Families in Australia 2011
Sticking together in good and tough times
You are in an archived section of the AIFS website
Overview
This paper explores several major trends in Australian families up until 2011. It covers a broad range of topics including changes in the aging population, parenting responsibilities, employment, economic wellbeing and life satisfaction.
Since Federation, Australia's families and communities have experienced changes on many fronts and confronted challenges that have forged our character and fostered our progress as a nation. Some challenges are faced by each generation, others recur from time to time, and still others are unique to a given era. Demographic, social and economic trends affect individuals, their families and communities.
We are each part of a family, despite wide differences in its form and cohesion or the degree of our contact with it. Well-functioning families have always been the glue that has bound communities together and strengthened societies, despite often being under pressure themselves. In turn, societies and their communities support families to stick together in good and tough times.
Difficult and challenging events bring issues of family, community and national resilience into sharp focus. The early months of 2011 were especially tough for many Australians - and others beyond our shores. For all nations, but perhaps especially so for developing ones, disasters have, by definition, profound and enduring impacts. Understandably, the many pressures that families face in times of crisis have tended to dominate popular concern. It is all too easy, however, to overlook the strengths of families, which are reflected in their responses to such challenges and the willingness of their members to assist in times of need. It is also easy to lose sight of the fact that disasters do not displace the ongoing, more commonplace pressures that families face.
Resilience entails not only the ability to adapt to change and bounce back from the stresses and strains of life, but also to identify and make the most of opportunities. Resilience is not just a personal attribute but reflects the support we give each other in dealing with difficulties within and beyond our families. Negotiating life's obstacles and opportunities enables families to develop strength in the face of adversity. Both personally and as a nation, our key capacities are to learn from experience, appreciate the risks that everyday challenges and events such as natural disasters or personal and family adversities carry, and plan and prepare for these in ways that reduce our vulnerability and enhance resilience. Major crises, as well as everyday challenges, highlight both the vulnerability and resilience of Australians.
This report draws on recent statistics to provide a picture of selected aspects of Australian families in 2011. It first explores some of the demographic and social changes that set the scene for contemporary family life and then considers patterns of participation in work and family life. The focus then turns to participation in community life through voluntary work and caring for others, expectations about the availability of support in times of need, and government assistance to families and individuals. The final sections of the report explore economic wellbeing and life satisfaction.
Key messages
-
The proportion of two-parent families where both parents worked full time increased from 17% in 1983 to 24% in 1995. In 2010, in families where one parent worked full-time and the other part-time, 95% of the time it was the father who worked the longer hours.
-
The amount of time fathers with preschool children spent working increased by 5.7 hours per week from 1997 to 2006.
-
Disposable household income grew by 58% between 1994/95 and 2007/08 (from $512 to $811 per week). Though single parents were considerably worse off than other family types: in 2009, their disposable income was $520 per week, and 37% faced financial hardship.
-
The golden years of life occur between 65 and 84 years – nearly 80% in this age group reported high life satisfaction
Demographic and social change
As in all other developed countries, Australia's population is ageing, with the key drivers being low fertility rates and increased life expectancy. The representation of older people has increased progressively over the last century (from 4% in 1901 to 14% in 2010).1 In contrast, the proportion of the population aged under 15 years fell from 35% in 1901 to 24% in 1940-45, then increased to 30% in 1957-66 (the peak of the "Baby Boom"), and fell thereafter to 19% in 2007-10. These two groups are traditionally considered as dependants.2
The Australian Bureau of Statistics (ABS) has projected that, by 2056, the older dependent-aged people will represent 23-25% of the Australian population, while the younger dependent-aged group will make up only 15-18%; by 2101, 25-28% will be in the older group and 14-17% will be in the young group.3 The development of strategies to minimise and handle the associated economic and social implications of having an ageing population represents a key priority, explored since 2002-03 by the Australian Government in its Intergenerational Report.4
Despite its challenges, an ageing population is also a prime reflection of a nation's success in preventing maternal and infant mortality and improving health, thereby increasing life expectancy. It also has profound implications within and beyond families.
Demographic changes such as these have marked impacts, not only on the nation, but also on families. In addition, extended periods of participation in education and increased involvement, especially of women, in paid employment, contribute to shaping patterns of couple formation and dissolution, which today differ substantially from the patterns apparent during most of the 20th century. Family size has become smaller, and many women now become mothers much later than was the case for previous generations. Many children also live with only one parent and have the other parent living elsewhere.
Marriage rates have fallen markedly in recent decades, while cohabitation rates have increased. In fact, marriage rates in recent years have been lower than at any time in the 20th century. In 2006, fewer than 50% of the Australian population aged 15 years and older were in a registered marriage, falling from 65% in 1971. And those who marry tend to do so at a later age than in the past. The median age at first marriage rose between 1971 to 2008 from 23.4 years to 29.6 years for men and from 21.1 years to 27.7 years for women. On the other hand, cohabitation has become increasingly common. According to the 2006 Census, 15% of couples were cohabiting rather than married, increasing from 6% in 1986. Cohabitation is particularly common among young people; in fact, people under 25 years are more likely to be in a cohabiting relationship than to be married.
The rise in the divorce rate during the second half of the 20th century, especially after the introduction of the Family Law Act 1975, represents one of the most spectacular changes in family relationships in Australia. The Act allowed for "no-fault" divorce based on just one ground - "irretrievable breakdown" - as measured by at least 12 months of separation. Current trends suggest that one in three marriages will end in divorce.5 It is also worth noting that just under half of all divorces occur among couples with children under 18 years old. This means that, each year, around 50,000 such children experience the divorce of their parents.
These changes form the backdrop to family and community life in contemporary Australia. They frame the economic and social participation of families, the supports they give and receive, and their economic and subjective wellbeing.
Another factor that sets the scene for contemporary family life is the evolving cultural character of Australia. Since Federation, the Australian population has changed dramatically in terms of cultural background. Ethnic diversity accelerated after World War II, and since this period Australia has become one of the most ethnically diverse countries in the world. According to the 2006 Census, migrants from the United Kingdom and Ireland represent 31% of all migrants who arrived in Australia before 1991, but only 12% of those who arrived subsequently. In contrast, the proportions of migrants from Asian countries rose from 18% to 42% across these two periods. Because they have settled in Australia over a shorter period of time than other immigrants, the Asian-born population tends to be younger than the other overseas-born population, and is especially concentrated in the 25-45 year age bracket (41% compared with 28% of migrants from other countries).
Only a small proportion of the Australian population identify as Indigenous (2.3% according to the 2006 Census).6 While this report focuses on Australians in general, it is important to acknowledge some of the ways in which Indigenous people and others in Australia differ. The Indigenous people's spiritual attachment to the land and its flora and fauna and their distinctive forms of art have gained increasing recognition within and beyond Australia. Probably less well known is the fact that the meaning of the family systems and structures of Indigenous Australians in some remote communities not only differs between groups, but also cannot readily be aligned with the system understood in the dominant culture in Australia.7 Indigenous Australians have a larger number of children than other Australians, and are more likely to live in multi-family and multi-generational households. They are also more likely to live in regional and remote areas. Indigenous Australians tend to fare considerably less well than other Australians in terms of a range of social, economic, and health indicators, and closing this gap represents an important policy focus of all governments in Australia.
1 In this document, the term "older people" is used to refer to those who are aged 65 years and over. Percentages have been rounded to the nearest whole number throughout.
2 Traditionally, the "working-age" population is defined as 15-64 years, and those in the other two age groups (under 15 years and older than 64 years) are treated as "dependants". However, as illustrated in this report, young people aged 15-19 years are most commonly engaged solely in education, and substantial proportions of men and women aged 60-64 years are not employed.
3 ABS (2008).
4 The Treasury (various years). The Intergenerational Report has been published in 2002-03, 2007 and 2010.
5 ABS (2001).
6 ABS (2010e).
7 Morphy (2006).
Participation in the world of work and family life
Parents' paid work
The movement of mothers into the paid workforce was one of the revolutionary changes of the second half of the 20th century, and it has had widespread repercussions for family life, workplaces and communities. This change is captured in Figure 1, which presents two sets of workforce participation patterns - one for couple families with dependent children and the other for single-mother families with dependent children. The first set shows the proportion of couple families in which: (a) neither parent has paid work; (b) only one parent has paid work and this is part-time (fewer than 35 hours per week); (c) either one parent works full-time (35 or more hours per week) and the other is not in paid work, or both parents work part-time (equivalent to one full-time job); (d) one parent works full-time and the other part-time; and (e) both parents work full-time. The second set shows the proportions of single-mother families who have no paid work, part-time work or full-time work.
Figure 1: Distribution of types of jobs among families with dependent children 1983-2010
Notes: FT = full-time; PT = part-time.
Source: Hayes, Weston, Qu & Gray (2010), based on data provided by the ABS.
In 1983, couple families with one equivalent full-time job clearly predominated - representing almost half the families. In just under one-quarter of couple families, one parent held a full-time job, and the other worked part-time, while in only 17% of couple families did both parents work full-time.
These trends changed markedly over the next decade. By 1995, the proportion of couple parents with one full-time and one part-time job (33%) was much the same as the proportion with one equivalent full-time job (32%). While most of the change occurred during the first decade of this period, it is noteworthy that, by 2010, there were more couple parents with a full-time and part-time job (36%) than with only one full-time job between them (30%).
Across the three decades, the third most likely scenario was for both parents to have full-time work. The proportion of couple parents in this position increased from 17% in 1983 to 24% in 1995, and changed little thereafter. There was also a consistent but small decrease in the proportion of couple parents with no job between them and a small increase in those with only one part-time job between them.
However, in keeping with traditional arrangements, where differences existed in 2010 in the work hours of each parent in couple families, fathers typically spent the greater amount of time in paid work:
- In 95% of families in which one parent worked full-time and the other part-time, it was the father who worked the longer hours.
- Within couple families with one equivalent full-time job, a large majority (84%) were those in which the father worked full-time and the mother was not in paid work. In only 7% of cases, the mother was in full-time employment and the father was not employed, and in another 9%, both parents had part-time work.
In 1983, the majority of single mothers (68%) had no paid work. This situation has become less common, with under half the single mothers (43%) having no paid work in 2010. Single mothers' rates of both full-time and part-time work (especially the latter) increased over this period. Whereas in 1983 higher proportions of single mothers had full-time work (20%) than part-time paid work (12%), by 2010, single mothers were as likely to work full-time as part-time (about 29% for each).
These major changes in workforce participation inevitably have caused "ripple effects", requiring other adjustments within the home, workplace and community. However, customs and practices invariably persist for some time after such major social changes have occurred.8
Family-friendly policies relating to employment
In response to the changing social environment of work and family, various policies have now been implemented in workplaces and communities to accommodate the family commitments of employees. Of particular note is the recently introduced Paid Parental Leave Scheme, funded by the Australian Government.9 Other initiatives include the provision of flexible work hours and leave to look after family members, both young and old, as well as the provision of formal child care. However, access to family-friendly work practices has varied considerably within and between organisations.10 On 1 January 2010, a set of 10 minimum employment conditions, the National Employment Standards, was introduced. This set includes the right to negotiate flexible working arrangements under certain circumstances.11
Hours of work and family pressures
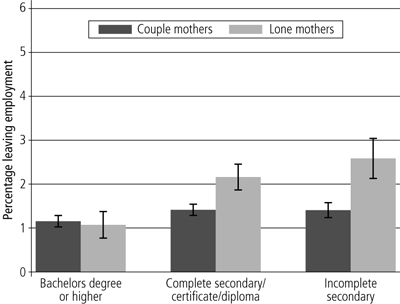
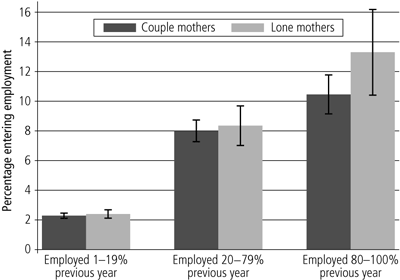
There has also been an emerging trend towards longer working hours for fathers. Recent Australian research suggests that the amount of time fathers with preschool children spent in paid work increased by 5.7 hours per week between 1997 and 2006 - a trend that runs counter to increased pressure on fathers to spend more time with their children.12 And despite detectable shifts among fathers to increase their share of child care, mothers are still doing the lion's share around the home, including looking after the children.13 It is therefore not surprising that mothers with full-time paid work and with young children are more likely than their counterparts with part-time or no paid work to experience time pressures. For example, in the first wave of Growing Up in Australia: The Longitudinal Study of Australian Children (LSAC)14 (conducted in 2004 among families with children who were either 0-1 or 4-5 years old), the following results emerged.15
- Among non-employed mothers, 38% who were in couple families and 34% of single mothers said that they often or always felt rushed or pressed for time; while an even greater proportion of couple and single mothers in part-time work indicated that they felt this way (50% and 47% respectively).
- Unsurprisingly, however, those most likely to feel often or always rushed or pressed for time were mothers in full-time work, with single mothers being more likely to indicate this than couple mothers (78% vs 62%).
- In comparison, 45% of fathers who were employed full-time said they often or always felt rushed or pressed for time.
- Furthermore, 40% of employed mothers with young children and 66% of employed fathers agreed that because of the work they did they had missed out on home or family activities that they would have liked to have taken part in.
- Finally, 23-25% of employed fathers and mothers indicated that their family life was less enjoyable and more pressured owing to their work responsibilities.
Parenting practices and arrangements
Mothers' and fathers' participation in parenting
While employed mothers still do the bulk of household work, they are now doing less of it than their mothers did - a trend that has been facilitated by the availability of non-parental child care and the introduction of labour-saving devices, pre-cooked meals and other domestic services. As noted above, fathers are increasingly expected to play a more active role in the non-financial aspects of parenting.
While breadwinning is clearly an important aspect of parenting, there is evidence that fathers are, indeed, spending more time with their children. In fact, the total workload from paid and unpaid work increased for both fathers and mothers from 1992 to 2006.16
Figure 2, which is based on Growing Up in Australia, shows the average number of hours that children in couple families spend with both parents, their father only or their mother only during weekends and weekdays.
Figure 2: Parental time spent with children, by period of week, 2004, 2006 and 2008
Source: Baxter, Gray and Hayes (2010), based on LSAC data.17
Both on weekends and weekdays, children under 10 years old spend more time with their mother than father. Not surprisingly, time spent with mothers during weekdays is greater for preschool-aged than school-aged children, but on weekends, these age-related differences are no longer apparent.
Children spend more time with their father on weekends than on weekdays (on average, 6-7 hours and around 3 hours respectively), with most of this time also involving the mother. In fact, during the weekends, children spend the largest amount of time with both parents together, followed by spending time with their mother alone. The reverse is true during weekdays: they spend the greatest slice of time in the presence of their mother only, followed by time with both parents.
Despite this clear gender difference in the time parents spend with their children, how do couples perceive the level of support they receive from each other? Figure 3, which is also based on the Growing Up in Australia study, shows the views of fathers and mothers of young children regarding how often they provide and receive support from each other in relation to raising their children.
Figure 3: Fathers' and mothers' perceptions of frequency of support they provide each other in raising their children, 2004 and 2008
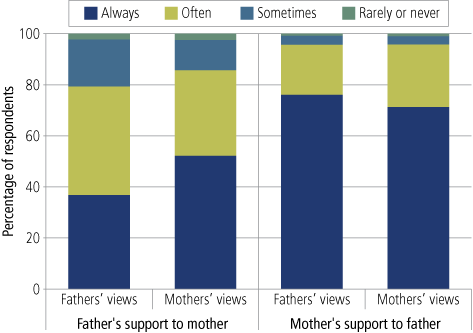
Source: Baxter and Smart (2011), based on LSAC data (both age cohorts, Waves 1 and 3)
Most mothers and fathers believed that the mother always provided support to the father (71-76%), whereas only 37% of fathers and 52% of mothers believed that the father always provided support to the mother. Fathers were more likely to believe that they always received rather than gave support. Although applying to a minority, considerably more fathers than mothers believed that the father provided support only "sometimes" (18% vs 12%).
Parenting arrangements following separation
The above discussion has focused on the experiences of partnered fathers, along with partnered and single mothers. Just as today's fathers in intact couples tend to be more involved in family life than was the case for earlier generations, there is also evidence that, after parental separation, fathers are more actively engaged with their children's lives. For instance, although equal care time (where the child spends 48-52% of nights with each parent) applies to a small minority of children, the proportion of children with this arrangement has increased since the late 1990s - a trend that is apparent across four age groups (under 5 years, 5-11 years, 12-14 years and 15-17 years).18 This arrangement does not work well for all children. The most suitable arrangement will depend on a range of factors, including the age of the child, distance between households, the quality of the inter-parental relationship, and the level of flexibility that is built into the schedule. These sorts of circumstances will vary as the duration of separation lengthens. Figure 4 focuses on the care-time arrangements in late 2008 experienced by children of different ages whose parents had been separated for an average of 15 months.19
Figure 4: Proportion of nights per year that children spent with each parent after separation, by age of child, 2008
Note: Sample is families where parents had been separated for up to 26 months; average time since separation = 15 months.
Source: Kaspiew et al. (2009)
The most common arrangement for children in all age groups entailed spending most nights (66-99% of nights) with their mother. For children under 3 years old, the second most common arrangement was for the child to spend all nights with the mother and to see the father during the daytime only (34% of these children), while the third most common arrangement entailed not seeing him at all (16%). Likewise, the second most common arrangement for older teenagers (aged 15-17 years) was to see their father during the daytime only (23%), and the third was not seeing him at all (13%).
For children between these two age extremes, the second most common arrangement entailed spending 35-65% of nights with each parent (classified as "shared care" by the Child Support Agency) - 26% of children aged 5-11 years and 20% of those aged 3-4 years and 12-14 years spent this amount of time with each parent.
Although only 5% of all children spent most or all nights with their father, this arrangement was more likely for older children.
The category of shared care time covers a fairly wide range of nights per year. In most cases, shared care time entailed the child either spending close to an equal proportion of nights with each parent (48-52% of nights), or more nights with their mother than father (i.e., 53-65% of nights with their mother and 35-47% of nights with their father). Of the children in this study with a shared care-time arrangement, 44% spent an equal time with each parent, 48% spent more time with their mother than their father, and only 8% spent more time with their father than their mother.
Study and employment patterns among teenagers and young adults
Adolescence and young adulthood are times when personal decisions regarding study, work, friendships, and leisure activities can have profound impacts on the course that life takes. Other things being equal, the life chances of young people are greatly improved when they achieve educational qualifications. Education is, after all, the engine of opportunity that drives the skilled workforce needed by advanced nations.
If not studying, then it is almost always important that young people are in paid work. Those who are engaged in neither activity are at higher risk of antisocial behaviour, demoralisation and, ultimately, social exclusion. Mental health problems, drug and alcohol abuse and other risk-taking behaviours often underlie young people's lack of participation in either study or paid work. Having caring responsibilities can also make study and/or work difficult for some young people.20
In recent decades there has been a marked shift in the participation of young people in formal education. Young Australian men, and more especially young women, now stay in education longer than previous generations. In 1981, only 56% of Australians aged 15-19 years were enrolled in formal education, but by 2010 this figure had increased to 78%. Even more spectacular has been an increase in the educational participation of Australians in their early twenties, from 16% in 1981 to 40% by 2010.
Figure 5 shows the proportion of those aged 15-19 and 20-24 years who were engaged in education alone, employment alone, in both activities or in neither activity for the years 1990 and 2010.
Figure 5: Engagement in education and employment by young people aged 15-19 and 20-24 years, 1990 and 2010
Sources: ABS (1991; 2010c)
In both 1990 and 2010, as would be expected, teenagers were most commonly engaged solely in study, while those in their early twenties were most commonly engaged in paid work alone. However, for both age groups, the proportion engaged solely in paid work decreased (from 25% to 14% of teenagers and from 61% to 48% of those aged 20-24 years), while the proportion engaged solely in study increased (from 41% to 45% of teenagers and from 8% to 14% of those aged 20-24 years).
The proportion of young people in paid employment, either solely or in combination with study, decreased slightly for both age groups (from 51% to 47% of teenagers and from 77% to 74% of those in their early twenties). On the other hand, the proportion of those who were studying, either solely or in combination with paid work, increased (from 67% to 78% of teenagers, and from 23% to 40% of those in their early twenties).
Furthermore, there has been an increasing tendency for young people to combine study with paid work. Engagement in both these activities applied to 26% of teenagers in 1990 compared with 33% in 2010, and to 16% of those in their early twenties in 1990 compared with 26% in 2010. However, this trend has had little effect on the proportions of young people who are engaged in neither activity, which applied to 9% of teenagers in both years and to 15% of the older group in 1990 and 12% in 2010. Although these percentages are small, they are a matter of considerable concern.
Of course, some of these young people would have been carers for family members, and others would have been volunteering some of their time to their communities. But others would have been engaged in neither of these activities.
Lack of study or paid work opportunities too often places life prospects in jeopardy. Innovative interventions are required to address the complex personal and social barriers that create such circumstances.
Health and employment of older people
Health and disability among older people
With advancing age, health issues are particularly likely to come to the fore in shaping the ability to participate in paid, as well as unpaid, work. Most people aged 65-84 years who live in private dwellings describe their health in favourable terms - that is, as "excellent", "very good" or "good". However, the proportions describing their health as "excellent" or "very good" fall with age (in 2009 reported by 35% of those aged 65-74 years, 23% of those aged 75-84 years, and only 17% of those aged 85 years and over). Conversely, the proportions indicating that their health is "fair" or "poor" increase with age and represent the most common descriptions provided by those aged 85 years and over (in 2009 indicated by 29% of those aged 65-74 years to 36% of those aged 75-84 years, and 52% of the oldest group).21
Declining health and the rising risk of disability with advancing age are often impediments to community participation. Worlds can shrink when health declines. But at what age are severe or profound disabilities most likely to take hold? Figure 6 shows the proportions of older people in different age groups in 2003 and 2009 who had a disability in one or more core activities (e.g., communication, mobility or self-care) that resulted in their requiring considerable assistance in their daily lives (i.e., a "severe or profound" disability).22
In 2009, close to one in ten people aged 65-69 years and just under two in ten people aged 75-79 had a severe or profound disability. Not surprisingly, the proportion of older people with such conditions increases with age. Even so, less than one-third of people aged 80-84 years experienced these problems in 2009, while this applied to just under one-half of those in their late eighties.
In contrast, the majority of people in their nineties (70% in 2009) had developed a disability that resulted in their needing assistance in managing at least one core activity.
Figure 6 also shows that the proportions of older people with severe or profound disabilities declined from 2003 to 200923 At the same time, while increased life expectancy is associated with an increase in the number of years a person can expect to live in good health ("healthy life expectancy"), it is also linked with an increase in the number of years a person lives with an illness or disability ("unhealthy life expectancy"). Between 1996 and 2003, the average life expectancy of males at birth increased by 3.6% while their unhealthy life expectancy increased by 11.6%. For females, the increases were 2.3% and 3.9% respectively.24 Nevertheless, newborn Australians have one of the highest healthy life expectancies in the world - 72 years for males and 74 years for females in 2007.25
Figure 6: Proportions of older persons with a severe or profound disability, by age, 2003 and 2009
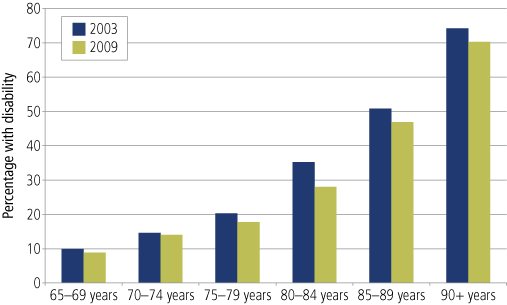
Source: ABS (2010b)
Advances in medical technologies and pharmaceuticals increasingly enable middle-aged and older Australians to enjoy many years free of most of the disabling effects of impairments and illnesses. Such developments permit many people to remain active contributors to society, whether through paid work, volunteering and/or caring for family members - contributions that give purpose and meaning to life, the challenges of ageing notwithstanding. It is easy to lose sight of these successes when considering the significant proportion of the health budget that can be attributed to such advances, and the associated increases in their use.26
Participation of older people in the workforce
Consistent with the abovementioned results, increasing proportions of older people have remained in paid work, as shown in Figure 7.
Figure 7: Proportions of older people who were employed, by age and gender, 1978-2010
Source: ABS (2010d)
The employment rate for men aged 60-64 years fell quite sharply in the late 1970s and early 1980s (from 58% in 1978 to just below 40% in 1985), then fluctuated until the new millennium (ranging between 42% and 47%). Since 2000, however, the employment rate for men of this age has increased substantially, returning in 2010 to the 1978 level (nearly 60%).
The employment rate for women aged 60-64 years has increased progressively, ranging from 10% in 1981-82 to 41% in 2009-10. This trend for women has been strongly influenced by the increasing workforce participation of mothers - participation that then persists beyond their childrearing years.
In the late 1970s and early 1980s, men aged 60-64 years were 4-5 times as likely as their female counterparts to be in paid work. This gap has progressively narrowed, and between 2008 and 2010, of those aged 60-64 years, men were only around 1.5 times as likely as women to be in paid work.
Not surprisingly, men and women aged 65 or more years are considerably less likely than their younger counterparts to be employed. Nevertheless, the employments rates for these older Australians have increased between 2000 and 2010, from 9% to 16% for men and from 3% to 7% for women.27
Paid employment is only one aspect of economic productivity. Another is the "in-kind" work that people provide in the form of unpaid caregiving and volunteering. While most people in their late sixties are not in paid employment, many are making substantial contributions through voluntary work and caregiving.28
8 Moen and Yu (2000).
9 Parents may be eligible if they: are the primary carer of a newborn or recently adopted child; have met the Paid Parental Leave work test before the birth or adoption occurs; have an individual income of up to $150,000 in the previous financial year; and are an Australian resident.
10 This has been demonstrated by Gray and Tudbull (2002).
11 For an outline of the nature of these entitlements and those who are affected by them, see the National Employment Standards <http://www.fairwork.gov.au/Employee-entitlements/national-employment-standards>.
12 Craig, Mullan, and Blaxland (2010).
13 Craig et al. (2010).
14 The analysis uses unit record data from Growing Up in Australia: The Longitudinal Study of Australian Children. The study is conducted in partnership between the Department of Families, Housing, Community Services and Indigenous Affairs (FaHCSIA), the Australian Institute of Family Studies (AIFS) and the Australian Bureau of Statistics (ABS). The findings and views reported in this report are those of the authors and should not be attributed to FaHCSIA or the ABS.
15 Baxter, Gray, Alexander, Strazdins, and Bittman (2007).
16 These findings have been reported by Craig et al. (2010).
17 Three waves of data have been collected in LSAC (in 2004, 2006 and 2008). At each wave, data are available from two cohorts of children, with the younger cohort having been 0-1 year old, and the elder 4-5 years old at the first (2004) survey. Figure 2 is based on data from both cohorts and all years combined to give information about parental time spent with children at each of the ages shown in the figure. At age 4-5 years, data are derived from pooled information from 2004 (Wave 1, the 4-5 year old cohort) and 2008 (Wave 3, the 0-1 year old cohort). The results are based on diary information for children living in couple or single-parent families.
18 Kaspiew et al. (2009).
19 The results on care-time arrangements are based on Wave 1 of a study of 10,000 separated families, the Longitudinal Study of Separated Families, conducted by the Australian Institute of Families Studies and funded by the Australian Government Attorney-General's Department (AGD) and the Department of Families, Housing Community Services and Indigenous Affairs (FaHCSIA) (Kaspiew et al., 2009). These families were registered with the Child Support Agency in 2007. Interviews with parents (around half of whom were fathers) took place in August to October 2008, up to 26 months after separation. Almost all these parents (95%) had separated between July 2006 and December 2007 (82% in 2007 and 13% in the second half of 2006), with the remaining 5% having separated in 2008. The care-time arrangements refer to those in place for the first child listed in the Child Support Agency database. For details of these results and others, see Kaspiew, et al. (2009).
20 Edwards, Gray, Baxter, and Hunter (2009), and Edwards and Gray (2009).
21 These results are based on the Household, Income and Labour Dynamics in Australia (HILDA) survey, 2009. The HILDA project was initiated and is funded by the Australian Government Department of Families, Housing, Community Services and Indigenous Affairs (FaHCSIA) and is managed by the Melbourne Institute of Applied Economic and Social Research (Melbourne Institute). The findings and views reported in this report, however, are those of the authors and should not be attributed to either FaHCSIA or the Melbourne Institute.
22 In mid-2009, around 162,300 people were in residential aged care services. With 28% being 85-89 years old, and only 3% being 65-69 years old (Australian Institute of Health and Welfare [AIHW], 2011).
23 The difference in disability rates in 2003 and 2009 was statistically significant for those aged 75-79 years and 80-84 years (ABS (2010b).
24 AIHW (2010).
25 World Health Organization (2010).
26 Mathers (2007).
27 These data do not differentiate between those aged in their late sixties and older age groups. The 1996 and 2006 Censuses indicate that the employment rates of men and women aged 65-69 years have increased substantially (men: from 16% to 24%; women: from 7% to 12%).
28 See also Borowski, Encel, and Ozanne (2007), and de Vaus, Gray, and Stanton (2003).
Supporting communities through the voluntary work and caring for others
Participation in voluntary work and caring for an adult relative
Many Australians expend a great deal of time and effort in assisting others in need. Figure 8, which is based on the Household, Income and Labour Dynamics in Australia (HILDA) Survey, shows the proportions of those of different ages who reported doing voluntary work (including looking after the children of other people) or caring for a disabled spouse or adult relative, or an elderly parent or parent-in-law in a typical week.29
Figure 8: Proportions of persons in private dwellings who report volunteering and/or caring for an adult relative in a typical week, by age, 2008
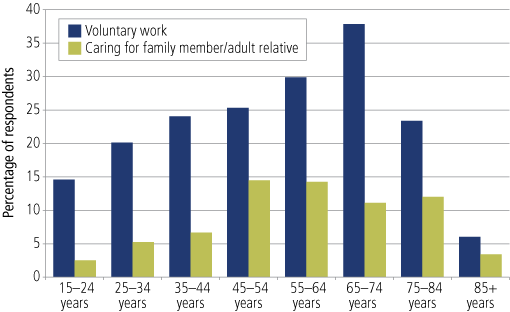
Note: The data have been weighted. Voluntary work includes looking after other people's children under 12 years on a regular, unpaid basis. Caring for a family member or other relative covers caring for a disabled spouse or adult relative, or an elderly parent or parent-in-law.
Source: HILDA, 2008
Across all age groups, volunteering was a far more common activity in a typical week than was caring for an elderly or disabled adult relative. The proportions of people who engaged in regular volunteer work increased progressively with advancing age, reaching a peak at age 65-74 years (38% of this older age group).
Just under one-quarter of those aged 75-84 years indicated that they engaged in some form of volunteering in a typical week and this proportion was higher than that for the two youngest groups (15-24 years: 15%; 25-34 years: 20%). Unsurprisingly, those aged 85 or more years were the least likely to engage in such activities (6%).
Given the low general rate of severe or profound disability in the community (outlined above), spending time caring for an elderly or disabled adult relative is not common, being undertaken by just under 15% of Australians aged 45-54 years and 55-64 years, and by just over 10% of those who were 65-74 or 75-84 years old. No more than 7% of those aged under 45 years or at least 85 years reported engaging in such activities in a typical week.
Figure 9 shows the extent to which adults reported participating in voluntary work and/or caring for elderly or disabled adult relatives, by household type. The differences across household types in doing volunteer work were small (23-27%). Those in couple-only families were the most likely to care for an elderly or disabled adult relative (11%) while those living alone were the least likely to do so (5%).
Figure 9: Proportions of persons who report volunteering and/or caring for an adult relative in a typical week, by household type, 2008
Notes: The data have been weighted. Voluntary work includes looking after other people's children under 12 years on a regular, unpaid basis. Caring for a family member or other relative covers caring for a disabled spouse or adult relative, or an elderly parent or parent-in-law. Some single- and couple-parent families with dependent children also included non-dependent children aged 15 years and older who participated in the survey. Percentages for these two family groups are based on parents' reports only.
Source: HILDA, 2008.
Supporting families to participate and function effectively
Although families have undergone profound change, they are still the basic unit of society, with the central task of providing for the needs of their members and raising the next generation. However, families cannot function in isolation, especially in difficult times. Some families can bounce back from difficulties with little if any help, while others may need a considerable amount of assistance. Most families require some support from their relatives, neighbours and communities, as well as governments.
Expectations of support in times of crisis
A belief that family, friends or others would assist in times of need not only provides people with a sense of security - allaying anxiety and stress - but also underpins the sense of being actively included in caring families and communities. In the General Social Survey conducted in 2006 by the ABS, respondents were asked whether they were able to approach someone living outside their household for support in times of crisis,30 and if so, to identify the sources of support they would approach ("friend"; "neighbour"; "family member living elsewhere"; "work colleague"; "community, charity or religious organisation"; "local government or other government services"; "health, legal or financial professional"; and/or "other").
More than nine in ten respondents (93%) reported that they would be able to seek such support. Family members living elsewhere represented the most commonly identified source of support (nominated by 80%), followed by friends (67%). Neighbours and work colleagues were also important sources of support (nominated by 33% and 22% respectively). Community, charity or religious organisations were mentioned by 13% of respondents, while 9% indicated that they would seek support from a health, legal or financial professional, and 5% said they would use their local council or another government agency.
Figure 10 depicts the proportions of respondents of different ages who indicated that they would be able to ask someone outside their household for assistance in a time of crisis, and the proportions that would seek assistance from each of the three most commonly mentioned sources (family members living elsewhere, friends and neighbours).
Figure 10: Proportions of persons reporting they would be able to ask someone for support, and most common sources of support, by age, 2006
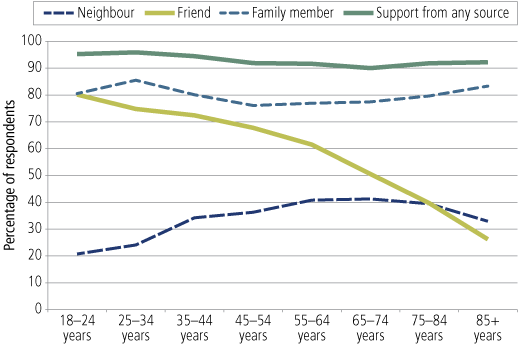
Note: Family member refers to a member of the respondent's family who does not live with the respondent.
Source: ABS (2007b)
At least 90% of respondents in all age groups indicated that they would be able to approach someone for assistance in a time of crisis. Family members (living elsewhere) were the most commonly mentioned source of support by all age groups except the youngest, who were just as likely to nominate friends as family members (around 80%). Between 76% and 86% of respondents in the different age groups indicated that they would ask family members for assistance in a crisis.
Approaching friends became less likely as age increased, and seeking assistance from neighbours was most commonly mentioned by respondents aged 55-84 years (around 40%). For all groups under the age of 75 years, neighbours were less commonly mentioned than friends.
As shown in Figure 11, the vast majority of adults in the four household types presented believed that they would be able to draw some sort of support should a crisis arise (92-94%). Consistent with the patterns described above, across household types, family members were the most commonly mentioned source of support (reported by 74-84%), followed by friends (61-71%), while substantial proportions saw neighbours as a source of support (25-39%). However, there are differences between household types in the perceived ability to seek support in times of crisis from the three most common sources:
- People living alone and single parents with dependent children were less likely than partnered people with or without dependent children to report that they would be able to seek help from family members living elsewhere in a time of crisis (74-76% vs 83-84%).
- Single parents with dependent children were less likely than others to believe that they could ask for support from neighbours (25% vs 33-39%).
- Persons living alone and those in couple-only families felt less able than couples with dependent children and single parents to approach friends for support in a time of crisis (61% vs 68-71%).
Figure 11: Proportions of persons reporting they would be able to ask someone for support, and most common sources of support, by household type, 2006
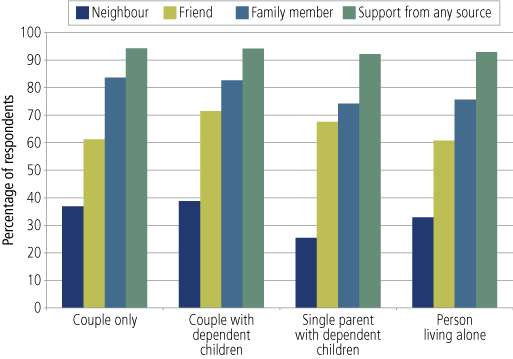
Note: Family member refers to a member of the respondent's family who does not live with the respondent. Some single- and couple-parent families with dependent children also included non-dependent children aged 15 years and older who participated in the survey. Percentages for these two family groups are based on parents' reports only.
Source: ABS (2007b)
Sense of neighbourhood support
As already shown, neighbours represent the third most commonly identified source of support in times of crisis. Even if family and friends usually take precedence, it is beneficial for people to know that they are surrounded by others who are willing to help out. In most of the HILDA survey waves, respondents have been asked various questions about their local neighbourhood, including how common it is for neighbours to help each other out and to do things together. The response options are: "never happens", "very rare", "not common", "fairly common", and "very common". Nearly 60% of respondents in each wave in which these questions were asked reported that it was very or fairly common for neighbours to help each other out, and around one-third indicated that it was very or fairly common for neighbours to do things together. Figure 12 shows the proportions of respondents in different age groups who indicated such views in the 2008 survey.
Figure 12: Proportions of persons reporting that it is very or fairly common for neighbours to help out and do things together, by age, 2008
Note: The data have been weighted.
Source: HILDA, 2008
Over half of the respondents in each age group reported that it was very or fairly common for those in their local neighbourhood to help each other out - an observation more commonly made by older than younger respondents. Specifically, this was mentioned by:
- 76% of respondents aged 85 or older;
- 63-65% of those in the three age groups spanning 55-84 years;
- 57-58% of those aged 35-44 and 45-54 years; and
- 52% in the two youngest age groups.
Those aged 85 years or more were also the most likely of all age groups to indicate that neighbours commonly participated in shared activities (43% vs 30-36%). However, respondents in all age groups were less likely to indicate that their neighbours commonly socialised in this way than to say that they commonly helped each other out.
As shown in Figure 13, the proportions of respondents who reported that it was very or fairly common for neighbours in their local area to engage in the two sets of activities - helping each other out or doing things together - did not vary greatly by household type. Nevertheless, single parents were slightly less likely than those in the three other household types to report that their neighbours helped each other out on a fairly or very common basis (54% vs 59-61%).
Figure 13: Proportions of persons reporting that it is very or fairly common for neighbours to help out and do things together, by household type, 2008
Note: The data have been weighted. Some single- and couple-parent families with dependent children also included non-dependent children aged 15 years and older who participated in the survey. Percentages for these two family groups are based on parents' reports only.
Source: HILDA, 2008
Government assistance to families and individuals
Australian governments also provide a great deal of assistance to families and communities through expenditure on health, housing, and support targeted at families and communities, as well as to vulnerable groups such as the elderly; the unemployed; Indigenous Australians; those who are homeless; people with disabilities, chronic illnesses or high care needs; and other socially excluded and vulnerable groups.
Figure 14 shows public spending on families in the form of cash, services and tax measures as a percentage of national gross domestic product (GDP) in Australia as well as other member countries of the Organisation for Economic Co-operation and Development (OECD) in 2007. It should be noted that this measure excludes the access that families may have to other forms of public support and services (for example, public education, public medical services, concessions in utility bills and transport).
Figure 14: Public spending on family benefits in cash, services and tax measures, as a percentage of GDP, 2007
Note: This measure of public support refers to that which is provided exclusively to families (e.g., child payments and allowances, parental leave benefits and childcare support). Spending recorded in other social policy areas, such as health and housing support also assists families, but not exclusively, and is not included here.
Source: OECD (2010)
In 2007, Australia ranked 13th highest in the amount it spent on families (as a percentage of GDP) of all countries represented in Figure 14. The Australian level of expenditure was therefore higher than the average for OECD countries (2.7% vs 2.2% of GDP).
Figure 15 shows the value of direct cash benefits provided in Australia to families and individuals as a percentage of GDP for each year from 1998 and 2009. This measure differs from the family expenditure measure used by the OECD. Across these years, such public expenditure varied between 7.4-9.0% of GDP, declining progressively from 2004 (when it represented 8.4% of GDP) to 2008 (7.4%), then increasing to its highest level for the entire period in the most recent year recorded (2009: 9%). This "spike" reflects the economic climate at the time, which was dominated by the global financial crisis, including the rise in unemployment and associated increased provision of benefits, the increasing number of older people eligible for the Age Pension, and other associated factors.
Figure 15: Social assistance benefits in cash to residents, as a percentage of gross domestic product, 1998-2009
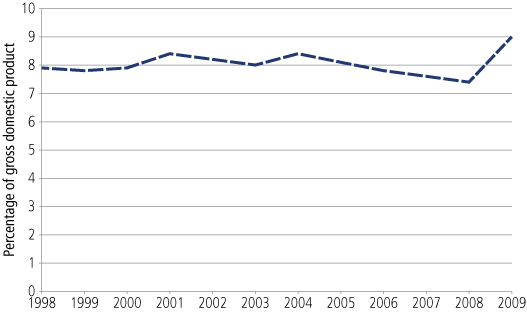
Note: Social assistance benefits include current transfers to people from general government sources in return for which no services are rendered or goods supplied. Principal components include: scholarships; maternity, sickness and unemployment benefits; family allowances; and widows', age, invalid and repatriation pensions.31
Source: ABS (2010a)
The Australian Government provides a range of services to support communities, families and individuals. In 2009-10, the governments' total recurrent expenditure on services amounted to approximately $150.5 billion - equivalent to about 12.3% of GDP.32 However, some people have difficulties in accessing services. Data from the General Social Survey 2006 provide insight into the prevalence of such difficulties. Respondents were asked about any problems they had experienced in accessing various services, and whether they had encountered difficulties in understanding or in being understood when they contacted a service.33
Just over one in five respondents (22%) reported difficulties in relation to access, as defined in this survey, while one in four (25%) reported communication problems (which can also be seen as aspects of access difficulties). Overall, about two in five (39%) reported either or both sets of difficulties. A similar proportion of respondents indicated that they had experienced access or communication problems when dealing with government and private sector services. In terms of access other than that relating to communication problems, the most commonly mentioned specific difficulties were inadequate services in areas in which the residents lived, followed by transport or distance problems and the cost of services.34
29 It is important to note that the HILDA survey is only representative of those living in private households.
30 To clarify the meaning of "support in times of crisis", respondents were given the following examples: "advice on what to do", "emotional support", "help out when you have a serious illness or injury", "help in maintaining family or work responsibilities", "provide emergency money", "provide emergency accommodation", and "provide emergency food".
31 In providing data for a more extensive period than that depicted in Figure 15, the ABS also includes "child endowment" in its definition of social assistance benefits. Family allowance was called child endowment from 1941-76. In 1976, child endowment and tax rebates for children were combined into a payment called "family payments".
32 Productivity Commission (2011).
33 Respondents were given a list of services as examples: doctors, employment services, telecommunication services, Centrelink, banks and other financial institutions, disability services, Family Assistance Office, or Medicare. The question on "access" was asked first. The examples of difficulties listed as problems in access covered: lack of transport/distance, cost, unavailability, no or inadequate services in the area, along with the respondent having a disability that restricts his or her access to services, lacking trust in services, or "any other reason". Although asked as a separate (subsequent) question, communication difficulties represent important problems in service access, and some respondents experiencing communication difficulties may have included such issues in the "any other reason" category.
34 ABS (2007b).
Economic wellbeing
Our living standard has never been as high as it is today, though some still face difficult financial circumstances and social exclusion, with the recent natural disasters adding to these difficulties.
From an international perspective, Australia is doing well economically. Financial living standards, as measured by gross national income per capita, represent a key component of the Human Development Index developed by the United Nations. Among the 169 nations assessed, Australia now ranks 13th according to this measure, having achieved 15th place in 2000.35
Australia's economic progress is also apparent in relation to changes in equivalised disposable household income. As shown in Figure 16, this grew by 58% between 1994-05 and 2007-08 (from $512 to $811 per week).36
Figure 16: Mean weekly equivalised disposable household income, 1994-95 to 2007-0839
Sources: ABS (2009)
In addition, household consumption expenditure grew by an average of 2% annually between 1960-61 and 2005-06.37
The HILDA survey casts further light on the financial living standards of Australians in private dwellings. Each year since its inception in 2001, respondents have been presented with a list of financial difficulties, such as being unable to pay bills on time due to lack of money, and are asked to indicate whether they had experienced this problem since January.38 Consistent with the above-mentioned trends in household disposable income, Figure 17 shows that the proportion that reported experiencing at least one financial difficulty declined more or less steadily from 2001 to 2009 (from 29% to 19%).
Figure 17: Proportions of persons who reported experiencing at least one financial hardship in the year, 2001-09
Note: The data have been weighted. Respondents were asked whether they had experienced the following because of a shortage of money since January: unable to pay electricity/gas/telephone bills on time; unable to pay mortgage/rent on time; pawned or sold something; went without meals; unable to heat home; asked for financial help from friends/family; and asked for help from welfare/community organisation.
Source: HILDA, 2001-09
However, these favourable overall findings mask the varied financial circumstances experienced by different families. Figure 18 shows the equivalised disposable household incomes of four groups: couples who are not living with children, couples with dependent children, families headed by a single parent, and single-person households.40
Figure 18: Mean weekly equivalised disposable household income (2007-08) and proportions of persons experiencing at least one financial hardship in 2009, by household type
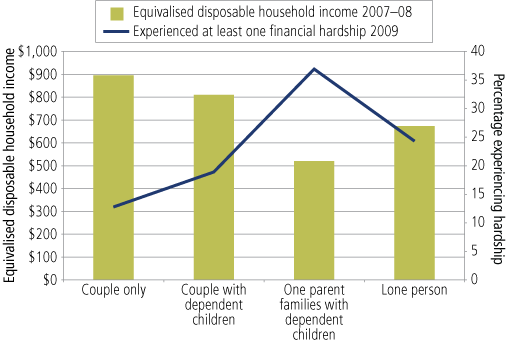
Notes: See notes for Figure 17.
Sources: ABS (2009); HILDA, 2008
Trends concerning financial hardship experiences represent a mirror image of those relating to equivalent household income:
- Couple-only families were in the best financial position: they had an average (equivalised) household income of nearly $900 per week, and only 13% in the 2009 HILDA survey reported that they had experienced at least one of the seven financial hardships.
- Of all four groups, families comprising couples with dependent children were in the second best financial position, with an average disposable income of $810 per week, and with 19% of people reporting the experience of at least one of the seven financial hardships.
- People who lived alone ranked third, with an average disposable income of $673, and with one-quarter reporting at least one of the financial hardships listed.
- Families with dependent children headed by a single parent were considerably worse off than the other three groups: their average disposable income was only $520 per week, and over one-third (37%) of single parents reported experiencing at least one of the financial hardships examined.
It should be noted that few respondents in each of the four groups described their household's financial situation as "poor" or "very poor" (2-8%), although a higher proportion of single parents than those in other households said that they were "just getting by" (37% vs 18-31%).41
Financial circumstances have a major influence on children's life chances and outcomes. In financially disadvantaged families, children tend to fare poorly in terms of developmental progress compared with other children. For example, research based on Growing Up in Australia suggests that children aged 4-5 years from financially disadvantaged families are less likely than other children of the same age to be "school-ready" in terms of their cognitive and social-emotional development (Figure 19 and Figure 20).42 These developmental differences continued to be apparent when the children were followed up two years later (i.e., at aged 6-7 years).
Figure 19: Percentage of children aged 4-5 years with low cognitive skills, by financial status of family
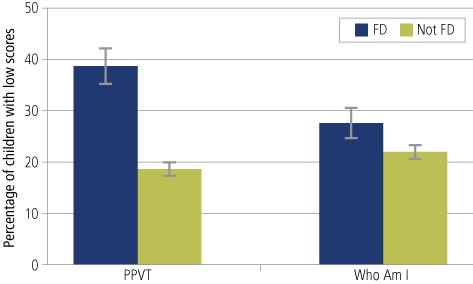
Note: FD (or financially disadvantaged) refers to families with equivalised incomes in the lowest 15%. Other families are referred to as Not FD. The Who am I test assesses children's school readiness in terms of pre-literacy and pre-numeracy skills, while the Peabody Picture Vocabulary Test (PPVT) assesses children's language competency.
Source: Smart et al. (2008)
Figure 20: Percentage of children aged 4-5 years with low social-emotional school readiness, by financial status of family
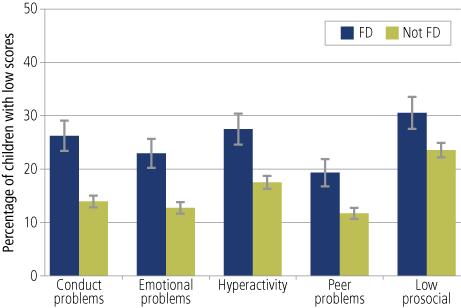
Note: FD (or financially disadvantaged) refers to families with equivalised incomes in the lowest 15%. Other families are referred to as Not FD.
Source: Smart et al. (2008)
It should be noted that the neighbourhoods to which children are exposed can affect their developmental progress and wellbeing. This is apparent in studies in which families have left or remained in neighbourhoods that are disadvantaged and in a study which attempted to control for a genetic predisposition to develop behavioural problems.43
The Growing Up in Australia study indicates that 4-5 year old children living in disadvantaged neighbourhoods show poorer cognitive skills and overall developmental progress compared with children living in other neighbourhoods. In addition, boys living in disadvantaged neighbourhoods do not progress as well as other boys in terms of their social-emotional development. Although these effects are small, they may accumulate into adolescence and adulthood.44
35 United Nations Development Program (2010).
36 ABS (2009).
37 ABS (2007a).
38 Almost all interviews for each survey wave take place between August and December.
39 Equivalised disposable household income is an estimate of financial living standards in which the disposable incomes of different households are adjusted according to an estimate of their costs, taking into account economies of scale. The results presented in this figure are based on the so-called "modified OECD scale", which gives a weight of 1.0 to the first adult in the household, a weight of 0.5 for each additional adult (people aged 15 years and over) and a weight of 0.3 for each child. (For example, it is assumed that a single parent with two children under 15 years old requires 1.6 times the disposable income of a person living alone in order to have the same living standard.) The total household income is then divided by the household weight.
40 The equivalised disposable income results are derived from data from the 2007-08 Income and Housing Survey (ABS, 2009). The data on financial hardship experiences are based the HILDA 2008 survey.
41 In the self-completion questionnaire, respondents were asked: "Given your current needs and financial responsibilities, would you say that you and your family are prosperous, very comfortable, reasonably comfortable, just getting by, poor, very poor".
42 Smart, Sanson, Baxter, Edwards, and Hayes (2008).
43 For a review of the literature on this issue, see Edwards (2005).
44 Edwards (2005). "Overall development" represented a composite measure based on physical, cognitive and socio-emotional progress. The level of advantage or disadvantage of a neighbourhood was measured by SEIFA indices developed by the ABS (2003).
Life satisfaction
Objective indicators of people's wellbeing, such as economic progress and community engagement, are of less worth if they are unhappy. Since the 1980s, increasing attention has been given to the importance of subjective wellbeing as an indicator of progress. Non-economic concerns often take precedence in shaping the decisions of individuals and families. A more informed view of wellbeing, then, uses both objective and subjective social indicators - with the latter assessing how people interpret their circumstances, or more generally, how they feel about their lives.
Some people see life as being rosier than others, but differences between some age groups may be somewhat surprising. Figure 21 shows the proportion of men and women in different age groups (living in private dwellings) who indicated in the 2009 HILDA survey that they were highly satisfied with their lives.45
Figure 21:Proportions or persons reporting high satisfaction with life, by age and gender, 2009
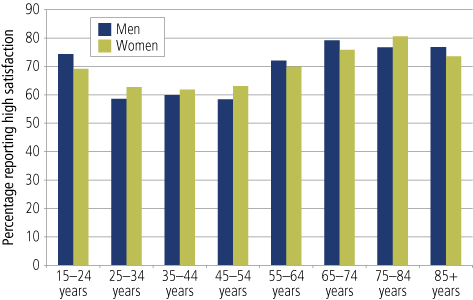
Notes: The data have been weighted. High satisfaction refers to ratings of 8-10 on a scale 0-10, where 0 indicates "completely dissatisfied" and 10 "completely satisfied".
Source: HILDA, 2008
Most people in private dwellings indicated that they were highly satisfied with their lives, although those aged 25-54 years were less likely to report this than older and younger people; nevertheless, a majority (58-63%) of 25-54 year old respondents did so.46
While the fear of becoming frail and dependent can be a source of increasing concern as people age, the challenges of ageing do not necessarily translate into reduced life satisfaction. In fact, the golden years in terms of life satisfaction appear to occur at ages 65-84 years, with 76-81% of people in this age group reporting high satisfaction. Of those who are at least 85, 74-77% express high satisfaction. These age-related patterns are similar for men and women.
45 Each year, participants in the HILDA survey are asked to indicate how satisfied they are with various aspects of their lives and with their life in general, using a rating scale ranging from 0 ("completely dissatisfied") to 10 ("completely satisfied").
46 This trend has also been observed in other studies (see Cummins, 1998; 2003).
In summary
There is much to celebrate in Australian family life. Australians live longer than their forebears. On the one hand, like other nations, Australia faces the challenges of supporting a growing elderly population; while on the other, most older people enjoy fulfilling lives and continue to make valuable contributions to their families and communities. Longevity and healthy ageing are marks of national progress. While life satisfaction of Australians is generally high, this is particularly so for those in the later years of life.
Access to education has been the engine of opportunity and advancement for our society. We benefit not only from the bounty of our natural resources but also from the wealth of talent that educational opportunity has unlocked. Today's economy requires a skilled, knowledgeable workforce - a workforce comprising young people, with their creative ideas, thirst for adventure and quickness of mind; middle-aged people, with their advanced knowledge and technological expertise; and older people, whose lifelong learning and accumulated wisdom is there to be tapped.
Contemporary family life, while being more complex than in the past, reflects the evolution and progress of society. In advanced societies, meeting material needs is now easier than in earlier eras, and each generation has generally become healthier, better educated and wealthier than the one that preceded it. Our living standard has never been as high as it is today, and unemployment is near record low levels. That said, we must not forget those whose lives are marked by the imprint of disadvantage, social exclusion or personal challenge.
The interconnection of families with their communities is a fundamental building block of strong and resilient societies. The extent to which Australians are engaged with their communities, volunteer and have the support of family, friends and neighbours, among others, is a real strength that directly contributes to resilience.
Resilience requires support from within and beyond families, tailored to the needs of individual, family and community circumstances. Provision of access to opportunities for education and participation provide key conditions for family members to develop their capabilities, to live satisfying, fulfilled lives, and to manage in times of need. Again, these underpin the resilience that enables families to stick together.
Families do not exist in isolation. They need community supports and, in turn, they are the foundation of strong communities. Together, they advance a fair, cohesive and resilient nation.
References
- Australian Bureau of Statistics. (1991). Transition from education to work, Australia 1990 (Cat. No. 6227.0). Canberra: ABS.
- Australian Bureau of Statistics. (2001). Marriages and divorces 2000 (Cat. No. 3310.0). Canberra: ABS.
- Australian Bureau of Statistics. (2003). Census of Population and Housing: Socio-Economic Indexes for Areas, Australia, 2001(Information Paper; Cat. No. 2039.0). Canberra: ABS.
- Australian Bureau of Statistics. (2007a). Australian social trends (Cat. No. 4402.00). Canberra: ABS.
- Australian Bureau of Statistics. (2007b). General Social Survey: Summary results, Australia 2006 (Cat. No. 4159.0). Canberra: ABS.
- Australian Bureau of Statistics. (2008). Population projections, Australia, 2006 to 2101 (Cat. No. 3222.0). Canberra: ABS.
- Australian Bureau of Statistics. (2009). Household income and income distribution, Australia, 2007-08. (Cat. No. 6523.0). Canberra: ABS.
- Australian Bureau of Statistics. (2010a). Australian social trends: Data cube (Cat. No. 4102.0). Canberra: ABS.
- Australian Bureau of Statistics. (2010b). Disability, ageing and carers, Australia: Summary of findings 2009 (Cat. No. 4430.0). Canberra: ABS.
- Australian Bureau of Statistics. (2010c). Education and work, Australia 2010 (Cat. No. 6227.0). Canberra: ABS.
- Australian Bureau of Statistics. (2010d). Labour force, Australia: Detailed. Electronic delivery (Cat. No. 6291.0.55.001). Canberra: ABS.
- Australian Bureau of Statistics. (2010e). Population characteristics, Aboriginal and Torres Strait Islander Australians, Australia 2006 (Cat. No. 4713.0). Canberra: ABS.
- Australian Institute of Health and Welfare. (2010). Healthy life expectancy. Canberra: AIHW. Retrieved from <www.aihw.gov.au/healthy-life-expectancy>.
- Australian Institute of Health and Welfare. (2011). Tracking the growing path to ageing and aged care. Access Online Magazine, 29, 6-7.
- Baxter, J. A., Gray, M., Alexander, M., Strazdins, L., & Bittman, M. (2007). Mothers and fathers with young children: Paid employment, caring and wellbeing (Social Policy Research Paper No. 30). Canberra: Department of Families, Housing, Community Services and Indigenous Affairs.
- Baxter, J. A., Gray, M., & Hayes, A. (2010). The best start: Supporting happy, healthy childhoods (Facts Sheet). Melbourne: Australian Institute of Family Studies.
- Baxter, J. A., & Smart, D. (2011). Fathering in Australia among couple families with young children (Occasional Paper No. 37). Canberra: Department of Families, Housing, Community Services and Indigenous Affairs.
- Borowski, A., Encel, S., & Ozanne, E. (2007). Introduction. In A. Borowski, S. Encel, & E. Ozanne (Eds.), Longevity and social change in Australia (pp. 4-14). Sydney: University of New South Wales.
- Craig, L., Mullan, K., & Blaxland, M. (2010). Parenthood, policy and work-family time in Australia 1992-2006. Work, Employment and Society, 24, 1-19.
- Cummins, R. (1998). The second approximation to an international standard for life satisfaction. Social Indicators Research, 43, 307-334.
- Cummins, R. (2003). Normative life satisfaction: Measurement issues and a homeostatic model. Social Indicators Research, 64, 225-256.
- de Vaus, D., Gray, M., & Stanton, D. (2003). The value of unpaid work of older Australians. Family Matters, 66, 34-39.
- Edwards, B. (2005). Does it take a village? An investigation of neighbourhood effects on Australian children's development. Family Matters, 72, 36-43.
- Edwards, B., & Gray, M. (2009). Determinants of the labour force status of female carers. Australian Journal of Labour Economics, 12, 5-21
- Edwards, B., Gray, M., Baxter, J. A. & Hunter, B. (2009). The tyranny of distance? Carers in regional and remote areas of Australia. Melbourne: Australian Institute of Family Studies.
- Gray, M., & Tudbull, J. (2002). Access to family-friendly work practices: Differences within and between Australian workplaces. Family Matters, 61, 30-35.
- Hayes, A., Weston, R., Qu, L., & Gray, M. (2010). Families then and now: 1980-2010 (Facts Sheet). Melbourne: Australian Institute of Family Studies.
- Kaspiew, R., Gray, M., Weston, R., Moloney, L., Hand, K., Qu, L., & The Family Law Evaluation Team. (2009). Evaluation of the 2006 family law reforms. Melbourne: Australian Institute of Family Studies.
- Mathers, C. D. (2007). The health of older Australians. In A. Borowski, S. Encel, & E. Ozanne (Eds.), Longevity and social change in Australia (pp. 40-64). Sydney: University of New South Wales.
- Moen, P., & Yu, Y. (2000). Effective work/life strategies: working couples, work conditions, gender and life quality. Social Problems, 47(3), 291-326.
- Morphy, F. (2006). Lost in translation? Remote Indigenous households and definitions of the family. Family Matters, 73, 23-31.
- Organisation of Economic and Co-operation Development. (2010). Social expenditure database. Paris: OECD.
- Productivity Commission. (2011). Report on government services 2011. Canberra: Productivity Commission.
- Smart, D., Sanson, A., Baxter, J., Edwards, B., & Hayes, A. (2008). Home-to-school transitions for financially disadvantaged children. Sydney: The Smith Family.
- The Treasury. (various years). Intergenerational report. Canberra: The Treasury. Retrieved from <www.treasury.gov.au/igr/>.
- United Nations Development Programme. (2010). Human development report 2010. New York: Palgrave Macmillan. Retrieved from <http://hdr.undp.org/en/reports/global/hdr2010/> .
- World Health Organization. (2010). World health statistics 2010. Geneva: WHO.
List of figures
- Figure 1 Distribution of types of jobs among families with dependent children 1983-2010
- Figure 2 Parental time spent with children, by period of week, 2004, 2006 and 2008
- Figure 3 Fathers' and mothers' perceptions of frequency of support they provide each other in raising their children, 2004 and 2008
- Figure 4 Proportion of nights per year that children spent with each parent after separation, by age of child, 2008
- Figure 5 Engagement in education and employment by young people aged 15-19 and 20-24 years, 1990 and 2010
- Figure 6 Proportions of older persons with a severe or profound disability, by age, 2003 and 2009
- Figure 7 Proportions of older people who were employed, by age and gender, 1978-2010
- Figure 8 Proportions of persons in private dwellings who report volunteering and/or caring for an adult relative in a typical week, by age, 2008
- Figure 9 Proportions of persons who report volunteering and/or caring for an adult relative in a typical week, by household type, 2008
- Figure 10 Proportions of persons reporting they would be able to ask someone for support, and most common sources of support, by age, 2006
- Figure 11 Proportions of persons reporting they would be able to ask someone for support, and most common sources of support, by household type, 2006
- Figure 12 Proportions of persons reporting that it is very or fairly common for neighbours to help out and do things together, by age, 2008
- Figure 13 Proportions of persons reporting that it is very or fairly common for neighbours to help out and do things together, by household type, 2008
- Figure 14 Public spending on family benefits in cash, services and tax measures, as a percentage of GDP, 2007
- Figure 15 Social assistance benefits in cash to residents, as a percentage of gross domestic product, 1998-2009
- Figure 16 Mean weekly equivalised disposable household income, 1994-95 to 2007-08
- Figure 17 Proportions of persons who reported experiencing at least one financial hardship in the year, 2001-09
- Figure 18 Mean weekly equivalised disposable household income (2007-08) and proportions of persons experiencing at least one financial hardship in 2009, by household type
- Figure 19 Percentage of children aged 4-5 years with low cognitive skills, by financial status of family
- Figure 20 Percentage of children aged 4-5 years with low social-emotional school readiness, by financial status of family
- Figure 21 Proportions or persons reporting high satisfaction with life, by age and gender, 2009
Professor Alan Hayes was Director at the time of writing, Dr Lixia Qu is a Senior Research Fellow, Ruth Weston was Assistant Director (Research) at the time of writing and Dr Jennifer Baxter is a Senior Research Fellow, all at the Australian Institute of Family Studies.
Hayes, A., Qu, L., Weston, R., & Baxter, J. (2011). Families in Australia 2011: Sticking together in good and tough times (Facts Sheet). Melbourne: Australian Institute of Family Studies.
978-1-921414-73-2
1 March 2011