Child care and early childhood education in Australia
May 2015
Download Research report
Overview
This fact sheet outlines the use of early childhood education and care (ECEC) in Australia, looking at both formal and informal types of care. It highlights how arrangements change as children grow, and how they vary between families.
Introduction
Child care and early childhood education hold a key place in the wellbeing of families and their local communities. They provide key opportunities for children's development and social engagement, and for enabling families to engage fully in the labour market, each of which is important in contributing to stronger families. This 2015 Families Week Facts Sheet presents information about the types of child care used by children in Australia, highlighting how arrangements change as children grow, and how they vary for families of different characteristics.
Different forms of child care are covered here. These include formal child care, which is provided predominantly through long day care and outside-school-hours care, and informal child care, in which families rely on grandparents or other relatives, friends, neighbours or nannies to care for their children.
Of relevance also is early childhood education, which many children attend in the year before full-time school (and sometimes earlier than this). This has been referred to as preschool here. The main objective of preschool is not child care, but to provide an early education for children, to help prepare them for school. It is included here as it may provide an alternative to child care for some families.1 Throughout this Facts Sheet, the term "early childhood education or care" (ECEC) is used to encompass children's participation in both child care and early childhood education.
Child care and early childhood education by child age
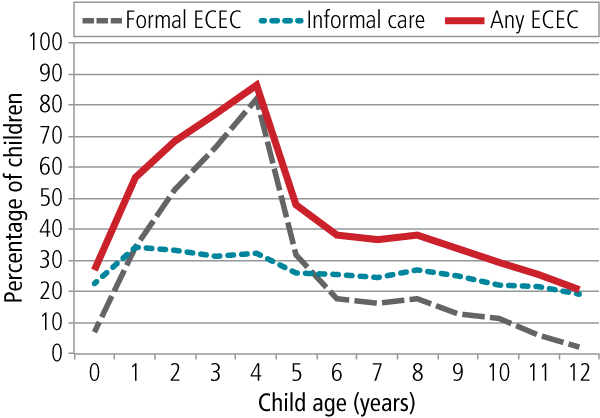
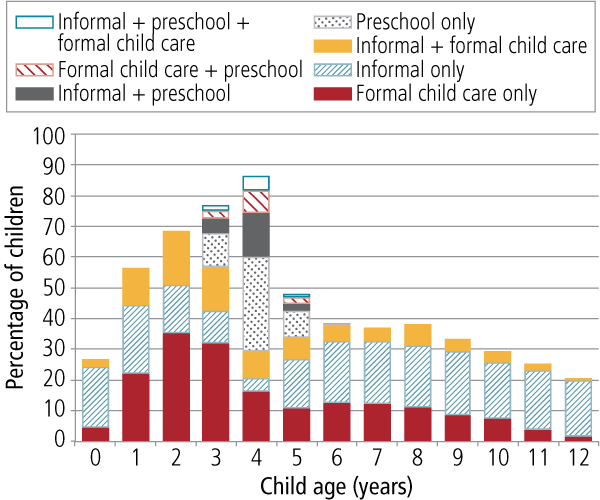
Figure 1 shows the percentage of children who were in some ECEC in June 2011, by age, and by whether that ECEC was formal or informal.2 These types of ECEC are explored further below.
- The distinct patterns of ECEC involvement by age of child reflect the participation of children in formal ECEC rather than informal child care.
- The peak age of ECEC attendance was at 4 years, when 87% of children were in some form of ECEC, including 82% in formal ECEC.
- The percentage of children in informal care varied much less by child age, with around 20% of children in informal care at under 1 year old and at older primary school ages, and around one in three children in some informal care from 1 to 4 years of age.
- Few children aged under 1 year old were in formal ECEC, as these children were more likely to be cared for by informal carers. Participation in formal ECEC increased through the preschool ages, being more likely than informal care at 2-4 years.
- Once children were primary-school-aged, participation in ECEC declined considerably, and children aged 6 through to 12 years were more often in informal child care than formal ECEC.
Figure 1: Children's participation in ECEC, by broad type of ECEC and age of child, 2011
Source: CEaCS, 2011 (derived from unit record file)
The following sections provide more information about formal ECEC and informal care.
Formal child care and early childhood education
The age-related patterns of formal ECEC participation reflect patterns of participation in different types of formal ECEC (Figure 2).
- Preschool is available to children in the year or two before they commence full-time school, and so participation clearly peaked at 4 years, with some 3-year-olds and 5-year-olds also participating in this form of ECEC.
- Long day care was the main source of formal ECEC to children under school age, with the highest proportions of children in long day care being at age 2-3 years (about 45% of children), but with about 30% of 1-year-olds and 4-year-olds also in long day care.
- Smaller percentages of under-school-aged children were in other forms of formal ECEC, which includes family day care and occasional child care.
- The main provision of formal ECEC to school-aged-children was as outside-school-hours care, and the percentage in this form of care was between 13% and 17% across ages 5 to 9 years, after which the proportions declined.
Figure 2: Types of formal ECEC, by child age, 2011
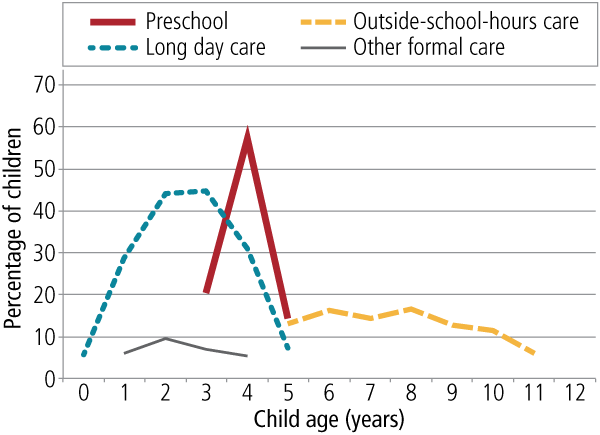
Note: Information for 12-year-olds is not shown because of the high standard error on the estimate. Likewise, estimates for other formal care are only shown for those ages at which statistically robust estimates could be derived.
Source: CEaCS, 2011 (derived from unit record file)
The age-related patterns described above reflect that children move into and out of different forms of care as they grow older, their developmental needs are perceived to change, or their parents' needs for child care alter. Thus, children enter primary school having had varying prior experiences of ECEC participation. The Longitudinal Study of Australian Children (LSAC) has allowed us to capture the ECEC participation of children every two years - from ages 0-1 years through to ages 8-9 years so far - and build up a picture of the different ECEC experiences leading up to their early primary school years.3
From these data, the percentage of children in formal ECEC was 16% at 0-1 years, 58% at 2-3 years, 93% at 4-5 years (excluding those already in school at this age), 18% at age 6-7 years, and 15% at 8-9 years. Looking back on children's formal ECEC participation prior to starting school:
- 43% were in ECEC at ages 2-3 years and 4-5 years, but not 0-1 years;
- 36% were in ECEC at age 4-5 years, but not 0-1 or 2-3 years;
- 12% were in ECEC at 0-1 year, 2-3 years and 4-5 years;
- 5% were not in ECEC at any time; and
- 3% had other combinations of ECEC.
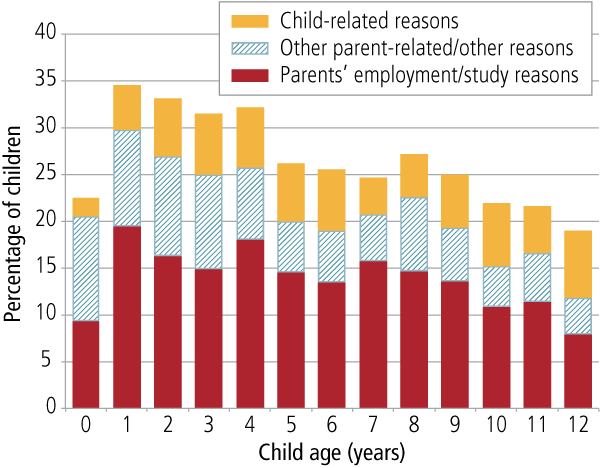
Children may attend ECEC for a range of reasons, with the predominant one being enabling parents to engage in paid employment, followed by providing developmental or social opportunities for children. Of children aged under 6 years in some formal ECEC other than preschool:4
- 66% attended because of parents' employment;
- 11% attended due to other parent-related/other reasons (the most common being "give parents a break"); and
- 23% attended for child-related reasons.
Of children aged 6-12 years in some formal ECEC:
- 90% attended because of parents' employment;
- 5% attended due to other parent-related/other reasons; and
- 5% attended for child-related reasons.
For the younger children, the top child-related reasons were that it was good for child (18%) and to prepare child for school (4%) (remembering this information was not collected for children who were only in preschool). The category "parents' employment" includes a small number who were undertaking work-related study or training, and an even smaller number who were looking for work, with the vast majority saying the care was for work reasons.
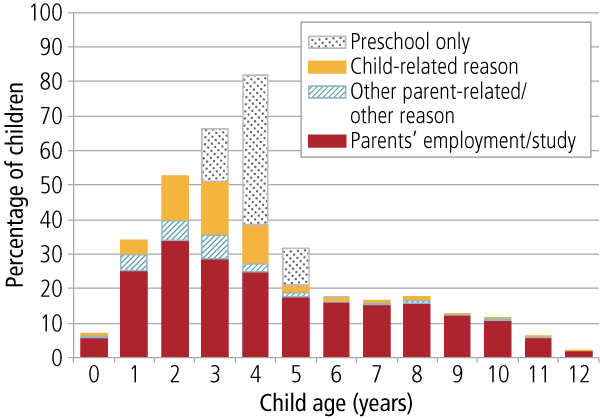
Figure 3 shows that the reasons parents provided for their children's formal ECEC attendance varied by child age, although employment-related reasons predominated at all ages. For the youngest children and primary-school-aged children in formal ECEC, parents did not often say that ECEC was used for child-related reasons. Such reasons were often given for children aged 2-4 years in formal ECEC. As reasons for participation in preschool were not obtained, this is shown in the figure for those children who were in preschool and no other types of formal ECEC.
Figure 3: Reasons for formal ECEC, by child age, 2011
Source: CEaCS, 2011 (derived from unit record file).
Children aged 0-12 years in formal ECEC spent an average of 15 hours per week there, with 51% of these children attending care for one or two weekdays per week. The time children spent in care varied according to the different types of formal ECEC used (Table 1).
| Type of ECEC and reason for care | Hours per week in care (mean) | 1-2 weekdays in care (%) |
|---|---|---|
| Source: CEaCS, 2011 (derived from unit record file) | ||
| Long day care | 20 | 57 |
| For parental employment reasons | 22 | 48 |
| For other parent-related/other reasons | 16 | 69 |
| For child-related reasons | 15 | 76 |
| Preschool | 13 | 54 |
| Outside-school-hours care | 6 | 52 |
| Other formal ECEC | 14 | 65 |
| Any formal ECEC | 15 | 51 |
- The children who spent the longest time in formal ECEC were those who attended long day care (20 hours per week on average), with 57% attending care on one or two weekdays per week and 43% attending on three to five weekdays. However, this varied according to parents' reasons for children's attendance in care:
- The average time spent in long day care was 22 hours per week when care was related to parents' employment, with 48% of children in care one or two days per week and 52% three to five days.
- If children were in long day care because of other parent-related or child-related reasons, they spent less time in care on average (15-16 hours per week), with a majority spending only one or two days per week in child care.
- Children in preschool spent less time there than those in long day care, spending on average 13 hours per week in preschool. Of these children, 54% were in preschool one or two days per week.
- Children in outside-school-hours care spent only 6 hours per week in this care, on average. About one in two of these children attended one or two days per week.
In these analyses, we have only reported the number of weekdays children attended formal ECEC, as the number reported as using formal care on weekends was negligible.
As parents' employment is a key reason for children to be in ECEC, it is not surprising that ECEC participation varies with different parental employment arrangements. This is shown in Table 2 for broad employment categories, and further separated by single-parent and couple-parent families (since they have different resources within the household for the provision of parental care of children).
- Looking first at the 0-2 year olds, children in families of employed single parents were the most likely to be in some formal ECEC (65%). Just under half (49%) of the children in couple families with two employed parents (dual-employed families) were in formal ECEC. Children were less likely to be in formal ECEC in those families in which at least one parent was not employed.
- For 3-5 year olds, the percentage in formal ECEC was highest in families of employed single parents (67%) or dual-employed families (71%), and these children were most likely to be in long day care (35-36%). In dual-employed families, 32% of children were in preschool, while the percentage was lower in families of employed single parents (23%).
- For 6-12 year olds, very few children were in formal ECEC when there was at least one parent in the family who was not employed, with the percentage being highest in families of employed single parents (23%) and in dual-employed families (16%).
| Child age and type of formal ECEC | Couple-parent family | Single-parent family | All families (%) | |||
|---|---|---|---|---|---|---|
| Both parents employed (%) | One parent employed (%) | Neither parent employed (%) | Employed (%) | Not employed (%) | ||
| Note: a "Other formal ECEC" includes after-school care for 3-5 year olds. Source: CEaCS, 2011 (derived from unit record file) | ||||||
| 0-2 years | 49 | 16 | 12 | 65 | 23 | 32 |
| 3-5 years | 71 | 53 | 40 | 67 | 46 | 60 |
| Long day care | 36 | 19 | 20 | 35 | 20 | 28 |
| Preschool | 32 | 35 | 20 | 23 | 24 | 31 |
| Other formal ECEC a | 13 | 4 | 6 | 19 | 5 | 9 |
| 6-12 years | 16 | 3 | 3 | 23 | 3 | 12 |
We return to examine formal ECEC and how it is combined with informal care in different families after an examination of informal child care below.
Informal child care
This section now focuses on the other broad form of child care - that provided by informal providers of care, including grandparents, non-resident parents, other relatives of the children (including siblings), and other unrelated persons (including nannies, friends and neighbours). Of all children aged up to 12 years old, 27% had been cared for by an informal carer in the survey week.
- Grandparent-provided child care was the most common of the types of informal care. Of all children aged 0-12 years, 16% were cared for by a grandparent.
- The proportion cared for by other informal care providers, at any age, was quite small, with 4-5% cared for by each of the following: a non-resident parent, another relative, or an unrelated person.
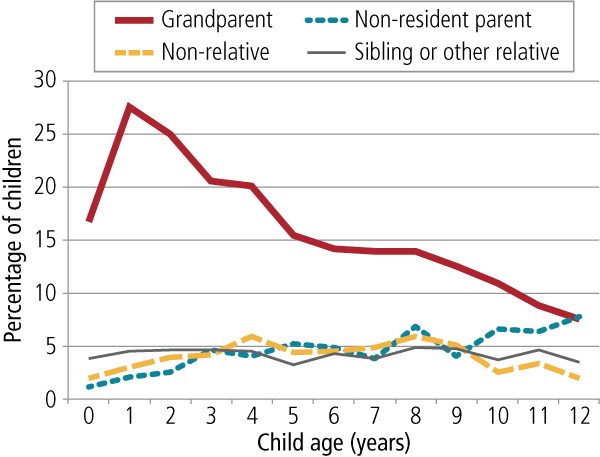
The overview of broad care types by child age in Figure 1 showed that the percentage of children in informal care did not vary a great deal by age of child. Figure 4 shows that there is some variation when looking at the different informal care providers:
- Grandparents were especially likely to be providing care to children aged 1 or 2 years (27% and 25% respectively), with the proportion cared for by grandparents declining as children grow older.
- The percentage cared for by a non-resident parent increased with children's age, no doubt reflecting that as they grow older, there is an increased likelihood of children experiencing their parents' separation, and parents sharing the care of children across two households.
Figure 4: Children cared for by different informal child care providers, by child age, 2011
Source: CEaCS, 2011 (derived from unit record file)
As with formal child care, children may be in informal child care for reasons other than their parents' employment, although parents' employment was the most commonly cited reason overall. Of the informal care provided to children aged 0-12 years:
- 52% was related to parents' employment;
- 27% was related to other parent-related/other reasons; and
- 21% was child-related reasons.
The reasons for using informal care related to parents' employment were predominantly to facilitate parents' work, but a small number of families reported that the care was used for parents' work-related study or training. A negligible number said it was to allow parents to look for work. Other parent-related reasons for using informal care included entertainment or social occasion (6%), giving parents a break (6%), shopping (3%), and other (7%). The child-related reasons included parents saying it was "good for child" (8%), spending time with the other parent (11%), and other (2%).
There is some variation in the reasons for informal care by child age. Figure 5 shows the percentage of children aged 0-12 years in some informal care, by their main reason for using that care.
- At most ages, parents' employment remained the most commonly cited reason.
- This was not true for the youngest children (aged under 1 year), with informal care often used for other parent-related reasons. Such reasons were less likely to be given as children grew older.
- The sustained proportion of children in informal care for child-related reasons (and increase at older ages) reflects the specific reason of "to spend time with other parent". This is consistent with the trends shown in Figure 4 in the growth in the percentage of older children being cared for by a non-resident parent.
Figure 5: Reasons for informal child care, by child age, 2011
Source: CEaCS, 2011 (derived from unit record file)
Of all children in informal child care, the average number of hours per week spent in informal care was 12 hours, with 59% of children spending one or two weekdays in informal care and 29% spending at least one weekend day in informal care.5 There were some differences according to who the provider of the informal care was (Table 3).
- In particular, some children were described as being cared for by a non-resident parent during the week. This of course is likely to be related to an arrangement between separated parents that goes beyond what is typically thought of as child care. The characteristics of that care differ considerably to other forms of informal care, with the average amount of time children spent in the care of a non-resident parent reported to be 27 hours per week. These children were a little less likely than other users of informal care to use informal care only one or two days per week, and they were more likely to spend some weekend time cared for by their non-resident parent.
- Children cared for by grandparents spent an average of 11 hours per week in this form of care, with 63% cared for only one or two weekdays per week, and 20% cared for on at least one weekend day.
- Children cared for by other relatives spent less time in this care (9 hours per week), but they were more often cared for by this carer on a weekend compared to those children cared for by grandparents.
- Children cared for by an unrelated person were less likely to be in the care of this person on a weekend compared to other informal care providers.
| Informal care provider | Hours per week in care (mean) | 1-2 weekdays in care (%) | 1-2 weekend days in care (%) |
|---|---|---|---|
| Source: CEaCS, 2011 (derived from unit record file) | |||
| Grandparent | 11 | 63 | 20 |
| Non-resident parent | 27 | 56 | 62 |
| Other relative | 9 | 60 | 49 |
| Unrelated person | 9 | 61 | 14 |
| Any informal care | 12 | 59 | 29 |
If we instead look at these figures by the main reason for the informal care, Table 4 shows:
- Those in informal care because of parents' employment were least likely to be in this care on weekends. Weekend care was much more likely for child-related reasons (which relates to care by a non-resident parent) and other parent-related reasons.
- Again, consistent with the other findings related to care by a non-resident parent (above), children who were in informal care for child-related reasons spent the longest time in informal care during the week (an average of 18 hours per week).
- This compared to 12 hours per week for those who were largely in informal care because of their parents' employment.
- Those in informal care for other parent-related/other reasons spent the least time in informal care, at 10 hours per week.
| Reason for informal care | Hours per week in care (mean) | 1-2 weekdays in care (%) | 1-2 weekend days in care (%) |
|---|---|---|---|
| Source: CEaCS, 2011 (derived from unit record file) | |||
| Parental employment reasons | 12 | 57 | 14 |
| Other parent-related/other reasons | 10 | 62 | 38 |
| Child-related reasons | 18 | 60 | 54 |
| Any informal care | 12 | 59 | 29 |
As with formal child care, the percentage of children in informal care was highest when parents were employed, with 55% of children of employed single parents in some informal care and 31% of children in dual-employed families in informal care (Table 5).
- In dual-employed families, this percentage was highest for 0-2 year olds (43% in informal care), then 3-5 year olds (36%), then 6-12 year olds (25%).
- For children of employed single parents, the percentages were highest for both 0-2 year olds and 3-5 years olds (66-67%) compared to 51% for 6-12 year olds.
- The difference between these two family types lies in the higher incidence of children being cared for by a non-resident parent in single-parent households. The percentage cared for by a grandparent was similar to dual-employed (22%) and employed single-parent households (21%). In the latter, a somewhat higher percentage of children was also cared for by another relative (10%, compared to 4% for children in dual-employed families).
| Age of child | Couple-parent family | Single-parent family | All families (%) | |||
|---|---|---|---|---|---|---|
| Both parents employed (%) | One parent employed (%) | Neither parent employed (%) | Employed (%) | Not employed (%) | ||
| Source: CEaCS, 2011 (derived from unit record file) | ||||||
| 0-2 years | 43 | 17 | 9 | 66 | 32 | 30 |
| 3-5 years | 36 | 16 | 13 | 67 | 28 | 30 |
| 6-12 years | 25 | 10 | 6 | 51 | 19 | 24 |
| 0-12 years | 31 | 14 | 9 | 55 | 25 | 27 |
The percentage of children in some informal care among families with not-employed single parents was also relatively high (25%), which of course largely reflects the high percentage of these children (13%) being cared for by a non-resident parent (Table 6).
| Informal care provider | Couple-parent family | Single-parent family | All families (%) | |||
|---|---|---|---|---|---|---|
| Both parents employed (%) | One parent employed (%) | Neither parent employed (%) | Employed (%) | Not employed (%) | ||
| Note: * Indicates relative standard error > 25%. Source: CEaCS, 2011 (derived from unit record file) | ||||||
| Grandparent | 22 | 9 | 7 | 21 | 7 | 16 |
| Non-resident parent | 1 | < 1 | * | 27 | 13 | 5 |
| Other relative | 4 | 3 | 2 | 10 | 5 | 4 |
| Unrelated person | 6 | 2 | * | 6 | 1 | 4 |
| Any informal ECEC | 31 | 14 | 9 | 55 | 25 | 27 |
Combinations of child care
While the above sections have explored formal care and informal care separately, in fact many children regularly attend more than one form of care; for example, when parents supplement informal grandparent care with formal outside-school-hours care.
The combinations of different care arrangements used by children across ages 0-12 years old are shown in Figure 6. Here, categories of care have been combined to create a "formal child care" category, which includes long day care, outside-school-hours care and other formal care. The combinations shown include those who attend formal child care as well as preschool; informal care as well as preschool; informal care as well as formal child care; and informal care, preschool and formal child care. The total height of each bar shows the percentage of children in any type of ECEC.
- Combining informal care with formal child care was most common for children aged 1 to 3 years. In fact, at 3 years, of children in informal care, about half were only in informal care and the other half were in some formal child care as well.
- Being only in informal care became less likely at 3 and especially 4 years, when most children were in some formal ECEC, such that, when used, informal care was often combined with either formal child care or preschool.
- There were very diverse care arrangements among 4-year-old children. This was true also of 5-year-old children, which included some 5-year-olds already in school and some who were not.
- Child care arrangements very often involved only informal care once children were school-aged.
Figure 6: Combinations of ECEC, by child age, 2011
Source: CEaCS, 2011 (derived from unit record file)
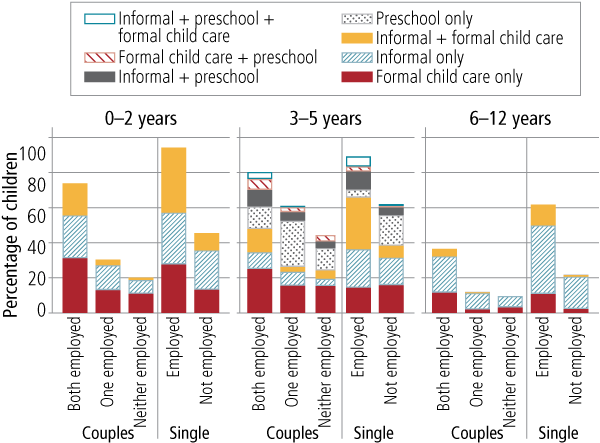
Earlier in this Facts Sheet, children's formal and informal care information was shown by family employment status. Figure 7 shows the combined ECEC information by family employment status, for each of the broad age groups: 0-2 years, 3-5 years, and 6-12 years.
Figure 7: Combinations of ECEC, by child age groups and family employment status, 2011
Source: CEaCS, 2011 (derived from unit record file)
For 0-2 year olds:
- Combining informal and formal child care was most likely for dual-employed couples and employed single parents. It was particularly prevalent for the latter. These two groups had fairly similar percentages of children in formal child care only, but the children in employed single-parent households were more likely to be in informal care only or in a combination of formal and informal care.
- The children were least likely to be in some ECEC in couple families with only one employed parent or where neither parent was employed. Children in these families were not often in both formal and informal care.
For 3-5 year olds:
- As with 0-2 year olds, the 3-5 year olds in jobless couple families were least likely to be in some ECEC.
- Arrangements were very diverse across all groups of family employment status, but there were some differences across groups:
- preschool only was most likely in couple families with one employed parent; and
- formal child care only was most likely in dual-employed families.
- As with 0-2 year olds, a combination of formal and informal care was most likely in families of employed single parents.
For 6-12 year olds:
- The majority of children in couple families with no employed parent or only one employed parent were not in any child care (that is, they were only in parental care).
- Informal care was often used in families of employed single parents or in dual-employed families, and this was often the only form of care used, although it was more common in the families of employed single parents for their children to be in some formal care and some informal care.
The data presented in Figure 7 also show that in couple families, even when both parents were employed, a considerable percentage of families managed with only parental care.
- For 0-2 year olds with dual-employed parents, 26% were only in parental care.
- This was less common at age 3-5 years, when ECEC was more commonly used even when parents were not employed. Twenty per cent of children in dual-employed families were only in parental care.
- For school-aged children with two employed parents, 64% were in parent-only care.
At school age, one or both parents may work during school hours, such that care outside of school hours is not needed. At younger ages, other flexible working arrangements may be used such that parents manage their work hours and child care between themselves rather than relying on others. To some extent, this is explained by the fact that dual-employed families include families in which one parent (usually the mother) works quite short hours, and these families may be most likely to juggle their work commitments around the time the other parent is able to provide care. This is evident if the child care combinations are examined according to mothers' work hours, putting aside family form and fathers' employment status (Figure 8).
Figure 8: Combinations of ECEC, by child age groups and mothers' work hours, 2011
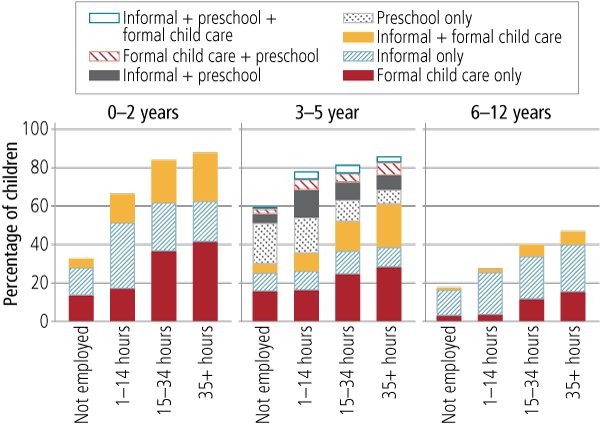
Source: CEaCS, 2011 (derived from unit record file)
For children aged 0-2 years:
- If mothers worked 15 hours or more per week, then their child care patterns were similar in terms of care combination percentages, regardless of whether they worked part-time or full-time hours. The most common arrangement was for formal child care only to be used, with informal child care only being less likely to be used. Children were fairly equally likely to be in informal care only or to be in a combination of informal and formal care.
- If mothers worked 1-14 hours per week, children were considerably less likely to be in formal child care, with many in informal child care only, or in no child care at all.
For children aged 3-5 years:
- Being in some formal child care increased with mothers' work hours, which was evident in increased percentages in formal child care only and in a combination of formal and informal care. The latter, especially, was higher when mothers worked full-time hours.
- It was increasingly unlikely for children to be only in preschool as mothers' work hours increased, although for mothers working short part-time hours (fewer than 15 hours per week), it was quite common for children to be in a combination of preschool and informal child care.
For school-aged children:
- The percentage in formal child care increased with mothers' work hours, with very few children in formal child care when mothers were not employed or worked short part-time hours.
- The percentage in informal care only was higher when mothers were employed, but only marginally higher when mothers worked full-time hours.
- The percentage in both formal and informal care remained fairly low, but did increase with mothers' work hours.
Family characteristics and ECEC
More detailed analyses of the family characteristics associated with the likelihood of children being in different care arrangements were undertaken and some findings from these analyses are summarised here.6
- For children under 3 years old, parent-only care was more likely when fathers were not employed or worked part-time hours, rather than working 35-54 hours. This was not as apparent for older children, and so may reflect fathers' involvement in child care at younger ages.
- At all ages, children in single-parent households were significantly more likely to be in some ECEC compared to those in couple families.
- At all ages, children in single-parent households were more likely than others to be in informal care only. They were also more likely than others to be in both formal and informal care, rather than formal care only.
- Children aged 3-5 years old in single-parent households were significantly less likely than other children to be in preschool only or formal child care only.
- Children in higher income families were more likely to be in some ECEC. This was reflected in their use of formal ECEC as well as informal care.
- Children aged 6-12 years old living outside a major city area were more likely to be in parental care only.
- Those aged 0-2 years old and 6-12 years old with a self-employed parent were more likely to be in only parental care.
- For 3-5 year olds, those living in jurisdictions that tended to provide preschool through schools (more typically the case in ACT, NT, SA, Tasmania and WA) were more likely than those in other jurisdictions to be in preschool only, and less likely to be in formal care only.
Child care difficulties
Information about families' use of child care provides valuable information about the services and supports families rely upon, especially in the context of parents' employment. However, the child care options available to families may not always meet families' needs or may cause challenges or difficulties. This section starts by drawing upon information collected from parents in the Household, Income and Labour Dynamics in Australia (HILDA) survey (using Wave 12 data collected in 2012), in which they were asked about difficulties they had had with child care in the past year.
This information is as reported by parents of children aged up to 14 years old who used or considered using child care in the previous 12 months. Respondents were asked to rate how much difficulty they had had with various aspects of child care, on a scale of 0 (not difficult) to 10 (very difficult). These responses have been grouped into three categories of: not difficult (0-3), somewhat difficult (4-6), and very difficult (7-10). For some items, a high proportion did not answer the question, indicating that it was not applicable. This was most apparent for the item relating to finding care for a difficult or special needs child, for which approximately 80% of the respondents did not feel this applied to them.
Overall, Figure 9 shows that parents were most likely to report a "very difficult" response with:
- finding care for a sick child (30%);
- finding care at short notice (29%); and
- the cost of their care (29%).
Figure 9: Child care difficulties experienced in last 12 months reported by those using work-related child care, 2012
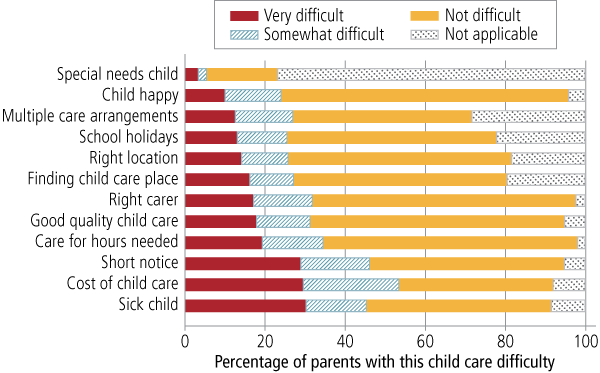
Source: HILDA, Wave 12
Nevertheless, the majority of parents reported a score that fell into the "not difficult" category on these and other items.
Looking at these responses according to the existing care arrangements of any children (aged up to 14 years) in the family, some findings evident in Figure 10 are:
- Families using formal child care were the most likely to have had difficulties with the cost of care and with finding care for a sick child, compared to families using only informal or parental care.
- Those using only informal care were the least likely to have reported difficulties with:
- finding care at short notice;
- the cost of care;
- finding a child care place; and
- finding care at the right location.
- Those not currently using care were the most likely to have reported difficulties with:
- finding care for school holidays;
- finding good quality child care;
- finding the right carer; and
- getting care for the hours needed.
Figure 10: Child care difficulties experienced in last 12 months reported by those using work-related child care, by care currently used, 2012
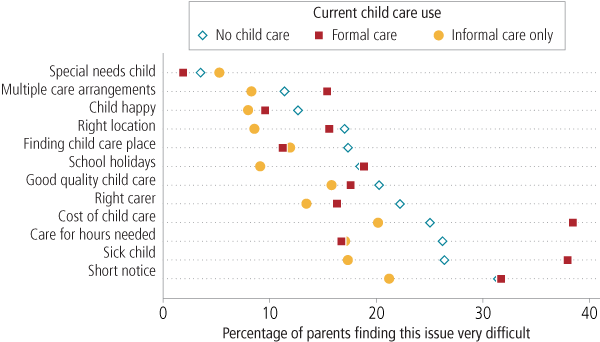
Source: HILDA, Wave 12
Looking at these data according to the employment status of parents within the household, these responses were examined for dual-employed couples and employed single parents, given that they are the most likely to have had a need for work-related child care. The key findings were:
- Employed single parents were more likely than parents in dual-employed families to have difficulties:
- finding care for a sick child (40% compared to 30%);
- finding care at short notice (34% compared to 28%);
- getting care for hours needed (24% compared to 17%); and
- finding care for school holidays (16% compared to 12%).
- Dual-employed couple-parents more often reported having difficulties finding a child care place than employed single parents (14% compared to 10%).
A particular challenge for families might be in finding care to suit their work hours when they are variable or non-standard. If these data are examined according to whether mothers worked regular daytime hours or some other schedule (e.g., irregular hours, night-time schedules):
- mothers working regular daytime hours more often had difficulties with finding care for a sick child (33% compared to 24% for those working irregular or other hours); and
- compared to mothers working regular daytime hours, those working irregular or other hours more often had difficulties:
- finding care at short notice (32% compared to 27%);
- with the cost of child care (34% compared to 27%); and
- getting care for hours needed (26% compared to 16%).
Summary and key messages
Families manage the care and early childhood education of their children in very diverse ways. As seen in this Facts Sheet, the variation in characteristics of ECEC used reflects that families have access to different forms of ECEC, different needs for care, and different views about what would suit them and their family best. Many families find solutions that involve a combination of formal and informal child care, although some families with employed parents manage with parent-only care. The solutions adopted vary considerably by age of child.
Within families, arrangements may be even more complex than we have seen here, given that families with multiple children may need to juggle the ECEC needs of children of different ages. The analyses of child care difficulties highlight that there are families that are more likely to have challenges in managing their child care needs. Vulnerable families, including single parents and those with mothers working irregular or other non-standard schedules, are more likely to have difficulties with certain aspects of child care.
Strong communities are important resources for families seeking ECEC arrangements for their children. Strong neighbourhood and family ties can provide families with informal options for the care of their children. For very young children, this might be especially valued. Further, as children grow through their primary school years, having these informal connections may be especially valued by the children themselves as alternatives to formal school-aged programs. ECEC supports within communities are important resources for families across all ages of children, and especially so for families with children in the years just before school commencement. They facilitate parental employment and provide social and learning opportunities for children.
Reference
- Baxter, J. A., & Hand, K. (2013). Access to early childhood education in Australia (Research Report No. 24). Melbourne: Australian Institute of Family Studies.
Footnotes
1 It is also important to include as there is considerable variation across jurisdictions of Australia in the delivery of early childhood education. In some jurisdictions, early childhood education is primarily delivered through preschools or kindergartens, often attached to schools. In others, it is more often delivered through the child care system. See Baxter and Hand (2013).
2 These data are from the most recent ABS Childhood Education and Care Survey (CEaCS) available when this Facts Sheet was compiled. The information presented here was derived from the confidentialised unit record file. The ECEC statistics refer to children's attendance in different forms of ECEC in the week before the interview (in June 2011).
3 This is based on children in the B cohort, but excluding children at 4-5 years if they were already attending school. The "looking back" data include those who were in each of the first three waves of LSAC.
4 Reasons for attendance were not captured in relation to preschool.
5 In these calculations, those spending more than 60 hours per week in a particular type of informal care were excluded, to avoid the average duration being inflated by these cases. The main purpose of this was to exclude the small number of children reported to have spent all of the previous week (168 hours) cared for by their non-resident parent or grandparent, but there were also others reported to have spent very long hours in informal care - possibly having spent several whole days in that person's care.
6 These findings are based on multivariate analyses of children being in: (a) only parental care, (b) only formal care, (c) only informal care, or (d) both formal and informal care. Multinomial logit models were used, with separate models estimated for each broad age group. In addition to child age, variables included were mothers' work hours, fathers' work hours (or indicator if no father present, i.e., in a single-mother family), number of children in family, remoteness, age of child in years, parental income, an indicator of either (or single) parent being self-employed or being born overseas in a country that is not classified as mainly English-speaking. In addition, in the model for 3-5 year olds, an indicator of the child being in school was included, as was an indicator of the child living in one of the jurisdictions that tends to offer preschool through the government sector (ACT, NT, Tasmania, SA and WA). Single-father families were excluded because of the small sample size. Further, a more complex model was estimated with an additional category of "only preschool" for the 3-5 year olds. In this model, the category "only formal care" includes those in preschool plus some formal child care, and the category "both" includes those in informal care as well as either preschool or formal child care.
Key messages
-
Children move into and out of different forms of care as they grow older, as they develop, and as their parents’ needs alter. Many children regularly attend more than one form of care.
-
The main reason children attend formal care is to enable parents to work.
-
Children in families of employed single parents were most likely to be in care, followed by children with two employed parents.
-
Of all children aged up to 12 years, 27% had been cared for by an informal carer (most commonly a grandparent) in the survey week.
Dr Jennifer Baxter is a Senior Research Fellow at the Australian Institute of Family Studies.
The data in this Facts Sheet were sourced from: Australian Bureau of Statistics Early Childhood Education and Care Survey (2011); Household, Income and Labour Dynamics in Australia (2012); Growing Up in Australia: The Longitudinal Study of Australian Children. The HILDA project was initiated and is funded by the Australian Government Department of Social Services, and is managed by the Melbourne Institute of Applied Economic and Social Research (Melbourne Institute). LSAC is conducted in a partnership between the Department of Social Services, the Australian Institute of Family Studies and the Australian Bureau of Statistics. The views expressed in this Facts Sheet are those of the author and may not reflect those of AIFS, the Melbourne Institute or the Australian Government.
Families Week 2015 logo © Families Australia. Photo credits: Front cover © istockphoto/AshleyWiley.
Baxter, J. A. (2015). Child care and early childhood education in Australia (Facts Sheet 2015). Melbourne: Australian Institute of Family Studies.
978-1-76016-023-4