Australian mothers' participation in employment
Analyses of social, demographic and family characteristics using the Household, Income and Labour Dynamics in Australia (HILDA) survey
You are in an archived section of the AIFS website
November 2013
Download Research report
Overview
This paper explores the characteristics of employed and non-employed mothers, to identify the factors that contribute to differing employment levels
In 2009-10, almost two-thirds of Australian mothers of children aged under 15 years were employed. This employment rate remains below that of many other OECD countries, indicating that there may be potential for increases in maternal employment in Australia.
This paper explores the characteristics of employed and non-employed mothers, to identify the factors that contribute to differing employment levels.
Using data from the Household, Income and Labour Dynamics in Australia (HILDA) survey, it examines birth and work history, labour force characteristics, socio-demographic characteristics (e.g., education, number and age of children, and health status), and self-perceptions and values among lone and couple mothers.
In particular, it examines whether non-employment is due to a preference to be at home or due to barriers to employment imposed by personal or family characteristics.
Key messages
-
the importance of caring for children by the many mothers who remain out of employment;
-
significant factors such as having long-term health conditions and other caring responsibilities, are more common among mothers with lower levels of engagement in paid work;
-
mothers' values about workfamily issues are strongly related to employment outcomes; and
-
non-employed mothers with older children, and lone mothers who are not employed seem to have the greatest barriers to employment as indicated by characteristics such as education and health status.
Executive summary
In 2009-10, almost two-thirds of Australian mothers of children aged under 15 years were employed. This employment rate remains below that of many other OECD countries, indicating that there may be potential for increases in maternal employment in Australia. This research was designed to provide insights on the factors that contribute to some mothers being less engaged in the labour market than others, in particular to examine to what extent mothers who are out of employment are not employed because of a preference to be at home, or because of barriers to employment imposed by their own or family characteristics.
The analyses are based on the Household, Income and Labour Dynamics in Australia (HILDA) survey, a panel survey of Australian households, using the responses of mothers with children aged under 15 years. The primary focus of the research is on how characteristics of mothers vary according to different measures of employment participation, relationship status and age of youngest child. Characteristics examined include mothers' birth and work history, labour force characteristics, socio-demographic characteristics (e.g., education, number and age of children, and health status), self-perceptions (of personal autonomy), social supports and values. To measure employment participation, employment status at the survey date was analysed, as well as measures of employment participation derived from the HILDA employment calendar data, in which information about mothers' employment over the course of a year is captured. Most of the analyses are based Wave 11 (collected in 2011), though earlier waves of data are also used.
The report presents four main sets of analyses. One is an overview of trends in maternal employment. The second is analyses of the characteristics of lone and couple mothers (and families) according to the measures of employment participation derived from the calendar data. The third is analyses of characteristics of non-employed mothers, comparing those with younger children (up to 5 years) to those with older children (6 to 14 years). The fourth is analyses of characteristics of non-employed mothers at one wave (Wave 10) of HILDA, according to whether they were employed in the following wave (Wave 11). In this section, data from earlier waves were used when they had not been collected in Wave 10. Some key findings from these analyses are summarised below, drawing on the findings from across these different sets of analyses.
Employment of lone and couple mothers by age of youngest child
As calculated from HILDA, the employment rate of mothers with children aged under 15 years was 62% in 2011. For lone mothers, the employment rate was 56% and for couple mothers the employment rate was 64%. The gap in lone and couple mothers' employment rates was greatest for mothers of children aged under 3 years (26% employed for lone mothers and 46% employed for couple mothers) or aged 3 to 5 years (44% employed for lone mothers and 63% employed for couple mothers). For mothers whose youngest child was aged 6 to 9 years, 67% of lone mothers were employed and 74% of couple mothers were employed. For mothers whose youngest child was aged 10 to 14 years, 74% of lone mothers were employed and 83% of couple mothers were employed.
Socio-demographic characteristics and maternal employment
Mothers with a stronger attachment to work (as evidenced by their time spent in employment in the previous financial year) had different personal and family socio-demographic characteristics to those with a weaker attachment to work. This was also apparent when the characteristics of non-employed mothers who did and did not enter employment over a period of two years were compared. Also, differences were apparent for non-employed mothers with younger rather than older children.
Educational attainment of mothers was one factor that varied across the different groups compared, with lower levels of educational attainment among mothers with less connection to employment, among those who did not transition into employment over two waves of HILDA, and among non-employed mothers with older rather than younger children.
For some mothers, non-employment was a continuation of weaker connection to employment, even from the time before they became mothers. For example, spending more time out of employment in the previous financial year was associated with mothers having started childbearing at an earlier age, and having been less likely to be employed in the year before having a first child.
Having caring responsibilities for someone due to their ill health, disability or old age was related to lower levels of engagement in paid work. In particular, caring for others appears to be a feature of non-employed mothers with older children. Mothers with caring responsibilities were under-represented among those who transitioned from non-employment to employment over two waves of HILDA.
Health status was also an important factor for both lone and couple mothers, with poorer health among those who had been out of employment for all or most of the previous year, and also poorer health among the non-employed mothers with older, compared to younger, children. The importance of health status is apparent, for example, with 36% of lone mothers with little or no time in employment in the previous year reporting to have a long-term health condition.
In relation to country of birth and language, the key findings related to mothers born overseas with poor English language proficiency being over-represented among those with lower levels of engagement in paid work.
The presence of caring responsibilities and health concerns were also related by some mothers as being reasons for their not looking for work, though these reasons were less often given than were those related to caring for children.
Self-perceptions, social supports, work-family attitudes and maternal employment
Mothers' mental health, perceptions of social support, beliefs in personal autonomy and work-family attitudes were examined in these analyses. Mental health is measured in HILDA with questions from the Short Form Health Survey. Perceptions of social support are measured by respondents' agreement or otherwise to statements such as having someone to lean on in times of trouble, or having an unmet demand for help. Beliefs in personal autonomy are likewise measured by respondents' agreement or otherwise to statements such "I can do just about anything I really set my mind to" and "I often feel helpless in dealing with the problems of life". Work-family attitudes are assessed using responses about agreement on items such as "Mothers who don't really need the money shouldn't work" and "Children do just as well if the mother earns the money and the father cares for the home and the children".
Mothers who had spent less of the previous year in employment tended to have poorer mental health and to have more perceived difficulties with social supports. Also, non-employed lone mothers, compared to couple mothers, were much more likely have had difficulties with social supports. There were some differences in beliefs in personal autonomy across the employment groupings, but these differences were more apparent for couple mothers, with those having been employed for little/none of the previous year having lower beliefs in personal autonomy than others. With regard to work-family attitudes, views tended to be more aligned with "traditional" values among mothers with a lesser connection to employment. Such attitudes, of course, may have been shaped by past employment patterns, such as having had a relatively long period of time out of the labour market while undertaking a caring role. Expressed values may also be based upon mothers' future plans or expectations regarding employment.
While these data do not allow us to say that lower levels of mental health, social supports or autonomy, or traditional work-family values, cause lower rates of participation in employment by lone mothers, they do suggest the presence of personal characteristics that could result in relatively low levels of confidence or motivation, which may deter mothers from attempting to enter employment.
Different socio-demographic characteristics of lone and couple mothers
The characteristics of lone and couple mothers are relevant to their differences in employment participation. For example, lone mothers had lower educational levels, older children, were more often Australian-born and were younger than couple mothers. Lone mothers had poorer (self-reported) health, and were more likely than couple mothers to have a long-term health condition. Couple mothers had significantly better mental health and more positive beliefs in personal autonomy than lone mothers. Lone mothers were more likely than couple mothers to report having difficulties with social supports.
Labour force characteristics
Mothers are often not in paid work because they have very young children to care for, and indeed, for mothers of the youngest children, they are facilitated to remain out of employment through the provision of parental leave. Detailed labour force information provides insights on the degree to which mothers want to be working, and their reasons for not working.
Being unemployed indicates than non-employed mothers are actively looking for work and available to start work. While most non-employed mothers are not unemployed (they are instead classified as "not in the labour force"), non-employed lone mothers were more likely to be unemployed than couple mothers. Also, non-employed mothers of older children were more likely to be unemployed when compared to non-employed mothers of younger children.
The majority of non-employed mothers are not in the labour force, rather than unemployed. Many report that they do not want to work, though this differs considerably by relationship status as 57% of non-employed couple mothers and 38% of lone mothers did not want a job.
Even if mothers indicated that they would like to be working, they often reported that they were not looking for work because they were caring for children. The mothers showing the least desire to be working were couple mothers with children aged up to 5 years old, though a large proportion of mothers who were not employed with a youngest child aged 6 to 14 years still referred to caring responsibilities in their reasons for not looking for work.
In analysing transitions over two waves of HILDA, those who moved into employment had been more attached to the labour market in the previous year, through undertaking direct job search and/or being available to work.
Summary
Overall, the most significant associations with maternal employment throughout these analyses were in relation to age of youngest child, mothers' health status and level of educational attainment. Non-employed mothers with older children, and lone mothers who were not employed seemed to have the greatest barriers to employment as indicated by characteristics such as education and health status. While some groups of mothers appear to be faced with more barriers to employment than others, the significance of caring for young children was apparent throughout these analyses for mothers with varying degrees of attachment to employment.
1. Introduction
In 2009-10, almost two-thirds (62%) of Australian mothers of children aged under 15 years were employed.1 While this percentage is higher than it has been in previous decades, it remains below that of many other Organisation for Economic Co-operation and Development (OECD) countries (Baxter & Renda, 2011; OECD, 2007, 2012).
This relatively low percentage indicates that there may be potential for increases in maternal employment in Australia. As part of the productivity agenda in Australia, there is considerable interest in understanding whether certain barriers deter some mothers from entering, or remaining in, employment. As such, this research was designed to provide some insights on the different factors that might contribute to some mothers being less engaged in the labour market than others. The analyses are based on the Household, Income and Labour Dynamics in Australia (HILDA) survey, a panel survey of Australian adults. The main source of data for this research is Wave 11 of HILDA, which was collected in 2011.
The main focus of the report is the analysis of how characteristics of mothers vary according to different measures of employment participation, relationship status and age of youngest child. Characteristics examined include mothers' birth and work history, labour force characteristics, socio-demographic characteristics (e.g., education, number and age of children, and health status), self-perceptions (of personal autonomy), social supports and values. This descriptive approach provides some perspective on the barriers that may be faced by non-employed mothers in particular.
The report is structured as follows. Following a discussion of some key recent Australian literature on maternal employment in section 2, the HILDA data are then described in section 3. The results are then presented in section 4, with the first analyses beginning with a discussion of trends in employment participation for lone and couple mothers. How the characteristics of lone and couple mothers vary with different levels of recent employment experience is then considered. Then the focus is on non-employed mothers, to analyse how their characteristics vary by relationship status and age of youngest child. A final set of analyses then compares characteristics of non-employed mothers who did and did not transition into employment in the subsequent wave of the survey. Section 5 provides a summary of the results and conclusions drawn from them.
1 Derived from Australian Bureau of Statistics (ABS; 2011), Table 8.1: Families with children, employment status of parents by family type by age of youngest child.
2. Background and literature
An interest in maternal employment has been heightened over recent decades for a number of reasons. One is that the ageing of the population has meant attention has focused on mothers, among others, as a potential labour supply for the Australian economy. Australian mothers are a key target group since their employment rate, at 62% in 2009-10,2 indicates there is potential for more to be engaged in paid work. Another key factor that drives interest in maternal employment is concern about the wellbeing of adults and children living in jobless households, particularly lone-mother households (Baxter, Gray, Hand, & Hayes, 2013).
In this report, selected characteristics of mothers are compared according to their different levels of engagement in paid work. These characteristics have not been used to predict who is or is not employed, though literature on determinants of maternal employment has guided the choice of variables examined. Key variables examined are relationship status and age of youngest child. Other variables analysed include mothers' education, prior work experience, age, carer status, health status and ethnicity; and the family variables of housing tenure and partner's employment and income. The focus throughout this report is on how the distribution of these variables differs for those with differing levels of engagement in employment.
This section presents a brief review of the literature relating to maternal employment, drawing in particular on Australian research. The review highlights the key factors that explain variation in mothers' participation in employment. For more extensive reviews, and also for discussion and analyses of trends in maternal employment in Australia, refer to Austen and Seymour (2006), Baxter, (2005; 2012), Birch (2003), Evans and Kelley (2008), Gray, Qu, de Vaus, and Millward (2002) and Parr (2012).
Ages and numbers of children
Mothers are often not in paid work because they have very young children to care for, and indeed, for many mothers of the youngest children, they are able to remain out of employment through the provision of parental leave.3 However, the employment rate increases as children grow and women become more likely to combine their caring responsibilities with paid work. The ages and numbers of children are examined in this report, and in examining mothers' reasons for not looking for work, we will see mothers' responses indicate they place considerable value on the caring role. Previous research on maternal employment has clearly shown how participation varies both with the age of the youngest child and with the number of children. For example, using HILDA, Parr (2012) showed maternal employment rates increased with the age of the youngest child, and were lowest when there were three or more children in the family. Such findings are consistent with other analyses of HILDA (Baxter & Renda, 2011), the International Social Science Survey Australia (Evans & Kelley, 2008), the Negotiating the Life Course Survey (Baxter, 2012), the Australian population Census (Baxter, 2005; Gray et al., 2002) and the Longitudinal Study of Australian Children (Gray & Baxter, 2011).
Increased participation by mothers as children grow older is likely to reflect a number of things. One is that mothers may feel it is neither appropriate nor desirable to give up the care of a baby to someone else, but as children become more independent and social, then non-parental care may be seen to offer opportunities for children to develop, as well as offering potential for parents to work. Mothers may seek to work for a range of reasons, including financial ones, to maintain skills or a career, to socialise and to be able to contribute in some way outside the home (Baxter, 2008). Financial aspects may also matter in relation to the cost of child care and other costs of working, relative to the income that comes in and possibly the income support that is withdrawn. These costs may be particularly important in explaining lower rates of employment among mothers with larger families.4
Lone and couple mothers
While the proportion of lone mothers participating in paid work in Australia has increased over recent years, this proportion remains below that of couple mothers (Baxter & Renda, 2011; Gray, Qu, Renda, & de Vaus 2006). This is true in several other OECD countries, such as the United Kingdom (UK), the United States (US) and New Zealand (see Baxter & Renda, 2011). A key focus of this research is therefore on exploring differences between lone and couple mothers.
Many explanations have been given for the lower employment rates of lone, compared to couple, mothers, including differences in their educational attainment, wages and abilities to combine work with caring for children, and their differential access to informal child care networks (Eardley, 2001; Gray et al., 2006; Harding et al., 2005; Hynes & Clarkberg, 2005; McHugh & Millar, 1996; Walters, 2002). Further barriers to lone mothers' labour market participation may be their relatively high rates of physical and mental health problems (Butterworth, 2003). The role of government support is also important, especially as lone mothers are more likely to be in receipt of income support payments and are thus more likely to face financial disincentives to work due to the interaction of the income support system with wages (OECD, 2007; Millar & Evans, 2003). Baxter and Renda (2011) found that the lower employment rate of lone mothers was partly related to differences in their characteristics, but also, when transitions into and out of employment were examined, related to lone mothers being more likely than couple mothers to leave employment in a given month.
Other socio-demographic factors
Higher educational attainment is associated with a greater likelihood of being employed (e.g., Austen & Seymour, 2006; Baxter, 2012; Gray et al., 2002; Parr, 2012). This is likely to reflect that education is associated with higher earnings potential, and therefore women with more education have more to lose by not working; that is, the opportunity cost of not working affects the employment decision. Higher education can also reflect a greater commitment to a career and may be associated with being able to attain more interesting and fulfilling work (Brewster & Rindfuss, 2000), and less conservative attitudes about mothers and employment (Evans, 1988; van Egmond, Baxter, Buchler, & Western, 2010). On the demand side, employers may prefer more highly educated people over others (Miller, 1993; O'Donnell, 1984).
Another measure of human capital is prior work experience. Past employment experience is strongly related to the likelihood of being employed at a point in time (Gray & Chapman, 2001; Ross, 1984). For mothers, being employed in pregnancy is an important predictor of timing of return to work after childbirth (Baxter, 2009). Also, employment experience is related more generally to transitions into and out of employment: those who have spent more time in employment are more likely to remain employed if already employed, or to enter employment if not employed (Baxter & Renda, 2011; Buddelmeyer, Wooden, & Ghantous, 2006; Haynes, Western, Yu, & Spellak, 2008; Knights, Harris, & Loundes, 2000; Stromback, Dockery, & Ying, 1998).
Other personal characteristics of mothers are associated with the likelihood of them being employed. One factor is country of birth, with migrant women, particularly those from non-English speaking countries, less likely to be employed than Australian-born women (Parr, 2012; Shamsuddin, 1998; VandenHeuvel & Wooden, 1996. Refer also to Birch, 2003, for a discussion of issues concerning analyses of ethnicity and labour supply). Another factor is health status, with mothers with poorer health being less likely to be employed (Renda, 2007). Baxter and Renda (2011) showed, for example, that non-employed mothers were much less likely to enter employment in a given month if their health was self-rated as fair, poor or very poor, as opposed to good or very good. Mothers with poorer health, if employed, were also somewhat more likely to leave employment in a given month. Being a carer to someone (other than the typical care of young children) is also associated with lower levels of engagement in paid work (Edwards, Higgins, Gray, Zmijewski, & Kingston, 2008).
In couple families, mothers' employment status is likely to be associated with that of her partner. In particular, wives (or partners) of unemployed men typically have relatively low rates of labour force attachment (Bradbury, 1995; Evans & Kelley, 2008; Jordan, 1993; King, Bradbury, & McHugh, 1995; Micklewright & Giannelli, 1991). Reasons for this include those of assortative (or associative) mating5 and the effect of location of residence (for example, where the family lives in a low employment area, the probability of employment would be lower for the husband and the wife). Also, gender norms may suggest that it is not acceptable to have a household with a "female breadwinner" model (Saunders, 1995).6 In families with employed fathers, the father's wage is generally negatively associated with the employment of the mother (Evans & Kelley, 2008; Gray et al., 2003), but these effects are not always large and, in fact, elsewhere it has been observed that the relationship is not straightforward (see Lehrer & Nerlove, 1986, for a review of the effect of husband income). When the husband's income is sufficient to meet financial obligations, the wife has more choice in whether to remain at home or to work, but when the husband's income is very low, there is likely to be a greater need to supplement his income with income from another source. However, as discussed, the effects of assortative mating may also mean a high-earning husband is likely to have a high earning-wife, and so these relationships may not be observed.
Another family-level factor is that of housing, with mothers' employment patterns likely to vary according to tenure and also the value of mortgage repayments (see Birch, 2003,Dawkins, Gregg, & Scutella, 2002; Scutella, 2000). The location of residence can be an important determinant of labour force participation, since the labour markets in different areas may not be uniform in the availability of options for employment (for mothers or for others).
Self-perceptions, social supports and values
Other variables explored in this report relate to mothers' self-perceptions (of personal autonomy), social supports and values. These more subjective variables are more often considered in qualitative studies and in discussions about the roles of preferences in explaining patterns of maternal employment (e.g., Hand, 2007; Losoncz & Bortolotto, 2009). They have been included here in an attempt to discover whether there are qualitative differences in mothers who have differing levels of engagement in paid work.
Labour force characteristics
The final set of data examined in this report relates to specific items about labour force participation; for example, information about looking for work, wanting to work, and reasons for not looking for work. This information is particularly informative, as it provides insights into the possible barriers to entering employment for mothers who say they want to work. Prior research comparing the labour force status of lone and couple mothers has shown that among not-employed mothers, there are some differences in labour force characteristics. In particular, lone mothers are more likely to be unemployed than are couple mothers, with couple mothers being more likely than lone mothers to be out of the labour force (Gray et al., 2006).
2 See footnote no. 1.
3 Mothers on leave from employment are classified as being not employed unless they have worked in the last four weeks or have been on paid leave in the last four weeks.
4 Associations between family size and maternal employment are more complex than this, as larger family size may reflect mothers valuing the parental role more than the worker role, and therefore choosing to have a larger family.
5 "Assortative mating" is the term given to explain that people are likely to form relationships with those with whom they have characteristics in common.
6 Another line of argument is that women can take up employment in times when their husband is out of work. This is known as the "added worker" hypothesis. This hypothesis may explain why in some families there are cases of wives working while their husband does not work; but given the low rates of employment among wives with not-working husbands, it is not a common phenomenon.
3. HILDA data
HILDA is a nationally representative annual panel survey that commenced with Wave 1 in 2001 (Watson & Wooden, 2002). The sampling unit for the survey is households, with information being gathered on each member of the sampled households, and interviews conducted with household members aged over 15 years. For Wave 1, 11,693 households were sampled from 488 areas across Australia. Members of 7,682 households completed interviews, resulting in 13,969 completed individual interviews and a response rate of 66%. While the number of participants from the original sample has declined over the waves due to attrition, at each wave new members to households are added in. Further, in Wave 11, the sample was topped up with an additional 2,153 households and 5,477 individuals. The purpose of this top-up sample was to address the fact that recent arrivals to Australia were no longer well represented in the HILDA sample (Watson, 2012). The top-up sample came from the general population, and so boosted sample sizes for Australia-born as well as immigrant respondents.
At each wave, to Wave 10, the sample has included approximately 2,000 mothers of children aged under 15 years, with somewhat more in Wave 11, due to the top-up of the sample.7
The data from Wave 1 (2001) to Wave 11 (2011) were combined to compare maternal employment rates from each of the waves of the study. Use of HILDA in this way (treated as repeated cross-sectional analyses) is not the preferred approach to analyse trends, as changes in the composition in the sample across waves are not taken into account (except through the application of sample weights). This may be an important factor particularly with Wave 11, with the addition of the top-up sample. Watson (2012) explored whether this made a difference to estimates produced using HILDA, and found that the inclusion of the top-up sample brought most of the estimates compared closer to those produced from Australian Bureau of Statistics (ABS) surveys. It is important, though, to be mindful that estimates of the subsample of HILDA comprising mothers with children aged under 15 years may be affected by the changing composition of the sample through wave-to-wave attrition and the top-up of the sample.
This research focuses on mothers with children aged under 15 years, who are referred to simply as "mothers" throughout the report. Information about relationships between household members is used to classify these women as being lone or couple mothers at the time of each interview, with lone mothers being those who do not have a co-resident partner at the time of the interview. That is not to say these mothers have always been lone or couple mothers, and in particular, many of the lone mothers will have previously been partnered. At Wave 11, there were 502 lone mothers and 2,067 couple mothers with children aged under 15 years.
Employment status here is derived using standard labour force definitions, such that a mother is counted as being employed if she undertakes at least one hour of paid work in the week before the survey (see ABS, 2007). Mothers are also counted as being employed if they are on leave from a job, but have been away for fewer than 4 weeks, or have been away for longer than this but in the last 4 weeks have received pay at some stage (i.e., they are on paid leave).
Mothers on longer term unpaid leave are counted as being either unemployed or not in the labour force (NILF), depending on their answers to questions about job search and their availability to start work. Unemployed mothers are those who are actively seeking work and available to start work. Mothers are classified as being not in the labour force if: (a) they do not want to work; (b) they want to work, but are not seeking work, regardless of whether they are available to start work; and (c) they are seeking work but are not available to start work. Responses to these labour force questions are examined in this report to explore differences in levels of attachment to the labour force and potential barriers to employment.
In addition to mothers' employment status at the survey date, this paper also makes use of data collected in an "employment calendar" for each wave of HILDA. For these data, respondents are asked about their work and study activities for the period starting from 1 July of the previous year, up to the survey date.8 In relation to work, respondents are asked to indicate how many jobs they have had over this period and to identify the dates within which they worked in each of those jobs. Derived information, based on these data, describes participation in employment in the financial year prior to the survey date.9 This includes information on what percentage of that year was spent in employment.
Mothers were assigned to one of three categories according to the percentage of time they spent working: (a) employed for little/none of the year (0-9% of the year); (b) employed for part of the year (10-89%); or (c) employed for most/all of the year (90-100%). Mothers employed for part of the year include those with intermittent or casual employment, but also includes those who left or started employment part way through the year. This latter group with part-year employment was quite small and could not be disaggregated further (see results in Table 1).
The analyses presented here begin with an overview of trends, with data sourced from Waves 1 to 11 of HILDA, using the Wave 11 HILDA release. Most other analyses use Wave 11 (2011) data.
In the final section, which explores employment transitions, characteristics of mothers were taken from the Wave 10 (2010) survey and analysed according to their employment status one year later, as identified in Wave 11. For this section, some data from earlier waves were used instead, when items of interest had not been collected in Wave 10. For those items, the most recent year in which they had been collected was used. Some were from 2008 (e.g., work-family attitudes), others from 2007 (e.g., measures of sense of personal autonomy).
The choice of characteristics to be examined in these analyses was guided by the literature on the determinants of maternal employment. This led to the inclusion of variables such as age of youngest child, education level and health status. Additional characteristics were examined to explore relationships between more subjective measures of wellbeing and maternal employment. Associations between work-family attitudes and maternal employment were also explored, given the possible role of preferences in explaining mothers' participation in employment.
Wave-specific cross-sectional sample weights were used to adjust for non-response in the calculations of means and percentages. Statistical tests of differences in means (t-tests) and distributions (chi-square tests) were applied to unweighted data. Statistically significant differences (at p < .05) have been indicated throughout the report.
7 In Wave 11, there were 1,936 mothers from the prior sample and 633 from the top-up sample.
8 Each survey wave begins in August and almost all surveys are completed before the end of December.
9 Financial year data do not necessarily capture very recent work history for those who were interviewed some months into the new financial year. It is possible to derive other calendar data pertaining to the twelve months prior to the interview, but for this report, due to the complexity involved in undertaking these derivations, attention is restricted to the previous financial year (for which derived measures are provided with the dataset).
4. Results
Overall trends
Figure 1 shows the employment rates of lone and couple mothers, derived from each wave of HILDA, from 2001 to 2011. These analyses are cross-sectional, in that mothers are defined as being lone or couple mothers at each survey, based on their relationship status and the presence of children at that time. As discussed in the preceding section, these analyses present some context to maternal employment in Australia, but the changing composition of the HILDA sample across waves may have some effect on the changes in maternal employment rates. Nevertheless, these trends are generally consistent with those observed from the ABS labour force data (see Figure A1, and Baxter & Renda, 2011) and Australian Census data (see Baxter, 2013).
Figure 1: Employment rates of lone and couple mothers, 2001-11
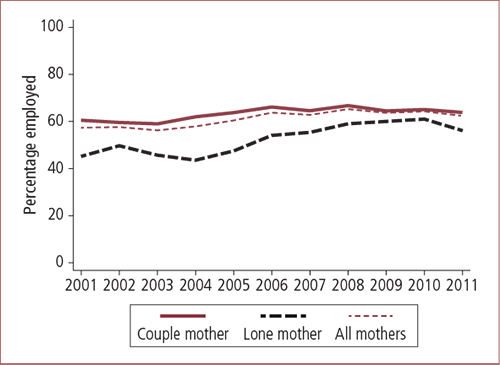
Note: The actual percentages are given in Appendix Table A1. The 2011 sample includes a top-up sample to HILDA.
Source: HILDA, Waves 1-11 (Wave 11 release)
Across 2001 to 2011, mothers' employment rates varied between 56% and 65%, with the lowest rate in 2003 and the highest in 2008. The employment rate in 2011 was 62%. As Figure 1 shows, there was a marked increase in the employment rate of lone mothers between 2004 (44%) and 2010 (61%). There were more gradual changes over the 2001-11 time period for couple mothers, with the percentage employed lowest in 2001 to 2003 at 59-60%, but then fluctuating between 64% and 67% from 2005 to 2011. The increased employment rate of lone mothers has meant that the gap in employment rates between lone and couple mothers has narrowed in the last few years, though it increased somewhat in 2011.
Within each of the lone-mother and couple-mother family forms, the employment rates vary considerably by age of youngest child (Figure 2).10 Differences between lone and couple mothers' employment rates are particularly apparent for those with a child aged 0-2 years: in most years, the employment rates of lone mothers in this group were around half that of couple mothers, with the size of this gap varying little from 2001 to 2008. There appears to have been some narrowing of the gap in more recent years.
Figure 2: Employment rates of lone and couple mothers, by age of youngest child, 2001-11
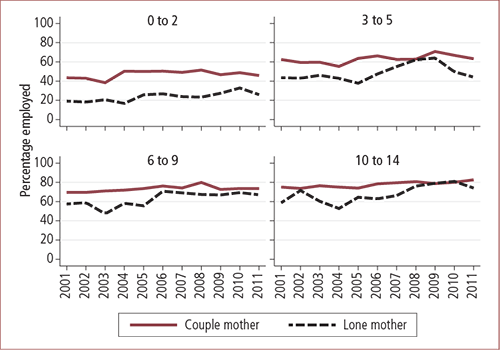
Note: The actual percentages are given in Appendix Table A2. The 2011 sample includes a top-up sample to HILDA.
Source: HILDA Waves 1-11 (Wave 11 release)
For lone mothers with a youngest child of 3-5 years old, the employment rates increased sharply from 38% in 2005 to 64% in 2009. The employment rates for this group then declined somewhat to 50% in 2010 and 44% in 2011. Further analyses would be required to see if this trend is an artefact of a compositional change in the sample of mothers with a youngest child aged 3-5 years.11
Among lone mothers whose youngest child was 6-9 years, employment rates increased from 47% in 2003 to 71% in 2006, then staying at just under this since this time. Employment rates of couple mothers of 6-9 year olds increased from 70% in 2002 to 80% in 2008, followed by a fall back to 73-74% for 2009, 2010 and 2011.
For lone mothers of 10-14 year olds, employment rates have fluctuated considerably, but gradually increased from 2004 to 2010. Couple mothers' employment rates for this age group increased from around 75% to around 80% over this time.
The narrowing of the gap in lone and couple mothers' employment rates in recent years is thus more apparent for mothers of older children. Some of these changing employment patterns may be due to welfare reform, which has meant that mothers can no longer remain on income support until children are aged 16 years without being required to look for work. It is, however, beyond the scope of this paper to explore these trends in relation to such changes in policy.
Recent employment history
As described previously, in the calendar component of each HILDA survey, respondents provide details of their labour force participation over the previous financial year, and this was used to derive a measure of how much of that year each respondent was in employment (here referred to as "recent employment history"). This measure is useful in that it provides some indication of the persistence of employment or non-employment, and so provides a different perspective to analysing the usual labour force measures alone.
Table 1 shows that at the survey date in 2011, 63% of couple mothers had been employed for most/all (90-100%) of the previous financial year (2010-11), as had 53% of lone mothers. A higher proportion of lone mothers than couple mothers had been employed for little/none (0-9%) of that financial year (35% compared to 25% of couple mothers), while another 11-12% of lone and couple mothers had been employed for part (10-89%) of that year.
| Recent employment history (2010-11) | Lone mothers | Couple mothers | ||||
|---|---|---|---|---|---|---|
| Employed 2011 (%) | Non-employed 2011 (%) | Total (%) | Employed 2011 (%) | Non-employed 2011 (%) | Total (%) | |
| Little/none (0-9%) of year | 4.0 | 81.3 | 35.3 | 2.0 | 74.3 | 25.1 |
| Part (10-89%) of year | 10.7 | 12.4 | 11.4 | 7.9 | 20.6 | 12.0 |
| Most/all (90-100%) of year | 85.3 | 6.3 | 53.3 | 90.1 | 5.1 | 62.9 |
| Totals | 100.0 | 100.0 | 100.0 | 100.0 | 100.0 | 100.0 |
| Distribution | 59.5 | 40.5 | 100.0 | 68.0 | 32.0 | 100.0 |
| Sample size | 225 | 154 | 379 | 1,027 | 530 | 1,557 |
Note: Respondents with missing calendar data are excluded.
The vast majority of lone and couple mothers who were employed at the survey date in 2011 (85% and 90% respectively) had been employed for most/all of the previous financial year (2010-11). Likewise, most non-employed lone and couple mothers were employed for little/none of the previous year (81% and 74% respectively), though a larger percentage of non-employed mothers with partners than without partners had been employed for part of the year (21% versus 12% respectively).
Overall, couple mothers were more likely than lone mothers to spend most/all of the previous year employed and lone mothers were more likely than couple mothers to spend most/all of that year not employed. Nevertheless, roughly half of the lone mothers had been employed for most/all of that year.
Characteristics of lone and couple mothers according to recent employment history
This section explores the characteristics of mothers according to their recent work experience. The overall aim is to explore the extent to which associations between recent employment history and particular maternal characteristics are apparent, especially from the perspective of explaining which groups may have relatively low levels of labour market engagement. Throughout, lone and couple mothers are differentiated, with a view to helping to understand the relatively low levels of employment of lone mothers.
Childbirth and education/employment history
As shown in Table 2, the characteristics examined in this section cover childbirth history (e.g., mothers' age at first birth) and education/employment history. The childbirth history data are relevant as they establish when mothers may have first left the labour market to care for children, and provide some indication of the time that may have been spent developing human capital - by way of education or employment - prior to childbearing. In particular, these historical data may indicate whether low levels of recent employment attachment are embedded within a much longer history of low levels of work attachment.
| Lone mothers (% of previous year employed) | Couple mothers (% of previous year employed) | Lone vs couple mothers (c) | |||||||
|---|---|---|---|---|---|---|---|---|---|
| 0-9% | 10-89% | 90-100% | Total (%) (a) | 0-9% | 10-89% | 90-100% | Total (%) (b) | ||
| Age of mother at first birth (mean) | 22.7 | 25.2 | 25.8 | 24.6 * | 26.0 | 27.5 | 28.1 | 27.5 * | * |
| Age of oldest child (mean) | 11.8 | 11.6 | 12.8 | 12.3 | 10.6 | 8.3 | 11.2 | 10.7 * | * |
| Time since first left full-time education (mean years spent) | |||||||||
| Since left full-time education | 18.2 | 20.7 | 21.5 | 20.3 * | 19.2 | 17.6 | 21.6 | 20.6 * | - |
| In paid work | 7.1 | 13.1 | 16.4 | 13.2 * | 8.8 | 12.3 | 17.8 | 15.0 * | * |
| Looking for work | 1.5 | 1.0 | 0.9 | 1.1 * | 0.9 | 0.6 | 0.4 | 0.5 * | * |
| Neither working nor looking for work | 9.4 | 6.3 | 4.8 | 6.4 * | 9.7 | 4.8 | 3.6 | 5.2 * | * |
| Years employed since full-time education (mean %) | 36.2 | 64.2 | 72.9 | 60.7 * | 45.2 | 69.7 | 82.2 | 72.0 * | * |
| Recent employment history (2010-11) (mean percentage of year spent) | |||||||||
| Employed | 0.2 | 51.3 | 99.8 | 59.1 * | 0.2 | 49.1 | 99.9 | 68.7 * | * |
| Unemployed | 20.7 | 22.3 | 0.2 | 10.0 * | 6.6 | 9.2 | 0.1 | 2.8 * | * |
| Not in the labour force | 79.1 | 26.4 | 0.0 | 31.0 * | 93.2 | 41.7 | 0.0 | 28.4 * | - |
| Employed in year before first birth (%) | 46.9 | 75.5 | 81.3 | 68.5 * | 52.0 | 86.7 | 91.9 | 81.2 * | * |
| Sample size | 136 | 46 | 197 | 379 | 405 | 207 | 945 | 1,557 | |
Note: Sample sizes vary somewhat due to non-response on particular items. T-tests were used to compare means and chi-square tests to compare distributions. * p < .05. Statistical tests compare data across the work history classifications within the lone mother (a) and couple mother (b) groups; and then compare all lone mothers to all couple mothers (c). Respondents with missing calendar data are excluded.
On average, those who were lone mothers in 2011 gave birth to their first child at a younger age (25 years) than those who had partners (28 years). For both lone and couple mothers, on average, those who spent more time in employment in the previous year (2010-11) commenced childbearing at an older age.
At the time of the Wave 11 survey, it had been around 20-21 years on average since the mothers had left full-time education, with no significant difference between lone and couple mothers. However, during this period, couple mothers had spent more time in paid work than had lone mothers (15 years compared to 13 years, or 72% and 61% of these years respectively). Mothers generally did not report spending many years looking for work, though the average was higher for lone than couple mothers (1.1 years compared to 0.5 years). The average number of years spent neither looking for work nor working (that is, time not in the labour force) was also higher for lone mothers (6 years compared to 5 years).
Comparing these figures by amount of recent employment history, the greatest difference was in relation to the average number of years spent in paid work, which was considerably lower for those who had been employed for little/none or part of the previous financial year compared to those who had been employed for most/all of that year. Those who had been employed for little/none or part of that year had spent more time looking for work since leaving full-time education, and more time out of the labour force. However, it is worth pointing out that even those with little/no recent employment history had spent several years in employment (an average of 9 years for couple mothers and 7 years for lone mothers).
This table also shows the average percentage of the year spent employed, not in the labour force and unemployed, for the previous financial year. Of course (since the categories are based on these data), there is a direct relationship between these measures and the categories of recent employment history. We do see that those with part-year employment, whether lone or couple mothers, spent more time unemployed when compared to those with little/no employment in the previous financial year. This reflects that those with part-year employment have more of a connection to the labour market than those with little/no recent employment. This time spent unemployed (while actively seeking work) may, for example, have led to subsequent employment or have followed the termination of employment during the year.
As shown in Table 1, compared to couple mothers, on average, lone mothers spent less of the previous financial year employed. This is also presented in Table 2, with an overall average of 69% of the year spent in employment for couple mothers and 59% for lone mothers. Lone mothers spent more time unemployed (10% of the year for lone mothers and 3% for couple mothers, on average). Significant differences by relationship status were not apparent for time not in the labour force.
Overall, then, these data show some differences between lone and couple mothers, and between mothers according to their recent employment history, in terms of childbirth and longer term education/employment histories. Lone mothers, compared to couple mothers, had a weaker connection to the labour market, had more often commenced childbearing earlier, and had spent less time in employment since leaving full-time education, having a greater chance also of having spent time unemployed. The same could be said of those who had spent less time in the previous financial year in employment, compared to those with more time in employment. While such differences are apparent, it is also worth noting that, on average, even mothers with little/no recent employment experience had some years of employment experience, and the amount and percentage of time that they spent unemployed was quite low.
Another indicator of past employment for mothers is their employment status in the twelve months prior to the birth of their first child. Mothers were asked about their employment in the year before the birth of each resident child and Table 2 shows the employment rate for the year before the birth of the older of these resident children.12 Among the lone mothers, of those with little/no recent employment, only 47% had been employed in the year prior to their first birth. For couple mothers, those with little/no recent employment also had low employment rates in the year prior to their first birth (52%), compared with other couple mothers. The non-employment of mothers is therefore likely, for some, to be entrenched within a longer period of low labour force attachment. Aggregated, differences between lone and couple mothers were quite large (for lone mothers, 69% had been employed in the year before their first birth, compared to 81% of couple mothers). This lower employment rate of those who were to become lone parents cannot yet be attributed to lone parenthood, and therefore is likely related to the socio-demographic characteristics of these women. Some of these characteristics are analysed further below.
Socio-demographic characteristics
As discussed in Section 2, analyses of maternal employment often focus on the socio-demographic characteristics of mothers to explain different levels of engagement in paid work. Of such variables, those capturing life stage may show how mothers alter their employment participation at particular times, especially when they have very young children. Other associations may reflect differences in mothers' abilities to find and remain in employment, or different aspirations for employment. This section provides information about the extent to which socio-demographic characteristics differ for lone and couple mothers, and for lone and couple mothers according to their recent employment history (Table 3).
| Lone mothers (% of previous year employed) | Couple mothers (% of previous year employed) | Lone vs couple mothers (c) | |||||||
|---|---|---|---|---|---|---|---|---|---|
| 0–9% | 10–89% | 90–100% | Total (%) (a) | 0–9% | 10–89% | 90–100% | Total (%) (b) | ||
| Educational attainment | * | * | * | ||||||
| Bachelors degree or higher | 4.3 | 7.5 | 24.6 | 15.5 | 18.8 | 31.6 | 39.5 | 33.3 | |
| Complete secondary/certificate/diploma | 26.4 | 46.6 | 43.4 | 37.8 | 29.0 | 42.0 | 29.8 | 31.0 | |
| Incomplete secondary only | 69.3 | 45.9 | 32.0 | 46.7 | 52.2 | 26.4 | 30.8 | 35.6 | |
| Age of youngest child | * | * | * | ||||||
| 0–2 years | 31.2 | 24.3 | 7.4 | 17.4 | 47.2 | 57.2 | 24.0 | 33.8 | |
| 3–5 years | 29.5 | 18.6 | 17.8 | 21.9 | 21.9 | 12.0 | 18.3 | 18.4 | |
| 6–9 years | 25.4 | 35.2 | 28.1 | 28.0 | 14.1 | 12.9 | 22.4 | 19.2 | |
| 10–15 years | 13.9 | 21.9 | 46.6 | 32.7 | 16.8 | 17.9 | 35.4 | 28.6 | |
| Provides care (d) | 15.2 | 6.0 | 8.4 | 10.5 | 14.4 | 6.5 | 5.7 | 8.0 * | * |
| Country of birth, language spoken at home and English language proficiency | * | * | |||||||
| Australia | 84.7 | 91.9 | 86.2 | 86.3 | 71.9 | 81.1 | 78.4 | 77.1 | |
| Overseas, English-speaking | 3.3 | 2.9 | 6.3 | 4.8 | 4.8 | 5.9 | 8.6 | 7.3 | |
| Overseas-born, non–English speaking, speaks English well or very well | 12.0 | 5.2 | 6.7 | 8.4 | 15.9 | 12.6 | 12.8 | 13.6 | |
| Overseas-born, non–English speaking, does not speak English well or at all | – | – | 0.8 | 0.4 | 7.4 | 0.3 | 0.1 | 2.0 | |
| Self-reported health status | * | * | * | ||||||
| Fair or poor | 25.0 | 29.4 | 13.8 | 19.4 | 20.5 | 6.3 | 7.4 | 10.5 | |
| Good or better | 75.0 | 70.6 | 86.2 | 80.6 | 79.5 | 93.7 | 92.6 | 89.5 | |
| Has long-term health condition | 36.1 | 18.7 | 14.9 | 22.8 * | 23.6 | 10.3 | 11.4 | 14.4 * | * |
| Partner is employed | n. a. | n. a. | n. a. | n. a. | 83.9 | 91.6 | 96.7 | 92.8 * | n. a. |
| Housing tenure | * | * | * | ||||||
| Owner or purchaser | 22.0 | 35.6 | 49.0 | 38.0 | 57.6 | 68.7 | 81.7 | 74.1 | |
| Private renter | 52.2 | 57.0 | 47.2 | 50.1 | 33.8 | 27.8 | 15.5 | 21.6 | |
| Public renter | 23.2 | 2.6 | 3.4 | 10.3 | 4.6 | 0.5 | 1.1 | 1.9 | |
| Other | 2.6 | 4.8 | 0.4 | 1.7 | 4.1 | 3.0 | 1.7 | 2.4 | |
| Location * | |||||||||
| Major city | 46.9 | 46.6 | 58.1 | 52.8 | 66.0 | 61.9 | 64.0 | 64.2 | |
| Inner regional | 33.6 | 37.3 | 26.7 | 30.3 | 22.5 | 25.7 | 25.4 | 24.7 | |
| Other | 19.5 | 16.1 | 15.2 | 16.8 | 11.5 | 12.4 | 10.6 | 11.1 | |
| Mean | Mean | ||||||||
| Age (years) | 34.5 | 36.7 | 38.6 | 36.9 * | 36.6 | 35.7 | 39.3 | 38.2 * | * |
| Number of children | 2.2 | 2.0 | 1.9 | 2.0 | 2.4 | 2.2 | 2.1 | 2.2 * | – |
| Partner income (financial year disposable $’000) | n. a. | n. a. | n. a. | n. a. | 62.7 | 67.2 | 66.3 | 65.5 * | n. a. |
| Sample size | 135 | 46 | 197 | 378 | 403 | 206 | 950 | 1,556 | |
Note: Sample sizes vary somewhat due to non-response on particular items. T-tests are used to compare means and chi-square tests to compare distributions. * p < .05. Statistical tests compare across the recent employment history classification within the lone mother (a) and couple mother (b) groups; and then compare all lone mothers to all couple mothers (c). (d) Provides care to someone due to their long-term health condition, being elderly, or having a disability. Respondents with missing calendar data are excluded.
Differences between lone and couple mothers exist in terms of:
- educational attainment - lone mothers had lower educational levels, on average;
- age of youngest child - lone mothers had older children, on average;
- having caring responsibilities - less likely for lone mothers;
- country of birth - in particular, lone mothers were more often Australian-born;
- health status - lone mothers having poorer self-reported health and more likely to have a long-term health condition;
- housing tenure - lone mothers were less likely to be home owners/purchasers;
- location - lone mothers were more likely to be living in inner regional areas of Australia, and less likely to be living in major cities; and
- age - lone mothers were younger, on average.
Comparing characteristics by the measure of recent employment history, a number of differences are apparent. Mothers with a greater amount of recent employment have higher levels of educational attainment and are, on average, older. Life stage, indicated by age of youngest child, is strongly associated with employment participation, with the presence of younger children most likely among those who spent less of the previous financial year in employment. Couple mothers who spent part of the previous year in employment included a relatively high proportion with a child aged under 3 years old, and this might reflect mothers having left employment on the birth of the child; or it might just reflect that mothers move in and out of work somewhat more when they have very young children.13 Mothers who spent more time out of employment tended to have a larger family size (only significant for couple mothers).
Around 10% of mothers had caring responsibilities (for another person with a long-term health condition, who is elderly or who has a disability). Significant differences in rates of being a carer were apparent among couple mothers in relation to their recent employment history. While not statistically significant, some differences were also apparent for lone mothers. For lone and couple mothers, a higher proportion of mothers had caring responsibilities among those with little/no employment in the previous financial year compared to those with higher rates of employment.
Among couple mothers, those who had spent less time in employment were disproportionately born outside Australia. Also, among couple mothers who had spent little/none of the year in employment, just over one in ten reported having poor English language proficiency. These country of birth and language differences were not apparent for lone mothers.
Self-reported health status was significantly related to recent employment history for both lone and couple mothers, with poorer health among those who had been out of employment for all or most of the previous year. Those who spent more time out of employment were also more likely to have a long-term health condition. These health differences were quite large, with, for example, 36% of lone mothers with little/no time in employment reporting a long-term health condition, compared to 15% among lone mothers who had spent most/all of the year in employment.
These data show significant differences in mothers' housing tenure by their level of involvement in employment. For couple mothers, 82% of those who had been employed for most/all of the year were living in a home that they owned or were purchasing. This compares to 58% for those with little/no recent employment, and 69% for those with part-year employment. Of these mothers with little/no or part-year recent employment, 28-34% were renting privately, with another fairly small percentage in public rental housing. The situation is quite different for lone mothers, who had a higher proportion in public rental housing, especially those with little/no employment in the previous financial year.
While lone mothers were somewhat less likely than couple mothers to live in major cities, differences in location by level of recent employment experience within each of the lone and couple mother groups are not statistically significant.
Couple mothers with higher levels of recent employment experience more often had employed partners, when compared to those with less employment experience. To explore whether mothers' employment participation may be related to their partners' incomes, Table 3 shows the mean of the partners' disposable annual incomes, by mothers' recent employment experience. Partner's mean income was higher for those partnered mothers with more recent employment experience. This is in line with the argument that when partners earn a higher income, mothers are likely to have a higher earning potential (because of assortative mating, which means couples are likely to be somewhat similar in their characteristics) and therefore may seek to minimise their time out of employment (see Section 2).
Overall, the most significant associations appear to be in relation to age of youngest child, mothers' health status and level of educational attainment. These characteristics differ across the varying levels of recent employment experience and also differ for lone versus couple mothers.
Self-perception, social supports and values
Mothers' perceptions of themselves, their feelings about their social supports and their abilities, and their attitudes about work and family may all be important factors in relation to their potential or actual engagement in the labour market. Here, this is examined by looking at mental health (using the "mental health" scale, as assessed in the Short Form (36) Health Survey [SF-36] in HILDA);14 perceptions of social support; beliefs in personal autonomy; and measures of attitudes to maternal employment.
In these analyses, associations between measures of wellbeing and values and recent employment experience cannot be interpreted as one causing the other. However, these associations may suggest the existence of certain barriers to be overcome by mothers in their engagement with the labour market.
First, these data show a measure of mothers' mental health and some items concerning perceptions of social supports (Table 4). Mothers who had spent less of the previous year in employment had, on average, poorer mental health. They also had more perceived difficulties with social supports, being more likely to say they had no one to lean on in times of trouble, and to say they often needed help from other people but were unable to get it (not statistically significant for lone mothers).
| Lone mothers (% of previous year employed) | Couple mothers (% of previous year employed) | Lone vs couple mothers (c) | |||||||
|---|---|---|---|---|---|---|---|---|---|
| 0-9% | 10-89% | 90-100% | Total (%) (a) | 0-9% | 10-89% | 90-100% | Total (%) (b) | ||
| Mental health (mean; 100 = better mental health) (d) | 67.5 | 66.2 | 68.6 | 67.9 | 72.8 | 74.1 | 75.2 | 74.5 * | * |
| Social support (% agreeing) (e) | |||||||||
| I have no one to lean on in times of trouble | 25.5 | 28.6 | 13.1 | 19.1 * | 10.0 | 8.7 | 5.9 | 7.3 * | * |
| I often need help from other people but can't get it | 29.2 | 22.0 | 21.0 | 24.0 | 16.8 | 12.2 | 7.4 | 10.3 * | * |
| Sample size | 102 | 35 | 162 | 299 | 342 | 183 | 834 | 1,359 | |
Note: Sample sizes vary somewhat due to non-response on particular items. T-tests are used to compare means and chi-square tests to compare distributions. * p < .05. Statistical tests compare across the recent employment history classification within the lone mother (a) and couple mother (b) groups; and then compare all lone mothers to all couple mothers (c). (d) Mental health assessed using SF-36 transformed (mean of 1 to 100, 100 = better mental health). (e) Percentage scoring between 5 and 7 on a scale of 1 (strongly disagree) to 7 (strongly agree). Respondents with missing calendar data are excluded.
With beliefs in personal autonomy, presented in Table 5, on most measures (and the aggregate mean score), couple mothers' beliefs in personal autonomy were more positive than lone mothers'. Differences across the groupings of recent employment were not all statistically significant for lone and couple mothers. For lone mothers, a significant difference was apparent for the negative statement "There is little I can do to change many of the important things in my life", which was more often agreed on by those who had been employed for little/none or part of the previous year. For couple mothers, there was a significant difference for the statement "I often feel helpless in dealing with the problems of life", which was more often agreed on by those who had been employed for little/none of the previous year. Also, differences were apparent for couple mothers for each of the positive statements: "I can do just about anything I really set my mind to do" and "What happens to me in the future mostly depends on me", which gained less agreement from mothers who had been employed for little/none of the previous year.
| Lone mothers (% of previous year employed) | Couple mothers (% of previous year employed) | Lone vs couple mothers (c) | |||||||
|---|---|---|---|---|---|---|---|---|---|
| 0-9% (%) | 10-89% (%) | 90-100% (%) | Total (%) (a) | 0-9% (%) | 10-89% (%) | 90-100% (%) | Total (%) (b) | ||
| Agreement with statement (d) | |||||||||
| I have little control over the things that happen to me | 20.2 | 19.0 | 14.9 | 17.2 | 15.6 | 9.7 | 10.4 | 11.6 | - |
| There is really no way I can solve some of the problems I have | 17.7 | 32.1 | 20.0 | 20.5 | 13.1 | 11.5 | 10.1 | 11.0 | * |
| There is little I can do to change many of the important things in my life | 23.0 | 23.7 | 15.7 | 19.1 * | 13.0 | 11.0 | 8.3 | 9.8 | * |
| I often feel helpless in dealing with the problems of life | 19.2 | 26.0 | 19.7 | 20.3 | 15.6 | 10.6 | 9.0 | 10.9 * | * |
| Sometimes I feel that I'm being pushed around in life | 20.6 | 28.7 | 17.7 | 20.0 | 17.2 | 14.4 | 13.3 | 14.4 | * |
| Disagreement with statement (e) | |||||||||
| What happens to me in the future mostly depends on me | 19.3 | 22.1 | 24.7 | 22.5 | 27.6 | 26.6 | 19.4 | 22.3 * | - |
| I can do just about anything I really set my mind to do | 24.2 | 21.2 | 25.2 | 24.4 | 25.8 | 19.5 | 18.2 | 20.2 * | * |
| Mean score | 2.79 | 2.89 | 2.72 | 2.76 | 2.66 | 2.47 | 2.39 | 2.47 * | * |
| Sample size | 103 | 34 | 162 | 299 | 343 | 182 | 835 | 1,360 | |
Note: Sample sizes vary somewhat due to non-response on particular items. T-tests are used to compare means and chi-square tests to compare distributions. * p < .05. Statistical tests compare across the recent employment history classification within the lone mother (a) and couple mother (b) groups; and then compare all lone mothers to all couple mothers (c). (d) Those who responded from 5 to 7 on a scale of 1 (strongly disagree) to 7 (strongly agree). (e) Percentage scoring between 1 and 4 on a scale of 1 (strongly disagree) to 7 (strongly agree). Respondents with missing calendar data are excluded.
Overall, the results indicate that couple mothers had significantly better mental health and more positive beliefs in personal autonomy than lone mothers. Lone mothers were more likely than couple mothers to report having difficulties with social supports. While these data do not allow us to say that lower levels of mental health, social supports or autonomy cause lower rates of participation in employment by lone mothers, they do suggest the presence of personal characteristics that could result in relatively low levels of confidence or motivation, which may be a factor in mothers' decision-making about entering employment.
Table 6 shows mothers' responses to various work-family values questions. These items have been explored as they particularly apply to perceptions of whether or not mothers should be employed.
| Agreement with statement (a) | Lone mothers (% of previous year employed) | Couple mothers (% of previous year employed) | Lone vs couple mothers (d) | ||||||
|---|---|---|---|---|---|---|---|---|---|
| 0-9% (%) | 10-89% (%) | 90-100% (%) | Total (%) (b) | 0-9% (%) | 10-89% (%) | 90-100% (%) | Total (%) (c) | ||
| It is better for everyone involved if the man earns the money and the woman takes care of the home and children | 30.6 | 23.4 | 13.8 | 20.6 * | 30.2 | 24.5 | 14.7 | 19.7 * | - |
| Many working mothers seem to care more about being successful at work than meeting the needs of their children | 28.7 | 21.2 | 11.4 | 18.5 * | 24.5 | 15.0 | 13.0 | 16.1 * | - |
| Mothers who don't really need the money shouldn't work | 26.4 | 13.5 | 15.8 | 19.2 | 30.5 | 26.7 | 16.8 | 21.4 * | - |
| Children do just as well if the mother earns the money and the father cares for the home and the children | 60.4 | 64.0 | 78.4 | 70.6 * | 62.6 | 78.7 | 74.9 | 72.4 * | - |
| A working mother can establish just as good a relationship with her children as a mother who does not work for pay | 51.0 | 59.7 | 73.6 | 64.3 * | 41.6 | 64.7 | 65.5 | 59.5 * | - |
| Sample size | 101 | 35 | 162 | 298 | 339 | 182 | 831 | 1,352 | |
Note: Sample sizes vary somewhat due to non-response on particular items. Chi-square tests are used to compare distributions. * p < .05. (a) Percentage scoring between 5 and 7 on a scale of 1 (strongly disagree) to 7 (strongly agree). Respondents with missing calendar data are excluded. Statistical tests compare across the recent employment history classification within the lone mothers (b) and couple mother (c) groups; and then compare all lone mothers to all couple mothers (d).
Overall, these data show relatively low levels of agreement with the statements: "It is better for everyone involved if the man earns the money and the woman takes care of the home and children"; "Many working mothers seem to care more about being successful at work than meeting the needs of their children"; and "Mothers who don't really need the money shouldn't work". Those who spent less of the previous year in employment more often agreed with these questions, compared with those who spent most/all of the year employed. (For lone mothers this was true also, though not statistically significant for the last of these questions.) Significant differences between lone and couple mothers were not apparent.
Compared to these items, mothers were more likely to agree with the statements: "Children do just as well if the mother earns the money and the father cares for the home and the children" and "A working mother can establish just as good a relationship with her children as a mother who does not work for pay". Not surprisingly, those who spent more time in employment were more likely to agree with this statement. This is consistent with previous analyses of these data, in which more egalitarian or progressive attitudes about working mothers are found among those who are employed (van Egmond et al., 2010).
For these attitudinal questions, it is especially problematic to draw causal links between such responses and employment patterns, in particular because attitudes (or reported attitudes) may have altered to reflect mothers' actual levels of participation in employment, such that attitudes tend to align with behaviours. Nevertheless, as with the measures of self-perceptions and mental health, the more traditional attitudes of those who have a lesser connection to the labour force suggest that such attitudes may be somewhat of a deterrent to these mothers' increasing their participation in employment.
Summary
In summary, these analyses have shown that spending more time out of employment in the previous financial year was associated with the following characteristics of mothers:
- starting childbearing at an earlier age, and being less likely to be employed in the year before having a first child;
- having a history of less attachment to the labour market; that is, spending fewer years in paid work since leaving full-time education, and more years either looking for work or out of the labour force;
- being younger, having more children, and having lower levels of educational attainment;
- for couple mothers only, having poor English language proficiency and providing care to someone;
- having poorer health or a long-term health condition;
- living in rental accommodation and, for lone mothers, living in public rental housing;
- having poorer mental health and more perceived difficulties with social supports;
- having varying beliefs about personal autonomy (though they did not all vary enough for differences to reach statistical significance - nevertheless, some associations suggested a lower sense of autonomy among those who spent more time out of employment); and
- having more "traditional" attitudes about maternal employment; that is, having views more aligned with a preference for mothers to remain out of employment.
The comparisons of lone and couple mothers throughout this section have shown that lone mothers are more likely to have many of the characteristics described above, which has implications for their overall lower rates of employment.
Not surprisingly, these data also show that mothers who spent all or most of the year out of employment had younger children, on average. This includes those on longer term unpaid leave from work, as well as those who have left employment. This is a reminder that some non-employed mothers are at a life stage in which they would prefer to prioritise providing full-time care of children. The non-employment of these mothers is perhaps different to that of mothers whose children are older, at which time the care needs of their children may be less constraining to their employment.
Characteristics of non-employed lone and couple mothers according to age of youngest child
The importance of age of youngest child in explaining variation in employment rates among mothers was apparent in Figure 2. The following analyses explore this by examining the characteristics of non-employed mothers by age of youngest child. Sample sizes do not allow examination by detailed age of the youngest child, so the sample has been classified into mothers with younger children (aged 0-5 years) and older children (aged 6-14 years). In these analyses, the question of whether mothers had been employed at all in the previous year is put aside to focus on those not employed at the time of the survey. The majority of these mothers will have been out of employment for all or most of the previous year (Table 1, and see also Table 7).
It is expected that mothers of the younger children will have a stronger preference to be at home, with caring for children being a primary reason for doing so, given the preference of many mothers to care for children while they are young. This is especially so given that the younger age group of children includes those aged less than one year old, and non-employed mothers of these children will include those who are on unpaid maternity or parental leave.
Caring for children may be less of a reason for not working once children reach school age. A question examined in this section, then, is whether non-employed mothers of older children are out of employment because, relative to those with younger children, they have a greater incidence of characteristics that deter or act as a barrier to them finding and sustaining employment.
Childbirth and education/employment history
Among mothers not currently employed, those with older children first left full-time education more years ago than those with younger children, but this would be expected, given differences in the ages of their children (Table 7) and also of the mothers themselves (Table 10). In total, these mothers with older children had spent more years in paid work since leaving full-time education than those with younger children (only significant for couple mothers), but they had also spent more years neither working nor looking for work. For non-employed couple mothers with younger children, this corresponds to having spent a greater percentage of years in paid work since leaving full-time education, compared to those with older children. In aggregate, non-employed couple mothers had spent significantly more time in employment than non-employed lone mothers since leaving full-time education, with lone mothers having spent a greater amount of time either unemployed or neither working nor looking for work.
| Non-employed lone mothers (age of youngest child) | Non-employed couple mothers (age of youngest child) | Lone vs couple mothers (c) | |||||
|---|---|---|---|---|---|---|---|
| 0-5 years | 6-14 years | Total (a) | 0-5 years | 6-14 years | Total (b) | ||
| Age of mother at first birth (mean) | 24.0 | 22.8 | 23.5 | 27.0 | 26.9 | 26.8 | * |
| Age of oldest child (mean) | 6.8 | 16.7 | 11.6 * | 5.4 | 15.8 | 8.7 * | * |
| Time since first left full-time education (Mean years spent) | |||||||
| Since left full-time education | 14.1 | 21.1 | 18.0 * | 13.7 | 24.8 | 17.1 * | - |
| In paid work | 6.3 | 7.0 | 7.0 | 7.6 | 11.4 | 8.8 * | * |
| Looking for work | 0.9 | 1.4 | 1.2 | 0.6 | 1.0 | 0.7 | * |
| Neither working nor looking for work | 6.9 | 12.1 | 9.5 * | 5.2 | 12.7 | 7.6 * | * |
| Years employed since full-time education (mean %) | 43.9 | 41.9 | 42.8 | 54.5 | 45.3 | 51.6 * | * |
| Recent employment history (2010-11) (mean percentage of year spent) | |||||||
| Employed | 11.3 | 14.5 | 12.5 | 16.4 | 12.3 | 15.0 | - |
| Unemployed | 15.6 | 27.5 | 19.4 | 5.0 | 7.1 | 5.6 * | * |
| Not in the labour force | 73.0 | 58.0 | 68.1 | 78.6 | 80.7 | 79.4 | - |
| Employed in year before first birth (%) | 51.9 | 55.8 | 50.4 | 61.7 | 64.5 | 61.9 | * |
| Sample size | 122 | 67 | 189 | 545 | 154 | 699 | |
Note: Sample sizes vary somewhat due to non-response on particular items. T-tests were used to compare means and chi-square tests to compare distributions. * p < .05. Statistical tests compare data across the age groups within the lone mother (a) and couple mother (b) groups; and then compare all non-employed lone and couple mothers (c).
In the previous financial year, those with older children had spent a greater proportion of the previous year unemployed, compared to those with younger children (significant only for couple mothers). To be classified as unemployed, rather than not in the labour force, requires mothers to have undertaken some job search and be available to start work, and so this difference could suggest that more mothers with older children would prefer to be working, compared to those with younger children. The non-employment of those with older children may be less often driven by a preference to be at home, and more often driven by an inability to find suitable work. (For some mothers, job search might be undertaken as a condition of income support receipt and so job search may not always reflect a preference to be in paid work.)
Looking at the percentage employed in the year before the first birth, Table 7 shows that differences by age of youngest child were not statistically significant, but that there were lower pre-birth employment rates for non-employed lone mothers compared to couple mothers.
Labour force characteristics
Before turning to socio-demographic characteristics, it is relevant here to examine the labour force characteristics of the non-employed mothers in more detail (Table 8).
| Non-employed lone mothers (age of youngest child) | Non-employed couple mothers (age of youngest child) | Lone vs couple mothers (c) | |||||
|---|---|---|---|---|---|---|---|
| 0-5 years (%) | 6-14 years (%) | Total (%) (a) | 0-5 years (%) | 6-14 years (%) | Total (%) (b) | ||
| Labour force status | * | * | * | ||||
| Unemployed | 16.3 | 32.3 | 22.3 | 5.3 | 12.4 | 7.2 | |
| Looking for full-time work | 6.9 | 19.7 | 11.7 | 2.8 | 5.1 | 3.4 | |
| Looking for part-time work | 9.4 | 12.6 | 10.6 | 2.5 | 7.3 | 3.8 | |
| Not in the labour force | 83.7 | 67.7 | 77.7 | 94.7 | 87.6 | 92.8 | |
| Marginally attached | 34.1 | 16.8 | 27.6 | 25.0 | 30.4 | 26.5 | |
| Not marginally attached | 49.6 | 50.9 | 50.1 | 69.6 | 57.2 | 66.3 | |
| Sample size | 124 | 71 | 211 | 546 | 159 | 725 | |
| Whether wanted a job (not in the labour force) | * | ||||||
| Want a job | 60.6 | 57.2 | 59.4 | 34.4 | 44.2 | 37.0 | |
| Maybe want a job | 3.5 | 2.3 | 3.1 | 5.9 | 6.1 | 5.9 | |
| Don't want a job | 35.8 | 40.4 | 37.5 | 59.7 | 49.8 | 57.0 | |
| Sample size | 116 | 66 | 182 | 527 | 154 | 681 | |
Note: Sample sizes vary somewhat due to non-response on particular items. T-tests were used to compare means and chi-square tests to compare distributions. * p < .05. Statistical tests compare data across the age groups within the lone mother (a) and couple mother (b) groups; and then compare all non-employed lone and couple mothers (c).
Lone mothers, if not employed, were more likely than couple mothers to be unemployed (22% vs 7%), looking for full-time or part-time employment. Non-employed mothers of older children were more likely to be unemployed, especially among lone mothers, who were most often looking for full-time work. As discussed previously, these findings may be related to requirements to look for work to be eligible for income support receipt.
The majority of non-employed mothers were not in the labour force. Of these mothers, being marginally attached indicates a stronger connection to the labour market, as it reflects either a desire to be working, or some degree of looking for work or being available to start work (but not both, which would classify these mothers as unemployed). If not in the labour force, lone mothers were more often marginally attached than couple mothers. The mothers showing the least attachment to the labour force are couple mothers with children aged under 6 years old.
One of the main conditions for being marginally attached is wanting a job. This is asked with the question "Even though you are not looking for work now, would you like a job? (Assume that suitable child care arrangements could be found.)". Of those not in the labour force, 57% of couple mothers and 38% of lone mother did not want a job. That is, non-employed lone mothers more often said that they wanted, or maybe wanted, a job. Differences by age of youngest child, for lone mothers and for couple mothers, were not statistically significant.
Mothers who were not in the labour force and wanted to work were asked why they were not looking for work. Note that for these analyses, the sample sizes were too small to allow examination of responses by age of youngest child and relationship status (Table 9). Not surprisingly, the most common reason for both lone and couple mothers was because they preferred to look after their children. Compared to mothers with younger children, this was less commonly reported as a reason for not looking for work by those with older children, though it was still reported by close to half of them. Other child-related reasons included waiting until the youngest child started preschool or primary school (only mothers of younger children), difficulties in finding child care, other child care reasons, and pregnancy/maternity leave (more for those with younger children).
Mothers' own illness, injury or disability was given as a reason for not looking for work by more lone than couple mothers (of those who wanted to work but were not looking for work: 8% for lone mothers and 6% for couple mothers), and by more of the mothers with older children (3% for mothers with younger children and 15% for mothers with older children).
The ill health or disability of a family member was a factor in some mothers not looking for work (of those who wanted to work but were not looking for work: 13% for lone mothers and 7% for couple mothers; 3% for mothers with younger children and 21% for mothers with older children).
Some mothers also said they were studying, while others cited job-related reasons for not looking for work, such as there being no jobs available, no jobs available with suitable hours or no jobs available in their line of work.
| Selected reasons not looking for work (a) | Youngest child 0-5 years (%) | Youngest child 6-14 years (%) | 0-5 vs 6-14 years (c) | Lone mothers (%) | Couple mothers (%) | Lone vs couple mothers (d) |
|---|---|---|---|---|---|---|
| Prefers to look after children | 69.1 | 46.5 | * | 56.4 | 64.8 | - |
| Pregnancy/maternity leave | 13.4 | 6.0 | * | 14.4 | 10.5 | - |
| Waiting until youngest child starts preschool/primary school | 15.5 | 0.0 | * | 8.0 | 12.2 | - |
| Difficulties in finding child care | 6.6 | 4.0 | - | 7.1 | 5.5 | - |
| Other child care reason | 6.4 | 9.2 | - | 3.4 | 8.2 | - |
| Own illness, injury or disability | 3.2 | 14.6 | * | 8.3 | 5.7 | * |
| Ill health of someone other than self/other family relation | 3.4 | 20.5 | * | 13.0 | 6.8 | * |
| Studying/returning to studies | 10.6 | 18.2 | - | 19.6 | 10.7 | - |
| Job-related (b) | 7.4 | 14.1 | - | 10.3 | 8.9 | - |
| Other reasons | 2.2 | 6.0 | * | 1.1 | 3.7 | - |
| Sample size | 621 | 188 | 70 | 245 |
Note: These data are shown for mothers who are NILF, who have not looked for work in last 4 weeks, who want or maybe want a job. Sample sizes vary somewhat due to non-response on particular items. T-tests are used to compare means and chi-square tests to compare distributions. * p < .05. (a) Respondents could give multiple reasons for not looking for work. (b) Job-related reasons include: no jobs in their line of work, no jobs with suitable hours or no jobs at all. Statistical tests compare across age groups (c); and compare lone and couple mothers (d).
A range of factors, then, seem to be important in explaining the non-employment of mothers. The health of themselves and someone else for whom they provide care is one issue, but there are other job-related and other issues also.
There is, however, also a sense that for many non-employed mothers, even if they wanted to work, a preference for caring for their children is an important concern. Of course, many also reported that they did not want to work. While reasons for not wanting to work are not collected in HILDA, it is likely that caring for children contributes to this, just as it contributes to the reasons for not looking for work among those who prefer to be working.
Socio-demographic characteristics
Looking then at socio-demographic characteristics, the focus of this section is to examine whether the different characteristics of non-employed mothers with younger rather than older children suggest there are differences in their potential barriers to entering employment.
Table 10 shows that compared to non-employed mothers with younger children, those with older children were, on average, older themselves, and for couple mothers had somewhat larger family size and different country of birth/language groupings (couples only). In particular, the country of birth/language differences reveal that among non-employed couple mothers with older children, there was a greater proportion of mothers with poor English language proficiency, compared to those with younger children.
| Lone mothers (age of youngest child) | Couple mothers (age of youngest child) | Lone vs couple mothers (c) | |||||
|---|---|---|---|---|---|---|---|
| 0-5 years (%) | 6-14 years (%) | Total (%) (a) | 0-5 years (%) | 6-14 years (%) | Total (%) (b) | ||
| Educational attainment | * | ||||||
| Bachelor degree or higher | 7.6 | 4.3 | 5.8 | 33.6 | 24.6 | 30.5 | |
| Complete secondary/certificate/diploma | 32.5 | 46.8 | 37.6 | 27.7 | 29.7 | 28.4 | |
| Incomplete secondary only | 59.9 | 48.8 | 56.6 | 38.7 | 45.7 | 41.1 | |
| Provides care (d) | 4.2 | 26.4 | 11.6* | 6.3 | 21.0 | 10.5 * | - |
| Country of birth, language spoken at home and English-language proficiency | * | * | |||||
| Australia | 70.0 | 71.5 | 71.9 | 57.3 | 56.1 | 57.7 | |
| Overseas, English-speaking | 2.3 | 12.6 | 5.7 | 12.6 | 9.2 | 11.5 | |
| Overseas-born, non-English speaking, speaks English well or very well | 21.8 | 11.9 | 17.6 | 23.2 | 19.5 | 21.8 | |
| Overseas-born, non-English speaking, does not speak English well or at all | 5.9 | 4.0 | 4.8 | 7.0 | 15.2 | 9.0 | |
| Self-reported health status | * | * | * | ||||
| Fair or poor | 15.3 | 38.6 | 24.9 | 11.1 | 18.7 | 14.5 | |
| Good or better | 84.7 | 61.4 | 75.1 | 88.9 | 81.3 | 85.5 | |
| Has long-term health condition | 22.2 | 51.5 | 34.5 * | 14.1 | 26.2 | 18.2 * | * |
| Partner is employed (e) | n. a. | n. a. | n. a. | 89.6 | 83.0 | 87.2 | n. a. |
| Housing tenure | * | * | |||||
| Owner or purchaser | 24.2 | 32.6 | 26.9 | 46.1 | 66.3 | 51.6 | |
| Private renter | 62.3 | 49.4 | 56.3 | 49.0 | 23.5 | 41.6 | |
| Public renter | 12.3 | 14.1 | 14.7 | 2.5 | 5.6 | 3.4 | |
| Other | 1.3 | 4.0 | 2.1 | 2.4 | 4.6 | 3.4 | |
| Location | * | ||||||
| Major city | 52.7 | 60.7 | 55.5 | 71.8 | 72.3 | 71.0 | |
| Inner regional | 29.8 | 31.1 | 31.2 | 17.5 | 18.6 | 18.0 | |
| Other | 17.6 | 8.1 | 13.3 | 10.6 | 9.2 | 11.0 | |
| Mean | Mean | ||||||
| Age (years) | 30.8 | 39.4 | 35.1 * | 32.4 | 42.7 | 35.5 * | - |
| Number of children | 2.1 | 2.2 | 2.2 | 2.2 | 2.4 | 2.2 * | - |
| Partner income (financial year disposable $'000) (f) | n. a. | n. a. | n. a. | 63.1 | 65.8 | 63.8 | n. a. |
| Sample size | 124 | 71 | 195 | 546 | 158 | 704 | |
Note: Sample sizes vary somewhat due to non-response on particular items. T-tests are used to compare means and chi-square tests to compare distributions. * p < .05. Statistical tests compare across the age groups within the lone mother (a) and couple mother (b) groups; and then compare all non-employed lone and couple mothers (c). (d) Provides care to someone due to their long-term health condition, being elderly, or having a disability. (e) Calculated only for partnered mothers. (f) For means of partner income, four cases were excluded that had partner annual incomes in the top-coded category (with average income greater than $400,000).
Lack of educational qualifications are likely to contribute to some mothers' non-employment, with 57% of non-employed lone mothers and 41% of non-employed couple mothers having not completed secondary education. Among non-employed couple mothers, lower levels of education were more apparent for those with older rather than younger children. However, one-third of non-employed couple mothers with younger children had bachelor degrees or higher.
Caring for others (for reasons of their ill health, disability or old age) appears to be a feature of non-employment for mothers with older children. Of non-employed lone and couple mothers with older children, 26% and 21% respectively reported that they were providing care for someone. Smaller proportions of those with younger children had caring responsibilities (4% for lone mothers and 6% for couple mothers ).
Compared to non-employed mothers with younger children, those with older children had poorer self-reported health and a greater likelihood of having a long-term health condition. Overall, non-employed lone mothers were more likely than couple mothers to have poorer self-reported health and a long-term health condition.
As was evident overall, these data on non-employed mothers also showed higher rates of home ownership (including purchasing) among couple mothers compared to lone mothers. Of note is the 15% of non-employed lone mothers who were living in public rental housing (compared to 3% for non-employed couple mothers). As home ownership is likely to increase with age, it is not surprising that a higher proportion of non-employed couple mothers with older children owned or were purchasing their home, when compared with those with younger children. For lone mothers, differences by age of youngest child were not statistically significant.
Although both non-employed lone and couple mothers most commonly lived in major cities, lone mothers more often lived in inner regional areas than did non-employed couple mothers, with somewhat lower proportions living in major cities. No differences were apparent by age of youngest child.
For couple mothers, significant differences were not apparent by age of youngest child in relation to the proportion who had employed partners, and the mean of partners' incomes.
Overall, among non-employed mothers, lone mothers tended to have lower levels of education than couple mothers, and were more likely to be born in Australia. Statistically significant differences were not apparent for age or number of children.
Self-perceptions, social supports and values
Table 11 shows that non-employed lone and couple mothers with older children had significantly lower levels of mental health when compared with those with younger children, though this was not statistically significant for couple mothers. Overall, non-employed lone mothers' mental health was poorer than that of couple mothers.
| Lone mothers (age of youngest child) | Couple mothers (age of youngest child) | Lone vs couple mothers (c) | |||||
|---|---|---|---|---|---|---|---|
| 0-5 years | 6-14 years | Total (a) | 0-5 years | 6-14 years | Total (b) | ||
| Mental health (mean; 100 = better mental health) (d) | 69.3 | 58.3 | 66.1* | 74.2 | 72.4 | 73.5 | * |
| Social support (% agreeing) (e) | |||||||
| I have no one to lean on in times of trouble | 32.1 | 27.2 | 29.8 | 7.7 | 14.6 | 9.5 | * |
| I often need help from other people but can't get it | 27.3 | 30.5 | 28.1 | 15.5 | 13.7 | 15.2 | * |
| Sample size | 90 | 51 | 141 | 460 | 141 | 601 | |
Note: Sample sizes vary somewhat due to non-response on particular items. T-tests are used to compare means and chi-square tests to compare distributions. * p < .05. Statistical tests compare across the age groups within the lone mother (a) and couple mother (b) groups; and then compare all non-employed lone and couple mothers (c). (d) Mental health assessed using SF-36 transformed (mean of 1 to 100, 100 = better mental health). (e) Percentage scoring between 5 and 7 on scale of 1 (strongly disagree) to 7 (strongly agree).
Access to social supports appeared to be an issue for non-employed mothers of younger as well as older children, as measured by having someone to lean on in times of trouble, or having an unmet demand for help. However, non-employed lone mothers were much more likely than couple mothers to indicate they had some difficulties with social supports.
As discussed previously, exploring differences in mental health and, in Table 12, personal autonomy in this way does not identify whether problems in these areas lead to lower levels of employment, or are a consequence of lack of employment or some other factor. However, it is possible that non-employment by mothers is related to their lack of confidence in being able to successfully enter and maintain employment.
| Lone mothers (age of youngest child) | Couple mothers (age of youngest child) | Lone vs couple mothers (c) | |||||
|---|---|---|---|---|---|---|---|
| 0-5 years (%) | 6-14 years (%) | Total (%) (a) | 0-5 years (%) | 6-14 years (%) | Total (%) (b) | ||
| Agreement with statement (d) | |||||||
| I have little control over the things that happen to me | 27.2 | 24.8 | 24.4 | 13.4 | 14.7 | 14.6 | * |
| There is really no way I can solve some of the problems I have | 21.1 | 24.1 | 21.7 | 12.8 | 14.7 | 14.1 | - |
| There is little I can do to change many of the important things in my life | 24.6 | 28.4 | 24.0 | 9.6 | 19.2 | 13.0 * | * |
| I often feel helpless in dealing with the problems of life | 20.3 | 34.2 | 24.0 * | 12.1 | 18.0 | 14.3 * | - |
| Sometimes I feel that I'm being pushed around in life | 25.4 | 37.8 | 28.1 | 11.2 | 20.6 | 14.3 * | * |
| Disagreement with statement (e) | |||||||
| What happens to me in the future mostly depends on me | 20.8 | 21.5 | 20.5 | 26.5 | 27.1 | 27.0 | - |
| I can do just about anything I really set my mind to do | 23.1 | 32.2 | 26.1 | 21.4 | 29.2 | 23.2 * | - |
| Mean score | 2.81 | 3.27 | 2.93 * | 2.50 | 2.70 | 2.58 * | * |
| Sample size | 90 | 51 | 141 | 459 | 140 | 599 | |
Note: Sample sizes vary somewhat due to non-response on particular items. T-tests are used to compare means and chi-square tests to compare distributions. * p < .05. Statistical tests compare across the age groups within the lone mother (a) and couple mother (b) groups; and then compare all non-employed lone and couple mothers (c). (d) Percentage scoring between 5 and 7 on a scale of 1 (strongly disagree) to 7 (strongly agree). (e) Percentage scoring between 1 and 4 on a scale of 1 (strongly disagree) to 7 (strongly agree).
Earlier analyses showed low levels of sense of personal autonomy were particularly apparent for lone mothers, and this is also evident from three of the specific measures examined here when non-employed lone and couple mothers are compared, as well as being evident in the overall mean score. Also, on some items (only one for lone mothers but four for couple mothers), non-employed mothers with older children had a lower sense of personal autonomy than those with younger children. Using the aggregate score, this was apparent for both lone and couple mothers.
Table 13 examines the work-family values of non-employed mothers. As argued before, it is difficult to determine whether such values contribute to employment outcomes, or are influenced by such outcomes (i.e., any causal direction is unclear, and could also be bi-directional). When the responses of non-employed lone and couple mothers are compared by age of youngest child, the differences are only statistically significant for two of the items. For the statement "Many working mothers seem to care more about being successful at work than meeting the needs of their children", those least likely to agree were couple mothers with younger children. Differences are apparent by age of youngest child for couple mothers, and are also apparent comparing lone and couple mothers, reflecting this lower level agreement by couple mothers with young children. For the statement "Mothers who don't really need the money shouldn't work", there was relatively low agreement by lone mothers with young children, and relatively high agreement by lone mothers with older children.
| Agreement with statement (d) | Lone mothers (age of youngest child) | Couple mothers (age of youngest child) | Lone vs couple mothers (c) | ||||
|---|---|---|---|---|---|---|---|
| 0-5 years (%) | 6-14 years (%) | Total (%) (a) | 0-5 years (%) | 6-14 years (%) | Total (%) (b) | ||
| It is better for everyone involved if the man earns the money and the woman takes care of the home and children | 34.0 | 34.8 | 35.4 | 31.4 | 37.1 | 32.8 | - |
| Many working mothers seem to care more about being successful at work than meeting the needs of their children | 32.9 | 34.5 | 34.6 | 16.6 | 29.5 | 20.7 * | * |
| Mothers who don't really need the money shouldn't work | 19.5 | 44.0 | 26.0 * | 28.5 | 27.2 | 28.7 | - |
| Children do just as well if the mother earns the money and the father cares for the home and the children | 60.8 | 71.7 | 63.9 | 65.0 | 62.4 | 64.7 | - |
| A working mother can establish just as good a relationship with her children as a mother who does not work for pay | 55.2 | 54.2 | 49.4 | 52.0 | 41.1 | 49.4 | - |
| Sample size | 88 | 49 | 137 | 455 | 140 | 595 | |
Note: Sample sizes vary somewhat due to non-response on particular items. Chi-square tests are used to compare distributions. * p < .05. Statistical tests compare across the age groups within the lone mother (a) and couple mother (b) groups; and then compare all non-employed lone and couple mothers (c). (d) Percentage scoring between 5 and 7 on scale of 1 (strongly disagree) to 7 (strongly agree).
Summary
In summary, these analyses of the characteristics of non-employed mothers have shown that non-employed mothers with older, compared to younger, children:
- had spent more years in paid work as well as more years not in the labour force since leaving full-time education, and among couple mothers, a greater percentage of time since leaving full-time education in paid work;
- did not have significantly different rates of pre-first birth employment - there is no evidence from these data, then, that mothers with older children who are not employed include a greater proportion of women who have had low levels of attachment to the labour market since before they became mothers;
- had spent a greater proportion of the previous year unemployed (significant only for couple mothers), consistent with expectations that non-employment for mothers of older children is more often due to an inability to find work than it is for mothers of younger children; also, at the time of the survey, mothers of older children were more likely to be unemployed;
- if wanting to work but not looking for work, were somewhat less likely than those with younger children to give child-related reasons for not looking for work;
- were older, and for couple mothers, had a somewhat larger family size;
- had, among couple mothers, a greater proportion with poor English-language proficiency;
- had poorer self-reported health, a greater likelihood of having a long-term health condition and significantly lower levels of mental health;
- had no significant difference in limitations in social supports, though this was an issue for more non-employed lone mothers compared to couples mothers, regardless of age of youngest child;
- had lower levels of autonomy as measured on the aggregate scale and on a few specific measures; and
- largely did not differ significantly in regard to their attitudes to maternal employment, though some differences were apparent on two of the items.
It is important to note that the majority of non-employed mothers were not in the labour force, with many expressing no desire to be in employment. In particular, the mothers showing the least attachment to the labour force were couple mothers with children aged under 5 years old. Even if mothers expressed a preference for being employed, the most common reason for not looking for work was because of a preference for looking after their children.
Employment transitions of non-employed lone and couple mothers according to age of youngest child
This section makes use of two waves of HILDA to analyse factors associated with transitions into employment in 2011 for mothers who were not employed in the previous wave, in 2010. Respondents had to be in scope in Wave 10 (2010) to be included, so this section excludes mothers introduced into HILDA as part of the Wave 11 (2011) top-up sample. Some items explored in this report were not collected in Wave 10, and so to examine employment transitions in relation to these variables, the most recent year in which they were collected was used, and related to employment outcomes one year later. The items relating to sense of personal autonomy were taken from 2007, and the work-family attitudinal data were taken from 2008.
In these analyses, the characteristics of those who transition into employment are compared to those who do not transition into employment. This may provide more direct evidence of whether certain factors impede movement into employment. The sample sizes are not sufficient for separate analyses of lone and couple mothers and so all non-employed mothers are examined together.
Birth and education/employment history
Table 14 shows that those who moved into employment between 2010 and 2011 had, since leaving full-time education, spent more time in employment and less time out of the labour force. A strong association with recent employment history was apparent, such that those who moved into employment by 2011 had, in the financial year prior to the 2010 survey spent a greater proportion of time in employment and less time out of the labour force. Also, those who moved into employment were more likely to have been employed in the year before their first birth. Clearly, prior employment history is relevant when considering later employment outcomes.
| Characteristics of mothers not employed in 2010 | Not employed in 2011 | Employed in 2011 | Total not employed 2010 | Employed vs not employed in 2011 (a) |
|---|---|---|---|---|
| Mean age of mother at first birth (years) | 25.1 | 27.7 | 25.6 | * |
| Mean age of oldest child (years) | 9.7 | 6.7 | 9.1 | * |
| Time since first left full-time education (mean years spent) | ||||
| Since left full-time education | 17.8 | 16.7 | 17.6 | - |
| In paid work | 8.2 | 11.5 | 8.9 | * |
| Looking for work | 1.1 | 0.7 | 1.0 | - |
| Neither working nor looking for work | 8.4 | 4.7 | 7.6 | * |
| Years employed since full-time education (mean %) | 45.7 | 67.9 | 50.6 | * |
| Recent employment history (2009-10) (mean percentage of year spent) | ||||
| Employed | 9.7 | 38.1 | 15.6 | * |
| Unemployed | 6.3 | 4.7 | 6.0 | - |
| Not in the labour force | 84.0 | 57.1 | 78.4 | * |
| Employed in year before first birth (%) (as captured in 2011) | 48.2 | 83.5 | 55.7 | * |
| Sample size | 486 | 136 | 622 | |
Note: Only includes respondents in Wave 10 and Wave 11 who were lone or couple mothers in Wave 10. Sample sizes vary somewhat due to non-response on particular items. T-tests are used to compare means and chi-square tests to compare distributions. * p < .05. (a) Statistical tests compare mothers according to whether they were employed in 2011.
Labour force characteristics
Table 15 looks at mothers' labour force attachment, and related items, in 2010, by 2011 employment status. Mothers who were employed in 2011 were more likely than those who were not employed in 2011 to have been unemployed in 2010 (that is, actively seeking work, and available to start work). This active job search may have led to later employment or may indicate an interest or willingness to enter employment that is otherwise not apparent among mothers who are not in the labour force.
| Characteristics of mothers not employed in 2010 | Not employed in 2011 (%) | Employed in 2011 (%) | Total not employed 2010 (%) | Employed vs not employed in 2011 (a) |
|---|---|---|---|---|
| Labour force status | * | |||
| Unemployed | 6.6 | 14.0 | 8.2 | |
| Looking for full-time work | 2.4 | 6.1 | 3.1 | |
| Looking for part-time work | 4.3 | 7.9 | 5.0 | |
| Not in the labour force | 93.4 | 86.0 | 91.8 | |
| Marginally attached | 26.7 | 25.2 | 26.4 | |
| Not marginally attached | 66.7 | 60.8 | 65.5 | |
| Sample size | 488 | 137 | 625 | |
| Not in the labour force | - | |||
| Want a job | 34.0 | 44.8 | 36.2 | |
| Maybe | 7.7 | 4.3 | 7.0 | |
| Don't want a job | 58.3 | 50.9 | 56.8 | |
| Sample size | 473 | 131 | 604 | |
| Selected reasons for not looking for work (NILF who had not looked for work in last 4 weeks, who want or maybe want a job) | ||||
| Prefers to look after children | 62.2 | 47.5 | 59.2 | - |
| Pregnancy/maternity leave | 6.0 | 27.4 | 10.0 | * |
| Waiting until youngest child starts preschool/primary school | 8.5 | 6.0 | 8.0 | - |
| Difficulties in finding child care | 7.9 | 0.0 | 6.3 | - |
| Other child care reason | 12.3 | 9.8 | 11.8 | - |
| Own illness, injury or disability | 13.0 | 0.0 | 10.3 | * |
| Ill health of someone other than self/other family relation | 7.0 | 3.8 | 6.3 | - |
| Studying/returning to studies | 4.5 | 9.7 | 5.6 | * |
| Job-related reasons (b) | 6.9 | 3.9 | 6.3 | - |
| Other reasons | 3.5 | 4.3 | 3.7 | - |
| Sample size | 177 | 43 | 220 | |
Note: Only includes respondents in Wave 10 and Wave 11 who were lone or couple mothers in Wave 10. Sample sizes vary somewhat due to non-response on particular items, and because some items apply only to sub-populations. T-tests are used to compare means and chi-square tests to compare distributions. * p < .05. (a) Statistical tests compare mothers according to whether employed in 2011. (b) Job-related reasons include no jobs in their line of work, no jobs with suitable hours, or no jobs at all.
Table 15 shows that among mothers who were not in the labour force in 2010, the percentage wanting to work was higher among those employed in 2011, though this difference was not statistically significant. Among those who were not in the labour force but wanted to work, those who entered employment included a relatively high proportion (compared to those who did not enter employment) who were not looking for work because they were pregnant or on maternity leave in 2010. This no doubt captures mothers who returned to work after a period of leave.
Those who were not employed in 2011 were more likely than those who were employed to say, in 2010, that they were not looking for work because of their own illness, injury or disability. So this appears to impede movement into work for some mothers.
Those who were not looking for work because they were studying in 2010 made up a greater proportion of mothers who had entered employment by 2011, compared to those who had not entered employment in 2011. Studying, for some mothers, may have been part of an intentional break from employment, to advance their skills, qualifications or career opportunities.
No other reason for not looking for work varied significantly according to 2010 employment status.
Socio-demographic characteristics
A comparison of the socio-demographic characteristics of mothers who moved into employment with those who did not (Table 16) shows that mothers who were not employed in 2010 but had entered employment by 2011 were more highly educated compared to those who had not entered employment; were less likely to have poor self-reported health and a long-term health condition; and were less likely to be a carer to someone due to their ill health, disability or old age.
| Characteristics of mothers not employed in 2010 | Not employed in 2011 (%) | Employed in 2011 (%) | Total not employed 2010 (%) | Employed vs not employed in 2011 (a) |
|---|---|---|---|---|
| Single mother | 20.5 | 13.7 | 19.1 | - |
| Educational attainment | * | |||
| Bachelors degree or higher | 18.1 | 28.8 | 20.3 | |
| Complete secondary/certificate/diploma | 25.4 | 32.2 | 26.8 | |
| Incomplete secondary only | 56.5 | 39.0 | 52.9 | |
| Age of youngest child | - | |||
| 0-2 years | 48.4 | 57.9 | 50.4 | |
| 3-5 years | 20.8 | 20.1 | 20.6 | |
| 6-9 years | 17.1 | 12.4 | 16.1 | |
| 10-15 years | 13.8 | 9.7 | 12.9 | |
| Provides care (b) | 16.7 | 5.4 | 14.4 | * |
| Country of birth, language spoken at home and English language proficiency | - | |||
| Australia | 70.0 | 76.9 | 71.4 | |
| Overseas, English-speaking | 4.6 | 5.6 | 4.8 | |
| Overseas-born, non-English speaking, speaks English well or very well | 16.7 | 17.5 | 16.9 | |
| Overseas-born, non-English speaking, does not speak English well or at all | 8.7 | 0.0 | 6.9 | |
| Self-reported health status | * | |||
| Fair or poor | 18.1 | 5.1 | 15.4 | |
| Good or better | 81.9 | 94.9 | 84.6 | |
| Has long-term health condition | 22.4 | 11.0 | 20.0 | * |
| Partner is employed (c) | 82.6 | 94.9 | 85.4 | * |
| Housing tenure | * | |||
| Owns or purchasing | 48.3 | 66.8 | 52.2 | |
| Private renter | 38.9 | 28.4 | 36.7 | |
| Public renter | 7.4 | 0.8 | 6.0 | |
| Other | 5.4 | 4.0 | 5.1 | |
| Location | - | |||
| Major city | 65.9 | 58.0 | 64.2 | |
| Inner regional | 22.1 | 27.3 | 23.1 | |
| Other | 12.0 | 14.7 | 12.6 | |
| Mean | Mean | |||
| Age (years) | 34.7 | 34.2 | 34.6 | - |
| Number of children | 2.3 | 2.0 | 2.3 | - |
| Partner income, couple mothers only (financial year disposable $'000) (d) | 61.0 | 63.0 | 62.3 | - |
| Sample size | 466 | 117 | 583 | |
Note: Only includes respondents in Wave 10 and Wave 11 who were lone or couple mothers in Wave 10. Sample sizes vary somewhat due to non-response on particular items. T-tests are used to compare means and chi-square tests to compare distributions. * p < .05. (a) Statistical tests compare mothers who are not employed in 2010 according to whether employed in 2011. (b) Provides care to someone due to their long-term health condition, being elderly, or having a disability. (c) Calculated only for partnered mothers. (d) For means of partner income, twelve cases were excluded that had partner annual incomes in the top-coded category (with average income greater than $380,000).
Among those with partners who transitioned into employment, there was a somewhat higher percentage who had employed partners. Also, those who transitioned into employment more often lived in homes that they owned or were purchasing, compared to mothers who did not transition into employment.
Despite these differences, it is worth noting that having characteristics such as low education or poor health did not guarantee a negative employment outcome. For example, 39% of those who had entered employment by 2011, while lower than the 57% who had not entered employment, had only an incomplete secondary education.
Self-perceptions, social supports and values
It was expected that mothers with better mental health and with better social supports might be in a stronger position with regard to employment outcomes, and this is somewhat substantiated with these data. Table 17 shows that those who had moved into employment by 2011, among mothers not employed in 2010, had better mental health in 2010. Also, those who had moved into employment were somewhat less likely than those who had not to have said in 2010 that they often needed help but could not get it.
| Characteristics of mothers not employed in 2010 | Not employed in 2011 | Employed in 2011 | Total not employed 2010 | Employed vs not employed in 2011 (a) |
|---|---|---|---|---|
| Mental health (mean; 100 = better mental health) (b) | 70.1 | 73.2 | 70.7 | * |
| Social support (% agreeing) (c) | - | |||
| I often need help from other people but can't get it | 12.0 | 7.2 | 11.0 | * |
| I have no one to lean on in times of trouble | 19.0 | 11.1 | 17.4 | - |
| Sample size | 423 | 119 | 542 |
Note: Only includes respondents in Wave 10 and Wave 11 who were lone or couple mothers in Wave 10. Sample sizes vary somewhat due to non-response on particular items. T-tests are used to compare means and chi-square tests to compare distributions. * p < .05. (a) Statistical tests compare mothers according to whether employed in 2011. (b) Mental health assessed using SF-36 transformed (mean of 1 to 100, 100 = better mental health). (c) Percentage scoring between 5 and 7 on scale 1 (strongly disagree) to 7 (strongly agree).
To examine associations with mothers' sense of personal autonomy, measures taken at 2007 were compared to employment outcomes in 2008, as 2007 was the last time prior to 2011 that these questions were asked (Table 18). These measures of autonomy did not differ significantly by later employment outcomes.
| Not employed in 2008 (%) | Employed in 2008 (%) | Total not employed 2007 (%) | Employed vs not employed in 2008 (a) | |
|---|---|---|---|---|
| Agreement with statement by mothers not employed in 2007 (b) | ||||
| I have little control over the things that happen to me | 17.3 | 17.3 | 17.3 | - |
| There is really no way I can solve some of the problems I have | 16.2 | 13.2 | 15.3 | - |
| There is little I can do to change many of the important things in my life | 17.3 | 11.6 | 15.8 | - |
| I often feel helpless in dealing with the problems of life | 18.4 | 16.5 | 17.9 | - |
| Sometimes I feel that I'm being pushed around in life | 20.8 | 17.3 | 19.8 | - |
| Disagreement with statement by mothers not employed in 2007 (b) | ||||
| What happens to me in the future mostly depends on me | 26.0 | 21.3 | 24.7 | - |
| I can do just about anything I really set my mind to do | 27.9 | 23.5 | 26.7 | - |
| Mean score | 2.71 | 2.58 | 2.67 | |
| Sample size | 363 | 150 | 513 | |
Note: Only includes respondents in Wave 7 and Wave 8 who were lone or couple mothers in Wave 7. Sample sizes vary somewhat due to non-response on particular items. Chi-square tests are used to compare distributions. * p < .05. (a) Statistical tests compare mothers according to whether employed in 2008. (b) Percentage scoring between 5 and 7 on scale 1 (strongly disagree) to 7 (strongly agree). (c) Percentage scoring between 1 and 4 on scale 1 (strongly disagree) to 7 (strongly agree).
To examine work-family attitudes and employment transitions, Wave 8 (2008) data were related to 2009 employment outcomes (Table 19). As with the personal autonomy data above, this earlier data collection was used, as 2008 was the last time prior to 2011 that these questions were asked. As discussed earlier, it is problematic to consider how employment status and work-family values measured at the same point in time are related, because values may be influenced by employment status as well as contribute to them. However, the values expressed in 2008, among non-employed mothers, are explored in relation to their employment status one year later, to determine whether mothers with more positive attitudes to employment were more likely to later transition into employment. This appears to be the case.
| Agreement with statements by mothers not employed in 2008 (b) | Not employed in 2009 (%) | Employed in 2009 (%) | Total not employed 2008 (%) | Employed vs not employed in 2009 (a) |
|---|---|---|---|---|
| It is better for everyone involved if the man earns the money and the woman takes care of the home and children | 34.5 | 6.3 | 28.3 | * |
| Children do just as well if the mother earns the money and the father cares for the home and the children | 58.7 | 77.7 | 62.9 | * |
| Mothers who don't really need the money shouldn't work | 36.6 | 13.6 | 31.6 | * |
| A working mother can establish just as good a relationship with her children as a mother who does not work for pay | 39.0 | 61.6 | 43.9 | * |
| Many working mothers seem to care more about being successful at work than meeting the needs of their children | 27.7 | 11.2 | 24.2 | * |
| Sample size | 353 | 104 | 457 |
Note: Only includes respondents in Wave 8 and Wave 9 who were lone or couple mothers in Wave 8. Sample sizes vary somewhat due to non-response on particular items. T-tests are used to compare means and chi-square tests to compare distributions. * p < .05. (a) Statistical tests compare mothers according to whether employed in 2009. (b) Percentage scoring between 5 and 7 on scale 1 (strongly disagree) to 7 (strongly agree).
Mothers who had transitioned into employment by 2009 were more likely than those who had not to agree, in 2008, that children do just as well if the mother earns the money and the father cares for the home and the children, and that a working mother can establish just as good a relationship with her children as a mother who does not work for pay. Also, they were less likely to agree that it is better if the man earns the money and the woman takes care of the home and children; that mothers who don't really need the money should not work; and that many working mothers seem to care more about being successful at work than meeting the needs of their children. These results suggest that more "traditional" attitudes toward maternal employment may contribute to some mothers' lack of movement into employment. Such attitudes, of course, may have been shaped by past employment patterns, such as having had a relatively long period of time out of the labour market while undertaking this caring role. Expressed values may also be based upon mothers' future plans or expectations regarding employment, and therefore cannot be thought of as some absolute measure of lifetime attitudes toward maternal employment.
Summary
In summary, the analyses of the characteristics of previously non-employed mothers and transitions into employment show that:
- those who moved into employment had a stronger history of employment participation, over the longer term, as well as in the more recent past;
- those who moved into employment had been more attached to the labour market in the previous year, through undertaking direct job searches and/or being available to work;
- those who moved into employment also had higher levels of educational attainment and, if partnered, were more likely to have an employed partner;
- caring responsibilities appeared to deter movement into employment;
- non-employed mothers with poorer health, mental health and perceived access to social supports were less likely than other mothers to transition into employment;
- measures of personal autonomy at one time were unrelated (at conventional levels of significance) to employment outcomes one year later; and
- more "traditional" attitudes toward maternal employment at one time were found among those who had not entered employment on year later - such attitudes may contribute to a lack of movement into employment.
While most variables examined were statistically significant, they did not fully explain the variation found among mothers who had moved into employment and mothers had not. Among mothers who entered employment were those with lower levels of education, with caring responsibilities, with poor health and with more traditional work-family attitudes, for example. Similarly, there was variation among those who remained out of employment.
It is of course true that entering employment can occur for a range of reasons; for example, some mothers may be more driven by preferences to work, while others might be more driven by the financial need to work. Either of these drivers could affect women with low or high levels of wellbeing, and with low or high levels of attachment to employment. Also, mothers with any of the characteristics examined may have a personal motivation to prioritise care of children at this life stage, especially when children are still young.
Footnotes
10 Figures 1 and 2 provide overviews of trends, but standard errors and confidence intervals have not been presented, and some apparent differences between lone and couple mothers, and over time, may not be statistically significant, especially given the relatively small sample sizes for lone mothers (see Appendix Table A2 on page 36). The changing composition of the sample over time, and the addition of the top-up sample in Wave 11 (2011) may also contribute to the variation in employment rates.
11 Baxter (2013) showed that, using Census data, maternal employment rates increased between 2006 and 2011 for this age group.
12 Some mothers may, of course, have had older non-resident children, for whom employment details before the birth were not captured, and so this is not a true measure of employment before the first birth, but it is referred to as this for simplicity.
13 Examining the calendar data by detailed age of youngest child suggests that both of these reasons are likely. Mothers with a child under 1 year old more often reported part-year employment than mothers with children of other ages; but mothers with children of ages 1-4 years also had a relatively high amount of part-year employment when compared to mothers of older children.
14 This scale captures the respondents' reports on how often, in the last 4 weeks, they (a) felt nervous; (b) felt so down in the dumps nothing could cheer them up; (c) felt calm and peaceful; (d) felt down; or (e) had been a happy person.
5. Discussion and conclusion
These analyses have highlighted several issues about maternal employment in Australia, contributing to the breadth of current literature on this topic.
One issue that stands out is the central role for mothers of caring. Many mothers, especially those with younger children, expressed a preference to not be working. Even if they indicated that they would like to be working, they often reported that they were not looking for work because of their caring responsibilities. Of course, the non-employed mothers with very young children included those who were on leave from their job. In analyses of transitions from non-employment to employment, these mothers (that is, those who reported they were not looking for work because they were on pregnancy/maternity leave) were well represented among those who moved into employment one year later.
Once children were school-aged, mothers appeared less constrained by their caring responsibilities or preferences to provide care for their children, though a large proportion of mothers who were not employed at this time still referred to caring responsibilities in their reasons for not looking for work.
For mothers, qualitative work has highlighted that decisions about the timing of return to work, and also the nature of that employment, are interwoven with mothers' views and preferences regarding the care of their children (Boyd, Thorpe, & Tayler, 2010; Hand, 2007). While survey data such as those collected in HILDA cannot easily inform on these complex decision-making processes, the role of caring for children has been clearly highlighted in these data.
Caring responsibilities also went beyond caring for young children, with some mothers caring for family members who were ill, were elderly or had a disability. This too seemed to constrain some mothers in their ability to be employed, consistent with previous research on the way in which caring responsibilities can limit employment (Edwards et al., 2008).
Maternal employment was associated with factors such as mothers' education and health status, which are well-known determinants of maternal employment (e.g., Austen & Seymour, 2006; Baxter, 2005; Baxter, 2012; Birch, 2003; Evans & Kelley, 2008; Gray et al., 2002; Parr, 2012; Renda, 2007). These factors were important generally in comparing levels of employment participation, and also, compared to couple mothers, lone mothers more often had those characteristics that were associated with lack of employment. This would contribute, then, to lone mothers' lower rates of employment. On the other hand, couple mothers had somewhat different characteristics that were also related to relatively low employment rates, in that they had a higher proportion with poor English-language proficiency.
Mothers with a greater connection to employment had higher education levels, and mothers who transitioned from non-employment into employment one year later also had higher education levels compared to those who remained not employed. Nevertheless, those with low education levels made up a significant proportion of those who transitioned into employment. This is an important reminder that lower education levels need not be a barrier to employment. Further, it is important to consider that mothers of all education levels are likely to take some time out of employment when they are caring for young children.
Past employment patterns varied across the groups compared in these analyses. Current employment attachment appeared to be related to a longer term as well as more recent history of being in paid employment. For some mothers, non-employment was likely to be a continuation of a weaker connection to employment, even from the time before they became mothers.
Non-employment had some association with physical health problems, as indicated by poor self-reported health and having a long-term health condition. Especially, their own illness, injury or disability was given as a reason for not looking for work by a very high proportion of lone mothers and non-employed mothers with older children. Also, poorer health status was more evident for non-employed mothers who did not transition into employment, when compared to those who did transition into employment.
The roles of mental health, self-perception, and perceived social supports in explaining patterns of maternal employment were apparent in these data. Poorer wellbeing on these different aspects were often found among those who had a weaker connection to employment, and was also found for lone compared to couple mothers.
Mothers' sense of personal autonomy was weaker than other variables in explaining patterns of maternal employment. However, overall, couple mothers had more positive beliefs in personal autonomy than lone mothers, and among non-employed mothers, those with older children had a lower sense of personal autonomy than those with younger children.
Mothers' attitudes or values about maternal employment had associations with patterns of employment and future transitions into employment. What we do not know is how these attitudes have been formed, and the extent to which they have been shaped by a particular history of labour force involvement. There is clearly scope for more analyses of these data, to further our understanding of the importance of these factors in explaining mothers' rates of participation in employment.
The focus of this paper was quite specific: looking at the characteristics of mothers according to their engagement in the labour market. As such, the purpose was not to use maternal or family characteristics to predict mothers' employment participation, as has been done elsewhere (e.g., Gray et al. 2006; Baxter & Renda, 2011; Parr, 2012). Nor was the purpose to examine the implications of maternal employment for maternal or other family outcomes.
These HILDA data offer the potential to more fully explore the links between maternal employment and maternal outcomes, especially mothers' wellbeing. The detailed employment data could also be used to broaden the scope of the research question to examine the nature of jobs in which mothers work; for example, comparing full-time and part-time jobs.
While quantitative work such as this cannot provide complete insights into the decision-making processes that women go through when contemplating whether or not to enter paid employment, these HILDA data have nevertheless proved to be useful in providing contextual information about the employment patterns of women from different backgrounds, and with different characteristics or attitudes.
References
- Austen, S., & Seymour, R. (2006). The evolution of the female labour force participation rate in Australia, 1984-1999. Australian Journal of Labour Economics, 9(3), 305-320.
- Australian Bureau of Statistics. (2007). Labour statistics: Concepts, sources and methods, April 2007 (Cat. No. 6102.0.55.001). Canberra: ABS. Retrieved from <tinyurl.com/q8ouxuq>.
- Australian Bureau of Statistics. (2011). Family characteristics Australia, 2009-10 (Cat. No. 4442.0). Canberra: ABS. Retrieved from <www.abs.gov.au/ausstats/[email protected]/mf/4442.0>.
- Baxter, J. A. (2005). The employment of partnered mothers in Australia, 1981 to 2001 (Unpublished doctoral dissertation). Demography and Sociology Program, Australian National University, Canberra.
- Baxter, J. A. (2008). Is money the main reason mothers return to work after childbearing? Journal of Population Research, 25(2), 141-160.
- Baxter, J. A. (2009). Mothers' timing of return to work by leave use and pre-birth job characteristics. Journal of Family Studies, 15(2), 153-166.
- Baxter, J. A. (2012). Employment and the life course: Analyses of birth cohort differences of young Australian women. In A. B. Evans, J. Baxter (Eds.), Negotiating the life course: Stability and change in life pathways (pp. 99-120). Dordrecht, Germany: Springer.
- Baxter, J. A. (2013). Parents working out work (Australian Family Trends No. 1). Melbourne: Australian Institute of Family Studies.
- Baxter, J. A., Gray, M., Hand, K., & Hayes, A. (2013). Parental joblessness, financial disadvantage and the wellbeing of parents and children (FaHCSIA Occasional Paper No. 48). Canberra: Department of Families, Housing, Community Services and Indigenous Affairs.
- Baxter, J. A., & Renda, J. (2011). Lone and couple mothers in the Australian labour market: Differences in employment transitions. Australian Journal of Labour Economics, 14(2), 103-122.
- Birch, E. R. (2003). The labour supply of Australian women (Discussion Paper No. 1/03). Perth: Institute for Research into International Competitiveness, Curtin University.
- Boyd, W. A., Thorpe, K. J., & Tayler, C. P. (2010). Preferences of first-time expectant mothers for care of their child: I wouldn't leave them somewhere that made me feel insecure. Australasian Journal of Early Childhood, 35(2), 4-12.
- Bradbury, B. (1995). Added, subtracted or just different: Why do the wives of unemployed men have such low employment rates? Australian Bulletin of Labour, 21(1), 48-70.
- Brewster, K. L., & Rindfuss, R. R. (2000). Fertility and women's employment in industrialized nations. Annual Review of Sociology, 26, 271-296.
- Buddelmeyer, H., Wooden, M., & Ghantous, S. (2006). Transitions from casual employment in Australia. Melbourne: Melbourne Institute of Applied Economic and Social Research.
- Butterworth, P. (2003). Multiple and severe disadvantage among lone mothers receiving income support. (PDF 323 KB) Family Matters, 64, 22-29. Retrieved from <www.aifs.gov.au/institute/pubs/fm2003/fm64/pb.pdf>.
- Dawkins, P., Gregg, P., & Scutella, R. (2002). The growth of jobless households and the polarisation of employment in Australia. Paper presented at the Towards Opportunity and Prosperity: 2002 Economic and Social Outlook Conference, University of Melbourne, Melbourne.
- Eardley, T. (2001). Sole parents and welfare dependency. Just Policy, 21, 2-7.
- Edwards, B., Higgins, D. J., Gray, M., Zmijewski, N., & Kingston, M. (2008). The nature and impact of caring for family members with a disability in Australia (AIFS Research Report No. 16). Melbourne: Australian Institute of Family Studies.
- Evans, M. D. R. (1988). Working wives in Australia: Influences of the life cycle, education, and feminist ideology. In J. Kelley & C. Bean (Eds.), Australian attitudes: Social and political analyses from the National Social Science Survey (pp. 147-162). Melbourne: Allen and Unwin.
- Evans, M. D. R., & Kelley, J. (2008). Trends in women's labor force participation in Australia: 1984-2002. Social Science Research, 37(1), 24.
- Gray, M., & Baxter, J. (2011). Parents and the labour market. In Australian Institute of Family Studies (Ed.), The Longitudinal Study of Australian Children annual statistical report 2010 (pp. 29-41). Melbourne: AIFS. Retrieved from <www.growingupinaustralia.gov.au/pubs/asr/2010/asr2010d.html>.
- Gray, M., & Chapman, B. (2001). Foregone earnings from child rearing: Changes between 1986 and 1997. (PDF 441 KB) Family Matters, 58, 4-9. Retrieved from <www.aifs.gov.au/institute/pubs/fm2001/fm58/mg.pdf>.
- Gray, M., Qu, L., de Vaus, D., & Millward, C. (2002). Determinants of Australian mothers' employment: An analysis of lone and couple mothers (Research Paper No. 26). Melbourne: Australian Institute of Family Studies. Retrieved from <www.aifs.gov.au/institute/pubs/rp26/>.
- Gray, M., Qu, L., Renda, J., & de Vaus, D. (2006). Changes in the labour force status of lone and couple Australian mothers, 1983-2005. Australian Journal of Labour Economics, 9(4), 395-416.
- Hand, K. (2007). Mothers' accounts of work and family decision-making in couple families: An analysis of the Family and Work Decisions Study. (PDF 1.2 MB) Family Matters, 75, 70-76. Retrieved from <www.aifs.gov.au/institute/pubs/fm2006/fm75/kh.pdf>.
- Harding, A., Vu, Q., Percival, R., & Beer, G. (2005). Welfare-to-work reforms: Impact on sole parents. Agenda, 12(3), 195-210.
- Haynes, M., Western, M., Yu, L., & Spellak, M. (2008, 1-4 August 2008). Employment transitions of Australian women: Analysing nominal data from a panel survey. Paper presented at the 103rd annual meeting of the American Sociological Association, Boston, USA.
- Hynes, K., & Clarkberg, M. (2005). Women's employment patterns during early parenthood: A group-based trajectory analysis. Journal of Marriage and Family, 67(1), 222-239.
- Jordan, A. (1993). Women's earnings and inequality of family income. Social Security Journal, March, 55-68. Retrieved from <www.fahcsia.gov.au/sites/default/files/documents/06_2012/mar93.pdf>.
- King, A., Bradbury, B., & McHugh, M. (1995). Why do the wives of unemployed men have such low employment rates (SPRC Reports and Proceedings No. 125). Sydney: Social Policy Research Centre, University of New South Wales.
- Knights, S., Harris, M., & Loundes, J. (2000). Dynamic relationships in the Australian labour market: Heterogeneity and state dependence (Melbourne Institute Working Paper No. 6/00). Melbourne: Melbourne Institute of Applied Economic and Social Research.
- Lehrer, E. L., & Nerlove, M. L. (1986). Female labor force behavior and fertility in the United States. Annual Review of Sociology, 12, 181-204.
- Losoncz, I., & Bortolotto, N. (2009). Work-life balance: The experiences of Australian working mothers. Journal of Family Studies, 15(2), 122-138.
- McHugh, M., & Millar, J. (1996). Sole mothers in Australia: Supporting mothers to seek work (Discussion Paper No. 71). Sydney: Social Policy Research Centre.
- Micklewright, J., & Giannelli, G. (1991). Why do women married to unemployed men have low participation rates? Florence: European University Institute.
- Millar, J., & Evans, M. (Eds.). (2003). Lone parents and employment: International comparisons of what works. Sheffield: UK Department for Work and Pensions.
- Miller, C. F. (1993). Part-time participation over the life-cycle among married-women who work in the market. Applied Economics, 25(1), 91-99.
- O'Donnell, C. (1984). The basis of the bargain : Gender, schooling and jobs. Sydney: Allen & Unwin.
- Organisation for Economic Co-operation and Development. (2007). Babies and bosses: Reconciling work and family life. A synthesis of findings for OECD countries. Paris: OECD.
- Organisation for Economic Co-operation and Development. (2012, 13 May). LMF1.2: Maternal employment rates (OECD Family Database). Paris: OECD Social Policy Division, Directorate of Employment, Labour and Social Affairs. Retrieved from <www.oecd.org/social/soc/oecdfamilydatabase.htm#labour_market>.
- Parr, N. (2012). Trends in differentials in the workforce participation of mothers with young children in Australia 2002-2008. Journal of Population Research, 29(3), 203-227.
- Renda, J. (2007). Employment aspirations of non-working mothers with long-term health problems (AIFS Research Paper No. 40). Melbourne: Australian Institute of Family Studies.
- Ross, R. (1984). Married women and market work: How much choice? Australian Quarterly, 56, 227-238.
- Saunders, P. (1995). Improving work incentives in a means-tested welfare system: The 1994 Australian social security reforms. Fiscal Studies, 16(2), 45-70.
- Scutella, R. (2000). Labour supply estimates for married women in Australia (Melbourne Institute Working Paper No. 25/99). Melbourne: Melbourne Institute for Applied Economic and Social Research.
- Shamsuddin, A. (1998). Labour supply of immigrant women in Australia. Australian Journal of Labour Economics, 2(2), 105-127.
- Stromback, T., Dockery, A. M., & Ying, W. (1998). Transition in the labour market: Evidence from the Survey of Employment and Unemployment Patterns (Working Paper No. 1). Melbourne: Melbourne Institute of Applied Economic and Social Research.
- van Egmond, M., Baxter, J., Buchler, S., & Western, M. (2010). A stalled revolution? Gender role attitudes in Australia, 1986-2005. Journal of Population Research, 27(3), 147-168.
- VandenHeuvel, A., & Wooden, M. (1996). Barriers to women's participation in the labour market. Canberra: Women's Bureau and Employment Initiatives Branch, Women's Bureau.
- Walters, M. (2002). Working their way out of poverty? Sole motherhood, work, welfare and material well-being. Journal of Sociology, 38(4), 361-380.
- Watson, N. (2012). Longitudinal and cross-sectional weighting methodology for the HILDA survey (HILDA Project Technical Paper Series No. 2/12). Melbourne: Melbourne Institute of Applied Economic and Social Research, University of Melbourne.
- Watson, N., & Wooden, M. (2002). Assessing the quality of the HILDA survey Wave 1 data (HILDA Project Technical Paper Series No. 4/02). Melbourne: Melbourne Institute of Applied Economic and Social Research, University of Melbourne.
Appendix
| Year | Percentage employed | Sample size | ||||
|---|---|---|---|---|---|---|
| Lone mothers | Couple mothers | All | Lone mothers | Couple mothers | All | |
| 2001 | 45.2 | 60.5 | 57.4 | 431 | 1,872 | 2,303 |
| 2002 | 49.7 | 59.6 | 57.6 | 393 | 1,670 | 2,063 |
| 2003 | 45.7 | 59.0 | 56.2 | 398 | 1,600 | 1,998 |
| 2004 | 43.6 | 62.0 | 57.9 | 393 | 1,551 | 1,944 |
| 2005 | 47.5 | 63.8 | 60.4 | 400 | 1,541 | 1,941 |
| 2006 | 54.1 | 66.2 | 63.8 | 373 | 1,531 | 1,904 |
| 2007 | 55.4 | 64.6 | 62.8 | 353 | 1,534 | 1,887 |
| 2008 | 59.0 | 66.8 | 65.3 | 362 | 1,481 | 1,843 |
| 2009 | 60.0 | 64.5 | 63.7 | 368 | 1,481 | 1,849 |
| 2010 | 61.0 | 65.1 | 64.3 | 357 | 1,521 | 1,878 |
| 2011 | 56.1 | 63.9 | 62.4 | 476 | 2,005 | 2,481 |
Note: A top-up sample was added to HILDA in Wave 11.
| Year | Lone mothers (age of youngest child) | Couple mothers (age of youngest child) | ||||||
|---|---|---|---|---|---|---|---|---|
| 0-2 years (%) | 3-5 years (%) | 6-9 years (%) | 10-14 years (%) | 0-2 years (%) | 3-5 years (%) | 6-9 years (%) | 10-14 years (%) | |
| Percentage employed | Percentage employed | |||||||
| 2001 | 19.2 | 43.5 | 57.5 | 58.8 | 43.5 | 62.5 | 69.5 | 75.0 |
| 2002 | 18.2 | 43.0 | 58.9 | 71.5 | 42.9 | 59.4 | 69.5 | 73.7 |
| 2003 | 20.7 | 46.1 | 47.3 | 60.3 | 38.4 | 59.6 | 71.0 | 76.4 |
| 2004 | 16.9 | 42.9 | 58.2 | 52.8 | 50.3 | 55.3 | 71.9 | 75.0 |
| 2005 | 25.8 | 37.8 | 55.6 | 64.5 | 50.0 | 63.7 | 73.5 | 74.0 |
| 2006 | 26.8 | 47.4 | 70.8 | 62.9 | 50.4 | 66.3 | 76.2 | 78.4 |
| 2007 | 23.8 | 55.1 | 69.0 | 66.3 | 49.1 | 62.6 | 74.1 | 79.6 |
| 2008 | 23.3 | 62.2 | 67.4 | 76.1 | 51.5 | 62.8 | 79.9 | 80.7 |
| 2009 | 27.4 | 64.1 | 66.9 | 79.0 | 46.7 | 70.8 | 72.6 | 78.7 |
| 2010 | 32.8 | 49.7 | 69.4 | 81.0 | 48.8 | 66.8 | 73.6 | 80.1 |
| 2011 | 25.9 | 44.2 | 67.1 | 74.1 | 45.9 | 63.3 | 73.6 | 82.6 |
| Sample size | Sample size | |||||||
| 2001 | 104 | 97 | 109 | 121 | 644 | 374 | 413 | 441 |
| 2002 | 81 | 87 | 101 | 124 | 526 | 364 | 398 | 382 |
| 2003 | 77 | 89 | 103 | 129 | 496 | 337 | 374 | 393 |
| 2004 | 85 | 76 | 105 | 127 | 479 | 341 | 335 | 396 |
| 2005 | 85 | 85 | 104 | 126 | 491 | 299 | 356 | 395 |
| 2006 | 73 | 76 | 92 | 132 | 492 | 299 | 353 | 387 |
| 2007 | 73 | 78 | 81 | 121 | 526 | 275 | 339 | 394 |
| 2008 | 88 | 70 | 88 | 116 | 526 | 268 | 319 | 368 |
| 2009 | 95 | 76 | 88 | 109 | 542 | 277 | 296 | 366 |
| 2010 | 79 | 82 | 87 | 109 | 575 | 277 | 290 | 379 |
| 2011 | 99 | 109 | 119 | 149 | 796 | 375 | 373 | 461 |
Note: A top-up sample was added to HILDA in Wave 11.
Figure A1: Lone and couple mothers with children under 15, comparisons of ABS and HILDA estimates of percentages employed, by year
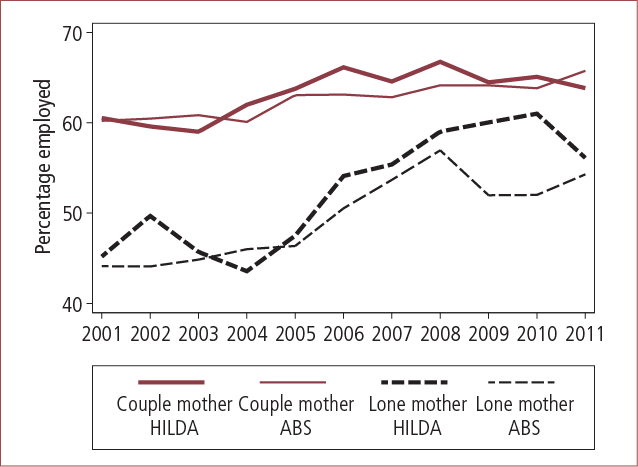
Source: HILDA, Waves 1-11 (Wave 11 release); ABS Supertable FM1: Labour force status by sex, state, relationship from April 2001 (estimates as at June each year)
Lists of tables and figures
List of tables
- Table 1: Recent employment history (2010-11) of lone and couple mothers, by employment status in 2011
- Table 2: Childbirth and education/employment history of lone and couple mothers, by recent employment history (2010-11), 2011
- Table 3: Socio-demographic characteristics of lone and couple mothers, by recent employment history (2010-11), 2011
- Table 4: Mental health and perceived social supports of lone and couple mothers, by recent employment history (2010-11), 2011
- Table 5: Personal autonomy of lone and couple mothers, by recent employment history (2010-11), 2011
- Table 6: Work-family values of lone and couple mothers, by recent employment history (2010-11), 2011
- Table 7: Childbirth and education/employment history of non-employed lone and couple mothers, by age of youngest child, 2011
- Table 8: Labour force characteristics of non-employed lone and couple mothers, by age of youngest child, 2011
- Table 9: Selected reasons not looking for work, lone and couple mothers who are not in the labour force who want a job, by age of youngest child, 2011
- Table 10: Socio-demographic characteristics of non-employed lone and couple mothers, by age of youngest child, 2011
- Table 11: Mental health and perceived social supports of non-employed lone and couple mothers, by age of youngest child, 2011
- Table 12: Personal autonomy of non-employed lone and couple mothers, by age of youngest child, 2011
- Table 13: Work-family attitudes of non-employed lone and couple mothers, by age of youngest child, 2011
- Table 14: Childbirth and education/employment history of mothers who were not employed in 2010, by employment status in 2011
- Table 15: Labour force characteristics of mothers who were not employed in 2010, by employment status in 2011
- Table 16: Socio-demographic characteristics of mothers who were not employed in 2010, by employment status in 2011
- Table 17: Self-perceptions and social supports of mothers who were not employed in 2010, by employment status in 2011
- Table 18: Personal autonomy of mothers who were not employed in 2007, by employment status in 2008
- Table 19: Work-family attitudes of mothers who were not employed in 2008, by employment status in 2009
- Table A1: Lone and couple mothers with children aged under 15, estimated percentages employed, by year
- Table A2: Lone and couple mothers with children aged under 15, estimated percentages employed, by year and age of youngest child
List of figures
Dr Jennifer Baxter is a Senior Research Fellow at the Australian Institute of Family Studies.
This paper uses unit record data from the Household, Income and Labour Dynamics in Australia (HILDA) survey. The HILDA project was initiated and is funded by the Australian Government Department of Families, Housing, Community Services and Indigenous Affairs (FaHCSIA) and is managed by the Melbourne Institute of Applied Economic and Social Research (Melbourne Institute).
This publication is an update of a report prepared with funding from FaHCSIA.
Disclaimer
The findings and the interpretation of the data, as reported in this paper, are those of the author and should not be attributed to the Australian Institute of Family Studies (AIFS), FaHCSIA, or the Melbourne Institute.
Baxter, J. (2013). Australian mothers' participation in employment: Analyses of social, demographic and family characteristics using the Household, Income and Labour Dynamics in Australia (HILDA) survey (Research Paper No. 52). Melbourne: Australian Institute of Family Studies.
978-1-922038-35-7