Families in regional, rural and remote Australia
You are in an archived section of the AIFS website
Download Research report
This Facts Sheet describes how the characteristics of Australian families differ between the "city" and the "bush”. It includes information about the geographic distribution of families; household type; family structure; age distribution; access to services and the characteristics of children’s outcomes. While there are many similarities between families regardless of where they live, geographic distance still has a significant influence on Australians and their families.
Key messages
-
In 2009, over two-thirds (69%) of Australians lived in major cities, one in five (20%) lived in inner regional areas, one in 10 (9%) in outer regional areas and around one in 40 (2.3%) lived in remote or very remote areas (1.5% remote and 0.8% very remote).
-
Families living in the "bush" differ in some important ways compared to those living in the city - in particular geographic remoteness limits their access to services.
-
Those in remote or very remote areas are more likely to be Indigenous, and a greater proportion of those in very remote areas live in multi-family households.
-
Old age dependency ratios are higher in inner regional areas, reflecting trends for many Australians to leave major cities on retirement.
-
Geographic area has some effect on how children spend their time, with increasing remoteness being associated with more time spent outdoors. On the other hand, children’s participation in extracurricular activities is higher in major cities.
-
There are differences in children's developmental outcomes across geographic areas, with children in major cities doing better for physical development and learning outcomes than children in other areas.
Introduction
Australia is one of the most urbanised countries in the world, with over two-thirds (69%) of the population living in major cities. It also has one of the lowest population densities outside of its major cities. Despite the vastness of Australia and the profound impact that this has on the lives of the peoples living in rural and remote areas, relatively little is known about families living in these areas of Australia compared to those living in major cities.
This Facts Sheet describes how the characteristics of families differ between the "city" and the "country" or "bush". While words such as these are used in everyday parlance, it is very difficult to identify exactly where the city ends and the country begins. One way of categorising regions is in terms of the road distance from services, and this is the standard method to define remoteness for statistical purposes in Australia. Most of the information in this Facts Sheet is provided for: major cities, and inner regional, outer regional, remote, and very remote regions.1 Figure 1 shows the areas of each of these regions across Australia.2
Figure 1 Geographic remoteness in Australia
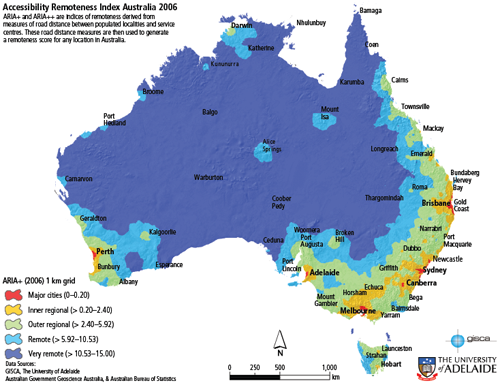
[Large map showing accessibility remoteness in Australia 2006]
Geographic distribution of Australian families
Over two-thirds (69%) of Australians live in major cities, one in five (20%) live in inner regional areas, one in ten (9%) in outer regional areas and around one in forty (2.3%) live in remote or very remote areas (1.5% remote and 0.8% very remote). These figures represented, in 2009, 15.1 million people living in major cities, 4.3 million in inner regional areas, 2.1 million in outer regional areas, 324,000 in remote areas and 174,000 in very remote areas (Australian Bureau of Statistics [ABS], 2010).3
While Australians of all backgrounds reside in the different regions across Australia, the Indigenous population has a much greater concentration in the more remote areas.
Although 2.4% of Australia's population are Indigenous, their geographic distribution across Australia is quite different. Indigenous people comprise 1% of the population in major cities, 3% in inner regional areas, 6% in outer regional areas, 15% in remote areas and 49% in very remote areas.
Given the much higher proportion of the population that is Indigenous in remote and very remote areas, some of the information in this Facts Sheet is presented separately for Indigenous and non-Indigenous Australians in these areas.
There are also differences between geographic regions in the percentage of the population born overseas. While overall, the proportion is 29%, the distribution across different types of areas varies considerably:
- major cities: 31%;
- inner regional areas: 14%;
- outer regional areas: 14%;
- remote areas: 13%; and
- very remote areas: 8%.
Household type
Most Australians (79%) live in one-family households, with 3% in multi-family households (households consisting of two or more families), 9% in lone-person households, 3% in group households and 6% in non-private dwellings or not-classifiable households (Figure 2). There are few differences in the composition of households between major cities, inner regional, outer regional and remote areas. However, in very remote areas a lower proportion of people live in one-family households (64%) and a higher proportion in multi-family households (18%).
Figure 2 Household type, by geographic remoteness, 2006
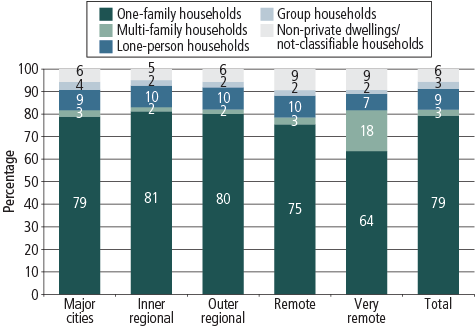
Source: Census 2006
The difference between very remote areas and the rest of Australia is largely the result of a higher proportion of the population in very remote areas being Indigenous. In very remote areas, about three-quarters of non-Indigenous people live in one-family households and 2% in multi-family households. This compares to 57% of Indigenous people who live in one-family households and 38% who live in multi-family households.4
Family structure
Among Australian family households, the distribution of family types is similar between major cities, inner regional, outer regional and remote areas, with 57-61% of people living in couple families with children, 24-29% in couple families with no children, and 13-14% in one-parent families (Figure 3). In contrast, in very remote regions, a smaller proportion of people live in couple families with no children (19%) and a higher proportion live in one-parent families (19%).
Figure 3 Family type, by geographic remoteness, 2006
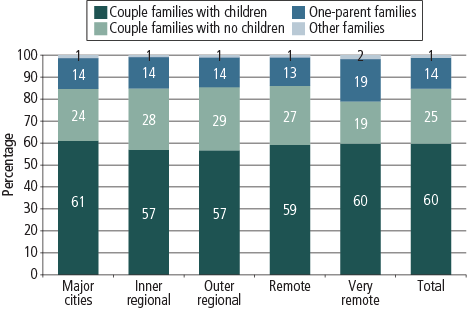
Notes: Date relates to people living in family households.
Source: Census 2006
These differences for remote regions largely reflect different family structures among Indigenous people. In remote areas, 35% of Indigenous people live in one-parent families compared to 9% of non-Indigenous people, and in very remote areas, 30% of Indigenous people live in one-parent families compared to 7% of non-Indigenous people. Indigenous people in these remote and very remote areas are less likely to be living as childless couple families than are non-Indigenous people. In very remote areas, 8% of Indigenous people and 32% of non-Indigenous people live as couple families without children.
Age distribution
Australia's population is ageing, as is the population in many other countries. The proportion of the population aged 65 years and over relative to those of working age (15-64 years) - known as the old age dependency ratio - is increasing. For example, in inner regional areas there are 24 elderly people for every 100 people of working age. This has significant implications for a wide range of government policies and programs, including the types of services needed. It also has implications for the social and economic life of communities. The old age dependency ratios for each area are:
- 19% in major cities;
- 24% in inner regional areas;
- 21% in outer regional areas;
- 14% in remote areas; and
- 9% in very remote areas.
The higher old age dependency ratio in inner regional areas reflects, in part, the migration of retired people from major cities to inner regional areas. The lower old age dependency ratios in remote and very remote regions reflects the higher proportion of the population that is Indigenous. Also, many younger people move to remote and very remote areas for employment (e.g., to work in the mining industry).
Access to services
One of the defining features of geographic remoteness is that many services are less accessible. The General Social Survey 2006 (GSS 2006) provides data on the extent to which respondents to the survey had difficulty accessing services such as doctors, employment services, telecommunication services, Centrelink, banks and other financial institutions, disability services, family assistance offices or Medicare. Respondents to the GSS 2006 were asked if they had difficulties for reasons such as transport/distance, cost or inadequate services in the area.5
As expected, people living in major cities are less likely to have problems accessing a range of services than those living in other areas. Those in outer regional or remote areas are the most likely to have difficulties accessing services. This is true irrespective of family type.
For couple-parent families, of those who had sought access to service providers, the proportion having problems accessing services are:
- 19% in major cities;
- 27% in inner regional areas; and
- 40% in outer regional areas.
For lone-parent families, the proportions having problems accessing services are:
- 29% in major cities;
- 31% in inner regional areas; and
- 43% in outer regional areas.
For couples without children living with them (including both childless couples and those with grown-up children), the proportions having problems accessing services are:
- 16% in major cities;
- 23% in inner regional areas; and
- 36% in outer regional areas.
These data illustrate that while geographic remoteness is an important factor in not having access to services, it is not a complete explanation. Even in major cities some people have experienced difficulties in accessing such services. This may reflect lack of affordable transport, cost of services, waiting lists, or because of the inappropriateness of available services.
Do children's lives differ according to geographic remoteness?
The geographic remoteness of the area in which children live can have a significant impact upon their experiences and how they spend their time. These can affect their future life trajectory. This Facts Sheet provides information about how the following aspects of children's lives vary according to whether they are growing up in a major city, or a regional or remote area:
- children's preferences about how to spend their free time;
- amount of time children spent outside compared to inside;
- children's extracurricular activities;
- parents' expectations about their children's educational attainment; and
- parents' views on the safety and desirability of their neighbourhood for their children.
The data presented in this section are for children aged 8-9 years in 2008, from Growing Up in Australia: The Longitudinal Study of Australian Children (LSAC). There were insufficient numbers of children from remote and very remote areas in this study to allow reliable estimates to be produced for these regions, so we focus on children in major cities, inner regional and outer regional areas.
Children's preferences about how to spend their free time
The LSAC survey asks parents about whether their children prefer to spend their free time in mostly active pastimes, in mostly inactive pastimes, or have no clear preference.
There are differences according to geographic remoteness in how children prefer to spend their time (Figure 4). In all areas, boys are more likely to prefer active pastimes than girls. A higher proportion of children in more geographically remote areas prefer active pastimes than children in less geographically remote areas. The proportion of children who prefer inactive pastimes is correspondingly higher in major cities.
Figure 4 Children's preferences about how they spend their free time, by gender and geographic remoteness
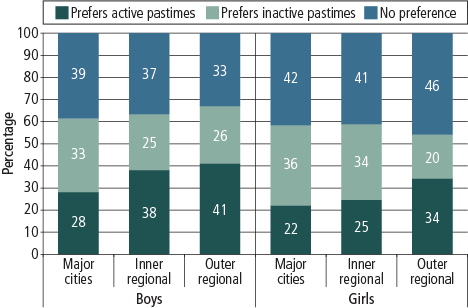
Notes: As reported by parents of children aged 8-9 years.
Source: LSAC 2008
Amount of time children spent outside compared to inside
While boys and girls living in outer regional areas spend more time outside than those living in major cities, the differences are no more than half an hour per day (Figure 5).6 In all areas boys spent more time outside than girls.
Figure 5 Amount of time children spend outside, by gender and geographic remoteness
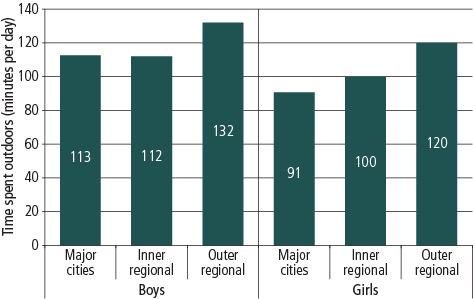
Notes: As reported by parents of children aged 8-9 years using a child time use diary.
Source: LSAC 2008
Children's extracurricular activities
LSAC collects data on a range of organised activities in which children may participate, including team sports, individual sports, or art, music or dance classes. The majority of boys aged 8-9 years participate in a team sport (64-69% across geographic remoteness areas), compared to a minority of girls (36-40% across geographic remoteness areas) (Figure 6). While regional differences are very small, boys in outer regional areas are the most likely to participate in team sports (69%).
Figure 6 Extracurricular activities, by gender and geographic remoteness
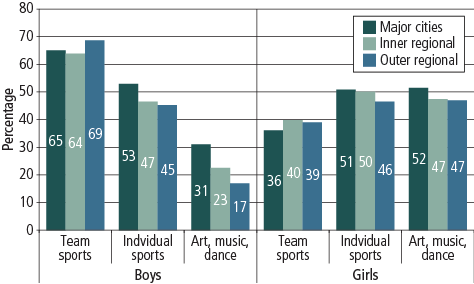
Notes: As reported by parents of children aged 8-9 years.
Source: LSAC 2008
Across geographic regions, differences in the proportions of boys and girls participating in individual sports, such as swimming lessons and gymnastics, are also apparent, with lower participation rates for these activities in outer regional areas.
Significant differences in participation in extracurricular art, music or dance classes according to geographic remoteness were also found. Participation in these types of classes is more common in major cities than outer regional areas. For example, the proportion of boys participating in these types of activities is 31% in major cities and 17% in outer regional areas. For girls, the pattern is similar, although the difference between major cities and outer regional areas is smaller than is the case for boys.
Parents' expectations about their children's educational attainment
Parents' expectations for their children's future education levels provide interesting insights into their possible educational outcomes. Figure 7 shows that in all geographic areas, parents have quite high expectations regarding their children obtaining some post-school qualifications, although boys are somewhat more likely than girls to be expected to obtain a trade or vocational qualification, rather than a university-level qualification.
Figure 7 Parents' expectations of children's future educational level, by gender and geographic remoteness
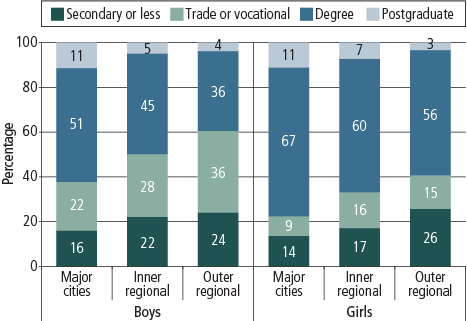
Notes: As reported by parents of children aged 8-9 years.
Source: LSAC 2008
Parents in major cities have relatively high expectations for their children's future education levels, when compared to parents in the less geographically accessible regions. For example, for 8-9 year old girls:
- In major cities, 78% of parents expect their daughter to obtain a university-level qualification (67% degree level, 11% postgraduate level). Only 9% expect girls to obtain a trade or vocational qualification and 14% expect them to complete no post-school qualification.
- In outer regional areas, 59% of parents expect their daughter to complete a university-level qualification (56% degree level, 3% postgraduate level). Another 15% expect girls to obtain a trade or vocational qualification and 26% expect them to complete no post-school qualification.
For 8-9 year old boys:
- In major cities, 62% of parents expect their son to complete a university-level qualification (51% degree level, 11% postgraduate level). Another 22% expect boys to obtain a trade or vocational qualification and 16% to complete no post-school qualification.
- In outer regional areas, 40% of parents expect their son to obtain a university-level qualification (36% degree level, 4% postgraduate level). Significant percentages expect boys to obtain a trade or vocational qualification (36%) or to complete no post-school qualification (24%).
The differences in expectations of qualifications for girls compared to boys is greatest in the outer regional areas.
Parents' views on the safety and desirability of their neighbourhood for their children
The nature of the neighbourhood in which children grow up can have impacts upon how children develop (e.g., Edwards & Bromfield, 2009). Very few Australian parents think that the neighbourhood in which they live is unsafe. There is little difference according to geographic remoteness, with those in outer regional areas slightly less likely to disagree that the neighbourhood is safe (4%) than in major cities or inner regional areas (7%) (Figure 8).
Figure 8 Parents' views about neighbourhood safety, quality of parks and access to basic services, by geographic remoteness
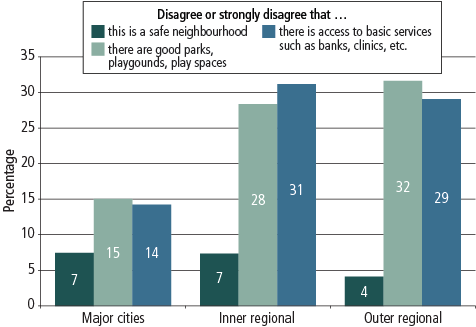
Notes: As reported by parents of children aged 8-9 years.
Source: LSAC 2008
There are big differences in terms of the perceived quality of parks and playgrounds, with parents living in major cities being the least likely to express unfavourable views compared to those living in inner and outer regional areas. Views about access to services also vary by region. About three in ten parents in inner regional areas (31%) and outer regional areas (29%) disagree that they have access to basic services such as banks and medical clinics. In major cities, however, only 14% of parents say they do not have access to basic services.
Children's developmental outcomes
The differences in the physical, economic and social environments between major cities, inner regional and outer regional areas may have an effect on children's developmental trajectories.
Children's physical, social-emotional and learning outcomes were measured and used to rank them according to whether they did very well or poorly relative to each other. Figure 9 shows these relative outcomes for children aged 8-9 years:
- physical development - children were more likely to do very well in major cities and outer regional areas compared to those in inner regional areas;
- social-emotional outcomes - children showed very little difference across the geographic areas; and
- learning outcomes - children were more likely to do very well in major cities, followed by inner regional areas and then outer regional areas.
Figure 9 Children's physical, social emotional and learning outcomes by geographic remoteness, 8-9 year olds
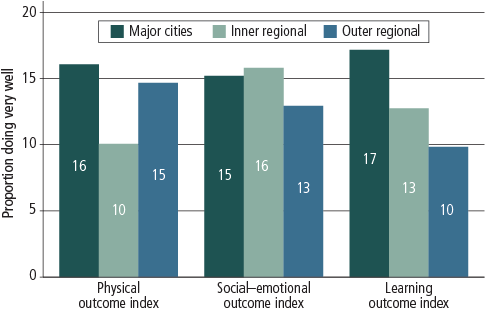
Note: Percentages are based on the top 15% of children in each of the outcome indices.
Source: LSAC Outcome Index (Misson et al., in press)
Similar observations were seen at the other end of the scale; for example, a higher percentage of children in inner regional areas had poorer physical development than children in the other areas (data not shown).
The differences in children's developmental outcomes across geographic areas are likely to be explained in part by the impact of living in these areas and in part by differences in the characteristics of families across these areas.
Concluding comments
This analysis of regional statistics shows that families living in the "bush" may differ in some important ways compared to those living in the city. Those in remote or very remote areas are more likely to be Indigenous than those living in inner regional areas or major cities; and a greater proportion of those in very remote areas live in multi-family households. While family structure does not differ markedly across regions varying in remoteness, Indigenous people are more likely to live in one-parent families, especially in remote and very remote areas. Old age dependency ratios are higher in inner regional areas, reflecting trends for many Australians to leave major cities on retirement.
Access to services and educational aspirations are generally more limited in outer regional areas. Geographic area has some effect on how children spend their time, with increasing remoteness being associated with more time spent outdoors. On the other hand, engagement in extracurricular activities is higher in major cities. Compared to parents in inner regional and outer regional areas, those in major cities are less likely to provide an unfavourable view of their neighbourhood parks and playgrounds, and access to basic services. There are also differences in children's developmental outcomes across geographic areas, with children in major cities doing better for physical development and learning outcomes than children in other areas.
While there are many similarities in the nature of families and their lives across areas of varying remoteness, overall distance still exercises some "tyrannous" influences on the lives of Australians and their families.
References
- Australian Bureau of Statistics. (2010). Australian demographic statistics, June 2010 (Cat. No. 3101.0). Canberra: ABS. Retrieved from <http://tinyurl.com/4tm2kqp>.
- Edwards, B., & Bromfield, L. M., (2009). Neighbourhood influences on young children's conduct problems and pro-social
- Misson, S., Sanson, A., Berthelsen, D., Rogers, H., Rothman, S., Sipthorp, M. et al. (in press). Tracking children's development over time: The Longitudinal Study of Australian Children Outcome Indices, Waves 2 and 3 (Research Paper). Melbourne: Australian Institute of Family Studies.
- Morphy, F. (2004). When systems collide: The 2001 Census at a Northern Territory outstation. In D. F. Martin, F. Morphy, W. G. Sanders, & J. Taylor (Eds.), Making sense of the Census: Observations of the 2001 enumeration in remote Aboriginal Australia (CAEPR Research Monograph No. 22). Canberra: ANU E Press.
- Morphy, F. (2006). Lost in translation? Remote Indigenous households and definitions of the family. Family Matters, 73, 23-31.
Endnotes
1 Based upon the Australian Standard Geographic Classification remoteness classification.
2 The statistical information in this Facts Sheet is derived from the Census 2006, the General Social Survey 2006 (GSS 2006) and Growing Up in Australia: The Longitudinal Study of Australian Children (LSAC). The Census data are for all Australians, irrespective of age (unless otherwise stated). Area of residence is based upon place of enumeration on Census night. Those who were not at home on Census night are excluded from the analysis. The GSS 2006 is a household survey, with respondents aged 18 and over.
3 ABS Estimated Resident Population statistics are based on 2006 Census data, updated to take account of births, deaths, international and interstate migration.
4 An important feature of many Indigenous households is that there is a significant amount of mobility through the household, which can result in complex and dynamic household structures (Morphy, 2004). In addition, the categories and terms generally used to describe kin relationships are those that apply to the standard Anglo-Celtic system that is used to collect data about family type and household structure in the Census and other national data collections; many traditionally oriented Indigenous people have kinship systems that differ markedly in their structure from the Anglo-Celtic system (Morphy, 2006). This Facts Sheet does not attempt to engage with these complexities.
5 The full list also included disability restrictions, lack of support networks, cannot trust them, and any other reason. Respondents could also say they had not tried to access any service providers; these people are excluded from calculations. The GSS regional classification combines remote and very remote regions.
6 Data on time spent outdoors are derived from child time use diaries.
Dr Jennifer Baxter is a Senior Research Fellow and Professor Alan Hayes is the Director, Australian Institute of Family Studies. Professor Matthew Gray is Professor of Indigenous Public Policy, Centre for Aboriginal Economic Policy Research, Australian National University.
This paper uses unit record data from Growing Up in Australia: The Longitudinal Study of Australian Children. The study is conducted in partnership between the Department of Families, Housing, Community Services and Indigenous Affairs (FaHCSIA), the Australian Institute of Family Studies (AIFS) and the Australian Bureau of Statistics (ABS). The findings and views reported in this paper are those of the author and should not be attributed to FaHCSIA, AIFS or the ABS
Baxter, J., Hayes, A., & Gray, M. (2011). Families in regional, rural and remote Australia (Facts Sheet). Melbourne: Australian Institute of Family Studies.