Family law court filings 2004-05 to 2012-13
February 2015
Download Research report
Overview
This report analyses trends in family law court filings over a nine year period between 2004-05 and 2012-13.
It sheds light on the impact on court filings of the 2006 reforms that encouraged greater use of non-court based mechanisms for resolving parenting disputes and the 2009 reforms that brought post-separation property division laws and processes for de facto couples into line with those for married couples.
This report extends the findings of the 2009 study Evaluation of the 2006 Family Law Reforms. The research is based on data provided by the Family Court of Australia, the Federal Magistrates Court, and the Family Court of Western Australia, for the period 2004-05 to 2012-13.
Key messages
-
Court filings in children's matters in the 2012-13 reflect a 25% decrease on levels in 2004-05, the period prior to the 2006 family law reforms. The sharp decreases shown in the years just after the 2006 reforms have stabilised at this level.
-
In relation to filings in property matters, a 17% increase is evident nationally, reflecting the impact of the de facto property reforms in 2008 which shifted jurisdiction over de facto property matters from state and territory systems into the federal system.
-
The case-load distribution between the FCoA and the FCC in 2012-13 stood at 86% for the FCC and 14% for the FCoA.
1. Introduction
This research report provides an overview of trends in family law court filings over a nine-year period between the 2004-05 and 2012-13 financial years. The data used were obtained from the three courts that primarily deal with family law matters: the Family Court of Australia (FCoA), the Federal Circuit Court of Australia (FCC, formerly the Federal Magistrates Court [FMC])1 and the Family Court of Western Australia (FCoWA). The report describes longer term trends in court filings overall, and in specific areas relating to children. It also covers the caseload distribution between the FCC and the FCoA but does not include data on appeals.
The report provides an update on information previously published by the Australian Institute of Family Studies (AIFS) in the Evaluation of the 2006 Family Law Reforms (Kaspiew et al., 2009). It extends the analysis covered in that report over a further four years, providing a longer term perspective on court caseloads in the nine-year period from 2004-05. The study also provides insight into the continuing effects of the 2006 family law reforms ("the 2006 reforms"), which introduced a requirement for parents to attempt to resolve parenting disputes through family dispute resolution (FDR) prior to lodging a child-related court application, except in certain circumstances, including those involving concerns about family violence and child abuse.2
In addition, through examining trends in filings in property matters, this research sheds light on the effects of legislation that removed legal distinctions between formerly married and de facto couples for the purposes of post-separation property division ("the de facto property reforms").3 It also provides some early insights into the emerging consequences of legislative changes that came into effect in 2012 ("the 2012 reforms").4 The 2012 reforms aim to improve the identification of and responses to matters involving family violence, child abuse and child safety concerns across the family law system. They are intended to have a widespread influence on practices in family support services (including FDR) and practices in the legal and court sectors. The effects of these reforms, including on patterns in court filings, are currently being examined by AIFS in a research program funded by the Attorney-General's Department.5
This research report has been prepared with the support of the three courts, each of which supplied relevant data.6
1.1 Aims and methods
Australia's family law system and the 2006 and 2012 reforms continue to attract significant local and international interest (e.g., House of Commons Justice Committee, 2012; Mnookin, 2014; Schepard & Emery, 2013). Trends in court filings attract particular attention as they are thought to provide one indication of the extent to which the objective of encouraging parents to use non-court based mechanisms for resolving parenting disputes has been successfully implemented. The aim of the present inquiry is to extend the analysis of court filings provided by AIFS in the Evaluation of the 2006 Family Law Reforms (Kaspiew et al., 2009) with a view to considering some longer term effects of the 2006 measures. The research also provides some preliminary insights into the influence of the de facto property reforms, as well as emerging consequences of the 2012 reforms.7 These aims are consistent with AIFS' responsibility, as an entity established under Part XIVA of the Family Law Act 1975 (Cth) (FLA), to monitor developments in the family law area.
The present research involved obtaining and analysing administrative data held by the three courts through the submission of a research proposal to each of the courts' research committees. These data were extracted by court personnel from each court's CaseTrack system. Data for each financial year from 2009-10 to 2012-13 were provided by each court.8 The data reported in this report relate to the following issues:
- applications for final orders (categorised as children-only, property plus children, and property-only cases);
- matters involving self-represented litigants (data prior to 2009 available for FCoA and FCC only);9
- application for consent orders in the FCoA and FCoWA (categorised as children-only, property plus children, and property-only cases); and
- orders for Independent Children's Lawyers (ICLs).
An analysis combining these data with data previously provided to AIFS for the years 2004-05 to 2009-10 was then conducted. An analysis of property filings is presented for the first time.
Below are some explanations for key terms used in this report:
- Section 60I certificate: Under s 60I of the Family Law Act 1975 (Cth), parties are required to attempt family dispute resolution prior to lodging a court application for parenting orders (s 60I(1)). Certain exceptions to this requirement apply, including circumstances involving urgency and matters where there are reasonable grounds to believe there has been, or is a risk of, family violence or child abuse by one of the parties to the proceedings (s 60I(9)). Where these grounds are established, a court may hear a matter without an s 60I certificate being lodged (s 60I(7)). These matters are referred to as being heard under the exceptions to s 60I. Under s 60I(8), family dispute resolution practitioners are empowered to issue certificates on the basis that:
- one party attended family dispute resolution but the other didn't (s 60I(8)(a));
- the FDR practitioner assessed that the matter was not appropriate for family dispute resolution (s 60I(8)(aa));
- the parties attended family dispute resolution and made a genuine effort to resolve the dispute without success (s 60(8)(I)(b));
- family dispute resolution was attempted but one or both parties did not make a genuine effort to resolve the dispute (s 60I(8)(c)); or
- family dispute resolution was commenced and discontinued on the initiative of the FDR practitioner (s 60(8)(d)).
- Independent Children's Lawyers: These are legal practitioners appointed to panels maintained by legal aid commissions in each state and territory or directly employed by the legal aid commissions that administer funding for them. They are appointed to represent the best interests of children in particularly complex cases, including those involving serious allegations of family violence and child abuse. Recent research by AIFS (Kaspiew et al., 2013) has examined the role and efficacy of ICLs.
1.2 Limitations
The aim of this report is essentially descriptive in that it seeks to set out the present position in relation to court filings. It sheds light on one aspect of the continuing consequences of the 2006 family law reforms, together with the effects on court caseloads of the de facto property reforms. The analysis will be extended to cover the 2013-14 financial year as part of the Evaluation of the 2012 Family Violence Amendments, which will also examine the effects of these reforms on the family law system more widely and, most importantly, on the experiences of families affected by family violence and safety concerns.
Consideration of the broader context for some of the patterns highlighted in this research report - including numbers of self-represented litigants and the caseload distribution between the federal family law courts - would necessitate consideration of issues such as levels of legal aid and court resourcing and is beyond the scope of this exercise.
1.3 Structure of the report
The remainder of this report outlines the results of the analyses of the court data obtained for the FCoA, the FCC and the FCoWA in relation to cases involving applications for final orders in family law cases between the 2004-05 and 2012-13 financial years. More particularly:
- Section 2 outlines the distribution of applications for final orders across the different courts, categorised by whether they involved matters relating to children only, property only, or children and property (hereafter referred to as "children-plus-property"). Focusing primarily on cases involving children, these categories are used as appropriate in the sections that follow.10
- Section 3 considers matters involving applications for consent orders.
- Section 4 looks at cases in which an order for an ICL was made.
- The focus of Section 5 is on matters involving self-represented litigants (defined administratively by the courts as a matter where no legal representative was recorded for one or both parties the month after the application was lodged).11
- Finally, the main findings of the analyses are summarised in Section 6.
In each section, the analysis addresses three main points. The first is the national trend in overall filings in each category of matters. The second is the distribution of filings between the FCoA, the FCC and the FCoWA, and the third is the extent to which variations in patterns between the three courts are evident.
Footnotes
1 When the FCoA and FCC are referred to together in contradistinction to the Family Court of Western Australia, the term "the federal family law courts" is used.
2 These changes were part of the Family Law Amendment (Shared Parental Responsibility) Act 2006. This amending legislation introduced the requirement to attend family dispute resolution in s 60I of the Family Law Act 1975 (Cth). Section 60I(9) contains a number of exceptions relating mainly to concerns about family violence and child abuse and issues of urgency. The reform program also contained other significant changes, including the introduction of a presumption of equal shared parental responsibility and support for a raft of new and expanded relationship-focused services (see Kaspiew et al., 2009).
3 Family Law Amendment (De Facto Financial Matters and Other Measures) Act 2008 (Cth).
4 These changes were introduced by the Family Law Legislation Amendment (Family Violence and Other Measures) Act 2011 (Cth).
5 For more information, see the description for the Evaluation of the 2012 Family Violence Amendments project <www.aifs.gov.au/efva>, which involves a more detailed examination of court filings.
6 AIFS is grateful for the continuing support of the three courts, including Chief Justice Bryant (FCoA), Chief Judge Pascoe (FCC) and Chief Judge Thackray (FCoWA), and staff from their statistical services divisions: Dennis Beissner (FCoA and FCC) and Robyn Zuliani (FCoWA).
7 For a recent examination of post-separation property division, see Qu, Weston, Moloney, Kaspiew, and Dunstan (2014).
8 Data for the years 2004-05 to 2008-09 were already held by AIFS and these data have been used in this paper for consistency. Information from the FCoWA has shown that minor changes have been made to the data for these years due to updates being entered in the data administration system. These changes are minor in character and make little difference to the overall patterns reported in this paper.
9 The administrative definition of "self-represented" applied by the courts is where no legal representative is allocated against the application one month after it was lodged. Accordingly, this is the definition applied in this analysis.
10 Where the focus is on children's matters, the property-only category is not examined.
11 It should be borne in mind that some parties may become self-represented outside of this defined timeframe (e.g., at some other point in proceedings) and these cases are not represented in these data.
2. Final order applications
Table 2.1 reveals that across all courts for the entire period under review (the 2004-05 financial year through to the end of the 2012-13 financial year), filings for final orders with respect to children-only, children-plus-property, and property-only applications declined by 14%. It will be seen from Figure 2.1) that much of this decline occurred between the years 2006-07 to 2007-08. This was when the majority of Family Relationship Centres (FRCs) had come on line and therefore the first period in which the s 60I provisions requiring parents to use FDR were likely to have had a substantial effect.12 Table 2.1 also shows that applications decreased by 17% in the years 2004-05 to 2007-08 and then rose a little (2%) over subsequent years.
| Court | 2004-05 to 2012-13 (%) | 2004-05 to 2007-08 (%) | 2008-09 to 2012-13 (%) |
|---|---|---|---|
| Total FCoA & FCC | -15.1 | -18.2 | +2.4 |
| FCoA | -77.0 | -63.2 | -27.5 |
| FCC | +51.6 | +30.3 | +9.8 |
| FCoWA | -6.4 | -8.5 | -0.1 |
| Total all courts | -14.2 | -17.2 | +2.2 |
Compared to the federal family law courts, the FCoWA experienced smaller shifts in filing patterns during the above period. Thus, Table 2.1 reveals that the federal family law courts experienced a decline of 15% during the whole analysis period, a decline of 18% up to the year 2007-08, and an increase of 2% between that year and the end of the analysis period. This compares to declines for the FCoWA during the same intervals of time of 6%, 8%, and no appreciable change.
Table 2.1 also shows the very different filing profiles during these periods for the FCoA and FCC. Thus, up to 2007-08, FCoA applications declined by 63%, while FCC filings increased by 30%. In the period after 2007-08, the decline for the FCoA was 28%, while the increase for the FCC was 10%. Over the entire period under examination, FCoA applications fell by 77%, whereas those in the FCC rose by 52%.
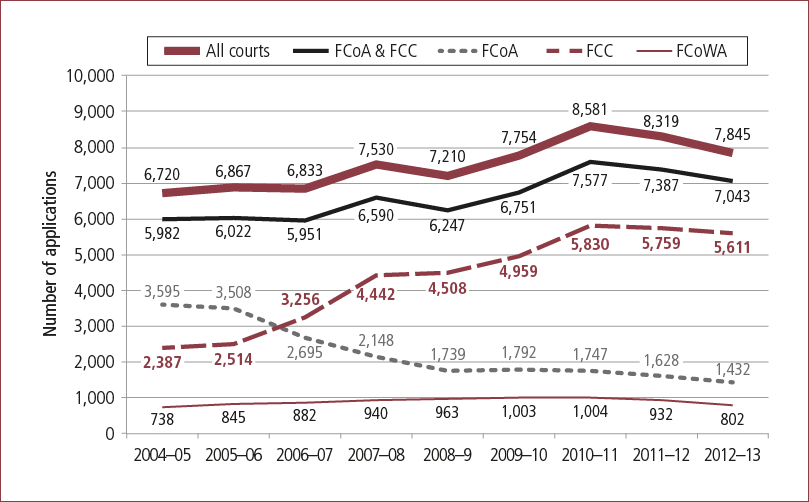
By presenting numerical data for each court on a year-by-year basis, Figure 2.1 permits a more detailed analysis of filing trends over time. In absolute terms, Figure 2.1 reveals that filings for all courts decreased from 25,908 in 2004-05 to 22,229 in 2012-13. The smallest number of filings (21,457) occurred in 2007-08. This coincided with the steepest decline in filings (4,256, or 17%) occurring between the previous years, 2006-07 to 2007-08.
Figure 2.1: Number of applications for final orders, by court, 2004-05 to 2012-13
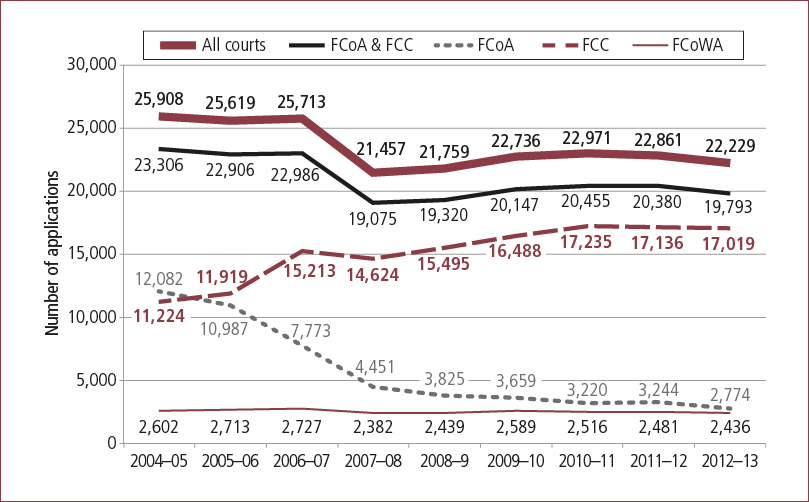
When considered together, the federal family law courts accounted for just under 90% (23,306 of a total of 25,908) of Australian filings during the year 2004-05 and just over 89% (19,793 of a total of 22,229) in 2012-13. The steepest declines in filings occurred the same period (between 2006-07 and 2007-08) in the combined federal family law courts and the FCoWA. For the combined federal courts, this represented a drop in applications of 3,911 (17%) and for the FCoWA, the drop was 345 (13%).
Figure 2.1 also provides a detailed analysis of an important aspect of the caseload distribution between the FCoA and the FCC.13 It will be seen that both courts began with similar numbers of filings in 2004-05 (12,082 for the FCoA and 11,224 for the FCC). From that time on, the gap between filing numbers in the two courts increased every year, so that by 2012-13, the FCoA had recorded 2,774 filings, whereas the FCC's filings had exceeded 17,000.
Figure 2.2 reveals that across all courts, 74% of applications in 2004-05 involved child-related matters (60% children-only and 14% children-plus-property). The first appreciable drop in the proportion of child-related applications occurred between 2006-07 and 2007-08. This period saw 65% of applications (55% children-only and 10% children-plus-property) in that category. There were relatively small increases and decreases in subsequent years, with 2012-13 again seeing 65% of applications for final orders in child-related cases.
Figure 2.2: Distribution of applications for final orders, by type of matter and court, 2004-05 to 2012-13
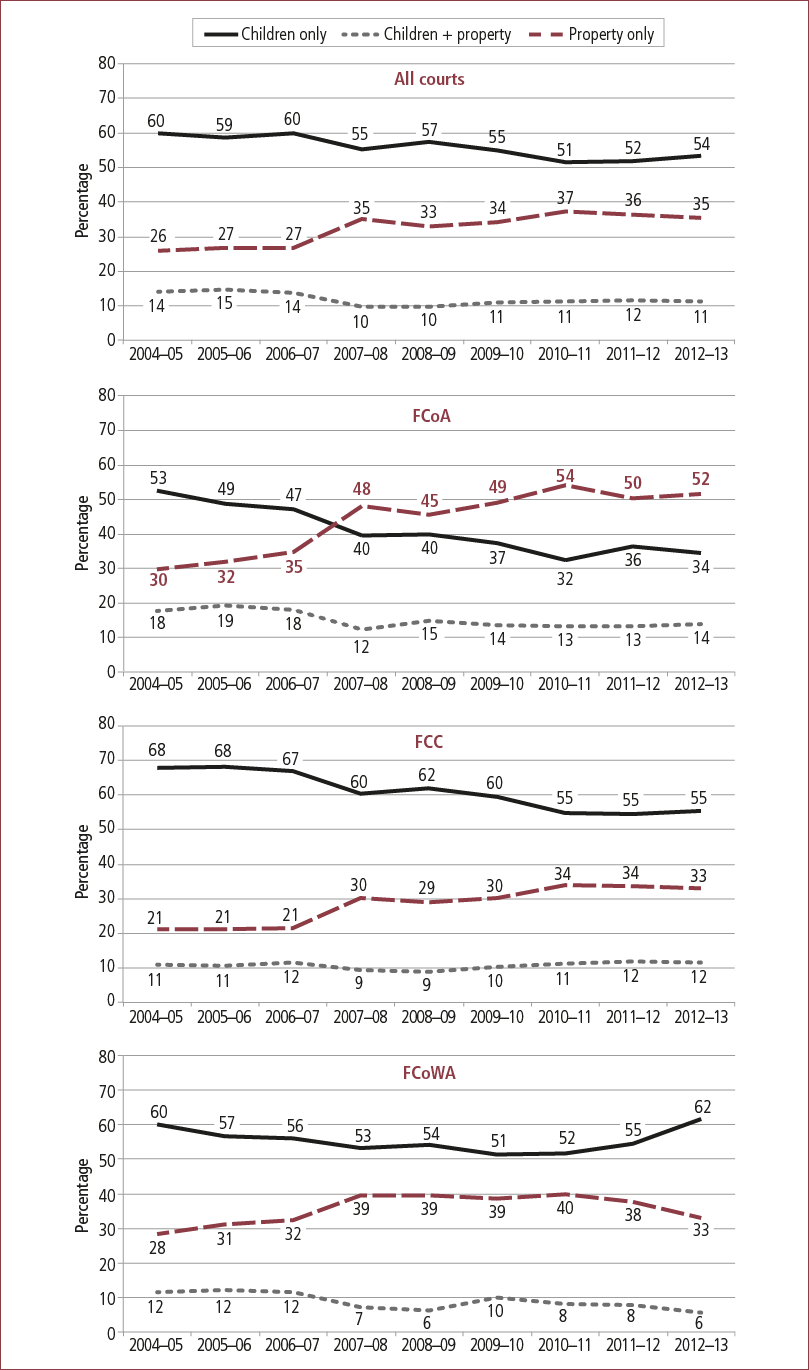
By way of contrast, property-only applications, which comprised 26% of filings in 2004-05, rose to 35% of filings between 2006-07 to 2007-08. Reflecting the pattern seen in children's matters, subsequent years saw relatively small fluctuations in property-only matters and an eventual return to the 2007-08 figure of 35% of applications in 2012-13.
In the full period under review, the proportion of applications for final orders involving children-only matters decreased overall by 18 percentage points (from 53% to 34%) in the FCoA and by 13 percentage points (from 68% to 55%) in the FCC. Applications involving children-plus-property decreased overall by only 4 percentage points (from 18% to 14%) in the FCoA and remained almost the same (11% to 12%) in the FCC. Finally, the proportion of property-only applications increased overall by 22 percentage points (from 30% to 52%) in the FCoA and by 12 percentage points in the FCC (from 21% to 33%).14
Trends in the distribution of the three types of applications filed in the FCoWA were less pronounced. The proportion of children-only applications increased by just 2 percentage points over the whole period, though a "dip" occurred in the middle period (to 51% of all applications in 2009-10). The proportion of matters involving children-plus-property decreased by 6 percentage points overall, with most of the decrease occurring in the first part of the reporting period. The proportion of property-only applications increased by 5 percentage points over the entire period, with a "spike" of 10-12 percentage points occurring over the years 2007-08 to 2011-12.
Finally, it is interesting to note that, as a proportion of all child-related matters, the FCoA was considerably more likely than the other courts to be dealing with applications involving children-plus-property matters. Across the period examined, the proportion of children-plus-property cases in the FCoA ranged between one in three and one in four. The proportion of children-plus-property cases in the FCC was lower, ranging from one in six to one in seven. The FCoWA recorded proportions similar to the FCC, mainly in the early years. In the latter years, however, the proportions tended to be appreciably lower. Indeed, only one in twelve child-related cases were in the children-plus-property category in 2012-13.
2.1.1 Summary
Across all three courts, applications for final orders in all three categories decreased by 17% in the period 2004-05 to 2007-08 and then rose marginally in the following period, up to 2012-13. Over the entire period, total applications for final orders in all three categories and across all courts decreased by 14%.
Each of the three courts saw a noticeable increase in the proportion of applications for final orders in property-only cases in the years 2006-07 to 2007-08 and a corresponding decrease in the proportion of applications in children's matters. Between 2007-08 and the end of the period under examination, the federal family law courts saw further modest increases in the proportion of property-only applications. This was accompanied by modest decreases in the proportion of children-only applications and small increases in the proportion of children-plus-property applications. During this same period, the FCoWA experienced an increase in the proportion of children-only cases but a small decrease in the proportion of children-plus-property applications. The proportion of property-only applications had returned to 2006-07 levels by the end of the period under examination.
When viewed separately, the pattern noted for each of the courts showed considerable variation with respect to the proportion of applications in children's matters found in the children-only and children-plus-property categories. By the end of the period of examination, for example, the proportion of children-plus-property applications comprised a little over one in three of the children's applications in the FCoA, almost one in six in the FCC and just over one in 12 applications in the FCoWA.
Finally the data reveal a large shift in the number of applications for final orders from the FCoA to the FCC. Though the bulk of this shift occurred in the period from 2005-06 to 2008-09, the trend continued, albeit at a considerably slower pace, between 2008-09 and 2012-13.
2.2 Trends in filings in child-related cases
The data summarised in Table 2.2 demonstrate that across all courts, applications for final orders in children-only and children-plus-property cases (children's matters) declined by 25% from 2004-05 to 2012-13. This was made up of an 84% decline in the FCoA and a 29% increase in the FCC (leading to an aggregate decline of 26%), and a 12% decline in the FCoWA.
| Court | 2004-05 to 2012-13 (%) | 2004-05 to 2007-08 (%) | 2008-09 to 2012-13 (%) |
|---|---|---|---|
| Total FCoA & FCC | -26.4 | -27.9 | -2.5 |
| FCoA | -84.2 | -72.9 | -35.7 |
| FCC | +29.1 | +15.2 | +3.8 |
| FCoWA | -12.3 | -22.6 | +10.7 |
| Total all courts | -25.0 | -27.4 | -1.1 |
Reference to Figure 2.3 shows that the steepest declines, both for the federal family law courts and the FCoWA, occurred between the years 2006-07 and 2007-08. This translates, as Table 2.2 illustrates, into a 27% decrease across all courts over the years 2004-05 to 2007-08. The largest percentage decline occurred in the FCoA, where filings over this period fell by 73%. Applications for final orders in the FCC increased by 15% over the corresponding time frame, resulting in an overall decrease of 28% across both the FCoA and FCC. Filings also decreased in the FCoWA, where there were 23% fewer applications in 2007-08 compared to 2004-05.
Figure 2.3: Number of applications for final orders in child-related cases, by court, 2004-05 to 2012-13
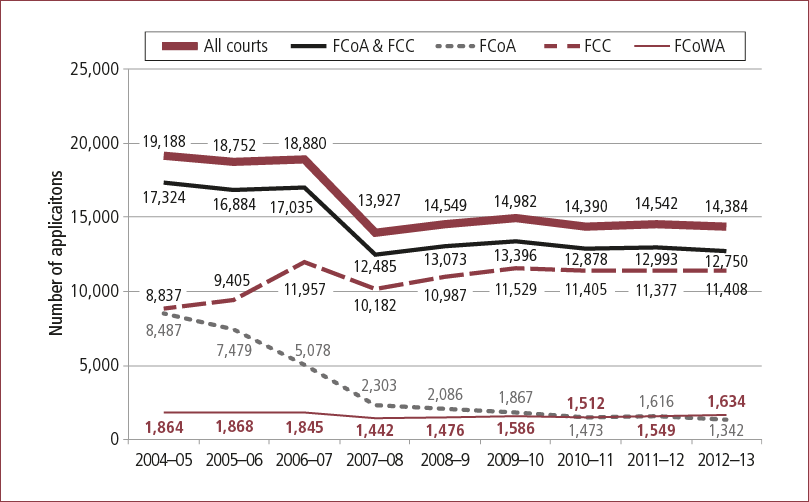
Across all courts, there was a decline of only 1% in applications in children's matters between 2008-09 and 2012-13. This was made up of a decline of 36% in the FCoA and an increase of 4% in the FCC (aggregate decline of 3%), and an 11% increase in applications to the FCoWA.
A more detailed inspection of Figure 2.3 reveals that the most rapid decline in combined court filings in children's cases amounted to a drop from 18,880 to 13,927 applications between 2006-07 and 2007-08. After that, applications rose and fell a little, culminating in a modest increase of 457 in 2012-13 from the 2007-08 low point.
Figure 2.3 also illustrates quite different patterns in the number of applications in child-related matters in the FCoA and FCC during the total period examined. The FCoA experienced a steady and substantial decline between 2004-05 and 2007-08 (from 8,487 to 2,303 applications). From that point, the decline continued at a considerably slower pace, reaching a relative low point of 1,342 applications in 2012-13. On the other hand, FCC applications rose considerably between 2004-05 and 2006-07. They dipped the following year, before rising a little in the two years after that and more or less flattening out after that time. Though absolute numbers for the FCoWA are considerably smaller, a noticeable dip can also be seen for applications in child-related matters between the years 2006-07 and 2007-08, followed by a modest rise by the end of the period under examination.
The courts' workload distribution in child-related matters can be clearly seen in Table 2.3. In 2004-05, the FCoA was dealing with 44% of these applications, the FCC with 46% and the FCoWA with the remaining 10%. The table shows a steady decline in the FCoA's percentage of work in this area (down to 9% in 2012-13) and a corresponding increase for the FCC (up to 79% in 2012-13). The proportion of FCoWA applications throughout this period remained similar, rising one percentage point overall to 11% in 2012-13.
| Court | 2004-05 (%) | 2005-06 (%) | 2006-07 (%) | 2007-08 (%) | 2008-09 (%) | 2009-10 (%) | 2010-11 (%) | 2011-12 (%) | 2012-13 (%) |
|---|---|---|---|---|---|---|---|---|---|
| FCoA | 44.2 | 39.9 | 26.9 | 16.5 | 14.3 | 12.5 | 10.2 | 11.1 | 9.3 |
| FCC | 46.1 | 50.2 | 63.3 | 73.1 | 75.5 | 77.0 | 79.3 | 78.2 | 79.3 |
| FCoWA | 9.7 | 10.0 | 9.8 | 10.4 | 10.1 | 10.6 | 10.5 | 10.7 | 11.4 |
| Total | 100.0 | 100.0 | 100.0 | 100.0 | 100.0 | 100.0 | 100.0 | 100.0 | 100.0 |
| No. of applications | 19,188 | 18,752 | 18,880 | 13,927 | 14,549 | 14,982 | 14,390 | 14,542 | 14,384 |
Note: Percentages may not total exactly 100.0% due to rounding.
2.3 Trends in filings for children-plus-property cases
Figure 2.4 reveals the numbers of child-related applications made to each court that also included applications for the division of property. For all courts combined, the lowest number of applications in this category occurred in 2007-08. This represents a decrease of 43% over the 2004-05 figures and a decrease of 45% over the highest combined figure of 3,737, which occurred in 2005-06. For all courts, there was a decrease of 32% in this category of applications (from 3,645 to 2,485) during the entire period examined, 2004-05 to 2012-13.
Figure 2.4: Number of applications for final orders in children-plus-property cases, by court, 2004-05 to 2012-13
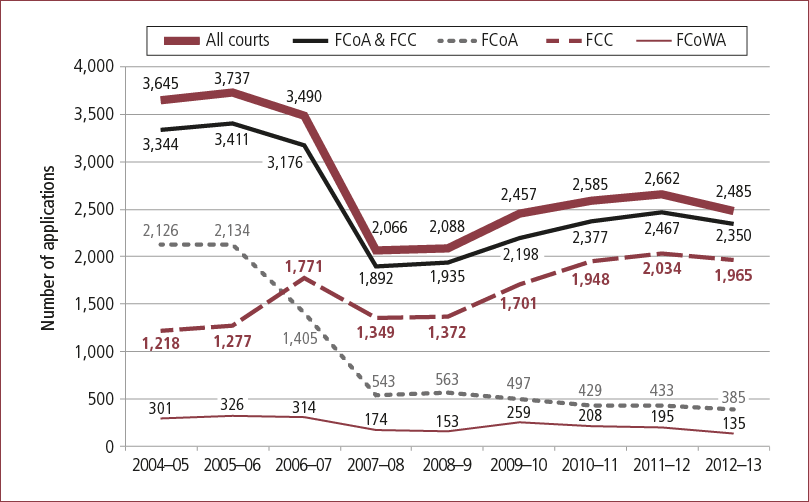
Focusing on the federal family law courts, the lowest number of applications in the children-plus-property category also occurred in 2007-08. This represented a decrease of 43% with respect to the 2004-05 figures and a decrease of 45% with respect to the highest combined figure of 3,411, again recorded in the year prior to the 2006 reforms. For both courts, the number of applications at 2012-13 represents an increase of 24% from the low point recorded in 2007-08, but a decrease of 30% with respect to the 3,344 applications recorded in 2004-05, and a decrease of 31% with respect to the highest figure (3,411) recorded in the year prior to the 2006 reforms (2005-06).
Focusing on the differences between the FCoA and the FCC, it can be seen that the first year of recorded data (2004-05) saw the FCoA dealing with 2,126 of 3,344 (almost two-thirds) of children-plus-property cases. Two years later (2006-07), this proportion had slipped to 44% (1,405 of 3,176) and the following year to 29% (543 of 1,892). By 2012-13, the FCoA proportion of children-plus-property cases represented only 16% (385 of 2,350) of the cases handled by both courts.
For the FCoWA, there was also a pronounced decrease of 42% in applications for children-plus-property between 2004-05 and 2007-08, and further decrease of 7% the following year. The figures rose appreciably the year after that, but once again began to decline, reaching their lowest point of all in the final year of the period under examination. As with the other courts, the highest percentage of FCoWA applications in this category occurred in 2005-06. There was a 55% decrease in these applications during the entire examination period and a 59% decrease with respect to the highest figure of 326, recorded in 2005-06.
Table 2.4 reveals that across all courts, the proportion of applications for final orders related to property-only matters during the period under examination rose from about a quarter (26%) to a little over a third (35%). The proportion of applications related to children-plus-property was highest in the early part of the period under examination (14-15%), lowest in the period immediately after the reforms (10%) and rose a little (11-12%) in subsequent years. The proportion of applications in children-only matters was also highest in the early part of the period under examination (59-60%), fell to 55% in the year after the 2006 reforms, rose a little in the following year and then settled to between 51% and 55% in subsequent years.
| Cases | 2004-05 (%) | 2005-06 (%) | 2006-07 (%) | 2007-08 (%) | 2008-09 (%) | 2009-10 (%) | 2010-11 (%) | 2011-12 (%) | 2012-13 (%) |
|---|---|---|---|---|---|---|---|---|---|
| All cases | |||||||||
| Children-only | 60.0 | 58.6 | 59.9 | 55.3 | 57.3 | 55.1 | 51.4 | 52.0 | 53.5 |
| Children-plus-property | 14.1 | 14.6 | 13.6 | 9.6 | 9.6 | 10.8 | 11.3 | 11.6 | 11.2 |
| Property-only | 25.9 | 26.8 | 26.6 | 35.1 | 33.1 | 34.1 | 37.4 | 36.4 | 35.3 |
| Total | 100.0 | 100.0 | 100.0 | 100.0 | 100.0 | 100.0 | 100.0 | 100.0 | 100.0 |
| No. of applications | 25,908 | 25,619 | 25,713 | 21,457 | 21,759 | 22,736 | 22,971 | 22,861 | 22,229 |
| Child-related cases | |||||||||
| Children-only | 81.0 | 80.1 | 81.5 | 85.2 | 85.6 | 83.6 | 82.0 | 81.7 | 82.7 |
| Children-plus-property | 19.0 | 19.9 | 18.5 | 14.8 | 14.4 | 16.4 | 18.0 | 18.3 | 17.3 |
| Total | 100.0 | 100.0 | 100.0 | 100.0 | 100.0 | 100.0 | 100.0 | 100.0 | 100.0 |
| No. of applications | 19,188 | 18,752 | 18,880 | 13,927 | 14,549 | 14,982 | 14,390 | 14,542 | 14,384 |
Note: Percentages may not total exactly 100.0% due to rounding.
With respect to all child-related cases, the lower part of Table 2.4 reveals that children-plus-property applications represented a little under a fifth of the applications for the first three years of the examination period (19-20%), dropped to around one in seven applications in the two years following the 2006 reforms (14-15%), and again rose to about one in six applications (17%) by the end of the examination period.
The total number of applications in child-related cases changed only slightly in the first three years of the examination period and then fell by 26% (from 18,880 to 13,927) in the year after the 2006 amendments. As previously noted, during the entire period under examination, the number of child-related applications fell by 25% (from 19,188 to 14,384).
Table 2.5 summarises the distribution of applications for final orders in all child-related matters in all three courts during the total period under examination. The table shows a decline in the number of child-related applications during the first three years for the FCoA from 8,487 to 7,479 to 5,078 and a corresponding increase for the FCC from 8,837 to 9,405 to 11,957. During this period, therefore, the total number of applications in these two courts fell marginally, by 289 (from 17,324 to 17,035). FCoWA application numbers during the same period also varied only marginally.
| Court | 2004-05 | 2005-06 | 2006-07 | 2007-08 | 2008-09 | 2009-10 | 2010-11 | 2011-12 | 2012-13 |
|---|---|---|---|---|---|---|---|---|---|
| FCoA | |||||||||
| Children-only | 6,361 | 5,345 | 3,673 | 1,760 | 1,523 | 1,370 | 1,044 | 1,183 | 957 |
| Children-plus-property | 2,126 | 2,134 | 1,405 | 543 | 563 | 497 | 429 | 433 | 385 |
| Total | 8,487 | 7,479 | 5,078 | 2,303 | 2,086 | 1,867 | 1,473 | 1,616 | 1,342 |
| FCC | |||||||||
| Children-only | 7,619 | 8,128 | 10,186 | 8,833 | 9,615 | 9,828 | 9,457 | 9,343 | 9,443 |
| Children-plus-property | 1,218 | 1,277 | 1,771 | 1,349 | 1,372 | 1,701 | 1,948 | 2,034 | 1,965 |
| Total | 8,837 | 9,405 | 11,957 | 10,182 | 10,987 | 11,529 | 11,405 | 11,377 | 11,408 |
| FCoWA | |||||||||
| Children-only | 1,563 | 1,542 | 1,531 | 1,268 | 1,323 | 1,327 | 1,304 | 1,354 | 1,499 |
| Children-plus-property | 301 | 326 | 314 | 174 | 153 | 259 | 208 | 195 | 135 |
| Total | 1,864 | 1,868 | 1,845 | 1,442 | 1,476 | 1,586 | 1,512 | 1,549 | 1,634 |
By the following year (2007-08), the number of child-related applications in the FCoA fell by 2,775 (55%), while the number of applications in the FCC fell by 1,775 (15%). The combined federal family law courts experienced an overall fall in that period of 4,550 (27%). The equivalent figure for the FCoWA was 403 (22%).
In the remaining period (to 2012-13), the number of applications for children's matters in the FCoA fell by a total of 961, while the number in the FCC during the same period rose by 1,226, a net gain of 265 (2%). The net increase in applications for the FCoWA during the same period was 192 (13%). Thus the net increase in applications in children's matters for all courts during this period was 467 (3%).
Finally, during the period under examination, the children-plus-property cases comprised between 24% and 29% of the child-related applications in the FCoA, between 12% and 18% of the FCC and between 8% and 17% in the FCoWA. There was no appreciable pattern with respect to how these proportions varied in each court from year to year.
2.3.1 Summary
The evidence presented in sections 2.2 and 2.3 suggests that the requirement to use FDR in disputes involving children is likely to have had an appreciable influence on the number of applications for final orders made in both children-only and children-plus-property matters. This is most clearly seen in the substantial reduction in applications that occurred between 2006-07 and 2007-08, the first period in which the effects of the 2006 reforms could be realistically expected to operate (see footnote 12 for a more detailed explanation). Across all courts combined, the number of post-reform applications for final orders in children's cases rose only a little from its low point, observed in 2007-08.
The proportions of children's cases consisting of children-plus-property applications were considerably higher in the FCoA in all the years considered. The reason for this is unclear. A possible explanation is that such cases more commonly meet the most relevant of the criteria required to justify a hearing in the FCoA - that the matter is likely to take more than four days to be heard.15
2.4 Trends in filings for property-only cases
In contrast to the overall reduction in filings for orders relating to children, Table 2.6 reveals that filings in relation to final orders for property only increased by 17% across the three courts over the period under examination between 2004-05 and 2012-13. It can be seen from Figure 2.5, that the sharpest increase of 1,371 cases (19%) occurred over the period between 2008-09 and 2010-11. This increase was not fully sustained, however. Indeed the final two years of the examination period recorded a modest decrease in these applications of 736 (9%).
| Court | 2004-05 to 2012-13 (%) | 2004-05 to 2007-08 (%) | 2008-09 to 2012-13 (%) |
|---|---|---|---|
| Total FCoA & FCC | +17.7 | +10.2 | +12.7 |
| FCoA | -60.2 | -40.3 | -17.7 |
| FCC | +135.1 | +86.1 | +24.5 |
| FCoWA | +8.7 | +27.4 | -16.7 |
| Total all courts | +16.7 | +12.1 | +8.8 |
The large increase in property filings in the period 2008-09 to 2010-11 reflects the effects of legislation introduced in 2008 that allowed de facto financial matters to be dealt with under the Family Law Act 1975 (Cth) in federal courts rather than in state- and territory-based systems.16 An expectation that this change would have significant implications for the FCoA and FCC (which operate entirely within the federal jurisdiction), finds support in the increase in these courts of 1,330 property-only cases (21%) between 2008-09 and 2010-11. The corresponding increase in the FCoWA of only 41 applications represents a far more modest upward trend of 4%.17
Consistent with the trend in child-related matters, the relative distributions of filings between the FCC and the FCoA widened in favour of the FCC throughout the period being examined. Table 2.6 shows a 60% decrease in property-only applications to the FCoA during the full period under examination, compared to a 135% increase in the FCC, which sums to an 18% increase for the combined courts. The widening gap between the number of applications to the two federal family law courts is graphically illustrated in the diverging lines in Figure 2.5. Over the full period under examination, the FCoWA experienced a 9% increase in these applications.
Figure 2.5: Number of applications for final orders in property-only cases, by court, 2004-05 to 2012-13
Footnotes
12 Arguments supporting this conclusion include that: the legislation did not take effect until July 2006; a time lag would have existed whereby cases proceeding under the old legislation would require time to be disposed of; and, at the time the legislation took effect, only 15 of the planned 65 FRCs had come on line (the remaining centres being rolled out over the next two years), and FRCs have been shown to provide the majority of FDR (see the findings from the AIFS evaluation of the 2006 reforms [Kaspiew et al., 2009] and the second and third waves of the Longitudinal Study of Separated Families [Qu & Weston, 2010; Qu et al., 2014]).
13 The criteria applied to determine whether a matter is heard in the FCoA or the FCC are set out in an agreed protocol between the courts. See "Protocol for the division of work between the Family Court of Australia and the Federal Circuit Court of Australia" on the Applying to the Courts web page, available at <tinyurl.com/naheaoe>.
14 Until 2006, the FCC (then the FMC) only had jurisdiction over property disputes under $300,000. This monetary limit was lifted through the repeal of FLA s 45A (Family Law Amendment (Shared Parental Responsibility) Act 2006 (Cth)). Notably, the trend for an increased share of the property filings being dealt with in the FCC commenced in 2006-07.
15 See point eight in "Protocol for the division of work between the Family Court and the Federal Circuit Court" on the Applying to the Courts web page: <tinyurl.com/naheaoe>.
16 The start date for the main provisions of the amendments to the Family Law Act 1975 (Cth) introduced by the Family Law Amendment (De Facto Financial Matters and Other Measures) Act 2008 (Cth) was 1 March 2009. In December 2011, it emerged that the Family Law Amendment (De Facto Financial Matters and Other Measures) Act 2008 (Cth) had not been proclaimed and was therefore not effective. Legislation correcting this and retrospectively validating orders made in this period was enacted early in 2012 through the Family Law Amendment (Validation of Certain Orders and Other Measures) Act 2012 (Cth) (assented on 10 April 2012).
17 Since 1997 in the FCoWA, state-based legislation governing de facto matters - the Family Court Act 1997 (WA) (Part 5A) - has largely approximated the provisions of the Family Law Act 1975 (Cth). However, the power to make orders in relation to the property and financial interests of opposite-sex and same-sex de facto couples was vested in the Family Court of Western Australia in 2002 through the insertion of s 205Z into the Family Court Act 1997 (WA) via the Family Court Amendment Act 2002 (WA), s 47.
3. Applications for consent orders
The analysis in this section concerns applications for consent orders where this is the originating application. Under reg 10.15 of the Family Law Rules 2004, such orders may be presented to the court for endorsement by a registrar in chambers through a process available only in the Family Courts (the FCoA and FCoWA). A second type of consent order may arise after an application has been lodged with a court for final orders and agreement is reached prior to the matter being determined by a court.18 The consent orders are then presented to a judicial officer for consideration and endorsement. As the analysis in this section covers only reg 10.15 orders, the data are drawn only from the FCoA and FCoWA.
Figure 3.1 reveals that the number of consent orders in the FCoA in 2012-13 (11,316) is not dissimilar to the figure recorded in 2004-05 (11,617). Similarly, the overall number of consent orders in the FCoWA has remained relatively constant between 2006-07 and 2012-13 (2,464 and 2,398, respectively). Figure 3.1 also reveals some fluctuation in the numbers of consent orders over the data collection period, which are considered below.
Figure 3.1: Number of applications for consent orders, FCoA and FCoWA, 2004-05 to 2012-13
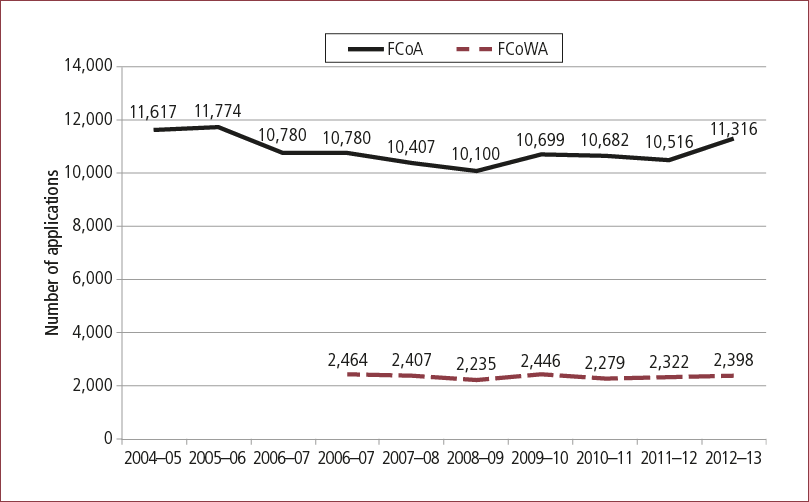
Note: Data prior to 2006-07 are not available for FCoWA.
As shown in Table 3.1, between 2004-05 and 2012-13, while consent orders for property-only matters increased by 16%, the number of children-only and children-plus-property consent orders both decreased (by 24% & 37%, respectively). From 2006-07 to 2012-13, looking at both the FCoA and FCoWA data combined, a similar pattern emerged, though the variation was slightly different in each court.
| 2004-05 to 2012-13 (%) | 2006-07 to 2012-13 (%) | 2006-07 to 2008-09 (%) | 2008-09 to 2011-12 (%) | 2011-12 to 2012-13 (%) | |
|---|---|---|---|---|---|
| FCoA | |||||
| Property-only | +16.3 | +20.2 | -8.1 | +17.3 | +11.5 |
| Children-plus-property | -36.5 | -24.8 | -20.6 | -12.1 | + 7.7 |
| Children-only | -24.2 | -15.2 | +10.5 | -18.4 | -6.0 |
| All consent orders | -2.6 | -5.0 | -6.3 | +4.1 | +7.6 |
| FCoWA | |||||
| Property-only | +11.8 | 0.0 | +7.3 | +4.2 | |
| Children-plus-property | -31.3 | -36.9 | -11.7 | -23.3 | |
| Children-only | -52.8 | -31.9 | -8.6 | -24.1 | |
| All consent orders | -2.7 | -9.3 | +3.9 | +3.3 | |
| Total FCoA & FCoWA | |||||
| Property-only | +18.4 | +6.4 | +15.0 | +9.9 | |
| Children-plus-property | -25.8 | -23.1 | -12.1 | +9.7 | |
| Children-only | -19.9 | -5.2 | -17.6 | -7.6 | |
| All consent orders | +3.5 | -6.9 | +4.1 | +6.8 | |
Note: Data prior to 2006-07 are not available for FCoWA.
Further, though the overall trends throughout the period analysed show property-only consent orders have increased and children-only consent orders have decreased, the period between 2006-07 and 2008-09 tells a different story in the FCoA, with an 8% decrease in property-only consent orders and an increase of 11% in children-only consent orders. Similar change was not seen in the FCoWA, where the number of property-only consent orders was the same in 2008-09 as it was in 2006-07 and children-only cases continued to decrease (32% during this period).
From 2008-09 to 2011-12, the number of child-related consent orders decreased in both the FCoA and FCoWA, with children-only cases decreasing by 18% and children-plus-property cases by 12%, overall. In the FCoA, the number of children-only cases dropped by 18% and children-plus-property cases by 12%. In the FCoWA, the decreases were less pronounced, with 9% and 12%, respectively.
However, between 2011-12 and 2012-13, the FCoA and FCoWA experienced noticeably different patterns. While the FCoWA experienced a 24% decrease in children-only consent orders and a 23% decrease in those related to children-plus-property, the FCoA saw a 6% decrease in children-only consent orders, yet an 8% increase in children-plus-property consent orders.
Figure 3.2 shows that although the number of property-only cases in the FCoA decreased steadily between 2004-05 to 2008-09 (11% overall during this time, from 6,870 to 6,108), the years that followed saw a fairly rapid increase. Notably, the number rose by 804 from 2008-09 to 2009-10 alone, to a six-year high of 6,912 (a 13% increase), and continued this upward trend over the period to 2012-13, when a total of 7,989 consent orders were filed in the FCoA.
Figure 3.2: Number of applications for consent orders, by type of matter, FCoA and FCoWA, 2004-05 to 2012-13
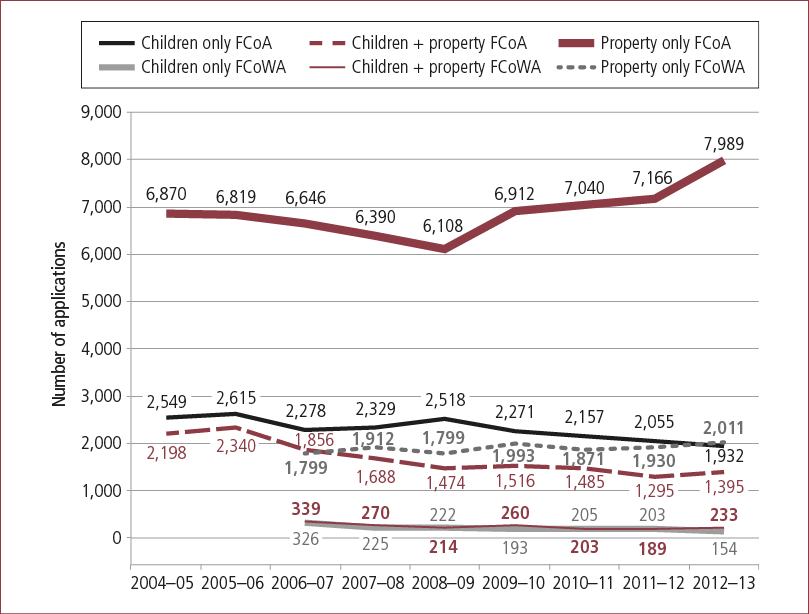
Note: Data prior to 2006-07 are not available for FCoWA.
Figure 3.2 also reveals that although the largest shift in percentage terms (37%) can be found in a downward shift in consent order applications in FCoA children-plus-property cases, this was off a relatively low base of 2,198 cases. The next largest percentage shift (24%), also downward, occurred in FCoA children-only cases, also off a low number of cases (2,549). Property-only cases experienced the largest change in absolute terms (1,119) but, due to the large number of applications at the outset, the most modest change in percentage terms - in this case an increase of 16%, as mentioned above, which is accounted for by the increases that occurred between 2008-09 and 2012-13.
The slow but steady decrease in applications for consent orders in children's matters after 2008-09 may reflect greater use of family dispute resolution and a policy preference for parenting plans over consent orders that was reflected in the 2006 amendments. Such parenting plans, which are non-registrable and not enforceable in the current regime, override earlier court orders (FLA s 64D). 19
Figure 3.3 shows the distribution of applications for consent orders made to the FCoA by the type of matter for which orders were sought between 2004-05 and 2012-13. The data reveal a gradual increase (from 59% to 71%) during this period in the proportion of applications for consent orders that were property-only cases. This is offset by modest decreases in the proportion of applications for consent orders involving children-plus-property cases (from 19% to 12%) and in children-only cases (from 22% to 17%).
Figure 3.3: Proportion of consent orders, by type of matter, FCoA, 2004-05 to 2012-13
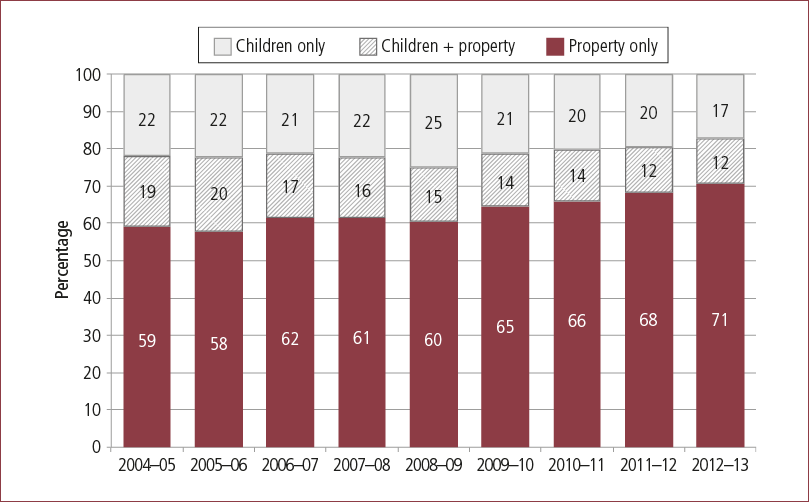
The proportion of consent orders sought for applications in children's matters began to decline a little in 2006-07. It rose a little in the following two years before beginning and sustaining a steady decline in subsequent years. The proportion of consent orders sought for matters involving children-plus-property was in slow but steady decline for almost the entire period under examination.
The distribution of consent order applications in the FCoWA by type of matter is shown in Figure 3.4. The results show that between 2006-07 and 2012-13, the proportion of property-only related consent orders increased by 11 percentage points (from 73% to 84%). The most notable change in the number of child-related consent orders in the FCoWA occurred between 2006-07 and 2007-08, when the proportion of children-plus-property cases decreased from 14% to 11%, and children-only cases from 13% to 9%. The proportion of children-plus-property and children-only consent orders fluctuated slightly between 8% and 11% in the period following, up to 2012-13, when the proportion of children-only consent orders decreased to 6% of all consent orders (with children-plus-property consent orders making up 10% of cases).
Figure 3.4: Proportion of consent orders, by type of matter, FCoWA, 2004-05 to 2012-13

Note: Data prior to 2006-07 are not available for FCoWA.
Footnotes
18 See Family Law Rules 2004, reg 10.15(1), and Federal Circuit Rules 2001, reg 13.04.
19 Note that the court may, in exceptional circumstances, include in a parenting order a provision that the parenting order, or a specified provision of the parenting order, may only be varied by a subsequent order of the court (and not by a parenting plan). See s 64D(2) of the Family Law Act 1975 (Cth).
4. Independent Children's Lawyers orders
Table 4.1 and Figure 4.1 reveal that orders made for ICLs in child-related cases increased by 359 (11%) between 2004-05 and 2012-13. Within this period, however, substantial increases in orders occurred in 2005-06 and 2006-07, ahead of a two-year levelling off in 2007-08 and 2008-09. A steep decline then occurred between 2008-09 and 2009-10, followed by a modest rise in the subsequent years.
| Court | 2004-05 to 2012-13 (%) | 2004-05 to 2007-08 (%) | 2009-10 to 2012-13 (%) |
|---|---|---|---|
| Total FCoA & FCC | -1.2 | -41.2 | +0.9 |
| FCoA | +79.1 | -47.3 | -40.3 |
| FCC | +72.7 | -125.1 | +9.5 |
| FCoWA | - | - | +54.9 |
| Total all courts | +10.8 | -41.2 | +4.8 |
Note: Data prior to 2008-09 are not available for the FCoWA.
Figure 4.1: Number of orders for ICLs, by court, 2004-05 to 2012-13

Note: Data prior to 2008-09 are not available for the FCoWA, resulting in the total for all courts prior to 2009-10 being the same as the combined total for FCC and FCoA.
Because data for the FCoWA are not available for the period prior to 2008-09, the combined number of orders for the FCoA and FCC is identical to the total number of orders in all courts up to that point in time. The familiar pattern of relative increases in orders made by the FCC and decreases in orders made by the FCoA can again be seen in the data presented in Figure 4.1. In absolute terms, the gap is greatest in 2008-09 (a difference of 3,100). It closes by a third in 2009-10, and then shows a tendency to again widen in subsequent years. For the federal family law courts, there is little recovery in the number of orders from the low point in 2010-11 (a total of 3,194). Most of the overall growth in those subsequent years across all courts comes from the modest but steady increase in orders made by the FCoWA (up 55% in 2012-13 from 257 in 2009-10).
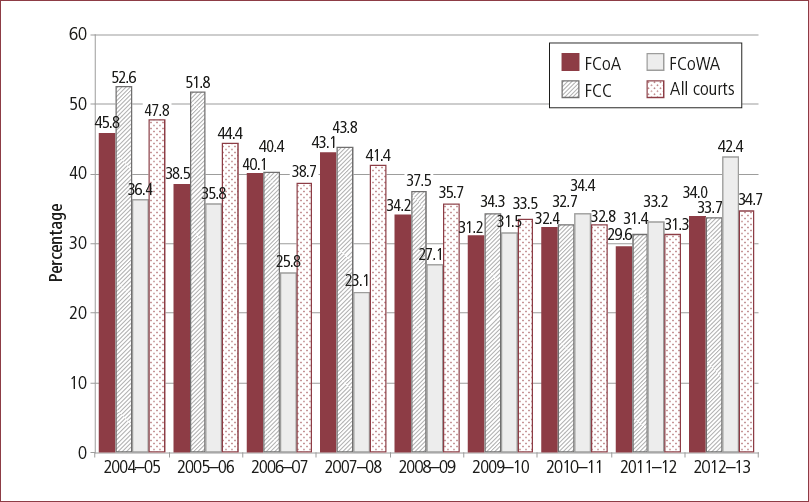
Figure 4.2 shows that in proportionate terms, orders for ICL representation were made in around a quarter of cases involving children in 2012-13 in each court. During the three preceding years, the proportions of ICL orders made in each court were more varied. No clearly discernable pattern is apparent during this time. The FCoWA had lower proportions in the earlier years, but by the end of the period under examination, had effectively closed the gap.
Figure 4.2: ICL orders as a proportion of applications for final orders in child-related cases, by court, 2004-05 to 2012-13
Note: Data prior to 2008-09 are not available for the FCoWA.
In broad terms, the data reveal that over the period under examination here, ICLs were ordered in about one in four child-related cases, from a low point of one in five cases prior to the commencement of the 2006 reforms, rising for a brief period to close to two in five cases and settling in recent years to an average of one in four cases.
5. Matters involving self-represented litigants
The analysis shows some fluctuation in the nine-year trend in relation to self-represented litigants in family law matters, with a downward trend between 2004-05 and 2008-09, followed by little movement for the period 2008-09 to 2011-12, ahead of a slight increase in 2012-13 (Figure 5.1). The number of final order applications that involved self-represented litigants in all courts between 2004-05 and 2011-12 decreased by 42%, but then increased slightly (by 8%) to 7,716 in 2012-13.
Figure 5.1: Number of filings involving self-represented litigants in all family law matters, by court, 2004-05 to 2012-13
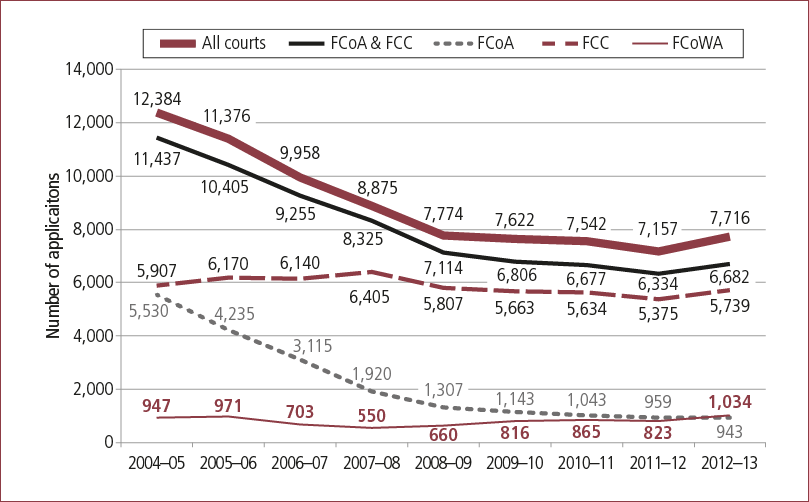
The number of self-represented litigants in the FCC remained fairly steady from 2004-05 to 2012-13, with between 5,375 and 6,405 litigants representing themselves each year during this period. The FCoA experienced a decrease of 79% in the number of self-represented litigants between 2004-05 and 2009-10, after which the number decreased at the considerably slower rate of 17% between 2009-10 and 2012-13 The likely explanation for this is the caseload distribution between the FCC and FCoA, and the latter court's focus on more complex cases.
Between 2004-05 and 2007-08, the self-represented litigants who filed applications for final orders in the FCoWA decreased by 42% to 550. However, the years after that have seen a steady increase to 943 litigants, which is almost identical to 2004-05.
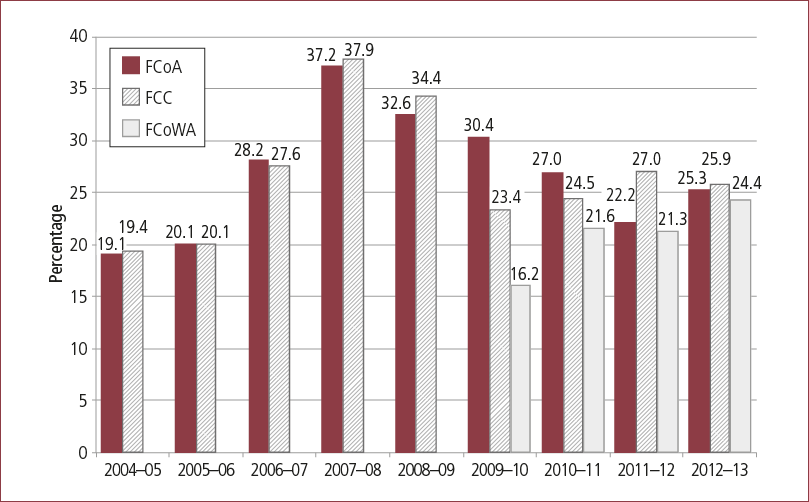
Figure 5.2 reveals that the number of self-represented litigants as a proportion of all applications for final orders in both the FCoA and the FCC decreased from 46% and 53% respectively in 2004-05 to 34% in each court in 2012-13.
Figure 5.2: Matters involving self-represented litigants as a proportion of all applications for final orders, by court, 2004-05 to 2012-13
FCoWA data reveal a different trend, having appreciably lower proportions of self-represented litigants than the other courts in 2004-05 (36%) and even lower proportions in the years immediately following the 2006 amendments (26%, 23% and 27%), but a considerably higher proportion (42%) in 2012-13.
6. Summary and conclusion
This research report examines patterns in court filings across the three family law courts between 2004-05 and 2012-13. The patterns evident in the analysis reflect the effects of a series of legislative changes that took place in the period covered, as well as substantial shifts in the distribution of filings between the Federal Circuit Court of Australia and the Family Court of Australia. In the final financial year covered by this analysis, the share of filings stood at 86% for the FCC and 14% in the FCoA. In the Family Court of Australia's (2013) Annual Report 2012-13, the Chief Justice, The Hon. Diana Bryant, commented on the shift in caseload toward the Federal Circuit Court in the period covered by this analysis, observing that: "this has resulted in the Family Court becoming a smaller court which manages all appeals and deals with the most complex family law matters" (p. 3).
In other areas, overall decreases in filings involving children almost certainly reflect the effects of the 2006 family law reforms, particularly the introduction of stronger legislative support and greater resourcing in the community sector for family dispute resolution. The sharp decreases in filings evident after the 2006 reforms in matters involving children and children-plus-property were sustained until 2009-10, and have since stabilised to reflect a decrease of some 25% since 2004-05. Court filings for all categories of applications decreased during this period by 14%.
The analysis also highlights the likely effects of the de facto property reforms, with a 17% increase in property-only matters evident nationally. The increase in caseload in the federal system for property matters is reflected in applications for final orders and applications for consent orders.
A further substantial shift in property applications is evident in the increased proportion of property matters dealt with in the FCC following the repeal in 2006 of the monetary cap on its jurisdiction in property matters. Even with this shift, property matters now dominate the FCoA caseload, which is comprised of 52% property-only matters (cf. 30% in 2004-05), 14% children-plus-property (cf. 18%), and 34% children-only (cf. 53%). In the FCC, the relative distribution of property and children's matters is the reverse of that in the FCoA (55% children-only, 12% children-plus-property and 33% property-only). The reversal evident in the distribution of these matters within the caseload of the FCoA over the total period examined is not evident in the FCC caseload, where, in 2004-05, children-only matters represented 68% of the caseload, children-plus-property 11% and property-only 21%.
There has been a decrease in the percentage of applications for consent orders in children's matters. This may reflect greater use of FDR, combined with a policy preference for parenting plans, which have the capacity to be more flexible than consent orders and to override earlier consent orders.
It would be important to explore the extent to which the data on the use of ICLs mainly reflect availability of funding for these practitioners at each of the periods of time examined. The data presented in this report do not speak to questions of complexity and risk. However, while courts are handling fewer child-related disputes (almost certainly linked to the availability of and default requirement to use FDR and other family relationship services), anecdotal evidence suggests an increase in the proportion of "difficult" cases requiring judicial decisions. If this is the case, an important question to be further pursued is the extent to which the parents and children using the courts, many of whom are likely to be caught up in cycles of violence, addiction issues and serious mental health problems, are being supported legally, emotionally and forensically.
There is fluctuation in the numbers of self-represented litigants. In the federal family courts, a 42% decrease between 2004-05 and 2011-12 was followed by an 8% increase in the final year examined. In the FCoWA, there was a considerably lower percentage or self-represented litigants at the beginning of the period under examination (compared to the other two courts), and a considerably higher proportion at the end; however, this was still less than the proportions experienced by the federal family law courts at the beginning of examination period.
As noted at the outset, the purpose of the analysis in report is essentially descriptive, in line with the intention of providing an update on the discussion of court filings in the Evaluation of the 2006 Family Law Reforms report (Kaspiew et al., 2009). Features of the broader policy context - including the effects of resourcing levels for legal aid and the courts - are beyond the scope of this exercise. Nonetheless, in providing a synthesised analysis of national data on family law filings, this report provides insight into a key aspect of the operation of the family law system and a snapshot of important trends in recent years.
7. References
- De Maio, J., Kaspiew, R., Smart, D., Dunstan, J., & Moore, S. (2013). Survey of recently separated parents: A study of parents who separated prior to the implementation of the Family Law Amendment (Family Violence and Other Matters) Act 2011. Melbourne: Australian Institute of Family Studies.
- Family Court of Australia. (2013). Annual report 2012-13. Canberra: FCoA.
- House of Commons Justice Committee. (2012). Pre-legislative scrutiny of the Children and Families Bill: Fourth report of session 2012-13. Volume I: Report, together with formal minutes, oral and written evidence (HC 739). London: The Stationery Office.
- Kaspiew, R., Carson, R., Moore, S., De Maio, J., Deblaquiere, J., & Horsfall, B. (2013). Independent Children's Lawyers Study: Final report. Melbourne: Australian Institute of Family Studies.
- Kaspiew, R., De Maio, J., Deblaquiere, J., & Horsfall, B. (2012). Evaluation of a pilot of legally assisted and supported family dispute resolution in family violence cases: Final report. Melbourne: Australian Institute of Family Studies.
- Kaspiew, R., Gray, M., Weston, R., Moloney, L., Hand, K., Qu, L., & The Family Law Evaluation Team. (2009). Evaluation of the 2006 family law reforms. Melbourne: Australian Institute of Family Studies.
- Mnookin, R. (2014). Child custody revisited. Law and Contemporary Problems, 77, 249-270.
- Moloney, L. (2012). Family mediation: Confidence, culture and cooperation. Journal of Family Studies, 17(3), 178-185.
- Qu, L., & Weston, R. (2010). Parenting dynamics after separation: A follow-up study of parents who separated after the 2006 family law reforms. Melbourne: Australian Institute of Family Studies.
- Qu, L., Weston, R., Moloney, L., Kaspiew, R., & Dunstan, J. (2014). Post-separation parenting, property and relationship dynamics after five years. Melbourne: Australian Institute of Family Studies.
- Schepard, A., & Emery, R. (2013). The Australian Family Relationship Centres and the future of services for separating and divorcing families. Family Court Review, 51(2), 179-183.
List of tables
- Table 2.1: Percentage change in applications for final orders, by court, 2004–05 to 2012–13
- Table 2.2: Percentage change in applications for final orders in child-related cases, by court, 2004–05 to 2012–13
- Table 2.3: Distribution of applications for final orders in child-related cases, by court, 2004–05 to 2012–13
- Table 2.4: Distribution of applications for final orders, by type of case, 2004–05 to 2012–13
- Table 2.5: Number of applications for final orders in child-related cases, by court, 2004–05 to 2012–13
- Table 2.6: Percentage change in applications for final orders in property-only cases, by court, 2004–05 to 2012–13
- Table 3.1: Percentage change in applications for consent orders, by type of matter, FCoA and FCoWA, 2004–05 to 2012–13
- Table 4.1: Percentage change in orders for ICLs, by court, 2004–05 to 2012–13
List of figures
- Figure 2.1: Number of applications for final orders, by court, 2004–05 to 2012–13
- Figure 2.2: Distribution of applications for final orders, by type of matter and court, 2004–05 to 2012–13
- Figure 2.3: Number of applications for final orders in child-related cases, by court, 2004–05 to 2012–13
- Figure 2.4: Number of applications for final orders in children-plus-property cases, by court, 2004–05 to 2012–13
- Figure 2.5: Number of applications for final orders in property-only cases, by court, 2004–05 to 2012–13
- Figure 3.1: Number of applications for consent orders, FCoA and FCoWA, 2004–05 to 2012–13
- Figure 3.2: Number of applications for consent orders, by type of matter, FCoA and FCoWA, 2004–05 to 2012–13
- Figure 3.3: Proportion of consent orders, by type of matter, FCoA, 2004–05 to 2012–13
- Figure 3.4: Proportion of consent orders, by type of matter, FCoWA, 2004–05 to 2012–13
- Figure 4.1: Number of orders for ICLs, by court, 2004–05 to 2012–13
- Figure 4.2: ICL orders as a proportion of applications for final orders in child-related cases, by court, 2004–05 to 2012–13
- Figure 5.1: Number of filings involving self-represented litigants in all family law matters, by court, 2004–05 to 2012–13
- Figure 5.2: Matters involving self-represented litigants as a proportion of all applications for final orders, by court, 2004–05 to 2012–13
Dr Rae Kaspiew is a Senior Research Fellow and Jessie Dunstan is a Senior Research Officer, all at the Australian Institute of Family Studies. Dr Lawrie Moloney was a Senior Research Fellow, and John De Maio was a Research Fellow at the Australian Institute of Family Studie at the time of writing.
Kaspiew, R., Moloney, L., Dunstan, J., & De Maio, J. (2015). Family law court filings 2004-05 to 2012-13 (Research Report No. 30). Melbourne: Australian Institute of Family Studies.
978-1-76016-014-2