The outskirts of Sydney and Melbourne
Economic diversity or homogeneity?
You are in an archived section of the AIFS website
April 1991
Abstract
The Institute's Australian Living Standards Study will examine family living standards and the availability and use of services in twelve local government areas, with four of the areas being on the outskirts of Sydney and Melbourne. This article reports on the use of cluster analysis to examine existing data on what sort of families live in these suburbs, whether they have jobs and mortgages, and to what extent the fringe areas are similar to each other and different from suburbs closer to the city centre.
AIFS Researchers, George Gondor and Andrew Burbidge, report on preliminary Institute research on the living standards of families in certain areas of Sydney and Melbourne.
The Institute's Australian Living Standards study will examine family living standards and the availability and use of services in 12 local government areas, with four of the areas being on the outskirts of Sydney and Melbourne. This article reports on the use of cluster analysis to examine existing data on what sort of families live in these suburbs, whether they have jobs and mortgages, and to what extent the fringe areas are similar to each other and different from suburbs closer to the city centre.
To gain some understanding of family circumstances at the local level, existing data on the economic, social and demographic characteristics of families, the availability of services and other indicators of the quality of life are being collected. There are many ways of grouping area data and many definitions of fringe suburbs. For example, the Australian Bureau of Statistics, and departments of social security, community services, planning, and the police, all have different classifications, often based on the areas served by their local or regional offices.
Although some of these classifications of local goverment areas were adopted, it was clear that the Institute had a different purpose for examining the data, and so a method was sought of grouping local goverment areas which were similar in the characteristics selected as important. The Institute's interest in the spatial distribution of families flows from the assumption that individuals and families differ from each other in ways which are important for public policy, and that there are significant similarities and differences between areas in their composition. One of the first tasks, therefore, was to decide what factors best reflect the important differences between families.
Indicators of Economic Inequality
The variables selected as showing important economic aspects of society were: high or low income (above $40,000 and below $15,000); the proportion of women employed (women aged 20 - 54 years); the proportion of employed males who are employers or self-employed; ownership or purchase of a dwelling; large dwellings (four or more bedrooms); and the median price of dwellings (available for Melbourne only). To distinguish areas with high proportions of retired people from other low income areas, the age 55 years and over was included as another variable.
Different variables were used for separate analysis of economic, social and life cycle variables. This method preserves detail and allows comparisons on each basis. However, the social and demographic clusterings are not reported on here.
Much of the data in this analysis comes from the Census. Tait and Horvath (1986) also used this source for a study they did of Sydney, but, as described below, the method used by the Institute is different from their regression analysis.
While most of the data in the research reported here comes from the 1986 Census, many of the conclusions based on Census data are still likely to apply, as other sources of data suggest that many of the characteristics of these areas are little changed. For example, data on population growth and dwelling commencements are available for Berwick and Werribee. These are the two Melbourne fringe areas in which the Institute will conduct household inverviews in its Australian Living Standards Study. These areas continued to have high rates of population growth after 1986 and still have high proportions of young families. Estimates for Berwick are that it will have 9.1 per cent of its population aged 0 - 5 years in June 1991 - very little change from the 10.6 per cent in 1986 (Ministry for Planning and Environment 1988).
Some trends (for example, employment growth) clearly have changed since then and some analysis has been done of more recent data where it is available.
Following Jordan's pioneering work using the 1981 - 82 income survey (Jordan 1987), cluster analysis was used to sort the suburbs into like and unlike groups. This is a relatively new technique to help the researcher 'see' the data (for details see accompanying boxed insert).
Similarities and Differences in Family Circumstances
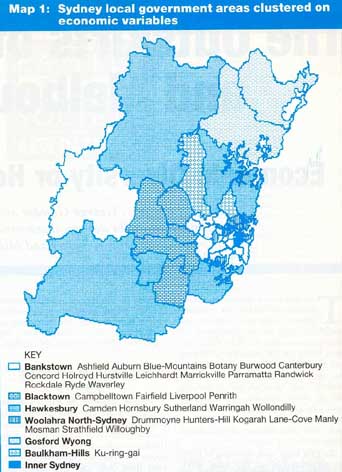
The results of cluster analysis procedures suggest that, in terms of the the economic variables described above, Melbourne and Sydney fringe suburbs do not represent a coherent group. In Map 1 (Sydney), for example, Gosford and Wyong are grouped together because they are similar to each other in many respects, but they are quite different to Campbelltown and Hawkesbury. As discussed further below, Gosford Wyong are relatively low income areas but have relatively high proportions of people who have fully paid off their homes. Residents of the Blue Mountains have more in common with those in Bankstown and some other middle suburbs than with their neighbours in Penrith.
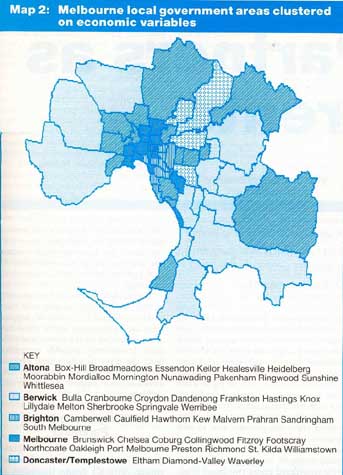
Similarly, Map 2 (Melbourne) shows Berwick and Werribee among a large cluster of 'home-buyer areas' but the fringe areas of Eltham and Pakenham each in different economic clusters. The inner and middle suburbs group themselves into an eastern group (including Brighton, Hawthorn, Sandringham) and a predominantly western group (including Footscray, Coburg, Richmond) with Chelsea and Oakleigh isolated additional members of this group.
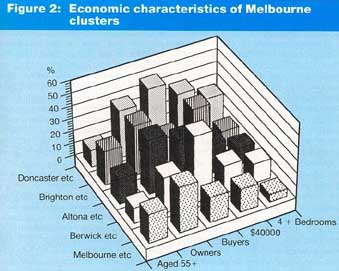
Figures 1 and 2 help explain why the variables selected result in the fringe suburbs being grouped in the way set out in the maps. The charts show some of the main differences between clusters by presenting the averages for each cluster of five of the variables used in the economic grouping. They allow clusters to be compared on the basis of family incomes, rates of home ownership and purchase. They also permit comparisons between Melbourne and Sydney.
In Sydney (Figure 1), the outer suburbs of Baulkham Hills and Ku-Ring- Gai had the highest proportions with family income of $40,000 or more, markedly above Gosford- -Wyong and the Sutherland - Hawkesbury group. Some of these differences are associated with the proportion of older people living in the area. Other Census data extracted for each local government area show that Baulkham Hills and Ku-Ring-Gai have high proportions of males who are employers or self-employed and large numbers of big houses of four or more bedrooms.
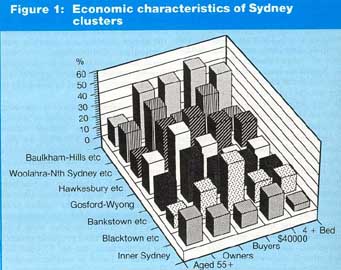
In contrast, Inner Sydney (not separate from South Sydney at the time of the Census) had the lowest proportion of large dwellings and high proportions of renters (based on low proportions of owners and buyers). The Bankstown and Blacktown groups are interesting in that Blacktown has a high proportion of buyers, while Bankstown, with twice the proportion of people over over the age of 55, has a high proportion of outright owners.
In Melbourne (Figure 2), the Berwick - Werribee group has the highest proportion of buyers, with the other predominantly fringe group - which includes Doncaster and Eltham - having higher proportions of owners and very much higher proportions with incomes of $40,000 plus and large dwellings. The Altona group contains Pakenham, Healesville and Whittlesea and is different from the other fringe clusters in its higher proportion of people aged 55years and over. This group has ownership rates similar to Doncaster - Eltham, but much lower income levels.
Conclusion
This article reports on preliminary research to see whether such factors as the high proportions of families with young children, the level of access to local employment, public transport and other employment support services (like child care and after-school programs) result in families in the fringe suburbs of Melbourne and Sydney having low incomes and other indicators of low standards of living.
It finds that the popular image of the urban fringe comprising economically disadvantaged families is doubtful for both Sydney and Melbourne. Fringe suburbs are not homogeneous; in economic terms there is as much variation between fringe suburbs as there is between middle suburbs. Many more closely resemble some middle and inner suburbs than they resemble each other.
There are interesting differences between Sydney and Melbourne, and the Institute plans to undertake more direct comparisons between them. For example, while the City of Melbourne is similar to a number of other inner and middle local goverment areas, Inner Sydney is quite different from its neighbours and other parts of Sydney.
Cluster analysis is proving useful in the analysis of complex data, helping in the creation of a typology of local goverment areas for Sydney and Melbourne. Further work is being done to examine economic, social and demographic diversity and segregation of families both between local goverment areas and within them.
References
- Tait, D. and Horvath, R. (1986), 'Socio-spatial inequality in Sydney', in Urban Planning in Australia, Longman-Cheshire, Melbourne.
- Jordan A. (1987), The Common Treasury, Discussion Paper No.22, Canberra.
- Ministry for Planning and Environment (1988), 'A population and household forecast for metropolitan Melbourne', Ministry for Planning and Environment, Victoria, Melbourne, p.83.