Migration, labour demand, housing markets and the drought in regional Australia
You are in an archived section of the AIFS website
September 2011
Download Research report
Overview
This report explore the interactions between local labour demand and short-term and long-term mobility or, more correctly, migration. Given that the definition of drought is contested, sensitivity analysis was conducted using independent regional data. Census data for Statistical Local Areas (SLAs) throughout Australia were used to capture mobility between 2001 and 2006. The major social and economic costs and benefits of migration identified in recent censuses are used to explain the changing patterns of mobility within and between rural and metropolitan areas. These results are interpreted by reference to the standard human capital model of migration.
The "good news" from this report is that the net effect of drought on migration is small or insignificant in the short run. While analysts need to be mindful of the possible changes in the composition of the population in drought-affected areas, their research needs only to be suitably qualified.
Perhaps the most important effect of drought is on the increased stress it places on families who are adjusting to financial pressures generated by regional decline. The long-term fragmentation of families who send some of their number elsewhere to find work is unlikely to be sustainable in the long run, as families will grow apart to adjust to the new "permanent" reality. Of course, one cannot presume anything is permanent when it comes to the weather, and hence the effect of drought is intrinsically indeterminate and uncertain.
Executive summary
The most recent drought has been one of the most severe on record, with large parts of southern and eastern Australia experiencing dry conditions since 1996. Moreover, "for the agriculturally important Murray-Darling Basin, October 2007 marked the sixth anniversary of lower than average rainfall totals, with the November 2001 to October 2007 period being its equal driest such six-year period on record" (Bureau of Meteorology [BOM], 2007, p. 1). Households adjust to adverse circumstances in drought-affected areas, with some members of households moving (temporarily or otherwise) towards areas with greater economic opportunity. One implication of drought is that it can fundamentally change the long-term economic viability of regional areas.
This report exploits the geographically uneven nature of the drought to explore the interactions between local labour demand and short-term and long-term mobility or, more correctly, migration. Given that the definition of drought is contested, sensitivity analysis was conducted using independent regional data. Census data for Statistical Local Areas (SLAs) throughout Australia were used to capture mobility between 2001 and 2006. The major social and economic costs and benefits of migration identified in recent censuses are used to explain the changing patterns of mobility within and between rural and metropolitan areas. These results are interpreted by reference to the standard human capital model of migration.
There are strong incentives for people to leave drought areas if adverse conditions persist in the long run; however, there is no necessary reason why this effect would be apparent in the short run. The main finding of this report is that it is important to differentiate the processes of migration so that policy-makers understand the factors that affect moving into and out of areas. While the interactions between drought and migration in drought are more complex than some analysts have argued, policy-makers still need to take them into account in regional economic plans and demographic projections. The research community also needs to take into account the role of selective migration in altering estimated models of individual behaviour in the social and economic domains.
This report also examines any issues arising from the use of the measures from the publicly released confidentialised unit record file (CURF) of the Rural and Regional Family Survey (RRFS) being conducted by the Australian Institute of Family Studies (AIFS). Most of the regional data used in this report can be linked to the CURF. Some of the data used are rather experimental in nature or have some unresolved quality issues at the SLA level of aggregation, and hence should be excluded from the publicly released data. One example is the measure of the contribution of the agricultural sector to structural change. The main issue for that variable is that it is rather difficult to interpret, and further refinements may be required to the estimator to ensure that it is providing meaningful information about drought-affected areas. Unfortunately, the second category of information that cannot be included is gross flows of various populations, which are rather difficult to make precise statements about at the SLA level. Notwithstanding this, other regional characteristics can be included at the discretion of AIFS. Note that any CURF should include the basic SLA measures of out-migration, in-migration and net migration.
The "good news" from this report is that the net effect of drought on migration is small or insignificant in the short run. While analysts need to be mindful of the possible changes in the composition of the population in drought-affected areas, their research needs only to be suitably qualified. That is, most analysis of the effect of drought from the RRFS is likely to be reasonably robust to the failure to take into account migration. Notwithstanding any documentation released with a CURF of the RRFS should alert readers to the fact that the regional characteristics of SLAs may change as a result of drought and hence ask potential analysts to have suitably cautious and nuanced analyses of the effect of drought on various social and economic outcomes.
Perhaps the most important effect of drought is on the increased stress it places on families who are adjusting to financial pressures generated by regional decline. The long-term fragmentation of families who send some of their number elsewhere to find work is unlikely to be sustainable in the long run, as families will grow apart to adjust to the new "permanent" reality. Of course, one cannot presume anything is permanent when it comes to the weather, and hence the effect of drought is intrinsically indeterminate and uncertain.
Introduction
The most recent drought has been one of the most severe on record, with large parts of southern and eastern Australia experiencing dry conditions since 1996. While the weakening of the El Niño event in late 2007 provided some relief in the form of rainfall, "for the agriculturally important Murray-Darling Basin, October 2007 marks the sixth anniversary of lower than average rainfall totals - with the November 2001 to October 2007 period being its equal driest such six-year period on record" (Bureau of Meteorology [BOM], 2007, p. 1).
Many Australian farmers and rural communities are still experiencing hardship as a result of severe and prolonged drought and variable rainfall events. "While this is not new to dryland farming areas, 'irrigation drought' is uncharted territory" (Productivity Commission, 2009, p. xx) in which the cumulative effect of a series of recent droughts means that insufficient water is being stored in dams to permit irrigation farming in many areas.
Droughts are likely to have a direct effect on the productivity of agricultural areas. The tendency in the long run for the relative price of primary produce (and resources) to decrease as incomes increase (i.e., following Engel's law) is one factor driving decline in regional Australia. The decline in productivity for farms reduces farmers' profitability and this affects their ability to pay farm workers' wages. This decline in wages creates less pressure in the local labour market, which in turn reduces other wages and may increase unemployment rates, especially if farm workers lose their jobs. Migration out of the area may be magnified by these less buoyant labour market conditions if other areas have higher wages and lower unemployment.
It should be noted though that outward migration can create conditions for some self-correction, as the resulting fall in the number of available workers may increase wage pressures, with firms competing for a reduced number of potential employees. This correction should be considered as (literally) a second-order effect.
Another mechanism by which an area might adjust to the prolonged experience of drought is through its effect on the housing market and asset prices. The price of farms is likely to fall directly in line with the decline in agricultural productivity, and the price of local housing will also tend to fall with any decline in regional wage levels. If this were the only dynamic then it might be sufficient to control for local labour market conditions when studying migration. However, given that a substantial amount of individual wealth is likely to be tied up in these assets, migration decisions will also be heavily dependent on expectations about what may happen to asset prices. Therefore, if drought is seen as a temporary phenomenon, then residents may be tempted to stay longer than other economic incentives would indicate, as asset prices would be expected to eventually recover.
Households may adjust to adverse circumstances in drought-affected areas, with some members of households moving (temporarily or otherwise) towards areas with greater economic opportunity. Such movements are particularly associated with relatively high exit rates by young people (e.g., Clawson, 1963).
Another implication of drought is that it can fundamentally change the long-term economic viability of regional areas, as demographic decline may feed back into a deterioration of regional infrastructure and local amenities (Barr, 2004).
Along with births and deaths, internal migration patterns are important factors influencing the demographic and economic futures of geographic areas and the people who live in them. The study of migration is important because policy-makers need to understand how many people live in an area and what sort of people move into and out of an area. Areas with net inward migration may experience greater pressure on the supply of goods and services, whereas those with net outward migration may experience labour shortages and lower levels of consumption of goods and services. Migration is an intrinsically geographic phenomenon - as it is a coalescence of several demographic forces with a spatial dimension - but it also reflects all the individual decisions of people in various areas. Droughts are the result of broader climatic events and global systems - which on the balance of probabilities are exacerbated by human activity - but they also have a clear geographic (local) manifestation.
This report exploits the geographically uneven nature of drought to explore the interactions between local labour demand, the regional housing market, and short- and long-term mobility.
The next section introduces the basic theoretical model of migration underlying the empirical analyses. After briefly introducing the relevant background literature on population dynamics in rural and regional Australia, the following two sections address the question of what constitutes a drought before documenting the broad patterns of Australian drought since the early 1990s. The report then introduces some data issues before a Census-based analysis of recent migration patterns is presented. The penultimate section revisits an analysis of migration and mobility that was presented to the 2008 Productivity Commission Inquiry into Government Drought Support (Edwards, Gray, & Hunter, 2008), and the final section draws together some relevant conclusions.
Theoretical model of migration
To understand the economic factors associated with migration, we follow the basic human capital model as developed in Sjaastad (1962), Harris and Todaro (1970) and elsewhere. According to this model, migration occurs when the anticipated future income stream available at a potential destination is greater than the future income stream at the person's current location plus the costs of migration. Individuals may therefore choose to move if they see another area as giving them a greater chance of obtaining employment or, if they are already employed, gaining a job with higher remuneration.
It is assumed, however, that the costs of migration are far from negligible. Hence, even if people do predict that there are areas where their income will be higher than it currently is, the increase in their predicted income from moving may not be enough to cover the costs of migration. These costs are perhaps best represented via a gravity model (developed originally in the 1940s, e.g., by Stewart, 1947). According to the modified gravity model in Greenwood (1997), the probability of moving between two areas is based in part on the size of the origin and destination populations, but inversely related to the distance between the two areas. The distance between the two areas is said to proxy the cost of migration, which could be either social or economic:
- Social (psychic) costs of migration: The main social cost of moving is related to the effect it has on a person's ability to maintain their existing social networks. The greater the distance between two areas, the more costly and time-consuming it is to make frequent return visits to maintain the social networks developed in the area. Distances from their source areas aside, individuals are able to build new social networks in their destination area. This is a possible reason why people move to areas with a high concentration of individuals with similar characteristics to themselves (based on ethnicity, country of birth, language, etc.) Other costs of migration are likely to vary throughout a person's life cycle. For example, those in mid- to late secondary school who move schools are likely to experience significant disruption to their studies (above and beyond the disruption to their peer social networks).
- Economic costs of migration: Moving to another area can also involve reasonably large economic costs. Firstly, there are the direct physical costs of moving oneself and one's family (e.g., transport, removalists, searching for accommodation). Secondly, especially in the short term, a family that moves may have to forego some of their income. That is, even though a person's income may increase in the long term, wages often decline in the short term because people lose firm specific human capital (Yankow, 2003). Furthermore, the opportunity costs in terms of spousal income may also be important; that is, for a married couple, moving to improve one spouse's income may come at the cost of their partner's income (Greenwood, 1997).
A further impediment to migration could be the uncertainty or risk involved with moving (Khwaja, 2002). If people already have a job lined up in another area, then they may be able to predict with reasonable accuracy the benefits of migration (at least in the short term). However, if people do not have a job in advance and are instead considering whether to move to improve their prospects of obtaining a job, then they may be less likely to feel that the uncertain future benefits are worth the risk (given the known economic and social costs).
To measure the association that area level variables have with migration decision, Biddle and Hunter (2006) assumed a two-step process. That is, individuals are assumed to first make the decision to move to a different SLA based on the characteristics of the source SLA or the SLA in which they lived in 2001. Once the decision to migrate has been made, the decision of where to move is assumed to be based on the characteristics of the potential destinations. Obviously this is a simplified assumption and, as pointed out by Greenwood (1997), individuals are likely to (a) make the decision to move based on the potential areas available to them; and (b) individuals are likely to make the decision about where to move based on where they are coming from.
Unlike Biddle and Hunter (2006), this report does not model the migration decision at the individual level because of a lack of access to the Census unit record data.1 Rather, we model the two migration decisions at an area level, using firstly the percentage of the population who moved out of an area between 2001 and 2006 (proxying for the decision to migrate), and secondly the percentage of the population who moved into an area between 2001 and 2006 (proxying for the choice of destination). We also separately model net migration or the difference between the rate of out-migration and in-migration in order to capture the effect of the two on population redistribution.
Notwithstanding the lack of suitable data to model the two-stage decision at an individual level, it is possible to use pairs of SLAs as the unit of analysis to model the joint effect of source and destination characteristics in influencing the two-stage migration decision. This is, however, left for future research.
1 There was an insufficient sample in the drought areas for the Census 1% sample to be of use for this analysis. The 5% sample for the 2006 Census has just been released, but the level of geographic detail provided is probably not adequate to analyse migration (ABS, 2009). For example, the lowest level of aggregation is statistical regions, and even then some of these regions have been aggregated in the released data.
Background: Population dynamics in rural and regional Australia
Drought is only one factor underlying mobility patterns and associated population trends in rural Australia. Garnaut (2008) suggested that even without the impacts of climate change, Australia's agriculture sector would be likely to grow because of higher demand and higher commodity prices. Overall, Garnaut's assessment was that the impacts of climate change are likely to reduce agricultural opportunities, and emissions mitigation policies (such as the increased use of bio-sequestration) will probably create new opportunities for developing more efficient land management.
"The agricultural sector is continually adjusting to the many forces of change" (Productivity Commission, 2009, p. 13) - agricultural output has been increasing, but the sector's share of the gross domestic product (GDP) has declined as farmers' terms of trade have been declining. As a group, the lowest 25% of broadacre farms did not make a profit in any year from 1988-89 to 2006-07. Farm numbers and the amount of land used in agricultural production have fallen, but there has been an increase in average farm size. Notwithstanding, agriculture continues to exhibit strong long-term productivity growth.
Population growth and regional centres
The Australian Bureau of Statistics (ABS, 2006) noted that in 2004-05, the largest population growth outside the capital cities occurred in coastal areas, most of which resulted from internal migration, as people from inland areas and cities moved towards the coast - a reflection of the so-called "sea change" phenomenon. These population movements are likely to reflect factors such as the relocation of retirees, individuals seeking a change of lifestyle, high city house prices, and the development of technologies that enable people to telecommute.
Many larger inland centres ("sponge cities") too are growing, at the expense of smaller outlying towns - although the validity of using the analogy of sponge cities (and rural towns) has been contested recently by Argent, Rolley, & Walmsley (2008). Some regional towns have had strong population growth because of the growing demand for labour by the mining industry.
The Productivity Commission (2009) noted that the population of small towns (with a base of 200-1,000 people) increased by an average of just under 1% per annum from 1996 to 2006 (close to the national average). However, this broad statistic hides the fact that while some towns have benefited from inflows to selected coastal and inland areas, others have declined due, in part, to the greater availability of commercial and other services in the larger towns and to the long-term decline of some rural industries.
The benefits of urbanisation are attractive to people and businesses alike (Bradley & Gans, 1998). Larger centres have greater product variety, higher order health services, a greater range of leisure activities and economies of scale. They offer better access to a skilled workforce, transport cost savings and improved technological synergies between firms. Improved roads and cars mean that it is easier for farmers and other local residents to travel to these centres.
Prolonged drought may have exacerbated these trends by reducing the income of wealth in rural communities relative to the more urbanised settlements.
In its submission to the Drought Policy Review Expert Social Panel, Central NSW Councils (2008) observed that drought can hit rural communities particularly hard:
The decimating of communities will only lead to less and less services within rural communities including medical services having a multiplying downward spiralling impact for rural and regional Australia. (p. 1)
The micro-dynamics of change in Australian agriculture
It would be surprising if the economic and social stresses associated with drought were not associated with migration. However, there is not necessarily a relationship, so we must consider some of the other factors underlying the population dynamics of regional Australia, especially with regard to the agricultural sector.
Barr (2004) described the changing demographic structure of Australia's farm community using a simple model of the farm sector. According to Barr, entry to farming has changed little since 1996. After a rapid decline in the entry rate of young persons during 1970s and 1980s, entry of younger persons seems to have stabilised at new low levels. The major form of entry is increasingly mid-career, rather than through informal family apprenticeship. Exit rates from agriculture continued to decline between 1996 and 2001, particularly for women and for older persons. It appears that increasing numbers of farmers are choosing to continue to farm on grazing enterprises in the absence of a next generation interested in taking over the business. The most vulnerable farmers are not necessarily those facing the greatest climate variability. Factors such as small farm scale, land degradation, low liquidity and lack of diversified income sources are more likely to increase the vulnerability of farms to adverse shocks.
Barr (2004) also argued that demographic research of Australia's rural regions inevitably shows the diversity of community situations, which is itself partly explained by an interaction between agricultural commodity economic systems and the urbanisation of the Australian community. In the peri-urban area (on the fringes of cities), high land values make all but the most capital-intensive agriculture a poor business investment. Therefore, as cities grow they put an upward pressure on land prices that in turn mean that farmers may have to sell the farm or move into more capital intensive farming techniques.
The landscapes of the Western Australian wheat belt offer the greatest opportunities for farm businesses to keep ahead of declining terms of trade (Barr, 2004). The main agricultural advantage is not better soils, or better rainfall, but the lack of competition from other land purchasers. However, this region has one major disadvantage in that it is, arguably, the first clear case of climate-change-induced regional decline, which may ultimately lead to higher rates of farm exits (Wahlquist, 2008).
Barr's (2004) conceptual model of entry and exit rates into farming should help the reader understand some idiosyncrasies of rural migration:
Below average exit and entry rates characterise areas which have traditionally been described as "tightly held" … Relatively high entry and exit rates describe an area where property turnover could be described as a form of "churning". High exit rates and low entry rates are characteristic of a district where business amalgamation is consolidating faster than the national average ["consolidation"]. Low exit rates and high entry rates are characteristic of business fragmentation, where farm numbers may be increasing and farms becoming smaller, or at least consolidating slower than elsewhere ["fragmentation"]. (p. 35)
Barr's classification of areas of regional dynamics in Australian agriculture provides clear examples of the process of regional adjustment to recent social and economic changes, with obvious implications for migration patterns.2
Seasonal off-farm work is quite common in some agricultural industries. The main workload of harvest for many horticultural businesses falls in the summer and autumn. Other seasons can have much less demand for labour, and owners of small horticultural blocks will often use this period to earn off-farm income. Movements such as these should be characterised as mobility rather than a permanent migration.
Another observation with some potentially important implications for migration is that the highest exit rates in farming have been after a temporary peak in commodity prices (Barr, 2004). This is counter to the intuitive assumption that poorer commodity prices will lead to a higher rate of exit from agriculture. Previous research has shown that exits from Australian broadacre agriculture are higher during periods of strong land prices, and fall during periods of low commodity prices when land markets are weak (Bureau of Agricultural Economics, 1975). If drought is associated with declining productivity, and hence lower land prices, then farmers may hold out for a more optimistic scenario before they move on. That is, farmers and other residents in regional areas may only migrate when housing prices are relatively buoyant, which is more likely to occur after a period of drought when the productivity of the land is restored to its historical levels. Farmers are likely to run down their financial reserves before selling their property because of the hope that a drought will finish sooner rather than later. Even in the presence of climate change, this is not necessarily an irrational response, as the price of property may recover somewhat after a temporary relief from drought-like conditions.
The underlying population dynamics of rural areas described above underscore the importance of understanding both the local labour and housing markets when analysing the interactions between agriculture and migration. Consequently, such issues will be given a suitable level of prominence in what follows.
2 Barr's (2004) provided further discussion of his classification system as follows: Tightly held regions "are found generally in the cropping zone of both east and west Australia. Relatively few persons enter farming in this zone, and relatively few leave. However, the rate of exit is sufficiently greater than the rate of entry to ensure there is considerable ongoing consolidation of properties. Cropping requires high skill levels and high capital for machinery and crop establishment. It is not likely to attract new cropping farmers. Entry is likely to be a sign of farm family members returning to the farm after a period earning income elsewhere" (p. 36). In churning regions, "high rates of entry and exit are a characteristic of the rangelands of northern and Western Australia. One explanation is the significant number of establishments managed by salaried employees. A significant minority of farmers in this region nominate another part of Australia as their place of usual residence. In the 1980s churning was a general characteristic of irrigation regions" (pp. 36-37). In fragmentation regions, "high entry and low exit rates were apparent in peri-urban districts across the country … Here relatively low exit rates and high entry rates reflect the allure of farm holdings in these regions as a lifestyle choice. The large number of small farm holdings allows easier entry, and the competition for land from new entrants reduces the potential for farm consolidation" (p. 37). "Relative consolidation, high exit rates and low entry rates, is comparatively uncommon as well as temporally unstable" (p. 37).
What is a drought?
"Droughts are a recurrent and frequent feature of Australia's climate" (Productivity Commission, 2009, p. 47). There have been three particularly severe and prolonged dry periods in Australia since 1900, and the period 2002 to 2007 is among these, although the "Forties Drought" (1939-45) appears to have been the most severe on record. Although the period 2002 to 2007 is regarded by many as one long drought, it includes three of the four highest ever years for Australia's agricultural output. The projections for Australia's climate make it clear that farmers and other Australians should be prepared for a hotter future (see, e.g., CSIRO, 2008). The outlook for rainfall is for continued variability and, for some regions, more frequent periods of extremely low rainfall. There is, however, large uncertainty surrounding the rainfall projections. Inflows to the Murray-Darling Basin in recent years have been the lowest on record, contributing to dramatic declines in annual allocations to irrigators.
Everyone who has read Dorothy Mackellar's famous poem, A Sunburnt Country, will know that Australia is a drought prone country. However, before analysing drought formally a clear definition is needed of what a drought is and when a drought may have occurred.
Intuitively, drought is generally taken to mean a situation of acute water shortage. Accordingly, the BOM's National Climate Centre issues a periodic Drought Statement that uses several terms to describe drought through rainfall deficiency:
- lowest on record - lowest rainfall on record, at least since 1900 when data analysis began;
- severe deficiency - rainfalls in the lowest 5% of historical totals;
- serious deficiency - rainfalls in the lowest 10% of historical totals, but not in the lowest 5%;
- very much below average - rainfalls in the lowest 10% of historical totals;
- below average - rainfalls in the lowest 30% of historical totals, but not in the lowest 10%;
- average - rainfalls in the middle 40% of historical totals;
- above average - rainfalls in the highest 30% of historical totals, but not in the highest 10%;
- very much above average - rainfalls in the highest 10% of historical totals.
A meteorological definition of drought, which focuses on the degree and duration of dryness compared to a historical average for the area, would be approximated by the rainfall categories of severe or serious deficiency. This definition of drought can be contested because it is becoming apparent that the lack of adequate rainfall relative to some historical norm is theoretically an inadequate basis for a taxonomy. It is increasingly unsatisfactory to define a drought as a period of extremely low rainfall involving a one-in-ten-year event, as global climate change is likely to involve a fundamental change in the patterns of rainfall.
Given the lack of consensus about what constitutes a drought, some researchers augment the conventional rainfall or meteorological definition of drought with definitions based on: a hydrological definition based on water supply, agricultural impacts in the local areas and, finally, a social definition based on personal experience.
The hydrological definition - for example, that used in the Australian Water Availability Project (AWAP; a collaboration between the Bureau of Rural Sciences (BRS), CSIRO, and the BOM) - is probably closest to what most people intuitively understand as "drought". This approach uses a water balance equation to estimate the water available for use by the local population. The resulting estimate of soil moisture and water availability is extremely sophisticated, as it takes into account broad factors such as stream flow, reservoir levels, ground water levels, flows between various soil strata and even the photosynthesis of plants in the area (Raupach, Briggs, King, Paget, & Trudinger, 2007). Unfortunately, existing estimates do not take into account allocations of irrigated water and hence it has not been clear that the hydrological approach provides a superior basis for estimating drought. Certainly, that was the judgement of Edwards, Gray, Hunter, and De Vaus (2008), for whom the estimated economic and social effects of drought, estimated using rainfall definitions, did not differ substantially when a hydrological definition of drought was used. Furthermore, the "sophisticated" nature of the AWAP means that it was based on several models and hence the generated data on soil moisture may have been unreliable if they were sensitive to the underlying assumptions of the respective models.
A definition of drought that focuses on the agricultural impacts of a climatic event has to contend with the fact that the effect of drought may take some time to manifest itself. In addition to an unavoidable time lag, another issue in the context of this report is that migration and agricultural drought are likely to be correlated, as both are defined as different responses to a particular historical (climatic) event. Hence it is conceptually difficult to separately identify the relationship between migration and drought. Notwithstanding such difficulties, an agricultural definition of drought could theoretically be constructed using standard economic measures of structural change and regional shocks arising from climatic anomalies. Following Layard, Nickell, and Jackman (2005), structural change can be measured using the Lillien (1982) turbulence index, which can be thought of as the average (absolute) change in industrial structure for an economy (in the context of this paper, a regional economy). This index is decomposable and one can focus on the proportion of structural change that is attributable to the agricultural sector. Given that "agricultural impact" drought involves a negative shock to the agricultural sector that is greater than what is being experienced elsewhere in the economy, drought could be measured by focusing on those areas where there is greater than one standard deviation away from the average turbulence index (i.e., attributable to agriculture) among all areas. While this putative definition of drought is not directly used in the main analysis of this study, it opens up possibilities for future research.3 For the moment, it is worth noting that these turbulence indices are most strongly correlated with rainfall levels of 5 to 10 years ago. The problem of using this definition of drought is that it is unlikely to be independent of migration decisions and indeed may be reflecting them. Notwithstanding these intrinsic problems with using a turbulence index to measure drought in the context of migration, the following discussion presents the results for the turbulence index to measure "structural change" across some standard definitions of drought.
The final definition of drought considered is a social definition based on individual or expert assessments. The AIFS Rural and Regional Family Survey (RRFS) asked a direct question about drought of the 8,000 respondents in agricultural areas spread across non-metropolitan Australia. The responses to this survey do not cover the whole of regional Australia and it is of limited use in the following analysis, which examines all the migration flows in Australia for the last three intercensal periods. Notwithstanding, the AIFS study also included information on migration and hence the following briefly reflects on the publicly available analysis (Edwards, Gray, Hunter, & De Vaus, 2008).
Recent changes in Australian rainfall
The sample design for the RRFS was stratified by drought areas defined on the extent of rainfall deficiency between 2004 and 2007 compared to all three-year periods back to 1900 (i.e., measured by percentile ranking of BOM data for SLAs defined using 2001 Census boundaries). Note that the maximum period that the BOM provide the local rainfall percentile ranking is 36 months, although they will provide data for shorter periods on request. However, to understand the relationship between drought and mobility more broadly we should briefly reflect on rainfall changes over a longer period. On the basis that geographic mobility and associated characteristics are only reliably measured using Census data, the following examines the analogous BOM data for the three years preceding the 1996, 2001 and 2006 censuses.
BOM report the deciles of rainfall outcomes (relative to the historical record) for the 36-month period before each of the last three censuses (maps are available on request). According to the standard meteorological definitions described above, the bottom decile of rainfall events can be classified as drought-affected (i.e., drought as a one-in-ten-year event). The drought of the early 1990s was widespread throughout Queensland "cattle areas", central Australia, southwest Western Australia, and some coastal areas in South Australia (and a small area around Burnie in Tasmania).
In the three years leading up to the 2001 Census, there were signs of good rainfall in much of Northern Australia. There was no sign of drought in Queensland, New South Wales (NSW) or the Northern Territory. Drought only seemed to persist in the extreme south of the continent. There were smaller pockets of drought in southwest Western Australia and coastal South Australia. Even though the continent had relatively good rainfall in those years on average, drought seemed to expand in parts of Victoria and Tasmania.
If we turn to the period between 2003 and 2006, drought-like conditions of extremely low rainfall were established in much of eastern Australia, southwest Western Australian and substantial parts of South Australia. However, using the technical meteorological definition of a one-in-ten-year event, drought was still confined to a relatively small portion of the Australian continent.
Coverage and geographic level of analysis
Before we move onto the detailed analysis of population dynamics, it is pertinent to note that the above discussion are based on maps that use relatively small grid data from the BOM (1-km squares). However, the lowest level that migration, labour market and housing market data is held is at the Statistical Local Area (SLA) level, and hence it is desirable to also measure rainfall data at this level as well. SLA-level data is available from the BOM for non-metropolitan areas; however, SLA-level data for metropolitan areas is not available because of the complexity of generating such data for sometimes very small geographic areas. For example, in addition to the need to statistically adjust data for areas with missing rainfall data (e.g., by "re-sampling"), technical expertise on geographic information systems is also required, making the exercise rather difficult. Given that migration between SLAs is defined for the whole of Australia, the BRS was asked to estimate rainfall distributions for all Australian SLAs, and this data is what is used in the remainder of the analysis.
3 There are several issues with using the agricultural contribution to the turbulence index of employment change as an independent measure of drought. First, the index is likely to increase with the initial distribution of agricultural employment; and second, the index gives equal weight to increases and decreases in agricultural employment. Accordingly, some adjustment to this measure is necessary before it could be considered an adequate independent measure of the agricultural impact of drought.
Selected data issues
Geographic aggregation issues
As indicated above, the Census provides the most reliable data for characterising small regions and mobility/migration and hence, in this analysis, we use information from the last three censuses (1996, 2001 and 2006). This report uses the standard ABS SLA geography, as this is the lowest level of aggregation for identifying internal migration and area characteristics such as local labour market conditions (Department of Employment and Workplace Relations, 2007). SLAs are geographic regions used by the ABS to report summarised aggregated data and are based upon Local Government Areas (LGAs), with one LGA encompassing from one to five or more SLAs.
SLA boundaries change in response to changing population distribution and changing administrative boundaries. For this report, concordances were applied to ensure that all boundaries were consistent with the 2001 SLA boundaries. Quasi-population weighted concordances from Biddle (2008) were used to ensure that the population estimates were referring to the same geographic entity.
Describing changing rainfall patterns across non-metropolitan SLAs
In order to measure the relationship between drought and migration as reflected in recent censuses, we have to first understand rainfall patterns across this geography. The BOM does not usually report rainfall by SLAs, so this section describes recent changes in rainfall patterns. The first difficulty encountered is that, as alluded to above, the maximum period for which the BOM measures rainfall percentiles is 36 months. Given that censuses are held every five years, there is a gap in the coverage of rainfall and migration-related Census data. The approach adopted in this report is to measure the rainfall in the three years leading up to each of the 1996, 2001 and 2006 censuses. This can be rationalised on the grounds that it is important to take into account the recent experience of drought if one asserts that one is measuring the effect of drought on migration. Notwithstanding, we are also interested in the patterns of migration that occur during a drought, but this contemporaneous variation is captured by these 3-year periods relative to all other 3-year periods for which data was collected.
Table 1 reports on the stability and change in the rainfall distributions for non-metropolitan areas by focusing on the halves of the distribution (above and below the median). The focus on non-metropolitan areas is driven by the difficulty of securing BOM data for SLAs in metropolitan areas. Similar results are evident using the BRS data (i.e., for the same periods). The following section focuses on these data (rather than the BRS data for all Australian regions) to illustrate some salient points about the nature of drought in non-metropolitan areas, on the grounds that such areas are most likely to be affected by drought.
| Change in BOM distribution between measurement periods (36-month blocks) | |||
|---|---|---|---|
| 1993-96 & 1998-2001 (%) | 1998-2001 & 2003-06 (%) | 1993-96 & 2003-06 (%) | |
| Changing SLAs | |||
| Switched between below and above median category | 46.8 | 46.7 | 43.1 |
| Increased from below to above median | 70.3 | 8.9 | 27.6 |
| Stable SLAs | |||
| Stayed within initial half of the distribution | 53.2 | 53.3 | 56.9 |
| Stayed below median | 41.9 | 60.0 | 76.1 |
Note: Median is the 50th percentile ranking.
Intuitively, we would expect that rainfall in two periods would be equally likely to switch between the above and below median categories. That is, 50% of SLAs would switch between the categories defined by the relationship to the median (changing SLAs) and 50% would remain in the same category (stable SLAs). However, it could be considered evidence of climate change that less than half of the SLAs changed between each BOM measurement period. Perhaps a more telling observation is that, of the SLAs that switched between the halves of the distribution, substantially fewer were likely to increase their ranking on the historical rainfall distribution in the later BOM measurement periods. Overall, between 1993 and 2006, rainfall outcomes fell for almost three-quarters of SLAs relative to the local historical record.
Another related aspect of these changing rainfall patterns is that there were more stable SLAs and, more importantly, such SLAs were more likely to continue with lower rainfall distributions in the later BOM measurement periods. Between 1993 and 2006, over three-quarters of SLAs with relatively stable rainfall patterns were likely to stay in the bottom half of the distribution (below the median).
Some readers might think that this discussion is unnecessarily complicated. Unfortunately, it is probably unavoidable because the definition of drought as a "one-in-ten-year event" means that it is literally impossible for an area to be classified as being in drought during a measurement period that covers 13 years of the 109 years over which BOM data have been collected. Between any two BOM measurement periods, there were a substantial number of SLAs that remained in "drought"; however, readers need to bear in mind the limitations of these "static" BOM definitions of drought in a period of climate change. It is not possible to understand the dynamics of geographic drought using BOM or BRS data on relative rainfall deficiency; however, it is possible for analysts to take into account what is defined as drought at a particular point in time.
In summary, Table 1 highlights that low rainfall events have been cumulative over recent decades and hence, having below average rainfall is a risk factor for experiencing drought in the future. This story is consistent with the prevailing concerns about the meteorological consequences of global climate change for the Australian continent.
Labour market, housing market, migration and drought
There are theoretical reasons for thinking that the labour and housing markets have direct impacts on migration and hence it would be useful to understand how such factors can be measured when attempting to analyse the relationship between drought and migration. Ultimately, the objective of this report is to document the differences and changes in such factors in areas associated with drought vis-à-vis other areas. Since we have some measures of drought back to the early 1990s it may also be possible to examine whether the labour and housing markets became depressed after the experience of drought, or indeed in the lead up to the more recent experiences of drought. Just as we must rely on Census data for migration, we are confined to using Census data to measure the local labour and housing markets as other sources of such data are unreliable. The SLA level is again used as the geographic analysis as this provides reliable data. This decision has the added advantage that it potentially simplifies the interpretation of results. That is, there should be no issue with the fallacy of composition (sometimes called the "ecological fallacy")4 as all geographic data is measured at the SLA level.
Measuring local labour market changes
What is the best way to measure labour market conditions in the context of drought? Census data on unemployment rates provide a direct measure of excess supply of labour in the local labour market. Labour demand can also be measured using changes in regional employment by industry sector, also using Census data. Shift-share analyses are commonly used by geographers to decompose regional employment growth into several components: aggregate growth, growth associated with the industry mix of an area and a residual growth component (see Karmel, McHugh, & Aungles, 1993); the industry mix component of such analysis is closely related to many popular indices of labour demand and hence provides a useful precedent for this report (see Katz & Murphy, 1992). Rather than provide the unnecessary complication of conducting a full shift-share, we simply estimate the expected employment growth for an area given the initial industry structure (at the beginning of the period of interest) and overall growth in industry employment observed at a national level.
The estimates of local employment demand used in this report rely heavily on the assumption that the industrial composition of a group is not changing much over time. If we relax this assumption, then one can estimate a direct measure of sectoral change, the so-called turbulence index that was mentioned above (in the "What is a drought?" discussion). The turbulence index is defined as half the sum of the absolute changes in the share of employment in particular industries (i.e., 1/2 * Σ/Δ[Ei/E]|, where Ei is the employment levels in a particular area, E refers to the aggregate employment levels and Δ Σ is the change in employment levels between two periods). It is a direct measure of sectoral change and an indirect measure of spatial mismatch that enables us to understand how structural change varies across socio-economic status regions (Driver & Dunne, 1992).5
The overall turbulence index can be interpreted as indicating what fraction of all jobs in the region has changed industry. The differences in the magnitude of these indices indicate the proportion of the employed who would have to move across sectors in the later period to restore the region to the industry structure evident in the earlier period. Since this index is additive, the component attributable to the agricultural sector represents the absolute change in agricultural participation as a proportion of all employment change.
Measuring the local housing market
Affordability of local housing is driven by house prices in the local area and the prevailing interest rate charged by financial institutions. Interest rates vary over time with macroeconomic policy, basically affecting all housing markets in a similar fashion, and hence can be largely ignored when focusing on regional variation in housing markets.6
In the absence of consistent local data on real estate sales, housing markets must be measured using a proxy derived from the Census. Censuses do not include direct information on housing prices, but it does include information on weekly rent and monthly housing loan repayments. Both of these are related more or less to local housing prices, but both are imperfect proxies.
When using average weekly rent as a proxy, it needs to be recognised that public housing and community housing in certain areas may involve subsidised rent. One preliminary attempt was made by the authors to focus solely on the private rental market. However, this resulted in a relatively large number of missing observations for average rent and hence a decision was made to use average overall rent for respective SLAs in the analysis.
Average housing loan repayments are also an imperfect proxy for local housing prices because they depend on a number of factors that are difficult, if not impossible, to control for in Census data. The relationship between housing prices and loan amounts depends on the initial equity position of the owners, when the house was purchased and the nature of the loan (e.g., fixed term versus flexible market interest rates). Also, housing prices may have changed since a home was purchased. The upshot is that average housing loan repayments may provide some long-run indication of relative housing prices across SLAs, but it is likely to be problematic for measuring changes in housing prices over time. Given that a similar criticism could be made of the average rent payments (i.e., the relocation of public housing could distort relative rents for areas), these proxies were only measured at a particular point in time - the 2001 Census.7
As average rental payments and monthly housing loan repayments are obviously both less than perfect proxies for housing prices, it seems to make sense to use a combination of the two rather than relying only on one variable in the formal analysis. We chose to use a principle component analysis (PCA) that exploits this correlation to summarise the information contained in the housing variables It transforms a set of correlated data (in this case, the set of housing variables) into a smaller set of uncorrelated components that capture most of the variation of the original set of variables (Dunteman, 1989).
The aim of the PCA method is to maximise the correlation between the components and the original variables. While the procedure produces several new principal component index variables, the first principal component explains the largest amount of variation in the original variables by definition, with the second component explaining less variation or information (and so on). The viability of components can be assessed using the Kaiser criterion (which requires a viable component to have an eigenvalue greater than 1). In this case, given that we are just summarising two variables, one would be surprised if more than one component was important. Indeed, this is the case, with the eigenvalue for the first component being 1.75. Overall, this component explains 88.0% of the variance of average rent and average housing repayments and gives an equal loading of 0.7071 on each variable. While the index generated using the PCA technique is theoretically more robust and more likely to be associated with the underlying concept (i.e., long-run value of housing stock or, more simply, housing prices), the following discussion also reports both rents and monthly housing payments because they are easier to interpret intuitively. Neither variable contradicts the multivariate analysis obtained using the PCA index.
4 The ecological fallacy refers to the incorrect inference that can occur when inappropriately comparing several levels of analysis (e.g., different geographic levels of aggregation).
5 Driver and Dunne (1992) claimed that while the turbulence index is the "obvious way to measure structural change" (p. 123), it has several drawbacks, including: the possible loss of information in representing a vector of changes by a single summary statistic, the difficulties of defining the sectors over which mismatch occurs, and the problem of confusing noise with structural movements when examining changes over short periods. Notwithstanding these problems, they argue that it is the best measure of structural change available for regionally based data.
6 It is possible that the cost of providing capital in some areas (e.g., remote areas) may be more expensive and hence financial institutions might charge different rates for different areas. However, to our knowledge, we are not aware that this scenario is a substantial factor in Australia for private finance. Notwithstanding, there are some interest rate subsidies available for certain categories of loans in drought-affected areas that may be reflected in the value of housing equity. It is not possible to take this into account in a systematic (and relatively straightforward) way and hence this is left for future research.
7 In aggregating housing payments to regional averages, the difference in timing of housing purchases (and associated loans) of various residents may add an extra complexity, especially if the average local housing prices are not highly correlated over time. That is, if the local prices are particularly dynamic or unpredictable and local houses are sold at different rates in different areas (i.e., variable rates of churn in the local housing market over time), then the relationship between average housing payments and local housing prices is further weakened.
Descriptive analysis of relationships between recent drought and migration
Setting the scene: Describing drought and migration, regional labour demand and housing markets
The BRS provided SLA level data on rainfall deficiency throughout Australia. There are strong theoretical reasons to expect that the effects of drought on migration, regional labour demand and housing markets are most pronounced in agricultural areas. Hence, the following provides a summary of SLAs that distinguishes between their drought status in agricultural areas, which is then contrasted with the analogous statistics for non-agricultural areas. Following the criteria used in defining the sample for the RRFS, an area was defined as being agricultural if more than 10% of the adult population was employed in agriculture. Note that the non-agricultural areas are further broken down into metropolitan and non-metropolitan SLAs because labour markets are likely to experience quite different conditions in these two areas (on average). For the remainder of this report, we refer to drought areas (0-10 percentiles) and other below average rainfall areas (10-50 percentiles). Note that for the sake of the exposition we will refer to the latter as "below average" areas rather than "other below average" areas, which is more technically correct.
Table 2 describes migration patterns, regional labour demand and housing markets using drought categories for the 2003-06 period. Before describing the statistical patterns in Table 2, it is worth noting the number of SLAs in the drought categories. There were 29 and 297 SLAs in the drought and below average rainfall areas respectively. Consequently, more weight should be given to the results for below average rainfall areas as the resulting statistics are based on more information (and hence are more reliable). There were 133 non-drought SLAs for the 2003-06 period. The areas classified as non-agricultural areas are defined on the basis of 2001 data and boundaries and consequently are held constant for all periods examined in this report - there are 333 non-metropolitan, non-agricultural SLAs and 528 metropolitan SLAs.
| Selected characteristics | Agricultural areas | Non-agricultural areas | |||
|---|---|---|---|---|---|
| Drought | Below average | Non-drought | Non-metropolitan | Metropolitan | |
| Migration patterns | |||||
| Out-migration (%) | 29.86 | 29.62 | 33.93 | 33.41 | 38.17 |
| In-migration (%) | 32.30 | 28.18 | 28.90 | 34.83 | 40.04 |
| Net migration (%) | 2.44 | -1.20 | -5.03 | 1.55 | 2.91 |
| Expected employment growth | |||||
| 1996-2001 (%) | 5.71 | 6.11 | 5.55 | 8.18 | 9.42 |
| 2001-06 (%) | 7.60 | 5.47 | 5.29 | 12.78 | 11.65 |
| Structural change | |||||
| Structural change 1996-2001 (%) | 9.35 | 8.38 | 9.66 | 8.54 | 6.01 |
| Change attributable to agriculture 1996-2001 (%) | 26.19 | 30.72 | 31.22 | 11.48 | 4.60 |
| Structural change 2001-06 (%) | 10.32 | 9.33 | 10.76 | 8.27 | 6.27 |
| Change attributable to agriculture 2001-06 (%) | 48.45 | 47.00 | 43.60 | 12.51 | 4.95 |
| Housing market | |||||
| Housing summary (PCA) | -0.47 | -0.62 | -0.83 | -0.03 | 0.69 |
| Weekly rent ($) | 112.45 | 103.26 | 96.70 | 141.86 | 183.07 |
| Monthly loan repayment ($) | 774.93 | 740.19 | 659.58 | 861.28 | 1042.63 |
| Number of observations | 29 | 297 | 133 | 333 | 528 |
Notes: Migration rates were measured for 2001-06. There were many fewer areas classified as being in drought than was the case for the RRFS. The reason for this is that the survey used BOM data on postal areas, which are usually substantially smaller than the SLAs used in this study. If rainfall is uneven across an SLA, it may be the case that one of an SLA's postal areas was technically in drought but the others were not.
It is somewhat counterintuitive that the out-migration rates are more than 4 percentage points lower than both the non-drought (agricultural) areas and other non-metropolitan areas. Indeed, out-migration in drought areas is over 8 percentage points lower than that in metropolitan areas. The main message is that, on average, residents were not more likely to move out of drought-affected areas and this may be due to other regional characteristics documented in Table 2. In terms of in-migration, drought areas actually have slightly higher rates than below average and non-drought areas, although not as high as in non-agricultural areas. The net effect of living in drought areas on migration is positive, but the effect of living in other agricultural areas on net migration is negative. Non-agricultural areas also have positive net migration rates (on average), but only metropolitan areas have higher net migration rates than drought areas.
One explanation for these seemingly incongruous higher in-migration and net migration rates in drought areas is that such areas have relatively buoyant labour and housing markets. The labour market is captured in Table 2 by expected employment growth rates, conditioned on the industry structure in 1996 and 2001. This shows that employment growth between 1996 and 2001 for drought SLAs, defined using 2003-06 rainfall, was not very different from other agricultural SLAs, but was substantially lower than in the more buoyant labour market in non-agricultural areas (especially metropolitan areas). However, the relatively high in-migration rates for the last inter-censal period (2003-06) for drought areas may be explained by the contemporaneous relative buoyancy of the labour market in these areas relative to the other agricultural areas. For example, the expected employment growth for 2001-06 was over two percentage points higher in drought areas than either below average or non-drought SLAs. It is also worth noting that the non-agricultural areas fared particularly well in terms of employment growth in the last inter-censal period.
The turbulence index is also reported in Table 2 (and elsewhere) to provide an indication of the extent of structural change in the local labour market, and hence how much economic stress needs to be accommodated by the local workforce. Structural change is measured for both the 1996-2001 and 2001-06 inter-censal periods. Both sets of estimates indicate that structural change is higher in agricultural areas than non-agricultural areas, but there was not as much variation in the turbulence index as we expected. Even more surprisingly, there were no substantial differences between agricultural areas after conditioning on the experience of drought in the 2003-06 period. On average, the only discernible pattern in the turbulence index in Table 2 is that agricultural areas are more likely to experience structural change than other areas, presumably because structural changes to the economy disproportionately affect agriculture. This claim is supported by the fact that the agricultural sector contributes almost equally to structural changes in both drought and non-drought areas. Indeed, the higher level of structural change in the last inter-censal period seems to result from a greater contribution from the agricultural sector in that period, irrespective of drought category.
One implication arising from Table 2 should be highlighted. The discussion above raised the possibility that agricultural drought might be identified by relatively high agricultural contributions to the structural change index. No one would argue that one would expect drought areas defined by rainfall deficits in 2003-06 period to have higher structural changes attributed to agriculture in earlier inter-censal periods, and of course this is not observed. However, given that the last inter-censal period covers the timeframe of rainfall deficiency used to define drought in this table, it is not surprising that the percentage of structural change between 2001 and 2006 is somewhat higher in drought areas vis-à-vis non-drought areas (4.9 and 3.6 percentage points respectively). While the prediction that the more intense droughts will lead to greater declines in agricultural sector (because of productivity declines) appears to be borne out by the data, it is left for future research to ascertain whether this observation is functionally useful for assisting analysts to better define drought.8
The housing market also seems to explain some of the migration patterns described above. Both housing rents and monthly housing payments are higher in drought SLAs compared to either below average SLAs or non-drought SLAs, especially the latter. Of course, both rents and housing payments are substantially higher in non-agricultural SLAs (especially metropolitan areas). These observations are confirmed in the pattern of the PCA index for housing payments calculated to summarise the housing market. Therefore, the relatively high in-migration rates in drought SLAs can in part be explained by relatively buoyant labour and housing market relative to other agricultural areas.
Table 3 reports the analogous statistics for agricultural areas, disaggregated by drought category defined by local rainfall deficiencies for the three years leading up to the 1996 Census (1993-96) and the 2001 Census (1998-2001). As explained above, non-agricultural SLAs do not change and hence those benchmarks are provided only in Table 2. It is clear that the extent of the drought was less pronounced in these periods compared to the 2003-06 drought categories, at least in terms of the number of SLAs in drought categories. There were 22 drought areas for 1993-96 and only 2 such areas for 1998-2001 (compared to 29 such areas in 2003-06). In terms of below average rainfall areas, there were 224 and 152 SLAs classified as such in the periods that began in the 1990s (compared to 297 for the later drought). Given that the evidence in Table 1 and elsewhere supports the cumulative effect of low rainfall in many regions, these below average rainfall areas may be at risk of falling into drought in future. It seems reasonable to claim on this specific evidence that the recent Australian experience of drought has been more extensive and intense than other Australian droughts, at least over the last two decades.
| Selected characteristics | 1993-96 drought categories | 1998-2001 drought categories | ||||
|---|---|---|---|---|---|---|
| Drought | Below average | Non-drought | Drought | Below average | Non-drought | |
| Expected employment growth | ||||||
| 1996-2001 (%) | 4.71 | 5.87 | 6.10 | 6.86 | 6.05 | 5.85 |
| 2001-06 (%) | 2.55 | 5.91 | 5.49 | 7.10 | 4.86 | 5.89 |
| Structural change | ||||||
| Structural change 1996-2001 (%) agriculture | 8.68 | 8.82 | 8.82 | 8.01 | 8.27 | 9.08 |
| Change attributable to 1996-2001 (%) | 34.50 | 28.44 | 32.42 | 12.63 | 33.11 | 29.43 |
| Structural change 2001-06 (%) | 8.88 | 9.60 | 10.13 | 6.92 | 8.81 | 10.32 |
| Change attributable to agriculture 2001-06 (%) | 38.44 | 45.05 | 48.01 | 57.62 | 45.56 | 46.31 |
| Housing market | ||||||
| Housing summary (PCA) | -1.00 | -0.69 | -0.61 | -0.79 | -0.71 | -0.64 |
| Weekly rent ($) | 85.95 | 101.31 | 104.25 | 96.00 | 100.86 | 102.51 |
| Monthly loan repayment ($) | 619.50 | 710.79 | 737.96 | 683.50 | 699.11 | 729.18 |
| Number of observations | 22 | 224 | 213 | 2 | 152 | 305 |
Table 3 indicates that drought areas for 1993-96 could expect less employment growth in the last two inter-censal periods. The expected employment growth (and hence labour demand) was particularly low in these areas between 2001 and 2006 - one possibility is that this was a result of the ongoing effects of drought. However, this hypothesis is not supported by the relatively low contribution from agriculture to the structural change experienced in that inter-censal period. Hence, the depressed labour market conditions in these areas are due to idiosyncratic regional effects. This observation underscores the importance of controlling for systematic regional variation in the multivariate analysis that follows.
It should also be noted that there was no substantial difference in the labour demand measure between below average and non-drought areas for the 1993-96 categories for either inter-censal period. If we examine the 1998-2001 drought categories, there were few differences in labour demand between any of the agricultural areas. The only possible exception is that below average rainfall areas for 1998-2001 had expected employment in the last inter-censal period that was one percentage point lower than those for non-drought SLAs. There did appear to be even higher labour demand in drought SLAs for 1998-2001, but given that these averages only relate to two areas, such anomalies could be potentially explained by regional idiosyncrasies of these areas. Hence, for the remainder of this report it would be advisable to treat the results for drought areas in 1998-2001 with caution.
As argued above, there is not much variation in the overall turbulence index or structural changes between drought categories for the two periods reported in Table 3. If anything, structural change is slightly less pronounced in drought areas. The contribution of agriculture to structural change was arguably most pronounced just after the drought in question finished. For example, 1996-2001 structural changes attributable to agriculture were most pronounced for drought (1993-96) and below average (1998-2001) areas. The structural change attributable to agriculture was markedly less for these categories in the last inter-censal period. Drought may hasten some structural change in the areas affected and the timing of the structural change is likely to be important for any putative uses of such indices in measuring, or rather benchmarking, a definition of agricultural drought.
The housing indicators in Table 3 were measured at the time of the 2001 Census and hence cannot be used to capture changes in housing market conditions; however, it may capture broad difference in the long-run regional housing market and relate such differences to the length of time since the drought in question. For example, if we focus on the 1998-2001 drought categories, drought SLAs had lower rents and housing payments, and hence a lower housing index as measured by the PCA summary measure. As expected, the housing index is lowest in drought SLAs, although the variation in the index between drought categories is not that large. However, if we focus on the drought categories for 1993-96, then non-drought areas have rents and housing repayments that are 20% higher than drought areas. That is, the longer time that has passed since the drought event, the more time economic factors have had to depress local housing prices.
These observations illustrate the importance of controlling for a range of regional characteristics, especially local economic characteristics, in the multivariate analysis of the relationship between migration and drought. Before doing this analysis, it may be useful to get a sense of which areas people move from or where they move to before and after a drought. The easiest way to summarise these complex patterns of migrations is to provide the gross flows of population by the drought categories used above (in a tabular form).
Migration flows and drought
One of the crucial questions for this report is: Where do people from drought-affected areas move to? The obverse of this is: Who are the people who move into drought-affected areas?
Table 4 attempts to answer these questions by documenting the percentage of the 2006 population in drought categories (defined using 2003-06 rainfall deficiency data) who lived in the same drought categories five years earlier. Before documenting these population flows in some detail, it is worth describing the number of people living in drought-affected areas in 2006. Of the over 2 million people (aged over 5) living in agricultural areas, only half a million lived in non-drought areas. A substantial number lived in drought areas (149,633). Of course in a highly urban society it is not surprising that almost nine million lived in metropolitan areas, while around five and a half million lived in non-metropolitan, non-agricultural areas.
| 2001 residence | 2006 residence | ||||
|---|---|---|---|---|---|
| Agricultural areas | Non-agricultural areas | ||||
| Drought (%) | Below average (%) | Non-drought (%) | Non-metropolitan (%) | Metropolitan (%) | |
| Agricultural areas | |||||
| Drought | 71.6 | 0.5 | 0.3 | 0.3 | 0.1 |
| Below average | 4.9 | 80.3 | 4.1 | 2.9 | 0.9 |
| Non-drought | 1.1 | 1.6 | 80.5 | 1.0 | 0.4 |
| Non-agricultural areas | |||||
| Non-metropolitan | 13.0 | 10.4 | 8.8 | 85.5 | 5.3 |
| Metropolitan | 9.4 | 7.3 | 6.3 | 10.3 | 93.2 |
| Total (% of 2001 population) | 100.0 | 100.1 | 100.0 | 100.0 | 99.9 |
| Total (number) | 149,633 | 1,381,031 | 506,644 | 5,467,698 | 8,759,612 |
Note: Percentages may not total 100% due to rounding.
One of the dominant stylised observations in Table 4 is that a person who lived in one type of area in 2006 is most likely to have lived in the same category of area in 2001. This observation is not surprising in that most people did not change their usual residence and those that did are more likely to have moved locally. However, it is more noteworthy that residents of drought areas were the least likely to have not moved out of a drought area (71.6% compared to over 80% for the other types of areas, with one extreme being metropolitan areas, where 93.2% of the population also lived in metropolitan areas in 2001). This pattern of population flow is consistent with fewer people wanting to stay in drought areas. The same could be said for below average rainfall areas in that there is little difference between the percentage staying in such areas and the percentage staying in non-drought areas. Very few of the 2006 residents in the non-drought areas came from areas that were in the drought categories in 2001.
Another observation from Table 4 is that a substantial number of residents of drought-affected areas came from non-agricultural areas, especially those in non-metropolitan areas. So it appears that the recent experience of drought is not dissuading everybody from migrating to these drought areas. People in non-agricultural SLAs may move to drought-affected areas for either social (family) or economic reasons. As discussed above, the relatively buoyant labour market conditions in some drought areas may attract some migrants, and lower housing prices in such areas may be attractive to residents from the more expensive housing markets (e.g., metropolitan areas).
Appendix A documents the gross flows for the total resident population across earlier drought categories (1993-96) and flows over an earlier inter-censal period (1996-2001). These data are in agreement with those in Table 4, showing that populations in drought areas were less likely to have come from the same sorts of (drought category) area recorded in the earlier Census, and a substantial number of residents of drought areas came from non-agricultural areas (especially non-metropolitan areas).
The sub-population of most interest to readers of this report are workers in the agricultural sector and we replicate the analysis above for this group in isolation (see Table 5). In addition to a potential issue with geographic concordances between 2001 and 2006 SLA boundaries for these gross flows,9 there is an additional intrinsic issue that may affect the interpretation in Table 5. Specifically, industry affiliation was based on responses given at the time of the 2006 Census, whereas migration was based on changes in usual residence in the five years that preceded it. That is, we only picked up people who were currently employed in the agricultural sector and hence we did not pick up those who have left the sector. In a sense, we are capturing those who have made the decision to stay affiliated with agriculture. This may be an important issue if people who experience prolonged drought respond by leaving agriculture for other industries (literally, greener fields).
Notwithstanding these qualifications about population flows of agricultural workers, Table 5 may yield some useful insights, especially about those workers who stay in agriculture. For example, it illustrates that there were only 11,272 agricultural workers in drought areas in 2003-06, and a substantial number of Australia's agricultural workers live in below average rainfall areas (133,224). While there is a large number of agricultural workers living in nominally non-agricultural areas, this is largely due to the fact that so many people live in such areas. It is notable that more than half of all agricultural workers lived in below average rainfall areas in the 2003-06 period - areas that may become drought prone if below average rainfall continues to fall (see Table 1). However, a relatively low proportion of agricultural workers lived in areas that were specifically classified as being in drought according to "official" definitions described above. The relatively low numbers working in drought areas may reflect that many such workers have already left the sector, possibly as a result of the recent experience of drought. However, another possibility is that farming in the areas classified as drought is more capital intensive than other agricultural areas and hence fewer workers are required to support farm production.
| 2001 residence | 2006 residence | ||||
|---|---|---|---|---|---|
| Agricultural areas | Non-agricultural areas | ||||
| Drought (%) | Below average (%) | Non-drought (%) | Non-metropolitan (%) | Metropolitan (%) | |
| Agricultural areas | |||||
| Drought | 84.9 | 0.5 | 0.2 | 0.6 | 0.5 |
| Below average | 4.5 | 90.3 | 5.0 | 6.7 | 3.9 |
| Non-drought | 1.8 | 1.9 | 87.7 | 2.1 | 1.8 |
| Non-agricultural areas | |||||
| Non-metropolitan | 5.1 | 4.8 | 4.6 | 85.3 | 6.4 |
| Metropolitan | 3.7 | 2.5 | 2.5 | 5.4 | 87.4 |
| Total (% of 2001 population) | 100.0 | 100.0 | 100.0 | 100.1 | 100.0 |
| Total (number) | 11,272 | 133,224 | 52,927 | 53,984 | 21,007 |
Notes: The population in this table is all people who worked in an agricultural industry in 2006 (measured using the 1993 ANZSIC code). Percentages may not total 100% due to rounding.
Just as was observed in the previous table, Table 5 illustrates that agricultural workers in drought areas were more likely to stay in such areas than in other categories of drought areas. However, in contrast to Table 4, there is little difference in the propensity to stay in a type of area across the various drought categories. While agricultural workers in below average rainfall areas were more likely to be in the same areas in both 2001 and 2006, the overall impression is that agricultural workers were more likely to want to stay in drought areas than other residents of such areas. For example, total population flows in Tables 4 and 5 show that the average 2006 resident was 13.3 percentage points less likely to stay in drought areas (71.6%) compared to the analogous flow for farmers in such areas (84.9%). Agricultural workers seem to have more attachment to these areas than other residents in agricultural areas, and this observation is most pronounced in the most drought-affected areas. Therefore, despite the general economic effects of drought, agricultural workers and farmers are more likely to stay in such areas. Such workers are likely to have more to lose by moving away in terms of local social contacts and family relationships, and farmers may have an economic incentive to stay if they believe that the value of their asset will increase when a "temporary" drought finishes. The main point here is that the agricultural sector will have more to lose in moving away from drought areas.10 In contrast, agricultural workers in metropolitan areas are less likely to stay in such areas than other residents of these areas. This is probably not surprising in that such workers are likely to have had other options in agricultural areas in 2001. Another issue may be that the high demand for housing in the major cities has made the economics of farms in the peri-urban fringe unviable.
8 Note that the difference in the contribution to structural change is not great and the relationship between drought and the contribution of agriculture to overall structural change may not be monotonic. The fact that the contribution of agriculture to structural change is so high in non-drought areas may reflect the whole agricultural sector is experiencing large structural shocks which are depressing employment outcomes. Alternatively, it may be that many of the drought areas are close to the thresholds for the definition of drought based on the rainfall deficiency method and hence the effects on productivity were similar. Given the extent and depth of the recent experience of drought in Australia, this second possibility is not implausible.
9 The data requested from the ABS for this report on population sub-groups used 2001 SLA boundaries for a person's place of usual residence at the time of the 2006 Census, but 2006 SLA boundaries for a person's place of usual residence five years beforehand. Changes in geographic boundaries between Census years led to a number of people being classified as having changed their place of usual residence when in fact it was the boundaries that changed around them. This had the effect of artificially inflating inward and outward migration rates, making analysis at the SLA level prone to error. However, these problems were minimised at the broad drought region level.
10 Appendix B reports the gross flows for the agricultural sector between 2001 and 2006, conditioned upon the experience of drought in 1993-96. Again, the agricultural sector is more likely to have come from the same sort of area in drought areas in previous censuses. This demonstrates a commitment to living in such areas.
Multivariate analysis of out-migration, in-migration and net migration
This section uses data from the 2006 Census of Population and Housing to calculate in-migration, out-migration and net migration between 2001 and 2006. These variables are constructed based on the "usual residence 5 years ago" question and are related back to the 2001 geographic boundaries, using area-based concordances provided by the ABS.
In order to analyse the factors associated with migration, we construct a series of summary data for each SLA from the 2001 Census. The relationship between these variables and both the human capital and modified gravity models of migration is covered in the description of the results. Descriptive statistics for data used in the regression analysis are reported in Appendix C, Table C1. The variables used are:
- index of expected employment growth for 2001-06 (%) - based on the expected employment growth based on a weighted average of sectoral employment growth (measured at a national level), conditioned on industrial composition of an SLA in 2001;
- unemployment rate (% of labour force);
- PCA index of housing payments, calculated using the weekly rental data and monthly housing repayment data from the Census;
- percentage of employed residents in public sector;
- percentage of non-school population aged 15 years and over who completed Year 12;
- percentage of population identified as Indigenous (i.e., excluding those who did not respond to that question);
- percentage of families that have children aged 0 to 15 years;
- percentage of population in various age groups (10-year categories and 55 years and over);
- state indicators; and
- the ARIA++ indicator - the ABS Accessibility/Remoteness Index of Australia (ARIA) was further developed for the Western Australian Aboriginal Child Health Survey (WAACHS) into the ARIA++ index (Zubrick, et al., 2004), which provides a finely disaggregated measure of the accessibility of services in an area.
The above analysis provided an important background overview of labour and housing markets in drought-affected areas; however, all multivariate analyses need to also provide detailed information on the variables and sample used, as this assists in interpreting and understanding the reported results. Table C1 reports the descriptive statistics for all 1,320 SLAs used in the regression analysis (all defined on the boundaries used in the 2001 Census).
Regression analysis of migration, 2001-06
The statistical model used to summarise the relationship between drought and migration across SLAs uses ordinary least squares (OLS). Even though out-migration is bound between 0% and 100%, all measured rates are well within these bounds. The mean level of out-migration is 35% of the original resident population, with a standard deviation of around 14%. The mean measures of in-migration are similar to that for out-migration, although the standard deviation is somewhat higher because more than 100% of the original population can move into an area. Technically, net migration is not bounded because it can take on both negative and positive values. The mean net migration for 2001-06 was 1%, with a standard deviation of 24%. Robust standard errors are used for the analysis in this section.
The omitted categories for the regression analysis are non-drought, accessible SLAs and the state of NSW, with the percentage of the local population aged between 35 and 54 also being excluded. Readers should note that we have chosen the non-drought areas as the base category as these areas are included in the RRFS and hence the following conclusions have an analogous interpretation in that context. Consequently, the findings are directly relevant for interpreting that survey.
Out-migration
Appendix C, Table C2 reports the regression results for out-migration (in 2001-06), while Tables C3 and C4 focus on in-migration and net migration respectively (also for the last inter-censal period). The first two columns of those tables report the coefficients for controls; the next two columns report the coefficients for the drought categories only (measured using the 2003-06 data); and the final two columns report full models that include both controls and drought categories for the three years leading up to the last three censuses.
The main message from Appendix C, Table C2, is that drought variables are associated with lower out-migration - even after other regional factors are accounted for. Employment demand for workers in an SLA is captured by the expected growth of jobs available. In Table C2, increasing labour demand increases out-migration, but the result is only significant for the model that controls for drought during the 2003-06 period. The result can be rationalised because people with jobs will tend to have sufficient resources to move out. Higher local unemployment rates are associated with higher out-migration; however, this out-migration coefficient is only significantly higher when drought is also controlled for (and then only at the 10% level). Public sector employment is also significantly positively associated with out-migration (irrespective of whether the drought categories were included in the regression). Not only do public sector jobs have a wage premium compared to other employment, but large employers such as governments are more likely to have work options for individuals in other parts of the country, thereby directly affecting the capacity for out-migration. Interestingly, education levels (as captured by the proportion with Year 12 education) are significantly associated with higher out-migration rates. However, having more Indigenous people in an SLA is significantly associated with lower out-migration rates. This observation is consistent the fact that Indigenous people tend to be more likely to move within the local area and less likely to move between such areas (Biddle & Hunter, 2006).
As expected, the areas with a higher proportion of families with children aged 0 to 15 years tended to have lower out-migration rates. This is likely to be related to the costs of migration in that it is more difficult and disruptive to organise migration for dependents, such as when making new schooling arrangements. Older age groups (aged 55 and over) were also associated with lower out-migration rates, presumably because of the higher economic, social and psychic costs associated with moving for this group; for example, the opportunity costs of higher wages associated with age and the costs of moving away from social networks established over a longer period.
Another set of explanatory variables is the group of variables that control for the residual geographic factors not elsewhere accounted for. The patterns across state boundaries are consistent with expectations (e.g., Tasmania has low out-migration). Remote and very remote areas seemed to have higher out-migration, probably due to the lack of social connection that many (non-Indigenous) people have with such areas.
A particularly noteworthy finding is that despite the apparently, systematic difference in housing prices across drought areas noted earlier, there is no systematic relationship between the effect of housing payments for any of the regressions in Table C2. If housing prices are playing a role, it may be being picked up by one of the other controls (but not the drought variables, as housing payments are not significant even if such variables are omitted). However, it is also possible that drought causes endogenous falls in housing prices that are only perceptible in later censuses. That is, housing prices may be caused by drought rather than vice versa.
Overall, there appear to be some important interactions between drought and the labour market data - especially labour demand, as this factor only becomes significant when the incidence of drought is controlled for. The converse of this is that the effect of drought is enhanced by controlling for local labour demand. Given that the recent drought is rather pervasive, and therefore has even affected formerly prosperous areas, this observation is understandable.
In-migration
The analysis of in-migration between 2001 and 2006 is presented in Appendix C, Table C3. Overall, drought regions are associated with lower in-migration rates than non-drought areas, but the effect is only significant at the 5% level after all the regional controls are taken into account.
Having a buoyant local labour market, as captured by the expected job growth in an SLA, is significantly associated with higher rates of in-migration. Obviously, having some available jobs is an attraction for migrants to move into an area. The unemployment rate does not significantly affect in-migration, but completion of Year 12 education was a significant factor in explaining in-migration once local labour market conditions were controlled.
Areas with higher rents and housing payments (as indicated by the PCA index) were also associated with higher in-migration. Given that the main asset of most Australians is their home, it is not surprising that people are attracted to areas with buoyant housing markets where housing prices might be expected to increase in future.
In contrast to the out-migration analysis, having more jobs in the public sector was not a significant factor driving in-migration. While government jobs generally enjoy relatively good pay and conditions, the size of the sector has not grown significantly in recent decades (Commonwealth of Australia, 2007), and in some areas the proportion in such employment may have declined. Hunter (2007a) documented the substantial overall decline in public sector employment since the early 1980s. Consequently, if people wanted to move to find work, they would be more likely to be following employment in the private sector.
The proportion of the SLA population who identify as Indigenous was negatively associated with in-migration in 2001-06. As well as reflecting the generally lower rates of mobility for Indigenous Australians between SLAs, another factor may be that non-Indigenous people may be reluctant to move into areas where there are large numbers of Indigenous Australians. This reluctance may vary from a mild preference for living with people "like" yourself to outright discriminatory attitudes. However, both sets of attitudes can lead to highly segregated outcomes, as was demonstrated in Schelling's (1978) famous model based on moving black and white pieces around a chess board. Note that the desire to live with similar people is embedded in the modified gravity model of migration.
Demographic factors did throw up some potentially unexpected results for in-migration. While younger age groups (under 25 years old) are associated with higher in-migration rates, areas with more families with children are associated with significantly lower in-migration. One interpretation of this is that once the differences in resources are taken into account (e.g., the buoyancy of the local labour market), the location of educational institutions (which are presumably located where the children live), does not attract additional in-migrants on average. The dominant factor is that, for obvious reasons, it is more costly to move families with dependents.
The accessibility index has a negative association with in-migration in the more remote areas. This is easily explained by the fact that people have fewer reasons to move to an area that is further away from important infrastructure and services.
Net migration
Table C4 reports the net effect of in-migration and out-migration taken together (for 2001-06). Again we focus on the full model with controls first before providing a detailed scrutiny of the apparent effects of living in drought effects areas, vis-à-vis other SLAs. Overall, net migration follows fairly similar patterns to those identified in the results for in-migration; however, minor differences do arise when factors associated with out-migration are at odds with the in-migration results. A buoyant local labour market is associated with higher net migration, and once this is taken into account, neither the unemployment rate or education factors are significant at the 10% level. SLAs with more Indigenous residents are associated with lower net migration, while younger age groups (under 25 years old) are associated with significantly higher net migration rates, and areas with more families with children are associated with significantly lower net migration, presumably for similar reasons to that identified in the discussion of Table C3. Less accessible areas tend to have significantly lower net migration rates.
Overall, Appendix C illustrates that the controls for observable regional factors overwhelmingly have the effect predicted by the human capital theories of migration referred to above and hence it is crucial that our assessment of the association between drought and migration takes this into account. Table 6 summarises the apparent effect of drought on out-migration, in-migration and net migration for all the drought periods examined in this report: 1993-96, 1998-2001 and 2003-06 (but in reverse temporal order). Given that it is important to control for observable regional characteristics in order to get some sense of the true association between drought and migration patterns, the ceteris paribus assumption is used; that is, other regional factors are held constant. Drought areas are compared with non-drought SLAs defined for the three drought periods examined in this report. The 2003-06 drought areas had lower out-migration and in-migration rates than non-drought areas, but the net effect on migration was not significant for either drought or below average rainfall areas. In the short run, there was no effect of drought on net migration. While the overall level of population was not affected much by the incidence of recent drought, the composition of the resident population may have changed as the types of people moving out and moving in are likely to have been systematically different.
| Out-migration | In-migration | Net migration | ||||
|---|---|---|---|---|---|---|
| Drought periods 2003–06 | ||||||
| Drought | –9.23 | (1.65) | –9.54 | (1.95) | –0.60 | (1.42) |
| Below average | –4.91 | (1.59) | –3.97 | (1.81) | 1.07 | (0.93) |
| Drought periods 1998–2001 | ||||||
| Drought | –5.09 | (1.22) | –5.64 | (1.92) | –1.27 | (1.61) |
| Below average | –4.19 | (0.84) | –3.77 | (1.14) | 0.42 | (1.05) |
| Drought periods 1993–96 | ||||||
| Drought | –2.07 | (1.68) | –5.23 | (2.18) | –3.64 | (1.92) |
| Below average | 0.61 | (1.49) | –0.52 | (1.74) | –1.34 | (1.06) |
Notes: Standard errors are reported in parentheses. Full regression results are reported in Appendix C for the 2003-06 drought categories; however, it should be noted that the control variables for the other drought categories for 1993-96 and 1998-2001 have a similar relationship with the various aspects of migration reported in this table.
Drought measured using 1998-2001 data was not significantly related to net migration between 2001 and 2006; however, drought and below average rainfall areas again had significantly lower out-migration and in-migration rates.
In the longer run, drought may have a greater effect on the resident population. Table 6 shows that if one focuses on the drought categories for the 1993-96 period, the negative effect on in-migration is relatively strong, but the effect on out-migration is not significant. Living in one of the 22 SLAs that experienced a drought between 1993 and 1996 was associated with lower net migration. In contrast, there was no significant effect of living in below average rainfall areas on any of the three forms of migration.
The significant difference between the effect of living in drought versus below average rainfall areas can be seen in several entries in Table 6. This finding provides an ex poste rationalisation for the decision to distinguish between drought and below average rainfall areas in the sample design of the RRFS (Hunter, 2007b).
Given that the changes in in-migration and out-migration seem to balance out for more recent droughts, it is plausible that the analysis of RRFS data can ignore migration issues, especially if the analysts control for other relevant observable regional characteristics. However, in the long run, drought is more likely to feed back on the regional economy and hence the regional population. While it is arguable that, on average, the feedback between drought and population can be ignored in the short run, it is fairly clear that there were substantial changes in the composition of the local population as a result of drought. Some of the preliminary analyses from Edwards, Gray, Hunter, and De Vaus (2008) are presented in the next section to illustrate some of the relevant issues.
Drought and mobility in the RRFS
In addition to including a subjective definition of drought, the RRFS covers a range of both outcomes and other factors that have been hypothesised to be associated with, if not driven by, low rainfall events (that is, basic demographics; mobility; labour force status; income; financial hardship; farming issues; health issues such as physical, mental health and alcohol use; relationships/family functioning and community cohesion arising from the decline in key services; and so on). The AIFS study is unique, as there are no other large-scale studies of drought and families in Australia or internationally. In Australia, the historical focus has been on in-depth studies of particular communities (Alston & Kent, 2008; Dean & Stain, 2007: 334 interviews with children; Stehlik, Gray, & Lawrence, 1999: 103 interviews). Although there is little research on the direct impact of drought, there is a substantial international literature on the risk factors that are likely to be associated with climate change and drought (McMichael, 2008).
The issue of migration has also been discussed in the international literature in the context of climate change and drought, but more often than not it focuses on climate-change-induced migration in a third world context (Reuveny, 2007). Reuveny surveyed much of the relevant literature and found only a few historical episodes of migration in developed countries being pushed by climate change factors (e.g., the North American "dust bowl" phenomenon in the 1930s). It is interesting to note that most of the episodes of such migration were associated with some degree of political conflict.
The RRFS includes several basic socio-demographic covariates that should be controlled for in an analysis of mobility, including:
- age;
- gender;
- Aboriginal or Torres Strait Islander status;
- education;
- child in household; and
- state, by remoteness indicators.
A preliminary logistic regression analysis of the possible effects of drought was presented by Edwards, Gray, Hunter, and De Vaus (2008), which formed the basis of a submission to the Productivity Commission Inquiry into Government Drought Support (Edwards, Gray, & Hunter, 2008).
The RRFS asked respondents whether anyone who had lived in their household had permanently moved out of the area (defined by a postcode) in the last 3 years. Respondents were also asked how many times they personally had moved between areas in the last 3 years (moves within a particular area were excluded). One of the difficulties in collecting information on the impacts of drought on residential mobility using a cross-sectional survey is that only those still living in the area at the time of the survey can be interviewed. This will tend to bias the sample towards those with a lower propensity to move. Accordingly, Figure 1 separately reports the probability of moving out of an area for respondents and for other members of the household.
Figure 1: Probability of moving out of the area in last 3 years, by social definition of drought
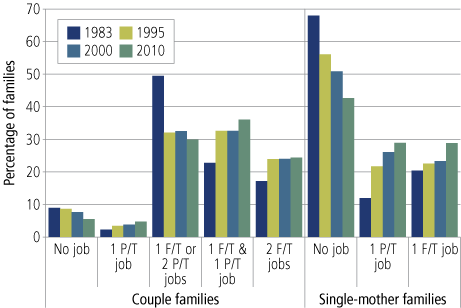
Note: Predicted probabilities derived from logistic regression, reported in Edwards, Gray, Hunter, and De Vaus (2008). The 'I' bars are 95% confidence intervals, which were not reported in the original paper.
Source: Rural and Regional Families Survey
When drought is measured by the social definition of drought, respondents are slightly less likely to move out of current drought areas, compared to non-drought areas (10.4% as opposed to 12.9%). The difference in mobility of those who lived in areas that had experienced drought in the last year and non-drought areas was also significant at the 5% level.
In contrast, other household members tended to be more likely to move out of drought-affected areas than non-drought areas. For example, other householders in areas that had experienced drought in the last year were about 3 percentage points more likely to have moved (10.9% as opposed to 7.5%). Probably the most interesting fact to arise from Figure 1 is that in areas that had not experience drought in the last 5 years, respondents were significantly more likely to move out in the last 5 years than other household members.
The mobility patterns for drought areas defined by the BOM rainfall percentiles for 2004-07 were also estimated in Edwards, Gray, Hunter, and De Vaus (2008). While the patterns were broadly similar, the standard errors were somewhat higher and hence only the largest differences between the estimates were significant.
Taken together, these findings on residential mobility seem to indicate that households were adjusting to adverse circumstances in drought-affected areas, with some members of households probably moving (temporarily or otherwise) towards areas with greater economic opportunity. The lower level of respondent mobility, according to the self-reported definition of drought, may be associated with members of the household with greater responsibilities (for the property, for instance) having lower mobility and therefore staying behind. However, it is also probable that the dynamics of drought areas is complicated by residents' desire to hold out for higher property prices when the rain eventually comes (or output prices improve).
In addition to examining the association between drought and mobility, the AIFS survey also looked at other social and economic outcomes that may be affected by drought (Edwards, Gray, Hunter, & De Vaus, 2008). The AIFS submission to the Productivity Commission (Edwards, Gray, & Hunter, 2008), concluded that:
drought was … associated with a higher rate of closure of key services and more people reporting low levels of community social cohesion. However, drought was also associated with higher rates of membership of community organisations. … The effects of drought on residential mobility are quite hard to estimate. However, our analysis seems to indicate that households were adjusting to adverse circumstances in drought-affected areas, with some members of households probably moving (temporarily or otherwise) towards areas with greater economic opportunity (p. 5).
Overall, the evidence from the report of the Productivity Commission (2009) suggests that when it comes to matters such as financial hardship, mental health and community cohesion, drought is a factor but is not the dominant influence. The report also concluded that there is a higher prevalence of some social problems among farmers compared to the general population, regardless of drought status.
Edwards, Gray, Hunter, and De Vaus (2008) identified some important factors associated with drought, but the conclusions must ultimately be conditioned by the fact that the analysis is based on a sample of 8,000 people in non-metropolitan agricultural areas. The preceding Census analysis is an attempt to identify broader migration patterns in regional Australia that might be related to the recent experience of "drought". The contrast between the Edwards, Gray, Hunter, and De Vaus study of migration and the Census-based regional analysis above show the importance of conducting an individual-level analysis. The concluding section summarises the main findings of this report, with a view to highlighting the major implications for the RRFS.
Conclusion
There are strong incentives for people to leave drought areas if adverse conditions persist in the long run; however, there is no necessary reason why this effect will be apparent in the short run. The main finding of this report is that it is important to differentiate the processes of migration so that policy-makers understand the factors that affect moving into and out of areas. While the role of migration is more complex than previously thought, policy-makers still need to take it into account in regional economic plans and demographic projections. The research community also needs to take into account the role of selective migration in altering estimated models of individual behaviour in the social and economic domains.
It should be noted that we should make a clear distinction between mobility and migration (based on the time horizon of the person who moves, and the anticipated permanence of the decision). The apparent differences between the short-run and long-run responses to drought seem to highlight the need for this distinction. Notwithstanding, the geographic and individual behaviours associated with high rates of migration are broadly consistent with the human capital of mobility.
Despite the lack of access to unit record Census data, we initially intended to break down the analysis by age, education and farmers to examine/analyse the specific migration patterns for these sub-populations. Unfortunately, the migration cross-tabulations provided by the ABS were not amenable to such an analysis. The analysis of migration for these sub-populations is therefore left for future research.
While some doubt remains about data quality, at least in terms of the complexity of defining consistent geographic boundaries over time, the results of the analysis of AIFS data should be reasonably robust, as they have been validated through benchmarking against other measures of drought. Drought appears to provide some incentives for some household members to move away from the area, while other household members remain more attached to the local area. The above Census-based analysis confirms the findings on mobility in Edwards, Gray, Hunter, and De Vaus (2008).
The good news from this report is that the net effect of drought on migration is small or insignificant in the short run. While analysts need to be mindful of the possible changes in the composition of the population in drought-affected areas, their research needs only to be suitably qualified.
Perhaps the most important effect of drought is on the increased stress it places on families who are adjusting to financial pressures generated by regional decline. The long-term fragmentation of families who send some of their number to find work is unlikely to be sustainable in the long run, as families will grow apart to adjust to the new "permanent" reality. Of course, one cannot presume anything is permanent when it comes to the weather, and hence the effect of drought is intrinsically indeterminate and uncertain.
References
- Australian Bureau of Statistics. (2006). Australia's environment: Issues and trends (Cat. No. 4613.0). Canberra: ABS.
- Australian Bureau of Statistics. (2009). Census of Population and Housing: Census sample file (expanded 5% data file) 2006 (Cat. No. 2037.0.55.001). Canberra: ABS.
- Alston, M., & Kent, J. (2008). The big dry: The link between rural masculinities and poor health outcomes for farming men. Journal of Sociology, 44(2), 133-147.
- Argent, N., Rolley, F., & Walmsley, J. (2008). The sponge city hypothesis: Does it hold water? Australian Geographer, 39(2), 109-130.
- Bureau of Agricultural Economics. (1975). Welfare and resource use effects: A study of the exodus from dairying in south east Queensland. Canberra: Australian Government Publishing Service.
- Barr, N. (2004). The micro-dynamics of change in Australian agriculture, 1976-2001 (ABS cat. No. 2055.0). Canberra: ABS.
- Biddle, N. (2008). A technical note on spatial concordances and Indigenous population change, 2001 to 2006. Canberra: Centre for Aboriginal Economic Policy Research. Retrieved from <www.anu.edu.au/caepr/system/files/page/2009/02/Biddle_TN01.pdf>.
- Biddle, N., & Hunter, B. H. (2006). An analysis of the internal migration of Indigenous and non-Indigenous Australians. Australian Journal of Labour Economics, 9(4), 321-341.
- Bureau of Meteorology. (2007). Six years of widespread drought in southern and eastern Australia: November 2001-October 2007 (Special Climate Statement 14). Melbourne: BOM.
- Bradley, R., & Gans, J. (1998). Growth in Australian cities. The Economic Record, 74, 266-278.
- Central NSW Councils. (2008). [Submission to the National Review of Drought Policy, Assessment of the social impacts of drought (PDF 65 KB)]. Lithgow, NSW: Central NSW Councils. Retrieved from <www.pc.gov.au/__data/assets/pdf_file/0010/83296/sub105.pdf>.
- Clawson, M. (1963). Aging farmers and agricultural policy. Journal of Farm Economics, 45(1), 13-30.
- Commonwealth of Australia. (2007). State of the service: 2006-07. Canberra: Australian Public Service Commission.
- CSIRO. (2008). CSIRO Mark 3.5 climate model, IPCC SRES A1B emissions scenario: Change relative to 1980-1999 average. Melbourne: CSIRO Division of Marine and Atmospheric Research.
- Dean, J., & Stain, H. J. (2007). The impact of drought on the emotional well-being of children and adolescents in rural and remote New South Wales. The Journal of Rural Health, 23(4), 356-364.
- Department of Employment and Workplace Relations. (2007). Small area labour market: Australia. March Quarter. Canberra: DEWR.
- Driver, C., & Dunne, P. (1992). Structural change in the UK economy. Cambridge: Cambridge University Press.
- Dunteman, G. H. (1989). Principal components analysis. Newbury Park, CA: SAGE Publications.
- Edwards, B., Gray, M., & Hunter, B. (2008). Social and economic impacts of drought on farm families and rural communities: Submission to the Productivity Commission's Inquiry into Government Drought Support. Melbourne: Australian Institute of Family Studies.
- Edwards, B., Gray, M., Hunter, B., & De Vaus, D. (2008, 11 July). "Her beauty and her terror, the wide brown land for me!" The individual and family wellbeing of Australian rural and regional families in drought. Paper presented at the 11th AIFS Conference, Families through Life, Melbourne. Retrieved from <www.aifs.gov.au/institute/afrc10/edwardsb1.pdf>.
- Garnaut, R. (2008). The Garnaut Climate Change Review: Final report. Melbourne: Cambridge University Press.
- Greenwood, M. J. (1997). Internal migration in developed countries. In M. R. Rosenzweig & O. Stark (Eds.), Handbook of population and family economics (pp. 647-720). Amsterdam: Elsevier Science.
- Harris, J. R., & Todaro, M. P. (1970). Migration, unemployment and development: A two-sector analysis. American Economic Review, 60(1), 126-142.
- Hunter, B. H. (2007a). Arguing over [the] remote control: Why Indigenous policy needs to be based on evidence and not hyperbole. Economic Papers, 26(1), 44-63.
- Hunter, B. H. (2007b). Report on the sample methodology for Australian Institute of Family Studies project, The Impact of Drought on Families in Rural and Regional Australia: A report to the Australian Institute of Family Studies. Melbourne: AIFS.
- Karmel, T., McHugh, B., & Aungles, P. (1993). Regional labour market disadvantage (Social Justice Research Program into Locational Disadvantage Report No. 16). Canberra: Department of Health, Housing, Local Government and Community Services.
- Katz, L. F., & Murphy, K. M. (1992). Changes in relative wages, 1963-1987. Quarterly Journal of Economics, 107(1), 35-78.
- Khwaja, Y. (2002). Should I stay or should I go? Migration under uncertainty. A real options approach (Economics and Finance Discussion Papers No. 02-10). London: Economics and Finance Section, School of Social Sciences, Brunel University.
- Layard, R., Nickell, S., & Jackman, R. (2005). Unemployment, macroeconomic performance and the labour market. Oxford: Oxford University Press.
- Lillien, D. (1982). Sectoral shifts and sectoral unemployment. Journal of Political Economy, 90(4), 777-793.
- McMichael, A. J. (2008). Rural Australia: Coping in a warmer dryer world. The need for coordinated multisector research to facilitate risk reduction (Submission number 87 to the Drought Policy Review). Canberra: National Centre for Epidemiology and Population Health, Australian National University. Retrieved from <www.daff.gov.au/__data/assets/pdf_file/0004/805828/McMichael,_A.J.pdf>.
- Productivity Commission. (2009). Government drought support (Productivity Commission Inquiry Report No. 46). Melbourne: Productivity Commission,.
- Raupach, M. R., Briggs, P. R., King, E. A., Paget, M., & Trudinger, C. M. (2007). Australian Water Availability Project (AWAP): CSIRO Marine and Atmospheric Research Component. Final Report for Phase 2. Canberra: CSIRO Earth Observation Centre.
- Reuveny, R. (2007). Climate change-induced migration and violent conflict. Political Geography, 26(6), 656-673.
- Schelling, T. (1978). Micromotives and macrobehaviour. New York: W. W. Norton & Company.
- Sjaastad, L. (1962). The costs and returns of human migration. Journal of Political Economy, 70(5), 80-93.
- Stehlik, D., Gray, I., & Lawrence, G. (1999). Drought in the 1990s: Australian farm families' experiences. Rockhampton, QLD: Rural Industries Research and Development Corporation.
- Stewart, J. (1947). Empirical mathematical rules concerning the distribution and equilibrium of population. Geographical Review, 37, 461-485.
- Wahlquist, Å. (2008). Thirsty country: Options for Australia. Sydney: Allen & Unwin.
- Yankow, J. J. (2003). Migration, job change, and wage growth: A new perspective on the pecuniary return to geographic mobility. Journal of Regional Science, 43(3), 483-516.
- Zubrick, S. R., Lawrence, D. M., Silburn, S. R., Blair, E., Milroy, H., Wilkes, T. et al. (2004). The health of Aboriginal children & young people (The Western Australian Aboriginal Child Health Survey, Vol. 1). Perth: Telethon Institute for Child Health Research.
Lists of tables and figures
List of tables
- Table 1. Stability and change in rainfall distributions, non-metropolitan areas, 1993–2006
- Table 2. Selected summary statistics for SLAs, by 2003–06 drought categories
- Table 3. Labour and housing markets during and after the droughts of the 1990s, agricultural SLAs
- Table 4. Gross population flows between 2001 and 2006, by 2003–06 drought categories, 2006 population aged over 5 years
- Table 5. Gross flows between 2001 and 2006, by 2003–06 drought categories, 2006 workers in agricultural sector
- Table 6. Migration rates, between 2001–06 censuses and recent drought periods (ceteris paribus)
List of figures
Appendix tables
- Table A1. Gross migration flows between 1996 and 2001, by 1993–96 drought categories, 2001 population aged over 5 years
- Table A2. Gross migration flows between 1996 and 2001, by 2003–06 drought categories, 2001 population aged over 5 years
- Table A3. Gross migration flows between 2001 and 2006, by 1993–96 drought categories, 2006 population aged over 5 years
- Table B1. Gross migration flows between 2001 and 2006, by 1993–96 drought categories, 2006 workers in agricultural sector
- Table C1. Descriptive statistics for regressions, all 1,320 SLAs defined using 2001 population/boundaries 29
- Table C2. 2001–06 out-migration regressions, all SLAs
- Table C3. 2001–06 in-migration regressions, all SLAs
- Table C4. 2001–06 net-migration regressions, all SLAs
Appendix A: Gross migration flows across drought categories (total population)
| 1996 residence | 2001 residence | ||||
|---|---|---|---|---|---|
| Agricultural areas | Non-agricultural areas | ||||
| Drought (%) | Below average (%) | Non-drought (%) | Non-metropolitan (%) | Metropolitan (%) | |
| Agricultural areas | |||||
| Drought | 78.1 | 0.4 | 0.1 | 0.2 | 0.1 |
| Below average | 5.6 | 80.4 | 1.8 | 2.2 | 1.0 |
| Non-drought | 1.0 | 2.0 | 83.6 | 2.1 | 0.8 |
| Non-agricultural areas | |||||
| Non-metropolitan | 10.7 | 9.9 | 8.6 | 84.9 | 5.9 |
| Metropolitan | 4.6 | 7.2 | 5.9 | 10.6 | 92.3 |
| Total (% of 2001 population) | 100.0 | 99.9 | 100.0 | 100.0 | 100.1 |
| Total (number) | 72,593 | 978,916 | 979,433 | 5,250,148 | 8,612,181 |
Note: Percentages may not total 100% due to rounding.
| 1996 residence | 2001 residence | ||||
|---|---|---|---|---|---|
| Agricultural areas | Non-agricultural areas | ||||
| Drought (%) | Below average (%) | Non-drought (%) | Non-metropolitan (%) | Metropolitan (%) | |
| Agricultural areas | |||||
| Drought | 74.3 | 0.4 | 0.2 | 0.3 | 0.1 |
| Below average | 4.9 | 82.3 | 3.9 | 3.1 | 1.2 |
| Non-drought | 1.1 | 1.4 | 81.3 | 1.1 | 0.5 |
| Non-agricultural areas | |||||
| Non-metropolitan | 11.3 | 9.4 | 8.5 | 84.9 | 5.9 |
| Metropolitan | 8.4 | 6.5 | 6.1 | 10.6 | 92.3 |
| Total (% of 2001 population) | 100.0 | 100.0 | 100.0 | 100.0 | 100.0 |
| Total (number) | 143,549 | 1,371,471 | 515,922 | 5,250,148 | 8,612,181 |
| 2001 residence | 2006 residence | ||||
|---|---|---|---|---|---|
| Agricultural areas | Non-agricultural areas | ||||
| Drought (%) | Below average (%) | Non-drought (%) | Non-metropolitan (%) | Metropolitan (%) | |
| Agricultural areas | |||||
| Drought | 77.3 | 0.4 | 0.1 | 0.2 | 0.0 |
| Below average | 5.6 | 78.5 | 2.0 | 2.1 | 0.8 |
| Non-drought | 1.3 | 2.2 | 81.9 | 1.9 | 0.6 |
| Non-agricultural areas | |||||
| Non-metropolitan | 11.6 | 11.0 | 9.3 | 85.5 | 5.3 |
| Metropolitan | 4.3 | 7.9 | 6.8 | 10.3 | 93.2 |
| Total (% of 2001 population) | 100.1 | 100.0 | 100.1 | 100.0 | 99.9 |
| Total (number) | 70,297 | 987,828 | 979,182 | 5,467,698 | 8,759,612 |
Note: Percentages may not total 100% due to rounding.
Appendix B: Gross migration flows across drought categories (all workers in the agricultural industry)
| 2001 residence | 2006 residence | ||||
|---|---|---|---|---|---|
| Agricultural areas | Non-agricultural areas | ||||
| Drought (%) | Below average (%) | Non-drought (%) | Non-metropolitan (%) | Metropolitan (%) | |
| Agricultural areas | |||||
| Drought | 87.1 | 0.5 | 0.1 | 0.4 | 0.2 |
| Below average | 4.9 | 88.6 | 2.4 | 4.4 | 3.6 |
| Non-drought | 1.0 | 2.8 | 90.9 | 4.5 | 2.4 |
| Non-agricultural areas | |||||
| Non-metropolitan | 5.2 | 5.2 | 4.4 | 85.3 | 6.4 |
| Metropolitan | 1.8 | 3.0 | 2.2 | 5.4 | 87.4 |
| Total (% of 2001 population) | 100.0 | 100.1 | 100.0 | 100.0 | 100.0 |
| Total (number) | 9,069 | 88,289 | 100,065 | 53,984 | 21,007 |
Notes: The population in this table is all people who worked in an agricultural industry in 2006 (measured using the 1993 ANZSIC code). Percentages may not total 100% due to rounding.
Appendix C: Regression results
| Abbreviated variable name | Description | Mean | Standard deviation |
|---|---|---|---|
| exempg~d0601 | Expected employment growth 2001-06 (%) | 9.81 | 4.89 |
| unem_perc | Unemployment rate (% of labour force) | 7.18 | 3.30 |
| housingpay~t | Summary of housing payment (PCA score) | 0.04 | 0.94 |
| govt_perc | Employed in public sector (%) | 19.73 | 9.45 |
| yr12_perc | Year 12 completed (%) | 45.66 | 16.82 |
| ind_perc | Indigenous Australians (%) | 4.90 | 11.96 |
| wtchild_perc | Families with children (%) | 72.02 | 9.07 |
| aged00to14~c | Aged 0 to 14 years (%) | 21.25 | 5.08 |
| aged15to24~c | Aged 15 to 24 years (%) | 13.43 | 4.87 |
| aged25to34~c | Aged 25 to 34 years (%) | 14.41 | 4.43 |
| aged55plus~c | Aged 55 years and over (%) | 21.33 | 6.92 |
| vic | Victoria (%) | 0.15 | 0.36 |
| qld | Queensland (%) | 0.34 | 0.47 |
| sa_ | South Australia (%) | 0.09 | 0.29 |
| wa_ | Western Australia (%) | 0.12 | 0.32 |
| tas | Tasmania (%) | 0.03 | 0.18 |
| nt_ | Northern Territory (%) | 0.05 | 0.21 |
| act | ACT (%) | 0.07 | 0.26 |
| ariapp_hig~c | Highly accessible (ARIA ++) | 0.40 | 0.49 |
| ariapp_mod~c | Moderately accessible (ARIA ++) | 0.05 | 0.22 |
| ariapp_rem~e | Remote (ARIA ++) | 0.05 | 0.22 |
| ariapp_ver~m | Very remote (ARIA ++) | 0.01 | 0.10 |
| drtreg1_0306 | Drought (2003-06) | 0.14 | 0.35 |
| drtreg2_0306 | Below average (2003-06) | 0.66 | 0.47 |
| drtreg1_9801 | Drought (1998-2001) | 0.00 | 0.06 |
| drtreg2_9801 | Below average (1998-2001) | 0.22 | 0.41 |
| drtreg1_9396 | Drought (1993-96) | 0.05 | 0.21 |
| drtreg2_9396 | Below average (1993-96) | 0.35 | 0.48 |
| Controls only | Drought categories only | Full specification | ||||
|---|---|---|---|---|---|---|
| Drought (2003-06) | -4.07 | (1.73) | -9.23 | (1.65) | ||
| Below average (2003-06) | -4.31 | (1.55) | -4.91 | (1.59) | ||
| Non-agricultural SLAs | 2.39 | (1.42) | -7.82 | (1.65) | ||
| exempg~d0601 | 0.13 | (0.11) | 0.37 | (0.12) | ||
| unem_perc | 0.21 | (0.16) | 0.28 | (0.16) | ||
| housingpay~t | -0.29 | (0.87) | 0.16 | (0.87) | ||
| govt_perc | 0.16 | (0.07) | 0.14 | (0.07) | ||
| yr12_perc | 0.03 | (0.07) | 0.03 | (0.07) | ||
| ind_perc | -0.33 | (0.04) | -0.36 | (0.04) | ||
| wtchild_perc | -0.62 | (0.10) | -0.59 | (0.10) | ||
| aged00to14~c | 0.07 | (0.20) | 0.07 | (0.20) | ||
| aged15to24~c | 0.25 | (0.14) | 0.28 | (0.13) | ||
| aged25to34~c | -0.28 | (0.20) | -0.22 | (0.19) | ||
| aged55plus~c | -0.32 | (0.13) | -0.29 | (0.13) | ||
| vic | -9.00 | (1.58) | -8.02 | (1.50) | ||
| qld | 2.22 | (1.65) | 3.18 | (1.58) | ||
| sa_ | -7.37 | (1.74) | -7.31 | (1.72) | ||
| wa_ | -1.17 | (1.85) | -0.68 | (1.80) | ||
| tas | -8.73 | (1.94) | -8.95 | (1.90) | ||
| nt_ | 8.30 | (2.18) | 9.55 | (2.11) | ||
| act | -4.04 | (2.50) | -4.18 | (2.49) | ||
| ariapp_hig~c | 1.53 | (1.09) | 2.24 | (1.08) | ||
| ariapp_mod~c | 1.39 | (1.33) | 0.43 | (1.37) | ||
| ariapp_rem~e | 5.33 | (1.65) | 3.80 | (1.68) | ||
| ariapp_ver~m | 6.39 | (2.92) | 5.39 | (3.00) | ||
| Constant | 79.97 | (11.59) | 33.93 | (1.34) | 79.28 | (11.34) |
| R-squared | 0.42 | 0.04 | 0.43 | |||
| Equality of high & below average coefficient prob > F | n. s. | 0.0002 | ||||
Note: The omitted variables are non-drought agricultural SLAs, population aged 35 to 54 years, NSW, and assessable areas (as measured using ARIA ++).
| Controls only | Drought categories only | Full specification | ||||
|---|---|---|---|---|---|---|
| Drought (2003-06) | 3.40 | (1.88) | -9.54 | (1.95) | ||
| Below average (2003-06) | -0.72 | (1.71) | -3.97 | (1.81) | ||
| Non-agricultural SLAs | 9.12 | (1.54) | -8.86 | (2.01) | ||
| exempg~d0601 | 0.38 | (0.12) | 0.71 | (0.14) | ||
| unem_perc | 0.24 | (0.18) | 0.35 | (0.19) | ||
| housingpay~t | 5.73 | (1.03) | 6.30 | (1.03) | ||
| govt_perc | 0.05 | (0.08) | 0.02 | (0.07) | ||
| yr12_perc | -0.20 | (0.08) | -0.20 | (0.08) | ||
| ind_perc | -0.36 | (0.05) | -0.39 | (0.05) | ||
| wtchild_perc | -1.09 | (0.10) | -1.04 | (0.10) | ||
| aged00to14~c | 0.69 | (0.27) | 0.70 | (0.27) | ||
| aged15to24~c | 0.58 | (0.19) | 0.61 | (0.18) | ||
| aged25to34~c | -0.23 | (0.24) | -0.13 | (0.24) | ||
| aged55plus~c | -0.19 | (0.17) | -0.16 | (0.17) | ||
| vic | -4.22 | (1.90) | -3.12 | (1.82) | ||
| qld | 8.04 | (1.87) | 9.17 | (1.82) | ||
| sa_ | -1.47 | (2.05) | -1.21 | (2.03) | ||
| wa_ | 1.25 | (2.05) | 1.99 | (2.03) | ||
| tas | -5.55 | (2.07) | -5.54 | (2.04) | ||
| nt_ | 3.58 | (2.69) | 5.32 | (2.61) | ||
| act | 3.33 | (3.05) | 3.06 | (3.05) | ||
| ariapp_hig~c | -1.39 | (1.45) | -0.32 | (1.47) | ||
| ariapp_mod~c | -5.06 | (1.49) | -6.18 | (1.58) | ||
| ariapp_rem~e | -6.92 | (1.81) | -8.75 | (1.92) | ||
| ariapp_ver~m | 2.94 | (5.40) | 1.54 | (5.26) | ||
| Constant | 101.23 | (13.90) | 28.90 | (1.40) | 97.49 | (13.53) |
| R-squared | 0.44 | 0.06 | 0.45 | |||
| Equality of high & below average coefficient prob > F | 0.0098 | 0.0001 | ||||
Note: The omitted variables are non-drought agricultural SLAs, population aged 35 to 54 years, NSW, and assessable areas (as measured using ARIA ++).
| Controls only | Drought categories only | Full specification | |||
|---|---|---|---|---|---|
| Drought (2003-06) | 7.47 | (1.09) | -0.60 | (1.42) | |
| Below average (2003-06) | 3.82 | (1.04) | 1.07 | (0.93) | |
| Non-agricultural SLAs | 7.41 | (0.91) | -2.05 | (1.62) | |
| exempg~d0601 | 0.24 | 0.37 | (0.15) | ||
| unem_perc | -0.14 | -0.08 | (0.17) | ||
| housingpay~t | 6.59 | 6.80 | (1.28) | ||
| govt_perc | -0.09 | -0.10 | (0.09) | ||
| yr12_perc | -0.28 | -0.27 | (0.07) | ||
| ind_perc | -0.05 | -0.06 | (0.05) | ||
| wtchild_perc | -0.64 | -0.62 | (0.13) | ||
| aged00to14~c | 0.79 | 0.79 | (0.28) | ||
| aged15to24~c | 0.78 | 0.79 | (0.26) | ||
| aged25to34~c | 0.01 | 0.07 | (0.28) | ||
| aged55plus~c | 0.17 | 0.19 | (0.14) | ||
| vic | 5.18 | 5.44 | (1.32) | ||
| qld | 5.96 | 6.23 | (1.19) | ||
| sa_ | 6.24 | 6.52 | (1.48) | ||
| wa_ | 2.52 | 2.89 | (1.43) | ||
| tas | 3.21 | 3.55 | (1.31) | ||
| nt_ | -6.88 | -6.08 | (2.23) | ||
| act | 7.87 | 7.62 | (2.96) | ||
| ariapp_hig~c | -2.98 | -2.38 | (1.48) | ||
| ariapp_mod~c | -6.18 | -6.44 | (1.50) | ||
| ariapp_rem~e | -12.86 | -13.39 | (1.95) | ||
| ariapp_ver~m | -5.02 | -5.65 | (4.45) | ||
| Constant | 27.73 | -5.03 | (0.76) | 23.07 | (14.39) |
| R-squared | 0.26 | 0.03 | 0.2605 | ||
| Equality of high & below average coefficient prob > F | 0.0006 | n. s. | |||
Note: The omitted variables are non-drought agricultural SLAs, population aged 35 to 54 years, NSW, and assessable areas (as measured using ARIA ++).
Boyd Hunter is a Senior Fellow and Nicholas Biddle is a Research Fellow at the Centre for Aboriginal Economic Policy Research, College of Arts and Social Sciences, Australian National University.
Hunter, B., & Biddle, N. (2011). Migration, labour demand, housing markets and the drought in regional Australia (Research Paper No. 49). Melbourne: Australian Institute of Family Studies.
978-1-921414-48-0