Child Care Package Evaluation: Early monitoring report
Report on baseline Child Care Package Evaluation project, early monitoring and emerging issues
August 2019
Jennifer Baxter, Megan Carroll, Kelly Hand, Mikayla Budinski, Cara Rogers, Jessica Smart
Download Research report
Overview
The Department of Education and Training has commissioned an evaluation of the new Child Care Package introduced in 2018. This is the first report of the evaluation, with a final report to be provided in 2021.
Child care in Australia has an extensive history, with the use of child care accelerating, in particular from the 1980s onwards. This expansion was driven by and contributed to increasing levels of workforce participation by women, including mothers and an increasing number of couple families with both partners employed. Key features of the expansion include:
- substantial increases in Commonwealth funding - commencing in the 1970s but building rapidly over more recent periods along with significant changes in the forms of financial support provided
- changes in the composition of child care provision including the growth in for profit providers and outside school hours care for school-aged children
- a stronger focus on the quality of care, and in more recent periods on the role of pre-school education
- ongoing cost pressures with the cost of child care provision rising much more rapidly than prices overall. The impact of this on the cost to parents has been mitigated by increasing levels of assistance.
The new Child Care Package introduced in July 2018 comprises:
- the replacement of existing payments with a single more generous, but more tightly income and activity tested Child Care Subsidy
- a Child Care Safety Net designed to reduce barriers to child care for disadvantaged families and communities
- enhanced information technology systems designed to simplify processes for parents and providers.
A key objective of the new Child Care Package is to boost participation in employment and employment enhancing activities.
With the combination of more generous rates of subsidy and the introduction of enhanced activity and income testing, the package is expected to produce both winners and losers. Gains are anticipated for those on lower to middle incomes who undertake substantial workforce and other approved activities.
The introduction of the new program was accompanied by significant communication activities.
- Just prior to the transition some two-thirds of services considered that they were prepared for the change, although some 13 per cent said they were not.
- While 40 per cent felt that the package would have a positive impact 36 per cent felt that it would be negative, and many more felt that the package would result in parents reducing their use of child care than those who felt they would increase.
- Services rated the support provided by their own organisation or peak, and by software providers most highly with just under half reporting that they agreed or strongly agreed that the Department of Education and Training and Department of Human Services was providing enough support, with a quarter of services disagreeing. The majority had accessed Department of Education and Training communications activities.
- In general, while there were some differences by state and sector there did not seem to be large differences by either remoteness or the socio-economic level of the location in the attitudes and experiences of services.
Department of Education and Training data on the July 2018 transition of the child care system indicates that over 99 per cent of services transitioned to the new arrangements at the time of implementation.
- At the time of preparation of this report, only limited post-implementation information has been obtained from services, much of which has been qualitative in nature. Emerging themes are:
- There is a sentiment among services that the introduction of the package was onerous and placed a heavy burden upon them.
- Service providers expressed many concerns about the IT system, including with respect to PRODA and the limited pre-implementation opportunities services felt they had to become familiar with the system. Additionally, issues have been reported with regard to the operation of the Additional Child Care Subsidy.
- Many services, and some key stakeholders, have raised a concern about the potential impact of the activity test in reducing access to child care for children from disadvantaged backgrounds, specifically the impact of the provision of support for only 24 hours per fortnight, which for many services means a single day per week.
- To date while some services have introduced shorter sessions the charges for these are often relatively high.
Parents generally considered that they were prepared for the new package and had accessed information. On balance they consider the package positively with 40.7 per cent describing it as being mostly or entirely positive, although 23.0 per cent considered it to be mostly or entirely negative.
- The majority reported that the transition process was relatively seamless, although around 20 per cent disagreed.
- Reflecting the expected impact of the changes, while most respondents report no or little change, low income families were more likely to report that their child care costs had decreased than high income families with this being reversed in terms of increased costs. While the currently available data is limited it suggests that some 42 per cent of families with incomes below $65,000 had experienced a fall in the cost of child care and 24 per cent an increase, for those on incomes between $65,000 and $170,000 the proportions were 39 per cent and 28 per cent, and for those with an income of over $170,000, 10 per cent and 65 per cent. According to Department of Education and Training data on families using child care, about 3 in 4 families have incomes below $170,000.
- To date most report no changes in their use of child care, nor in their level of engagement in employment.
These initial findings will be further scrutinised in the evaluation along with more detailed analysis of the transition and the impact and outcome of the new Child Care Package including on the costs of child care for families, changes in workforce participation, access to child care, especially for those with disadvantage, the robustness of the child care sector and the sustainability of government funding.
| Term | Description |
|---|---|
| ABS | Australian Bureau of Statistics |
| ACCS | Additional Child Care Subsidy |
| ACECQA | Australian Children's Education and Care Quality Authority |
| AIFS | Australian Institute of Family Studies |
| AIHW | Australian Institute of Health and Welfare |
| ANU | Australian National University |
| ARIA | Accessibility/Remoteness Index of Australia |
| BBF | Budget Based Funded Program |
| CALD | Culturally and Linguistically Diverse |
| CAPI | Computer Assisted Personal Interview |
| CATI | Computer Assisted Telephone Interview |
| CBDC | Centre Based Day Care |
| CCB | Child Care Benefit |
| CCCF | Community Child Care Fund |
| CCSS | Child Care Subsidy System (formerly the Child Care IT System (CCITS)) |
| CCSS | Child Care Subsidy System |
| CCMS | Child Care Management System |
| CCPFamS | Child Care Package Families Survey |
| CCR | Child Care Rebate |
| CCS | Child Care Subsidy |
| CCTR | Child Care Tax Rebate |
| CPI | Consumer Price Index |
| CSP | Community Support Program |
| CWA | Complying Written Arrangement |
| DET | Department of Education and Training |
| DHS | Department of Human Services |
| DSS | Department of Social Services |
| ECCC | Early Childhood and Child Care |
| ECE | Early Childhood Education |
| ECEC | Early Childhood Education and Care |
| FDC | Family Day Care |
| GST | Goods and Services Tax |
| HILDA | The Household, Income and Labour Dynamics Study |
| IDF | Inclusion Development Fund |
| IHC | In Home Care |
| IPSP | Inclusion and Professional Support Program |
| IRSAD | Index of Relative Socio-Economic Advantage and Disadvantage |
| ISP | Inclusion Support Programme |
| IT | Information Technology |
| ITRG | Implementation and Transition Reference Group |
| IZA | Institute of Labor Economics (Germany) |
| JETCCFA | Jobs, Education and Training, Child Care Fee Assistance |
| LDC | Long Day Care |
| LinA | Life in Australia Study |
| LOTE | Language Other Than English |
| NDIS | National Disability Insurance Scheme |
| NFF-OCC | Non-Formula Funded Occasional Care |
| NHMRC | National Health and Medical Research Council |
| NQA ITS | National Quality Agenda Information Technology System |
| NQS | National Quality Standard |
| OECD | Organisation for Economic Co-operation and Development |
| OLS | Ordinary Least Squares |
| OSHC | Outside School Hours Care |
| PC | Productivity Commission |
| PEP | Provider Entry Point |
| PIR | Post Implementation Review |
| PolicyMod | Microsimulation Model of the Australian Tax and Transfer System |
| PRODA | Provider Digital Access |
| SCARC | Senate Community Affairs Reference Committee |
| SEIFA | Socio-Economic Indexes for Area |
| SELCS | Survey of Early Learning and Care Services |
| SES | Socio-Economic Status |
| SIP | Strategic Inclusion Plan |
| SNAICC | Secretariat of National Aboriginal and Islander Child Care - National Voice for Children |
| SPRC | Social Policy Research Centre |
| SRC | Social Research Centre |
| UNSW | University of New South Wales |
Child care plays an important economic and social role in Australia. For parents, it supports paid employment, education and training. For children, quality care can assist child development and has social and educational value, including a role in preschool education, particularly for vulnerable and disadvantaged children and their families. Since the 1970s the Australian Government has been active in providing support to the sector and the families using child care services. In 2018-2019 Australian Government expenditure, primarily through subsidies for the cost of care to parents, is with the introduction of the new package expected to be some $8.1 billion (Department of Education and Training, 2019, pp. 26-27).
In July 2018 the Australian Government introduced the 'new Child Care Package' under the aegis of the Family Assistance Legislation Amendment (Jobs for Families Child Care Package) Act 2017. The new Child Care Package has four key elements:
- Child Care Subsidy - this is the main form of financial support
- Additional Child Care Subsidy - additional fee assistance directed at families and children who may face barriers in accessing affordable child care
- Inclusion Support Programme - support for services to build their capacity and capability to include children with additional needs in mainstream services
- Community Child Care Fund - which enables grants to child care services to help them to address barriers to participation and to support service sustainability and funding for services in areas of high unmet demand.
The Additional Child Care Subsidy, Inclusion Support Programme and Community Child Care Fund, which are collectively referred to as the Child Care Safety Net are designed to provide additional targeted assistance for disadvantaged communities and vulnerable children and their families to address barriers to participation in child care and employment.
The Child Care Safety Net was progressively rolled out from July 2016. At this time the Inclusion Support Programme was introduced, as was the Connected Beginnings program, which is part of the Community Child Care Fund.
Another early element of the Child Care Package was the Nanny Pilot Programme, initially called the Interim Home Based Carer Subsidy Programme. A new In Home Care program was introduced in July 2018, which replaced the previous In Home Care program and the previous Nanny Pilot Programme.
A new Information Technology system was developed with the intent of providing a simpler interface for both parents and services, and for the automation of the payment system. Changes have also been made to the child care services regulatory framework including the removal of some requirements related to hours of operation, and a strengthened set of requirements that services need to comply with (e.g. reporting on children's hours of attendance).
Underlying the package are the objectives of addressing issues of affordability and increasing costs, improving flexibility, and increasing the targeting of financial assistance, in particular towards supporting those parents who are participating in employment.
The Australian Institute of Family Studies in association with the Social Research Centre, the UNSW Social Policy Research Centre and the ANU Centre for Social Research and Methods have been commissioned by the Australian Government Department of Education and Training to undertake an independent evaluation of the new Child Care Package. The evaluation commenced in December 2017 prior to the introduction of the package and continues until June 2021. The In Home Care program and the Inclusion Support Programme, in addition to being within the overall evaluation scope, are being subject to specific attention and separate early findings reports for these programs will be completed by mid-2019, with a second In Home Care program report due mid-2020.
The evaluation is being guided by the Evaluation Framework which was agreed with the Department of Education and Training and which is publicly available.1 The Evaluation Framework, as detailed in Chapter 2, sets out four key outcomes and three key impacts against which the new Child Care Package is being evaluated. These reflect the policy objectives set by the government for the package. In large part they relate to medium to long term effects of the package and its consequences for families, children and the child care sector.
This early monitoring report is the first formal evaluation report. In addition to presenting early data about the transition for services and families it provides context for the reform package through a review of the history of child care in Australia and a detailed overview of child care provision and the nature and objectives of the Child Care Package at the point of implementation of the package. This context will be increasingly important as the evaluation progresses as a point of reference for understanding the progress and impacts of the reforms.
This report also provides baseline data on families with children and services, their expectations of about how the new system might work, their assessment of their readiness for the changes and some very initial data on the transition including parental labour supply responses and the costs of child care for families. The timing of this report means that it is only considering the immediate post-implementation period. It also means only limited administrative and other program data were available to the evaluation, and thus it is too early to assess the medium to long term effects.
The report is based on data collected either just before the introduction of the new Child Care Package or very shortly after the transition to the new arrangements. It draws upon:
- a range of data that describe the nature of the child care system, level of usage of child care, characteristics of those using the system, and costs of child care and how this has changed over time
- data collected from services just prior to the introduction of the new Child Care Package
- data collected from parents shortly before and shortly after the transition to the new system
- some limited administrative data on the transition of children and services to the arrangements under the new Child Care Package
- some preliminary data from interviews with key stakeholders and the pilot case study.
The Evaluation Framework anticipated that the Early Monitoring Report would be informed by and report on initial findings from the Post Implementation Reviews being undertaken by the Department of Education and Training. At the time of writing these have not yet been completed and thus have not been able to be drawn upon in this report. It was also anticipated that a range of administrative data covering the transition period would be provided to the evaluation consortium by the Department which would enable the immediate effects of the transition to be analysed. These data were not available at the time of writing the report. Given the absence of this information and that implementation of the new Child Care Package is in the early stages, it is not possible at this time to substantively address the key evaluation outcomes and impacts.
The remainder of this report is structured as follows:
Background:
- Chapter 2 reviews the history and role of child care in Australia, including its relationship to increasing workforce participation in families with dependent children.
- Chapter 3 presents the evaluation framework and methodology.
- Chapter 4 provides information about the Child Care Package, as well as details of the sector at the point of transition including the broader environment in which it operates.
Initial analysis:
- Chapter 5 draws upon the data collections detailed above to consider the preparedness of services and providers for the introduction of the new package, and their attitudes and expectations of the impact.
- Chapter 6 complements the previous chapter by presenting findings related to families' expectations and experiences of the transition.
- Chapter 7 provides an early insight into the issues and experiences of the sector in the transition as drawn from the preliminary findings of the pilot case study and the current work of the evaluation in interviewing key stakeholders.
- Chapter 8 is a summary of the report. Reflecting the above considerations this chapter does not include any substantive findings as to the outcomes or impacts of the package, but rather some reflections on the state of child care at the transition and on the transition experience. It draws out a number of issues, which will be addressed at further stages of the evaluation.
2.1 Introduction
This chapter provides an overview of the historical development of child care in Australia, the role of the Commonwealth in supporting and shaping its development, and hence the setting within which the Child Care Package has been introduced.2 The chapter provides an overview of the history of the development of the Australian formal child care system since 1970, including key policy developments and themes. Statistical information on key aspects of the development of the system are presented, although the extent to which it is possible to construct long time series is limited by the available data. Areas covered are size of the sector, the mix of types of child care, type of provider, and Commonwealth expenditure. The third section describes trends in the cost of child care. The fourth section provides a high level overview of families, their participation in the labour market and use and demand for child care. The fifth section provides an overview of the child care system in operation immediately prior to July 2018 when the new child care policy took effect.
The current rationale for Commonwealth involvement in child care is given in the 2017/18 Portfolio Budget Statement for the Department of Education and Training.
The program helps families to participate in the social and economic life of the community by:
- promoting and supporting quality and affordable child care
- assisting services to improve access and inclusion for vulnerable or disadvantaged children and families, including children with disabilities and their families
- supporting the sustainability of child care for all Australian children and families including in areas and/or under circumstances where services would not otherwise be viable
- developing, maintaining and disseminating information to assist families to make informed decisions about child care and the related support programs and services provided or funded by the government
- supporting child care services to be more responsive to the needs of families.
Types of child care
There are a range of different types of child care currently in Australia supported by the Australian Government. The main forms are:
Centre-Based Day Care
This is the predominant form of care usually being provided in purpose specific facilities, by either private providers, community organisations or local government, in the form of Long Day Care, or in some cases as Occasional Care. While Long Day Care services tend to offer whole of day care (typically 8 to 12 hours) to a relatively stable group of children, Occasional Care services focus more on casual or short-term provision.3
Family Day Care
Family Day Care is provided to small groups of children, usually in a Family Day Care educator's own dwelling. The provision of this service is structured with a single provider organisation managing a number of Family Day Care educators. These services are mainly provided by the private sector, although local government and not-for-profit providers play a significant role.
Outside School Hours Care
There are three forms of Outside School Hours Care, before school care, after school care and vacation care. These services are managed by private for-profit providers, schools, community and other organisations.
In Home Care
This is a small and specialised sector providing care in a family home for children in a range of circumstances where mainstream care is not available or appropriate.
Further details on these forms of care are given in Appendix B.
Other child care and early education and related services
In addition, reference is made to a number of other types of child care, including:
- Budget Based Funded Services. These are a group of services, largely serving Aboriginal and Torres Strait Islander communities which prior to July 2018 were directly funded by the Australian Government, rather than through fees income. Many of these services are transitioning to be Centre Based Day Care.
- The Nanny Pilot Programme. This was a form of in home care which operated as a pilot program between 1 January 2016 and 1 July 2018.
- Preschool and Kindergarten. As discussed in the text, these have traditionally focused on education rather than care services. This has changed so that today a high proportion of this preschool education is provided through Long Day Care services.
2.2 Overview of the history of Australian formal child care
In broad terms formal early childhood care and education can be divided into child care and kindergarten/preschool.4,5 The latter has primarily a more formal educational focus and aims to prepare children for school.
Child care, while largely having had a primary focus on allowing parental workforce participation, has also had a social development and educational component. The focus on social development and education in child care has grown in recent decades through the quality agenda that commenced in the early 1990s and associated initiatives such as the National Quality Framework. While the scope of this chapter focusses on formal child care, it needs to be recognised that there is an interaction between preschool and child care services, and increasingly, child care services are providing formal preschool programs.
In Australia, kindergartens emerged in the 1890s with the Kindergarten Union establishing the first formal early childhood teacher training program in Sydney in 1897 (Brennan, 1998). The early kindergartens were intended to assist children living in families experiencing poverty (Brennan, 1998). There was growth of kindergartens during the 1950s with the focus shifting from assisting children from deprived backgrounds to becoming an important part of early childhood education (Press & Hayes, 2000).
Child care had its origins in the Day Nursery Movement which also emerged in the late 1890s, with a focus on assisting disadvantaged families (Press & Hayes, 2000). However, there was only very limited formal child care until the 1970s.
1970 to 1983
In 1970 there were 560 registered child care centres in Australia offering about 14,000 places (Brennan, 1998). Forty of the centres received support from state/territory governments with virtually no Commonwealth support. Almost all of the centres were run as for-profit centres and were established to provide care for children from deprived or underprivileged backgrounds. Outside school hours care has existed in some form for decades, but government funding for this type of care did not commence until the 1970s (Moyle, Meyer, & Evans, 1996).
At this time there were increases in maternal employment and strengthening evidence and recognition that a lack of child care was a significant barrier to mothers being able to return to, and maintain, employment. In 1972 the Commonwealth Child Care Act was passed and this allowed the Commonwealth to provide funding to not-for-profit organisations to run centre-based day care facilities for children of working and sick parents (McIntosh & Phillips, 2002). This reflected recognition of growing employment rates of mothers and the importance of providing good quality care at an affordable price, especially for single parent families, newly arrived migrants, low-income families, and disabled parents (Senate Community Affairs Reference Committee [SCARC], 1998).
In 1974 a decision was made to extend Commonwealth government financial support for all child care, not just that for families that were poor or needed financial assistance. This marked a change in the philosophical underpinning of the provision of child care. The Commonwealth continued to expand financial support over the following years, expanding the range of organisations that could receive assistance and including new child care services and forms of child care other than child care centres including preschools, Family Day Care, Outside School Hours Care and playgroups (McIntosh & Phillips, 2002).
In 1976 the Commonwealth ceased directly funding individual centres and instead provided block funding to states and territories; representing a major change (SCARC, 1998). The effect of these changes was that during the period from the mid-1970s to the early 1980s expansion in child care places was mainly in Family Day Care (McIntosh & Phillips, 2002). The period 1976 to 1980 was one of declining Commonwealth expenditure on children's services (SCARC, 1998).
1983 to 1996
From 1983 there was a progressive increase in the number of child care places as a result of additional Commonwealth funding including the National Children's Services Program in 1983, and the National Childcare Strategy in 1988. In 1982 there were around 41,600 Commonwealth supported child care places and by 1991 this had increased to 168,300 places (Brennan, 1998).
In 1984 financial assistance for non-profit Long Day Care centres was introduced. This was subsequently extended during the 1980s and became the main form of Commonwealth financial support for child care (McIntosh & Phillips, 2002). There was also a shift towards a more needs-based planning approach to the expansion of Commonwealth support for child care places and in 1985 the Commonwealth ceased block funding for states and territories for preschools (McIntosh & Phillips, 2002).
The 1990s saw a further expansion of Commonwealth funded child care places (Figure 2.1) and an increase in the number of services (Figure 2.2). In 1990 the National Childcare Strategy was expanded to allow for an additional 50,000 child care places by the mid-1990s. A significant change was to extend fee relief to commercial child care centres in 1990. This led to a large expansion in the number of Long Day Care centre places (SCARC, 1998). Over the period 1994 to 1996 the Commonwealth provided funds to local government and community organisations so as to increase the number of work-related child care places, including Outside School Hours Care (SCARC, 1998).
In 1993 the introduction of an accreditation scheme for child care centres was announced and the Accreditation Council established, and in 1994 the Quality Improvement and Accreditation System was introduced. This was aimed at improving the quality of approved child care (SCARC, 1998). Also in 1994 the Childcare Cash Rebate was introduced. This was paid to families to assist with the costs of work-related child care assistance (SCARC, 1998).
Figure 2.1. Number of children using child care by service type, 1991 to 2017
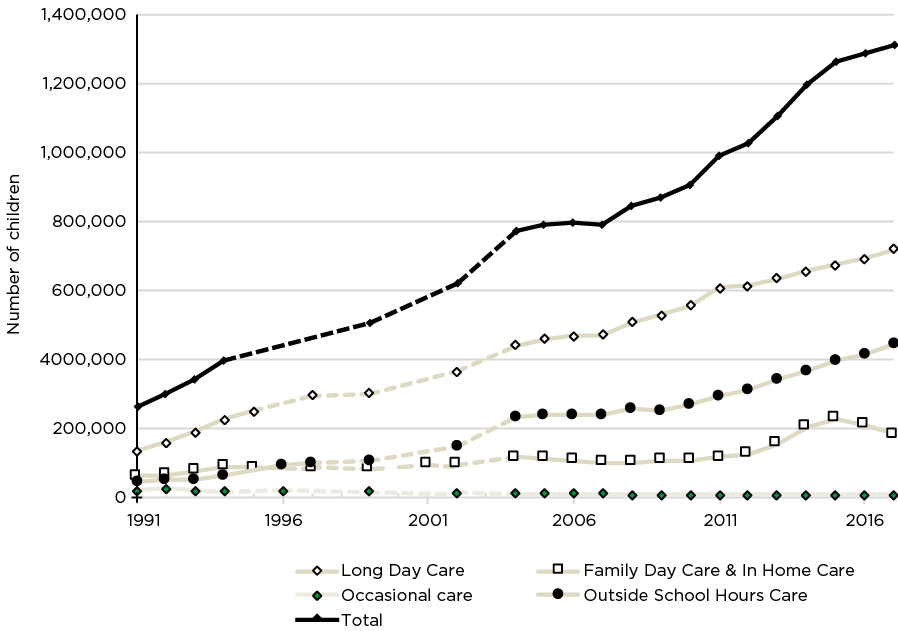
Sources: Data for 1991 to 2002 are from AIHW (2003), Table 6.12. Data for 2004 to 2012 are from Department of Education, Employment and Workplace Relations (2013), Child Care in Australia, August 2013, Commonwealth of Australia, Canberra. Data for 2013, 2014 are from Child Care and Early Learning in Summary published by the Department of Education. Data for 2015, 2016 and 2017 are Department of Education and Training publication Early Childhood and Child Care in Summary.
Notes: For the period 1991 to 2002 Occasional Care includes multifunctional Aboriginal Children's services and other multifunctional services. The data for this period measure occurrences of care and includes some double-counting where children attend more than one services. Data from 2004 are for the September quarter. Data for the period 1995 to 2003 are not necessarily complete or consistent. This is shown here by a dashed line.
Figure 2.2. Number of services by type of services, 2004 to 2017
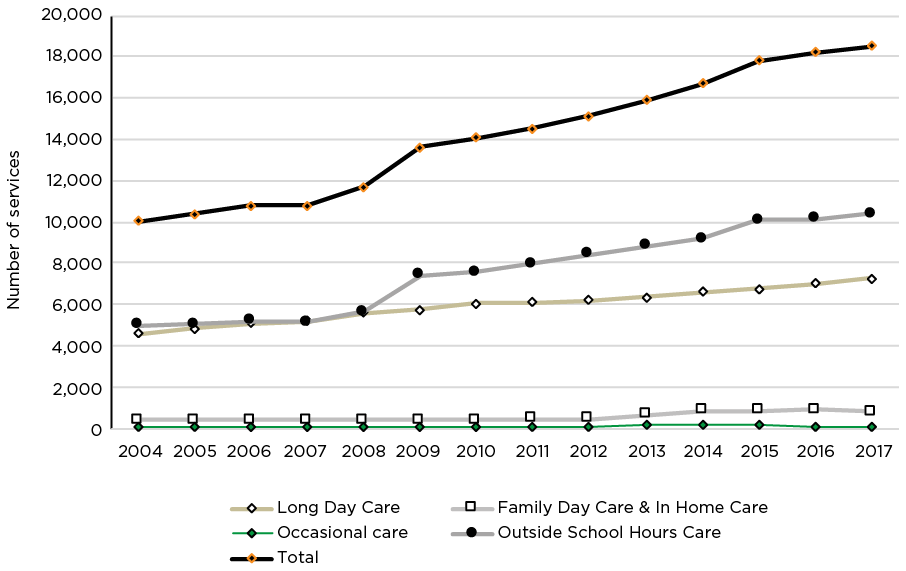
Sources: Data for 2004 to 2012 are from Department of Education, Employment and Workplace Relations (2013), Child Care in Australia, August 2013, Commonwealth of Australia, Canberra. Data for 2013, 2014 are from Child Care and Early Learning in Summary published by the Department of Education. Data for 2015, 2016 and 2017 are Department of Education and Training publication Early Childhood and Child Care in Summary.
Figure 2.3 shows child care use by child age and type of child care (including informal care only) for the period 1984 to 2017. Growth in maternal employment and dual earner families with children (see discussion in section 2.4), and the growth in the child care sector over this period is reflected in the big increases in the proportion of children attending different types of care. The proportion of children aged 0 to 2 years attending centre-based care increased from 4.6 per cent in 1984 to 31.5 per cent in 2017 and the proportion attending Family Day Care increased from 2.6 per cent to 6.4 per cent over this period. For children 3 to 5 years, the proportion attending centre-based care increased from 7.2 per cent to 32.6 per cent over the period 1984 to 2017, the proportion attending Family Day Care increased very slightly from 2.5 per cent to 3.8 per cent, and the proportion attending preschool fluctuated but was around one-third over the period. There was a big increase in the proportion attending Outside School Hours Care from close to zero to 17.4 per cent.
The increased use of these forms of care has meant a decline in the number of children only using informal care arrangements, such as care by grandparents. Nevertheless, Informal care arrangements remain common for children of all ages, often used in combination with formal arrangements like long day care, family day care and outside school hours care (Baxter, 2015).
Figure 2.3. Child care use by child age and type of child care, 1984 to 2017
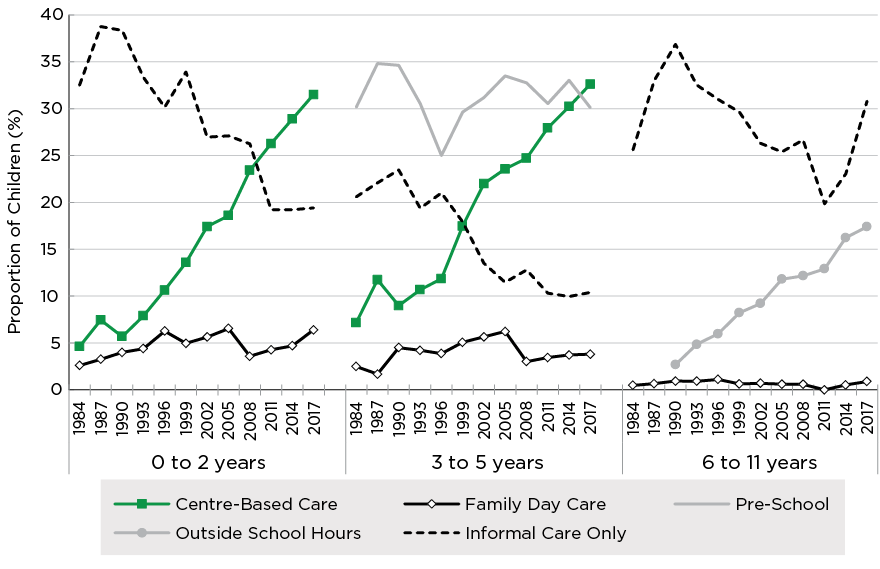
Source: Bray (2018). Underlying data from ABS 4402.0
Since 1997
Following a change of government in 1996, major changes were made to Commonwealth child care policy and funding including: the removal of operational and capital works subsidies for community owned Long Day Care centres; the limiting of Childcare Assistance - as provided under the Commonwealth Childcare Assistance Scheme - to 50 hours per week per child; freezing the levels of Childcare Assistance and the Childcare Cash Rebate for two years; and the reduction of the Childcare Tax Rebate from 30 per cent to 20 per cent for families with an income above a certain level (SCARC, 1998).
The removal of operational and capital works subsidies reflected a view that child care subsidies should be used to help parents purchase whatever form of accredited child care best suited their needs. It also reflected a view that the changes 'would encourage community centres to be more efficient and cost competitive with the private sector' ... [and also] ...'to remove inequities in government assistance for families using private and community-based centres' (Department of Health and Family Services, 1996, pp. 178-188).
The 1997-98 budget represented the start of a trend towards varying the level of subsidy between working and non-working parents, with changes including limiting Childcare Assistance to 20 hours per week for each child using child care for parents' non-work purposes (McIntosh & Phillips, 2002).
In 2000 the cap on Long Day Care places was removed and since that time there has been no controls on the number of Long Day Care places or the location of new centres. This was intended to encourage market competition and to offer choice to families. The caps on Family Day Care and Outside School Hours Care places were removed in July 2006.
Also, in 2000, significant changes were made to the tax system (associated with the introduction of the GST). At this time Childcare assistance and the Childcare Cash Rebate were replaced with the Child Care Benefit. The Child Care Benefit was more generous than the payments it replaced and the income threshold for eligibility was raised and the number of hours of subsidised care was increased. Child Care Benefit was available either as direct payments to parents or as lump sum payment at the end of the year (Whiteford, Stanton, & Gray, 2001).
The 2000-01 Commonwealth Budget provided funding for a number of new child care initiatives that overall had an emphasis on more flexible services being provided and more services being made available in rural and remote areas. Specific measures included:
- the introduction of a new In Home Care measure for those families for whom accessing standard childcare services was difficult
- extending the quality assurance to Family Day Care and Outside School Hours Care
- the Long Day Care Incentive Scheme, which encouraged private operators to establish child care centres in rural and urban fringe areas of high, unmet demand.
In 2004 the Child Care Tax Rebate was introduced. This payment covered 30 per cent of out-of-pocket expenses for approved child care where parents met a work, study or training test. Expenses were calculated after the Child Care Benefit was taken into account. Initially the payment covered 30 per cent of the costs and was capped at $4,000 per child per year.6 Initially the Child Care Tax Rebate was a non-refundable tax rebate and could be claimed in the tax return of the following year. In 2007 the Child Care Tax Rebate was removed from the tax system and became a cash payment after the end of the financial year in which the child care costs were incurred. There were also changes made that increased the generosity of the Child Care Tax Rebate. The key changes to the level of the Child Care Tax Rebate were increasing the maximum value of the rebate from $4,354 in 2007-08 to $7,500 per child per annum in 2008-09 and then subsequently slightly reducing the rebate (from $7,941 in 2008-10 to $7,500 in 2011-12) and freezing its maximum level until July 2017.7 There was also an increase in the proportion of out-of-pocket child care expenses covered from 30 per cent to 50 per cent up to the cap from July 2008. In June 2018 the Child Care Rebate covered 50 per cent of out-of-pocket child care expenses up to the annual limit of $7,613 per child per year.
Other than some changes in the way that the Child Care Tax Rebate was paid, and an increase in the percentage of families' out-of-pocket costs it paid for, the child care payment system remained relatively unchanged from 2004 until 2 July 2018 when the Child Care Benefit and the Child Care Tax Rebate were replaced with the single Child Care Subsidy (see Chapter 3 for a description of the Child Care Subsidy and other changes that took effect from 2 July 2018). One policy which did however impact on parts of the child care system was the application of enhanced anti-fraud measures, especially in the Family Day Care sector from 2014. These are discussed in more detail in Chapter 4.
The Community Support Program, introduced in 2004, provided funds to Family Day Care, Occasional Care and In Home Care services to help with set-up costs and also provided 'sustainability assistance' to these services and to Long Day Care services (Department of Education, Employment and Workplace Relations, 2015). In addition, the Community Support Program provided most Family Day Care services with operational assistance in recognition of the additional costs associated with the support and oversight of educators by the service. However, massive growth in the number of Family Day Care services led to rapidly escalating costs for the program. In response, eligibility was tightened in 2014 and 2015, restricting program access to Family Day Care services operating in the most disadvantaged areas or in rural and remote areas. As a result, most Family Day Care services lost this as a significant source of funding and redesigned their fee structures as well as the nature of the support they offered educators (Cortis et al., 2014). The Community Support Program ceased in June 2018, with the introduction of the Community Child Care Fund in July 2018.
The changes to the system that were designed to encourage a greater level of market competition resulted in a rapid increase in the proportion of Long Cay Care centre places being provided for profit providers including the growth of large providers (one of the first was ABC Learning, which increased from 43 centres in 2001 to 1,037 at the time it collapsed and went into administration in November 2008).8 At its peak ABC Learning provided around 25 per cent of the Long Day Care market, providing care to over 100,000 children.
Productivity Commission data report that, as of 30 June 2016, 62.5 per cent of Long Day Care centres and 78.4 per cent of Family Day Care services were run by private for profit providers. Community sector providers operated 29.8 per cent of Long Day Care centres and 12.8 per cent of Family Day Care services (Figure 2.4). There is a more even mix of provider types for Outside School Hours Care (before and after school care). The community sector runs 40.4 per cent of vacation care services and 34.3 per cent of Outside School Hours Care and the private sector 41.0 per cent and 46.0 per cent respectively. Government schools as well as non-government schools are also significant providers with 6.5 per cent of vacation care and 7.0 per cent of Outside School Hours Care provided by non-government schools and 12.1 per cent and 12.7 per cent respectively provided by state, territory or local government.
Figure 2.4. Type of service by type of provider, June 2016

Source: Productivity Commission (2017), Table 3A.10
While it is difficult to obtain consistent data over time on the proportion of children in services run by private for-profit providers and on the proportion in community sector run services, it is clear that the proportion in private for-profit services increased substantially during the 1990s. In 1991 about half (48.1 per cent) of Long Day Care centres were run by private for-profit providers, this had increased to 74.7 per cent in 1997 and was 71.6 per cent in 2004 (AIHW, 2005). Data from the Australian Children's Education and Care Quality Authority (2018) for September 2018 show that 66.0 per cent of children attending a Long Day Care centre were attending a privately run centre.9
The real value of Commonwealth expenditure on child care increased from $3.2 billion in 2007-08 to $7.7 billion in 2016-17 (expenditure in 2016-17 dollars) (Figure 2.5). This is an increase in real expenditure on child care of 137 per cent, much faster than the growth in the number of children aged 0-12 years, which increased by 15 per cent over the period 2007 to 2016 (Productivity Commission, 2018, Table 3A.2).
Figure 2.5. Real Commonwealth expenditure on child care, 2007/08 to 2016/17, Australia
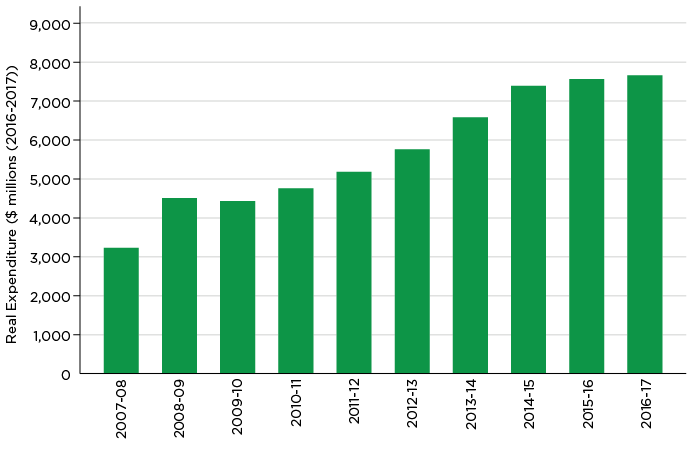
Source: Productivity Commission (2018), Table 3A.6
Standards and Quality
A significant development in the child care landscape was the Commonwealth and state and territory governments signing the National Partnership Agreement on Early Childhood Education in 2008. While not directly a child care measure, it aimed to provide universal access to preschool in the year before full-time school and it had implications for the child care sector. One consequence was an increased focus on the quality of child care, and the early education role of child care, including the introduction of two national frameworks: the Belonging, Being, Becoming - Early Years Learning Framework for young children in 2009; and the My Time, Our Place Framework for School Aged Care in 2011. This also marked a growing awareness of the importance of preschool programs offered in child care services, as most children in New South Wales (NSW), Victoria and Queensland access preschool in Long Day Care services (Pascoe & Brennan, 2017). Of particular significance is the 2010 National Partnership Agreement on the National Quality Agenda for Early Childhood Education and Care, which endorsed a National Quality Standard for child care, the establishment of a national rating system, and the establishment of national body responsible for guiding the implementation and management of the system. The quality framework identified seven key quality areas:
- Educational program and practice
- Children's health and safety
- Physical environment
- Staffing arrangements
- Relationships with children
- Collaborative partnerships with families and communities
- Leadership and service management.
Subsequent to the agreement, the Australian Children's Education and Care Quality Authority (ACECQA) was established to undertake a national coordinating role. This is an independent national authority managed by a governing board whose members are nominated by the Australian and state governments. The authority works closely with the state and territory regulatory authorities who grant approvals for services and assess services against the National Quality Standard.
The National Quality Standard provided national consistency in quality requirements for all formal services. It established, with a rolling timetable for achievement, regulations on educator to child ratios, staff qualifications, and requirements for all educators, including Family Day Care educators, to document children's learning for families and to feed this information into educational programming.
A revised National Quality Standard was introduced in February 2018. This reduced the number of standards from 18 to 15, reduced the elements from 58 to 40, and was designed to clarify the language and ensure that each standard and element described a single unique concept. This was accompanied by some changes in the rating framework and implementation. Other changes, some of which were implemented from late 2017 in most states, concerned improved oversight of Family Day Care, and the introduction of a national educator to child ratio for the provision of care to school-aged children. In the 2018-19 Budget, the Australian Government provided funding to ACECQA for two years to support quality and drive continuous improvement in the sector.
Productivity Commission Inquiry into Child Care and Early Childhood Learning and policy response
In 2013 the Productivity Commission was requested by the government to undertake an Inquiry into Child Care and Early Childhood Learning. This inquiry had broad terms of reference which reflected the commitment of the Australian Government 'to establishing a sustainable future for a more flexible, affordable and accessible child care and early childhood learning market that helps underpin the national economy and supports the community, especially parent's choices to participate in work and learning and children's growth, welfare, learning and development' (Productivity Commission, 2014a, p. iv).
The Productivity Commission reported in 2014 and noted that while 'there is a lot that is good about Australia's current ECEC (Early Childhood Education and Care) system … the current ECEC funding system was largely designed to meet the needs of a different era and the series of incremental additions and amendments mean there is much scope for improvement' (p. 6). The report concluded that the 'current ECEC arrangements are complex and costly to administer and difficult for parents and providers to navigate'.
A range of specific issues and recommendations were identified, including those relating to the complexity of child care subsidies (for services, providers and families), as well as access to and affordability of child care for some families. The key recommendations of the Inquiry concerned a new approach to funding which had three main elements:
- 'mainstream support through a single child-based subsidy that is: means- and activity- tested, paid directly to the family's choice of approved services, for up to 100 hours per fortnight, and based on a benchmark price for quality ECEC. In regional, rural and remote areas with fluctuating child populations, viability assistance should be provided on a limited time basis
- support [for] the inclusion of children with additional needs in mainstream services, delivery of services for children in highly disadvantaged communities and the integration of ECEC with schools and other child and family services
- approved preschool programs funded on a per child basis, for all children, regardless of whether they are dedicated preschools or part of a long day care centre' (Productivity Commission, 2014b, p. 2).
More generally the Productivity Commission noted that 'Early Childhood Education and Care (ECEC) services play a vital role in the development of Australian children and their preparation for school, and in enabling parents to work' (p. 2). With respect to workforce participation, while identifying that some increase was likely to occur, this was likely to be 'small'.
Indeed, in their summary, the Productivity Commission noted that while it had 'estimated that there may be up to roughly 165,000 parents (on a full-time equivalent basis) who would like to work, or work more hours, but are not able to do so because they are experiencing difficulties with the cost of, or access to, suitable child care', they expressed some caution: 'as workforce participation is affected by many factors other than ECEC (including flexible work arrangements, other government family payments and support of partners), the accessibility and affordability of ECEC and ECEC assistance arrangements are important, but not the only factors, that discourage parents from working.' (Productivity Commission, 2014b, p. 11).
In their substantive considerations of these issues they emphasised a series of trade-offs including 'reductions in unpaid work currently performed by mothers, reductions in the workforce participation of fathers and those providing informal child care … and the added stresses in achieving work-life balance' (Productivity Commission, 2014a, p. 186). The Productivity Commission Report also notes, 'The workforce participation of mothers of children aged under 15 years is affected by the preferences of parents to look after their own (particularly very young) children' (p. 231). They estimated that if their proposed model for child care was introduced this could 'increase the labour supply of mothers by 1.2 per cent - the equivalent of around … 16,000 full-time equivalent workers' (p. 670) and generate an increase in GDP of '$1.3 billion in 2013-14 (or 0.1 per cent of GDP)' (p. 684). In considering these impacts they caution 'pursuing an objective of supporting workforce participation through an ECEC system should not be divorced from another important objective - namely, enabling greater child learning and development' (p. 186).
In response to the Productivity Commission Report the government announced the Jobs for Families Child Care Package in the 2015-16 Budget. This led to the program changes (which are considered in this report) which commenced on 2 July 2018. The Jobs for Families Child Care Package is described in more detail in Chapter 4.
2.3 Trends in the cost of child care
The history of the cost of child care as measured by the Australian Bureau of Statistics' Consumer Price Index is, as illustrated in Figure 2.6, one of rapidly increasing prices (especially since the early 1990s) punctuated by strong price falls as Commonwealth Governments have increased the generosity of payments or introduced new programs.
Figure 2.6. ABS Child Care and All Groups CPI, March 1982 to September 2018
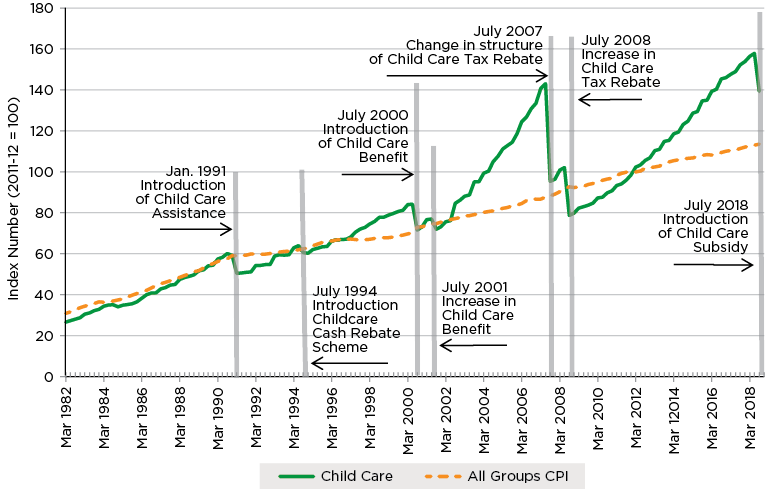
Source: ABS 6101.0
Interpreting these changes requires an understanding of the methodology that the ABS uses to calculate price change for child care. The ABS methodology involves collecting gross child care prices and then subtracting government child care payments. Government child care payments are calculated through the use of customer profiles for a sample of households. The methodology takes into account payments that are made to families that reduce child care costs to families, but not assistance provided through the tax system.
Specifically highlighted in Figure 2.6 are some of the major changes. The ABS report these changes as:
- a fall of 14.7 per cent in child care fees in the March quarter 1991. This was as a consequence of the introduction of Childcare Assistance in January of that year (effectively the extension of the 'Fee relief' which has been available in the community sector)
- a 5.1 per cent decrease in the September quarter 1994. This was 'largely due to the introduction of the Commonwealth Government Childcare Cash Rebate Scheme that came into effect on 1 July 1994' (ABS 6401.0 September 1994, 2)
- a fall of 15.1 per cent in the September quarter 2000. No detailed explanation of this is given by the ABS, in part as this release also encompassed the effect of the introduction of the GST. The change appears to reflect the impact of the introduction of the Child Care Benefit and the higher rates of assistance this provided
- a fall in September 2001. ABS reported 'a fall in the cost of child care (-6.4 per cent) due to an increase in Commonwealth child care benefits' (ABS 6401.0 September 2001, 4)
- a fall of 33.4 per cent in September quarter 2007. The ABS reports this as resulting 'from a change in the eligibility criteria for the Child Care Tax Rebate (CCTR) that has brought it in-scope of the CPI this quarter and from the additional 10 per cent indexation of the Child Care Benefit (CCB) rates on top of the usual annual CPI indexation' (ABS 6401.0 September 2007, 1)10
- a further fall of 22.9 per cent in the September quarter 2008. This is ascribed by the ABS to 'the increase in the Child Care Tax Rebate (CCTR) from 30 per cent to 50 per cent that was implemented as of 1 July 2008' (ABS 6401.0, September 2008, 5)
- a fall in September 2018. The ABS reported the introduction of the Child Care Package and the CCS as resulting in an 11.8 per cent decline in the cost of child care: 'The fall in child care is due to the introduction of the Child Care Subsidy from 2 July 2018, which replaced the Child Care Rebate and Child Care Benefit' (ABS 6401.0, September 2018, 3).
These changes in support have had a profound effect on affordability. While the annualised nominal rate of increase in child care costs since March 1982 has been 4.7 per cent, this is estimated to increase to 8.3 per cent if the effect of these identified increases in support (and ignoring any other adjustments outside of these events) is excluded. In real terms (i.e. taking account of other price increases), over this period the annualised increase in cost of child care as measured by the CPI has been 1.0 per cent, and 4.5 per cent when these changes in assistance have been removed. That is, these increases in assistance over a number of decades have been a major factor in reducing the cost impact of child care on consumers.
Over the period since June 2001 the annualised rate of real growth in child care costs as reported by ABS has been 1.0 per cent and once the effects of the policy changes are removed, this increases to 6.2 per cent.
As well as reflecting child care specific issues, this much higher underlying increase in the cost of child care can be seen as reflecting wider factors in the drivers of price change in Australia. One dimension of this can be seen in the relative changes in prices of 'Tradeable' and 'Non-Tradable' components of the CPI. While the price of items in the tradeable sector (i.e. goods and services with exposure to international trade) increased by 30.5 per cent between June 1998 and September 2018, prices in the non-tradable sector (i.e. without this type of exposure) increased by 101.0 per cent, with the overall CPI, which is a balance of these two sectors increasing by 68.4 per cent. That is, the fact that the cost of a domestically produced service such as child care has increased more rapidly than the CPI is not unusual.
A second series examining the cost of child care by looking at average fees charged by services is produced by the Department of Education and Training. Currently data are published for the period March 2007 to December 2017. As illustrated in Figure 2.7, the series shows a diversity of change over this period, although demonstrating that for the whole period the rate of real growth in child care fees has been positive. In addition to the strong peak in real increases seen in March 2009, lesser peaks were recorded in June 2011 and September 2012, and again in June 2016. After this last peak the rate of real growth in fees appears to have declined, in particular in the year to the last two quarters of 2017.
However, growth in fees was not consistent across sectors. Annualised real growth rates in fees for the period March 2007 to December 2017 ranged from 3.0 per cent for Occasional Care to 4.0 per cent for Long Day Care (Figure 2.8).
Figure 2.7. Nominal and real rates of annual growth in Child Care Fees (all sectors) March 2007 to December 2017
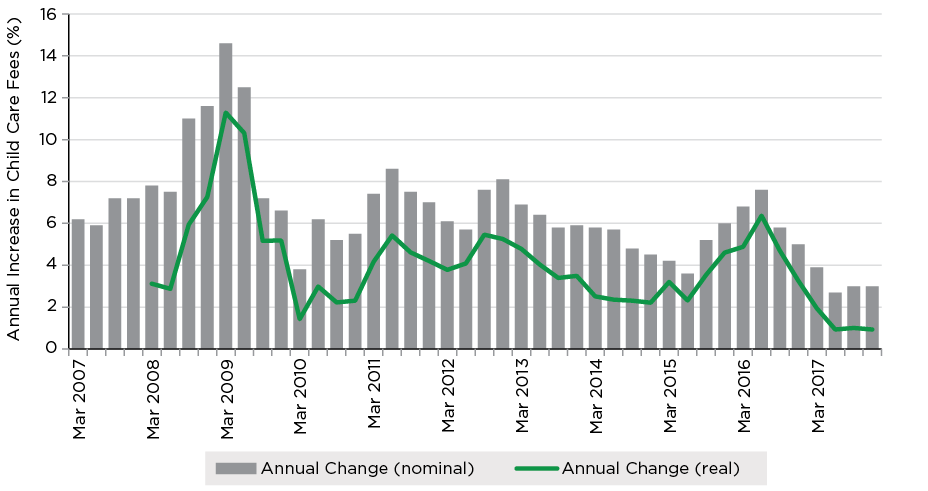
Sources: Derived from Department of Education and Training Early Childhood and Child Care in Summary Reports (various) & ABS 6401.0
Figure 2.8. Annualised real increase in child care fees by sector, March 2007 to December 2017
Sources: Department of Education and Training Early Childhood and Child Care in Summary Reports (various)
2.4 Families, child care and the labour market
This section considers the relationship between child care and workforce participation and provides a high-level summary of trends in maternal employment, discusses how families make work force participation and child care decisions, and considers the impact of children on maternal employment.
Child care, maternal employment and other outcomes
This chapter has already detailed the perspective of the Productivity Commission on the relationship between child care and maternal employment. These issues were also explored in Baxter, Hand, and Sweid (2016), who focused on decision making in respect to flexible work and flexible care and Hand (2007) who explored the ways that couples make decisions about work and care arrangements. These reports discuss the roles of child care affordability, availability and flexibility in relation to parents' use of care and parents' employment. They also highlight that decisions about work and care are also strongly influenced by parents' own views of parenting and gender roles. For example, Baxter et al. (2016) discuss the strong gendered parental norms that still contribute to decision making about work and care in Australia, such that mothers often prefer part-time work or to take time away from paid work while children are young. For some families, these attitudinal factors are more influential than are factors related to the accessibility or affordability of alternate care options.
Taking a wider perspective from the international literature, the German Institute of Labour Economics (IZA) summary of the cross-national evidence on the relationship between child care policies and maternal employment (Vuri, 2016) concludes that:
- countries with a higher availability of affordable child care exhibit high maternal labour force participation rates
- the provision of child care, especially for preschool-aged children, helps mothers achieve a satisfactory work−life balance
- higher child care subsidies result in a substantial increase in child care utilisation
- larger labour supply effects occur in countries where employed single parents or two-earner couples are eligible for the [child care] subsidies.
However, in terms of looking at the implications of further policy development the paper noted:
- the scope for policy to increase labour supply is limited in countries with very high female labour force participation and/or highly subsidised child care systems
- good access to affordable care might result in little or no increase in maternal labour supply if it only crowds out other forms of non-parental care
- difficulties in measuring the lack of qualified people working in child care and the quality of care may prevent families from using this service
- preferences and social norms may drive child care choices, as well as costs and availability.
Australia has several of the characteristics that are associated with child care policies having a greater impact on maternal employment including maternal employment rates around the middle of OECD countries and the fact that many families face significant out-of-pocket child care costs (Vuri, 2016, p. 1).
A recent study presents an overview of economic studies of the outcomes of pre-kindergarten programs undertaken in the United States.11 The studies included in the research were all 'scaled up' projects, rather than smaller experimental studies. This indicated that almost all of the programs had positive cost-benefit outcomes, with a high proportion having returns of two or three times the cost (Karoly, 2017, p. 63). Summary results are shown in Table 2.1. This reports on the 'monetarised outcomes', that is the estimated dollar value of the gains and costs of these programs and the stakeholders to whom these accrue.
While this research relates to the operation of these programs in the United States there are reasonable grounds, given the understood pathways on how these outcomes are manifest, for considering that a similar spread of benefits is likely to be present in Australia.
| Timing of monetisable effect | Stakeholders who incur monetisable effect | ||||
|---|---|---|---|---|---|
| Program participants | Tax payers | Rest of society | |||
| Reduced child abuse and neglect | Childhood | + | + | ||
| Improved school readiness | Adulthood | + (i) | + (i) | ||
| Higher achievement tests | Adulthood | + (i) | + (i) | ||
| Reduced special education use | K-12 years | + | |||
| Reduced grade retention | K-12 years | + | |||
| Increased high school graduation | Adulthood | + (i) | + | ||
| Increased higher education attainment | Adulthood | - | - | ||
| Higher earnings and taxes paid | Adulthood | + | + | ||
| Reduced crime | Adolescence to Adulthood | + | + | ||
| Reduced welfare use | Adolescence to Adulthood | - | + | ||
| Improved health and health behaviour | Adolescence to Adulthood | + | + | + | |
Source: Karoly (2017), p. 59.
Notes: + denotes a favourable effect; - denotes an unfavourable effect. (i) indicate monetisable effect is indirect, i.e. through linkages to later outcomes. Examples include depression, smoking, substance abuse, mortality, and teen pregnancy.
2.5 Trends in parental employment in Australia
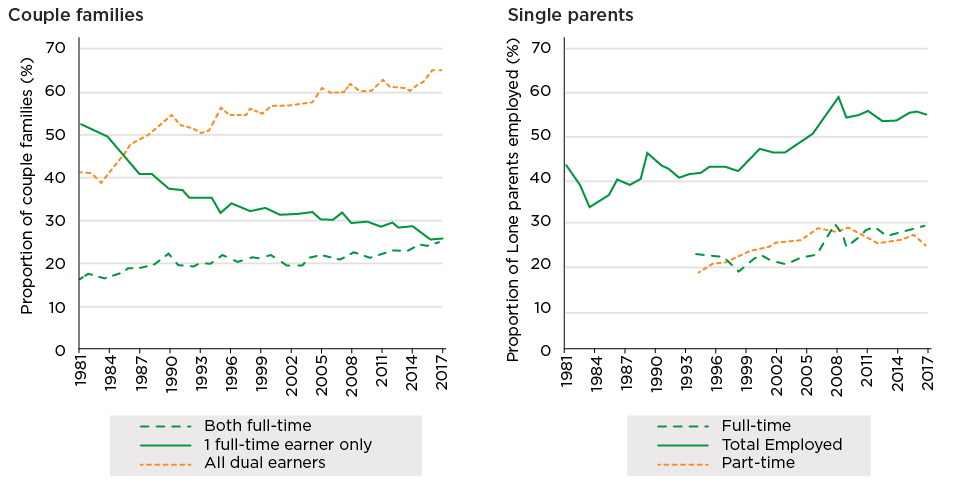
Since 1981 the proportion of couple households with dependent children under 15 years of age in which both parents were in paid employment increased from 41.0 per cent to 65.0 per cent in 2017 (Figure 2.1). The proportion in which there was only one full-time earner decreased from 52.4 per cent to 25.9 per cent over this time period. The proportion of households in which both parents were working full-time increased from 16.5 per cent in 1981 to 25.8 per cent in 2017.
The employment rate of single parents also increased substantially over this period; from 43.2 per cent in 1981 to 55.4 per cent in 2017. While there have been some fluctuations since 1994 (when this breakdown started to be published), the growth in employment of lone parents was roughly equally for part-time and full-time employment.
Figure 2.9. Employment of parents in couple and single parent families with dependent children aged under 15 years 1981 to 2017
Source: Derived from ABS 6224.0 (Various)
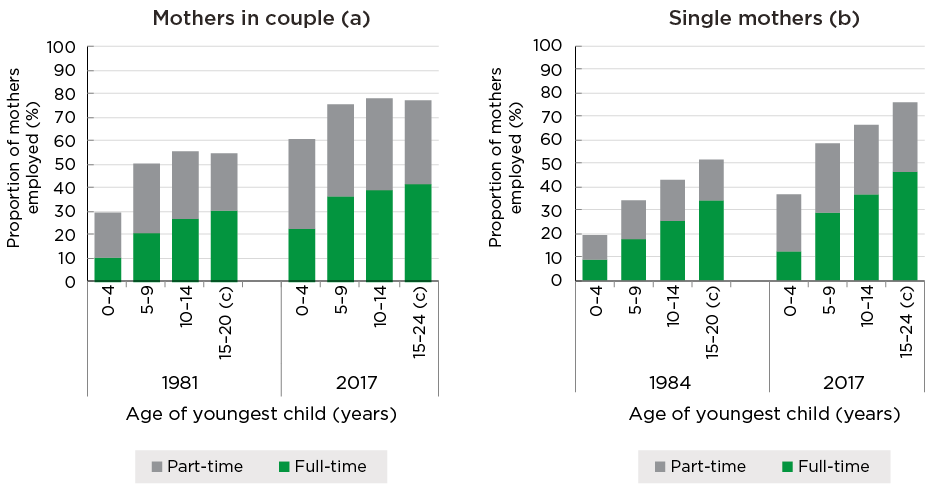
Figure 2.10 shows the employment to population rates for partnered and single mothers with dependent children by the age of their youngest child for 1981 and 2017. There were big increases in employment rates between 1981 and 2017 for all groups irrespective of the age of the youngest child, with the biggest increase for women with a child aged 0 to 4 years whose employment rate increased from 29.6 per cent in 1981 to 60.8 per cent in 2017, a 31.2 percentage point gain. For those with a youngest child aged 5 to 9 years there was a 25.5 percentage point increase in their employment to population rate and for those with children aged 10 to 14 years the employment to population rate increased by 23.0 percentage points. Interestingly there was little change in the share of employment that was full-time between 1981 and 2017 irrespective of the age of the youngest child.
Figure 2.10. Employment to population rate, mothers with dependent children, by age of youngest child and whether they have a partner, 1981, 1984 and 2017

Source: Bray (2018). Underlying data 1981: ABS 6224.0 1981. 2017: ABS 6224.0 2017.
Notes: (a) Opposite sex couples only. (b) Data for single mothers is only available from 1984. (c) In 1981 this category comprised dependent full-time students aged 15-19 years. In 2017 this group included such students aged 15-24 years.
Reasons for using child care
Parents use child care for a range of reasons, including to allow them to be in paid employment and to provide developmental/educational opportunities for their children. A large majority of parents using formal child care give the main reason for their child or children attending care as being because of paid employment, study, training or job search activities.
Data from the 2017 ABS Childhood Education and Care Survey reveal that about three-quarters (76 per cent) of parents with a child under 6 years of age using formal care (other than preschool) report that the main reason for using formal care was because of work, study/training or job search, 14 per cent because they thought it was good for the child, 5 per cent to prepare the child for school and 6 per cent for other parent-related reasons (the most common being to 'give parents a break').
For children aged 6 years or over in formal child care, 92 per cent of parents said that the main reason for using formal care was because of work, study/training or job search; 5 per cent attended due to other parent-related reasons; and just 4 per cent attended for child-related reasons (Figure 2.11). For each age group of children, the category 'parents' work, study/training or job search' is predominantly for parents' work.12
Figure 2.11. Parents' main reasons for using formal child care or preschool, by child age for children under 6 years, 2017
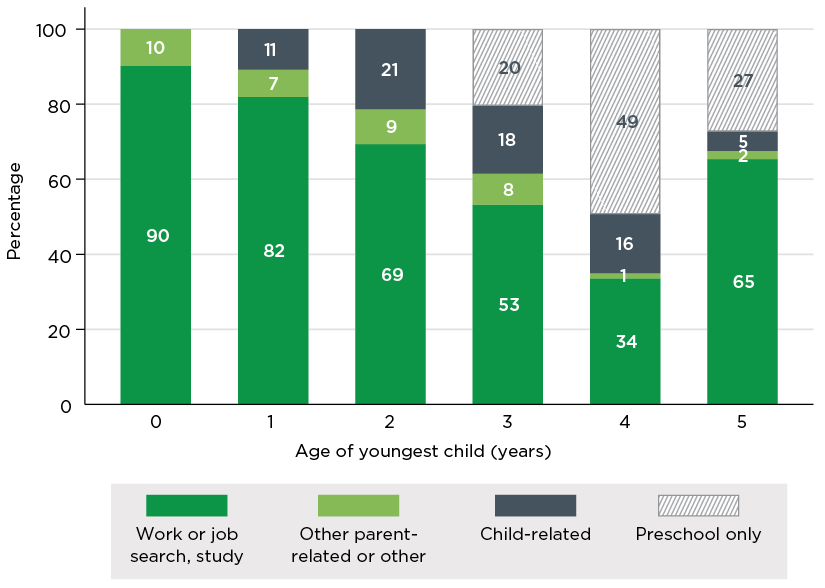
Source: ABS 4402.0 2017. Derived using TableBuilder.
Notes: Columns add to the total percentage of parents using formal child care or early learning. The Childhood Education and Care Survey does not ask about the reasons as to why children are attending preschool.
2.6 Patterns of child care and preschool usage
In June 2017 the proportion of children in formal child care or preschool was 12 per cent of children under the age of 1 year, 40 per cent of children aged 1, 56 per cent of children aged 2, 70 per cent of children aged 3 and reaches a peak of 87 per cent of children aged 4 years (Figure 2.12). It then falls with age of the child to be 38 per cent of children aged 5 years and just 6 per cent of children aged 11 years.
Figure 2.12. Children's participation in child care or preschool by age of child (years), 2017
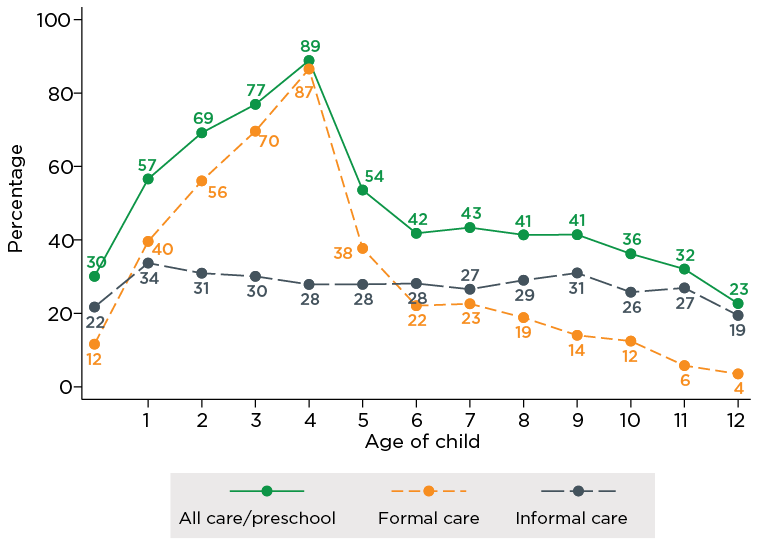
Source: ABS 4402.0 2017. Derived using TableBuilder.
Notes: Formal care includes Long Day Care, Family Day Care, Outside School Hours Care, Occasional Care or other registered care. These estimates are for care used in the preceding week.
The age-related patterns of formal care participation reflect patterns of participation in different types of formal care and early learning (Figure 2.13):
- Preschool is available to children in the year or two before they commence full-time school, so participation clearly peaked at 4 years, with some 3 year olds and 5 year olds also participating in preschool.
- Long Day Care was the main source of formal care to children under school age, with the highest proportions of children in Long Day Care being 2-3 years (46-49 per cent of children), but with 34 per cent of 1 year olds and 38 per cent of 4 year olds also in Long Day Care.
- Smaller percentages of under-school-aged children were in other forms of formal care, which includes Family Day Care and Occasional Care.
- The main provision of formal care to school-aged children was as Outside School Hours Care, and the percentage for this form of care was highest for 6 year olds at 21 per cent, with proportions declining with age of child beyond this.
The average weekly hours in child care in December 2017 was 24.6 hours. It varied from 28.8 hours per week for Long Day Care and 28.5 hours per week for Family Day Care and In Home Care, to 12.2 hours for Occasional Care and 11.2 hours for Outside School Hours Care (Department of Education and Training, 2018c).
Figure 2.13 reports the proportion of children in preschool and Long Day Care separately. However, some Long Day Care centres provide a preschool program, and there is considerable variation in the way in which preschool is delivered across jurisdictions. In some jurisdictions, early childhood education is primarily delivered through dedicated preschools or kindergartens, often attached to schools. In others, it is more often delivered through the child care system. See Baxter and Hand (2013) for more information. Detailed information produced by the ABS on the service types of children aged 4 to 5 years attending preschool programs is shown in Figure 2.14, showing clear variation across jurisdictions.
Figure 2.13. Types of formal child care and early learning by child age (years), 2017
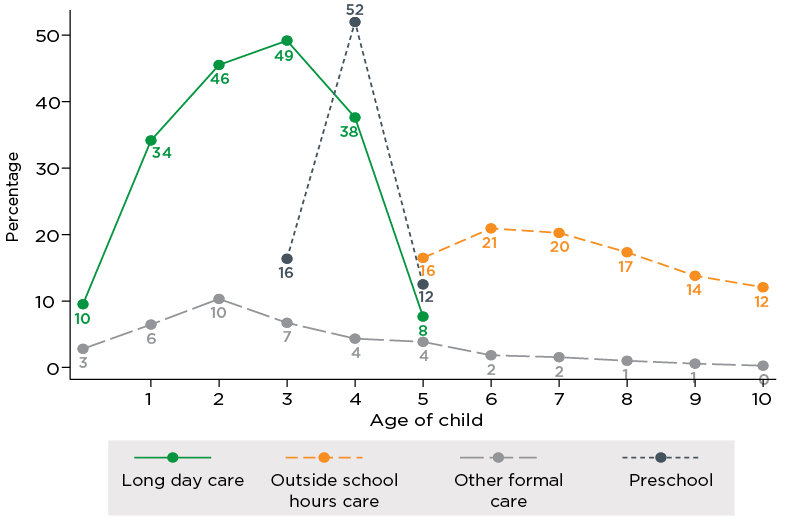
Source: ABS 4402.0 2017. Derived using TableBuilder.
Notes: Information for 11 and 12 year olds is not shown because of the high standard error on the estimate. Small estimates for 'Other formal' are also excluded for school-aged children. 'Other formal' includes Family Day Care and Occasional care. These estimates are for care used in the preceding week.
Figure 2.14. Service types of children aged 4 and 5 years attending preschool programs, by state/territory, 2016
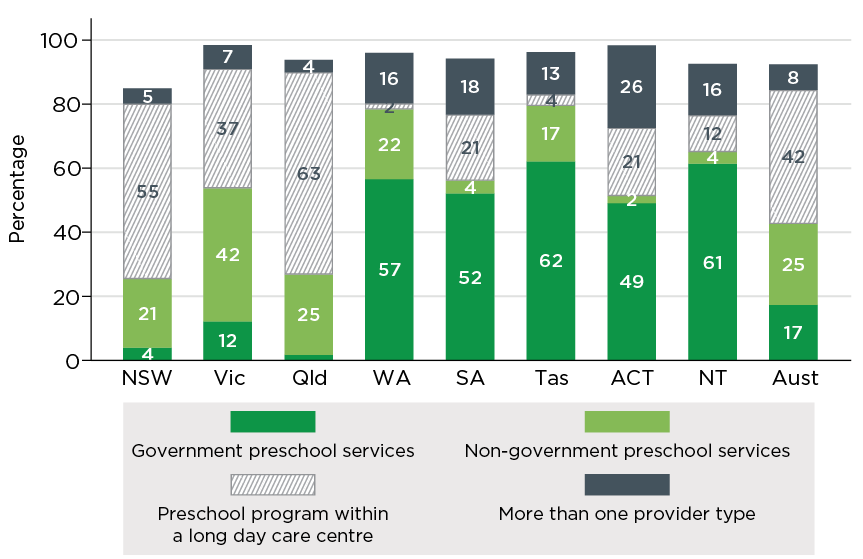
Source: ABS, 4240.0 2016 (Table 3).
Notes: The ABS defines 'preschool program' for the purposes of this collection as 'a structured, play based learning program, delivered by a degree qualified teacher, aimed primarily at children in the year or two before they commence full-time schooling. This is irrespective of the type of institution that provides it or whether it is government funded or privately provided.' The ABS notes that care should be taken when comparing jurisdictions. On the table sourcing these data, they note there may be some duplication of children across service types in the Queensland estimates.
Families not using child care
The proportion of children not in formal care is much lower for families in which the mother is employed and is a little lower for children aged 3 to 5 years than children aged under 3 years (Figure 2.15). This pattern is consistent with parents' reports on the main reason for using child care being for parental employment.
Figure 2.15. Family use of child care, age of youngest child and mothers' work status
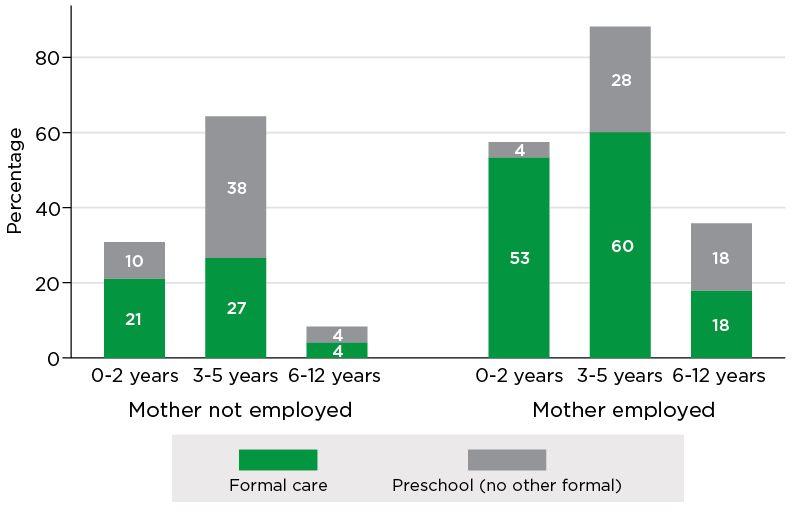
Source: ABS 4402.0 2017. Derived using TableBuilder
Note: Formal care used by any children in the family
Parents in the Baseline Parent Survey who had not used child care in the past year were asked why they had not used child care. Overwhelmingly, as shown in Figure 2.16, the most common response was parents agreeing that they preferred to take care of their child themselves (or have their partner take care of their children) - 78 per cent of parents. This was the most common response, regardless of age of youngest child and of mothers' employment status. The second most common response was the cost of child care reported by 57 per cent of families with employed mothers and 65 per cent of families where the mother was not employed.
Figure 2.16. Families not using child care: Reasons care not used by mothers' work status

Source: Baseline Parent Survey, May 2018.
Notes: Percentages calculated over those who answered one of 'Agree', 'Neither agree or disagree' or 'Disagree', with those who answered 'Not applicable' excluded. This is the percentage who answered 'agree'.
2.7 Overview of the child care system prior to July 2018
Child care payments
This section provides an overview of the child care system as of March 2018, immediately prior to the introduction of the new Child Care Package. Under this prior arrangement support for parents with the cost of child care was primarily through a combination of the Child Care Benefit and Child Care Rebate. Both payments were provided on a per child basis. Additional support for some families was available through Jobs, Education and Training Child Care Fee Assistance, Grandparent Child Care Benefit and Special Child Care Benefit.
The Child Care Benefit was a means tested benefit covering up to 50 hours of approved child care use per child per week provided that parents satisfied an activity test of at least 15 hours per week. 13 The rate of Child Care Benefit depended upon the number of hours of work-related activities, the number of hours of child care used, the number of children in child care, whether the children were at or below school age, the type of service attended, and family income. Families that did not meet the activity test were eligible for Child Care Benefit for up to 24 hours of child care per child per week. Child Care Benefit could be paid either direct to child care services to reduce the fees charged (fee reductions were based on estimated financial year income with reconciliations at the end of the financial year) or as a lump sum payment to parents after reconciliation at the end of the financial year.
The maximum rate of Child Care Benefit was $4.30 per hour for a non-school child ($215 for a 50-hour week). Rates for school children were 85 per cent of the non-school child rate. The maximum rate of Child Care Benefit was payable for families with an income under $45,114 or families on income support. Families with an income above specified income limits did not receive Child Care Benefit with the limit being $156,914 for a family with one child in care, $162,633 for a family with two children in care and $183,655 for a family with three or more children in care and $34,724 for each subsequent child.
The Child Care Rebate was a non-means tested payment that provided additional assistance for families using approved child care. Child Care Rebate provided up to 50 per cent of a family's out-of-pocket child care expenses (after Child Care Benefit was deducted) to a maximum of $7,613 per child per year. To be eligible for the rebate, parents were required to have had some work, training or study related commitments during the week, although there was no minimum number of hours of such activity required.
Using policy settings as at June 2018, Figure 2.17 shows how the amount of Child Care Benefit, Child Care Rebate and the cost paid by parents varied with family income. The scenario is for a family with a preschool-aged child using 40 hours of care per week with child care fees of $500 per week.
Figure 2.17. Child Care Benefit, Child Care Rebate and cost paid by parents by family income, June 2018
Source: Derived from Child Care Benefit and Child Care Rebate Program parameters.
Note: For one preschool child using 40 hours of standard Long Day Care per week and child care fees of $500 per week.
The Jobs, Education and Training Child Care Fee Assistance provided financial assistance to eligible parents who qualified for the maximum rate of Child Care Benefit and it paid for most of the gap in out-of-pocket costs while a parent was working, studying or training.
Special Child Care Benefit was available for families experiencing financial hardship or for children at risk. Grandparents who were primary carers of a child may have been eligible for Grandparent Child Care Benefit. Special and Grandparent Child Care Benefit could be up to the full costs of child care and were not subject to an activity test.
Child care programs
In addition to the general support provided to parents, a range of programs existed primarily to support services, or in some cases specific groups of parents. The Community Support Program provided assistance payments to providers including establishment and sustainability assistance, operational support, Long Day Care Capital Funding Exceptional Circumstances Grants and the Regional Travel Assistance Grants. The Community Support Program ceased in June 2018, with the introduction of the Community Child Care Fund in July 2018.
The Budget Based Funded (BBF) Program (established in 2003) had similar objectives to the Community Support Program, but with an emphasis on non-mainstream services in rural, remote and Aboriginal and Torres Strait Islander communities. Non-mainstream services were established to provide child care where the market would otherwise fail to provide services.
The In Home Care program provided a flexible form of child care to children in the child's home. It was only available to children in specific circumstances, including where the child or other children in the home had a disability, the parent or their partner had a disability that reduced their capacity to care for the child, the child lived in a rural or remote area, and/or the work hours of the child's parents meant that no other services were available.
The Inclusion Support Programme is part of the Child Care Package, but was introduced in 2016 following the cessation of the former Inclusion and Professional Support Program. It provides support to child care services to enable them to provide inclusive approaches to the provision of child care. This support may include access to the Inclusion Development Fund.
Connected Beginnings is similarly part of the Child Care Package but has also operated since July 2016. It provides support to integrate early childhood, maternal and child health and family support services with schools in a selected number of Aboriginal and Torres Strait Islander communities.
2.8 Summary
There has been strong growth in the child care sector over the last 40 years as a result of increases in parental employment (particularly couples in which both parents are in paid employment) and population growth. The primary focus of the child care sector is about enabling parental employment, although the focus on the child developmental and educational outcomes has increased via the development, implementation and enforcement of national quality standards.
The mix of types of child care has changed over time, but both Long Day Care and Family Day Care remain significant. For school-aged children there has been a rapid increase in Outside School Hours Care and this is a growing sector. A substantial proportion of child care, particularly in the Family Day Care and Long Day Care sectors is provided by the private sector and this appears to have been relatively stable since the mid-1990s.
The underlying cost of provision of child care has grown much more rapidly than prices overall. This reflects many factors including changes in quality and the costs of staffing. ABS estimates indicate that while government policies directed at this have had some immediate success in offsetting the more rapid increase in the cost of child care, they have not been successful at addressing the overall trend over time.
2 This chapter is based on a forthcoming publication by Bray, Hand, Baxter and Gray.
3 Most references to this form of care in this report refer instead to Long Day Care as the care type, as the use of 'Centre Based Day Care' replaced Long Day Care as a care type on 2 July 2018.
4 The early learning programs in the year before full-time school (and in some states, two years before) are generally referred to as preschool or kindergarten, but with the actual terminology varying across states. For the purposes of this report, we have generally used the terminology of preschool.
5 While making this demarcation of the differences between the two sectors with respect to the educational role they undertake, it is noted that in part this relates to emphasis and specific pedagogical approaches. More generally, for example, The Early Years Learning Framework for Australia (Council of Australian Governments [COAG], 2009) encompasses children up to five years old without sectoral delineation.
6 One policy context for this policy was strong debate around whether child care expenses should be seen as a legitimate tax deduction as a cost of work.
7 The name of the Child Care Tax Rebate was changed to the Child Care Rebate in 2009/10.
8 The bulk of the services, some 660 centres, were transferred to Goodstart Early Learning, a syndicate of Australian community-sector organisations: The Benevolent Society, the Brotherhood of St Laurence, Mission Australia and Social Ventures Australia. The Syndicate was formed in 2009 and began operating ABC Learning Centres nationally in December 2009.
9 Data from Australian Children's Education and Care Quality Authority National Quality Standard Data as at 30 September 2018.
10 This fall was as a result of a May 2007 change in the way in which the Child Care Tax Rebate (CCTR) was paid. Instead of being paid through the tax system the payment was to be made through the Family Assistance Office. This change was largely triggered by a change in the treatment of the cost of child care in the CPI. The ABS estimates that without the change in treatment the Child Care Expenditure Class Index would have fallen, due to the changes in indexation by just 4.9 per cent. From the perspective of families this change in treatment of the CCTR did not have an impact on household budgets per se, although it can be considered that the previous operation of CCTR can be seen as decreasing their effective costs in the preceding periods, rather than occurring at this point.
11 In the United States' education system most children enter formal kindergarten at age 5 as part of the elementary education system. Reference to pre-Kindergarten here is to children aged 3 and 4 years.
12 The data includes 2 per cent who were doing work-related study/training, another 2 per cent doing other study/training and 1 per cent looking for work.
13 Assistance could be paid for children aged up to age 18 years, and for older children in a number of defined circumstances.
This chapter provides a summary of the Evaluation Framework, the methodological approach to the evaluation overall and the data sources used for this report. A detailed overview of the evaluation methodology is available in the Evaluation Framework (AIFS, ANU, SPRC, & SRC, 2018). Further detail on the methods and data are provided in Appendices C.1 to C.5.
3.1 The Evaluation Framework
The evaluation is being conducted in accordance with an Evaluation Framework which has been developed to outline the overarching evaluation questions and methodologies. This framework reflects the objectives established by the government for the program and identifies key issues for consideration.
The evaluation has primary responsibility for evaluating the impacts of the:
- Child Care Subsidy
- Additional Child Care Subsidy
- Community Child Care Fund
- Inclusion Support Programme
- In Home Care program.
The Connected Beginnings program, while an element of the Child Care Package, is not being directly addressed in the evaluation. This program commenced in 2016 and has a specific focus on the integration of early childhood, maternal and child health and family support services to better prepare Aboriginal and/or Torres Strait Islander children for school in selected communities. The Connected Beginnings program is being evaluated separately.
The evaluation will integrate the findings of these different components of the package to understand its overall impact.
While the Inclusion Support Programme and In Home Care program are part of the overall evaluation, they are also being addressed more specifically, including as the subject of early reporting as detailed below.
In addition, the evaluation project team is supporting the Department of Education and Training's development of Post Implementation Reviews. The purpose of these reviews is to enable the Department to obtain early and targeted information on the implementation phase of the program to ensure that implementation was undertaken as proposed, to identify any issues arising from the implementation which need to be addressed in both policy and operational terms, and as a source of internal learning.14
The Evaluation Framework has been developed using the broad program logic of the Child Care Package (Figure 3.1).
Figure 3.1. Broad program logic of Child Care Package
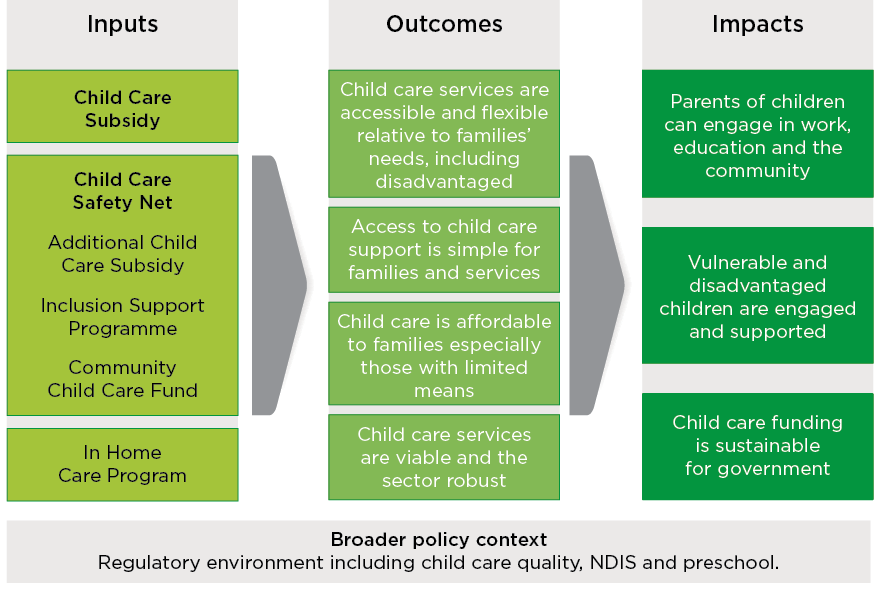
Source: Child Care Evaluation: Evaluation Framework, June 2018
The evaluation is focusing on four key outcomes and three key impacts:
Outcome 1: Child care services are accessible and flexible relative to families' needs, including disadvantaged and vulnerable families.
Outcome 2: Access to child care support is simple for families and services.
Outcome 3: Child care is affordable to families especially those with limited means.
Outcome 4: Child care services are viable and sector robust.
Impact 1: Parents of children can engage in work, education and the community.
Impact 2: Vulnerable and disadvantaged children are engaged and supported.
Impact 3: Child care funding is sustainable for government.
In addition to these specific outcomes and impacts which reflect program goals and objectives, the evaluation will also investigate whether or not the program has had any unanticipated outcomes.
The impact evaluation is the primary focus of the Evaluation Framework. However, the earlier stages of the evaluation, including this report, will provide the Department with early feedback from data collections (such as reporting on any issues or themes emerging from survey responses, interviews and case studies) and supporting the Department's Post-Implementation Review work. Hence there are also formative and process stages to the evaluation. The current report sits primarily in these formative and process stages. It focuses on understanding the baseline context of the child care system in Australia as well as the lead up to, and experiences of, implementation of the package.
3.2 Key evaluation outputs
This Early Monitoring Report is the first of a series of outputs from the evaluation. Subsequent key scheduled outputs are:
- Program specific evaluation report on the Inclusion Support Programme June 2019
- Program specific early evaluation report on the In Home Care program June 2019
- Interim Evaluation Report December 2019
- Program specific final evaluation report on the In Home Care program June 2020
- Draft Final Evaluation Report December 2020
- Final Evaluation Report June 2021.
In addition, this evaluation project will provide to the Department in December 2020 a roadmap for any ongoing 2021-23 evaluation activities that may be required.
3.3 Evaluating change
The evaluation is primarily concerned with the impact of the Child Care Package. This includes evaluating the extent to which the policies contained in the Child Care Package have achieved their stated outcomes relative to those under the pre-existing policies as well as evaluating the overall impact and outcomes of the Child Care Package.
The focus on the broad outcomes is also valuable in terms of identifying any unexpected outcomes of the Child Care Package.
While the evaluation sought to obtain robust 'baseline' data prior to implementation of the new package, there have been some limitations to this. One is that data systems that existed prior to the package being implemented do not capture the full set of information proposed for collection under the new system (e.g. the number of hours children attend care). The second is the fact that the baseline data were collected subsequent to the announcement of the new package and that services and families may have already made changes in anticipation of the new system.
3.4 Elements of the evaluation
The evaluation design reflects the multiple goals for the package including: affordability; access and targeting; sustainability; and ensuring that the system is simpler to understand while still maintaining payment integrity. The findings on specific elements of the package will be synthesised into the overall evaluation, answering questions about the achievement of the program objectives and providing information for future policy development.
Broad approach to the evaluation
The evaluation approach is underpinned by three main principles: maximising the use of existing data; exploiting the opportunities for data linkages wherever possible to allow for the maximum leverage; and using data longitudinally to allow for more robust analytical techniques.
The multi-dimensionality of the reform goals means that a multi-faceted evaluation approach is required. This will allow the triangulation of data from different sources and methodologies to arrive at robust evaluation findings. In addition, in the absence of a control group and given that the changes were implemented in July 2018, the evaluation will rely on pre- and post-comparisons as well as triangulation of data.
The broad approach to be adopted by the evaluation is to consider the child care reforms and their outcomes as a whole. Within this integrated approach the evaluation will, however, consider and report on specific programs. It will also incorporate a number of cross-cutting foci, representing particular sectors of services, and the populations for which services are delivered.
Where there are quite distinct care types - such as Out of School Hours Care relative to Long Day Care/Family Day Care - the analysis of these will be reported on, highlighting where outcomes vary. This will also be the case with respect to different programs, and to the elements of the Child Care Safety Net (the Additional Child Care Subsidy, Inclusion Support Programme and Community Child Care Fund) where the interest is in both how these programs operate with respect to specific outcomes and their contribution to the child care system overall. As such, cross-cutting elements of the program will in the first instance be considered at the aggregate.
The specific elements of this drilling down approach will be a focus on: key service sectors - defined both by the sector and by the program; families - looking at subpopulations of families with specific foci on those with high, or non-mainstream needs, as well as the differential impacts on different family types; and issues that are concerned with the intersection between child care and associated services and activities.
Identifying and reporting on any unintended consequences of the Child Care Package will be done through ongoing evaluation activities.
Two particular aspects of the evaluation which address key impacts and outcomes:
- A multifaceted approach will be taken to measuring child care affordability. This will comprise: parent assessments from the Parent Survey analysis of information on affordability contained in administrative data microsimulation modelling using the ANU Centre for Social Research and Methods' PolicyMod to identify both aggregate and subpopulation (family type, number of children, income levels and regionally), with results benchmarked to administrative data.
- The impact of the child care reforms on workforce participation will be measured. This will again be undertaken using a multifaceted approach, which will allow the triangulation of data from different sources and methodologies to arrive at robust evaluation findings. In addition to the direct use of administrative data and the results of surveys of parents, and in-depth and focus group components of the data collection, we propose several strategies to measure change and understand how individual parents respond. Elements include: well calibrated econometric labour supply models to estimate the impact of price changes on workforce participation (intensive and extensive) econometric analysis of labour force data to identify participation change choice experiments using online survey techniques. Alongside this HILDA and relevant ABS surveys will be analysed to identify broad patterns and trends in parental employment, child care use and identification of child care as a barrier to employment.
To integrate the evaluation findings with other aspects of monitoring any review of these reforms being undertaken by the Department, the evaluation will:
- undertake extensive ongoing discussions with the Department
- draw on monitoring, reviews and evaluations conducted by the Department into specific program aspects
- utilise learnings from related research.
Evaluation data sources
The evaluation will draw data from a wide range of sources including specific collections undertaken by the evaluation team, administrative and other data collected by the Department and data collected by other agencies including the ABS. The key data sources for use in the evaluation are summarised below, with further details of those collections used in this report in section 3.7.
Quantitative survey data from parents and providers will include:
- the parent survey commissioned by the Department of Education and Training and conducted by ORIMA Research (including a baseline data collection prior to the implementation of the Child Care Package and then subsequent biannual surveys)
- an online panel survey of parents conducted by AIFS - the Child Care Package Family Survey, (CCPFamS)
- a three-wave longitudinal survey of services (the Survey of Early Learning and Care Services, SELCS) which commenced with a pre-implementation survey in May-June 2018
- specific surveys undertaken by the evaluation team on the Inclusion Support Programme and In Home Care program.
In-depth qualitative data will be collected including from parents, providers and other stakeholders through:
- a series of case studies (see below for more detail) with the first of these conducted in late 2018
- a program of interviews with stakeholders, providers and services
- qualitative data collection with parents.
Administrative and related program data including:
- unit record files of families' child care use and of child care services. These, drawn from records of both the Department of Employment and Training and the Department of Social Service will allow for the examination of patterns of child care use, and cost, and the use of program elements such as ACCS as well as the nature of service provision including session lengths and times, fees, levels of utilisation and service entries and exits. Although it had been anticipated that an initial pre- and post-implementation file would be available to allow for analysis of the transition of families and children to the package to be included as part of this early monitoring report these data have not yet been available to the evaluation team
- Post Implementation Reviews being undertaken the Department of Education and Training reporting on and assessing the implementation and establishment phase of the program. (As with the unit record files while it was originally envisaged that these reports would be used as a significant input into this report, delays in their preparation have precluded this)
- other Departmental reporting on the programs and on operational aspects. This includes the use of tools such as the parent portal, and outcomes of activities such as communications and compliance activity, as well as special collections such as the Child Care Workforce Census and the In Home Care transition project
- program data drawn from: Inclusion Agency and Inclusion Fund Development Manager reports In Home Care Support Agency reports the ACECQA National Quality Agenda Information Technology System (NQA ITS) Grant data from the Department of Social Services (DSS) Community Grants Hub.
This will be complemented by other data sources including ABS surveys, the Household Income and Labour Dynamics Australia (HILDA) and Living in Australia (LinA) surveys as well as surveys and other analysis undertaken by researchers, peak bodies and other organisations.
Case studies
The evaluation is proposing to undertake nine case studies (seven general case studies and one each specific to the Inclusion Support Programme and In Home Care program). As noted above these are designed to be intensive qualitative studies to examine the impact of the package, as a whole or in some cases focused on particular elements, including wider interactions in different social, demographic and program contexts.
The first of the general case studies, undertaken August to December 2018 was located in a low socio-economic urban area. Research participants were recruited from a selection of services which were a mix of local government, for profit and non-profit early learning and child care providers, including both small owner managed services and large organisations. In addition to providing direct input to the evaluation, the pilot case study was designed to test, and optimise, approaches to this style of data collection.
The two program case studies (for the Inclusion Support Programme and the In Home Care program) will be conducted early 2019.
While the final choice of focus of the seven general case studies has not been resolved, current proposals include (but are not limited to) case studies that will have a focus on the following themes:
- Aboriginal and Torres Strait Islander families and communities
- low SES areas
- culturally and linguistically diverse (CALD) communities
- regional areas.
3.5 Ethics
All qualitative and quantitative data collections being undertaken by the consortium partners are subject to ethics approval via AIFS' NHMRC accredited Human Research Ethics Committee. Additional ethics approvals will be sought in relation to case studies focusing on Aboriginal and Torres Strait Islander families and communities.
3.6 Stakeholder engagement
The evaluation is drawing on extensive engagement with stakeholders. In addition to the Department of Education and Training, this includes the Department's Implementation and Transition Reference Group which comprises of members from peak bodies and large service organisations and the Evaluation Working Group which has members from the Department as well as from the Departments of Human Services and Social Services.
3.7 Data used in this report
The report draws on both existing and new data.
A range of data that describes the nature of the child care system, the level of usage of child care and characteristics of those using the system, and costs of the system and how this has changed over time, is drawn on for the introductory chapters of the report. While some limited administrative data on the transition of families and services to the new system have been accessed and are used in this report, it was anticipated that more substantial data, including initial findings from the program Post Implementation Reviews being undertaken by the Department and a more extensive body of administrative data covering the transition period would also be used. At the time of writing these were not available to the evaluation. This has limited the extent to which we can address the key evaluation outcomes and impacts in this current report.
Data collected for the purpose of the evaluation are also used for this report. These data include:
- data collected from services just prior to the transition to the new child care system:
- the Baseline Survey of Early Learning and Care Services, Wave 1 (SELCS)
- data collected from parents shortly before and shortly after the transition to the new system:
- the Baseline Parents Survey
- the Life in Australia Panel (LinA)
- the Child Care Package Family Survey (CCPFamS).
These are summarised in Table 3.1 below and described in more detail in the discussion that follows. Preliminary data from interviews with key stakeholders and from the pilot case study are also referred to in the report. However, these components have only just been completed and were not able to be analysed systematically for inclusion in this report. Rather they are referenced to indicate emerging findings and themes that will be interrogated in more detail in later reports. These data are presented in Chapter 7, along with an overview of the methodology.
| Baseline Parent Survey | Child Care Package Family Survey (CCPFamS) | Life in Australia panel (LinA) | Baseline Survey of Early Learning and Care Services (SELCS) | |
|---|---|---|---|---|
| Conducted by | ORIMA Research | Evaluation consortium | Social Research Centre | Evaluation consortium |
| When | May 2018 | November 2018 | July, August 2018 | May-June 2018 |
| Coverage | Representative sample of parents at May 2018, including a sample drawn from formal child care users | Baseline Parent Survey respondents who used child care, who agreed to be contacted by AIFS were in scope for this survey | LinA is representative of the Australian population. Child care questions were asked of a subsample of parents using screening questions. | All services current at April 2018 were in scope. |
| Number of respondents | Total of 6,189, including 4,423 formal child care users | 502 (fully responding) | 206 respondents who used paid child care in July 2018; 184 respondents used paid child care in the previous six months in August 2018 | 2,619 services |
| Comments | Weighted estimates are presented in this report. | Weights could not be calculated for this survey so all estimates are unweighted. | Weighted estimates are presented in this report. | Weighted estimates are presented in this report. |
3.8 Detailed data collection descriptions
The Survey of Early Learning and Care Services (SELCS), Wave 1
The Baseline SELCS, Wave 1, was conducted in May-June 2018, just before the introduction of the Child Care Package. This survey provides baseline data about service characteristics, as well as providing information about services' preparedness for the changes and views about the likely impact of these changes. Respondents to the Baseline SELCS were predominantly service managers, administrators or co-ordinators, or others with similar positions.
The Baseline SELCS was designed by the evaluation consortium to inform the evaluation of the Child Care Package. The survey was developed in consultation with the Department of Education and Training and representatives of the child care sector. Data collection was undertaken by the Social Research Centre, one of the consortium members. Some key points about the survey are:
- Data collection was 28 May 2018 to 29 June 2018. A sample of 5,300, out of an in-scope population of 12,759 services, was invited to participate in the survey. The sample was stratified by service type, location, and size.
- A total of 2,808 services responded to the survey. This is response rate of 53 per cent, although the response rate varied by sector. Around half the surveys were completed by Computer Assisted Telephone Interviews (CATI), a small number at the enterprise/provider level and the rest completed online.
- During phone interviews, participants often expressed a desire to contribute to the evaluation. Refusals were most often related to time constraints, with services frequently citing the pressures they were facing in preparing for the introduction of the package.
See also Appendix C.2 for more information and sample characteristics and Appendix E.1 for a copy of the survey instrument.
Analyses of services survey data
All estimates from the Baseline SELCS presented here have been weighted, and standard errors calculated, to take account of sample design and non-response bias.15
Regression analyses have been used to explore whether differences in responses by service type can be explained at least in part by other service characteristics, and to explore differences by provider size. This analysis has included variables such as:
- state/territory
- remoteness (ARIA), based on service postcode
- local area (based on service postcode) advantage/disadvantage, based on the 2016 SEIFA decile on the Index of Relative Socio-Economic Advantage and Disadvantage (IRSAD), which ranks areas from most disadvantaged through to most advantaged, drawing on information from the five-yearly census
- service size, as measured by the number of staff employed by the service, as reported in the Baseline SELCS
- whether services were private sector, versus public or community sector. This was derived from Department of Education and Training data
- financial viability of the service, as reported in the Baseline SELCS.
These variables were selected, to allow examination of how early experiences of the Child Care Package varied across different segments of the sector. Not all variables are discussed within the text of relevant chapters - rather key findings are highlighted where appropriate. The multivariate analyses are provided in detail in Appendix A.
Qualitative data from the Survey of Early Learning and Care Services
In the Baseline SELCS, services were also asked to provide comments for a range of questions. In particular, the survey concluded with the question: 'Is there anything else you would like to say about the changes and how they may impact families or the child care sector?'.
Notwithstanding the length of the survey, and the number of questions where respondents were asked to provide some additional information, this question elicited a strong response. Out of a total of 2,619 respondents, 42 per cent provided a comment. Qualitative methods have not been used to analyse these data at this stage, but responses are used here to illustrate a range of experiences and perceptions as related to the quantitative data collected as part of the survey.
An important contextual note is that a higher proportion of services that were negative about the Child Care Package provided comments - 57 per cent of those who thought the package would have a negative impact on the child care sector provided a comment, compared to 34 per cent of those who thought it would have a positive impact. While fewer positive than negative comments were received, a mix of both have been included in the text to help understand some of the issues services may have faced. A more detailed analysis of this data, where relevant, will be included in future evaluation reports.
The Baseline Parent Survey
The Baseline Parent Survey was conducted by ORIMA Research in May 2018 as a random sample survey of parents with young children. Child care users were sampled from the Department's Child Care Management System (CCMS) administrative data for the March quarter 2018, while non-child care users were sourced from an online panel maintained by the ORIMA Online Research Unit. Data were collected online, and via CATI and Computer Assisted Personal Interview (CAPI) for targeted populations.
The baseline survey captures a range of quantitative data including:
- respondent and partner's employment and activity status
- use of, and views on, paid child care
- use of, and views on, early childhood education
- use of, and views on, unpaid child care
- understanding of the child care system, including sources of information about child care services and government fee assistance
- attitudinal questions related to career, child care and family
- demographic characteristics.
The Baseline Parents Survey was completed by 6,189 parents, of which 4,423 (71.5 per cent) were child care users as identified in the CCMS database. To ensure adequate coverage of smaller populations of interest, sampling rates of these groups were increased. Weights were then calculated to produce unbiased population estimates. Unless otherwise indicated, this report uses the full sample of child care users with population weights applied. A table of sample characteristics can be found in Appendix C.3.
Survey respondents recruited from CCMS data were asked if their details and contact information could be provided to AIFS for further data collection. Those that consented formed the subsample for our Child Care Package Families Survey, as discussed below.
Life in Australia (LinA)
The LinA Survey is a panel survey conducted by the Social Research Centre. It is based on random probability-based sampling methods and comprises both an online and offline population. The survey is designed to be generalisable to the Australian population aged 18 years and over, and is conducted through a mix of online and telephone interviews.
In July and August 2018 (Waves 18 and 19) the survey contained a number of child care questions relating to the introduction of the Child Care package. The July (Wave 18) survey was undertaken in the second half of the month, and hence subsequent to the new arrangements. There were 2,260 respondents to the Wave 18 survey. In August (Wave 19), there were 2,220 respondents. Within each wave, a screening question identified the child care population (those with children using paid child care).
Survey questions in July 2018 focused on the experience of transitioning to the new Child Care Package. Respondents were asked about the application process. Specifically:
- For your family, was the process of applying for the new child care fee assistance (which commenced from 2nd July 2018) easy or difficult?
The August questions addressed the early impact of the changes, including:
- the impact of the changes on the net cost of child care for households
- the extent to which people had responded to changes in the subsidy arrangements with respect to their work, study and other activities
- their views on the changes and child care more generally.
While LinA is designed to obtain information for the Australian population as a whole, the size of the sample limits its capacity to provide detailed information on sub-populations, including on those individuals using child care. In Wave 18, 206 respondents reported that they had children in paid child care, and in Wave 19 there were 184 who reported using paid child care in the previous six months.
These relatively small sample sizes pose a series of limitations of the child care questions. When weights are applied, the population of users does not easily translate into an estimate of the number of families using child care, nor does it benchmark well against administrative and other data collections. Further, individual estimates are subject to high sampling variability, which in most cases renders differences observed in the data as being statistically insignificant, severely restricting the ability to draw inferences from the survey as to the impact.
Notwithstanding this, it is considered that the findings of these surveys, when used with caution, provide some insight into the changes and their consequences, both directly, and as a tool for the development of more detailed evaluation strategies. They are also usefully triangulated with other data collected from parents such as the Baseline Parents Survey and the Child Care Package Families Survey.
The Child Care Package Families Survey (CCPFamS)
The CCPFamS was conducted by AIFS in November 2018. In effect, the ORIMA survey is Wave 0 for these respondents. A total of 1,980 Baseline Parent Survey respondents who used child care and agreed to be contacted by AIFS were in scope for this survey. Valid email addresses were available for 1,827 of the 1,980 persons, so the initial invitation to participate in the survey was sent by email to them, with follow-up emails sent through the fieldwork period to maximise response.
The survey was open from 29 October to 30 November, during which time 502 participants completed the survey in full, with an additional 80 partial completes, for an overall response rate of 32 per cent (27 per cent for complete responses). Only complete responses were included in analysis for this report.
The survey captured information from parents and carers on:
- use and costs of child care, to allow analysis of how it has changed since May
- the experiences of parents relating to the Child Care Subsidy application process
- information about eligibility for the Child Care Subsidy and Additional Child Care Subsidy
- how child care use has changed (and why)
- parents' experience of child care provision, including their perceptions about and satisfaction with the services they use
- parents' work and other activities.
The survey is further detailed at Appendix C.4 and the survey instrument is at Appendix E.2.
The sample is not a representative sample. The sample is drawn entirely from respondents to the Baseline Parent Survey, who were randomly selected into that survey from the child care administrative data and then consented for their details to be passed on to AIFS. Therefore, the sample for this survey may be biased toward families with certain characteristics, with initial analysis indicating that it tends to underrepresent low-income families who use child care. Appendix C.4.1 shows the distribution of family characteristics in our sample, compared with our sampling frame and the population-representative weighted ORIMA values.
Qualitative data from the CCPFamS
As with the Baseline SELCS, the CCPFamS allowed for survey respondents to provide additional comments. In this report we report primarily on parents' responses to the following questions:
- 'Are there any comments you would like to make on specific experiences related to the application for child care assistance, or dealing with the Department of Human Services or Centrelink'.
- 'This survey will feed into the Child Care Package evaluation. Is there anything else you would like to comment on, to inform this evaluation?'
Out of a total of 502 respondents to the survey, 20 per cent provided comments to the first of these and 18 per cent to the second (not including responses such as 'no', 'no comment' or 'n/a').
The responses to these questions had not been systematically analysed at the time of drafting this report, so their use has been limited to using a selection of comments to illustrate the quantitative findings.
Initial analyses do show, however, that respondents who were more negative about the transition to the Child Care Package or about the impact of the package for their family in their responses overall, were more likely to provide a comment than those who were positive. For example:
- Respondents who found the transition seamless were less likely to provide a comment regarding the application process or Centrelink (16 per cent commented) than were those who did not find it seamless (39 per cent commented).
- Respondents who felt the Child Care Package was, overall, positive for their family were less likely to provide a comment (14 per cent) than those who felt the Child Care Package was, overall, negative for their family (42 per cent).
As with the Baseline SELCS, a mix of both positive and negative comments have been included in the text for illustrative purposes. A more detailed analysis of these data, where relevant, will also be included in future evaluation reports.
3.9 Implications for this report
This early monitoring report is the first substantive report of the evaluation. As indicated above, however, it has not sought to directly address the specific evaluation questions which have been established in the evaluation framework. This reflects:
- The early phase of implementation - it is too early to identify the extent to which the new arrangements will lead to changes in behaviour in terms of service offerings and charges, and parents' use of child care and participation in employment.
- There was a limited amount of data on the transition and on the current use of services, reflecting only the specific surveys undertaken by the evaluation team and summary administrative reports, rather than the more comprehensive administrative data envisaged on the pre- and post-populations.
- The unavailability of initial findings from the program Post Implementation Reviews, as well as the administrative data covering the transition period, limits the extent to which key evaluation outcomes and impacts can be addressed in this report.
The first of these was anticipated in the framing of the evaluation, such that this first report was to focus on early monitoring, with later reports to explore outcomes and impacts, including the final report to be completed in June 2021. Further, this evaluation framing recognised that there may be a need for a longer-term view to the evaluation of outcomes and impacts, with the current evaluation project to include the development of a road map for evaluation activities beyond 2021, up to 2023.
14 Post Implementation Reviews (PIRs) are the responsibility of program areas within the Department, but the evaluation team is providing support to those program areas, to help guide their PIR activities, and to inform them of evaluation data that may be useful to their PIR work.
15 In accordance with usual practice, multivariate analysis has been undertaken on the basis of unweighted data although the survey design is taken into account in the estimation of standard errors.
This chapter is concerned with the Child Care Package introduced in 2018. It considers the background, the nature of the changes, the broader context of child care and support for families with children and the characteristics of the sector at the time of implementation. This information is provided to document the policy and broader context that is relevant to the evaluation of the Child Care Package.
4.1 Objectives of the package
In his second reading speech on the Family Assistance Legislation Amendment (Jobs for Families Child Care Package) Bill 2016, the Minister for Social Services detailed the government's motivation for the initiative as:
This package will deliver genuine, much-needed reform for a simpler, more affordable, more accessible and more flexible early education and child care system … Together, these reforms will ensure that, in a fiscally sustainable way, we can achieve three important goals:
- continue to assist families in raising their children and provide access to quality early learning opportunities over the long term;
- enable and encourage greater workforce participation; and
- simplify our child care payments and social security systems ……
The more specific outcome and impact objectives of the program, which form the basis of the program evaluation, have been detailed in Chapter 3.
4.2 Implementation of the package
Commencing in 2015, the government developed a set of policies, the 'Jobs for Families Child Care Package', to effect changes to the funding and operation of child care in Australia. This was in response to the findings of the 2014 Productivity Commission Report on Child Care and Early Childhood Learning (as discussed in Chapter 2) and an extensive consultation process undertaken by the government in 2015. This package was originally proposed in the 2015-16 Budget, but faced extensive parliamentary scrutiny. The final primary legislation amendment bill passed in March 2017 with an implementation date of July 2018.
More specifically the sequence of the legislative process for this policy comprised:
- Family Assistance Legislative Amendment (Jobs for Families Child Care Package) Bill 2015, introduced in the House of Representatives on 2 December 2015
- Family Assistance Legislative Amendment (Jobs for Families Child Care Package) Bill 2016, introduced in the House of Representatives on 1 September 2016
- Social Services Legislative Amendment (Omnibus Savings and Child Care Reform) Bill 2017, introduced in the House of Representatives on 8 February 2017 and the Senate on 20 March 2017.
The Family Assistance Legislative Amendment (Jobs for Families Child Care Package) Bill 2017 was passed by the Senate, with amendment, on 20 March, and by the House of Representatives on 27 March 2017 and received Royal Assent on 4 April 2017.
The Social Services Legislative Amendment (Omnibus Savings and Child Care Reform) Bill 2017 was significant to the package in terms of funding. The Minister for Social Security, Christian Porter, in introducing the legislation emphasised this in arguing that 'the significant investment in child care must be fiscally sustainable. Combining fair and reasonable changes to the family tax benefit system and child care reforms into a single bill enables the government to reduce spending and increase workforce participation through an affordable child care system' and more specifically 'the additional expenditure on child care must be paid for, and the family tax benefit measures in this bill are to offset this expense. A key component of reducing this expense is to phase-out both the family tax benefit part A and part B end-of-year supplements' (Porter, 2017b).16
Key elements of the package
The four key elements of the package are:
- Child Care Subsidy - the main form of financial support, paid to services as an offset to the fee otherwise payable by parents
- Additional Child Care Subsidy - additional fee assistance directed at families and children who may face barriers in accessing affordable child care
- Inclusion Support Programme - support for services to build their capacity and capability to include children with additional needs in mainstream services
- Community Child Care Fund - enables grants to child care services to help them to address barriers participation (see later in this section for more detail).
The latter three elements form the 'Child Care Safety Net' which seeks to provide additional targeted assistance for disadvantaged communities and vulnerable children and their families to address barriers in accessing child care and employment. The Child Care Safety Net was rolled out from July 2016, at which time the Inclusion Support Programme and one element of the Community Child Care Fund (the Connected Beginnings program) were introduced. The remaining elements of the Child Care Safety Net were introduced in July 2018.
In addition, the package included a new In Home Care program targeted at those children and families for whom mainstream child care is either not available or appropriate. This replaced the previous In Home Care program, and the Nanny Pilot Programme. The Nanny Pilot Programme (then named the Interim Home Based Carer Subsidy) commenced 1 January 2016 as an early component of the Child Care Package.
Also associated with the package are a number of changes to the regulatory framework for services as well as in the information technology systems through which services and parents interact with the Departments of Education and Training and Human Services. These include:
- The introduction of a new IT system - the Child Care Subsidy System (CCSS)17 to replace the old Child Care Management System (CCMS). The new CCSS seeks to provide a more integrated system with a simpler user interface and streamlining and automating of the administration of payments and programs. It has also been designed to strengthen the Department's capacity to monitor compliance and address fraud. This system was constructed by the Department of Human Services. It integrated three portals, one for services, one for families and one for Department of Education and Training and Department of Human Services staff, and is linked to the Grants Management Portal. The IT build is still being refined and not all intended functionality is yet available.
- Removal of requirements for hours of operation per day or days per week. Services now only have a requirement to operate for a minimum of 48 weeks per year, or if the service only provides Outside School Hours Care, for a minimum of seven weeks per year.
- Additional obligations on services to comply with the Family Assistance Law and a strengthened compliance framework, requirements for providers to report educator 'Working with Children Check' details, a limit on backdating children's attendance records and the ability for the Minister to make legislative instruments to place a pause on child care service applications in defined circumstances.
Child Care Subsidy
The Child Care Subsidy (CCS) is the main element of the package and provides targeted assistance with the cost of child care. The parameters of the system include:
- a cap on the hourly rate charged for child care to which the subsidy rate will apply
- a subsidy rate which declines as family income increases
- an annual cap on the total level of assistance paid to some higher income households
- a limit on the number of hours of care for which the subsidy is payable based on an activity test applied to the parent(s).
In addition, parents are required to meet residency requirements, and the child needs to meet immunisation requirements, be aged 13 years and under, and not be attending secondary school.18
The change to the CCS also introduced the concept of a family co-contribution, so that families pay a portion of their child care fees.19 There are, however, intersections between this and the Additional Child Care Subsidy (ACCS), which tops up the subsidy for families and children facing barriers to accessing affordable child care (see discussion of ACCS below).
Notionally, the CCS is calculated as a direct offset to the charges which would otherwise be paid by the parents. However, in most cases the actual subsidy paid to a provider is 95 per cent of the CCS as 5 per cent of parents' actual entitlement is withheld.20 After annual reconciliation, the amount withheld is either paid to families, or is used to offset any debt they may have to the Commonwealth (e.g. because an underestimation of annual income has resulted in the subsidy being paid at an incorrect rate).
Key features of CCS are three parameters which determine the financial level of subsidy and one on the quantum of child care which is subject to the subsidy:
- The hourly rate caps are a limit on the rate charged by child care providers that will be subject to subsidy. Where a provider charges a rate less than the cap, families will receive their applicable percentage of the actual fee charged, while where the rate charged is above the cap, the percentage applies to the hourly rate cap.21 As of 2 July 2018, they are $11.77 for Centre Based Day Care (Long Day Care and Occasional Care), $10.90 per hour for Family Day Care, and $10.29 for Outside School Hours Care. These caps are to be indexed annually based on the All Groups CPI.
- The percentage of Child Care Subsidy families are eligible for is the proportion of the capped fee which is provided as a subsidy. As illustrated in Figure 4.1, the percentage declines with family income. For 2018-19 the maximum rate is 85 per cent for families with an income of up to $66,958. The rate of assistance then tapers to 50 per cent at an income of $171,958, remaining at this rate up to a family income of $251,248, before again tapering to a rate of 20 per cent at $341,248, and holding at this rate until family income reaches $351,248. Families with income at or above $351,248 have zero Child Care Subsidy entitlement. (See Figure 4.1).
- The annual cap is the maximum level of subsidy which will be paid to a family in any one year. For 2018-19 it is $10,190 per child per annum and applies to families with a joint income over $186,958 (and less than $351,248) per annum. For families with lower incomes there is no cap.
- The activity test operates to restrict the number of hours of Child Care Subsidy a family is entitled to, on a per child per fortnight basis, with the number of hours being determined by the level of 'recognised activity' parents are engaged in. Reflecting the program's focus on participation, and employment in particular, 'recognised activity' includes: paid work self-employment unpaid work in a family business looking for work volunteering studying. When applied to couples the test is based on the hours of activity of the member with the fewest hours. There are a number of exemptions to the activity requirement for some families. Table 4.1 illustrates the operation of the activity test and details the main exemptions.
Figure 4.1. Child Care Subsidy, Rate of subsidy by family income

Source: Derived from program criteria
| Step | Hours of approved activity | Maximum number of fortnightly hours of subsidy per child |
|---|---|---|
| Persons subject to the activity test | ||
| 1 | 8 hours to 16 hours | 36 hours |
| 2 | More than 16 hours to 48 hours | 72 hours |
| 3 | More than 48 hours | 100 hours |
| Activity test exemptions22 | ||
| Child Care Safety Net - families with an annual income of $66,958 or less who do not meet the activity test | 24 hours | |
| Families who do not meet and are not exempt from the activity test and have a preschool-aged child who attends preschool at a centre based day care service (for preschool child only) | 36 hours | |
| Includes: Grandparent principal carers, Disability Support Pensioners and Carer Payment recipients23 | 100 hours | |
Additional Child Care Subsidy
The Additional Child Care Subsidy (ACCS), which is part of the Child Care Safety Net and is a top-up payment to the Child Care Subsidy. It provides additional fee assistance to families and children facing barriers in accessing affordable child care. As with the Child Care Subsidy, it is paid to services as an offset to the charge on parents. It has four components:
- ACCS (Child Wellbeing) provides assistance to support access to approved child care for children who are at risk of serious abuse or neglect. Program eligibility includes children who have been abused or neglected and may continue to suffer harm as a result, and children and families before they reach crisis point and become subject to the mandatory reporting system.
- ACCS (Grandparent) supports grandparent primary carers, providing support for grandparents who: receive an income support payment care for their grandchild/ren for 65 per cent or more of the time have substantial autonomy for day-to-day decisions about the child's care, welfare and development.
- ACCS (Temporary Financial Hardship) provides short-term increased child care fee assistance to families who, due to exceptional circumstances, are experiencing significant financial stress with the cost of child care.
- ACCS (Transition to Work) supports parents who are transitioning from income support to work by engaging in work, study or training activities.
With the exception of the Transition to Work element, the subsidy is equal to the actual fee charged (up to 120 per cent of the hourly rate cap), and is provided for up to 100 hours per fortnight without an activity test. In the case of the Temporary Financial Hardship element the activity exemption applies for a maximum of 13 weeks per financial hardship event. Under the Transition to Work element, the subsidy is equal to 95 per cent of the actual fee charged (up to a rate equal to 95 per cent of the hourly rate cap), with the number of hours of subsidised care being determined by the individual's activity test result, while the duration of assistance varies with the activity undertaken. In addition, the subsidy can continue for a further 12 weeks if parents gain employment and their income support payments ceases. Assistance under the Child Wellbeing provision can be initially granted for six weeks on the basis of a certificate issued by the service provider, and for renewable periods of 13 weeks on the basis of a determination by the Department of Human Services.
Inclusion Support Programme
The Inclusion Support Programme is the second element of the Child Care Safety Net and provides support to early childhood and child care services to build their capacity and capability to include children with additional needs in mainstream services. It commenced in July 2016 and replaced the previous Inclusion and Professional Support Program. It aims to increase the proportion of children with additional needs attending mainstream services, improve the capacity of the sector over time and ensure parents of children with additional needs have access to appropriate and inclusive child care services.
Under the program, support is provided to services to enable them to provide inclusive approaches to the provision of child care. This includes, but is not limited to, inclusive practices for:
- children with disability including those undergoing assessment for disability
- Aboriginal and Torres Strait Islander children
- children from culturally and linguistically diverse backgrounds
- children from refugee or humanitarian backgrounds
- children with serious medical condition/s
- children presenting with language and speech delays
- children presenting with disruptive behaviour.
The program operates through seven state/territory-based Inclusion Agencies (essentially community-based organisations), along with a national Inclusion Development Fund Manager (again currently a community-based organisation) responsible for management of the Inclusion Development Fund (see below) and decision making on small scale grants to services. Support under the Inclusion Support Programme is implemented through Inclusion Professionals, employed at the Inclusion Agencies. These agencies undertake a range of roles in providing support to services to generally develop more inclusive approaches, support in the development of Strategic Inclusion Plans, and in providing specific support to assist services address barriers that individual children or groups of children may face. Inclusion Agencies operate equipment libraries for use by services.
There are four streams of funding available through the Inclusion Development Fund:
- a subsidy for an additional educator in centre-based services to support ongoing high support needs of a child with disability;
- a subsidy for immediate/time-limited (up to eight weeks) support for centre-based services where there is an immediate barrier to enrolling a child with disability or disruptive behaviours;
- Top-up support for Family Day Care services where an educator is unable to enrol the maximum number of children they are permitted to because of the demands on the educator of including a child with a disability or high care needs; and
- 'Innovative Solutions Support' which allows all service types to receive financial support for creative solutions to address barriers to inclusion.
Services wishing to access financial support through the Inclusion Development Fund must first develop a Strategic Inclusion Plan, excepting those applying for immediate support. The Strategic Inclusion Plan, developed through collaboration with the Inclusion Agency, outlines the current inclusion practices of the service, barriers to inclusion, and strategies to address those barriers. It may also involve inclusion related training, development of policies and procedures, sourcing resources from the local community, changes to educators' planning and pedagogy, and modifications to the child care and early learning environment.
Community Child Care Fund
The Community Child Care Fund (CCCF), the third element of the Child Care Safety Net, provides grants to child care services to help them to address barriers to participation. The purpose of the fund, as described in 2017 by the then Minister for Education and Training, was to help 'new and existing services, particularly in rural, regional or vulnerable communities, to reduce the barriers for families to access those services and to increase the supply of places in areas of high, unmet demand'' (Birmingham, 2017). More specifically the fund is designed to:
- reduce barriers in accessing child care, in particular for disadvantaged or disadvantaged and vulnerable families and communities
- provide sustainability support for child care services experiencing viability issues
- provide capital support to increase the supply of child care places in areas of high unmet demand.
One specific objective of the program is to assist former Budget Based Funded services transition to the new child care arrangements.
The program has three components:
- CCCF Open Competitive Grants: These are available to eligible, approved child care services. Grants are intended to supplement fee income (received directly from families or as subsidies from payment of the Child Care Subsidy and Additional Child Care Subsidy). Eligibility targets services operating in selected disadvantaged communities, with funding awarded for up to five years.
- CCCF Restricted Non-Competitive Grants: These are grants to former Budget Based Funded services during and beyond the transition period and are designed to help eligible specified services to build capacity and operate sustainably under the new child care system and support services to increase participation by Aboriginal and Torres Strait Islander children.
- Connected Beginnings: This element aims to help Aboriginal and/or Torres Strait Islander children in areas of high need be well prepared for school by supporting pregnant Aboriginal and Torres Strait Islander women and Aboriginal and Torres Strait Islander children from birth to school age. A core objective is that, over time, the initiative should contribute to improving school readiness and education outcomes for Aboriginal and Torres Strait Islander children. Connected Beginnings has operated since July 2016 and provides support to integrate early childhood, maternal and child health, and family support services with schools in a selected number of Aboriginal and Torres Strait Islander communities experiencing disadvantage. The program has an annual budget of around $12 million. Currently, 12 projects are underway. This program is jointly funded and implemented by the Federal Departments of Education and Training, and Health. As noted in Chapter 3, Connected Beginnings is not part of the evaluation.24
A total of 907 grant agreements from the Community Child Care Fund were executed between July and September 2018 with a total value of $293.3 million, see Table 4.2. Applications for the first round of Open Competitive Grants were open between August and November 2017. A total of 769 grants, with a value of $120.2 million were under the open competitive element of the program. Another 138 were awarded under the restricted element, with a value of $173.1 million. The grants varied in duration with most being awarded for a three-year period although a quarter were for a period of around five years.
| Grant Program | Organisations | Grants ($) |
|---|---|---|
| CCCF Open Competitive Capital Support | 6 | 1,259,500 |
| CCCF Open Competitive Community Support | 106 | 18,861,138 |
| CCCF Open Competitive Sustainability Support | 657 | 100,102,705 |
| CCCF Restricted Non-Competitive Community Support | 2 | 5,515,176 |
| CCCF Restricted Non-Competitive Sustainability Support | 136 | 167,585,302 |
| Total | 907 | 293,323,821 |
Source: Department of Education and Training administrative data
In Home Care
The other significant element of the Child Care Package is the new In Home Care program. The program's objective is to support families' workforce participation and early childhood education and care requirements where other approved child care services are not available or appropriate. The program is targeted at families in geographically isolated areas, working non-standard or variable hours, or those with complex or challenging needs.
It replaces two pre-existing programs: the previous In Home Care program and the Nanny Pilot Programme. The new program, however, has a number of significant differences. This includes delivery through a networked brokerage model, with In Home Care Support Agencies, servicing each state and territory, whose key role is to advocate for families. The support agencies match families to In Home Care services, make recommendations to the Department about the allocation of places to services, and establish referral pathways for families to other appropriate services where required.
In terms of objectives, the new program has two significant differences from its predecessors. The first is to place the primary focus on early childhood education and care. The second is, to the extent possible, for support to be temporary in nature with the aim of transitioning children into mainstream child care services. In addition, it is intended that places supported under the program will be more equitably distributed across the country over time - relative to the imbalances which developed under the previous approaches. Additionally, the new program aligns IHC to other elements of the Child Care Package, and so introduces a family hourly rate cap, with the subsidy to which the family is entitled being based on an income-tested percentage rate which is applied to the actual fee charged or 85 per cent of the family hourly rate cap, whichever is lower. Families are potentially eligible for 100 hours subsidised care per fortnight.
To be eligible for In Home Care, families must demonstrate that mainstream child care services are not currently appropriate or available. They must also meet at least one of the following criteria:
- parents or carers are working non-standard or variable hours, outside normal child care service hours
- parents or carers are geographically isolated from other types of approved child care, particularly in rural or remote locations/or
- the family has challenging or complex needs, including where families are experiencing challenging situations, and other approved child care services are not able to meet the needs of the child or the family. This may be due to disability or serious illness.
The main program parameters at the point of introduction were:
- It was capped at 3,000 'places' (each place representing 35 hours of subsidised care per week).
- Child Care Subsidy for In Home Care is on a per family (not per child) basis and was capped, as of 2 July 2018, at $25.48 per hour.
- As with other approved care types, families may also be entitled to the Additional Child Care Subsidy, which increases the potential subsidy to $30.58 per hour.
In December 2018 the Minister for Education and Training announced an increase in the number of places to 3,200 as of 1 January 2019 and an increase in the In Home Care Child Care Subsidy family hourly rate cap to $32.00 an hour and the Additional Child Care Subsidy rate of up to $38.40 from the same date (Tehan, 2018a).
All families in the Nanny Pilot Programme and the previous In Home Care program were provided with the opportunity for an individually focused supported transition to the new In Home Care program, or another form of support or care, as appropriate.
Summary of changes
In summary, the new Child Care Package can be seen as a significant change from the previous arrangements for Commonwealth support of parents using child care. The key elements of this change include:
- replacement of the two existing payments, Child Care Benefit and Child Care Rebate, with a more targeted, but higher, single means-tested Child Care Subsidy (CCS)
- expanded activity testing and a reduction in the number of hours for which families not meeting the activity test can receive subsidised care to 24 hours per fortnight
- creation of a single Additional Child Care Subsidy encompassing a number of previously diverse programs, including Jobs, Education and Training Child Care Fee Assistance, Grandparent Child Care Benefit and Special Child Care Benefit
- introduction of the Community Child Care Fund to provide grants to services to reduce barriers and promote sustainability, and the closure of the Community Support Program (CSP) and the abolition of previous arrangements for Budget Based Funded services25
- introduction of brokerage models for programs designed to support vulnerable children (Inclusion Support Programme and In Home Care program)
- changes to the In Home Care program to improve consistency in service delivery, focus more on quality early childhood education and care, and where possible seek to achieve placement in mainstream child care
- introduction of the CCSS, a new child care information technology system, designed to be a 'simple and easy to use interface' which includes enhanced functionality:
- For families it enables them to make and view the status of their claims and other functions by signing into their (or creating a) my.gov.au account to access their online Centrelink account.26
- For services, which access the CCSS either directly through the Provider Entry Point (PEP) or through third-party software, it provides for the reporting of activity to the Department. Associated with its introduction the Provider Digital Access (PRODA) system was adopted as an authentication mechanism for service staff in their interface with the new system:27
- As of 14 January 2019, session reports (the reports sent by services to the Department recording child attendance, fees charged and other details) are to include actual child attendance information in terms of in and out times. As a consequence, more services have introduced electronic sign-in processes.
- These changes have also been complemented by the development and enhancement of the system with respect to grants and related payments.
Expenditure
The changes associated with the package involve significant additional expenditure, as illustrated in Table 4.3.
| 2016/17 Actual expenses | 2017/18 Actual expenses | 2018/19 Revised estimated expenses | 2019/20 Forward estimate | |
|---|---|---|---|---|
| $ Million | ||||
| Child Care Services Support | 264.9 | 317.9 | 333.8 | 337.0 |
| Child Care Benefit | 3,649.0 | 3,246.6 | - | - |
| Child Care Rebate | 3,627.4 | 3,766.6 | - | - |
| Child Care Subsidy | - | - | 7,722.4 | 8,273.1 |
Source: Derived from Department of Education and Training (2018b), p. 22 & Department of Education and Training (2019), pp. 26-27.
Note: Table excludes some expenditures such as the Early Years Quality Fund Special Account.
Specifically, these data point to an increase in financial support for parents' use of child care (excluding the Child Care Services Support) from $7.0 billion in 2017-18, to $7.7 billion in 2018-19, and a further increase to $8.3 billion in 2019-20. These changes reflect a number of factors: the direct effect of the subsidy arrangements in the package; possible changes in the use of child care as a consequence of the package, or as a result of pre-existing trends and demographic factors.
4.3 The broader policy context
While representing the major funding stream, the Child Care Package is only one part of a broader policy environment which impacts on early childhood education and care, including the regulatory and operational environment in which child care operates. As indicated in the previous chapter the introduction of the Child Care Package also comes after a decade of ongoing and significant change in the sector.
Five aspects of this broader environment have been identified as being particularly relevant to the evaluation of the package due to their actual or potential interactions with the sector, effects on the operation of services, and the outcomes for families and children. These are: child care quality; preschool education initiatives; the interface between child care and the National Disability Insurance Scheme; the government's enhanced compliance activities, particularly with respect to fraud in the Family Day Care sector; and the findings of the Senate Inquiry into Red Tape.
Child care quality
Chapter 2 has detailed the National Quality Standards and the role of the Australian Children's Education and Care Authority in overseeing and reporting on its implementation. This section is concerned with the quality of care in the child care sector, as measured against these standards, at the time of implementation of the Child Care Package. In September 2018, ACECQA reported on the rating of some 12,500 child care services.28 Of these, 49.3 per cent were recorded as meeting the National Quality Standards, 25.2 per cent as exceeding the standards and 0.3 as being excellent. A small number, just 0.2 per cent were recorded as requiring significant improvement, with a further 25.0 per cent of services 'working towards the National Quality Standard'.
This distribution varied between service types (Figure 4.2) and by the characteristics of the management /ownership of services Figure 4.3.
Figure 4.2. National Quality Standards, child care services by service type, September 2018
Source: Australian Children's Education and Care Quality Authority (2018)
As illustrated in Figure 4.2 there are some marked differences in the extent to which services meet the National Quality Standards across service types. While 31.6 per cent of Long Day Care services exceed the standards or are rated as excellent, just 14.8 per cent of Family Day Care services and 16.6 per cent of Outside School Hours Care services are similarly rated. Conversely, while only 20.4 per cent of Long Day Care services and 29.0 per cent of Outside School Hours Care services are rated as requiring significant improvement or as still working towards meeting the standard this increases to 55.9 per cent for Family Day Care services.
Figure 4.3. National Quality Standards, child care services by management/ownership, September 2018
Source: Australian Children's Education and Care Quality Authority (2018).
Note: Excludes services identified as 'Other'. These accounted for just 0.1 per cent of the services with an overall rating.
Even more marked differences are seen when services are classified by their ownership/management type, Figure 4.3. Considering the three major types:
- private for-profit providers, who account for 57.3 per cent of services, had 28.8 per cent of their services rated as requiring significant improvement or still working towards the National Quality Standards, and just 20.8 per cent exceeding the standard, or being rated as excellent
- the next largest group of services, community managed private non-profits, accounted for 16.0 per cent of services and had a much smaller 21.6 per cent in the lower two classifications and larger 33.2 per cent in the highest two
- for the 14.7 per cent of services in the next largest sector, private not for profits operated by other organisations, an even lower 16.2 per cent were rated in the lower two categories, although a lower 27.0 per cent fell into the highest two classifications.
Neither of the two groups of non-profit services had any service that was rated as requiring significant improvement.29
Preschool education
While the Commonwealth Government provides significant financial support and has developed national partnerships with the states and territories, the provision of preschool education in Australia is the responsibility of State governments, and so different models of delivery apply across Australia (see Baxter and Hand 2013).
As noted earlier, there is an exemption from the Child Care Subsidy activity test for families with a preschool-aged child(ren). This involves providing families with access to 36 hours of subsidised care per fortnight for the preschool child(ren) of a family attending a preschool program within a centre-based day care service in the year before they commence full-time school.
This support reflects the Australian Government's commitment to the objective of ensuring all children have access to 15 hours per week of high-quality preschool education for 40 weeks per year in the year before they start full-time school. This is through the National Partnership on Universal Access to Early Childhood Education with states and territories.30 Under this agreement the Australian Government will provide more than $440 million to the states and territories in 2019 (Tehan, 2018b).
As has been described in Chapter 2, there is an important interface between the child care system and the preschool system. The interface is complex, reflecting significant variation in the delivery of preschool in different states and territories and the diverse roles of child care services with respect to preschool. While some children just attend standalone preschool many others attend preschool and participate in child care. Sometime this involves children attending preschool in centre-based day care settings, while in other cases children attend standalone preschool for some periods and other types of child care for other periods, involving coordination between child care and preschool providers.
The nature of preschool provision was one of the aspects of the pre-transition child care structure examined in the Baseline SELCS undertaken in April 2018. Across services as a whole, excluding Outside School Hours Care where most children were of an older age group, 87.4 per cent reported providing a preschool or kindergarten program for children in the year before full-time school. Among Long Day Care services this proportion was 93.4 per cent, with a further 2.1 per cent arranging access to a program run externally. Just 2.3 per cent said they made no provision with the remaining 2.3 per cent reporting that they had no children in this age group. Across the Family Day Care sector, 30.3 per cent reported having a program, with 28.6 per cent arranging access to an external program. Over a quarter (26.4 per cent) said they made no provision and 14.8 per cent said it was not applicable for the ages of the children being cared for.
National Disability Insurance Scheme
Inclusion is a key objective of the Australian child care system. Under the package this is supported by access to the Additional Child Care Subsidy, the Inclusion Support Programme and the In Home Care program. Children who have an impairment, serious illness or condition that is likely to be permanent are also potentially eligible for support through the National Disability Insurance Scheme (NDIS). A specific objective of the NDIS is investing in people with disability early to improve their outcomes later in life.
The NDIS has been rolled out across Australia, commencing in 2013. The NDIS includes a specific Early Childhood Early Intervention (ECEI) approach, which began its roll-out in 2016. At the time of writing the report there were some areas of Australia that did not yet have access to the ECEI through the NDIS.
With respect to child care, the focus of the NDIS is on providing 'individualised supports to enable a child to attend an early learning service'. The program approach, however, limits this to those 'situations where a child has very significant and complex care needs that are beyond a reasonable expectation for child care services to provide. For example, a child requiring ventilation, which must be supervised by a trained carer or nurse' (NDIS, 2014).
With the exception of these specific circumstances, the early childhood and child care services have responsibility for the education and care needs of children, including children with disability or developmental delay.
Specific elements of this responsibility as identified by the NDIS include:
- providing 'inclusion supports' that enable an early learning service to meet a child's needs through increased staff to child ratios and enabling staff to attend disability-specific training
- adapting their educational program to the needs of children with disability
- making reasonable adjustments to buildings, such as ramps, and fixed or non-transportable equipment such as hoists
- transporting children while they are in an early learning service such as for an excursion (NDIS, 2014).
Notwithstanding the relatively clear division of roles suggested in the above, the nature of disability and of childhood disability in particular, and the complexity of associated care and support needs and arrangements, can mean there is a significant interaction between the NDIS and the packages of supports a child may be eligible for and the child care sector.
Compliance
Since 2014 the government has enhanced its compliance activities in the child care sector, in particular with regard to Family Day Care services (Birmingham, 2015). These were strengthened in 2016 with the introduction of additional compliance measures including compulsory reporting of actions (including police action) taken against staff members, and restrictions relating to care of own children, and the swapping of own children with other providers. The government reported that in 2016-17 over 3,800 compliance checks were undertaken. Resulting action included 141 sanctions and immediate cancellations (Birmingham, 2018), along with the announcement of a publicly accessible 'Child Care Enforcement Action Register', where details of non-compliant services and the nature of their breaches are recorded. This was followed by a six-month campaign which resulted in enforcement action against a further 151 services for serious breaches.
The government has reported that its 'legislative measures addressing fraud and non-compliance, as well as ongoing enforcement efforts, have prevented around $2.8 billion being inappropriately paid to non-compliant and fraudulent child care providers between January 2014 and June 2018' (Tehan, 2018c).
Senate Red Tape Inquiry
In October 2016 the Senate resolved to establish a Select Committee on Red Tape. The committee reported in December 2018. As part of its work, the committee undertook a number of inquiries into specific industry sectors or areas of regulation and published a series of interim reports on these. One of the sectors considered was child care.
The report Effect of red Tape on Child Care (Senate, Select Committee, 2018), contained a majority and dissenting report, with the main report containing seven recommendations. These concerned regulation of Family Day Care, the National Quality Framework - including with regard to staffing ratios and qualifications, and departmental reporting on red tape. With reference to the new Child Care Package, it addressed the regulatory effort involved, including with respect to the activity test, and the overall targeting of fees assistance.
The dissenting report was supportive of the National Quality Framework and considered the key issue for the sector was funding and not red tape. It also raised some questions about the administrative burden associated with the introduction of the package.
The government responded to the report in November 2018, largely noting the recommendations, although rejected that relating to the departmental reporting and indicated with respect to the recommendations specifically addressing the new package that: 'The independent evaluation of the Child Care Package will consider the impact of the Child Care Package on families, providers and services, including in relation to the Child Care Subsidy and the Activity Test' (Australian Government, 2018, p. 5).
4.4 Transition and the state of the sector at transition
This final section of this chapter considers the state of the sector at the time of transition, drawing upon administrative data on the characteristics of the services in December 2017 and some of the data collected in the surveys established for the evaluation. It describes selected characteristics of services with respect to the structure of care provision, including session length, timing and flexibility. These are all dimensions of provision which are particularly important to the focus of the evaluation on the extent to which the package enhances flexibility and improves the ability of service provision to match the needs of parents. It further considers questions relating to the pre-transition capacity of the sector to respond to the needs of vulnerable children and families, and on the financial viability of services. It concludes with some information on the actual transition of children and families, as well as some of the pre-existing analysis on the potential effects of the Child Care Package on affordability.
The state of the sector at transition
December 2017 administrative data indicate that 1,302,940 children from 897,880 families attended one or more of the 18,524 approved child care services (see Table 4.4).31
The major share of child care services involved Long Day Care. While these services represent only 39.7 per cent of services, they are used by 58.6 per cent of families and 54.7 per cent of children who use approved child care and account for 68.3 per cent of child care hours. This service type is followed by Family Day Care and In Home Care services, which together accounted for 15.8 per cent of the hours of care. Outside School Hours Care, while accounting for 55.8 per cent of services and around 30 per cent of child care use by families and children, provided 15.6 per cent of hours of care. Occasional Care services provided just 0.2 per cent of all hours of care and were used by around a half of a per cent of families and children.
The Department estimates that 31.9 per cent of children aged 0 to 12 years used one of these services in the December quarter 2017. The estimated usage rate among Aboriginal and Torres Strait Islander children was much lower at 15.4 per cent, being particularly low at 5.0 per cent in the Northern Territory and 9.0 per cent in Western Australia (Department of Education and Training, 2018c, p. 10).
Three dimensions of these services at the point of transition are considered to be of particular importance to the evaluation. These are considered below. The first concerns the fees and session arrangements of services, with a particular focus on the question of flexibility and hence the capacity of services to meet the diverse needs of parents. The second concerns services' perception of their financial viability, and the third relates to services' inclusion practices and capacity to meet the needs of vulnerable children. This also considers the engagement of the services with the Inclusion Support Programme and the Community Child Care Fund. As noted above, while both of these form part of the Child Care Package, they commenced prior to the July 2018 implementation of the main elements of the package.
| Service type | Services | Families | Children | Average weekly hours | |||
|---|---|---|---|---|---|---|---|
| No. | % | No. | % of service uses | No. | % of service uses | % of total hours | |
| Long Day Care | 7,349 | 39.7 | 594,970 | 58.6 | 734,250 | 54.7 | 68.3 |
| Family Day Care and In Home Care | 728 | 3.9 | 106,640 | 10.5 | 171,540 | 12.8 | 15.8 |
| Occasional Care | 106 | 0.6 | 5,140 | 0.5 | 6,180 | 0.5 | 0.2 |
| Outside School Hours Care | 10,341 | 55.8 | 308,620 | 30.4 | 431,420 | 32.1 | 15.6 |
| Totals | |||||||
| Uses at least one | 897,880 | 1,302,940 | 100.0 | ||||
| Total of service uses | 1,015,370 | 100.0 | 1,343,390 | 100.0 | |||
| Total services | 18,524 | 100.0 | |||||
Source: Department of Education and Training (2018c), Tables 2, 5, 6, 13.
Notes: While Budget Based Funded services are under some classifications identified as a separate service type here, they have been included under the form of care they provide. Similarly, while Occasional Care Services are often categorised as part of 'Centre Based Day Care', here they are shown as a separate service. Children or families may use more than one service type and hence the total of service uses may involve some double counting.
Fees and sessions
Analysis of changes in fees and costs of child care will be a key focus of subsequent evaluation reports, and are not addressed here in detail. Chapter 2 has provided some discussion of historical trends.
This report considers some early insights into the charging practices of child care centres, as identified in the Baseline SELCS is considered along with information on the flexibility of arrangements.
Long Day Care and Occasional Care services were asked about the length of sessions of care (the most commonly applied session of care if multiple sessions were offered to families) used for charging purposes. Family Day Care services were asked for the minimum booking hours for the purposes of charging. This question was not asked for Outside School Hours Care or for Budget Based Funded services.
In some cases, services were unable to answer this question in terms of actual hours. For Long Day Care, about one in ten reported they did not charge by session. Most of these services reported that they had a daily fee, without nominating how many hours per day were charged for. Just under one in five of the Family Day Care services reported that the means of charging varied by educator.
The distributions of session length for the three service types (excluding those that did not respond with actual hours estimates) are shown in Figure 4.4. For Long Day Care, the median session length was 11 hours. For Occasional Care the median session length was five hours, which was also the median duration for the minimum booking hours for Family Day Care.
Figure 4.4. Distributions of session lengths or minimum booking lengths, by service type
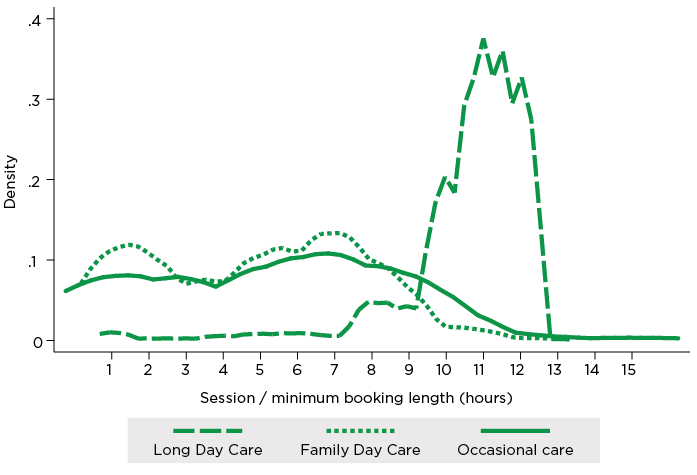
Source: Baseline SELCS, Wave 1.
Note: Excludes those that did not provide information on session or minimum booking length. Weighted estimates, n = 1,616.
The question of session length is significant with respect to the operation of the new package and the introduction of the activity test constraint on the number of hours of care per fortnight which will be subject to subsidy. Specifically, three issues arise:
- To the extent parents did not use the full session length - especially the predominant 10 to 12 hour sessions in Long Day Care, these long session lengths tend to exhaust the hours of subsidised care available to parents.
- More specifically, the 36 hours per fortnight does not divide into a regular pattern of weekly attendance unless session lengths are nine hours or less.32
- Currently most providers' Long Day Care sessions are 10 to 12 hours. For low-income families who do not meet the activity test, this means that the 24 hours of subsidised care a fortnight now available to them translates to only one day of care a week only (in contrast to the 24 hours per week previously available). This is seen by many providers as being insufficient from a child development and socialisation perspective.
In considering the question of session lengths, it is noted that while services have traditionally offered long sessions, these tend to operate as 'envelopes' and most children actually spend somewhat shorter times at the centre. Staffing is configured to meet demand, with lower tails at either end of the day. As such, a realignment of session lengths with actual usage does not necessarily imply any savings on staff costs.33
Respondents were asked if their service charged a late fee. Practice varied across services with almost half of Family Day Care services not charging a late fee, falling to one in three for Occasional Care services, and about one in ten Long Day Care services. Overall, across all of services: 61 per cent charged a late fee on a per minute basis; 25 per cent charged a late fee in some other way; and 15 per cent did not charge a late fee.
Data were collected from all services, except for some Budget Based Funded ones, as to whether they charged for public holidays if the service is closed.34 Overall, 61 per cent reported they charged for public holidays, 37 per cent reported that they did not, with 2 per cent giving 'other' responses. Long Day Care services were most likely to charge for public holidays (87 per cent), followed by 61 per cent of Family Day Care services, and 38 per cent of fee-charging Budget Based Funded services. In contrast just 20 per cent of Outside School Hours Care and 19 per cent of Occasional Care services did so.
Services were also asked about the extent to which they provided 'non-standard hours' care. Across all services, just under half offered extended weekday hours (before 7 am or after 6 pm). As illustrated in Table 4.5 this was most common for In Home Care and Family Day Care. These were also the only service types that substantially offered care on weekends or overnight.
Services, other than Occasional Care Services, also reported on the flexibility they offered to parents who wished to make changes to their children's use of care. (Occasional Care Services were not asked about flexibility, since the nature of Occasional Care is that it is offered as short term or casual bookings.) Most services (90 per cent) said parents can add days or sessions of care and offered occasional sessions for temporary vacancies (85 per cent), as well as allowing parents to swap days/sessions (57 per cent) or change/add sessions at short notice (57 per cent). While 91 per cent offered longer sessions of care (7 to 12 hours) only 23 per cent offered shorter sessions of care (up to six hours). These shorter sessions were, as illustrated in Table 4.6, least likely to be offered in Long Day Care.
| Non-standard hours offered | Long Day Care | Family Day Care (a) | Outside School Hours Care | Occasional Care | Budget Based Funded | In Home Care (a) | All service types |
|---|---|---|---|---|---|---|---|
| Proportion of services offering (%) | |||||||
| Weekdays before 7 am or after 6 pm | 45.7 | 88.2 | 44.6 | 7.4 | 8.2 | 100.0 | 46.8 |
| Weekends | 0.5 | 85.5 | 0.0 | 2.2 | 3.0 | 94.9 | 5.1 |
| Overnight | 0.0 | 47.5 | 0.0 | 0.0 | 0.0 | 71.9 | 2.7 |
| Other outside standard hours (b) | 4.1 | 42.2 | 38.3 | 5.2 | 20.0 | 80.2 | 19.4 |
Source: Baseline SELCS, Wave 1.
Notes: (a) Service level respondents were asked whether any educators provided care at these nonstandard hours. (b) This covered a range of arrangements. These include vacation care and arrangements such as providing care on school curriculum days. Others responses include the provision of Outside School Hours Care by providers such as Long Day Care services. Excludes don't know/prefer not to say. Weighted estimates, n = 2,646.
| Non-standard hours/arrangements offered | Long Day Care | Family Day Care | Outside School Hours Care | Budget Based Funded | In Home Care | All service types |
|---|---|---|---|---|---|---|
| Proportion of services offering (%) | ||||||
| Shorter sessions (up to 6 hours) | 17.2 | 84.7 | N/A | 64.0 | 79.8 | 23.1 |
| Longer sessions (7 to 12 hours) | 91.4 | 94.0 | N/A | 76.3 | 77.7 | 91.2 |
| Can swap days/sessions | 51.0 | 65.3 | 65.6 | 58.6 | 76.3 | 57.1 |
| Can add days/sessions | 89.6 | 83.2 | 91.8 | 77.5 | 79.8 | 89.9 |
| Can change/add at short notice | 50.2 | 65.3 | 67.5 | 61.7 | 57.8 | 57.2 |
| Occasional sessions for temporary vacancies | 81.9 | 86.5 | 89.6 | 80.3 | 57.1 | 84.7 |
| Other flexible arrangements | 10.0 | 25.1 | 18.0 | 15.5 | 21.8 | 13.6 |
Source: Baseline SELCS, Wave 1.
Notes: This was not asked of respondents in Occasional Care services, since providing flexibility in bookings is central to this care type. For Family Day Care and In Home Care the respondent (at the service level) was asked whether any educators provided these flexible options. Weighted estimates, n = 2,646.
These services were also asked whether there was a demand for more flexible care options than currently provided, and about the ease with which they could meet the needs of parents with a range of different work arrangements (Figure 4.5). Across all service types, 27 per cent of services reported a demand for more flexible care options. By service type, the proportion reporting demand ranged from: 25 per cent for Long Day Care and 26 per cent for Outside School Hours Care, to 43 per cent for Budget Based Funded services, 47 per cent for Family Day Care, 48 per cent for Occasional Care and 57 per cent for In Home Care. When asked for the reasons why they were unable to meet the demand, services cited constraints due to staffing, funding, costs, licensing, and sometimes being at capacity.
Figure 4.5. Service level capacity to meet the child care needs of parents with different work arrangements
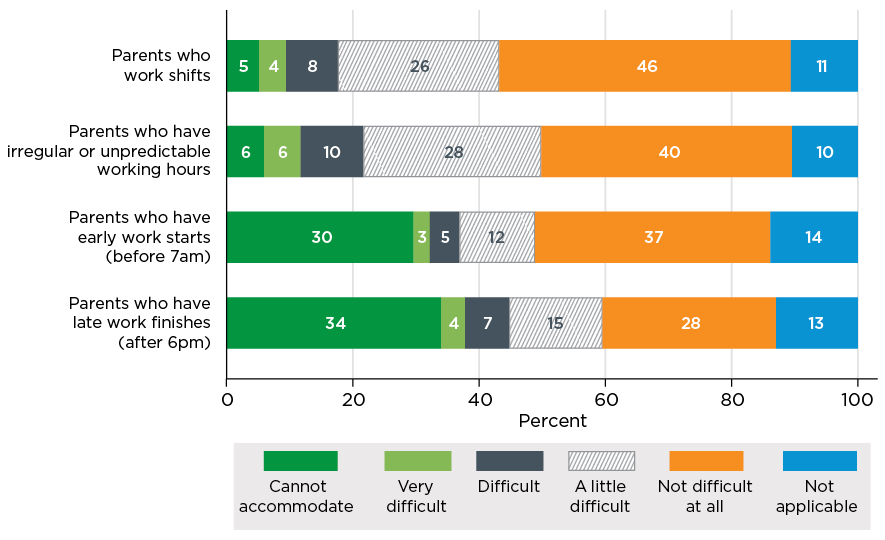
Source: Baseline SELCS, Wave 1.
Notes: Excludes 'Don't know/prefer not to say' responses. Weighted estimates, n = 2,615.
Financial sustainability
The viability of child care centres and the robustness of the sector represent one of key outcomes which the evaluation is to consider. While analysis of this is complex, and the data relate to the period prior to the implementation of the package, for an initial insight services were asked in the Baseline SELCS about their level of agreement with the statement that their service is financially viable.
Overall services report being financially viable. Based on the 84 per cent of services that responded to this question it is estimated that: 25 per cent of services are in strong agreement with the statement that their service is financially viable with a further 43 per cent agreeing. One in five (21 per cent) gave a neutral response while an estimated 7 per cent disagreed with the statement and 4 per cent strongly disagreed.
The level of agreement with the statement of financial viability, see Table C3.1, was highest among Outside School Hours Care services where 71 per cent of services agreed or agreed strongly. This was followed closely by Long Day Care (67 per cent), with a gap to Family Day Care (55 per cent), and a substantial fall to the Budget Based Funded services and Occasional Care services (both 47 per cent). Only 22 per cent of the In Home Care sector agreed, potentially reflecting the extent of change they were facing.
Multivariate analysis, Table A.4.1, broadly confirmed this hierarchy of service types with the analysis also highlighting:
- a strong relationship between the socio-economic status of the service location and perceptions of financial viability, with services in higher ranked locations being more likely to report a positive view
- a similar hierarchy across services based on their staffing size with those services with larger numbers of staff being significantly more positive than the smallest services
- no significant relationship with respect to whether the service was in the private sector, the number of services associated with the provider, or geographic location when measured by remoteness, although relative to NSW Victorian services were slightly less likely to give a positive response, and those in the Northern Territory more likely to give a positive response.
While caution needs to be exercised in drawing conclusions about the financial viability of the sector from this type of self-report, especially at a time of a significant change, this data nevertheless provides some suggestion that at the point of transition, on balance, services saw their financial position positively.
Meeting the needs of vulnerable children and families
Services were asked about meeting the needs of vulnerable children and families. Four in 10 services (41 per cent) reported that they were in receipt of some funding related to their specific needs of Aboriginal and Torres Strait Islander children, children who had additional needs or were vulnerable, and children from culturally and linguistically diverse (CALD) backgrounds. This support was mainly from the Inclusion Support Programme and the then Special Child Care Benefit.
When asked to rate how well their service was able to meet the needs of particular groups of vulnerable children, most services were positive, although there was a tendency for services to respond that they met the needs 'well' or 'adequately', rather than 'very well' (Figure 4.6). The extent to which services considered they were able to meet children's needs was broadly consistent across different categories of children. There are some subtle differences, however, including an apparent lower capacity to meet the needs of children in low-income families and a higher ability to respond to the needs of children from culturally diverse backgrounds. While the first may reflect issues around fees rather than care provision, the second is potentially associated with the number of services which made reference to recruiting staff with language other than English (LOTE) skills.
Figure 4.6. Meeting the needs of vulnerable children, for services with those children
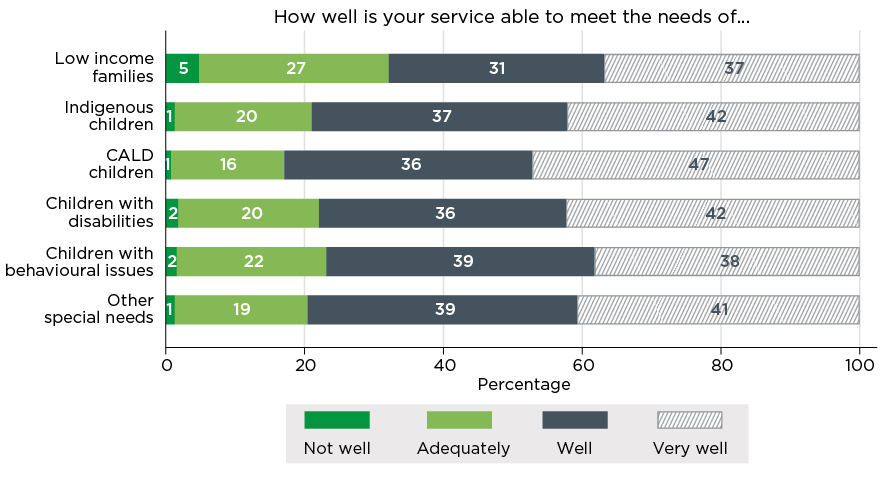
Source: Baseline SELCS, Wave 1.
Notes: Excludes those responding 'do not have any children in this circumstance' and 'don't know/prefer not to say'. Weighted estimates, n = 1,810-2,395, varying due to variable numbers excluded on the above basis.
A significant number of services indicated that their service did not have (many) children in these different categories. This included 29 per cent of services reporting no Aboriginal and Torres Strait Islander children, 19 per cent reporting no children with disabilities and 14 per cent reporting no children from low-income families. In contrast, only 7 per cent reported having no children with behavioural problems, although this proportion was almost double in Family Day Care services at 14 per cent.
Additional information was sought on the actual provisions made by services to meet the needs of these children. Responses included priority placement, flexibility in bookings, employing Aboriginal and Torres Strait Islander staff and staff with LOTE skills, having appropriate cultural activities, the use of inclusion support agencies and the NDIS, as well as accessing various programs, resources and supports from elsewhere. When asked what would help the service better meet the needs of these children, the main response was more funding, but some services also referred to more, overall, or specialist staff, and more training.
Use of program support
The survey also sought to ascertain the extent to which services utilised various program supports to meet the needs of vulnerable children, in particular the Inclusion Support Programme and the Community Child Care Fund.
The Inclusion Support Programme
Of those services who responded, 88 per cent of services reported that they had engaged with an Inclusion Agency and/or Inclusion Professional as part of the Inclusion Support Programme. This comprises 50 per cent who said they had regular contact with their Inclusion Professional in the past year, 34 per cent who said they had been in contact a few times and 4 per cent who said that while they had engaged, they had no contact in the past year. In contrast, 10 per cent reported not having any engagement and 1 per cent reported they did not know what the Inclusion Agency was.35 The extent of regular contact was less frequent, at 39 per cent for Family Day Care services and 15 per cent for In Home Care services.36 These services also had higher rates of non-contact (8 per cent and 27 per cent respectively).
Of the little over half (56 per cent) of services in Baseline SELCS were identified in the Department of Education and Training administrative data as having a Strategic Inclusion Plan.37 These services were more likely to have had contact with an Inclusion Agency (96 per cent overall: 63 per cent regularly, 31 per cent a few times and 2 per cent no contact in the past year) than those without a SIP (79 per cent overall: 36 per cent regularly, 38 per cent a few times, 6 per cent no contact in the past year). Data were also collected from those providers who were in contact regularly, or a few times in the past year, as to their satisfaction with the Inclusion Professional. Overall, those who had contact with an Inclusion Professional had a relatively high degree of satisfaction with 47 per cent being very satisfied, and 32 per cent satisfied. In contrast, 10 per cent were neither satisfied or dissatisfied, 6 per cent registered that they were somewhat dissatisfied and 6 per cent were very dissatisfied.
As illustrated in Figure 4.7 satisfaction was associated with frequency of contact, with much higher levels of satisfaction among those with regular contact. This may indicate satisfaction increases with more contact but could also indicate that contact increases with satisfaction. No differences in satisfaction with an Inclusion Professionals were apparent between those services with a Strategic Inclusion Plan and those without.
Figure 4.7. Satisfaction with inclusion professional, by whether service has a Strategic Inclusion Plan and the frequency of contact

Source: Baseline SELCS, Wave 1.
Note: Excluding those who answered 'don't know' or 'not applicable'. Weighted estimates, n = 2,116.
When the 10 per cent of services reporting not having engaged with the Inclusion Agency were asked for the reasons (multiple reasons could be given), the overwhelming response was that this support was not required (64 per cent). Other frequently cited reasons were that it was too difficult to do so (17 per cent), they could not get an appointment (2 per cent), along with 9 per cent which considered they were not eligible. A not dissimilar pattern of responses was reported by the small group of services who had engaged in the past, but not in the last year.
The Community Child Care Fund
The Community Child Care Fund provides grants to help child care services address barriers to participation. While 12 per cent of services said that their service had made an application for a Community Child Care Fund grant, responses to this question included 37 per cent of services reporting that they did not know what a Community Child Care Fund grant was.38 Lack of knowledge about the fund was particularly high among Outside School Hours Care services at 45 per cent, along with 34 per cent of Long Day Care services, 25 per cent of Occasional Care services and 18 per cent of Family Day Care services.
High application rates were reported by Budget Based Funded services, (73 per cent), Occasional Care services (48 per cent), along with 24 per cent of Family Day Care Services and 14 per cent of Outside School Hours Care. Only 9 per cent of Long Day Care services had applied and 2 per cent of In Home Care services.39
The main reasons given for not applying were (multiple reasons could be given) lack of eligibility (37 per cent), the funding was not needed (18 per cent), a perception that they would have little chance of success (17 per cent), the application process was too hard (7 per cent); and they had missed the deadline for submitting a proposal (3 per cent). When asked if they were likely to make an application in the future (in addition to the group who did not know about the program), 21 per cent of services said such an application was likely, 30 per cent that it was not likely, and 18 per cent that they were considering making an application.
Sector services and supports
The discussion above has considered the child care sector mainly in terms of services; however, several other institutions play a significant role. Of particular note is the extent to which many services are part of larger provider organisations. In addition, there are a number of peak industry organisations. These provider organisations and peaks, as well as being involved extensively in consultations with the Department of Education and Training, and acting as intermediaries between services and the Department, provided considerable support to their member services in preparing for the transition.
A further intermediary role is played by third-party software providers. While the Department offers a direct Provider Entry Point which allows services to meet their legislative obligations, such as lodging child enrolment and attendance reports, many services use third-party software which integrates the provision of this information to the departmental CCSS along with a broader suite of management tools for the operation of the service. The Department provided these software providers with specifications of the CCSS interface, and requirements for interoperability.
Transition
Detailed data are not yet available on the transition to the new package, with families having had until 23 September 2018 to complete their assessment and transition to the new package in order for payments, if they were eligible, to be backdated to 2 July 2018. Initial data, however, indicates that:
- The Department of Human Services invited 1,162,908 families to transition to the Child Care Package, with 1,024,359 of these having successfully transitioned to the Child Care Package as at 2 July 2018 (Department of Education and Training, 2018e).
- In the September 2018 quarter the numbers of children and families using approved child care were broadly in line with the September 2017 quarter, with a fall of 1.5 per cent in the number of children but an increase of 1.3 per cent in the number of families.
- Based on the operation of the activity test:
- 59.8 per cent of families were entitled to 100 hours of subsidised care per fortnight
- 28.7 per cent were entitled to 72 hours of subsidised care per fortnight
- 3.7 per cent were entitled to 36 hours of subsidised care per fortnight
- 3.0 per cent were entitled to 24 hours of subsidised care per fortnight
- 4.9 per cent of families were entitled to 0 hours of subsidised care per fortnight.
Transition of Budget Based Funded services
Due to the nature of these services, and the major change that the package entailed, the Department of Education and Training provided individualised support to Budget Based Funded services to manage their transition to the new Child Care Package through a number of consultancy contracts commencing in 2016. While a majority of services transitioned to the new Child Care Package, others were precluded from transitioning due to the nature of the activities they provided (although important to local communities and the children and families using them, the activities were not deemed to be child care). As a consequence, out of the 244 services, 135 services transitioned to the package and are receiving funding under the Community Child Care Fund. Another 65 were transferred to the Department of Prime Minister and Cabinet, and 25 to the Department of Social Services, as their activities more closely aligned with those departments' responsibilities. Three services continued operation with alternative funding sources. The remaining services have closed, identifying issues such as staff retention, declining demand, availability of alternative services and changes in service offering.40
Transition of In Home Care services
The transition to the new In Home Care, as with Budget Based Funded services, was a very intensive process. It was initially underpinned by an evaluation of the Nanny Pilot Programme and a Review of the In Home Care program, both undertaken by the Institute of Social Science Research, and then supported by a Transition Consultant, PricewaterhouseCoopers (PwC). PwC was responsible for contacting previous In Home Care and Nanny Pilot Program families to discuss their care needs, and to help them to transition to new care arrangements with the least possible disruption. The consultant also provided In Home Care Support Agencies with family profiles and Family Transition Plans (where a family had complex care needs) as well as identifying possible referral pathways to other suitable services.
The Department reports that there were about 1,900 families using In Home Care or the Nanny Pilot program prior to transition. Drawing on early indicative data from the IHC Support Agencies, the Department estimated that about 80 per cent of these families transitioned to the new In Home Care program. Of those who transitioned out, the main reasons were: no longer requiring In Home Care and not being able to afford the new arrangements. Other reasons included the educator not being suitable for funding,41 not meeting the new In Home Care criteria, referral to other care or support services, and ineligibility for CCS.
Other aspects
The experiences of parents in the transition process and the impact of the new package on their child care use and affordability and on employment are considered in Chapter 6.
There has been some evidence of services responding to the constraints on the number of hours of care which will be subsidised by moving to alternative session structures. To date, however, no comprehensive information is available on this or the consequences for the use of child care. It is noted that in some cases these changes have included the introduction of a series of notional sessions of varying lengths but with little difference in the per session cost.
Questions about flexibility of service provision, including with regard to session length, and the capacity of parents to utilise this will be a focus of further stages of the evaluation.
While the IT processes associated with the transition were largely operational, some issues have arisen:
- It was reported that the software provided by two of the 16 third-party providers had significant issues at the time of transition (Chang, 2018).
- Issues have been raised with respect to the operation of PRODA and more generally the interface with the CCSS.
- There have been delays in the development of appropriate internal management and related reports for the Department of Education and Training.
Potential transition effects
The nature of the changes in the package will result in increased government financial support for some families and decreased support for others. This reflects the specific targeting of the arrangements, in particular the reduction of assistance to higher income households, and the operation of the activity test to more strongly focus on providing support to those engaged in the workforce and other activities.
Estimating the impact of these changes is difficult. While it is possible to model the direct financial impact on existing families, it is more difficult to assess the effect of the activity test on hours as these data are not always precisely available. It is even more difficult to estimate and to take account of behavioural change. Notwithstanding this, various estimates of the effects on affordability have been made:
- The Department of Education and Training modelling suggested that 810,951 (70.7 per cent) families would receive more under the new package, 57,788 (5.0 per cent) would have no change and 278,863 (24.3 per cent) would receive less. (Department of Education and Training, 2018d).
- Modelling by Ben Phillips from the ANU reports that the effect 'for most families a moderately more generous and simpler subsidy. We also find that this policy will lead to about 262,000-330,000 families being worse off on account of a tighter activity test, price caps, less generous subsidies for very high-income families and some families who use informal care no longer receiving a subsidy for their paid care' (2016, p. 12).
Later stages of the evaluation will consider this question in detail to seek to identify the actual effect, including taking into account behavioural aspects that these two studies have been unable to incorporate.
4.5 Summary
The Child Care Package introduced in July 2018 has involved significant change. Central to the package is a reorientation of assistance with a strong focus on support for parents' participation, in particular their engagement in employment. It has also involved a shift in focus towards directing support to a group of low- and middle-income families.
While tightening the targeting of the subsidy, the package is more generous in the level of assistance it provides to many families. The net effect of this, as can be seen in the anticipated increased spending on the package, is increased government support for parents using child care. At the same time the increased targeting, both in terms of the hours of care for which a family may be eligible, and the rate of subsidy provided (including the exclusion of some higher income families), means that the introduction of the package will involve both winners and losers.
The package involves significant change for the operations of child care services, in particular to their funding arrangements. These changes follow a history of changes in the sector and, as detailed in this chapter, are changes introduced in a complex environment.
Turning to the status of services at the time of transition, the data collected indicate that while many services saw there was a demand from parents for more flexible service provision, they also considered there were considerable constraints on services providing this. Nevertheless, there are suggestions that some services have responded to the new package by providing more flexibility in session length, especially in the Long Day Care sector. This will be one of the areas of attention in future evaluation activity.
In broad terms the sector sees itself being able to meet the needs of vulnerable groups, although potentially with scope for improvement. While it has a good understanding, level of engagement and satisfaction with the Inclusion Support Programme it is less aware and engaged with the Community Child Care Fund. While overall most services either meet or exceed the National Quality Standards this varies by sector with relatively poor assessment and ratings in the Family Day Care sector.
In operational terms the Department appears to have been successful in the transfer of services and families to the new arrangements with this aided by the special measures taken for some programs for which the transition represented a major change. While some issues arose in the transition, including with respect to the IT system, these, to the extent they are persistent and impact on outcomes, will be considered in later stages of the evaluation, along with the outcomes and impact of the package.
16 The government was unable to gain senate support for the full gamut of changes it was proposing to make to FTB. While the full program of phase out of the end-of-year supplements was not proceeded with, due to this the FTB-A end-of-year supplement was closed for families with income over $80,000 per annum (see Klapdor, 2017).
17 This system was also referred to, especially in the early parts of its development, as the Child Care IT System (CCITS).
18 In addition, where a child may be cared for by others the person applying for the subsidy needs to have a minimum level of care of the child.
19 In the explanatory memorandum for the original Jobs for Families and Child Care Package this was described as 'a provision that obliges approved providers to ensure that they recover, from individuals, the difference between a fee reduction (made available through CCS or ACCS) and the actual fee charged to the individuals, where there is a difference. The CCS payment is designed with a concept of co-contribution to the cost of child care. This provision intends to address an issue that has arisen with CCB where some child care services did not actually pursue the difference between fee reductions and actual fee charged to the individual' (Porter, 2017b, p. 87). In the accompanying Regulation Impact Statement (Department of Education and Training, 2015), the Department indicated 'A minimum co-contribution from all child care users was seen by stakeholders as acceptable, fair and necessary. A co-contribution can encourage parents to be conscious of the fees charged and help keep downward pressure on child care fees' (page 43).
20 Parents can apply to have this proportion increased.
21 Notwithstanding the introduction of the hourly rate cap child care, fee assistance continues to be calculated on the length of the session of care the parent is charged for and not time actually attended. Where services charge by the session the hourly rate used to determine the relationship with the fee cap is derived by dividing the session charge by the session length.
22 In exceptional circumstances families can make an application to Centrelink that it would be unreasonable for them in their circumstances to satisfy the activity test. This provision also allows for a subsidy for more than 100 hours per fortnight.
23 The Department (Department of Education and Training, 2018a) indicates that people in the following circumstances are exempt from the activity test:
- people with disability or impairment, including those who receive Disability Support Pension or an invalidity service pension or who have been diagnosed by a registered medical practitioner or clinical psychologist as impaired to a significant degree;
- people living or travelling outside Australia (the individual claiming Child Care Subsidy will usually be exempt for up to six weeks);
- recipients of Newstart, Youth Allowance (jobseeker), Parenting Payment or Special Benefit, with an exemption from mutual obligation requirements (with some exceptions);
- being in gaol or psychiatric confinement due to being charged with an offence;
- being a carer who receives Carer Payment;
- being a carer who provides constant care for an adult or child but they or the person they are caring for do not meet
- grandparents who are the principal carers of their grandchild/ren but who do not receive income support payments and are therefore not eligible for Additional Child Care Subsidy (grandparent).
24 Australian Healthcare Associates have been commissioned to undertake this evaluation. It is anticipated that the findings of the evaluation will be used as an input to later stages of this evaluation.
25 This program has provided funding to some 300 services, mostly in regional, remote and Aboriginal and Torres Strait Islander communities.
26 The actual process for parents to register their children for child care and manage their entitlements and payments are detailed in Chapter 6.
27 PRODA is an online authentication system designed to enable providers across a range of services, including health disability and child care to securely access government online service. It involves the verification of individuals using the '100 point' identification approach and then the linking of these individuals to the services for which they are authorised.
28 In addition to the child care sector ACECQA also report on 3,100 preschool and kindergarten services.
29 The other sectors, while shown in Figure 4.3 were all quite small. Specifically, state/territory and local government managed services accounted for 5.0 per cent of all services, state/territory government schools for 3.4 per cent, Independent schools for 2.4 per cent and Catholic schools 1.2 per cent.
30 There have been a series of National Partnership Arrangements seeking to provide universal access to quality early childhood education in the year before school commencing with the National Partnership Agreement on Early Childhood Education, which was made in 2009. The most recent agreement provided for funding in 2019.
31 In detailing this structure, it is noted that the concept of a 'child care service' has a specific meaning and can be counted in a range of different ways. Of particular note is that a Family Day Care service is an organisation which manages the provision of care by a number of Family Day Care educators who usually provide care for a child or group of children (up to a maximum of seven of whom no more than four can be of a preschool age). In addition, a single Out of School Hours Care provider may provide several different Out of School Hours Care Services; for example, before school care, after school care and vacation care. In this data each of these is counted as a separate service. In addition, many services are part of larger organisations. Administrative data provided by the Department of Education and Trainings indicates that while 38.4 per cent of services are single services 20.6 per cent are part of a provider organisation with 2-5 services, 21.8 per cent are as part of a provider organisation with 6-99 services and 19.2 per cent part of a provider organisation with 100 or more services.
32 Most services operate on the basis of a weekly schedule.
33 It is further noted that were services to introduce shorter session lengths within the structure of these longer opening hours and staffed specifically to match the short sessions within this larger time period that this would usually involve a requirement for these sessions to have very rigid hours of operation with specific start and finish times. This type of rigidity is likely to be counter to the needs of parents, in particular those who are employed, where some flexibility is required to cope with specific job demands and the unpredictability of commute times, etc.
34 18 per cent of the Budget Based Funded services said they did not charge for early childhood education and care.
35 While in most cases the survey was completed by a person who would be expected to have a comprehensive knowledge of the service's operations it is recognised that in some cases it may have been responded to by someone in an administrative or related role. Hence caution needs to be exercised in responses such as this which suggest that some services may be unaware of the existence of the agency.
36 IHC services are not eligible for support through the ISP (Guideline 8.2, DET, 2017b, p. 9), although some transitional arrangements were in place in the transition from the former ISIP. It is also possible that these responses may relate to services which are involved in providing a range of care types and while selected for their IHC service have responded more generally.
37 The sample for the Baseline SELCS was drawn from the Department's administrative data.
388 The 37 per cent who did not know what a CCCF grant is includes those who initially answered that they had not made an application for a CCCF grant, then when asked why not, indicated that they did not know what a CCCF grant is. These calculations exclude about 8 per cent who answered 'don't know / prefer not to say'.
39 In Home Care services were not eligible for the first Open Competitive Grant Opportunity under the CCCF.
40 In addition to the Budget Based Funded services there were 27 services classified as Non-Formula Funding Occasional Care (NFF-OCC) which were transitioned. Of these 22 services 12 are operating under the new package, five have been transferred to the Department of Social Services, four have closed and one has sought alternative funding.
41 A key issue relates to the qualification of the educator. Reflecting the renewed focus on early childhood education and care under the new program, IHC educators are required to have, as a minimum qualification, a Certificate III in a relevant course or be working towards such a qualification. In remote and very remote areas there are transitional arrangements to January 2020 where either a qualified educator actively provides support for 20 per cent of the time or the educator has had 15 years continuous experience working in these locations.
5.1 Introduction
This chapter considers aspects of the introduction of the Child Care Package from the perspective of child care services and providers in the period in the lead up to its introduction on 2 July 2018. Preparations for the Child Care Package commenced well before its introduction and required significant changes to services' systems and processes in preparation for the changes, including those to the funding system, regulatory framework, and associated reporting requirements to the Department of Education and Training. For many services it also involved supporting parents to help them understand and prepare for the changes to child care assistance (see Chapters 4 and 6). Further, some services anticipated the impacts of the Child Care Package, by planning for changes in their offerings.
The chapter primarily draws on information from Wave 1 of the Baseline SELCS which was undertaken in May and June 2018, just prior to the introduction of the package. This coincided with a time when services were experiencing significant pressure to prepare themselves, and to support families, for the transition. More detailed information about the Baseline SELCS is provided in Chapter 3 and Attachment C.2. Additional data have also been drawn from information provided by the Department of Education and Training.
The focus in this chapter is on preparation for the transition, including the extent to which services considered they were prepared for the changes and the sources of information they accessed and their satisfaction with these. In addition, it considers services' views on the likely impact of the Child Care Package on the child care sector.
5.2 Information and support activities for the sector preparing for the transition
In preparation for the transition to the Child Care Package, services and providers were required to undertake a number of tasks. This involved learning about the changes to child care assistance (to understand implications for them, and to support families), adopting and learning new software for their service, and learning about new service-level requirements for enrolments and reporting.
Specific administrative tasks that needed to be undertaken ahead of the reforms included completing an online Transition Form, linking personnel with administrative responsibilities to enrolment software (using PRODA), updating service details in the Child Care Subsidy System and ensuring all enrolments met Complying Written Arrangement requirements.42 The Department of Education and Training provided a range of supports for services during the period leading up to the transition, including a range of online fact sheets and task cards. There were face-to-face information sessions, conducted around Australia in May and June 2017 and March 2018. The Department reports that a total of 41 session were held, across capital cities and major regional centres. There were also nine webcasts for providers who could not attend in person.
Regular updates were sent to the sector via email. These emails contained information and links to resources such as the Child Care Service Handbook and video presentations to support services and providers to prepare for transition. Services were able to use the CCS Helpdesk43 and other Department of Education and Training contacts to ask questions.
In addition to resources to support their own transition, child care services and providers were also sent emails and other targeted communications containing messages and resources - such as fact sheets and brochures - to disseminate to families, so services could assist families to complete their call to action and transition to the new system.
5.3 Services' perceptions of preparedness for the transition
Readiness
Services were asked, in the May-June 2018 Baseline SELCS, about the extent to which their service was prepared for the changes. At that time, just before the transition, services reported that on balance they were prepared for the change. Overall:
- 15 per cent of services said they strongly agreed and 51 per cent agreed that their service was prepared for the changes
- 21 per cent neither agreed or disagreed
- 10 per cent disagreed, and 3 per cent strongly disagreed, that their service was ready for the changes.
These assessments of readiness are compared by service type in Figure 5.1. Patterns of responses were similar across service types, as seen in the Figure and confirmed in multivariate analysis, with the exception of In Home Care services, which were most likely to disagree that their service was prepared for the changes.44 As has been noted in Chapter 4, this sector was facing very significant changes in the focus and operation of this form of care.
Figure 5.1. Extent of agreement/disagreement with statement 'This service is prepared for the changes'

Source: Baseline SELCS, Wave 1.
Notes: Excludes those who answered 'Not applicable' or 'Don't know/prefer not to say'. Weighted estimates, n = 2,561.
Multivariate analysis of these responses (detailed findings at Table A.5.5.) indicates:
- In comparison with NSW, services in other states but not territories were significantly more positive about their state of preparedness, with this being particularly marked in Tasmania.
- There were no substantive differences in responses to this question by either remoteness or by the level of socio-economic advantage/disadvantage in the region in which the service was based.
- Services which considered themselves to be less financially viable were less likely to report that they were prepared for the transition. Indeed, there was a marked gradient of responses across gradations of assessed financial viability.
- While the size of an individual service did not have any strong relationship with the state of preparedness, those services that were part of a provider with six or more services were significantly more likely than single services to consider they were prepared. This effect can also be seen in cross-tabular data. For example, 82 per cent of services from large Long Day Care providers agreed they were prepared for the changes compared to 62 per cent of single-service providers (see Table A.5.4).
- Services in private, as opposed to public, or community, ownership were slightly more positive with this difference being statistically significant.
Many services raised preparedness for the transition when invited to provide additional comments at the end of the Baseline SELCS. While services that felt less prepared for the changes were the most likely to provide comments in response to the open-ended question, both positive and negative comments were made.
One service summarised their state of readiness as:
It's organised, our families and educators are aware of it and ready for the transition and our families are ready for the changes.
~ Nominated Supervisor, Long Day Care
At the same time some services reported problems. These related to issues with the support provided, access to information, and the operation of some of the systems. For example:
This process has been extremely difficult and there has been very little support or information provided. We are not ready at all and I am worried for the impact on families.
~ Service Manager/Director, Long Day Care
References to concerns about software and system readiness were also related to concerns about how ready the system would be to make payments, a finding also observed in media reports around the time of the transition (section 4.3). This quote also illustrates another common theme about how much work it has been for services to get themselves ready for the transition.
There is a concern they won't be ready - that the system won't be ready - lots of glitches. It's not recognising provider numbers so I can't progress with linking my child care system to it. We've been told IT systems won't be ready so there's concern it will affect payments. It's been a lot of work for the directors and it looks like it will continue to be a lot of work.
~ Service Manager/Director, Outside School Hours Care
For a number of services, there were significant challenges with the complexity and volume of the work involved in getting themselves ready for the change, within a time-constrained period.
The CCS transition process is complex and confusing and frustrating. There are so many layers of requirements just to get the system over to CCS. PEP, PRODA numbers, CCS ID numbers, CCS enrolment confirmations, etc. Educators have had difficulty getting a PRODA number which holds up the entire CCS and enrolment confirmation process. We are in support of the one payment system, but it is very difficult to understand why there has had to be so many layers of changes to get there.
~ Service Manager/Director, Family Day Care
We note that the above findings are based on services' perceptions of whether they were ready for the transition to the Child Care Package, as reported at May-June 2018. To what extent these perceptions of readiness aligned with transitions at and beyond 2 July 2018 is something we will look at in later stages of the evaluation.
5.4 Services' access to information about the package
There were a number of ways services were provided with and could access information about the new Child Care Package (as noted in section 5.2). The Baseline SELCS sought details on whether services had sourced information from the CCS Helpdesk, the Department of Education and Training website, Department of Education and Training webinars, the Department of Human Services website and information from their own organisation or peak body, in the lead up to implementation.
Only a minority of services did not know about the range of sources of information available (Figure 5.2). Almost all services indicated they knew about their own organisation's or peak's information, the CCS Helpdesk or the Department of Education and Training website (4 per cent, 5 per cent and 6 per cent respectively reported that they did not know about these resources). A larger, but still very small, proportion reported not knowing about the Department of Human Services website and Department of Education and Training Webinars (9 per cent and 13 per cent).
While most services indicated they were aware of these sources of information, many services reported they had no need to access the information and hence fewer services reported accessing them and finding them helpful. While only 12 per cent of services reported not needing to access their own organisation's or peak's information, this rose to around a quarter for most of the government sources. The most frequently cited source was services' provider organisation or peak, with 72 per cent using these and finding them helpful. Around half had accessed the Department of Education and Training website, CCS Helpdesk and Department of Human Services website and found them helpful, along with around a quarter of services saying that they had not needed to access these sources. Less than half had accessed and found helpful the Department's webinars (42 per cent using them and finding them helpful) and services were more likely to say they were unable to access this resource (9 per cent) compared to the other sources of information.45
Among services who had used particular supports, around 80 per cent felt it was helpful for each of the government-based services and 90 per cent for own organisation/sector/peak support. Around half (49) referred to other information sources to get information about the new Child Care Package. These other sources included their software provider, cited by about one in four services, and networking with others (about one in five).
From Department of Education and Training data on CCS Helpdesk usage, it is clear that many services did call on the helpdesk as a source of information. The CCS Helpdesk statistics provide broad information on the numbers of callers, call time and wait time, as well (for some periods) information on the themes covered. Overall, the number of calls to the helpdesk increased throughout June 2018, from 2,626 in the week starting 4 June to 4,894 for the week of June 25.46 For calls specifically related to the child care subsidy, the helpdesk reported over 2,000 calls per week, with 3,092 recorded in the final week before the package was introduced (25 to 29 June).
The Department's CCS Helpdesk statistics show that the average talk time for Helpdesk calls was 4-6 minutes, with average wait times of similar length. There were exceptions to this, however, with maximum wait times of between 15 and 30 minutes during peak times and roughly one in seven calls abandoned during this time. The report on the CCS Helpdesk statistics noted that the callers tended to be smaller providers/single service providers, as large providers tended to have their own administrative support arrangements or to rely on support from their third-party software provider for assistance.
Figure 5.2. Use of different information sources in preparation for the introduction of the package
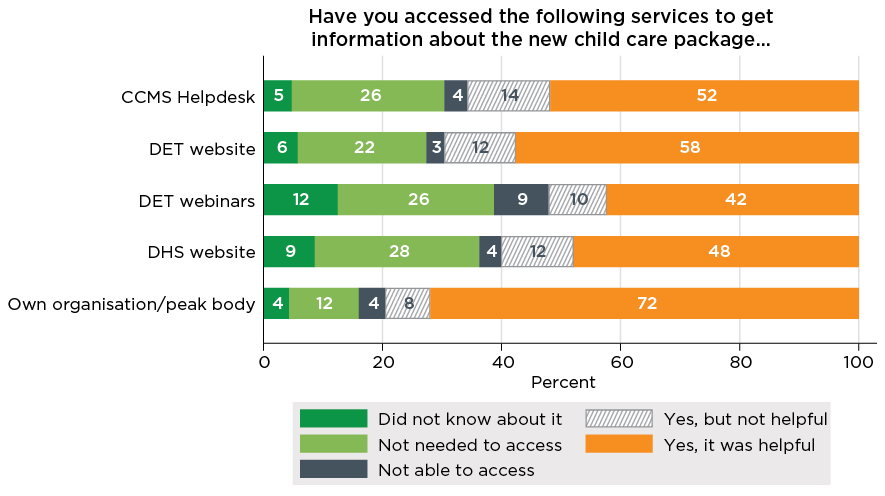
Source: Baseline SELCS, Wave 1.
Notes: Excludes those who answered 'Don't know/prefer not to say'. Weighted estimates, n = 2,383 to 2,439 depending how many answered 'Don't know/prefer not to say'.
These analyses were extended to take account of other service characteristics using multivariate regression analysis. The dependent variable is whether or not the service had used the source of information (Table A.5.6).47
By service type, Outside School Hours Care services were the least likely to use the Department of Education and Training website or webinars (66 per cent and 46 per cent respectively), while In Home Care services were the most likely to use these resources (100 per cent and 83 per cent respectively). When awareness of information sources was analysed by service type, the lack of knowledge tended to be higher in the Occasional Care and Outside School Hours Care sectors. Looking at the satisfaction with each information source, In Home Care services tended to be the least satisfied (see Table A.5.2).
Looking across all of these sources there are relatively few consistent differences, although in almost all cases Family Day Care services were more likely to have used the source than Long Day Care services, with other services not being significantly different to the Long Day Care sector. Secondly, there were marked differences by organisation size. Specifically, those services which were part of a provider with more than six services were significantly less likely to have used government sources, and more likely to have used their own organisation or peaks than those single service providers. This reflects the more centralised approach to the transition used by larger providers, while single service providers were more likely than services from larger provider organisations to rely upon Department of Education and Training and Department of Human Services information and the CCS Helpdesk. As with the earlier analysis of preparedness, issues of location whether defined in terms of remoteness, or with regard to socio-economic advantage or disadvantage, were not significant. In contrast to earlier data, there were no consistent significant differences by state.
The relationship between provider size and use of information sources was further examined within the Long Day Care sector alone (Table A.5.3). This shows that single-service Long Day Care providers were more likely than services of large providers (100 or more services) to use government sources such as the Department of Education and Training website (79 per cent compared to 51 per cent), webinars (56 per cent to 43 per cent) and the Department of Human Services website (68 per cent to 54 per cent).
These provider size differences are consistent with CCS Helpdesk reports that the majority of their callers are from smaller provider services.
While overall, most services seemed to have found a useful source of information about the transition, some clearly experienced challenges. The comments below from services who completed the survey provide some insights into the types of challenges and concerns services may have experienced.
Basically, as a service provider I'm happy about the changes. I'm not happy about the transitions: not enough supports for services and not enough support for software providers. … At the moment we have no idea. All I want it a sheet of paper with step 1, 2, 3 for the service providers. Their info is for the families not the providers. A clearer help desk. Who do I go to? When I call my software provider, their phones lines are down because so many calls. I'm not frightened of changes but I'm fearful and it's stressful when you don't know what you're doing. I'm liable. There's no handbook as a guide.
~ Service Manager/Director, In Home Care
My biggest problem is there hasn't been enough info and I've been searching and searching and we do get some but it doesn't seem to necessarily flow on or be applicable to the questions that I have …
~ Service Manager/Director, Long Day Care
CCS Helpdesk data on service information needs
Department of Education and Training reports drawing on the CCS Helpdesk indicate that in the time immediately before the transition, policy related queries (handled by the governance team) turned more to very pragmatic issues, as services started asking about how very specific circumstances with their service or with their families should be dealt with.
The CCS Helpdesk data show that in the lead up to (and beyond) the transition, the following issues were most commonly asked about:
- ACCS - how to apply/criteria/difference between family and service eligible/grandparents
- payments - payments to families, backdating, differing from first week which is generally due to exhausting eligible hours, payment advice not showing in PEP, remittance notices
- enrolments - Pending Eligibility and Pending Confirmation status, Complying Written Agreement (CWA) requirements, amending ACCS enrolments created in error, multiple children with differing entitlements
- sessions - queries regarding eligibility and attendance submitted, backdating, resubmitting, preschool sessions
- absences.
While these issues may indicate a lack of understanding of these elements, it may also reflect difficulties with the systems involved in implementing aspects of the package.
5.5 Adequacy of support
Services were asked about the adequacy of the support that they had received from a number of different sources to help them to prepare for the introduction of the package. Specific sources identified in the survey were:
- the Department of Education and Training
- the Department of Human Services
- third-party software providers, where they had one
- service's own provider organisation, or peak body.
These responses are summarised in Figure 5.3:
- Three quarters of services agreed or strongly agreed that they were getting enough support from their own organisation or peak body. This was the source of information for which there was the highest level of agreement that the level of support being provided being was sufficient.
- This was followed by the software provider (24 per cent strongly agreed and 46 per cent agreed).
- Services were less positive about the support provided by the Department of Education and Training (7 per cent strongly agreed they were getting enough support and 40 per cent agreed) and by the Department of Human Services (7 per cent strongly agreed they were getting enough support and 38 per cent agreed). For each of these around 18 per cent disagreed and 8 per cent strongly disagreed with the statement of support being adequate. In general, services tended to report the same level of satisfaction with both Departments.
Figure 5.3. Readiness and support for the changes
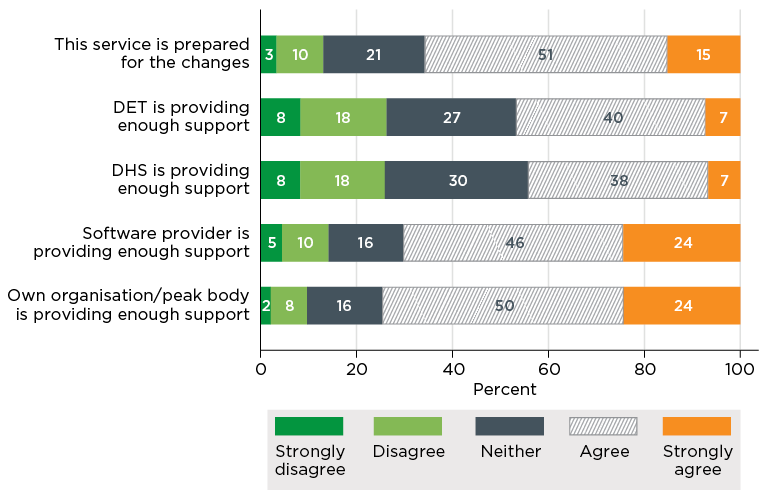
Source: Baseline SELCS, Wave 1.
Note: Excludes those who answered 'Not applicable' or 'Don't know/prefer not to say'. Weighted estimates, n = 2,323 to 2,561, depending how many answered not applicable or don't know.
Looking more specifically at the responses about the support provided by the Department of Education and Training, Figure 5.4 shows a broad similarity of responses for the main service types of Long Day Care, Family Day Care and Outside School Hours Care, with Occasional Care somewhat more positive than these. In contrast Budget Based Funded services gave considerably more positive responses on the rating of support by the department. This is likely to reflect the intensive support provided to these services. A different perspective was given by In Home Care services which were much more negative relative to other services. In this sector 30 per cent strongly disagreed and 38 per cent disagreed with the statement that the Department of Education and Training was providing enough support - and none expressed strong agreement.
Figure 5.4. The Department of Education and Training is providing enough support for the changes, by detailed service type
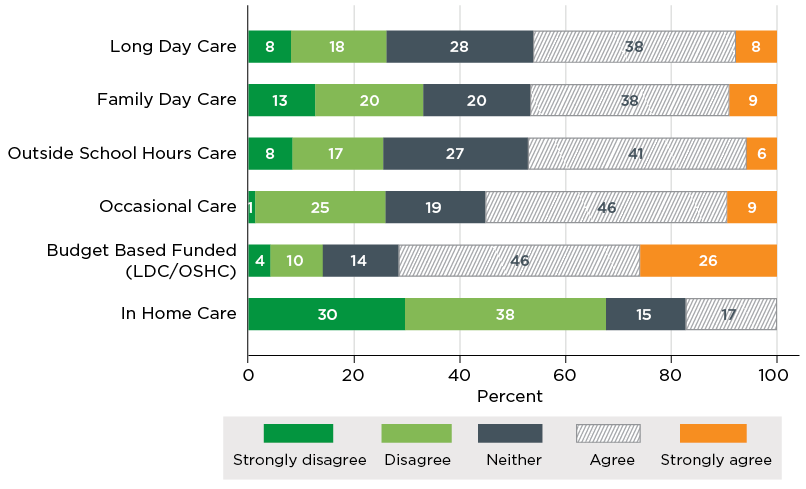
Source: Baseline SELCS, Wave 1.
Note: Excludes those who answered 'Not applicable' or 'Don't know/prefer not to say'. Weighted estimates, n = 2,505.
Multivariate analyses were used to explore the assessments of adequacy of these sources of support in more detail. The detailed table is at Table A.5.7, and some specific findings by service type are:
- The service type differences discussed above were statistically significant with regard to support provided by the Department of Education and Training.
- The ratings of support provided by software providers were markedly, and statistically significantly lower for Family Day Care services and In Home Care services, compared to those providing Long Day Care.
- For the support provided by their own organisation or peak body, relative to Long Day Care services Budget Based Funded services gave a significantly higher rating and Family Day Care services a significantly lower rating.
Looking across the ratings for all four sources of support some other factors emerge, although not necessarily consistently for each source:
- There was a tendency, in many cases statistically significant, for services located in states other than NSW to provide a higher rating for the adequacy of support, except for that from their own organisation/peak where the differences between states were generally more muted.
- As with a number of the other measures considered here, differences by remoteness and level of socio-economic advantage/disadvantage of the service location were not statistically significant.
- There was a negative, and statistically significant relationship with the financial viability of the service, with those services that considered they were less viable being more negative as to the adequacy of support.
- While in most cases, other than the Department of Human Services support the size of the service made little difference. In the case of support provided by the Department of Human Services the analysis suggests that the very small services considered the adequacy of support was greater than the larger ones. For all sources of support, other than software providers, more positive assessments of adequacy of support was associated with being part of a larger provider.
- Across all measures privately owned services were slightly, but statistically significantly, more positive about the adequacy of support from each of the sources.
Differences in ratings of the support provided by the Department of Education and Training are shown for Long Day Care services, by provider size in Table A.5.4. While 58 per cent of services from large providers agreed that the department was providing enough support, this fell to 40 per cent for single-service providers. Similar gradients are seen in the responses to each of the other sources of support, except for software providers where other than for the largest providers the adequacy of support was generally rated at the same level.
When respondents were invited to provide additional comments about the Child Care Package, these primarily came from those who had provided negative responses to questions about the transition. Such comments included:
General confusion amongst parents. Parents contacting our service for support and we cannot give that to them because we also lack the information. Software or CCMS not ready and fully prepared. So many questions not able to be answered by DHS. Parents and services not understanding the terminology especially 'compliant written agreement' - different services doing different things in regards to this. …. The roll out for this package is HUGE for services and all has been very last minute. In addition, that constant threat that if services do not get it right the compliance team will come down on us hard.
~ Authorised service personnel, Family Day Care
It's been a lot of hard work, I don't think they realise how much work we have to do, been really, really hard work and still not 100 per cent ready for it. Families don't really understand the importance of transitioning over. Having a lot of problems getting people to go on the MyGov website to transition over. A lot of unnecessary paperwork and changes in agreements and enrolment forms. For a little centre like us who have to do everything, we don't have the time or the money to do it. The impact on little centres, so remote and without support, big, big burden.
~ Manager, Education Leader, Supervisor, Budget Based Funded
5.6 Services understanding of the package and perception of parents' understanding
The Baseline SELCS also asked services to rate their own understanding, and that of the parents who used the service of the new Child Care Package on a five-point scale from 'poor' to 'excellent'. These responses are considered below.
Services' Understanding
Just 2 per cent of services rated their own understanding as excellent, 15 per cent as very good, 34 per cent as good, 37 per cent as fair, and 12 per cent reported that they had a poor understanding.48
There was variability across service types in their ratings of their own understanding (Figure 5.5). Of particular note was that while 71 per cent of the Budget Based Funded services rated their understanding as good or better, this fell to 66 per cent for Family Day Care and In Home Care services, and to around 50 per cent among Long Day Care services, Outside School Hours Care and Occasional Care. In multivariate analysis, as discussed below, only the differences for Family Day Care and Budget Based Funded services were statistically different to the base case of Long Day Care when account was taken of other service characteristics.
One factor that is important to note when interpreting the Budget Based Funded finding was the more intensive support provided to these services prior to, and during, the transition. While the Budget Based Funding program ceased on 30 June 2018, services receiving this funding were provided with support from PricewaterhouseCoopers (PwC) and PricewaterhouseCoopers Indigenous Consulting (PIC) from May 2016 to August 2018 to transition to the new Child Care Package, or where appropriate, to alternative funding arrangements. Under these arrangements Budget Based Funded services were assessed, and provided with varying levels of support depending on their needs, including face-to-face meetings and support (PwC, PIC, 2018).
Similarly, the marked changes to In Home Care service model and the strong interventions by the department and consultants may have also promoted a stronger understanding of the new package given its implications on service operations.
Figure 5.5. Service's understanding of the Child Care Package, by detailed service type
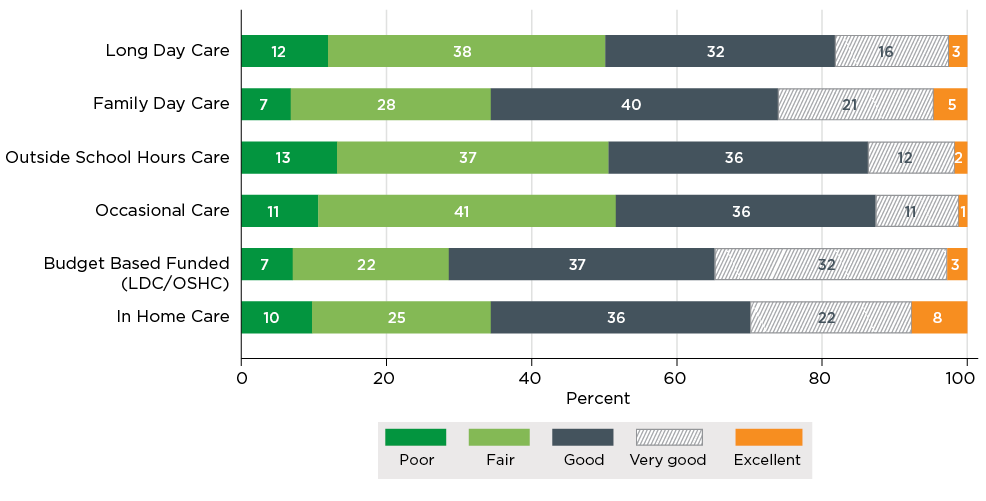
Source: Baseline SELCS, Wave 1.
Note: Excludes those who answered 'Not applicable' or 'Don't know/prefer not to say'. Service understanding. Weighted estimates, n = 2,605.
Multivariate analyses of the responses about understanding of the package are shown in Table A.5.8 with responses coded to a numeric scale of one to five, based on the five responses from poor through to excellent. (The table also provides analysis of services perceptions of the understanding of families which is discussed below.)
- By service type, relative to Long Day Care services, reported understanding of the package was significantly higher for Budget Based Funded services and (although to a lesser extent) for Family Day Care services.
- Services in Western Australia and Tasmania were somewhat more positive than those in NSW, but again there was no strong impact of location when considered in terms of remoteness or socio-economic advantage/disadvantage.
- There were however very marked and significant differences associated with the services' perception of their financial viability. The interpretation of this is not though obvious. On one hand it may be a consequence of less viable services being able to invest less in developing an understanding, on the other hand, given both of these questions concern perceptions of a situation, the association of a more negative assessment of financial viability and a more negative assessment of understanding may just reflect a more negative outlook by a sub-population of services.
- In contrast to analysis of other aspects of preparedness, provider size was not particularly important to services' rating of their understanding, although size, when measured by staff members was. Specifically, middle sized services, those with between 11 and 24 staff, were significantly more positive than small services as to their understanding.
- Privately owned services were slightly, and weakly statistically significantly, more likely to report a higher level of understanding than those services that were publicly or community owned and operated.
In comments in the survey, there was concern expressed by some services about the lack of understanding of the package and the potential consequences of this. For example:
At this stage I think families and services don't understand how it's going to work. I think it's going to be an admin mess once it starts. Services will really suffer financially because of it.
~ Service Manager/Director, Long Day Care
Services' perceptions of families' understanding of the package
Services were also asked how well they thought families at their service understood the Child Care Package. While services were not asked explicitly as to the basis on which these views were formed, as identified in the CCPFamS these services were a major source of information for parents and these responses are likely to be based on conversations and related interactions with families.
- Less than 1 per cent of services rated families' understanding as excellent, 2 per cent rated it as very good, 16 per cent rated it as good, 42 per cent rated it as fair and 39 per cent rated families' understanding as poor.49
Comparing these observations with the family responses (see Chapter 6, section 6.4) suggests that services were more negative in their perception of families' understanding than the families themselves. Three possible explanations for this are:
- Families' responses were to a fairly broad question while services were more aware of the nuances of the new arrangements and felt that families did not know about these. This is evident also in Chapter 6, section 6.4 where families were asked about their knowledge of a number of the components of the package and subsidy arrangements.
- The services' responses may be related to the interactions they had with families and in particular the subgroup of families who had problems understanding the new arrangements.
- Services, as discussed below, may have confounded their own level of understanding with that of parents.
There was variability across service types in their ratings of families' understanding (Figure 5.6). Parental understanding was assessed as good or better by some 17-20 per cent of services in most sectors. However, the full span was from 5 per cent for In Home Care services to 25 per cent in the Occasional Care sector. In multivariate analysis, relative to the Long Day Care sector both the Occasional Care sector and Family Day Care services gave parents' understanding a more positive, and statistically significant rating. Interestingly the higher assessment by Budget Based Funded services of their own understanding was not mirrored in these services' assessment of parents' understanding.
The multivariate analysis also identified some other associations. Of particular note was an increasingly positive assessment of parental understanding associated with more advantaged locations as measured by the location's socio-economic status, although only the difference between the least and most advantaged locations was statistically significant. The association seen between the service's understanding and their self-assessed financial viability was again seen in this data. Additionally, services with more than 25 staff, or part of providers with more than 100 services, were more positive about parents' understanding with this difference being statistically significant relative to the base categories of fewer than seven staff, and single services.
Figure 5.6. Service's perception of families' understanding of the Child Care Package, by detailed service type

Source: Baseline SELCS, Wave 1.
Note: Excludes those who answered 'Not applicable' or 'Don't know/prefer not to say'. Weighted estimates, n = 2,573.
Another feature of this data, as discussed above, and illustrated in Table 5.1, was the association between services' rating of their own understanding of the package and the rating they gave to parent's understanding. For example, 93.8 per cent of those services that rated their understanding as poor or fair awarded ratings of either poor or fair for parents' understanding, in contrast only 61.2 per cent of those services that rated their own understanding as very good or excellent gave a rating of poor or fair to parents' understanding.
| Service understanding of the package | Services perception of parental understanding of the package (%) | ||||
| Poor or fair | Good | Very good or excellent | Total | ||
| Poor or fair | 93.8 | 5.6 | 0.6 | 100.0 | |
| Good | 74.9 | 22.9 | 2.2 | 100.0 | |
| Very good or excellent | 61.2 | 29.5 | 9.3 | 100.0 | |
| Total | 81.8 | 15.6 | 2.6 | 100.0 | |
Source: Baseline SELCS, Wave 1, May-June 2018.
Note: Excludes those who answered 'Not applicable' or 'Don't know/prefer not to say'. Weighted estimates, n = 2,573.
While the Baseline SELCS did not directly prompt for service-level views on how families were managing the transition, a number of issues were raised in services' comments about the Child Care Package overall. Generally, services which expressed concerns in comments about families' understanding of the package made observations such as families having difficulties getting through to Centrelink to have their queries answered, and having trouble getting accurate information about their eligibility.
I think the information is out there but it's not being understood by families. We're passing the info onto them but they're having trouble getting through to Centrelink and getting what they need. We're having huge problems with our software providers, it's very stressful.
~ Service Manager/Director, Outside School Hours Care
Biggest problem is that families aren't getting enough information yet and are anxious, don't know what happens when everything comes into place because they can't get a straight answer.
~ Service Manager/Director, Long Day Care
5.7 Pre-implementation service views on the Child Care Package
A final element of the Baseline SELCS was concerned with the views of services about the potential impact of the package. These questions addressed the overall impact, and about implications for service use and delivery.
Overall impact
The first question sought from services an overall assessment of the impact, specifically asking them to say, overall, whether they thought the changes would have a 'large, negative impact' through to 'large, positive impact'. While this is a very broad subjective question, it provides some insights on how the child care sector was viewing the potential effects of the Child Care Package at this pre-implementation stage. Later waves of this survey will seek to follow this to explore if, and how, these perceptions changed.
Across the sector as a whole there was no consensus as to the potential impact with:
- 13 per cent of services considering there would be a large, negative impact
- 23 per cent a small, negative impact
- 7 per cent no impact
- 29 per cent a small positive impact
- 11 per cent a large positive impact
- 17 per cent indicating that they did not know, or preferred not to say, what they thought the impact would be.
Responses are shown by service type in Figure 5.7 (excluding those who indicated they did not know). This shows a persistence of the diversity of views within each of the types of child care, but also some distinctly different patterns in responses across the sectors. Of particular note is the more negative views of In Home Care Services, where over half expected a large negative impact. Interestingly, about one in three of the Budget Based Funded services reported that they expected a large positive impact.
Multivariate analysis confirmed this strong negative sentiment from the In Home Care sector, relative to Long Day Care services, and also a more positive perspective from services in the Outside School Hours Care and Family Day Care sectors, although this latter was only weakly statistically significant. Except for Queensland and Tasmania, services in other states and territories were more positive than those in NSW, although to the extent there were differences, none were strongly statistically significant. Similarly, while there were some differences by remoteness the strength of these was not strong, although there was a general pattern of less positive attitudes in the major cities and more positive in other locations. The differences by socio-economic status were in general even smaller, and all were statistically insignificant. Both the size of services as measured by staffing and provider size mattered, with the least positive views being expressed by single service providers, and the most positive by those services belonging to large organisations. This effect was strong and statistically significant. In contrast the services with fewer than seven staff were more positive, although there was no consistent pattern with increasing staff size and most differences were not statistically significant. There was a marked pattern of a more negative assessment of the potential impact by those services that had more negative assessment of their financial viability. Privately owned services tended to be more positive than public and community owned services, but this was only weakly significant.
Figure 5.7. Expectations of the impact of the Child Care Package
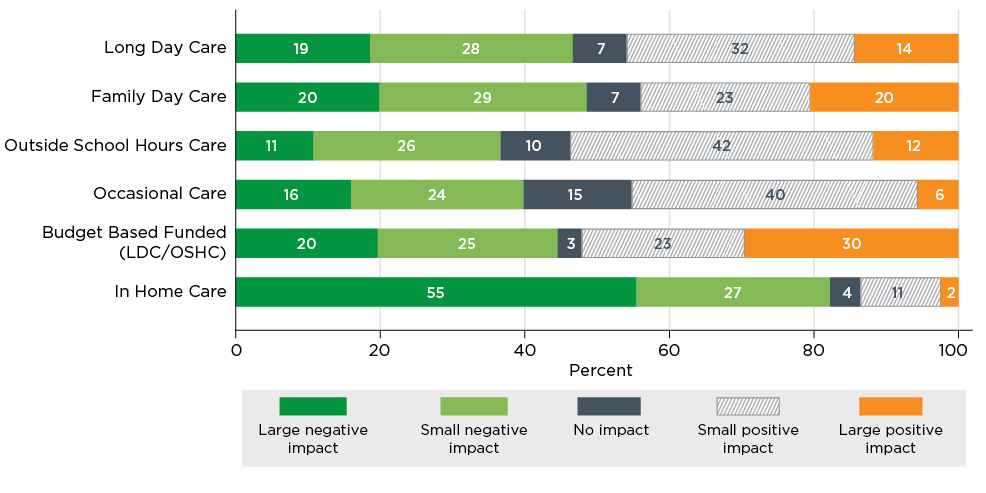
Source: Baseline SELCS, Wave 1.
Note: Excludes Don't know. Weighted estimates, n = 2,808.
Views on anticipated specific impacts of the Child Care Package
In addition to the more global question about the overall impact of the package, services were also asked about their perceptions of outcomes specifically related to particular services or families' use of child care.
Figure 5.8 shows services' extent of agreement with statements describing ways in which the Child Care Package might change service delivery or use.
As with the overall perceptions of outcomes there was considerable diversity of opinion on the potential impact across each of these dimensions. Of note:
- 59 per cent agreed or strongly agreed that the Child Care Package will result in families withdrawing children or reducing hours
- 53 per cent agreed or strongly agreed that the Child Care Package will result in a simpler process for child care payments
- 40 per cent agreed or strongly agreed that there will be changes in the way fees are charged at their service.
Later waves of SELCS will include follow up questions on services' perceptions of impact of the package, and whether, and if so how, they have changed.
Figure 5.8. Perceived outcomes of the Child Care Package
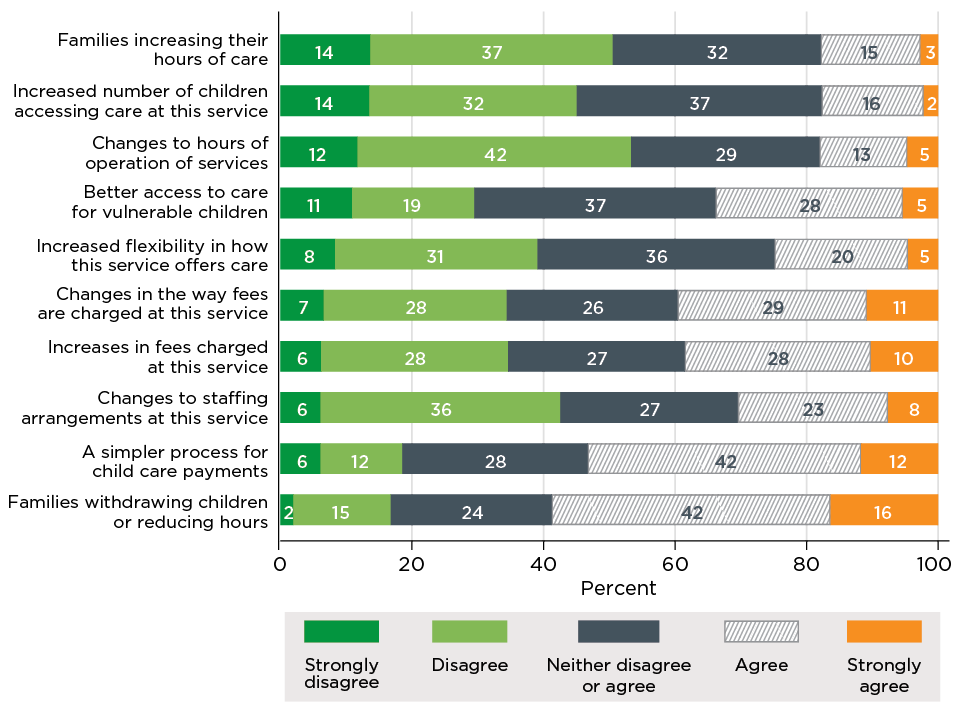
Source: Baseline SELCS, Wave 1.
Note: Weighted estimates, n = 2,397 to 2,463, depending how many answered 'Don't know/prefer not to say', responses (about 6-7 per cent of respondents per question) are excluded.
More detailed analysis of the pattern of service responses is considered below.
The qualitative responses from services across these subjects largely concentrated on the question of access for vulnerable children, and the potential for the families of some of these to withdraw from using child care and the consequences of this. There was, only limited coverage of the other aspects including: expectations for changing (or increasing) fees at the service, the hours of operation or flexibility of the service, or expectations for a simpler process for child care payments.
With regard to better access to care for vulnerable children, as seen above responses were split with an estimated 33 per cent suggesting the package may increase access, 37 per cent being unsure of the impact, and 30 per cent disagreeing or strongly disagreeing. Typical of these views were:
I feel that a lot of our vulnerable families who do not meet the activity requirements - we are limiting these children's access. Given they are already vulnerable because their parents aren't working, this will increase the gap even further for these children. …. Already seen families withdrawing from care because they don't meet the activity requirements. All children should have a minimum of 2 day access to care. Our service is 24 hours a week, which is 48 hours a fortnight. That should be the minimum standard that every child can access that regardless of the activity of their parents.
~ Service Manager/Director, Long Day Care
I'm most concerned about hours being reliant on the activity of the families, these are children who need more hours, coming from vulnerable families, these hours are being reduced because families can't pay for child care. Parents on one wage can't afford to pay full fees.
~ Nominated Supervisor, Family Day Care
Some extended this type of consideration to comment on the possible effect on service viability:
In our low socio-economic area with low employment and study I think we will have a lot of families who will leave their children in care but will not be eligible in future and therefore we will be incurring huge bad debts from families unable to make child care payments who have been cut off. I don't think the new system takes into account highly vulnerable children and families who require greater assistance to get on their feet. I envisage we will either have children not coming and being left in unsafe home environments or children who continue to come but accounts not being paid.
~ Authorised Supervisor, Long Day Care
A contradictory position was taken by some respondents in the context of the question as to the potential for families to increase their use of care, or whether more families would use care, as a result of the package. While most services did not agree this would happen, some services indicated that the changed arrangements would possibly open up these opportunities:
I would say positively because there were many families who have for example 50hrs of care and didn't really need and can now pick up more children who actually do.
~ Manager/Director/Coordinator, Family Day Care
Looking at how these responses vary by service type, Figure 5.9 shows the percentage who agreed or strongly agreed with each of the possible impacts:
- With respect to increases in fees, while 48 per cent of Family Day Care and 44 per cent of Long Day Care services agreed or strongly agreed that fees were likely to increase, only 28 per cent of Outside School Hours Care services did so. The Budget Based Funded services were the most likely to report agreement about likely increases in fees (76 per cent) (noting that 18 per cent of Budget Based Funded services did not charge for care before transition to the Child Care Package).
- Agreement with the statement of families reducing usage was most likely for In Home Care services (91 per cent) and least likely for Occasional Care (44 per cent) and Outside School Hours Care services (47 per cent).
Figure 5.9. Perceived outcomes of the Child Care Package: agreement by service type
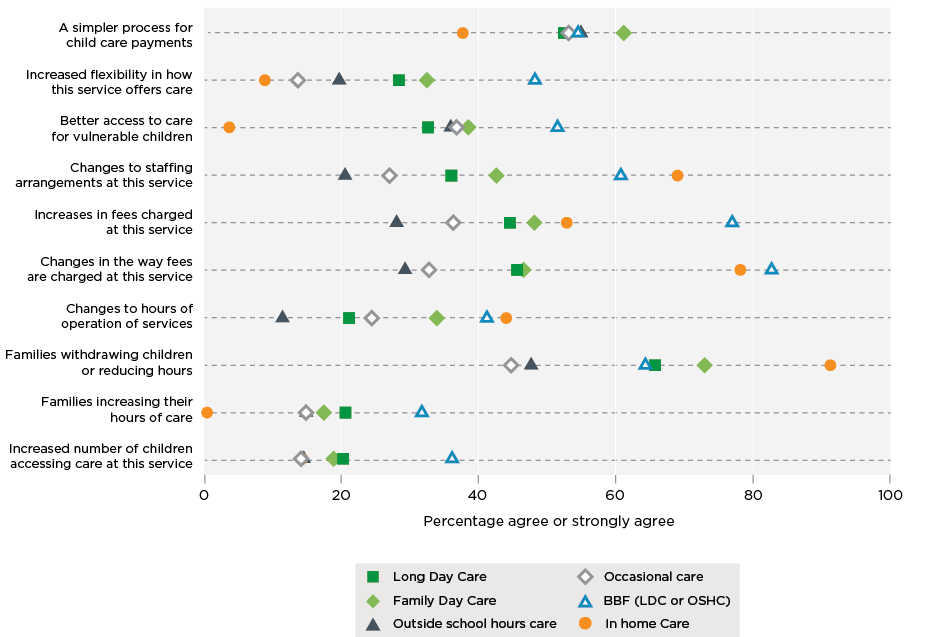
Source: Baseline SELCS, Wave 1.
Note: Weighted estimates, n = 2,397 to 2,463, depending how many answered 'Don't know/prefer not to say', who were excluded.
Each of the statements was also analysed using multivariate analyses, with the outcome variables analysed as a five-point variable from 1 (strongly disagree) to 5 (strongly agree). They have been presented in two tables, Table A.5.10 and Table A.5.11.
Compared to Long Day Care, In Home Care and Budget Based Funded services were more likely to agree that there would be changes to the hours of operation of service, changes in the way fees are charged at their service and changes to staffing arrangements in their service. Again relative to Long Day Care services, the Budget Based Funded service services were more likely to agree that there would be increases in fees charged at their service, and increases in flexibility in how their service offers care. This is consistent with the fact that most Budget Based Funded services transitioning to the new system would now be required to charge fees for the first time. In addition, Budget Based Funded services were more positive in considering there may be increases in the number of children accessing care, families increasing their hours of care, and better access to care for vulnerable children. Occasional Care services responses were similar to the Budget Based Funded services' responses on these items. In Home Care services were more likely to expect that families would withdraw or reduce hours, compared to Long Day Care services, as well as less likely to expect that there would be an increased number of children accessing care, or that families would increase their hours of care.
There were significant differences between Long Day Care and Family Day Care services, with the latter more likely to agree that there would be changes to the hours of operation of services and increased flexibility in how their service offers care. Family Day Care services were a little more likely than Long Day Care services to agree that there would be an increased number of children accessing care.
In Home Care services reported less agreement about there being better access to care for vulnerable children, again relative to Long Day Care services, but other service types (Family Day Care, Outside School Hours Care, Occasional Care and Budget Based Funded services) all reported somewhat more agreement with this compared to Long Day Care. Outside School Hours Care services were less likely than Long Day Care services to agree that there would be changes to hours of operation, increases in fees charged and changes to staffing arrangements at the service.
These analyses also identified some marked differences associated with other service characteristics:
- There was greater, and generally statistically significant, perceptions that that there would be changes to hours of operation, changes to how fees are charged and increases in fees charged in areas of lowest socio-economic status relative to other locations, while those services in higher socio-economic status areas were significantly less likely to agree with the statement that families may withdraw children or reduce hours.
- Compared with those in major cities, services in more remote locations were less likely to agree there would be changes in staffing, or that families would withdraw children. Indeed, services in all locations, relative to the major cities, expressed stronger agreement with the possibility of families increasing care, although this latter was only weakly significant in most of these locations
- Services from larger providers more often agreed about better access for vulnerable children and less often agreed about withdrawal of children from care than single service providers. They were also the most likely to expect a simpler process for child care payments, increases in care use, and greater flexibility in how services were provided.
- Another broadly consistent pattern was that more change was expected in private sector services, rather than public or community ones. Private sector services agreed more strongly about all the impacts asked about, except on families withdrawing from care, where they did not report any differently to public/community sector services.
5.8 Summary
This chapter provides an overview of services' assessment of their preparedness for the changes to the child care system, and their views on the information and support provided to them as at May-June 2018. It also provides an overview of what they anticipated to be the impacts of the package ahead of it being implemented.
Overall, most services considered they were prepared for the transition and had the information and support they needed, although there was some uncertainty about their actual level of understanding of the package, and even more negative perceptions about parents' understanding. Services that were part of larger organisations tended to report relying on their own organisation for information and support. Smaller and single service providers were more likely to rely on Centrelink/ the Department of Human Services and the Department of Education and Training for information and support. Services generally expressed greater satisfaction with information and support from their own organisations and peaks than from the government agencies involved. Many of the qualitative comments received about the transition focused on frustrations with finding information and getting support to undertake the many tasks associated with the transition.
Services were split in their views when asked about the impacts of the new package overall, with similar proportions anticipating positive or negative impacts and around a quarter being agnostic or unsure. However, there were clearer responses to the more specific outcomes that may be associated with the package. For example, just over half of services agreed it would lead to a simpler process for child care payments. However, 58 per cent also agreed with a statement that it would lead to families reducing their hours of care.
The qualitative comments collected as part of the survey provided some insights into this finding with many comments from providers expressing concerns that disadvantaged and vulnerable families who do not meet the activity test would lose access to, or need to reduce, their hours of care. In these comments there was concern expressed around the impact of such reductions on the wellbeing of both children and their families.
While much of the information considered here focuses specifically on the transition process, the issues identified may also have relevance to the ongoing delivery of care, if issues raised by services around processes, and IT systems, for both services and families, remain unresolved post implementation. Similarly, services concerns about how the Child Care Package may change the opportunities for care (or costs of care) for particular types of families is a longer-term concern to be monitored.
The issues raised by services in their survey responses also address some of the intended objectives of the Child Care Package. This includes issues concerning a simple system of childcare assistance. The issues also concern the objectives of a viable and sustainable child care sector, through measures including the role of the Child Care Safety Net and engagement with vulnerable children, and providing care that better supports parents' employment. These will be considered using further services surveys and interviews as well as information from other stakeholders, parents and administrative data (where available) as the evaluation progresses.
42 A Complying Written Arrangement is required to contain the following information: the names and contact details of the provider and the individual(s); the date that the arrangement starts; the name and date of birth of the child (or children); if care will be provided on a routine basis, and if so: details about the days on which sessions of care will usually be provided, and the usual start and end times for these sessions of care; whether care may be provided on a casual or flexible basis (in addition to, or instead of, a routine basis); and details of fees to be charged under the arrangement (this can be by reference to a fee schedule or information available on the provider's website maintained by the provider), that the parties understand may vary from time to time.
43 The CCS Helpdesk was previously named the CCMS Helpdesk.
44 While the lower level of preparedness in the In Home Care sector was also identified in the multivariate analysis it was only weakly statically significant.
45 Excludes those who answered 'don't know/prefer not to say'.
46 The number of calls to the CCS Helpdesk does not equate to the number of unique callers. Repeat callers are included in the count.
47 While similar analysis was undertaken on which services had said each source was helpful, little was statistically significant, and so this was not retained.
48 A small number answered 'don't know/prefer not to say' to either, and they are excluded.
49 A small number answered 'don't know/prefer not to say' to either, and they are excluded.
6.1 Introduction
The Child Care Package involves significant changes for families, including the operation of the new subsidy, increased means testing, and imposing a level of activity requirement to be eligible for assistance. Changes to In Home Care and the transition of former Budget Based Funded services to the new subsidy system will also affect some families.
This chapter provides an overview of families' experiences of the transition to the new child care system. It explores the support provided by government and services in preparation for transition to the Child Care Package, and families' experiences of these transitions, and emerging evidence on how families have responded to the package.
The chapter draws on information from the Department of Education and Training and other sources involved in informing families about the changes. It also draws on three different surveys of families.50 The first was conducted shortly before the transition, and the second in the immediate period following transition and the third post-transition in late 2018:
- the pre-transition Baseline Parent Survey
- two waves of the LinA Panel, conducted shortly after the transition
- one wave of the Child Care Package Families Survey (CCPFamS). This survey, as discussed in Chapter 3 used a sample of respondents to the Baseline Parent Survey which in turn permits some analysis of experience and attitudes over time.
While the Baseline Parent Survey and LinA surveys have been weighted to be representative of the population, the CCPFamS data are unweighted and, as noted in Chapter 3, tend to underrepresent low-income families who use child care. One other consequence of this bias is that where matched data is used from the CCPFamS and the Baseline Parent Survey to explore changes over time, the reported distributions from the Baseline Survey will not coincide with those published directly from the CCPFamS.
This chapter begins with an overview of the information provided to parents about the transition and parents' use of this information in the lead up to the 2 July 2018 implementation, followed by analysis of parents' understanding, and the early impacts, of the package.
6.2 Information and support activities for parents preparing for the transition
The transition to the new child care system required families to undertake a number of activities. While for many parents there was only a relatively small number of actions required, largely related to the determination of their CCS eligibility and entitlement, for others, including those without MyGov registration, new entrants to the system and those attending some BBF services, the process was more complex and variously included:
- setting up a MyGov account, and/or entering other child and family information with the Department of Human Services
- completing the child care enrolment process (see Figure 6.1)
- applying for and accessing child care subsidy (see Figure 6.2).
Government information campaigns and supports for parents
The Department of Education and Training undertook a range of communications and stakeholder engagement activities to enhance families' awareness and understanding of the Child Care Package and to support families in their transition to the new system.
This process required families to have interactions with both Centrelink and their child care providers including providing information related to family income, work and study arrangements and any additional needs they, or their child, may have that could impact their eligibility for the Child Care Subsidy and other supports. It also involved a major Government information campaign, along with activities by child care providers directed at informing parents about the changes and what families were required to do in preparation.
The Department's Communications Branch developed a two-phase communications strategy. The first phase was undertaken between August and December 2017 and focused on awareness raising and providing information about the package. The second phase ran from April 2018 to end June 2018 and was designed to inform families about the actions they needed to take to transition to the new package.51
The communication campaign objectives for phase one were to raise awareness and disseminate information about the changes to the child care systems, and included a 'call to action' that directed families to the Department of Education and Training's website and its online subsidy estimator. The strategy contained many different elements with phase one commencing in August 2017 with social media, strategic social media partnerships, media briefings, and intermediary outreach, and other activities. This was extended from September with targeting to CALD and Aboriginal and Torres Strait Islander audiences. From November 2017, a major advertising campaign across television, radio and online (social media, search and digital) media was initiated.
Phase two continued the messages of phase one, however the 'call to action' during this phase asked families to confirm their details and provide additional information via the MyGov portal and go to education.gov.au/childcare to learn more. Activities in phase two mirrored those of phase one, with the addition of cinema advertising. All communications activities ceased by June 30 2018. By 2 July 2018, 1,024,359 families had responded to the call to action and transitioned to the new system, representing a high proportion of all eligible families.
Figure 6.1. Enrolment process
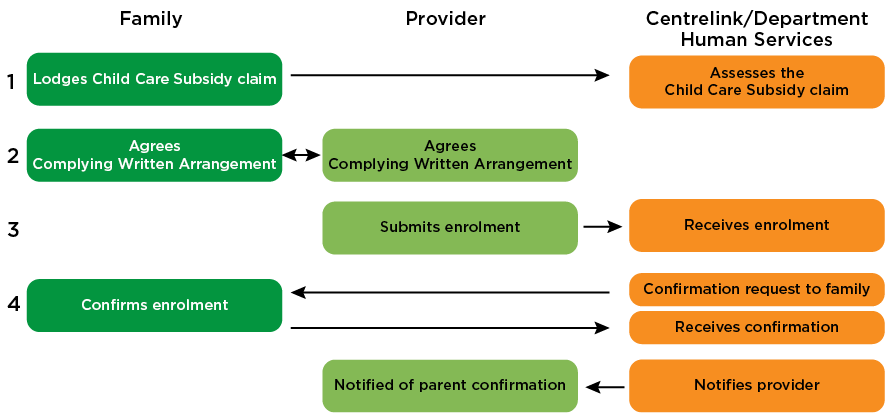
Source: Department of Education and Training Provider-service information presentation (PowerPoint)
Figure 6.2. Calculation of entitlements and payments
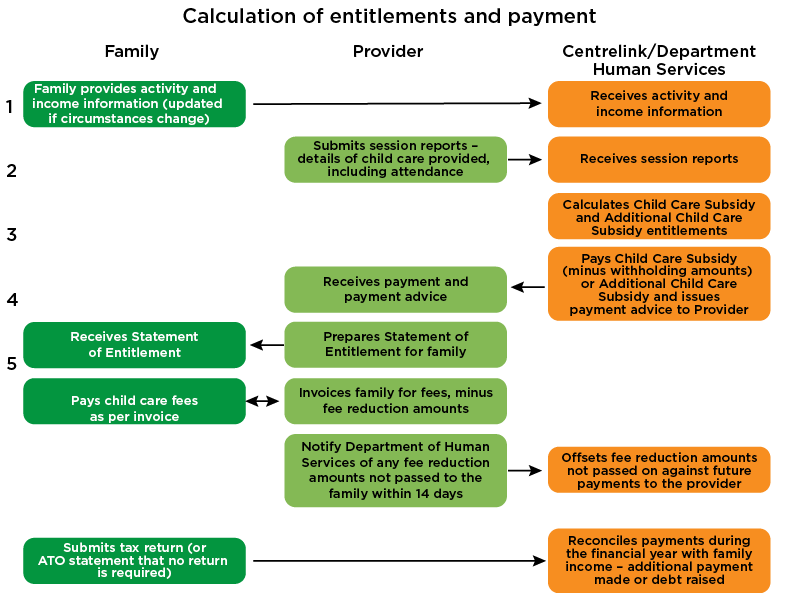
Source: Department of Education and Training Provider-service information presentation (PowerPoint)
The Department's website was a central element of the strategy being a repository of information for families and services about the Child Care Package, with information added and updated over time. As at 30 June 2018, there had been 842,052 unique page views of the department's campaign website since the beginning of the campaign.
In addition to these communications activities, the Department of Education and Training held information sessions for families via webcasts in November 2017, and April and May 2018. Six webcasts were held in total. Information for families was also disseminated via child care services and providers who received materials to share with families, and materials that they could use to assist families to prepare them for transition.
The Department of Human Services also undertook their own communications activities, including emails, mail outs, text messages, and social media, as well as reminders through MyGov and participation in activities organised by the Department of Education and Training.
Sector information and support for parents
In addition to communication and resources received directly from the Departments of Education and Training and Human Services, many services and service organisations provided information and support to parents about the new package and the activities needed to transition to the new system. Services and providers approached this in multiple ways from sharing resources, sending links to information provided by others, and providing reminders and assistance to make applications, through to making enquires of Department of Education and Training in relation to complex issues or specific circumstances relating to families at their service.
Pre-July 2018 parental sources of information and understanding of Commonwealth financial support for child care costs
In considering this activity it is relevant to consider how families had traditionally sought or obtained information about child care subsidy or fee assistance. The Baseline Parent Survey, conducted in May 2018, asked parents how they found out about government child care fee assistance (Child Care Benefit/Child Care Rebate (CCR)). The main source of information was Centrelink with 51 per cent reporting this source of information, followed by word of mouth with 31 per cent reporting this source of information. (Note that this survey did not include an option for communication from child care providers, which was the top-ranked source according to the later CCPFamS - see analysis of this survey in a subsection that follows.)
| Information source | Used (%) |
|---|---|
| Centrelink | 51 |
| Word of mouth | 31 |
| Mychild.gov.au | 12 |
| General web search | 6 |
| Advertising | 4 |
| Other | 7 |
| Did not report using any information sources | 15 |
Source: Baseline Parent Survey, May 2018.
Note: Parents could select multiple sources of information.
The Baseline Parent Survey also allows reporting on parents' understanding of child care fee assistance at May 2018. The data collected shows that a significant proportion of child care users reported that they did not find it easy to access or understand child care fee assistance. Just over one-third agreed or strongly agreed that they found it easy to get government information about child care fee assistance, one-quarter neither agreed or disagreed, and just over one-third disagreed or strongly disagreed. The lowest level of agreement was with the statement 'it was easy to understand government information about child care fee assistance' with just 2 per cent strongly agreeing this was the case and 22 per cent agreeing. In contrast, 20 per cent strongly disagreed with the statement that it was easy to understand the government information, and 36 per cent disagreed.
Figure 6.3. Ratings of agreement about child care fee assistance in May 2018
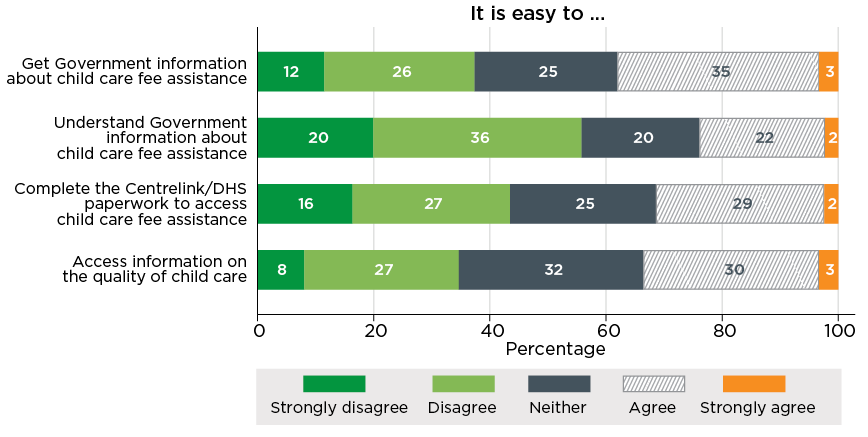
Source: Baseline Parent Survey, May 2018.
Note: Includes those using formal child care.
Parent awareness of the package
The Baseline Parent Survey also collected information on parents' awareness in May 2018 of the changes to child care fee assistance. The data collection for the survey coincided with government and child care sector communications activities about the changes to the child care system.
Data from the Baseline Parent Survey records 86 per cent of families using paid child care reporting that they were aware that the child care system was changing. There were however some differences in awareness across families (see Figure 6.4):
- Parents using child care who had a youngest child aged 2 years and under were the most likely to be aware of the changes (94 per cent), followed by those with a youngest child aged 3 to 5 years (89 per cent) and those with a youngest child aged 6 to 12 years (73 per cent).
- Couple families in which both parents were working were more likely to report being aware of the changes (89 per cent) compared to other families (82 to 83 per cent).
- Awareness was significantly lower (70 per cent) among the 10 per cent of families who reported receiving no Government subsidy at the time of the survey.52
- Awareness of the changes was higher among Long Day Care users (94 per cent for those using Long Day Care but no Outside School Hours Care, and 91 per cent for those using both Long Day Care and Outside School Hours Care). Next most likely to be aware were Family Day Care (FDC) users (78 per cent) and those using Outside School Hours Care but not Long Day Care (77 per cent). Families who did not use any of these care types, but used other sorts of paid care such as Occasional Care, were the least likely to be aware of the changes (62 per cent).
- Awareness of the changes was lowest for those on the lower incomes of less than $64,000 per year (83 per cent), compared to 88 to 89 per cent for higher income families.
Figure 6.4. Parents' awareness in May 2018 of July 2018 changes to child care
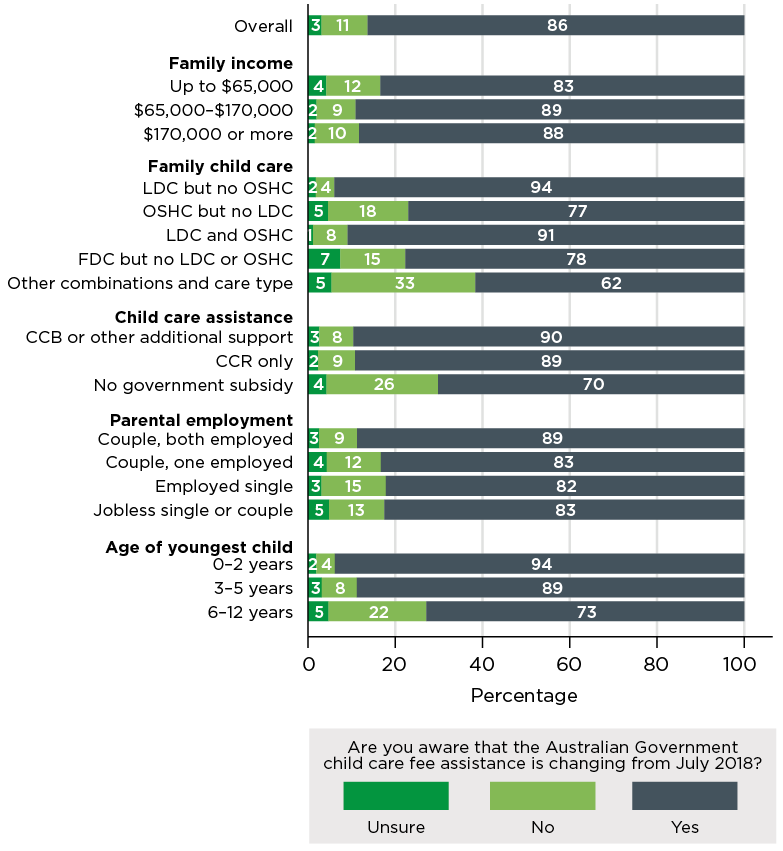
Source: Baseline Parent Survey (families using child care). May 2018.
Note: For the Family child care variable, each of the first three (combinations of Long Day Care and Outside School Hours Care), families may be using Family Day Care or other care types as well. For the fourth (Family Day Care but not Long Day Care or OHSC), families may be using other care types. Most of those in the 'Other combinations and care types' were using either Occasional Care or paid care that does not attract government subsidy such as nannies and babysitters.
Information sources used by parents
The CCPFamS (collected in November 2018 after the package had commenced) asked families about all of the sources of information they had used to find out about CCS and the actions they needed to take in order to transition to the new arrangements.53 The proportion using each source of information, ranked by the level of usage, was:54
- 64 per cent - Formal communication from child care providers (e.g. emails, newsletters)
- 30 per cent - Centrelink website
- 27 per cent - Information put out by the Government through TV, radio or other advertising
- 21 per cent - Informal communication from my child care service (e.g. conversations with staff)
- 15 per cent - Family, friends or other parents
- 10 per cent - Information put out by the Government on social media
- 6 per cent - Department of Education and Training website
- 3 per cent - Centrelink help line.
As indicated, the most frequently used source was the persons' child care service, although, 55 per cent of parents reported using at least one of the Government sources of information.55
Some respondents also commented on the quality and accessibility of the information available. While parents who reported negative views and experiences about the package overall were more likely to provide additional comments, some parents did comment that they found the information was easily accessed and understood.
I attended an information session run by a Centrelink outreach officer regarding the new CCS - it was good that this service was offered.
~ Middle-income family, Long Day Care, Family Day Care, Outside School Hours Care
The phone staff were helpful though when I called and I was surprised that the call centre wait times were very reasonable during this period.
~ Middle-income family, Long Day Care
Parents who reported challenges in accessing or understanding the information provided tended to speak about difficulties in accessing information via the phone or that they found the websites where information was held difficult to navigate.
It is impossible to get through to Centrelink via phone. They are always engaged. This makes it impossible to get information.
~ Middle-income family, Long Day Care
Centrelink website is extremely difficult to navigate. When I eventually found what I was looking for, it wasn't very easy to understand. I have a university degree and struggled to understand what was written, I think someone with lower education would struggle a lot more
~ Middle-income family, Family Day Care
Others sat somewhere in the middle suggesting that while they were aware of the changes and knew what was required of them, some of the forms and information they needed to provide was confusing.
I felt like I mostly understood the changes but have to admit when filling out the application I didn't understand some questions because of the complicated wording used and therefore just hoped what I did was correct and that it would work.
~ Middle-income family, Family Day Care
Use of the online subsidy estimator in the lead-up to implementation
Prior to the transition to the Child Care Package, online estimators were available to help parents determine their eligibility for child care assistance under the new arrangements. The first phase of Department of Education and Training's communication strategy during 2017 encouraged use of the online estimator available through the department's website to determine how their child care assistance would change with the introduction of CCS. Additional estimators were also available through some peak and provider organisations (e.g. Australian Childcare Association and Family Day Care Australia).
In the second phase (from April 2018) of the communication strategy, the Department of Human Services Payment and Service Finder was enabled, and the Department of Education and Training estimator was disabled. The Department of Human Services Payment and Service Finder continues to be available.
In the Baseline Parent Survey (in May 2018), parents were asked about their use of the Department of Human Services estimator. About one-third (31 per cent) reported that they had used the estimator. While the question referred to the estimator offered by the Department of Human Services (the Payment and Service Finder), it likely that many respondents would not distinguish between the estimator provided by one government department and an estimator provided by another, and as such may have simply answered yes if they had used either of the two departments' calculators.
Differences in in reported use of the calculator include (Figure 6.5):
- Parents whose youngest child was 2 years or younger were much more likely to have used the calculator than those whose youngest child was 3 to 5 years, who were in turn more likely to have used it than parents whose youngest child was aged 6 to 12 years (39 per cent, 31 per cent and 19 per cent respectively).
- Long Day Care users were most likely to report having used the online estimator, with 38 per cent of parents using the tool, compared to 24 per cent who used Family Day Care only, 20 per cent for Outside School Hours Care only, and 7 per cent for those who used other devices or combinations of services.
- The level of use of the estimator increased with income, rising from 24 per cent for parents with a household income of less than $65,000 per annum, to 33 per cent of those with a household income $65,000 to $170,000 per annum, and 39 per cent of those with a household income of $170,000 plus per annum.
- By type of government child care support reported use of the estimator, was highest among those in receipt of Child Care Rebate only (35 per cent), with those receiving Child Care Benefit or other additional support reporting a utilisation rate of 32 per cent. In contrast the sub-population who reported not receiving any government subsidy at the time of the survey56 also reported the lowest rate of use of the calculator, 19 per cent.
- Dual working parents were more likely (34 per cent) to have used the estimator compared to jobless couple parents, couple parents with one parent employed and single parents where the level of use ranged between 24 per cent and 27 per cent).
Respondents to the later survey of families (in November 2018) were asked to reflect on their experiences of accessing the calculators. The comments provide some insights into the challenges some had experienced in using these calculators.
It's been a while now, but I do remember being confused about how it would all work in reality etc. And before it was implemented no one had any idea about who would get what percentage rate- it caused a lot of additional stress - until I found a calculator online - NOT through the DHS, which really wasn't helpful to people who really needed to know what was going to happen for their budgets.
~ Low-income family, Long Day Care
I used to use the Childcare calculator to work how the costs would change if I worked more or less. The website seems to have changed (sometime before the transition) and now it is far less helpful. Having to answer questions to see what payments I might be eligible for before being able to move to the calculator I was hoping to quickly pop some figures in.
~ Middle-income family, Long Day Care
Figure 6.5. Parents' use of the Department of Human Services online estimator, May 2018
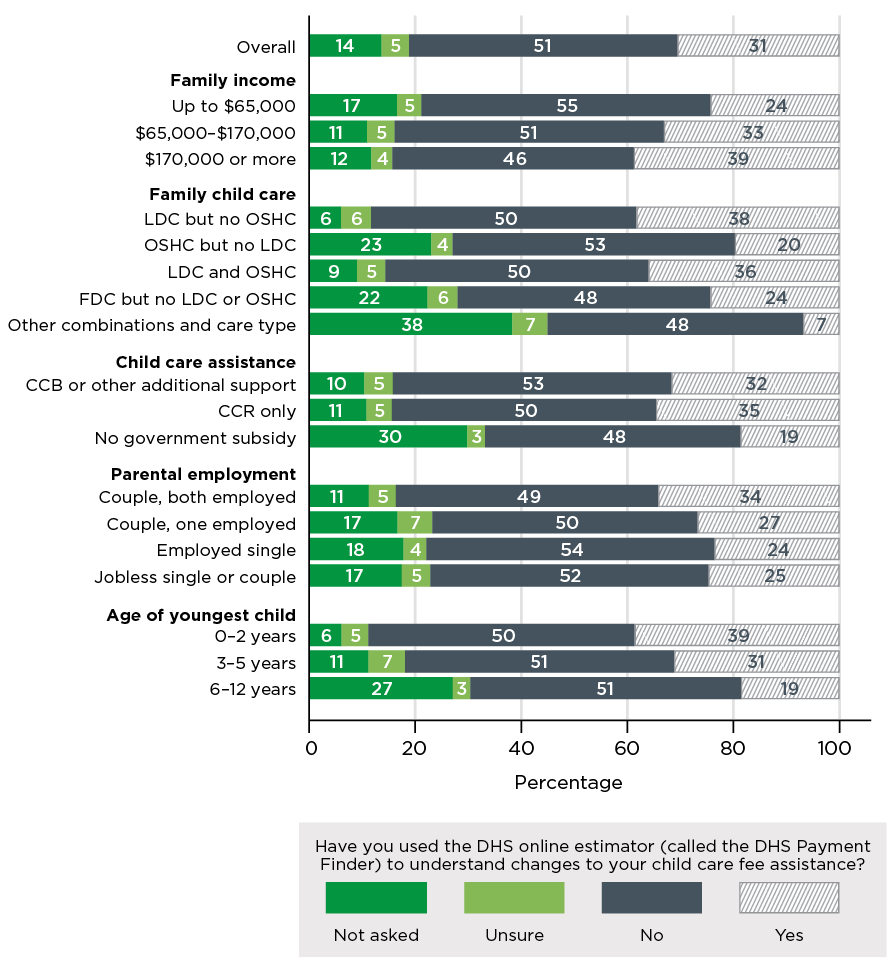
Source: Baseline Parent Survey (families using child care). May 2018.
Note: Respondents who previously indicated they were not aware of the changes to child care were not asked this question (and are shown here as 'Not asked'). For the Family child care variable, each of the first three (combinations of Long Day Care and Outside School Hours Care), families may be using Family Day Care or other care types as well. For the fourth (Family Day Care but not Long Day Care or OHSC), families may be using other care types. Most of those in the 'Other combinations and care types' were using either Occasional Care or paid care that does not attract government subsidy such as nannies and babysitters.
6.3 Family experiences of the transition
Information on families' experiences of the transition was captured in two waves of the LinA survey conducted very shortly after the transition and in the November CCPFamS.
The July 2018 wave of the LinA survey asked families who were using paid child care the question: 'For your family, was the process of applying for the new child care fee assistance (which commenced from 2nd July 2018) easy or difficult?'. 57 As the survey was conducted in the same month as the new arrangements were introduced, it is considered that it provides a good contemporaneous, rather than retrospective insight into the experience.
In response, 22 per cent of users of child care reported it to be 'very easy', 49 per cent 'quite easy', 19 per cent 'quite difficult' and 10 per cent 'very difficult'. Less than 1 per cent reported that they had not yet applied. Analysis of these data suggest that those with tertiary education of Bachelor degree or higher were more likely to report finding the process as being difficult (36 per cent) relative to those with a diploma, certificate or secondary education only (24 per cent). While this may be a spurious result due to the sample size, it could also be reflective of other factors such as a lesser knowledge of MyGov by those with higher education (and incomes), or potentially this population having a more critical perspective on consumer and other IT systems and interfaces. Comparisons of responses by characteristics such as educational attainment, gender and household structure were not statistically significant, likely reflecting the small sample and resultant high sampling error.
This initial insight from LinA of a relatively positive transition experience for most, but not all families was confirmed in the CCPFamS conducted a few months later. In CCPFamS, parents were asked to state the level of their agreement or disagreement with a series of four statements about the transition and the actions they were required to undertake as part of this (Figure 6.6).
Figure 6.6. Transition experiences of parents
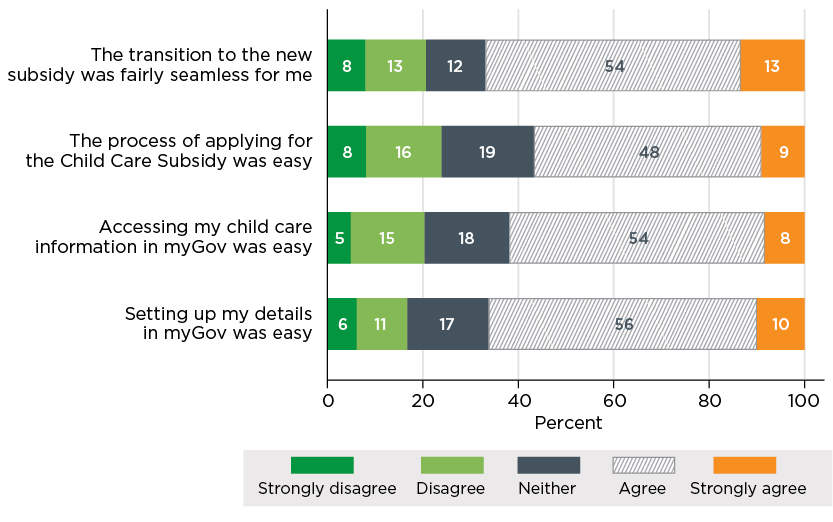
Source: CCPFamS, November 2018.
Note: Excludes missing and don't know responses. n = 446 to 456
As shown in the Figure the balance of responses was toward parents being more positive about the experiences, although for each statement around one in five expressed more negative views:
- 67 per cent agreed or strongly agreed that the transition was fairly seamless
- 57 per cent agreed or strongly agreed that the application process was easy
- 62 per cent agreed or strongly agreed that accessing their child care information in myGov was easy
- 66 per cent agreed or strongly agreed that setting up their myGov was easy.
While most families reported a fairly straightforward transitions experience, a sizable proportion disagreed that the processes were easy. A review of the comments provided by respondents suggests difficulties largely centred on the process of engaging with Centrelink to put in their applications.
I had to provide details over 5 times because the information was not taken by the [MyGov] app.
~ High-income family, Long Day Care, Outside School Hours Care
I put in my application for the new Child Care Package very early but there were several processing issues that Centrelink could not identify or rectify for months. In the end, my application only got approved the week of the new benefit even though my application was initially completed several months beforehand.
~ Middle-income family, Long Day Care
I updated my details and was then charged full fees by my child care provider. They told me to contact Centrelink. I called more than 20 times. This is not an exaggeration. In the end I went into the centre and waited over an hour. I had to then return to work. Kept calling until finally I spoke to a real person, not an automated robot.
~ Middle-income family, Outside School Hours Care
Almost four out of five families (78 per cent) had MyGov accounts prior to the child care changes, however there was no difference in agreement on the ease of the transition process for those who had not previously used the MyGov platform. Further, analysis considering factors such as child care use, household income, age of youngest child, child care assistance receipt, and parental employment status, did not find any strong associations between these characteristics and the transition experience.
6.4 Families' understanding of child care assistance since July 2018
Accessing and understanding child care assistance information
The CCPFamS also asked families how easy they felt it was to understand government information on child care and whether they knew where to go if they had questions about the new Child Care Subsidy. Figure 6.7 shows the responses to these two questions. Across all parents:
- 31 per cent agreed or strongly agreed that it is easy to understand Government information about child care assistance, while 47 per cent disagreed or strongly disagreed
- 44 per cent agreed or strongly agreed that they knew where to go to with questions about the child care subsidy, while 33 per cent disagreed or strongly disagreed.
Figure 6.7. Parents' understanding of government information on the new Child Care Package and where to gain assistance, November 2018

Source: CCPFamS, November 2018.
Note: Excludes missing and don't know. n = 451-458
The response to the question on ease of understanding suggests that, notwithstanding the effort that was put into the communications strategy, many families, even when they did access information, did not find it easy to interpret. A question from this for further consideration in the evaluation is whether this reflects problems with the material provided to these parents, the complexity of the new arrangements, or simply the quite different framework associated with the new package, making it difficult for parents to translate their current understanding to the new arrangements. Notwithstanding the explanation these findings have some resonance with the reported concerns of services, in the Baseline SELCS, about families' lack of understanding of the Child Care Package.
While these results suggest that many parents faced a challenge in understanding information about the new Child Care Package, a slightly different perspective is gained if compared to the May 2018 Baseline Parent Survey responses. In the May survey, parents were asked for their agreement with the statement 'it is easy to understand Government information about child care assistance'. Overall, 21 per cent agreed or strongly agreed with this and 62 per cent disagreed or strongly disagreed. In November 2018, the proportions were 31 per cent agreeing or strongly agreeing and 47 per cent disagreeing or strongly disagreeing. This points to a very marked increase in the proportion who consider that government information on child care is easy to understand. Again though, trying to interpret this is difficult. It is not clear for example the extent to which the first survey was picking up responses to information on the program that applied at the time, or information about the new. To the extent parents were responding in May about the new program, this type of response can be seen as consistent with a maturing understanding. Such an effect may have been further complicated as the May 2018 survey was held when transition to the new system was imminent and people were being provided with a large amount of information about the changes, potentially leading to information overload. If, on the other hand, people were responding on a comparative basis relative to the old arrangements, this improvement might be reflective of the extent to which the movement to a single payment has simplified the system from a user perspective.
Understanding of specific aspects of the package
The CCPFamS also asked families about their understanding of five specific aspects of the child care subsidy. These were: eligibility for CCS; how income affects CCS; how activity affects CCS; what to do if circumstances change; and the 5 per cent withholding of CCS. This has particular relevance to the evaluation of the package, as one of the key aims of the package was to implement a package of child care assistance that was simpler than the previous arrangements. Responses are illustrated in Figure 6.8.
The strongest level of understanding was reported by families to the question about their obligations in reporting changes of circumstances with some 47 per cent of parents reported that they well, or very well, understood what they needed to do, along with a further 31 per cent reporting they 'somewhat understood' their reporting requirements. At the same time 22 per cent - more than one in five of parents said they did not understand it at all, or did not understand it very much. This can be considered to be a significant gap, given the importance of reporting changes in circumstances for both avoiding overpayments and in ensuring that adequate support is provided if the change in circumstances might render the parent eligible for further assistance.
The lowest level of reported understanding concerned the 5 per cent withholding. Here only 28 per cent of families reported that they understood this well or very well, with 50 per cent reporting that they did not understand it at all, or did not understand it very much. Turning to the other questions the second highest level of understanding and second lowest level of non-understanding concerns the impact of income on CCS entitlement, followed by the impact of hours of activity, and then the broader question on understanding eligibility. Multivariate analysis of these responses did not identify any significant associations with specific family characteristics.
Considering these responses in aggregate the survey found that 63 per cent of parents reported that they did not understand at all, or did not have much of an understanding, of at least one of these five elements. Conversely only 11 per cent reported understanding all elements well, or very well. This result can be considered as somewhat concerning, and while understanding of aspects of the system may improve with experience, the extent of the current gap in understanding suggests a need for an ongoing investment in support and information.
Figure 6.8. Parents' understanding about specifics of the child care subsidy
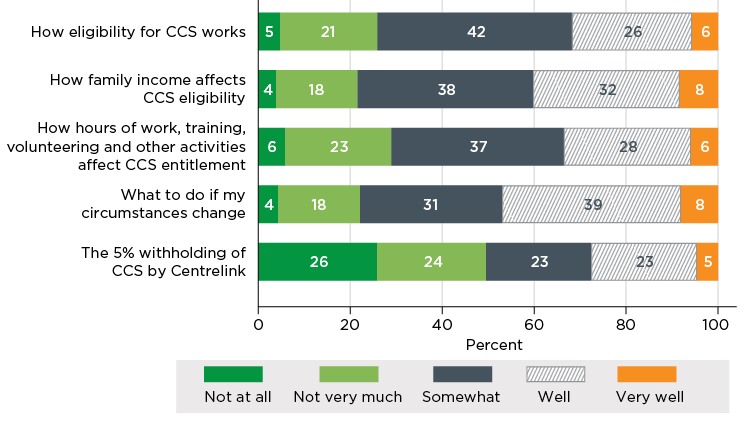
Source: CCPFamS, November 2018.
Note: Excludes missing responses, n = 460
Comments by survey participants in the CCPFamS provided not just insight into families' understanding, but also the way in which information is sought and exchanged. For example:
To be honest, my knowledge about CCS is very limited. And surprisingly, it's not just me, but many other parents are as unfamiliar as me. I have seen mum's gather around and talk about CCS, ask questions, surprise about how attendance would affect the benefits, how sick leave is also considered as absent. I could not really work out how the 5 per cent withholding work. Or if I could be entitled to other benefit etc.
~ Middle-income family, Long Day Care
In the CCPFamS, parents were also asked questions about their understanding of the subsidy their family receives, specifically the subsidy rate, and the number of subsidised hours to which they were entitled. While almost all parents were able to provide details of the subsidy percentage,58 when asked how many hours of subsidy they were eligible for, nearly half (46 per cent) of survey parents reported they did not know. Analysis indicates a greater awareness of the number of subsidised hours among couples with one parent not employed (65 per cent) and in jobless households (69 per cent), those groups most likely to be affected by the activity test.
Understanding of child care costs
One indicator of whether families find child care subsidies simple is the extent that they understand how much they are paying for child care. Survey responses indicate most parents are. In the May survey 75 per cent agreed or strongly agreed that they knew how much child care was costing them. As at November 2018, in the CCPFamS:
- 75 per cent of parents agreed (or strongly agreed) with the statement 'I know how much child care is costing me'
- 14 per cent disagreed or strongly disagreed
- 10 per cent neither agreed or disagreed.
This suggests that, at least during the early implementation phase, there has been no major change in the level of parental understanding of what child care is costing them.59
A number of respondents commented positively about the new subsidy arrangements, typically citing the change from two to one payments:
I feel it's easier to have one payment instead of the CCB and CCR, to me it is easier to predict costs.
~ Low-income family, Long Day Care, Outside School Hours Care
Overall I feel the new changes make for a more understandable system. The last one was very confusing, with A and B etc.60
~ High-income family, Long Day Care
Some families however commented that they were less able to understand their costs, with their subsidy varying from week to week. These families tended to express concerns about accruing debt.
I appreciate we now pay less in fees, but the calculation is confusing and I am worried we are under paying and will owe at the end of the year.
~ Middle-income family, Long Day Care, Occasional Care
More streamlined. but as our family income is near the cut-off for the cap, we are being cautious as we don't want a debt.
~ Middle-income family, Long Day Care
The process was made more difficult because I am a contractor with variable income and this is difficult to estimate as I've just come off maternity leave; I wanted to avoid having a debt to Centrelink so I over-estimated my income.
~ High-income family, Long Day Care
When asked about updating child care information on MyGov, the majority of families, 65 per cent, said they had updated their details since July 2. Considering those families which have updated details around one in three had updated their details more than once (20 per cent of all families). For most families who had made updates, updates were related to income, with 38 per cent of these families reporting updating both income and activity details and 21 per cent reporting updating income details but not activity details. Other reasons for the updates were not captured in the survey.
6.5 Changes to child care costs
Improving the affordability of child care for low and middle-income earners is one of the key objectives of the new Child Care Package. This section provides some early findings about perception of how child care costs changed for families since the 2 July 2018 changes. Given the relatively short time period since the transition to the new child care system caution is needed not to interpret these as the whole effect will depend upon fee changes, and potentially changes in session structures, these will take time to emerge. Chapter 2 provides a discussion of the ABS Consumer Price Index data on the very short-term changes in child care costs. The CPI data suggests that in the quarter following the introduction of the CCS there was a 11.8 per cent decline in the net cost of child care.
In the August 2018 LinA survey, parents who had used paid child care in the previous six months61 were asked 'In July 2018, the government changed the funding arrangements for child care and some services changed their charges. For you and your family, has this change...? Increased the cost of child care/decreased the cost of child care/made no difference to the cost of child care?'. Just over one third, 37per cent, said the cost had increased, 36 per cent that it had made no difference and 27 per cent that it had decreased the cost for their families.
The small sample size prohibits the calculation of reliable estimates based on more detailed analysis, but there was a distinct pattern of reported increases in costs across households classified by income (Figure 6.9). The proportion reporting increased costs was 9 per cent for households with an annual income below $65,000, 30 per cent for those with an income of $65,000 to $156,000, and 48 per cent for those with an annual income of over $156,000. While the difference between the highest and lowest income households was statistically significant, other differences were not. Conversely the proportion reporting decreased costs was 35 per cent for families on incomes under $65,000, falling to 21 per cent for those with incomes over $156,000.
Figure 6.9 Impact of changes in child care funding on costs for families by family income range, August 2018
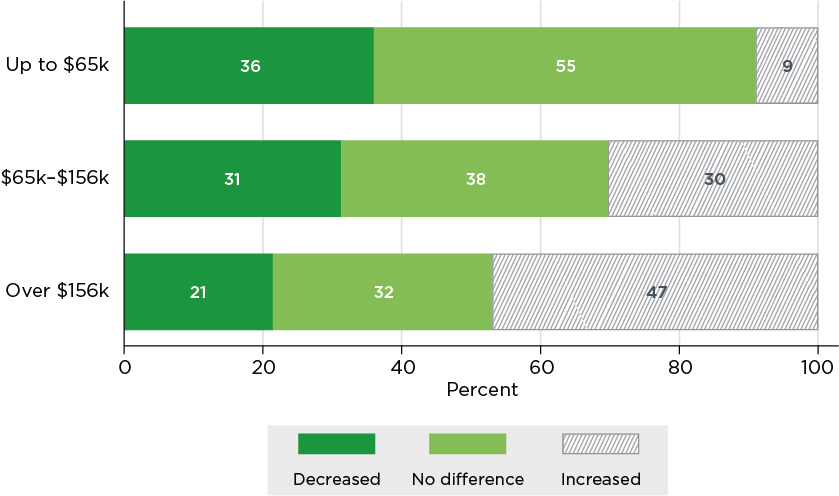
Source: LinA, Wave 19.
Note: There are 27 respondents with a household income of up to $65,000, 63 with a household income of $65,000 to $156,000 and 76 with a household income of over $156,000. Excludes those with not stated household income.
Parents' perceptions of the impact of changes in child care costs were also the subject of questions in the CCPFamS which captured the effect to November 2018. The distribution, see Table 6.2, shows the population being divided into three, almost equal, sized groups with about one in three reporting they paid about the same amount in child care costs in November as they did prior to the introduction of the package, about one in three reporting lesser costs and about one in three reporting higher costs. To the extent people reported either paying more or less they were more likely to describe the change in terms of being a little more, or a little less, rather than a lot more or a lot less. In broad terms the data from this survey is similar to the LinA findings, although with a higher proportion reporting decreased costs.
| Compared to costs pre 2 July families are paying | % |
|---|---|
| A lot less | 13.4 |
| A little less | 18.7 |
| About the same | 31.1 |
| A little more | 23.2 |
| A lot more | 13.6 |
| Total | 100.0 |
| Number of respondents | 418 |
Source: CCPFamS, November 2018.
Note: Missing, don't knows and prefer not to say responses are excluded.
More detailed analyses of these data will follow in subsequent reporting. Initial examination by household income, as presented in Figure 6.10, shows that while a strong majority of families on incomes below $170,000 reported they were paying about the same or less than they had pre-July, some 65 per cent of families earning over $170,000 reported paying more, with 35 per cent reporting that they were paying a lot more. Of families with incomes below $65,000 42 per cent reported paying less, with half of these reported paying 'a lot less'. A quarter of these respondents (24 per cent) though reported paying more, including 8 per cent reporting that they paid 'a lot more'. In the middle-income group 32 per cent reported paying about the same and 46 per cent either a little bit more or a little bit less, with approximately equal proportions in each of these groups. At the extremes, however, while 6 per cent reported paying a lot more, this was strongly outweighed by the 15 per cent reporting that they paid a lot less.
Figure 6.10. Changes to child care costs from pre-July 2018 to November 2018 by annual family/household income

Source: CCPFamS, November 2018.
Note: Number of respondents to the questions is 401. Missing, don't know and prefer not to say responses are excluded.
In interpreting these changes, it should be noted that changes to the cost of child care for families can reflect multiple factors in addition to changes to child care assistance. These include changes in fees charged by services, or changes in the amount of care used.
6.6 Changes in families' child care use
Families were asked two questions about changes in the use of child care since July 2.
The first question asked respondents if their family had made changes in their use of child care since July, and whether those changes were related to changes in services' offerings in child care, or related to work changes or for other reasons. Overall, 71 per cent reported that they had not made major changes to their child care arrangements.62
About three in ten reported that they had made major changes to their child care arrangements since the introduction of the new Child Care Package. Of these, about half said it was due to the cost of care, with other reasons including changes to employment or family circumstances such as a new baby, increased grandparent availability.
Of the 14 per cent of families reported making a major change in care due to the cost of child care:
- 59 per cent reported using less formal care in November, compared to pre-July
- 26 per cent reported using more care in November
- 15 per cent reported using similar amounts of care in November and before July, but made changes such as swapping days or changing centres.
Reducing time in paid care, for some, was accommodated by making changes to informal care arrangements, with additional days with grandparents or other family members being mentioned in comments by families. About half (49 per cent) of the parents who reported using less care than previously said that they had made changes to their informal care arrangements.
A second question related to changes to the amount of formal care used. Most families reported that overall they were using about the same amount of child care from pre-July 2018 to November 2018 (70 per cent). The balance comprised 19 per cent who reported using less formal child care and 11 per cent using more. (Table 6.3).
| Compared to before July | % |
|---|---|
| We use much less formal care now | 7.6 |
| We use a little less formal care now | 11.3 |
| We use about the same amount of formal care | 70.4 |
| We use a little more formal care now | 8.3 |
| We use much more formal care now | 2.4 |
| Total | 100.0 |
| Number of respondents | 459 |
Source: CCPFamS, November 2018.
Note: Excludes missing and those not previously using formal child care.
Cost of care was the predominant issue referenced by parents when elaborating on their changed care arrangements with both positive and negative effects being cited:
Increased our private nanny's hours to replace long day care. It is no longer financially sensible to have 2 x children in long day care - it costs less to pay a private nanny.
~ High-income family, Long Day Care
Due to the child-care changes, our cost of childcare has increased significantly. We have had to reduce our childcare, which has impacted our work routines.
~ High-income family, Long Day Care
[we changed child care arrangements] because the Government cap went from $7,500 to $10,000 which meant we could afford to put our children in for another day. Plus, we have seen improvement in our son who has speech difficulties due to the extra interaction with his teachers and peers.
~ Middle-income family, Long Day Care
The CCPFamS captured more detailed information about the care used by children within families, the cost of that care, and the child care assistance received, which will be further examined. This will allow more careful examination of the ways in which families are experiencing the Child Care Package, and will be especially valuable when later waves of this survey are conducted so that change in care use and costs can be analysed, in conjunction with any changes in parents' activities including employment.
6.7 Early findings about parental employment and the activity test
A key objective of the Child Care Package is to better support parents' participation, with an ultimate objective of enhancing the engagement of parents with employment.
At May 2018, in the Baseline Parent Survey, parents were asked if they had already made changes to their work arrangements in anticipation of the child care changes, with 8.6 per cent of parents indicating that they had. Details of what these changes were was not collected.
The LinA survey in August 2018 sought to identify whether the change in subsidy arrangements had impacted on the work, study or other activities of parents. Some 77.4 per cent of parents reported no impact, 14.0 per cent reported an impact on work (9.1 per cent of males and 19.6 per cent of females) and smaller percentages reported impacts on study or other activities (Table 6.4).
| Impact | Male | Female | All |
|---|---|---|---|
| - % - | |||
| No Impact | 79.7 | 76.2 | 77.4 |
| Work | 9.1 | 19.6 | 14.0 |
| Study | 6.8 | 4.5 | 4.8 |
| Other | 0.3 | 4.3 | 2.5 |
| Total | 100.0 | 100.0 | 100.0 |
| Number of respondents | 65 | 119 | 184 |
Source: LinA, Wave 19, August 2018.
Notes: Differences between males and females were not statistically significant. Respondents could indicate they changed work as well as study, or other arrangements.
Those in LinA who reported an impact of the changed subsidy were further asked whether this involved an increase in work or study hours, a decrease in work or study hours, or a change in the pattern of their activities. Limitations on sample size preclude calculation of reliable estimates, but among those that reported changes, more reported an increase in hours than either a rearrangement of hours, without any impact on the number of hours worked, or a decrease in hours. All parents who reported an impact on study reported that it was in terms of reduced hours.
In the CCPFamS, at November 2018, parents were asked if they had made a change to employment or other approved activity since July 2018. Most had not (83 per cent). Just under one in five (17 per cent) families reported a change to employment or other approved activities since July. Of these, one in three reported that those changes were directly related to child care.
Families that had changed their employment or other approved activities were asked to explain these changes. Most changes were to work arrangements and hours, although a few mentioned either increasing or decreasing volunteering. While some reported increasing their number of days at work, others had reduced hours.
Examples of family responses include:
… because we get penalised continually because of our income we receive minimal assistance despite the fact we both work full time, one parent away the majority of the time. We have two older children who need to be cared for and funded this is not taken into account in any income estimations at all, there is little motivation to be a working family. If you are middle-income earner you are shafted at every turn.'
~ High-income family, Outside School Hours Care
Our costs doubled overnight. This has impacted on our family expenses drastically. As a result we are using less child care, I have reduced my work days to reduce our child care expenses and I will not work the hours I would like for quite a few years because the expense of childcare is too drastic. This impacts on my career and reduces the tax we pay as a family…
~ High-income family, Long Day Care, Outside School Hours Care
The nature of the data collected, and the small number having reported changing arrangements, has imposed very strong limitations on the capacity of analysis to derive, from this source, robust estimates of how work and activity levels have so far been affected by the Child Care Package. Further analysis of the CCPFamS, and further waves of this survey, along with the use of administrative and wider survey data as well as modelling will allow this to be explored further.
6.8 Other early views and observations about the Child Care Package and families
In the CCPFamS people were asked for their impression of the overall impact of the Child Care Package for their family - with options of 'entirely positive' through to 'entirely negative'. As noted, this was at a time when they had had about four months of experience of the Child Care Package.
In general, there was a strong tendency towards a positive assessment with 41 per cent reporting the new Child Care Package to have been mostly (31.6 per cent) or entirely (9.1 per cent) positive for their families, as opposed to 23.0 per cent of families who perceived the impact to have been mostly (13.0 per cent) or entirely (10 per cent) negative. Another very significant percentage (36.4 per cent) reported that it had neither been positive or negative, see Table 6.5.
| For your family, the changes have been | % |
|---|---|
| Entirely positive | 9.1 |
| Mostly positive | 31.6 |
| Neither positive or negative | 36.4 |
| Mostly negative | 13.0 |
| Entirely negative | 10.0 |
| Total | 100.0 |
| Number of respondents | 462 |
Source: CCPFamS, November 2018.
Note: Excludes missing, don't know and prefer not to say responses.
The perceived impact of the changes differed by household income (Figure 6.11) with 18 per cent of those in lower income households reporting the impact to be entirely positive and another 42 per cent mostly positive. Only 15 per cent reported the impact as mostly, or entirely negative, with one in four describing it as neither positive or negative.
In contrast the changes were seen as having a much more negative impact by higher income households with 24 per cent reporting the changes had been entirely negative and 21 per cent mostly negative, and only 20 per cent reporting it was entirely or mostly positive.
Figure 6.11. Perceived impact of the Child Care Package, by household income
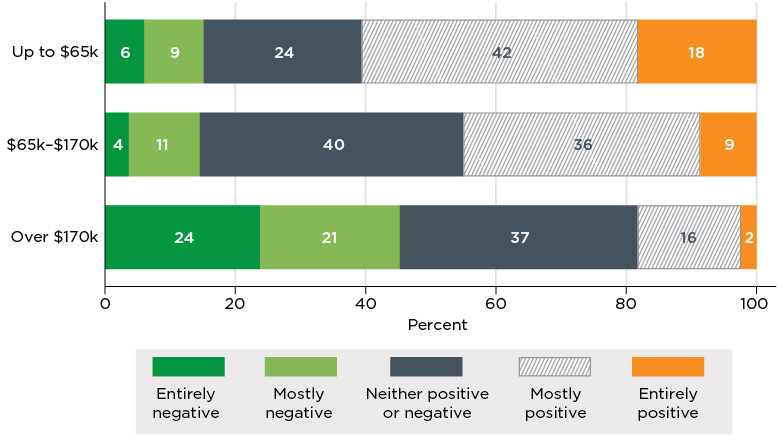
Source: CCPFamS, November 2018.
Note: n = 445 excludes missing, don't know and prefer not to say.
These responses were also subject to multivariate analysis to identify the extent to which there were associations between family characteristics and perception of the impact of the new Child Care Package. The two models used are at Table A.6.1. The first model, which only contained family and household characteristics, found no significant relationships other than for families using formal care types other than Long Day Care, Outside School Hours Care or Family Day Care, and for those with a combined household income over $170,000.63 The second model incorporated households' perception of the change in their child care costs. This is a strong and significant predictor of families' assessment of the impact of the package. That is, when asked about the impact more broadly, it appears that families, in large part, are responding in financial terms.
6.9 Summary
This chapter reports on families' experiences of the transition to the new child care system using data collected from parents before and after the transition in July 2018. Specific issues considered include the extent to which parents were provided with the appropriate information and supports to transition to the new system, and some of the early impacts of the new package on costs and usage of care.
In the months prior to the transition to the new system, there was a high-level of awareness among child care users that the child care system was changing, particularly among those with preschool aged children. While most parents had accessed information about the changes prior to the transition, they did not always find the information useful or easy to understand and many found the government information portals difficult to navigate and understand. An important source of information to families about the changes was their child care service.
While in general parents thought they had a good understanding of the new system, there is a significant group that did not, and only a small group appeared to have a systematic understanding of the details of the system. Overall, most found the transition to the new arrangements to be relatively seamless although almost a quarter did not.
There was no change associated with the introduction of the new package on the proportion of parents who said they know how much child care is costing them. With respect to the impact of the package around a third of parents said they paid more for care after 2 July 2018, one-third reported paying less, and about one-third third said there had been no change. Most of those who reported paying more were higher income earners. This is not inconsistent with expected impact of changes to means testing. While a significant proportion of parents reported changes to their use of child care this was triggered by a range of factors of which child care affordability is just one. There is, however, a tentative suggestion of some reduction in the use of formal child care (i.e. provided by services) with a greater use of informal care (grandparents) or nannies.
While it is too early to draw any significant conclusions, there is an indication that for some the changes to the child care system have increased work activity for some, but decreased it for another (potentially smaller) group. This will be a major focus of later parts of the evaluation.
Overall, about 40.7 per cent of families were positive about the impact of the new child care system, a third were neutral and 23.0 per cent were negative, with these perceptions for all groups being somewhat associated with whether or not they considered that their child care costs had increased or decreased.
50 When reporting on responses to the Baseline Parent Survey, LinA and Child Care Package Families Survey we refer to parents as the respondents. While some respondents may have a different relationship to the children who they are responding about (such as grandparent), most are parents and for simplicity we report by referring to respondents as parents throughout.
51 Communications activities undertaken by the Department were informed by research undertaken by ORIMA in 2015 and 2017. This research reported that families lacked awareness of and understanding about the then upcoming changes (Department of Education and Training, May 2017).
52 Documentation on the Baseline Parent Survey does not provide a clear explanation of the circumstances of this group. While it may include some parents who have not sought financial support from the government for child care it may also, especially given the timing of the survey in the later part of the financial year, have reached the subsidy cap and hence were no longer eligible for assistance. In some cases, the respondent in a household may not have been aware of the assistance provided, especially where it was paid to a partner, or the partner usually manages child care expenses.
53 As noted, the sample for this survey was drawn from those who participated in the May 2018 Baseline Parent Survey. In this earlier survey, almost all (96 per cent) had said in May they were aware of the coming changes. As discussed in Chapter 3, while the respondents to the Child Care Package Family Survey were representative of the earlier population with respect to major demographic characteristics, they were a group who may be considered to be more engaged with child care, and hence may have higher levels of understanding of the system. This is reflected here with the very high proportion reporting awareness. This 96 per cent compares with an overall level of awareness of 86 per cent among users of formal child care.
54 8.3 per cent (n = 42) of respondents did not identify using any of the listed information sources.
55 These sources included the Department of Education and Training or Centrelink website or help line, information put out on TV, radio or other advertising, or on social media, or on the website.
56 See footnote 53.
57 The July LinA survey had 2,260 respondents. Of these, 206 reported having used formal child care and answered this question.
58 This response may not, however, accurately reflect actual understanding of the rate as the response categories identified the relevant income bands and it is probable that many of the responses were based on this.
59 Among all child care users in the Baseline Parent Survey (May 2018), 66 per cent agreed they knew how much their child care was costing them. The subsample responding to the Child Care Package Family Survey is therefore somewhat more aware of their child care costs compared to all child care users.
60 In this response it is not entirely clear whether the respondent is referring to CCB and CCR as the two elements or FTB. In either case however the point of the complexity of past assistance, and the simpler nature of the new CCS is apparent
61 n = 184
62 This statistic is from a different question to that reported in Table 4, and while there is considerable overlap the numbers do not perfectly agree. For example, some families reported using slightly more or slightly less care but did not detail this when asked about changes. Others reported using the same amount of care overall, but had changed services.
63 This group may be using Occasional Care, or care types that do not attract government subsidy such as private nannies or babysitters.
7.1 Introduction
As detailed in Chapter 3, the evaluation will be drawing upon a range of qualitative sources, including case studies and interviews with stakeholders. At the time of preparing this report, the initial pilot case study was still being finalised and only a limited number of stakeholder interviews had been conducted. In neither case had full analysis of the activity been concluded.
Notwithstanding this, the nature of these collections means that aspects of the information gathered complement those derived from the survey activities and identify some of the more contemporary issues associated with the transition to the Package. This chapter briefly considers these insights.
7.2 The role of qualitative collections
The evaluation approach as described in Chapter 3 is one of using mixed methods, that is drawing upon quantitative analysis, drawn from surveys, administrative data and modelling and qualitative information gathered through mechanisms such as case studies and interviews. Utilising both of these sources is important to being able to quantify findings with respect to outcomes and impacts, but also to enable such findings to be placed in context, and to understand the processes which may lead to them. More so in an evaluation such as this, these parallel streams of research allow the learnings in one stream to impact and shape activities in the other. That is, the findings of the qualitative analysis not only help in interpreting the quantitative findings but also feed into decisions on the questions to ask in surveys, including by identifying what is important to those affected by the new package.
At the same time the relatively small scale of qualitative data collections means that while issues can be identified, it is not necessarily easy to determine whether these are systemic issues with widespread impact, potentially something more isolated, or are linked to the particular environment in which the data are collected. Again, the linking of this research with the quantitative studies allows these questions to be answered.
7.3 Pilot case study
As noted in Chapter 3, the initial pilot case study has two objectives. One objective is to provide findings in the post-implementation period against the broader case study objectives to examine the interaction of the different elements of the package with each other and with other activities at the community level. This includes the interaction between stakeholders and between different services. The second objective is for this case study to refine the methodology to be adopted in subsequent case studies.
The first pilot case study was located in a low socio-economic urban area in a capital city. The location had a high proportion of public housing and single parents, a significant Aboriginal and Torres Strait Islander population, higher than average child vulnerability as measured by the Australian Early Development Index, and an array of child care services including Long Day Care. Family Day Care and Out of School Hours Care. Research participants were recruited from a selection of these services which were a mix of local government, for profit and non-profit child care and early learning providers, both small owner-managed services and large organisations. There were 22 research participants from child care and other local services. Most interviews were conducted between August and October 2018. Interviews with families are still being conducted.
Although it was recognised that conducting this case study so early after implementation may have resulted in the potential longer-term impacts and outcomes being less visible relative to the immediate implementation issues, this was considered a reasonable trade-off as insight into the transition experience was a useful addition to the overall evaluation.
Throughout this data collection and also the stakeholder interviews, there were many references by participants to system issues, or problems with IT or software. At this stage of the evaluation and given the qualitative approach to data collection on these issues, and that the evaluation has yet to engage with the third party software providers, it is not possible to draw any strong conclusions about the actual source of these problems. This will be explored further in later evaluation activities.
Emerging themes
In broad terms, the main themes emerging from the case study are that while the introduction of the package was seen across the range of participants as having imposed a heavy burden on services in particular, but also families, the immediate impacts have been limited. Most services did not perceive any immediate impact on their viability and overall there appeared to be little effect on service use by families. Services in general reported that most families met the activity test and continued to use the same amount of care they had before the package was introduced.
At the same time, many services found the transition difficult, and even in late 2018 considered that there were issues still requiring resolution. For example, a number of services reported that low income families not meeting the activity test were incorrectly informed that they were only entitled to 24 hours of CCS rather than 36 hours for preschool programs. As a result, some families reduced their usage rather than risk accruing a debt.
Services also reported a number of issues with ACCS. These issues are discussed further under the stakeholder interview section of this chapter and in Appendix D.
A number of other issues emerged in the interviews. One relates to the creation of debt for families and for services in the transition period. Interviewees reported that debts resulted from a number of factors, including: third party software and Centrelink generating incorrect or inconsistent information; families not understanding that enrolment happened in two stages and so failing to confirm their enrolment; and family entitlements being less than anticipated when first starting to use care. Debt issues arose with ACCS when families had set their hours of care under one ACCS certificate and applied for and expected another determination, and so maintained those hours. If the second determination was not granted, the family owed full fees for the additional hours of care they had used and owed a debt to the service. Other debts arose when ACCS or CCS back pay was made directly to families instead of services and families spent the back payment not understanding that it was CCS or ACCS back pay that should be passed on to services. It was reported that payments appeared in families' bank accounts as an unspecified Centrelink payment, without families being advised of the reason for the payment. In some of these cases, services were then unable to recoup these debts from families.
Lengthy processing times, reportedly due to third party software system errors and Centrelink processing backlogs, meant that individual debts accrued and in some cases became quite significant. As well as debt issues being viewed as a significant problem for some services in the transition process, there was uncertainty about whether this would be an issue which might continue into the future.
A second key issue was an almost universal concern from services and community practitioners about disadvantaged and vulnerable children. Under the Child Care Safety Net, low-income families, who do not meet the activity test are entitled to access 24 hours of subsidised care a fortnight. Interviewees were concerned about the families in their services who had had their subsidised care significantly reduced, and subsequently reduced their usage of care. There were also concerns about the implications of this on the cohort more broadly. As has been discussed in Section 4.3 this compares with previous access to 24 hours care per week and does not fit well into the session structures of most Long Day Care centres.64 As most Long Day Care sessions are 12 hours, these families are only able to access one day a week of subsidised Long Day Care. This is a substantial reduction in the amount of subsidised care available to these families. Most of those interviewed expressed the view that one day a week care was not enough for positive outcomes in development and wellbeing, potentially impacting on a child's social-emotional and educational outcomes.
Other initial conclusions from the case study are:
- The changes in the IT environment (including Proda) were seen as significant issues in the transition to the new package. Many services said they would have liked an opportunity to test the third party software systems and learn how to use it in advance. They also would have liked to learn and understand the family application process through myGov so they could have better supported families in their use of the system. As discussed previously, the data available to date are not sufficient to allow conclusions to be drawn about the source of these IT and system problems, specifically to conclude to what extent these problems were associated with the software development, the time available for this or issues about an absence of an integrated environment with the CCMS which would allow for testing.
- A particular issue in the transition period was that services did not have a clear advance indication of how much subsidy families were entitled to. This meant some services were providing care to families for a period when they were unsure how much subsidised care families would get. Services reported in interviews that in some cases families' application for subsidy took an inordinate amount of time. This meant sometimes large debts were accrued by families in the meantime. The extent and reasons for these delays in processing applications has not yet been considered by the evaluation. Debts which arose in the transition period could be carried more readily by larger providers who felt they could absorb some financial risk but this was more difficult for small providers. Uncertainty was particularly acute for Family Day Care services and educators who, because of recent compliance action on unscrupulous operators, were concerned that they would unwittingly breach rules and be found to be non-compliant.
Another issue identified by those interviewed involved the separation of roles within many services, which has an administrator or other specialist staff member managing the IT tasks (e.g. for family enrolments and session reporting), and therefore likely to be the one resolving CCS and ACCS issues for families. Services reported that staff who work with face to face with families may have no exposure to this, and as such had no input into understanding and resolving families' problems with their subsidies.
7.4 Qualitative interviews with stakeholders
Qualitative interviews with stakeholders were conducted in November and December 2018. Those interviewed included peak bodies, child care providers and some Department of Education and Training state network staff. In total 14 interviews were conducted involving 32 participants. Interviews will also be undertaken with state governments, child protection authorities and third-party software providers in 2019. There were strong commonalities in the themes that emerged from these interviews and the pilot case study.
Emerging themes
Overall, there was general agreement that the Child Care Package appeared to have been generally positive for families with two working parents earning low to middle-incomes, with out of pocket expenses reduced for these families. Most considered it was too early to tell how, or if, this change in affordability would impact on child care or work arrangements.
Interview participants agreed that the transition was broadly successful in moving services and families to the new arrangements. However, they also identified the burden placed on services as an issue and expressed significant concerns about some elements of the package, particularly the IT systems. They echoed issues identified in the case study about debts and the impact of the operation of the activity test on vulnerable children. Additionally, this group raised issues around the implementation of ACCS and to what extent families that should be receiving ACCS were in fact doing so. As in the case study, interviewees raised specific issues around ACCS, including long delays in receiving determinations which resulted in families either having to reduce their care or risk accruing a debt, should their determination be rejected. Research participants pointed out that the delays around determinations could have potentially had serious consequences as the children affected by these delays were at risk of abuse and neglect. Research participants also said that the assessment of determination applications was at times inconsistent or unnecessarily rigid, citing examples where applications were rejected for minor problems such as a missing birthdate or when attachments containing evidence couldn't be opened. Many said that rejection letters did not explain why an application was rejected, and no contact details were given with which providers or families could call Centrelink with regard to an application or to resolve issues around missing information. See Appendix D for more information.
More generally, stakeholders external to the Department of Education and Training were positive about the collaborative approach the Department had adopted, although they also expressed the view that while the Department sought and was receptive to feedback, achieving actual change was slow, especially in achieving change in the IT systems.
In addition to reiterating the concerns expressed in the case study around the IT system, they identified a number of specific issues including:
- Limited functionality - this was seen as a problem not just by external users but also by Departmental staff, with some characterising it as a 'black hole' into which information was fed but from which nothing emerged to assist them in their work
- Operational demands, including PRODA registration which made the system difficult to use at the service level
- Difficulties in making ACCS applications, as well as reports of incorrect advice for families being generated by the Centrelink system, including around eligibility for preschool.
While some noted that some of these problems were not inconsistent with the introduction of any new system or major systems change, there was a sentiment that this burden was inappropriately being carried by the sector, and was amplified by the slow response by the Department of Human Services and the Department of Education and Training to acknowledge issues.
The other significant issues raised were:
- Questions surrounding the financial viability of some services were raised - in the short term as a consequence of family debts arising in the transition, as discussed above (and in Appendix D), and in the longer term as a consequence of services offering shorter sessions in response to the activity test limits (as discussed relation to session lengths)
- In addition to the general concerns about the impact of the activity test on vulnerable children, and the issues with ACCS, several other concerns emerged concerning the effects on disadvantaged and vulnerable families. This included the effects on Aboriginal and Torres Strait Islander children, both in mainstream services, but also in those Budget Based Funded services transitioning to the new arrangements. While, as discussed in Appendix D, some early insights were apparent from these data collections, these effects require further study which will be reported on in future evaluation reporting.
7.5 Summary
While these elements of the evaluation have yet to be completed, both the Pilot Case Study and the stakeholder interviews have identified some common themes, some directed at the actual transition, and in particular the IT system. There were also consistent and persistent concerns about the impact of the package on disadvantaged and vulnerable families. Some of these issues are more fully documented in Appendix D.
At the same time there was a general perception that, notwithstanding the burden imposed by the transition, some concern about the emergence of some debts, and questions about how these will be resolved, the transition was effective in moving services and families to the new funding system, and for some groups that the new arrangements had improved affordability. There was little evidence in the short term of there being significant changes in child care use, or family workforce participation.
These though are very much interim findings and the questions being raised will be part of the focus of the ongoing evaluation process.
64 This problem not only arises because the 24 hours of care when divided by the usual session lengths of 10 to 12 hours only permits a total of two sessions, but that even when services offer a shorter session length of 8 hours it only permits a total of three sessions -but given the weekly scheduling of most services this type of arrangement does not fit well, nor does it substantially address the stronger underlying concern by services about the relative infrequency of participation.
8.1 Background
This early monitoring evaluation report provides baseline data and analysis of the Australian child care system, and observations on the transition to, and issues arising from, the Australian Government's Child Care Package (the Child Care Package) including the major policy changes implemented in July 2018.
The evaluation
This evaluation project, being undertaken by a consortium led by the Australian Institute of Family Studies with the participation of the ANU Centre for Social Research and Methods, the UNSW Social Policy Research Centre and the Social Research Centre, commenced in December 2017 and continues until June 2021. This is the first report of the evaluation.
The evaluation is considering the following components of the Child Care Package:
- Child Care Subsidy
- Additional Child Care Subsidy, including specific elements: Child Wellbeing/ Grandparent/ Temporary Financial Hardship/ Transition to Work)
- Community Child Care Fund
- In Home Care program
- Inclusion Support Programme.
The package, which involves an increase in Australian Government expenditure, also involves significant changes to child care fee assistance, including new activity and income tests. It has been designed to target support towards workforce participation and provide more support for lower and middle-income families, as well as reduce child care cost pressures on families.
A detailed evaluation framework has been published (AIFS, ANU, SPRC and SRC 2018). This identifies four key outcomes and three key impacts upon which the evaluation will focus:
Outcome 1: Child care services are accessible and flexible relative to families' needs, including disadvantaged and vulnerable families.
Outcome 2: Access to child care support is simple for families and services.
Outcome 3: Child care is affordable to families especially those with limited means.
Outcome 4: Child care services are viable and sector robust.
Impact 1: Parents of children can engage in work, education and the community.
Impact 2: Vulnerable and disadvantaged children are engaged and supported.
Impact 3: Child care funding is sustainable for government.
This report is based on data collected either just before the transition to the new child care system, or very shortly after the transition. It provides a combination of baseline data, and information on the expectations of parents, and services and providers, about the implications of the new package for the sector, as well as its expected impacts. It discusses their perceptions of their readiness for the changes, and the sources they used to inform them, as well as their experiences of the transition including changes in child care use, and some very initial data on labour supply responses and costs.
At the time of writing some key pieces of information that it was anticipated would be available to the evaluation team for this report were not available to the evaluation team including:
- initial findings from the program Post Implementation Reviews being undertaken by the Department of Education and Training
- administrative data covering the transition period including detailed information on the use of child care before and after the transition.
Given the absence of this information, that implementation of the new Child Care Package is in the early stages, and that it is expected many of the outcomes and impacts will occur over time as families and services respond to the package, it is not possible or appropriate to substantively address the key evaluation outcomes and impacts at this stage.
8.2 Early monitoring findings
The findings are synthesised in three sections:
- insights from the historical development of child care
- the experience of services leading to the transition and their expectations as to the impact of the package
- the experience of parents before and after the transition, including early insights into the impact on child care use, cost and changes in participation.
Context: Child Care in Australia
There has been strong growth in the formal child sector over the last forty years as a result of a range of factors including increases in parental employment, and in particular the increase in the proportion of couple families with children in which both parents are in paid employment. This is an increase also mirrored by lone parents. The primary focus of the child care sector is about enabling parental employment, although the focus on the child developmental and educational aspects has never been absent and has increased via the development, implementation and enforcement of National Quality Standards and more recently the commitment to access to preschool education in the year before full-time school.
Formal child care is provided through a range of different providers reflecting both the form of care and the nature of ownership of the provider. While the mix of types of child care has changed over time, Long Day Care (which prior to the introduction of the package accounted for 39.7 per cent of all services, 54.7 percent of children using child care and 68.3 per cent of hours of child care) has been the dominant care type with the relative role of Family Day Care fluctuating over time. For school aged children there has been a rapid increase in Outside School Hours Care and this is a growing sector.
The child care sector, over time, has faced a number of different regulatory environments, funding arrangements and emphases in policy priorities. It has been the subject of a range of reviews and inquiries, including by the Productivity Commission which reported in 2014. It also has significant intersections with other policy initiatives.
A substantial proportion of child care, particularly in the Family Day Care and Long Day Care sectors is provided by the for-profit sector and, notwithstanding some fluctuations over the period, is at much the same level as it was in the mid-1990s. Data on child care quality indicates that most services either meet (49.3 per cent) or exceed the National Quality Standard (25.2 per cent), while very few services require significant improvements in quality, a quarter of services are recorded as still 'working towards' the expected standard.
The underlying cost of provision of child care has grown much more rapidly than prices overall. This reflects many factors including changes in quality and the costs of staffing. ABS estimates indicate that while government policies directed at this have had some immediate success in offsetting the more rapid increase in the cost of child care, they have not been successful at addressing the overall trend over time.
Services and transition
In broad terms the data collected and analysed to date for the evaluation indicates that the services were, on balance, prepared for the transition to the package and that the transition process was largely effective in moving the services, and children attending them, to the package and the new IT system - the Child Care Subsidy System (CCSS).65
Specifically, it was found:
- Just prior to the transition about two-thirds of services said that they agreed or strongly agreed that their service was prepared for the changes and 13 per cent disagreed or strongly disagreed that they were ready for the changes.
- The majority of services had been able to access information from a range of sources in preparation for the introduction of the package, but services expressed mixed views as to whether this information was helpful. In general services reported that information from their provider or peak organisation was the most useful. Services that were part of a large provider tended to be more positive in their assessment of their understanding and preparation for the new package.
- There were mixed reports of services' understanding of the new Child Care Package, with a significant proportion of services saying they had either a poor or only fair understanding of the Child Care Package.
- While identifying some state effects (with NSW services tending to be more negative on some aspects), more detailed analysis across these questions, and with regard to expectations about the impact, found there were no significant patterns by remoteness or by the socio-economic status of the services' location.
- At the time of implementation most services considered they were financially viable.
- Services also generally report having the capacity to provide care for high needs and vulnerable children and families, although there was a more mixed picture of the available supports.
- While many services had some flexibility in their operation and service offerings, other data indicated that, especially in the Long Day Care sector, most operated on the basis of long, 10-12 hour sessions. A quarter identified demand from families for greater flexibility but identified a range of cost, operational and regulatory barriers to meeting this.
- Services had mixed views pre-implementation about expected the impacts of the Child Care Package:
- slightly more thought there would be a positive impact (40 per cent) than a negative impact (36 per cent).
- a substantial number of services expected families to withdraw children or reduce hours of care (58 per cent), a small number expected some families to increase their hours (18 per cent) and an increased number of children accessing care at their service (18 per cent).
- there were also very split views on whether access to care for vulnerable children would be improved or worsened.
While the transition process achieved the transfer of services and children to the new system, some issues did arise. Aspects of the functionality of the CCSS remain problematic, including reporting, and there was a view by many services that the transition process had imposed a heavy (unfunded) burden on the sector. Qualitative research has raised issues relating to the operation of the activity test and the number of hours of care available for some children, especially those living with disadvantage and with the operation of ACCS.
Families' transition
Early monitoring of families' preparations, expectations and experiences of the Child Care Package was drawn from three main sources: a Baseline Parent Survey conducted in May 2018; LinA surveys in July and August 2017; and the CCPFamS conducted in November 2018. The data indicate that prior to the changes to the system the majority of families were aware of the introduction of the package, with the majority of parents reporting using at least one source of information about the changes, and the main source being formal communications from child care providers (about two thirds). Just under one-third of parents reported using the Centrelink website, and a similar number obtained information from government advertising.
When asked about the transition experience the most frequent response was it was relatively seamless - with 13 per cent strongly agreeing and 54 per cent agreeing with this statement. Offset against this were 8 per cent who strongly disagreed and 13 per cent who disagreed.
The nature of the changes in the package will result in increased financial support for some families and decreased financial support for others, a feature that has been identified in the modelling undertaken within and outside of government. This reflects the specific targeting of the arrangements, in particular the reduction of assistance to higher income households and the operation of the activity test to more strongly focus on providing support to those engaged in the workforce and other activities. This would appear to be reflected in parents' self-reports of the impact of the changes to child care funding on the costs for families. Among low-income families about one-third said it had decreased their costs, just over one-half said it had no effect and 9 per cent said it had increased costs. For high-income families about one fifth said it had decreased costs, just under one-third said it had made no difference and nearly half said it had increased costs. While these results are noted here as part of the 'monitoring' of the program (as is the CPI data, which suggests that the introduction of the Child Care Package led to an 11.8 per cent decline in the cost of child care in the September 2018 quarter), it is stressed that the question of affordability will be considered in a more rigorous fashion and in greater depth in later stages of the evaluation.
Similar caution needs to be exercised with regard to the early self-report data on the impact of the package on work, study or other activities of parents. Survey data suggest that some 80 per cent report no impact, and where there have been changes in hours, these were associated with a range of factors of which the new child care arrangements were just one. However, of those reporting changes to employment there was a tendency towards reporting increased rather than decreased hours of work, but a tendency towards reducing study hours.
Overall the sentiment of families towards the package was positive, with 40.7 per cent describing it as being mostly and entirely positive, as opposed to 23.0 per cent describing it as being mostly or entirely negative and 36.4 per cent saying it was neither.
8.3 Conclusion
Given the nature of this early monitoring report, the limited data available, and the extent to which it is anticipated that it will take some time for the effects of the new Child Care Package to flow through (including with respect to parental employment, service structures and charges and affordability), it is too early to report any substantive findings concerning the impact and outcomes of the new Child Care Package. As anticipated prior to the introduction of the package, however, it has resulted in some positive outcomes for some families and negative outcomes for others. Similarly, while concerns have been expressed by many stakeholders as to the potential consequences for vulnerable and disadvantaged children as a result of parents not satisfying the activity test, further data and analysis is required to better understand how these changes are impacting on the participation of these children in early learning programs.
The initial indications are that the transition was successful at transferring services and families into the new system, and while some issues have arisen it is unclear whether these are simply transitional/teething issues, or more substantive. The overall sentiment of families both to the transition experience and impact, on balance is positive, although with a not insignificant group reporting otherwise.
65 The Department advises that as at 2 July 2018 6,040 providers with 12 732 services had transitioned, over 99% of all providers.
Australian Bureau of Statistics (2016). Preschool education, Australia (Cat. No. 4240). Canberra: ABS.
Australian Bureau of Statistics (2017). Childhood education and care, Australia, June 2017 (Cat. No. 4402.0). Canberra: ABS.
Australian Bureau of Statistics (Various). Consumer price index, Australia (Cat. No. 6401.0). Canberra: ABS.
Australian Bureau of Statistics (Various). Labour force, Australia: Labour force status and other characteristics of families (Cat. No. 6224.0). Canberra: ABS.
Australian Children's Education and Care Quality Authority (ACECQA). (2017). National quality agenda national partnership annual performance report. Sydney: Australian Community Education College.
Australian Children's Education and Care Quality Authority (ACECQA). (2018). National quality standard data, as at 30 September 2018. Sydney: Australian Community Education College.
Australian Government. (2018). Australian Government response to the Select Committee on Red Tape: Effect of red tape on child care (interim report) August 2018, November 2018. Canberra: Australian Government.
Australian Institute of Health and Welfare (AIHW). (2003). Australia's welfare 2003. Canberra: AIHW.
Australian Institute of Family Studies (AIFS), the Australian National University (ANU), the Social Policy Research Centre (SPRC) and the Social Research Centre (SRC) (2018). Child Care Package: Evaluation Framework: AIFS.
AIHW. (2005). Australia's welfare, 2005. Canberra: AIHW.
Baxter, J. (2005). The employment of partnered mothers in Australia, 1981 to 2001 (PhD diss.). Canberra: Australian National University.
Baxter, J.A., & Hand, K. (2013). Access to early childhood education in Australia (Research Report 24). Melbourne: Australian Institute of Family Studies.
Baxter, J. A. (2015). Child care and early childhood education in Australia (AIFS Facts Sheet). Melbourne: Australian Institute of Family Studies.
Baxter, J. A., Hand, K., & Sweid, R. (2016). Flexible child care and Australian parents' work and care decision-making (AIFS Research Report No. 37). Melbourne: Australian Institute of Family Studies.
Birmingham, S. (Minister for Education and Training). (2015, December 17). Government recovers $283 million from 'shonky' child care operators. [Media release]. Canberra: Department of Education and Training.
Birmingham, S. (Minister for Education and Training). (2017, February 1). Just 10 of the reasons Parliament must pass early childhood education and care reforms. [Media release]. Canberra: Department of Education and Training.
Birmingham, S. (Minister for Education and Training). (2018, January 6). Dodgy child care providers named and shamed. [Media release]. Canberra: Department of Education and Training.
Bray, J. R. (2018). The Australian minimum wage and the needs of a family (PhD diss.). Canberra: Australian National University.
Brennan, D. (1998). The politics of Australian childcare: from philanthropy to feminism. Cambridge: Cambridge University Press.
Chang, C. (2018, August 7). Glitches plague new childcare system. news.com.au. Retrieved from http://news.com.au
Cortis, N., Blaxland, M., Brennan, D., & Adamson, E. (2014). Family day care at the crossroads: Quality and sustainability in uncertain times. (SPRC Report 24/2014). Sydney: Social Policy Research Centre, UNSW.
Council of Australian Governments (2009). Belonging, being and becoming: the early years learning framework for Australia. Retrieved from https://docs.education.gov.au/system/files/doc/other/belonging_being_and_becoming_the_early_years_learning_framework_for_australia_0.pdf
Department of Education and Training. (various years). Early Childhood and Child Care in Summary Reports. Canberra: DET.
Department of Education and Training. (2015). Regulation Impact Statement - Jobs for Families Child Care Package. Canberra: DET.
Department of Education and Training. (2017a). Budget 2017-18: Portfolio Budget Statements 2017-18 (Budget Related Paper No. 1.5, Education and Training Portfolio). Canberra: Australian Government.
Department of Education and Training. (2017b). Inclusion Support Programme Guidelines 2016-2017 to 2018-2019. Canberra: DET.
Department of Education and Training. (May 2017). Communication strategy. Jobs for Families Child Care campaign. Canberra: DET.
Department of Education and Training. (2018a). Fact sheet: Child care subsidy activity test, May 2018. Canberra: Australian Government.
Department of Education and Training. (2018b). Portfolio Additional Estimates Statements 2017-18, Education and Training Portfolio. Canberra: Australian Government.
Department of Education and Training. (2018c). Early childhood and child care in summary: December quarter 2017. Canberra: DET.
Department of Education and Training. (2018d). Analysis by electorate for Child Care campaign: An analysis by electorate for 2017 Child Care campaign. Canberra: DET.
Department of Education and Training. (2018e). Child Care Package (PowerPoint presentation). Canberra: DET.
Department of Education and Training. (2019). Portfolio Additional Estimates Statements 2018-19, Education and Training Portfolio. Canberra: Australian Government.
Department of Education, Employment and Workplace Relations. (2015). i. Canberra: Department of Employment and Workplace Relations.
Department of Education, Employment and Workplace Relations (2013). Child care in Australia, August 2013. Canberra: Department of Education, Employment and Workplace Relations
Department of Health and Family Services. (1996). Portfolio Budget Statements, 1996-97. Canberra.
Hand, K. (2007). Mothers' accounts of work and family decision-making in couple families: An analysis of the Family and Work Decisions Study. Family Matters, 75, 70-76.
Karoly, L. 2017. The costs and benefits of scaled-up pre-kindergarten programs. In Brookings & Duke Centre for Child and Family Policy, The current state of scientific knowledge on pre-kindergarten effects. Washington: The Brookings Institution.
Klapdor, M 2017, Family Payments: budget review 2017-18 index. Retrieved from https://www.aph.gov.au/About_Parliament/Parliamentary_Departments/Parliamentary_Library/pubs/rp/BudgetReview201718/FamilyPayments
McIntosh, G., & Phillips, J. (2002). Commonwealth support for childcare. Current Issues E-brief, Parliamentary Library, Parliament of Australia. Retrieved from www.aph.gov.au/About_Parliament/Parliamentary_Departments/Parliamentary_Library/Publications_Archive/archive/childcaresupport
Moyle, H., Meyer, P., & Evans, A. (1996). Outside school hours care services in Australia (Children's Service Series No. 3). Canberra: Australian Institute of Health and Welfare.
National Disability Insurance Scheme. (2014). Mainstream interface: Early childhood - Supports National Disability Insurance Scheme will fund in relation to early childhood. Canberra: National Disability Insurance Scheme.
ORIMA Research. (2018). Baseline Parent Survey (BPS): Final report. Canberra: Department of Education and Training
Pascoe, S., & Brennan, D. (2017). Lifting our game: Report of the review to achieve educational excellence in Australian schools through early childhood interventions. Melbourne: Victorian Government.
Phillips, B. (2016). Distributional modelling of proposed childcare reforms in Australia. Canberra: ANU Centre for Social Research and Methods.
Porter, C. (Minister for Social Services). (2016). Second reading speech: Family Assistance Legislation Amendment (Jobs for Families Child Care Package) Bill 2016. House of Representatives, 1 September 2016.
Porter, C. (Minister for Social Services). (2017a). Second reading speech: Family Assistance Legislation Amendment (Jobs for Families Child Care Package) Bill 2016. House of Representatives, 8 February 2017.
Porter, C (2017b) Explanatory Memoranda, Social Services Legislation Amendment (Omnibus Savings and Child Care Reform) Bill 2017 (ACT)
Press, F., & Hayes, A. (2000). OECD thematic review of early childhood education and care policy: Australian background report. Paris: Organisation for Economic Cooperation and Development. Retrieved from www.oecd.org/australia/1900259.pdf
Productivity Commission. (2014a). Childcare and early childhood learning (Productivity Commission Inquiry Report No. 73, Volumes 1 & 2). Canberra: Productivity Commission.
Productivity Commission. (2014b). Childcare and early childhood learning (Productivity Commission Inquiry Report No. 73, Overview and Recommendations). Canberra: Productivity Commission.
Productivity Commission. (2017). Report on government services 2017. Canberra: Productivity Commission.
Productivity Commission. (2018). Report on government services 2018. Canberra: Productivity Commission.
Senate Community Affairs Reference Committee (SCARC). (1998). Report on child care funding. Senate Standing Committees on Community Affairs, Commonwealth of Australia, Canberra.
Senate, Select Committee on Red Tape. (2018). Effect if red tape on child care: Interim report. Canberra: Parliament of Australia.
Tehan, D. (Minister for Education). (2018a, December 7). Helping more families access In Home Care. [Media release]. Canberra: DET.
Tehan, D. (Minister for Education). (2018b, October 3). Preschool funding guaranteed. [Media release]. Canberra: DET.
Tehan, D. (Minister for Education). (2018c, October 8). Child care numbers continue to grow across Australia. [Media release]. Canberra: DET.
Vuri, D. (2016). Do childcare policies increase maternal employment? IZA World of Labor, 241. doi: 10.15185/izawol.241
Whiteford, P., Stanton, D., & Gray, M. (2001). Families and income security: Changing patterns of social security and related policy issues. Family Matters, 60, 24-35.
A.1. Supplementary tables: Chapter 2
| Centre-based Care | Family day care | Preschool | Outside school hours | Informal care only | |
|---|---|---|---|---|---|
| - % - 0 to 2 years | |||||
| 1984 | 4.6 | 2.6 | - | - | 32.5 |
| 1987 | 7.5 | 3.3 | - | - | 38.8 |
| 1990 | 5.7 | 4.0 | - | - | 38.3 |
| 1993 | 7.9 | 4.4 | - | - | 33.3 |
| 1996 | 10.6 | 6.3 | - | - | 30.2 |
| 1999 | 13.6 | 5.0 | - | - | 33.9 |
| 2002 | 17.4 | 5.6 | - | - | 27.0 |
| 2005 | 18.6 | 6.5 | - | - | 27.1 |
| 2008 | 23.4 | 3.6 | - | - | 26.3 |
| 2011 | 26.3 | 4.3 | - | - | 19.2 |
| 2014 | 28.9 | 4.7 | - | - | 19.2 |
| 2017 | 31.5 | 6.4 | - | - | 19.4 |
| 3 to 5 years | |||||
| 1984 | 7.2 | 2.5 | 30.1 | - | 20.6 |
| 1987 | 11.7 | 1.7 | 34.8 | - | 22.1 |
| 1990 | 9.0 | 4.5 | 34.6 | - | 23.5 |
| 1993 | 10.7 | 4.2 | 30.6 | - | 19.4 |
| 1996 | 11.8 | 3.9 | 25.0 | - | 21.0 |
| 1999 | 17.5 | 5.1 | 29.6 | - | 17.9 |
| 2002 | 22.0 | 5.7 | 31.2 | - | 13.5 |
| 2005 | 23.6 | 6.2 | 33.5 | - | 11.5 |
| 2008 | 24.7 | 3.0 | 32.8 | - | 12.8 |
| 2011 | 28.0 | 3.4 | 30.5 | - | 10.3 |
| 2014 | 30.2 | 3.7 | 33.0 | - | 10.0 |
| 2017 | 32.6 | 3.8 | 30.1 | - | 10.4 |
| 6 to 11 years | |||||
| 1984 | - | 0.5 | - | - | 25.6 |
| 1987 | - | 0.7 | - | - | 33.0 |
| 1990 | - | 0.9 | - | 2.7 | 36.9 |
| 1993 | - | 0.9 | - | 4.8 | 32.5 |
| 1996 | - | 1.1 | - | 6.0 | 31.0 |
| 1999 | - | 0.6 | - | 8.2 | 29.6 |
| 2002 | - | 0.7 | - | 9.2 | 26.3 |
| 2005 | - | 0.6 | - | 11.8 | 25.4 |
| 2008 | - | 0.6 | - | 12.2 | 26.7 |
| 2011 | - | 0.0 | - | 12.9 | 19.9 |
| 2014 | - | 0.5 | - | 16.2 | 23.1 |
| 2017 | - | 0.9 | - | 17.4 | 30.8 |
Source: Bray (2018). Underlying data from ABS 4402.0 2017
| Year | Parental employment status, couple families with dependent children aged under 15 years (distribution): | ||||||
|---|---|---|---|---|---|---|---|
| Both full-time | One full-time, one part-time | One full-time only | Both part-time | One part-time only | Neither employed | Total | |
| - % - | |||||||
| 1981 | 16.5 | 23.9 | 52.4 | 0.5 | 1.7 | 5.0 | 100.0 |
| 1982 | 17.1 | 23.3 | 51.5 | 0.6 | 1.6 | 5.8 | 100.0 |
| 1983 | 16.2 | 22.5 | 50.6 | 0.7 | 1.6 | 8.5 | 100.0 |
| 1984 | 16.6 | 24.0 | 49.4 | 0.8 | 1.6 | 7.5 | 100.0 |
| 1985 | 17.6 | 26.1 | 46.3 | 0.7 | 1.9 | 7.4 | 100.0 |
| 1986 | 18.8 | 28.2 | 43.2 | 0.7 | 1.7 | 7.3 | 100.0 |
| 1987 | 18.8 | 29.6 | 40.9 | 0.7 | 2.0 | 7.9 | 100.0 |
| 1988 | 19.2 | 30.6 | 40.6 | 0.6 | 1.8 | 7.2 | 100.0 |
| 1989 | 20.4 | 31.5 | 38.6 | 0.7 | 1.9 | 6.9 | 100.0 |
| 1990 | 21.6 | 32.3 | 36.9 | 0.8 | 2.0 | 6.3 | 100.0 |
| 1991 | 20.1 | 30.6 | 36.9 | 1.0 | 3.1 | 8.1 | 100.0 |
| 1992 | 19.2 | 31.1 | 35.2 | 1.4 | 3.3 | 9.8 | 100.0 |
| 1993 | 19.8 | 29.5 | 35.3 | 1.2 | 3.4 | 10.8 | 100.0 |
| 1994 | 19.6 | 30.5 | 35.5 | 1.1 | 3.3 | 10.0 | 100.0 |
| 1995 | 21.6 | 33.0 | 32.1 | 1.5 | 3.3 | 8.4 | 100.0 |
| 1996 | 20.9 | 32.2 | 33.8 | 1.4 | 3.9 | 7.9 | 100.0 |
| 1997 | 20.6 | 32.5 | 33.4 | 1.4 | 3.7 | 8.6 | 100.0 |
| 1998 | 21.3 | 33.0 | 32.2 | 1.4 | 3.7 | 8.5 | 100.0 |
| 1999 | 20.9 | 32.4 | 33.0 | 1.5 | 4.2 | 7.9 | 100.0 |
| 2000 | 21.7 | 32.9 | 32.4 | 1.7 | 3.8 | 7.5 | 100.0 |
| 2001 | 21.2 | 33.5 | 31.5 | 2.0 | 4.2 | 7.5 | 100.0 |
| 2002 | 19.3 | 35.6 | 31.5 | 2.2 | 4.2 | 7.2 | 100.0 |
| 2003 | 19.8 | 35.9 | 31.7 | 1.9 | 4.4 | 6.3 | 100.0 |
| 2004 | 21.3 | 34.1 | 32.0 | 2.0 | 4.3 | 6.4 | 100.0 |
| 2005 | 22.0 | 36.7 | 30.4 | 2.0 | 3.7 | 5.3 | 100.0 |
| 2006 | 21.4 | 36.4 | 30.5 | 2.0 | 4.3 | 5.4 | 100.0 |
| 2007 | 21.1 | 36.6 | 31.6 | 2.3 | 3.6 | 4.8 | 100.0 |
| 2008 | 22.1 | 36.8 | 29.9 | 2.7 | 4.1 | 4.3 | 100.0 |
| 2009 | 21.8 | 36.4 | 29.7 | 2.2 | 4.2 | 5.7 | 100.0 |
| 2010 | 21.5 | 36.7 | 29.5 | 2.5 | 4.6 | 5.3 | 100.0 |
| 2011 | 21.8 | 38.3 | 28.8 | 2.5 | 3.5 | 5.2 | 100.0 |
| 2012 | 22.9 | 35.6 | 29.3 | 2.3 | 4.4 | 5.5 | 100.0 |
| 2013 | 22.3 | 36.3 | 28.5 | 2.3 | 4.5 | 6.1 | 100.0 |
| 2014 | 23.3 | 34.3 | 28.7 | 2.9 | 4.7 | 6.0 | 100.0 |
| 2015 | 24.1 | 35.1 | 27.2 | 2.8 | 4.6 | 6.2 | 100.0 |
| 2016 | 23.7 | 36.6 | 25.7 | 2.9 | 5.0 | 6.2 | 100.0 |
Source: Bray (2018); underlying data ABS 6224.0 (various).
Notes: Since 2013 data include same sex couples. There was a minor series break in 2012. This resulted in a drop in dual earner families of 0.8 percentage points and an increase in one earner families by 0.2 percentage points.
A.2. Supplementary tables: Chapter 4
| Characteristic | Variable | Financial viability (Scale 1-5, 5 = highest) | |
|---|---|---|---|
| Coefficient | |||
| Service type | Long day care (reference) | - | |
| Family day care | -0.345 | *** | |
| Outside school hours | 0.334 | *** | |
| Occasional care | -0.145 | ||
| Budget based funded | -0.227 | ||
| In home care | -1.217 | *** | |
| State/Territory | NSW (reference) | - | |
| VIC | -0.171 | *** | |
| QLD | 0.036 | ||
| SA | 0.086 | ||
| WA | -0.148 | ||
| TAS | 0.111 | ||
| ACT | -0.140 | ||
| NT | 0.401 | ** | |
| Remoteness | Major city area (reference) | - | |
| Inner regional area | -0.062 | ||
| Outer regional area | -0.118 | ||
| Remote area | -0.198 | ||
| Very remote area | -0.206 | ||
| Socio economic index of area: disadvantage and advantage | Most disadvantaged (reference) | - | |
| 2nd quintile | 0.082 | ||
| 3rd quintile | 0.231 | *** | |
| 4th quintile | 0.264 | *** | |
| Most advantaged | 0.320 | *** | |
| Missing | 0.135 | ||
| Service staff size | 1-6 (reference) | - | |
| 7-10 | 0.260 | *** | |
| 11-15 | 0.535 | *** | |
| 16-24 | 0.624 | *** | |
| 25 or more | 0.670 | *** | |
| Missing | 0.145 | ||
| Provider size | 1 (reference) | - | |
| 2-5 services | -0.074 | ||
| 6-99 services | -0.019 | ||
| 100+ services | 0.109 | ||
| Organisation type | Public / community (reference) | - | |
| Private | 0.042 | ||
| Constant | 3.141 | *** | |
| n | 2,561 | ||
| r2 | 0.098 | ||
Source: Baseline SELCS, Wave 1.
Note: * p<0.05; ** p<0.01; *** p<0.001
A.3. Supplementary tables: Chapter 5
| Services accessed | OSHC % | FDC % | IHC % | LDC % | OCC % | BBF % |
|---|---|---|---|---|---|---|
| Child Care (CCMS) Helpdesk | 64.3 | 87.7 | 76.0 | 64.9 | 57.7 | 63.5 |
| DET website | 65.8 | 94.3 | 100.0 | 69.3 | 78.5 | 85.9 |
| DET webinars | 46.1 | 79.9 | 82.6 | 53.3 | 62.6 | 58.8 |
| DHS website | 56.9 | 81.3 | 52.5 | 60.0 | 58.7 | 70.0 |
| Own organisation or a sector/peak body | 75.9 | 85.2 | 78.7 | 81.5 | 68.6 | 89.2 |
Source: Baseline SELCS, Wave 1
| Service usefulness | OSHC % | FDC % | IHC % | LDC % | OCC % | BBF % |
|---|---|---|---|---|---|---|
| Child Care (CCMS) Helpdesk | ||||||
| Accessed and found helpful | 51.8 | 68.3 | 53.1 | 50.3 | 48.2 | 55.7 |
| Accessed but did not find helpful | 12.5 | 19.4 | 23.0 | 14.6 | 9.4 | 7.8 |
| Not been able to access it | 3.6 | 2.4 | 0.0 | 4.1 | 7.2 | 8.5 |
| Did not need to access it | 25.2 | 9.6 | 16.8 | 27.6 | 31.0 | 14.8 |
| Did not know about it | 7.0 | 0.3 | 7.2 | 3.5 | 4.1 | 13.2 |
| Total, n | 596 | 298 | 24 | 1471 | 79 | 66 |
| DET Website | ||||||
| Accessed and found helpful | 55.1 | 79.1 | 67.3 | 56.7 | 69.0 | 80.0 |
| Accessed but did not find helpful | 10.7 | 15.2 | 32.7 | 12.7 | 9.6 | 6.0 |
| Not been able to access it | 3.3 | 1.8 | 0.0 | 2.9 | 0.0 | 8.4 |
| Did not need to access it | 24.1 | 3.3 | 0.0 | 22.2 | 13.4 | 2.9 |
| Did not know about it | 6.9 | 0.6 | 0.0 | 5.5 | 8.1 | 2.8 |
| Total, n | 590 | 298 | 22 | 1483 | 80 | 66 |
| DET webinars | ||||||
| Accessed and found helpful | 37.9 | 69.2 | 54.1 | 42.6 | 50.9 | 53.3 |
| Accessed but did not find helpful | 8.2 | 10.7 | 28.8 | 10.7 | 11.7 | 5.6 |
| Not been able to access it | 8.2 | 5.5 | 5.2 | 10.2 | 11.9 | 8.8 |
| Did not need to access it | 29.1 | 9.5 | 12.0 | 26.1 | 18.0 | 21.8 |
| Did not know about it | 16.6 | 5.1 | 0.0 | 10.5 | 7.5 | 10.5 |
| Total, n | 591 | 294 | 24 | 1469 | 78 | 64 |
| DHS website | ||||||
| Accessed and found helpful | 45.9 | 66.9 | 45.5 | 47.3 | 48.9 | 56.9 |
| Accessed but did not find helpful | 11.0 | 14.4 | 40.0 | 12.7 | 9.7 | 13.1 |
| Not been able to access it | 4.0 | 3.4 | 0.0 | 3.4 | 0.0 | 8.1 |
| Did not need to access it | 29.4 | 11.7 | 14.5 | 28.2 | 25.4 | 15.4 |
| Did not know about it | 9.7 | 3.6 | 0.0 | 8.4 | 15.9 | 6.6 |
| Total, n | 578 | 296 | 24 | 1452 | 80 | 67 |
| Own organisation or a sector/peak body | ||||||
| Accessed and found helpful | 67.9 | 73.7 | 62.4 | 74.4 | 63.4 | 88.0 |
| Accessed but did not find helpful | 8.0 | 11.5 | 16.3 | 7.1 | 5.2 | 1.2 |
| Not been able to access it | 4.7 | 5.3 | 6.3 | 4.1 | 6.1 | 2.9 |
| Did not need to access it | 14.8 | 6.0 | 15.1 | 10.2 | 16.5 | 5.6 |
| Did not know about it | 4.6 | 3.5 | 0.0 | 4.2 | 8.9 | 2.3 |
| Total, n | 551 | 279 | 22 | 1397 | 71 | 63 |
Source: Baseline SELCS, Wave 1
| LDC provider size (number of services) | |||||
|---|---|---|---|---|---|
| 1 | 2-5 | 6-99 | 100+ | ||
| Child Care (CCMS) Helpdesk | % | ||||
| Accessed and found helpful | 58.0 | 56.6 | 43.3 | 39.3 | |
| Accessed but did not find helpful | 17.3 | 16.6 | 9.7 | 6.3 | |
| Not been able to access it | 3.7 | 4.8 | 3.4 | 3.5 | |
| Did not need to access it | 18.0 | 19.7 | 35.7 | 41.8 | |
| Did not know about it | 3.0 | 2.3 | 7.8 | 9.2 | |
| Total, n | 1349 | 561 | 391 | 233 | |
| DET website | |||||
| Accessed and found helpful | 63.2 | 62.4 | 50.5 | 44.4 | |
| Accessed but did not find helpful | 15.7 | 13.2 | 7.2 | 6.7 | |
| Not been able to access it | 2.6 | 2.5 | 3.6 | 4.2 | |
| Did not need to access it | 13.5 | 18.1 | 31.8 | 35.4 | |
| Did not know about it | 5.1 | 3.8 | 6.9 | 9.2 | |
| Total, n | 1352 | 563 | 392 | 232 | |
| DET webinars | |||||
| Accessed and found helpful | 43.5 | 47.1 | 41.0 | 33.0 | |
| Accessed but did not find helpful | 12.0 | 10.1 | 7.8 | 5.7 | |
| Not been able to access it | 9.5 | 9.3 | 6.7 | 12.0 | |
| Did not need to access it | 22.5 | 24.0 | 30.9 | 33.9 | |
| Did not know about it | 12.6 | 9.5 | 13.6 | 15.4 | |
| Total, n | 1334 | 566 | 388 | 232 | |
| DHS website | |||||
| Accessed and found helpful | 53.4 | 52.2 | 37.4 | 41.7 | |
| Accessed but did not find helpful | 14.8 | 13.7 | 8.6 | 8.1 | |
| Not been able to access it | 3.3 | 2.5 | 5.3 | 3.7 | |
| Did not need to access it | 20.6 | 23.1 | 38.1 | 38.5 | |
| Did not know about it | 7.9 | 8.5 | 10.6 | 8.1 | |
| Total, n | 1323 | 554 | 389 | 231 | |
| Own organisation or a sector/peak body | |||||
| Accessed and found helpful | 63.5 | 72.1 | 80.8 | 80.0 | |
| Accessed but did not find helpful | 9.2 | 6.4 | 5.9 | 8.0 | |
| Not been able to access it | 4.9 | 5.9 | 2.7 | 3.6 | |
| Did not need to access it | 16.1 | 12.8 | 8.3 | 3.7 | |
| Did not know about it | 6.3 | 2.8 | 2.3 | 4.7 | |
| Total, n | 1217 | 534 | 395 | 237 | |
Source: Baseline SELCS, Wave 1
| Agree % | Prepared for the changes | DET is providing enough support | DHS is providing enough support | Software provider is providing enough support | Own organisation / peak body is providing enough support |
|---|---|---|---|---|---|
| LDC Provider Size | |||||
| 1 Service | 62.0 | 40.1 | 39.9 | 71.9 | 65.1 |
| 2-5 Services | 63.1 | 43.7 | 42.0 | 69.4 | 75.3 |
| 6-99 Services | 69.7 | 52.1 | 47.8 | 70.9 | 84.9 |
| 100+ Services | 81.4 | 57.5 | 52.7 | 75.6 | 90.8 |
Source: Baseline SELCS, Wave 1
| Variable | Readiness (Coefficient) | |
|---|---|---|
| Service type | Long day care (reference) | 0.00 |
| Family day care | -0.00 | |
| Outside school hours | -0.09 | |
| Occasional care | 0.14 | |
| Budget based funded | 0.22 | |
| In home care | -0.52* | |
| State/Territory | NSW (reference) | |
| VIC | 0.20*** | |
| QLD | 0.16** | |
| SA | 0.24** | |
| WA | 0.24*** | |
| TAS | 0.41*** | |
| ACT | 0.09 | |
| NT | 0.39* | |
| Remoteness | Major city area (reference) | 0.00 |
| Inner regional area | -0.06 | |
| Outer regional area | -0.09 | |
| Remote area | 0.00 | |
| Very remote area | -0.04 | |
| Socio economic index of area: disadvantage and advantage | Most disadvantaged (reference) | 0.00 |
| 2nd quintile | -0.05 | |
| 3rd quintile | 0.01 | |
| 4th quintile | 0.01 | |
| Most advantaged | 0.01 | |
| Agreement that the service is financial viability | Strongly agree [financially viable] (reference) | 0.00 |
| Agree | -0.21*** | |
| Neutral | -0.33*** | |
| Disagree | -0.41*** | |
| Strongly disagree [not financially viable] | -0.78*** | |
| Service staff size | 1-6 (reference) | 0.00 |
| 7-10 | 0.04 | |
| 11-15 | 0.01 | |
| 16-24 | -0.04 | |
| 25 or more | -0.03 | |
| Provider size (number of services) | 1 (reference) | 0.00 |
| 2-5 services | 0.04 | |
| 6-99 services | 0.23*** | |
| 100+ services | 0.29*** | |
| Organisation type | Public / community (reference) | 0.00 |
| Private | 0.16*** | |
| Constant | 3.59*** | |
| n | 2561 | |
| r2 | 0.07 |
Source: Baseline SELCS, Wave 1, May-June 2018.
Note: Services with a non-missing value on perceived preparedness but missing value on any of the explanatory variables were retained, but findings for those 'missing' categories are not shown. Standard errors calculated through jackknife replication. * p<0.05; ** p<0.01; *** p<0.001. 1 = strongly disagree, not prepared to 5 = strongly agree, prepared.
| Variable | CCMS help desk | DET Websitea | DET webinars | DHS website | Own organisation/peak | |
|---|---|---|---|---|---|---|
| Marginal Effects | ||||||
| Service type | Long day care (ref.) | |||||
| Family day care | 0.19*** | 0.21*** | 0.21*** | 0.17*** | 0.04 | |
| Outside school hours | 0.03 | -0.04 | -0.03 | 0.00 | -0.03 | |
| Occasional care | -0.09 | 0.04 | 0.07 | -0.02 | -0.07 | |
| Budget based funded | -0.07 | 0.15** | 0.01 | 0.09 | 0.11*** | |
| In home care | 0.07 | - | 0.27** | 0.23** | 0.00 | |
| State/ Territory | NSW ( ref.) | |||||
| VIC | 0.05 | 0.03 | 0.06 | -0.01 | -0.03 | |
| QLD | -0.02 | 0.04 | 0.09** | 0.05 | 0.06* | |
| SA | 0.10* | 0.00 | -0.05 | 0.09* | 0.04 | |
| WA | 0.08* | 0.02 | 0.01 | 0.10* | 0.01 | |
| TAS | -0.02 | -0.02 | 0.05 | -0.07 | -0.11 | |
| ACT | 0.04 | -0.11 | -0.15* | 0.02 | -0.05 | |
| NT | 0.05 | -0.10 | -0.05 | -0.12 | 0.10 | |
| Remoteness | Major city area ( ref.) | |||||
| Inner regional area | -0.03 | -0.01 | 0.01 | -0.03 | -0.02 | |
| Outer regional area | 0.06 | 0.00 | 0.09* | 0.05 | -0.02 | |
| Remote area | -0.07 | -0.16* | -0.14* | -0.02 | -0.09 | |
| Very remote area | 0.01 | -0.15 | 0.04 | -0.16 | -0.14 | |
| Socio economic index of area: disadvantage and advantage | Most disadvantaged (ref.) | |||||
| 2nd quintile | -0.05 | 0.02 | -0.09* | 0.01 | -0.04 | |
| 3rd quintile | -0.03 | -0.04 | -0.09* | -0.02 | -0.05 | |
| 4th quintile | -0.03 | -0.04 | -0.10* | 0.00 | -0.09** | |
| Most advantaged | -0.02 | 0.01 | -0.10** | -0.01 | -0.03 | |
| Agreement that the service is financial viability | Strongly agree [financially viable] (reference) | |||||
| Agree | 0.06* | -0.02 | 0.01 | 0.07* | 0.04 | |
| Neutral | 0.04 | 0.01 | 0.03 | 0.05 | 0.01 | |
| Disagree | 0.04 | -0.02 | 0.03 | 0.07 | 0.03 | |
| Strongly disagree [not financially viable] | 0.06 | 0.06 | 0.12* | 0.09 | -0.08 | |
| Service staff size | 1-6 (reference) | |||||
| 7-10 | 0.03 | 0.00 | 0.04 | 0.08* | 0.03 | |
| 11-15 | 0.03 | 0.01 | 0.10** | 0.08* | 0.09** | |
| 16-24 | 0.07* | 0.08* | 0.14*** | 0.09* | 0.10*** | |
| 25 or more | 0.07 | 0.06 | 0.11** | 0.11** | 0.11*** | |
| Provider size (number of services) | 1 (reference) | |||||
| 2-5 services | -0.02 | -0.03 | 0.02 | -0.02 | 0.06** | |
| 6-99 services | -0.22*** | -0.19*** | -0.06 | -0.23*** | 0.15*** | |
| 100+ services | -0.27*** | -0.24*** | -0.19*** | -0.17*** | 0.13*** | |
| Organisation type | Public / community (ref.) | |||||
| Private | 0.03 | -0.06* | -0.02 | -0.01 | -0.01 | |
| n | 2534 | 2541 | 2520 | 2497 | 2383 | |
Source: Baseline SELCS, Wave 1, May-June 2018
Note: Table shows marginal effects evaluated at mean, for categorical data the represents the difference in the probability of the use of the source of information relative to that of the base case. Services with a non-missing value on the question about a particular information source, but missing value on any of the explanatory variables were retained, but findings for those 'missing' categories are not shown. Standard errors calculated through jackknife replication. a In Home Care Omitted in model as it perfectly predicts use. * p<0.05; ** p<0.01; *** p<0.001.
| Variable | Department of Education & Training support | Department of Human Services support | Software provider support | Own organisation or peak support | |
|---|---|---|---|---|---|
| Coefficients | |||||
| Service type | Long day care (ref.) | 0.00 | 0.00 | 0.00 | 0.00 |
| Family day care | 0.13 | 0.11 | -0.31*** | -0.20** | |
| Outside school hours | 0.01 | 0.02 | -0.08 | -0.11 | |
| Occasional care | 0.40*** | 0.27* | 0.19 | -0.03 | |
| Budget based funded | 0.74*** | 0.07 | 0.20 | 0.51*** | |
| In home care | -0.65** | -0.67** | -0.67** | -0.06 | |
| State/ Territory | NSW (reference) | 0.00 | 0.00 | 0.00 | 0.00 |
| VIC | 0.17** | 0.16** | 0.17* | 0.05 | |
| QLD | 0.21*** | 0.17** | 0.31*** | 0.09 | |
| SA | 0.12 | 0.05 | 0.38*** | 0.18* | |
| WA | 0.27** | 0.24** | 0.34*** | 0.08 | |
| TAS | 0.29* | 0.20 | 0.52*** | 0.13 | |
| ACT | -0.21 | -0.24 | 0.02 | 0.05 | |
| NT | 0.21 | -0.01 | 0.54*** | 0.44** | |
| Remoteness | Major city area (reference) | 0.00 | 0.00 | 0.00 | 0.00 |
| Inner regional area | -0.04 | -0.04 | 0.06 | 0.01 | |
| Outer regional area | -0.06 | -0.08 | -0.02 | -0.13 | |
| Remote area | 0.15 | 0.12 | -0.07 | -0.16 | |
| Very remote area | 0.32* | 0.49* | -0.10 | -0.15 | |
| Socio economic index of area: disadvantage and advantage | Most disadvantaged (ref.) | 0.00 | 0.00 | 0.00 | 0.00 |
| 2nd quintile | -0.09 | -0.10 | -0.06 | -0.02 | |
| 3rd quintile | -0.00 | -0.01 | -0.03 | -0.03 | |
| 4th quintile | 0.04 | -0.03 | -0.00 | -0.01 | |
| Most advantaged | 0.05 | -0.01 | 0.07 | 0.01 | |
| Agreement that the service is financial viability | Strongly agree [financially viable] (reference) | 0.00 | 0.00 | 0.00 | 0.00 |
| Agree | -0.11 | -0.10 | -0.03 | -0.01 | |
| Neutral | -0.23*** | -0.28*** | -0.17* | -0.18** | |
| Disagree | -0.49*** | -0.46*** | -0.27** | -0.27** | |
| Strongly disagree [not financially viable] | -0.85*** | -0.72*** | -0.29* | -0.67*** | |
| Service staff size | 1-6 (reference) | 0.00 | 0.00 | 0.00 | 0.00 |
| 7-10 | -0.03 | -0.08 | -0.03 | 0.00 | |
| 11-15 | -0.13 | -0.20** | 0.02 | -0.01 | |
| 16-24 | -0.15 | -0.20** | -0.10 | 0.02 | |
| 25 or more | -0.23** | -0.29*** | -0.05 | 0.10 | |
| Provider size (number of services) | 1 (reference) | 0.00 | 0.00 | 0.00 | 0.00 |
| 2-5 services | -0.01 | -0.08 | -0.07 | 0.15** | |
| 6-99 services | 0.22*** | 0.18** | -0.02 | 0.39*** | |
| 100+ services | 0.24*** | 0.22** | -0.02 | 0.35*** | |
| Organisation type | Public / community (ref.) | 0.00 | 0.00 | 0.00 | 0.00 |
| Private | 0.22*** | 0.23*** | 0.16** | 0.22*** | |
| Constant | 3.09*** | 3.20*** | 3.67*** | 3.61*** | |
| n | 2505 | 2461 | 2501 | 2323 | |
| r2 | 0.08 | 0.07 | 0.04 | 0.10 | |
Source: Baseline SELCS, Wave 1, May-June 2018.
Note: Services with a non-missing value on support satisfaction but missing value on any of the explanatory variables were retained, but findings for those 'missing' categories are not shown. Standard errors calculated through jackknife replication. * p<0.05; ** p<0.01; *** p<0.001. 1 = strongly disagree [not enough support from this source] to 5 = strongly agree [enough support from this source].
| Variable | Services' greater understanding of the package | Families' greater understanding of the package | |
|---|---|---|---|
| Coefficients | |||
| Service type | Long day care (ref.) | 0.00 | 0.00 |
| Family day care | 0.29*** | 0.24*** | |
| Outside school hours | 0.07 | 0.07 | |
| Occasional care | 0.19 | 0.34*** | |
| Budget based funded | 0.69*** | 0.09 | |
| In home care | 0.46 | -0.21 | |
| State/ Territory | NSW (ref.) | 0.00 | 0.00 |
| VIC | 0.11* | 0.12* | |
| QLD | 0.12* | 0.06 | |
| SA | 0.14 | 0.12 | |
| WA | 0.25*** | 0.07 | |
| TAS | 0.45*** | -0.14 | |
| ACT | -0.22 | 0.07 | |
| NT | 0.13 | 0.03 | |
| Remoteness | Major city area (ref.) | 0.00 | 0.00 |
| Inner regional area | -0.01 | 0.06 | |
| Outer regional area | -0.14* | 0.02 | |
| Remote area | -0.04 | 0.17 | |
| Very remote area | -0.22 | 0.15 | |
| Socio economic index of area: disadvantage and advantage | Most disadvantaged (ref.) | 0.00 | 0.00 |
| 2nd quintile | -0.07 | 0.03 | |
| 3rd quintile | -0.00 | 0.07 | |
| 4th quintile | -0.08 | 0.11* | |
| Most advantaged | 0.06 | 0.23*** | |
| Agreement that the service is financial viability | Strongly agree [financially viable] (reference) | 0.00 | 0.00 |
| Agree | -0.19*** | -0.12** | |
| Neutral | -0.29*** | -0.21*** | |
| Disagree | -0.20* | -0.34*** | |
| Strongly disagree [not financially viable] | -0.36** | -0.44*** | |
| Service staff size | 1-6 (reference) | 0.00 | 0.00 |
| 7-10 | 0.13* | -0.07 | |
| 11-15 | 0.23*** | -0.04 | |
| 16-24 | 0.34*** | -0.07 | |
| 25 or more | 0.32 | 0.54** | |
| Provider size (number of services) | 1 (reference) | 0.00 | 0.00 |
| 2-5 services | 0.03 | 0.01 | |
| 6-99 services | 0.02 | 0.10* | |
| 100+ services | 0.16* | 0.18** | |
| Organisation type | Public / community (ref.) | 0.00 | 0.00 |
| Private | 0.10* | 0.09* | |
| Constant | 2.39*** | 1.65*** | |
| n | 2605 | 2573 | |
| r2 | 0.07 | 0.06 | |
Source: Baseline SELCS, Wave 1, May-June 2018.
Note: Services with a non-missing value on understanding but missing value on any of the explanatory variables were retained, but findings for those 'missing' categories are not shown. Standard errors calculated through jackknife replication. . * p<0.05; ** p<0.01; *** p<0.001. 1 = poor to 5 = excellent.
| Variable | More positive impact on the child care sector | |
|---|---|---|
| Coefficients | ||
| Service type | Long day care (ref.) | 0.00 |
| Family day care | 0.22* | |
| Outside school hours | 0.23** | |
| Occasional care | 0.27 | |
| Budget based funded | 0.40 | |
| In home care | -0.94*** | |
| State/ Territory | NSW (ref.) | 0.00 |
| VIC | 0.17* | |
| QLD | -0.08 | |
| SA | 0.23* | |
| WA | 0.30* | |
| TAS | -0.18 | |
| ACT | 0.18 | |
| NT | 0.17 | |
| Remoteness | Major city area (ref.) | 0.00 |
| Inner regional area | 0.16* | |
| Outer regional area | 0.08 | |
| Remote area | 0.41* | |
| Very remote area | 0.36 | |
| Socio economic index of area: disadvantage and advantage | Most disadvantaged (ref.) | 0.00 |
| 2nd quintile | -0.04 | |
| 3rd quintile | -0.04 | |
| 4th quintile | 0.19 | |
| Most advantaged | 0.07 | |
| Agreement that the service is financial viability | Strongly agree [financially viable] (reference) | 0.00 |
| Agree | -0.11 | |
| Neutral | -0.21* | |
| Disagree | -0.62*** | |
| Strongly disagree [not financially viable] | -0.73*** | |
| Service staff size | 1-6 (reference) | 0.00 |
| 7-10 | -0.24** | |
| 11-15 | -0.24* | |
| 16-24 | -0.25* | |
| 25 or more | -0.12 | |
| Provider size (number of services) | 1 (reference) | 0.00 |
| 2-5 services | 0.21** | |
| 6-99 services | 0.36*** | |
| 100+ services | 0.79*** | |
| Organisation type | Public / community (ref.) | 0.00 |
| Private | 0.18* | |
| Constant | 2.74*** | |
| n | 2191 | |
| r2 | 0.10 |
Source: Baseline SELCS, Wave 1, May-June 2018.
Note: Services with a non-missing value on expected impact but missing value on any of the explanatory variables were retained, but findings for those 'missing' categories are not shown. Standard errors calculated through jackknife replication. . * p<0.05; ** p<0.01; *** p<0.001. 1 = large negative to 5 = large positive impact.
| Variable | Changes to hours of operation of services | Changes in the way fees are charged at this service | Increases in fees charged at this service | Changes to staffing arrangements at this service | Increased flexibility in how this service offers care | ||
|---|---|---|---|---|---|---|---|
| Coefficients | |||||||
| Service type | Long day care (ref.) | 0.00 | 0.00 | 0.00 | 0.00 | 0.00 | |
| Family day care | 0.32*** | 0.11 | 0.03 | 0.05 | 0.26*** | ||
| Outside school hours | -0.16** | -0.12 | -0.27*** | -0.23*** | -0.07 | ||
| Occasional care | 0.20 | -0.10 | -0.11 | -0.02 | -0.07 | ||
| Budget based funded | 0.65*** | 1.28*** | 1.10*** | 0.88*** | 0.58*** | ||
| In home care | 0.71* | 0.93*** | 0.33 | 0.68** | -0.27 | ||
| State/ Territory | NSW ( ref.) | 0.00 | 0.00 | 0.00 | 0.00 | 0.00 | |
| VIC | 0.03 | 0.09 | 0.08 | 0.04 | 0.20*** | ||
| QLD | 0.24*** | 0.10 | 0.03 | 0.16* | 0.26*** | ||
| SA | -0.04 | 0.02 | -0.03 | 0.13 | 0.23** | ||
| WA | 0.23** | 0.34*** | 0.26** | 0.02 | 0.36*** | ||
| TAS | 0.21 | 0.30 | 0.24 | 0.15 | 0.11 | ||
| ACT | 0.04 | -0.12 | 0.05 | 0.05 | -0.04 | ||
| NT | 0.27 | -0.06 | -0.46* | 0.22 | 0.12 | ||
| Remoteness | Major city area ( ref.) | 0.00 | 0.00 | 0.00 | 0.00 | 0.00 | |
| Inner regional area | -0.03 | -0.02 | 0.03 | -0.11 | 0.02 | ||
| Outer regional area | -0.10 | -0.00 | 0.06 | -0.17* | 0.02 | ||
| Remote area | -0.09 | 0.02 | 0.05 | -0.36** | -0.18 | ||
| Very remote area | -0.38* | -0.38* | -0.09 | -0.42** | -0.07 | ||
| Socio economic index of area: disadvantage and advantage | Most disadvantaged (ref.) | 0.00 | 0.00 | 0.00 | 0.00 | 0.00 | |
| 2nd quintile | -0.24*** | -0.08 | -0.04 | -0.02 | -0.11 | ||
| 3rd quintile | -0.20** | -0.21** | -0.20** | -0.09 | -0.08 | ||
| 4th quintile | -0.21** | -0.31*** | -0.12 | -0.21** | -0.05 | ||
| Most advantaged | -0.20** | -0.29*** | -0.23** | -0.15* | -0.09 | ||
| Agreement that the service is financial viability | Strongly agree [financially viable] (reference) | 0.00 | 0.00 | 0.00 | 0.00 | 0.00 | |
| Agree | 0.17** | 0.19** | 0.18** | 0.16** | 0.09 | ||
| Neutral | 0.11 | 0.17* | 0.16* | 0.21** | 0.02 | ||
| Disagree | 0.30*** | 0.44*** | 0.38*** | 0.41*** | -0.16 | ||
| Strongly disagree [not financially viable] | 0.06 | 0.28 | 0.48** | 0.23 | -0.57*** | ||
| Service staff size | 1-6 (reference) | 0.00 | 0.00 | 0.00 | 0.00 | 0.00 | |
| 7-10 | 0.02 | 0.19** | 0.14* | 0.16* | -0.13* | ||
| 11-15 | -0.05 | 0.20** | 0.13 | 0.18* | -0.08 | ||
| 16-24 | 0.03 | 0.30*** | 0.25*** | 0.16* | -0.15* | ||
| 25 or more | 0.06 | 0.15 | 0.19* | 0.24** | -0.21** | ||
| Provider size (number of services) | 1 (reference) | 0.00 | 0.00 | 0.00 | 0.00 | 0.00 | |
| 2-5 services | 0.03 | -0.04 | -0.06 | 0.02 | 0.01 | ||
| 6-99 services | -0.05 | 0.05 | 0.05 | -0.05 | 0.08 | ||
| 100+ services | -0.08 | 0.17* | 0.15 | 0.05 | 0.42*** | ||
| Organisation type | Public / community (ref.) | 0.00 | 0.00 | 0.00 | 0.00 | 0.00 | |
| Private | 0.17** | 0.24*** | 0.18** | 0.18*** | 0.17*** | ||
| Constant | 2.52*** | 2.77*** | 2.85*** | 2.65*** | 2.63*** | ||
| n | 2419 | 2436 | 2427 | 2463 | 2452 | ||
| r2 | 0.06 | 0.10 | 0.09 | 0.08 | 0.10 | ||
Source: Baseline SELCS, Wave 1, May-June 2018.
Note: Services with a non-missing value on expected impact but missing value on any of the explanatory variables were retained, but findings for those 'missing' categories are not shown. Standard errors calculated through jackknife replication. . * p<0.05; ** p<0.01; *** p<0.001. 1 = strongly disagree [this change unlikely] to 5 = strongly agree [this change is likely].
| Variable | A simpler process for child care payments | Increased number of children accessing care | Families increasing their hours of care | Families withdrawing children or reducing | Better access to care for vulnerable children | |
|---|---|---|---|---|---|---|
| Coefficients | ||||||
| Service type | Long day care (ref.) | 0.00 | 0.00 | 0.00 | 0.00 | 0.00 |
| Family day care | 0.24** | 0.21** | 0.11 | -0.01 | 0.29*** | |
| Outside school hours | 0.08 | 0.00 | 0.04 | -0.26*** | 0.15* | |
| Occasional care | 0.14 | 0.27* | 0.23* | -0.42*** | 0.33** | |
| Budget based funded | -0.04 | 0.42** | 0.26* | 0.06 | 0.59*** | |
| In home care | -0.54 | -0.54* | -0.87*** | 0.73*** | -0.93*** | |
| State/ Territory | NSW ( ref.) | 0.00 | 0.00 | 0.00 | 0.00 | 0.00 |
| VIC | -0.01 | 0.13* | 0.12* | -0.15* | 0.11 | |
| QLD | 0.03 | -0.07 | -0.10 | 0.21*** | -0.07 | |
| SA | -0.03 | 0.28*** | 0.22** | -0.22** | 0.09 | |
| WA | 0.27** | 0.23** | 0.26** | -0.06 | 0.13 | |
| TAS | 0.01 | -0.09 | -0.06 | 0.19 | -0.19 | |
| ACT | 0.21 | 0.17 | 0.30* | -0.16 | -0.07 | |
| NT | -0.08 | 0.17 | 0.06 | -0.43* | 0.18 | |
| Remoteness | Major city area (ref.) | 0.00 | 0.00 | 0.00 | 0.00 | 0.00 |
| Inner regional area | 0.08 | 0.14** | 0.13* | -0.13* | -0.05 | |
| Outer regional area | 0.08 | 0.17* | 0.15* | -0.22** | 0.02 | |
| Remote area | 0.13 | 0.18 | 0.36** | -0.26* | 0.16 | |
| Very remote area | 0.11 | 0.43** | 0.39* | -0.57*** | 0.21 | |
| Socio economic index of area: disadvantage and advantage | Most disadvantaged (ref.) | 0.00 | 0.00 | 0.00 | 0.00 | 0.00 |
| 2nd quintile | -0.00 | 0.04 | 0.03 | -0.15* | 0.04 | |
| 3rd quintile | 0.01 | -0.04 | -0.02 | -0.17* | 0.06 | |
| 4th quintile | 0.06 | 0.10 | 0.06 | -0.32*** | 0.21** | |
| Most advantaged | -0.03 | -0.04 | 0.01 | -0.22*** | 0.13 | |
| Agreement that the service is financial viability | Strongly agree [financially viable] (reference) | 0.00 | 0.00 | 0.00 | 0.00 | 0.00 |
| Agree | -0.09 | 0.01 | -0.04 | 0.12* | 0.00 | |
| Neutral | -0.10 | -0.12 | -0.14* | 0.16* | 0.03 | |
| Disagree | -0.32** | -0.42*** | -0.41*** | 0.40*** | -0.51*** | |
| Strongly disagree [not financially viable] | -0.44** | -0.69*** | -0.66*** | 0.31* | -0.62*** | |
| Service staff size | 1-6 (reference) | 0.00 | 0.00 | 0.00 | 0.00 | 0.00 |
| 7-10 | -0.08 | -0.12 | -0.04 | 0.16* | -0.14* | |
| 11-15 | -0.04 | -0.16* | -0.13* | 0.30*** | -0.16* | |
| 16-24 | -0.07 | -0.18** | -0.07 | 0.25*** | -0.26*** | |
| 25 or more | -0.09 | -0.16* | -0.09 | 0.23** | -0.30*** | |
| Provider size (number of services) | 1 (reference) | 0.00 | 0.00 | 0.00 | 0.00 | 0.00 |
| 2-5 services | 0.11 | 0.07 | 0.11* | -0.02 | 0.09 | |
| 6-99 services | 0.26*** | 0.22*** | 0.21*** | -0.04 | 0.20** | |
| 100+ services | 0.31*** | 0.52*** | 0.43*** | -0.24*** | 0.29*** | |
| Organisation type | Public / community (ref.) | 0.00 | 0.00 | 0.00 | 0.00 | 0.00 |
| Private | 0.11* | 0.22*** | 0.23*** | -0.04 | 0.15** | |
| Constant | 3.24*** | 2.40*** | 2.31*** | 3.70*** | 2.81*** | |
| n | 2397 | 2418 | 2435 | 2450 | 2401 | |
| r2 | 0.05 | 0.10 | 0.09 | 0.09 | 0.08 | |
Source: Baseline SELCS, Wave 1, May-June 2018.
Notes: Services with a non-missing value on expected impact but missing value on any of the explanatory variables were retained, but findings for those 'missing' categories are not shown. Standard errors calculated through jackknife replication. * p<0.05; ** p<0.01; *** p<0.001. 1=strongly disagree [this change unlikely] to 5=strongly agree [this change is likely].
A.4. Supplementary table: Chapter 6
| Characteristic | Variable | Model 1 (family characteristics) | Model 2 (adding changed cost of care) |
|---|---|---|---|
| Family care type | LDC no OSHC (reference) | 0.00 | 0.00 |
| OSHC no LDC | -0.12 | -0.04 | |
| LDC and OSHC | -0.28* | -0.13 | |
| FDC only | -0.26 | -0.15 | |
| Other | -1.37*** | -1.09** | |
| Parental employment | Couple, both employed (reference) | 0.00 | 0.00 |
| Couple, one employed | -0.03 | -0.00 | |
| Employed single | 0.13 | 0.00 | |
| Jobless single or couple | 0.01 | 0.06 | |
| Previous Child Care Assistance | CCB or other subsidy (reference) | 0.00 | 0.00 |
| CCR only | -0.05 | 0.09 | |
| No government subsidy | -0.14 | -0.07 | |
| Household income | <$65k (reference) | 0.00 | 0.00 |
| $65k-$170k | -0.23 | -0.29* | |
| $170k plus | -1.01*** | -0.66*** | |
| Age of youngest child | 0-2 years (ref) | 0.00 | 0.00 |
| 3-5 years | 0.20 | 0.12 | |
| 6-12 years | -0.16 | -0.09 | |
| Change in child care costs | A lot more (reference) | 0.00 | 0.00 |
| A little more | 0.91*** | ||
| About the same | 1.10*** | ||
| A little less | 1.69*** | ||
| A lot less | 1.82*** | ||
| Constant | 3.66*** | 2.43*** | |
| n | 460 | 460 | |
| r2 | 0.19 | 0.39 |
Source: Child Care Package Families Survey November 2018.
Notes: Coefficients not shown for Don't Know categories of household income, previous child care assistance and changes in child care costs. All family characteristics are as at May 2018: * p<0.05; ** p<0.01; *** p<0.001. From (1) entirely negative to (5) entirely positive.
Edited extract from the Australian Government Department of Education and Training Child Care Provider Handbook
Four types of child care service are able to be approved by the Department of Education and Training for the provision of Child Care Subsidy under Family Assistance Law:
- Centre Based Day Care
- Family Day Care
- Outside School Hours Care
- In Home Care.
Each type of care, and some basic rules that apply, is described in more detail in the following sections.
A provider may deliver different types of approved services. For example, a provider may offer a Centre Based Day Care service and an Outside School Hours Care service. A separate approval is required for each service that the provider delivers if Child Care Subsidy is to be payable for that service.
A provider may also offer different types of care under the same service approval at a single location. For example, an approved Centre Based Day Care service may provide care to both non-school aged and school aged children. Similarly, an Outside School Hours Care service may provide care to both school aged and non-school aged children. The type of service approval will be determined by the care mostly provided by that service, that is, whether care was mostly provided to school aged children or non-school aged children.
Minimum periods of operation generally apply to each service type. Services wishing to operate for less than the required minimum operating period will need to seek a determination from the Department of Education and Training. Services will need to demonstrate that special circumstances apply that make it appropriate for the service to operate for a shorter period. For example, consideration may be given to evidence that shows a service operates in an area where seasonal demand is high or that it operates as a sole provider in the area…
Some services (those that were Budget Based Funded Services prior to July 2018, and new services that are listed at Section 50 of the Minister's Rules) are exempt from minimum operating period requirements, and meeting National Law and state and territory requirements (for the purposes of the Child Care Subsidy), though they will generally fall within one of these categories.
B.1. Centre Based Day Care
This is child care that is provided in centres that are approved by the relevant state or territory authority. It can include any pattern or arrangement of care provided in this setting.
Minimum periods of operation
Centre Based Day Care must operate for at least 48 weeks per year.
Beyond this minimum, the provider can decide on the hours of care provided per day and the number of days per week. Providers can consider flexible options that suit their children and families, as well as their business.
B.2. Family Day Care
This child care is usually provided in the home of an educator. An educator may provide care in their home for a group of children, although rules apply - as outlined below. Family Day Care must be provided as part of an approved service, by an approved provider.
Minimum periods of operation
Family Day Care services must operate for at least 48 weeks per year.
Maximum number of children
No more than seven children at a time may be in the care of each Family Day Care educator, and no more than four of the children can be preschool age or under. These are requirements of the National Law (not the Family Assistance Law) ...
Under the Family Assistance Law, children who are a niece/nephew, cousin or grand/great-grandchild of a Family Day Care educator must make up fewer than half of the children to whom the educator is providing care within any fortnight.
Care of own children or siblings excluded from Child Care Subsidy
There is no entitlement to Child Care Subsidy or Additional Child Care Subsidy where a Family Day Care educator, or their partner, cares for:
- their or their partner's child, including a foster care child, adopted child, kinship child or child for which they otherwise have legal responsibility, or
- their or their partner's brother, sister, half-brother or half-sister, step-brother or step-sister (noting some exemptions apply).
Care of a Family Day Care educator's children by other Family Day Care educators
There is no entitlement to Child Care Subsidy or Additional Child Care Subsidy where a Family Day Care educator's, or their partner's, child is provided with care by any Family Day Care service if they (the educator) provide care for a Family Day Care service on that same day, unless (in summary) either:
- the child is one of the following:
- an eligible disability child (has evidence of current diagnosis by a qualified practitioner of a recognised condition)
- an eligible Inclusion Support Programme child (for whom the service is receiving Inclusion Support Programme assistance)
- a remote area child (living in an area designated as remote, or very remote, under the Australian Standard Geographical Classification);
- or the parent has supplied evidence that, at the usual time that care is provided, they either
- work in paid work that is not for an approved Family Day Care service, or
- study (are enrolled in education or training towards a recognised qualification provided by a registered training organisation).
(More details about these circumstances are available in the handbook.)
Records must also be kept of care that is provided at premises other than the educator's home.
B.3. Outside School Hours Care
This provides care before and after school hours and during school holidays for children who normally attend school.
Children who do not attend school may attend Outside School Hours Care (for example, a service may provide care for preschool aged siblings of school aged children), and the mix of children attending the service can vary from day-to-day, or week-to-week. However, an Outside School Hours Care service must be designed to predominantly care for school aged children.
Minimum periods of operation
Outside School Hours Care services must operate for at least seven weeks per year.
Beyond this minimum, the provider can decide the hours of care provided per day and the number of days per week. Providers can consider flexible options that suit families, as well as their business.
B.4. In Home Care
In Home Care is a flexible child care option, providing care in the family home and is available to families unable to access Centre Based Day Care, Family Day Care and Outside School Hours Care due to their unique circumstances and where one or more of the following criteria apply:
- parents or carers are working non-standard or variable hours, outside normal child care service hours
- parents or carers are geographically isolated from other types of approved child care, particularly in rural or remote locations
- the family has challenging or complex needs, including where families are experiencing challenging situations, and other approved child care services are not able to meet the needs of the child or the family.
Families accessing In Home Care due to challenging or complex needs may have circumstances that include one or more of the following:
- a child with additional needs or a disability whose early childhood education and care requirements cannot be catered for in another approved child care setting, or through other government funded or community-based services
- a family where a parent is undergoing treatment for a serious illness
- other complex family situations that prevent families from accessing other approved child care types.
In Home Care must be provided as part of an approved service, by an approved provider.
Minimum periods of operation
In Home Care services must operate for at least 48 weeks per year.
Maximum number of children
No more than five children at a time may be in the care of each In Home Care educator, and no more than four of the children can be preschool age or under. All children must be from the same family.
If there are more than the maximum number of children in the family requiring In Home Care, then a second educator may be engaged for another session of care.
Care for own family excluded from Child Care Subsidy
There is no entitlement to Child Care Subsidy or Additional Child Care Subsidy where an In Home Care educator cares for:
- their or their partner's child, including a foster care child, adopted child, kinship child or child for which they otherwise have legal responsibility, or
- their or their partner's brother, sister, half-brother or half-sister, step-brother or step-sister (noting some exemptions apply)
- their or their partner's niece, nephew, cousin, grandchild or great-grandchild.
Care of an In Home Care educator's children by other In Home Care educators
There is no entitlement to Child Care Subsidy or Additional Child Care Subsidy where an In Home Care educator's, or their partner's, child is provided with care by any In Home Care service if they (the educator) provide care for an In Home Care service on that same day.
In Home Care Support Agencies
Providers and services must be registered with the relevant In Home Care Support Agency to provide In Home Care Services in that state/territory.
In Home Care Support Agencies service each state and territory, ensuring the program maintains a focus on quality early childhood education and care and advocating for families and supporting them to find care that meets their needs.
In Home Care Support Agencies will assess the family's suitability for In Home Care and match those families to suitable services that have the capability to provide care that meets the family's needs. They will work with the family to develop a Family Management Plan tailored to meet the family's unique needs and will identify referral pathways to disability and family support services including government funded and community based services, where appropriate.
In Home Care Support Agencies provide recommendations to the Department of Education and Training on the allocation of places. Taking these recommendations into account, the Department allocates places to services for families who are suitable for the In Home Care service type, with the focus being on an equitable distribution of places nationally …
In Home Care educator qualifications
In Home Care educators are required to have a minimum Certificate III level qualification in a relevant course, or be working towards a Certificate III qualification and provide documentary evidence. A Certificate III, a diploma or a degree in Early Childhood Education or equivalent qualifications that have a major focus on Early Childhood Education are acceptable qualifications.
C.1. Summary of data collections
| Data collection | Description |
|---|---|
| Services, providers, stakeholders | |
| Survey of Early Learning and Care Services (SELCS) | The Survey of Early Learning and Care Services is a longitudinal survey directed at the managers or directors (or equivalent) of a sample of early learning and care services. Wave 1 was conducted in May-June 2018. Three waves are planned. These data will allow reporting on key issues for the services (e.g. simplicity of child care support, expected changes to the service/sector as a result of the Package) as well as issues for families (e.g. affordability, flexibility, accessibility). |
| Qualitative interviews with stakeholders | This qualitative component involves interviews with services, providers and other sector and community stakeholders. The methodology involves a mix of longitudinal and cross-sectional data collection. Three waves of 15 interviews with high−level stakeholders, and three waves of 30−50 interviews with providers and services are planned. |
| IHC online services survey | All in home care services would be invited to complete an online survey of IHC services. Our methodology will be based on the Survey of Early Learning and Care Services, but with specific questions developed to enable reporting against the outcome measures for IHC. This will include questions about the IHC service, the educators providing care and the families and/or children receiving care. Two waves are planned. |
| ISP online services survey | An online survey will be developed, using a similar approach to that used for the Survey of Early Learning and Care Services but leveraging off the data that is available through administrative data on services' engagement with ISP. Questions will be designed that correspond to the measures the evaluation is required to report on, where those measures are best sourced from services but not available in existing data. Two waves are planned. |
| ISP brokerage agency interviews | Two waves are planned for 2019/20, supplementing the ISP Case Study that will also incorporate ISP brokerage agency interviews. |
| Parents and families | |
| Child care evaluation survey of parents (online) | The evaluation team plans to conduct an online survey of parents, with a sample drawn from consenting participants in the May 2018 ORIMA Parent Survey. This will be a longitudinal survey, following parents who were child care users at the time of the May 2018 survey. This survey will allow the evaluation team to collect longitudinal data relevant to the objectives of the Child Care Package, leveraging off the ORIMA Parent Survey. Three waves are planned. |
| IHC online families survey | An online survey of families is planned, however, response rates are likely to be very low, and this on its own is not expected to yield a sample of sufficient size or representativeness. The online methodology for this survey would therefore be complemented by conducting a proportion of these surveys with respondents via telephone. Two waves are planned. However, given the uncertainty of the response to the online survey, for the second wave we will consider the potential use of qualitative data collection methods, in the event that the second wave survey proves to be not viable. |
| Case studies | |
| Community-based and population-based case studies (7 case studies) | A total of 7 community-based and population-based case studies are planned. These case studies will involve both qualitative and quantitative elements. The case studies will supplement the other elements of the evaluation by focusing in depth on specific population groups of interest to the policy formation and on geographical areas where the operation of the policy can be examined in detail in different contexts. The objectives of this component are to:
For some case studies, there will be more than one wave of data collection, while for others just one wave will be sufficient. In addition to the ISP case study (see below), the fieldwork for selected existing case studies will be extended to allow additional data collection specifically relevant to ISP. This additional fieldwork will focus on services receiving ISP funding and families using those services. This will allow issues about inclusion and the ISP to be explored in context of the other issues explored by the case studies. |
| Program-based case studies (2 case studies) | There will be 2 program-based case studies: one for IHC and one for ISP. These case studies will bring together a range of data collection methods from multiple sources that relate specifically to each program. An IHC case study will involve interviews with departmental staff, IHC Support Agencies in each state, a select group of services and families using IHC and other stakeholders. This will also provide insights into interactions between IHC and other aspects of the Child Care Package (for example, ACCS) as well as with other support services (for example, NDIS). Families are specifically included in the IHC case study, to allow us to capture the complexity of families' experiences with the program. While the proposed web (and phone) IHC family survey (described above) will aim to capture an overview of family experiences, it is unlikely to fully capture the complexity for families. The ISP case study will involve interviews with key informants from the Department, ISP brokerage agencies, Inclusion Professionals, the Inclusion Development Fund Manager, service providers using ISP (and, for large service providers, those who manage ISP within the organisation) and other stakeholders. This case study will involve one wave of data collection. (See also, under stakeholder interviews, stakeholder consultations will also be held at additional points in time.) |
| Qualitative parent data (counted as 3 case studies). This will include collection of between-wave qualitative online data. | The qualitative parent interviews comprise interviews with a small number of families (about 30), interviewed at three points in time. That is, each point in time will form a case study. These respondents will be drawn from the evaluation's parent survey described previously, with selected respondents invited to participate in more in-depth interviews. A component of this will be longitudinal, following some families over 2018 to 2020. In addition to the in-depth interviews, respondents will be invited to contribute their perspectives on topics of relevance to the broad evaluation through online forums or focus groups. This component has been designed to allow for some flexibility, meaning we can collect data from these parents as issues emerge during the evaluation. |
| 2018 | 2019 | 2020 | ||||||||||
|---|---|---|---|---|---|---|---|---|---|---|---|---|
| Method | Jan-Mar | Apr-Jun | Jul-Sept | Oct-Dec | Jan-Mar | Apr-Jun | Jul-Sept | Oct-Dec | Jan-Mar | Apr-Jun | Jul-Sept | Oct-Dec |
| Services, providers, stakeholders (see also the case studies) | ||||||||||||
| Survey of Early Learning and Care Services | W1 | W2 | W3 | |||||||||
| Qualitative interviews with stakeholders | W1 | W1 | W2 | W2 | W3 | W3 | ||||||
| IHC online services survey | W1 | W2 | ||||||||||
| Interviews with ISP brokerage agencies, Inclusion Professionals, IDF Manager (see CS2 for W1) | W2 | W3 | ||||||||||
| Parents and families (see also the case studies) | ||||||||||||
| Child care evaluation survey of parents (online) | W1 | W2 | W3 | |||||||||
| IHC online families survey | W1 | W2 | ||||||||||
| Qualitative parent data (including between-wave qualitative online) | W1 | W2 | W3 | |||||||||
| Case Studies | ||||||||||||
| Location 1: low SES | Pilot (CS1) | CS1 | CS1 | |||||||||
| CS2: ISP case study | CS2 | |||||||||||
| CS3: IHC case study (including interviews with agencies) | CS3 | CS3 | ||||||||||
| Location 2: (e.g.: middle to high SES) | CS4 | |||||||||||
| Location 3 (with CALD & High Refugee population) | CS5 | CS5 | ||||||||||
| Location 4 Indigenous (where there is a BFF transitioning) | CS6 | CS6 | CS6 | |||||||||
| CS6: ACCS Program Case Study | CS7 | |||||||||||
| CS7 to be determined | CS8 | CS8 | ||||||||||
| Location 5: Rural/remote | CS9 | |||||||||||
C.2. Survey of Early Learning and Care Services
The Baseline SELCS, Wave 1, was conducted in May-June 2018, just before the introduction of the new Child Care Package. This survey provides baseline data about service characteristics, as well as providing information about services' preparedness for the changes and views of service managers and directors about the likely impact of these changes.
The Baseline SELCS was designed by the AIFS-led consortium to inform the evaluation of the Child Care Package, through consultation with the Australian Government Department of Education and Training and representatives of the child care sector. Data collection was undertaken by the Social Research Centre, one of the consortium members.
Data collection was 28 May 2018 to 29 June 2018. A sample of 5,300, out of an in-scope population of 12,759 services was invited to participate in the survey. The sample was stratified by service type and location and size.
A total of 2,808 services responded to the survey. This is response rate of 53 per cent, although the response rated varied by sector. Around half the surveys were completed by Computer Assisted Telephone Interviews (CATI), a small number at the enterprise/ provider level and the rest completed online.
During phone interviews, participants often expressed a desire to contribute to the evaluation. Refusals were most often related to time constraints.
| Characteristic | Variable | Weighted % |
|---|---|---|
| Service type | Long day care | 57.8% |
| Family day care | 4.5% | |
| Outside school hours | 35.4% | |
| Occasional care | 0.8% | |
| Budget based funded | 1.1% | |
| In home care | 0.5% | |
| State/territory | NSW (reference) | 36.4% |
| VIC | 23.3% | |
| QLD | 19.4% | |
| SA | 6.2% | |
| WA | 9.0% | |
| TAS | 2.2% | |
| ACT | 2.2% | |
| NT | 1.4% | |
| Remoteness | Major city area (reference) | 74.0% |
| Inner regional area | 16.8% | |
| Outer regional area | 7.1% | |
| Remote area | 1.2% | |
| Very remote area | 0.9% | |
| Socio economic index of area: disadvantage and advantage | Most disadvantaged (reference) | 15.1% |
| 2nd quintile | 16.2% | |
| 3rd quintile | 19.9% | |
| 4th quintile | 18.8% | |
| Most advantaged | 26.7% | |
| Missing | 3.4% | |
| Perceived service financial viability | Strongly agree (reference) | 20.3% |
| Agree | 35.0% | |
| Neutral (ref) | 17.4% | |
| Disagree | 6.0% | |
| Strongly disagree | 3.5% | |
| Don't know / Prefer n.. | 17.8% | |
| Service staff size | 1-6 (reference) | 25.4% |
| 7-10 | 18.7% | |
| 11-15 | 17.9% | |
| 16-24 | 20.9% | |
| 25 or more | 16.2% | |
| Missing | 0.9%^ | |
| Provider size (number of services) | 1 (reference) | 38.2% |
| 2-5 services | 20.6% | |
| 6-99 services | 21.4% | |
| 100+ services | 19.7% | |
| Organisation type | Public / community (reference) | 38.6% |
| Private | 61.4% | |
| 21.4% | ||
| n | 2561 |
Source: Baseline SELCS, Wave 1.
Note: * p<0.05; ** p<0.01; *** p<0.001 ^RSE > = 25%
C.3. Baseline Parent Survey
The Baseline Parent Survey was conducted by ORIMA research in May 2018 as a random sample survey of parents with young children. Child care users were sampled from the Australian Government Department of Education and Training's Child Care Management System (CCMS) administrative data for the March quarter 2018, while non-child care users were sourced from an online panel maintained by the ORIMA Online Research unit. Data were collected online, and for targeted populations using Computer assisted telephone interviews (CATI) and computer assister personal interview (CAPI).
Survey respondents recruited from CCMS data were asked if their details contact information could be provided to AIFS for further data collection. Those that consented formed the subsample for our Child Care Packages families survey, as detailed in Appendix E.2.
The baseline survey captures a range of quantitative data including:
- respondent and partner's employment and activity status
- use of, and views on, paid child care
- use of, and views on, early childhood education (ECE)
- use of, and views on, unpaid child care
- understanding of the child care system, including sources of information about child care services and government fee assistance
- attitudinal questions related to career, child care and family
- demographic characteristics.
6,189 parents completed the baseline parents survey, of which 4,423 (71.5 per cent) were formal child care users. To ensure adequate coverage of smaller populations of interest, sampling rates of these groups were increased. Weights were then calculated to produce unbiased population estimates. Unless otherwise indicated, this report uses the full sample of child care users with population weights applied. For more information, see the final report (ORIMA Research 2018). A table of sample characteristics can be found in Appendix C.4.
C.4. The Child Care Package Family Survey
The Child Care Package Survey was conducted online by AIFS, in November 2018. This survey was designed to collect information that supplements the information collected in the ORIMA Baseline Parent Survey. In effect, the ORIMA survey is Wave 0 for these respondents. 1,980 Baseline Parent Survey respondents who used child care and agreed to be contacted by AFIS were in scope for this survey. Valid email address for 1,827 of the 1,980 persons, and so the initial invitation to participate in the survey was sent by email to them, with follow-up emails sent through the field work period to maximise response.
The survey was open from 29 October to 30 November, during which 502 participants completed the survey in full, with an additional 80 partial completes, for an overall response rate of 32 per cent (27 per cent for complete responses). For this report, only complete responses were included in analysis.
The survey captured information from parents and carers on:
- Use and costs of child care, to allow analysis of how it has changed since May 2018.
- The experiences of parents relating to the Child Care Subsidy application process.
- Information about eligibility for CCS and ACCS.
- How child care has changed (and why).
- Parents' experience of child care provision, including their perceptions about and satisfaction with the services they use.
- Parents' work and other activities.
The sample is not a representative sample. The sample is entirely drawn from respondents to the Baseline Parent Survey, who were randomly selected into that survey from the child care administrative data and then consented for their details to be passed on to AIFS. Therefore, the sample for this survey may be biased toward families with certain characteristics. Table C.4.1shows the distribution of family characteristics in our sample, compared with our sampling frame and the population-representative weighted ORIMA values.
| CCPFamS participants (n = 502) | CCPFamS sampling frame ( n = 1,980) | ORIMAa (n = 4,423) | ||
|---|---|---|---|---|
| n | % | % | % | |
| Age of youngest child | ||||
| 1 year or less | 120 | 24.0 | 23.4 | 19.7 |
| 2 or 3 years | 197 | 39.4 | 34.1 | 33.4 |
| 4 or 5 years | 96 | 19.2 | 20.1 | 19.4 |
| 6 to 13 years | 87 | 17.4 | 22.4 | 27.5 |
| Child care assistance | ||||
| CCB or other additional support | 242 | 48.4 | 49.6 | 51.3 |
| CCR only | 214 | 42.8 | 41.7 | 38.0 |
| No government subsidy | 38 | 7.6 | 8.7 | 10.7 |
| Relationship to child/childrenb | ||||
| Parent | 459 | 91.8 | 89.6 | 98.9 |
| Grandparent | 38 | 7.6 | 10.3 | 0.5 |
| Guardian or primary carer | 13 | 2.6 | 1.3 | 0.8 |
| Parental employment | ||||
| Couple, both employed | 340 | 68.0 | 62.0 | 60.9 |
| Couple, one employed | 53 | 10.6 | 11.4 | 12.8 |
| Employed single | 60 | 12.0 | 13.4 | 16.6 |
| Jobless single or couple | 47 | 9.4 | 13.1 | 9.7 |
| Household income | ||||
| Up to $65k | 111 | 22.1 | 27.4 | 29.1 |
| $65k-$170k | 239 | 47.6 | 43.6 | 49.9 |
| Over $170k | 129 | 24.7 | 23.9 | 15.3 |
| Don't know/Missing | 23 | 4.7 | 5.1 | 5.7 |
| Child care usec | ||||
| Long Day Care | 348 | 69.6 | 63.3 | 60.2 |
| Family Day Care | 60 | 12.0 | 14.3 | 13.4 |
| Occasional Care | 18 | 3.6 | 2.8 | 4.3 |
| Outside School Hours Care | 218 | 43.6 | 41.8 | 39.9 |
| In Home Care | 6 | 1.2 | 0.8 | 0.7 |
| Nanny/Informal care | 90 | 18.0 | 14.1 | 10.5 |
Source: CCPFamS, November 2018, Baseline Parent Survey (ORIMA). May 2018.
Note: Percentages for the CCPFamS and sampling frame are unweighted. ORIMA percentages are weighted. a child care users only. b Multiples possible. c At least one child in child care
C.5. Living in Australia (LinA)
LinA is a panel survey conducted by the Social Research Centre. It is based on random probability-based sampling methods and comprises both an online and offline population. The survey is designed to be generalisable to the Australian population aged 18 years and over, and is conducted through a mix of online and telephone interviews.
In July and August 2018 (waves 18 and 19) the survey contained a number of questions relating to child care with these being specifically concerned with the introduction of the new Child Care Package on 2 July 2018. The July (Wave 18) survey was undertaken in the second half of the month, and hence subsequent to the new arrangements. There were 2,260 respondents to the Wave 18 survey. In August (Wave 19), there were 2,220 respondents, of which 88 per cent were web-based, with the balance being undertaken by Computer Assisted telephone Interview (CATI).
Survey questions in July 2018 focused on the experiencing of transitioning to the new child care assistance. First there was a screening question to identify the child care population (those with children using paid child care), and the second asked about the application process. Specifically:
- For your family, was the process of applying for the new child care fee assistance (which commenced from 2nd July 2018) easy or difficult?
The August questions addressing the early impact of the changes. After a screening question, they were asked about:
- the impact of the changes on the net cost of child care for households
- the extent to which people had responded to changes in the subsidy arrangements with respect to their work, study and other activities
- their views on the changes and child care more generally.
While LinA is designed to obtain information for the Australian population as a whole, the size of the sample limits its capacity to provide detailed information on sub-populations, including on those individuals using child care. In wave 18 206 respondents reported that they had children who used paid child care, and in wave 19 there were 184 who reported using paid child care in the previous six months.
These relatively small sample sizes pose a series of limitations of the child care questions. When weights are applied, the population of users does not easily translate into an estimate of the number of families using child care nor does it benchmark well against administrative and other data collections. Further, individual estimates are subject to high sampling variability which in most cases renders differences observed in the data as being statistically insignificant, severely restricting the ability to draw inferences from the survey as to the impact.
Notwithstanding this it is considered that the findings of these surveys, when used with caution, provide some insight into the changes and their consequences, both directly, and as a tool for the development of more detailed evaluation strategies.
The first waves of two of the qualitative evaluation data collections were conducted in the latter part of 2018: the high-level stakeholder interviews and the pilot case study.
Qualitative interviews with stakeholders were conducted in November and December 2018. Those interviewed included representatives from peak bodies, child care providers and some Department of Education and Training state network representatives. In total 32 research participants were interviewed with further interviews planned for early 2019.
The first pilot case study was located in a low socioeconomic area. Research participants were recruited from a selection of services. These were a mix of local government, for profit and non-profit child care and early learning providers, both small owner managed services and large organisations. There were 22 research participants from child care and also other local services. Most interviews were conducted between August and October 2018. Interviews with families are still being conducted but the case study is nearing completion.
Both these data collections produced very rich data which is still being analysed. It is too early to report on the findings in this report. However, below we have provided some preliminary comments on a theme regarding disadvantaged and vulnerable families that is emerging strongly from the data. We will report more fully on this theme at a later date.
D.1. Disadvantaged and vulnerable families
A strong theme emerging from the pilot case study and the stakeholder interviews is a concern about the effect of the Child Care Package on disadvantaged and vulnerable families. These concerns are discussed below.
Activity test
Under the Child Care Safety Net, low-income families earning $66 958 or less per annum, who do not meet the activity test, are entitled to access 24 hours of subsidised care a fortnight. As most Long Day Care sessions are 12 hours, these families are able to access one day a week of subsidised Long Day Care. This is a substantial reduction in the amount of subsidised care available to these families. Many of the research participants interviewed expressed concern about this reduction in subsidised care explaining that, in their view, one session per week was inadequate from an early learning perspective and was less likely to deliver the positive outcomes associated with children's participation in early learning and care. Many interviewees expressed concern that those children who most needed access to early learning and care were not receiving enough of it. Of particular concern to some research participants was the reduction in access to early learning and care for low-income Aboriginal and Torres Strait Islander families who do not meet the activity test. These research participants emphasized the importance of access to culturally appropriate early learning and care in producing better outcomes for Aboriginal and Torres Strait Islander children, particularly in preparing them for school and working towards the Australian Government's commitment to Closing the Gap.
In response to these concerns about disadvantaged and vulnerable families, a small number of services have begun offering 6-hour sessions so that these families are able to access two sessions of subsidised care a week. Some services and providers who have been offering these reduced sessions said that these sessions had to be cross subsidised from other child care income. One service said they may have to raise fees for other families in order to cover the cost of these shorter sessions.
Many research participants reported that the activity test was not well understood by disadvantaged and vulnerable families, who often didn't understand what activities would contribute to their eligibility. Some interviewees pointed out that it could be difficult for these families to meet activity test requirements, such as looking for work or volunteering, particularly in areas where employment opportunities were very limited or non-existent or when families did not have the skills, social capital or resources to take up volunteering.
Preschool programs
Several research participants reported that Centrelink has, on multiple occasions, given the wrong advice to low-income families who do not meet the activity test about the number of subsidised hours to participate in a preschool program that they are entitled to, advising these families that they are only entitled to 24 hours of subsidised hours rather than 36 hours as specified in the guidelines. This has meant that Centrelink and services have been giving conflicting advice to families. Several providers gave examples of families going back and forth, repeatedly, between a service and Centrelink trying to resolve the problem. Research participants attributed this problem to a Department of Human Services computer system problem that has yet to be fixed and that is creating ongoing confusion and stress for families and, on occasion, resulting in families choosing to follow Centrelink's advice and reduce their care rather than risk accruing debt. According to some research participants, this means that some families are accessing fewer hours of care than they are entitled to and therefore their children are missing out on what interviewees say is critical preparation for school.
Even when families do successfully apply for 36 hours of preschool, in some services they are not able to access their full entitlement. In Long Day Care services that charge 12 hour days, 36 hours equates to three days of subsidised preschool program per fortnight. Interviewees reported that services do not usually offer one day of Long Day Care in one week and two days in the next, preferring families use the same number of days every week. As a result, many families in this situation must either elect to pay full fees for one additional day per fortnight, or only use two days per fortnight.
ACCS
Most research participants cited ACCS as one of the most problematic aspects of the new package, reporting that services and providers were unprepared for how this aspect of the package would work, in part because the guide about ACCS wasn't released until 29 June 2018, only days before the go live date. Interviewees said that there have been long delays in receiving determinations and this has resulted in families either having to reduce their care or risk accruing a debt should their determination be rejected. Research participants pointed out that the delays around determinations could have potentially had serious consequences as the children affected by these delays were at risk of abuse and neglect.
Research participants also said that the assessment of determination applications was at times inconsistent or unnecessarily rigid, citing examples where applications were rejected for minor problems such as a missing birthdate or when attachments containing evidence couldn't be opened. Many said that rejection letters did not explain why an application was rejected, and there was no contact details given with which providers or families could call Centrelink with regard to an application or to resolve issues around missing information.
Stakeholders and providers also reported a lack of functionality (CCMS and third-party providers) with regard to making ACCS applications.
Those interviewed said that some, but not all, of the issues around ACCS have been resolved but these issues have taken a long time to be resolved and have created a lot of stress for services and very disadvantaged and vulnerable families.
Debt
Many interviewees said that a number of families, particularly disadvantaged and vulnerable families, have accrued debts to services. Debts appear to have arisen in several common scenarios. One of these scenarios is when families haven't confirmed their enrolment. This results in services not being paid until the issue is resolved. Research participants said that in some cases, IT problems (both CCMS and third-party provider) resulted in it taking many weeks, sometimes months, to resolve these problems. In some of these instances, when the enrolment was successfully completed, the level of subsidised care that the family was entitled to was less than the family or service anticipated. Another common scenario appears to be when families had increased their level of care under an ACCS certificate, then maintained that level of care because they were expecting a successful subsequent determination. However, in some cases the determination was rejected after lengthy delays in processing. This has meant that the increased level of care these families had been accessing was not subsidised and the family ended up accruing a considerable debt to a service. In other instances when determinations were approved or incomplete enrolment issues were resolved and families have received the amount of subsidy they were expecting, back pay has been given directly to families rather than services. Interviewees said this back payment often appeared with no notification to families about the period it related to. Research participants said that a number of families, and ACCS families in particular, didn't understand that was supposed to go to services and spent the money rather than paying services. In many of the scenarios above services had to carry the debt, which for some services created significant financial strain.
| Variable | Values | Comments |
|---|---|---|
| Respondent position | Service manager/director Service co-ordinator Authorised service personnel Certified supervisor Nominated supervisor Other, specify Missing (enterprise only) | Respondents were instructed to pick the category that best suits their position Enterprise only are those surveys completed at the provider level with no service-level response The 'other, specify' responses will be coded for later analysis. |
| Service workforce size | Numeric | Respondents were asked approximately how many staff currently work at this service. For FDC/IHC services this question captures how many coordination unit staff are employed at this service |
| Service educator workforce | Numeric | FDC/IHC services only How many educators are employed at this service |
| Number working fulltime | Numeric or missing | At the service level (and FDC coordination level) |
| Number working part-time | Numeric or missing | At the service level (and FDC coordination level) |
| Number permanent employees | Numeric or missing | At the service level (and FDC coordination level) |
| Number casual employees | Numeric or missing | At the service level (and FDC coordination level) |
Nonstandard work hour offerings: a. Weekday care before 7.00am or after 6.00pm b. Weekend care c. Overnight care d. Other outside hours care (specify) | For each: Yes No Don't know | For FDC/IHC the question asks if any educators offer these. The 'other, specify' responses will be coded for later analysis. |
Number of educators offering: a. Weekday care before 7.00am or after 6.00pm b. Weekend care c. Overnight care d. Other outside hours care (specify) | For each: Numeric | Only FDC/IHC The 'other, specify' responses will be coded for later analysis. |
Flexible arrangements offered Shorter sessions (up to 6 hours) Longer sessions (7-12 hours) Can swap days or sessions Can add days or sessions Can change or add sessions at short notice Offer occasional/casual sessions when there are temporary vacancies Other flexible arrangements (specify) | Yes No | All asked except Occasional care For FDC/IHC the question asks whether any educators offer these For OSHC, (a) and (b) were not asked. The 'other, specify' responses will be coded for later analysis. |
| Charging for early childhood education and care | Yes No Don't know / Prefer not to say | Only BBF services |
| Length of session | Specific hours Not charged by session Don't know/Prefer not to say | All except OSHC For LDC and Occasional Care, this is most common session length. For FDC/IHC this is minimum number of booking hours. |
| Method for calculating charges | Free text with options 'Don't know / Prefer not to say' | Free text will be coded up for later analysis |
| Service approach to late fees | Charged on a per minute basis (numeric - $/min) Charged some other way Other (free text) No Don't know / Prefer not to say | Free text captured for those who charge some other way (will be coded up for later analysis) |
| Service approach to charging for public holidays | Yes No Not Applicable Other (free text) Don't know / Prefer not to say | The question asks about charging for public holidays when the service is closed. Free text captures other information about public holiday charging (will be coded up for later analysis) |
Whether service has a current waitlist a. Yes - all sessions b. Yes - for specific days or times c. Yes - for some age groups d. Yes - for some educators d. No e. Don't know / Prefer not to say | For each: Yes No | The item 'for some educators' was only asked of FDC/IHC services |
Whether service had vacancies last week a. Yes - all sessions b. Yes - for specific days or times c. Yes - for some age groups d. Yes - for some educators d. No e. Don't know / Prefer not to say | For each: Yes No | The item 'for some educators' was only asked of FDC/IHC services |
Perceived difficulty for service in meeting the needs of parents who: a. Work shifts b. Have irregular or unpredictable working hours c. Have early work starts (before 7am) d. Have late work finishes (after 6pm) | For each: Not difficult at all A little difficult Difficult Very difficult Cannot accommodate Not applicable Don't know / Prefer not to say | |
| Perceived demand for more flexible care options at this service | Yes No Don't know / Prefer not to say | |
| Perceived impediments to meeting demands for more flexible care options | Specified (Free text) Don't know / Prefer not to say | Free text will be analysed further |
| Frequency of service difficulties collecting child care fees | Never Rarely Sometimes Often Always Not applicable Don't know / Prefer not to say | |
| Perceived proportion of families at this service who have difficulties paying child care fees | None A few A moderate number Most All Don't know / Prefer not to say | |
| Whether aware of the cause of families' payment difficulties | Yes Maybe / to some extent | |
Perceived reasons for parents' difficulties paying child care fees No employment Intermittent or unpredictable employment Low wages Multiple children in care High housing and other costs Difficulties managing finances | For each: Not at all A little bit Moderately Considerably To a great extent Don't know / Prefer not to say | All services who were able to report on parents' difficulties paying fees |
| Whether service makes specific provisions for indigenous, CALD, additional needs or vulnerable children | Yes (specified with free text) No Don't know / Prefer not to say | Free text will be analysed further |
| Receives additional funding to support indigenous, CALD, additional needs or vulnerable children | Yes (specified with free text) No Don't know / Prefer not to say | Free text will be analysed further |
Perceived ability to meet the needs of: Children from low-income families Indigenous children Children from culturally or linguistically diverse families Children with disabilities Children with behavioural issues Other children with additional needs | For each: Very well Well Adequately Not well Do not have any children in this circumstance Don't know / Prefer not to say | |
| What service needs to better meet the needs of these children? | Response given (Free text) Don't know / Prefer not to say | Free text will be analysed further |
| Whether service has engaged with an Inclusion Agency and/or Inclusion Professional in past year | Yes No I don't know what an Inclusion Agency is Don't know / prefer not to say | |
| Amount of contact with Inclusion Professional | No contact A few times but not often Regularly as required Don't know / prefer not to say | |
| Satisfaction with last engagement with Inclusion Professional | Very dissatisfied Somewhat dissatisfied Neither satisfied nor dissatisfied Mostly satisfied Very satisfied Not applicable Don't know / Prefer not to say | If had contact with IA in past year |
| Reason for not engaging with or not having contact from Inclusion Agency and/or Inclusion Professional | Not eligible Not required Process too difficult Could not get an appointment Other (specified with free text) Don't know / Prefer not to say | Free text will be analysed further |
| Whether applied for Community Child Care Fund grant | Yes No I don't know what a Community Child Care Fund grant is Don't know / Prefer not to say | |
Reason for not applying for a Community Child Care Fund grant Not eligible Not required Did not think we were likely to get a grant Missed deadline Application process too difficult Have not heard about Community Child Care Fund Other (specify) Don't know / Prefer not to say | For each: Yes No | Free text will be analysed further |
| Whether likely to apply for a Community Child Care Fund grant in the future | Yes No Considering I don't know what a Community Child Care Fund grant is | |
| Whether offers preschool or kindergarten program for children in the year before full-time school | We provide a preschool/ kindergarten program for children in the year before school We arrange access to a preschool/ kindergarten program offered elsewhere We have no provision for preschool/ kindergarten program Not applicable (we don't have children in the year before school) Don't know/Prefer not to say | |
Perceived administrative burden of: Assisting families with requirements for CCB and CCR Compliance requirements and reporting under family assistance law Workplace Health and Safety requirements Workplace Relations - including compliance with awards Child Care National Quality Standards Health, food service and related requirements including food handling certificates and allergy management Family law requirements including providing reports for, or attendance at Family Court Requirements associated with the NDIS Other regulatory requirements (specified) | For each: Not a burden at all Very little burden Somewhat of a burden A large burden A major challenge Handled by central management Not applicable Don't know / Prefer not to say | For 'other regulatory requirement', free text is captured and will be analysed further |
| Additional comments about administrative and regulatory requirements | Yes (free text) No | Free text will be analysed further |
| Agreement that this service is financially viable | Strongly agree Agree Neither agree or disagree Disagree Strongly disagree Don't know / Prefer not to say | |
| Perceived understanding of the new Child Care Package | Poor Fair Good Very good Excellent Don't know / Prefer not to say | |
| Perception of service's families' understanding of the new Child Care Package | Poor Fair Good Very good Excellent Don't know / Prefer not to say | |
Resources accessed, and perceived helpfulness, for information on the new Child Care Package Child Care (CCMS) Helpdesk Department of Education and Training website Department of Education and Training webinars Department of Human Services website Support provided by your own organisation or a sector/peak body organisation | For each: Yes, it was helpful Yes, but it was not helpful No, I have not been able to access it No, I have not needed to access it I did not know about it Don't know / Prefer not to say | |
| Other sources used to get information about the new Child Care Package | Yes (specified with free text) No Don't know / Prefer not to say | Free text will be analysed further |
Perceptions of readiness and about support for the transition Their service is prepared for the changes The Department of Education and Training is providing enough support to services for these changes The Department of Human Services is providing enough support to services for these changes The third-party software provider used by their service is providing enough support for these changes Their organisation or a sector peak is providing enough support for these changes | For each: Strongly disagree Disagree Neither agree or disagree Agree Strongly agree Not Applicable Don't know | |
Perceived outcomes of the Child Care Package: agreement on possible outcomes An increased number of children accessing care at this service Families increasing Families withdrawing children or reducing hours Changes to hours of operation of services Changes in the way fees are charged at this service Increases in fees charged at this service Changes to staffing arrangements at this service Better access to care for vulnerable children Increased flexibility in how this service offers care A simpler process for child care payments | For each: Strongly agree Agree Neither agree or disagree Disagree Strongly disagree Don't know / Prefer not to say | |
| Expectations for the impact of the changes on the child care sector | Large, positive impact Small, positive impact No impact Small, negative impact Large, negative impact Don't know / Prefer not to say | |
| Additional comments on the changes and expected impact on families or sector | Free text | The free text responses will be analysed further |
| Ref | Section/ Population | Items | Question | Categories |
|---|---|---|---|---|
| Key characteristics | ||||
| 1 | All | Gender | Are you… | Male Female Other |
| 2 | All | Relationship | Do you live with a partner? | Yes No |
| 3 | All | Number of children | How many children aged 13 years and under live with you? Please include children who are part of your household even if they don't live with you all of the time | Count |
| 4 | All | Ages of children | Starting with the youngest, how old are these children? If your child is under 1, please enter 0 | Age in years (0 if aged <1) |
| 5 | All | All usual child care arrangements | Besides you / and your partner, who looks after your children during the week? | Centre Based Day Care (Long Day Care) Outside School hours care (before/after school) Family Day Care (provided by approved family day care educators in their home) Other organised care Nanny or au pair (a person employed to provide child care services) Informal carer (grandparents, neighbours, friends or other relatives) A parent living elsewhere Other, specify [ Free text ] |
| 6 | For children aged 3-5 | Does your child normally attend a preschool/kindergarten program? | Yes - at a standalone preschool/kindergarten Yes - as at a child care centre Yes - preschool/ kindergarten attached to a school No - attends full time school No | |
| 7 | How many hours does your child attend kindergarten/preschool per week? | Numeric | ||
| Child care use | ||||
| 8 | Ask for each child, for each care type. Only the care types used for that child will show up. | Hours in child care | How many hours a week does your child spend in each of the following types of child care? Please provide hours used, rather than hours paid for. Provide an approximation or average if it varies. | Centre Based Day Care (Long Day Care) Outside School hours care Family Day Care (provided by approved family day care educators in their home) Other organised care Nannies, grandparents and other informal care Numeric |
| Child care changes | ||||
| 9 | If not formal care | You indicated you do not currently use formal child care - that is, care with an approved child care supplier. When (if ever) did you last use formal care? | Free text | |
| 10 | If stopped using formal care | Can you tell us why you do not use formal care now? | Free text | |
| 11 | Have you made any changes to your formal child care use - that is, care with an approved child care supplier - [for any of your children] since July 2? | Yes - because of changes to the cost of child care Yes - because of changes in the child care service offerings Yes - because of change in work or other activities Yes - for other reasons No | ||
| 12 | If because of changes | Please describe the changes made by your service | Free text | |
| 13 | If because other reasons | Can you explain why you changed your care arrangements? | Free text | |
| If any changes | Please describe the changes you made to child care | Free text | ||
| All using formal care | Overall, are you using around the same amount of formal child care now as you were before 2 July this year? This helps us get a better understanding of the patterns of changes to child care in Australia | We were not using formal care before 2 July We use much less formal care now We use a little less formal care now We use about the same amount of formal care We use a little more formal care now We use much more formal care now | ||
| 14 | Informal care - to see if this has changed to balance changes in formal care | Informal care is care provided by people like grandparents, nannies and friends. Have you made any changes to your informal care use since July 2? Please do not include parental care of children here | Yes No Not applicable | |
| 15 | If yes | Please explain the changes you have made to informal child care, and why you made them | Free text | |
| Service changes Note: The following section of sequenced questions is repeated for each child (ref 17-23) | ||||
| 16 | All using formal care | We have some questions about the main formal child care provider or service that your [x] year old child uses. Can you please confirm what this care type is? | Centre Based Day Care (LDC) OSHC Family Day Care Other organised care No formal care | |
| 17 | OSHC | When does your child attend care? | Before school After school Both before and after school Other [ Free text ] | |
| 18 | Not OSHC | Does this service charge…. Select one | By the hour, so you are charged for the number of hours you use By sessions, so you are charged for a set amount of hours but less than a full day By day, so you are charged for a full day regardless of how much you use Don't know Other [ Free text ] | |
| 19 | OSHC | Does this service charge…. Select one | By the hour, so you are charged for the number of hours you use By sessions, so you are charged for a set amount of hours before or after school Don't know Other [ Free text ] | |
| 20 | All sessions but OSHC | Does your service offer a choice in length of session? | Yes No Don't know | |
| 21 | How many hours of care are you charged for [per session / per day] at this service? Note - if you use sessions of different lengths, please choose one to report on | Numeric | ||
| 22 | OSHC | How long is the session of care - that is, many hours are you charged for? | Before School [ Numeric ] After school [ Numeric ] | |
| 23 | Not OSHC | Actual charge | How much does this service charge [ per hour / per session / per day ] | ___ per [hour / session / day] Don't know |
| 24 | OSHC | How much does this service charge [per hour./ per session] before school? | ___ per [hour / day] Don't know | |
| 25 | OSHC | How much does this service charge [per hour./ per session] after school? | ___ per [hour / day] Don't know | |
| 26 | All | Still thinking about this [xx]-year olds' main child care service, has the fee charged by this service changed since 2 July? Note this is about how much the service charges, not your out of pocket costs. | The fee has gone up a lot The fee has gone up a little The fee is about the same The fee has gone down a little The fee has gone down a lot I don't know I can't compare | |
| 27 | If fees changed | Reason for fee change | Were you advised by the service why these fees changed? If so, can you indicate the key reason(s) here? | Free text |
| Child care subsidy | ||||
| 28 | All using formal care | CCS application | Did you apply for the new Child Care Subsidy? The Child Care Subsidy is government assistance with the cost of child care | Yes, I completed my application Currently under application I did not finish the application No Don't know |
| 29 | No CCS application | Reason for no CCS application | Why didn't you apply for CCS ? Or if 'I did not finish the application' above Why didn't you finish the application | I'm not eligible for any subsidy It's too difficult There was a mistake in my application Other [ Free text ] |
| 30 | No CCS application | Do you intend to apply in the future? | Yes, this year Yes, at some point in future Maybe, if circumstances change No Unsure Other [ Free text ] | |
| 31 | CCS applicants (this section from here down) (include don't know) | ACCS eligibility | Some families are eligible for Additional Child Care Subsidy (ACCS). Do you know if you are receiving this subsidy? Additional Child Care Subsidy provides extra help to some families with the cost of child care. If you or your service has applied for ACCS but you don't know the final outcome select 'maybe/to be confirmed'. | No - we don't receive ACCS ACCS - grandparent ACCS - child wellbeing ACCS - transition to work ACCS - temporary financial hardship ACCS - type unknown or unspecified Unsure Prefer not to say |
| 32 | If more than one child | We would like to ask about the number of hours of subsidised care you are entitled to. Are all of your children entitled to the same amount of care? | Yes No Don't know | |
| 33 | If response to previous question was 'No' | Subsidised care | Why are your children entitled to different hours of care? | One [or more] attends a preschool program One [or more] lives with a grandparent or other carer Unsure Other [ Free text ] |
| 34 | CCS applicants (include don't know) | Subsidised care | How many hours of subsidised care are you entitled to per fortnight? 'If your children have different hours, please enter the number of hours your youngest is eligible for' | 0 hours 24 hours 36 hours per fortnight 72 hours per fortnight 100 hours per fortnight Don't know Other [ Free text ] |
| 35 | 100 hours or Other/don't know | Exemption check | Do you [or your partner] have an exemption from the activity test | Yes No Don't know Prefer not to say |
| 36 | If answer exemption is yes | Exemption reason | Why do you have an exemption from the activity test? Remember, you can always skip a question if you prefer not to answer it. | Please choose all that apply: Temporarily outside Australia A disability or medical condition that impacts your ability to work You care for someone with a disability You are the primary carer of a grandchild Other [ Free text ] |
| 37 | How well does the amount of subsidised care cover your family's needs for formal child care? | It is enough or more than enough It is about right It is not enough Other [ Free text ] | ||
| 38 | Costs of child care | If CCS | The Government subsidy for child care varies depending on family income. Can you tell us what range your subsidy percentage falls in? Again, you may wish to refer to your child care statement, or your letter about CCS from DHS | 85% (family yearly income <$66,958) Between 50% and 85% (family yearly income $66,958-$171,958) 50% (family yearly income $171,958- $251,248) Between 20% and 50% (family yearly income $251,248-$341,248) 20% (family yearly income $341,248-$351,248) 0% (family yearly income $351,248 or more) Prefer not to say |
| 39 | How much in total do you pay for child care after your fees are reduced by government subsidies? This includes all care types [and children]. Please provide an approximation if it varies or if you are not sure | Per week [ numeric ] OR Per fortnight [ numeric ] | ||
| 40 | How does this compare to what you were paying before 2 July? | A lot less A little less About the same A little more A lot more Don't know Prefer not to say | ||
| Child care affordability and satisfaction | ||||
| 41 | Overall child care | Thinking about all the care your family uses, do you agree or disagree with the following? The cost of child care is affordable There were enough child care options for me to choose from when selecting a child care provider It is easy for me to get the child care I need We rely on informal care more than I would like We use care that is not our preferred form of child care | Strongly Agree Agree Neither agree or disagree Disagree Strongly Disagree Not applicable | |
| 42 | All care satisfaction | Overall, how satisfied are you with the paid child care you have used since 2 July? | Very dissatisfied Dissatisfied Neither satisfied or dissatisfied Satisfied Very satisfied | |
| 43 | Care improvements | Could your options for child care be improved in any way? | Free text | |
| 44 | Child Care Package | Do you think that the child care changes that came in on 2 July, for your family, have been … | Entirely positive Mostly positive Neither positive or negative Mostly negative Entirely negative Don't know Prefer not to say | |
| 45 | Comment on Child Care Package | Would you like to comment on this? | Free text | |
| Child care assistance transitions and understanding | ||||
| 46 | Exclude those who did not apply | MyGov | Did you have to set up a MyGov account in order to apply for the Child Care Subsidy? | Yes No, I already had a myGov account I Don't know |
| 47 | Child care assistance | Have you updated your child care related details in MyGov since July 2? | Yes, my [or my partners] income Yes, my [or my partners] activity Yes, both my [or my partners] income and activity No, haven't had to update either income or activity Other [ Free text ] | |
| 48 | IF updated details | How many times have you updated your child care details? | Once 2 or 3 times More than 3 times Don't know | |
| 49 | All (although note some sequencing needed) | Transition experiences | Could you rate your agreement with the following statements about the transition to the new child care assistance? Setting up my details in myGov was easy Accessing my child care information in myGov was easy The process of applying for the Child Care Subsidy was easy The transition to the new child care subsidy was fairly seamless for me It is easy to understand Government information about the new child care subsidy I know how much my child care is costing me. I know where to go to get my child care questions answered | Strongly disagree Disagree Neither agree or disagree Agree Strongly agree Don't know |
| 50 | Sources of information | How did you find out about the Child Care Subsidy and what you had to do for the transition? | Department of Education website Centrelink web site Centrelink help line Information put out by the Government through TV, Radio or other advertising Information put out by the Government on social media Formal communication from my child care provider (e.g. emails, newsletters) Informal communication from my child care provider (e.g. conversations with staff) Family, friends or other parents | |
| 51 | Child care assistance understanding | Do you feel you understand these aspects of the Child Care Subsidy?: How eligibility for CCS works How my family's income affects my CCS entitlement How hours of work, training, study, volunteering and other activities affect CCS entitlement What to do if my circumstances change The 5% withholding of CCS by Centrelink | Very well Well Somewhat Not very much Not at all | |
| 52 | All | Overall difficulties | Are there any comments you would like to make on specific experiences related to the application for child care assistance, or dealing with DHS or Centrelink? | Free text |
| Work and other activities | ||||
| 53 | Work and other activities | Activity levels | Can you tell us about how much time you and your partner usually spend on the following activities in a regular fortnight? Paid work, self-employment, setting up a business Study or training in approved course Unpaid work in a family business, unpaid work experience Actively looking for work Volunteering Other recognised activities (e.g. government work programs) | You (hours per fortnight) [numeric] Your partner (hours per fortnight) [numeric] |
| 54 | Changes in activity and child care | Have you or your partner made any significant changes to any of these activities since 2 July? | [ Multiple selection ] Yes, I have made significant changes Yes, my partner has made significant changes No Don't know | |
| 55 | If changes in activity | Were these changes related to changes in child care or the new child care subsidy? | Yes No Unsure | |
| 56 | If yes to previous | Can you please describe these changes [and how they relate to child care] | Free text | |
| 57 | If no changes in activity | Are you thinking about making any changes as a result of the new Child Care Package? | Free text | |
| 58 | Variability | Thinking about paid employment, please indicate if any of the following apply | [ Multiple selection ] My hours vary a lot week to week I work outside standard hours (e.g. before 7am, after 6pm) My work involves a changing pattern of shifts My partner's hours vary a lot week to week My partner works outside standard hours (e.g. before 7am, after 6pm) My partner's work involves a changing pattern of shifts] | |
| 59 | Work challenges for child care | Is there anything else about your [or your partners] work or other activities that makes child care more difficult? | Free text | |
| Other information | ||||
| 60 | ISP | ISP programme | The Inclusion Support Programme is a government program that supports inclusion of children with additional needs in child care. Do you know about this program? | I know what the Inclusion Support Programme is I've heard of it but I don't know what it is I have not heard of this program Don't know |
| 61 | If aware of ISP | Do any of your children's services access support through the Inclusion Support Programme? | Yes - one [or more] of my child[ren]s services uses this program No - my child[ren]s service doesn't participate in this program Don't know | |
| 62 | NDIS | Do you, your partner or any of your children receive a package of assistance under the NDIS? Multiple responses allowed | Me or my partner One or more of my children aged under 13 years Other children aged 13 years or more No Don't know Prefer not to say | |
| 63 | Others paying for care | Does anyone else pay for some or all off the costs of your [ child's / children's ] formal care? | No Yes, a parent living elsewhere Yes, my employer or my partner's employer Yes, someone else [Free text ] | |
| 64 | Final | Comment on Child Care Package | This survey will feed into the Child Care Package evaluation. Is there anything else you would like to comment on, to inform this evaluation? | Free text |
| Question / Variable | Categories |
|---|---|
| Can you please tell me which state or territory you live in? | NSW VIC QLD SA WA TAS NT ACT |
| Capital city / rest of state | Capital City Rest of State |
| What is your gender? | Don't know Not stated / Unknown Male Female Other |
| Age as of 30th August 2018? | Numeric |
| Respondent country of birth grouping? | Don't know Not stated / Unknown Australian born Mainly NESB background Mainly ESB background |
| Which of the following best describes your household? | Don't know Not stated / Unknown Person living alone Couple living alone Couple with non-dependent child(ren) Couple with dependent child(ren) Couple with dependent and non-dependent child(ren) Single parent with non-dependent child(ren) Single parent with dependent child(ren) Single parent with dependent and non-dependent child(ren). Non-related adults sharing house/apartment/flat Other household type |
| Highest educational qualification? | Not stated / Unknown Postgraduate Degree Level Graduate Diplomat and Graduate Certificate Level Bachelor Degree Level Advanced Diploma and Diploma Level Certificate III & IV Level Secondary Education - Year 12 Secondary Education - years 10 and 11 Certificate I & II Level Secondary Education - Years 9 and below |
| Before tax or other deductions, what is the gross annual income from all sources for you and your family or other living with you? | Don't know Not stated / Unknown High-income - over $155,999 per year Middle-income - between $65,000 and $156,000 per year Low-income - under $65,000 per year |
| Wave 18 (July 2018) - Child care use | |
| Now just some questions about your use of child care services. Do you have any children who use paid child care use? | Don't know Yes No |
| For your family, was the process of applying for the new child care fee assistance (which commenced from 2nd July 2018) easy or difficult? | Don't know Very easy Quite easy Quite difficult Very difficult Have not applied |
| Wave 19 (August 2018) - Child care use | |
| Have you used paid child care in the last 6 months? | Don't know Yes No |
| In July 2018, the government changed the funding arrangements for child care and some services changed their charges. For you and your family, has this change...? | Don't know Increased the cost of child care Decreased the cost of child care Made no difference to the cost of child care |
| Has the subsidy affected your...? (Multiple choice) | Work Study Anything else (please specify [free text]) Not affected Not sure Prefer not to say |
| Has the subsidy - affected work | Increased hours Decreased hours Changed hours Something else (please specify) Not sure Prefer not to say |
| Has the subsidy - affected study | Increased hours Decreased hours Changed hours Something else (please specify) Not sure Prefer not to say |
| Do you have any other comments to make about the government's changes to the funding of child care? | [Free text] |
This evaluation was commissioned by the Australian Government Department of Education and Training.
The authors would like to acknowledge and thank all of those who participated in or assisted with this stage of the evaluation, including families and services as well as representatives of peak bodies and other organisations with an interest in the Child Care Package.
We also acknowledge the helpful assistance of staff from the Australian Government Department of Education and Training. In particular the Evaluation Section team from the Approvals and Relationships Branch for their continuing collaboration, guidance and support.
Research team
Australian Institute of Family Studies
Jennifer Baxter, Mikayla Budinski, Megan Carroll, Kelly Hand, Cara Rogers and Jessica Smart
Australian National University
J. Rob Bray and Matthew Gray
Social Policy Research Centre, University of New South Wales
Megan Blaxland, Ilan Katz and Jennifer Skattebol
Research assistance
Megan Bedford (Social Policy Research Centre), Marie Delany (Social Policy Research Centre) and Pam Muth (The Social Research Centre) provided valuable research assistance.
Fieldwork
The fieldwork for the Survey of Early Learning and Care Services (SELCS) was conducted by the Social Research Centre. The fieldwork team was managed by Leon Head and Eugene Siow.

Featured image: GettyImages/Onfokus
Baxter, J., Bray, J.R., Carroll, M., Hand, K., Gray, M., Katz, I., Budinski, M., Rogers, C., Smart, J., Skattebol J., & Blaxland, M. (2019). Child Care Package Evaluation: Early monitoring report. (Research Report). Melbourne: Australian Institute of Family Studies.
Download Research report
Related publications

In Home Care Evaluation Report
This final evaluation report for the IHC program draws on data collected about IHC up to February 2020.
Read more
Evaluation of the Inclusion Support Program
This evaluation considers the impact of the Inclusion Support Program – an element of the Child Care Package.
Read more
Child Care Package Evaluation: Final report
The evaluation primarily considers the impact of the child care subsidy system, comprising the Child Care Subsidy (CCS)…
Read more