Children’s social-emotional wellbeing
The role of parenting, parents’ mental health and health behaviours
March 2020
Pilar Rioseco, Diana Warren, Galina Daraganova
Download Research report
Overview
This paper examines the association of mothers' parenting behaviours, parents' mental health and parents' health behaviours (alcohol use and smoking) with social-emotional wellbeing of primary school children using Growing Up in Australia: The Longitudinal Study of Australian Children.
Children's social-emotional wellbeing was assessed using the Strength and Difficulties Questionnaire over five data collection periods or 'waves'; that is, every two years from when children were aged 4-5 to 12-13 years. Descriptive analysis was used to examine differences in social-emotional wellbeing by parenting behaviours, parents' mental health and parents' health behaviours. Longitudinal analysis was used to investigate trajectories of children's social-emotional difficulties between the ages of 4-5 and 12-13.
This research was commissioned by Emerging Minds: The National Workforce Centre for Child Mental Health.
Key messages
-
Mother's positive parenting behaviours including warmth, consistency and low frequency of hostile parenting had a significant positive effect on children's social-emotional outcomes, with the largest effect observed for conduct problems.
-
Of all parenting behaviours, mother's hostile parenting was associated with the largest differences in children's social-emotional outcomes at all ages.
-
Children whose mothers experienced moderate or high levels of psychological distress were more likely to be at an increased risk of social-emotional difficulties at every age.
-
Even after taking into account later psychological distress experienced by mothers, the early experience of mental health problems in pregnancy showed a small but significant effect on the level of children's total difficulties at age 4-5.
-
For the same children, an observed increase in the frequency of warm and consistent parenting behaviours at later stages, as well as a reduction in the frequency of hostile parenting behaviours, led to better social-emotional outcomes.
Abbreviations
| ABS | Australian Bureau of Statistics |
| AIFS | Australian Institute of Family Studies |
| AIHW | Australian Institute of Health and Welfare |
| AMHOCN | Australian Mental Health Outcomes and Classification Network |
| AUDIT | Alcohol Use Disorders Identification Test |
| CI | Confidence Interval |
| DSS | Department of Social Services |
| GP | General Practitioner |
| K6 | Kessler 6 Psychological Distress Scale |
| LOTE | Language other than English |
| LSAC | Longitudinal Study of Australian Children |
| NSW | New South Wales |
| PRC | Parenting Research Centre |
| SDQ | Strengths and Difficulties Questionnaire |
Introduction
Child mental health is a significant public health issue in Australia. According to the second Australian Child and Adolescent Survey of Mental Health and Wellbeing, nearly 14% of children and adolescents aged 4-17 had a mental health condition in 2013-14 (Lawrence et al., 2015). In 2011, 24% of the non-fatal burden of disease in Australia (years lived in ill health or with a disability) was due to mental health conditions, mainly anxiety and depressive disorders (Australian Institute of Health and Welfare [AIHW], 2016).
Mental health problems in childhood affect several aspects of wellbeing and development. For example, Australian children with clinical levels of mental health conditions have shown lower self-esteem and poorer physical health compared with other children, and their mental health condition has negatively affected family life, school activities and relationships with peers (Sawyer et al., 2001). Children with common emotional or behavioural problems, not necessarily at clinical levels, have shown lower academic achievement in the primary school years compared with those without these difficulties, particularly among boys (Mundy et al., 2017). Furthermore, a higher proportion of children who experience mental health problems in childhood also experience these difficulties in adolescence (O'Connor, Romaniuk, Gray, & Daraganova, forthcoming).
An earlier review on the age of onset of mental health disorders showed that they usually begin in childhood or adolescence, particularly in the case of impulse-control disorders and some anxiety disorders (Kessler et al., 2007). In this context, early detection and early intervention have been identified as the best approaches to reduce the prevalence of mental health problems in childhood, and to change the trajectories of mental health problems that continue into adolescence and adulthood.
Children's social-emotional adjustment is influenced by a number of different elements, including characteristics of the child, the parents and the home environment. For example, the child's physical health, parents' mental health, parenting behaviours and socio-economic disadvantage have been found to have a significant impact on children's mental health (e.g. Bayer et al., 2011; McLoyd, 1998; Mesman & Koot, 2001; Xue, Leventhal, Brooks-Gunn, & Earls, 2005). Previous research has shown that factors such as harsh parenting and parents' mental health problems are not only associated with poorer social-emotional outcomes in childhood (Giallo, Cooklin, Wade, D'Esposito, & Nicholson, 2014a, 2014b; Warren, 2017) but also with persistence of childhood mental health conditions into adolescence (O'Connor et al., forthcoming).
Some of these factors may be harder to modify in the short term, from a policy perspective. Structural factors such as improving children's socio-economic status is a long-term societal goal but may not be achieved within the critical early childhood years. However, other factors may be more amenable to intervention. For example, ample evidence shows that competent parenting benefits children and that parenting behaviours can be successfully improved with appropriate parenting education programs (Sanders, Kirby, Tellegan, & Day, 2014; Teti, Cole, Cabrera, Goodman, & McLoyd, 2017). Similarly, treatment of parents' mental health conditions has been shown to have a significant positive effect on children's outcomes (Gunlicks & Weissman, 2008).
The aim of this paper is to identify the factors that influence the levels and trajectories of children's social-emotional adjustment in a representative sample of Australian children aged 4-13. In particular, this paper examines the role of parenting behaviours, parental mental health and parents' health behaviours on children's social-emotional adjustment over an eight-year period.
This paper contributes to the current literature in at least two ways. First, we use the latest release of the LSAC study, allowing us to analyse eight years of data, from the pre-school years up to early adolescence, as well as early experiences when children were aged 0-1. Second, we not only examine differences in social-emotional outcomes for children with different parenting practices, but also the associations between change in parenting practices and social-emotional outcomes at the individual level. Note, even though this study used longitudinal methods of data analysis to take into account individual heterogeneity and change over time, the findings presented here show associations and do not necessarily identify causal effects.
Parents' influence on children's mental health
Parenting behaviours have been identified as one of the key mechanisms through which parents directly influence children's development and wellbeing. Several studies have shown the association between specific parenting behaviours, such as warmth and hostility, on children's social-emotional wellbeing, including the incidence of internalising and externalising difficulties. Using data from Growing Up in Australia: The Longitudinal Study of Australian Children (LSAC), Bayer and colleagues (2011) investigated the risk factors associated with mental health problems. The authors found that harsh discipline was associated with externalising symptoms. More recently, another study using six data collection periods (Waves 1-6) of LSAC found that maternal hostility was associated with children's social-emotional adjustment at age four (Christensen, Fahey, Giallo, & Hancock, 2017). In a recent analysis of LSAC, O'Connor et al. (forthcoming) reported that mothers' harsh discipline was associated with higher levels of internalising difficulties in childhood, and also with the persistence of childhood internalising difficulties into adolescence.
Several studies have shown that maternal mental health is associated with children's social-emotional wellbeing, including prenatal and postpartum maternal mental health problems. In a systematic review of the effects of prenatal and postpartum psychological distress, Kingston, Tough, and Whitfield (2012) found that maternal psychological distress during pregnancy can have a negative effect on behavioural development, while social-emotional development was negatively influenced by maternal psychological distress after birth. Research using LSAC has also demonstrated this association. In these studies, higher levels of maternal psychological distress were associated with poorer mental health outcomes for children (Bayer et al., 2011; Christensen et al., 2017).
A number of mechanisms have been proposed to explain these associations. For example, a study of mother-child dyads examined different pathways through which prenatal maternal stress affects children's mental health in the preschool years. The authors showed that prenatal stress had a direct effect on internalising symptoms at age five, as well as indirect effects via postnatal stress (at age four months) and negative affect at age three (via postnatal stress). Regarding externalising symptoms, this study found an indirect effect of prenatal stress through hostile parenting at age four months and through negative affect at age three (Hentges, Graham, Plamondon, Tough, & Madigan, 2019). There is a lack of research focusing on the association of fathers' mental health and children's wellbeing, although extant studies also highlight the role of fathers' depressive mood on children's mental health outcomes (e.g. Jacob & Johnson, 1997; Low & Stocker, 2005) and the association between fathers' psychological distress and negative parenting behaviours (Giallo et al., 2015).
In addition to parents' mental health, parents' health behaviours, such as problematic substance use, have also been associated with children's later substance use and mental health difficulties. Several studies have established a relationship between parents' drinking and young people's drinking habits in early adolescence (e.g. Homel & Warren, 2019). Research has also shown that children of parents who abuse substances are more likely to experience other risk factors such as interpersonal conflict and dysfunctional parenting, which, in turn, result in poorer outcomes for children (e.g. Conners-Burrow et al., 2013). Australian research using LSAC showed a significant association between mothers' smoking and externalising behaviours in unadjusted models (Sutin, Flynn, & Terracciano, 2017). However, after taking into account a range of socio-demographic and parenting factors this association was no longer significant. In the same study, mothers' alcohol use was not associated with children's social-emotional wellbeing (Bayer et al., 2011).
Socio-economic disadvantage has been consistently found to lead to poorer outcomes for children in a range of different domains, including higher risk of emotional and behavioural problems (Brooks-Gunn & Duncan, 1997; Duncan, Brooks-Gunn, & Klebanov, 1994; McLoyd, 1998). However, there is mixed evidence regarding the mechanisms by which poverty or socio-economic disadvantage contribute to negative outcomes for children. The quality of the parent-child relationship has been identified as one possible pathway in which poverty affects children's outcomes (Duncan & Brooks-Gunn, 2000; Teti et al., 2017). Some studies have shown that parenting behaviours, such as harsh and inconsistent parenting, partly mediate the association between socio-economic disadvantage and children's wellbeing (Kiernan & Huerta, 2008; McLoyd, 1998; Warren, 2017). Notably, maternal mental health has also been shown to partly mediate the effects of poverty on social-emotional outcomes (Kiernan & Huerta, 2008; Warren, 2017).
Data and methodology
The Longitudinal Study of Australian Children
This paper uses data from LSAC. LSAC is conducted in a partnership between the Department of Social Services (DSS), the Australian Institute of Family Studies (AIFS) and the Australian Bureau of Statistics (ABS) and follows two cohorts of children who were randomly selected from across Australia. The study has collected data on the children and their families since 2004 (Wave 1) with subsequent data collection points - or waves - every two years. Children in the B cohort ('babies' aged 0-1 at the first data collection point) were born between March 2003 and February 2004 and children in the K cohort ('kindergarten' aged 4-5 at the first data collection point) were born between March 1999 and February 2000. The B cohort is the focus of the current paper.
The sampling frame for LSAC was created using the then Health Insurance Commission's (HIC) Medicare database, a comprehensive database of Australia's population. Using this database, a stratified sample of postcodes was generated, a sample of children selected, and their families invited to participate in the study. The final sample, comprising 54% of these families, was broadly representative of Australian children. For a detailed description of the design of LSAC, see Gray and Smart (2009).
LSAC gathers comprehensive, nationally representative data on important aspects of a child's life and development over time, including physical and mental health; motor skills; social, cognitive and emotional development; and language, literacy and numeracy. The study child is the focus of LSAC, and the study collects information about the child's behaviour in different contexts. Information is collected from the child (using physical measurement, cognitive testing and, depending upon the age of the child, interviews), the parent who knows most about the child ('primary carer') and any secondary parent in the household (biological, adoptive or step-parents), home-based and centre-based carers for preschool children who are regularly in non-parental care and teachers for school-aged children. From Wave 2, information was also obtained from parents who live in a separate household from the primary carer but who still have contact with the child.
The first wave of LSAC interviews were conducted between March 2004 and January 2005 and families have subsequently been interviewed every two years. At the time of writing, data from seven main waves of the survey were available, collected in 2004, 2006, 2008, 2010, 2012, 2014 and 2016. The Wave 1 sample consisted of 5,107 observations for the B cohort; just over 90% of the Wave 1 sample was retained in Wave 2; and in subsequent waves 90-97% of the sample was retained from one wave to the next. As a consequence, the Wave 7 sample comprises 66% of the original Wave 1 sample (Bandara, et al., forthcoming; Usback, 2018).
Measures
Child social-emotional wellbeing - the SDQ
The social and emotional outcomes analysed in this paper are based on children's scores on the Strengths and Difficulties Questionnaire (SDQ - parent report). The SDQ is a brief behavioural screening questionnaire designed to measure the psychological adjustment of children aged 3-16 years. This scale has been widely used, and evidence of its psychometric properties has been demonstrated in a number of studies (Hawes & Dadds, 2004; Stone, Otten, Engels, Vermulst, & Janssens, 2010). The SDQ is not intended to be used as a diagnostic instrument but rather as a measure of problematic emotions and behaviours across a range from normative to highly elevated (Stone et al., 2010). As such, the SDQ provides an indication of children that may be experiencing clinical levels of difficulties.
The SDQ Difficulties Subscale consists of 20 items, some positive and others negative, where each item describes an attribute of the child's behaviour (Goodman, 2001). The 20 items are divided into four subscales of five items each (see the appendix, Table 18 for details):
- hyperactivity/inattention (e.g. is restless, overactive, cannot stay still for long)
- conduct problems (e.g. often fights with other children or bullies them)
- emotional symptoms (e.g. has many fears and is easily scared)
- peer problems (e.g. is rather solitary, tends to play alone).
The child's primary carer (usually the child's mother) indicates whether each item is: 'not true', 'somewhat true' or 'certainly true' of the child. Responses are scored 0, 1 or 2, where the higher scores indicate more problematic behaviour. The total score for each subscale has a range of 0-10, with higher scores indicating a higher risk of clinically significant problems.
The full SDQ questionnaire consists of 25 items, with an additional five items measuring prosocial behaviours (considerate of other people's feelings; shares readily with other children; helpful if someone is hurt, upset or feeling ill; kind to younger children; often volunteers to help others). This scale also ranges from 0-10. However, lower scores on the prosocial scale indicate a higher risk of social problems (Goodman, 2001).
For each subscale, cut points have been derived from United Kingdom samples to indicate the presence of elevated symptom levels (Australian Mental Health Outcomes and Classification Network [AMHOCN], 2005).1 The percentage of children in LSAC exhibiting a raised or high risk (hereafter referred to as elevated) of significant problems for each SDQ subscale at ages 4-5 to 12-13, is shown in Table 1. The proportion of children with elevated emotional symptoms was between 18% and 22% across ages. This proportion was lowest at age 6-7 and highest at age 12-13. A lower proportion of children showed elevated levels of hyperactivity (between 15% and 20%). The highest proportion of children with elevated levels of hyperactivity was observed at age 8-9, and this decreased with age. The proportion of children with conduct problems was highest at age 6-7 (24%), and decreased to below 15% by age 12-13. The proportion of children with elevated levels of peer problems, in turn, was lower at age 4-5 (21%) and increased slightly as children got older, while the proportion of children with elevated total difficulties also decreased over time, from 19% at age 4-5 to 15% at age 12-13. The proportion of children with slightly low or low prosocial behaviours was highest at age 4-5.
| SDQ component (% elevated) | Age 4-5 (2008) | Age 6-7 (2010) | Age 8-9 (2012) | Age 10-11 (2014) | Age 12-13 (2016) |
|---|---|---|---|---|---|
| Emotional symptoms | 20.7 | 17.5 | 18.4 | 20.8 | 21.6 |
| Hyperactivity | 14.7 | 18.9 | 20.4 | 17.6 | 15.7 |
| Conduct problems | 22.2 | 24.1 | 19.9 | 16.7 | 14.8 |
| Peer problems | 21.2 | 22.5 | 23.4 | 24.8 | 24.3 |
| SDQ total difficulties score | 19.4 | 16.8 | 17.4 | 15.5 | 15.3 |
| Prosocial behaviour | 26.1 | 8.6 | 7.3 | 6.7 | 10.3 |
| Total, N | 3,824 | 4,211 | 4,007 | 3,663 | 3,334 |
Notes: Binary indicators of slightly raised/high are used as the cell count for high was too small for reliable estimates. For prosocial behaviour it is the percentage slightly low or low, rather than slightly raised/high.
Source: LSAC Waves 3-7, B cohort, weighted
The descriptive statistics that will be presented in later sections examine the proportion of children with elevated difficulties (slightly low or low in the case of prosocial behaviours) by parenting behaviours, parents' mental health and parents' health behaviours.
The regression model presented in later sections is focused on the total difficulties score, as a summary measure of children's social-emotional adjustment. This score is treated as a continuous variable in the models. It is important to note that the distribution of scores in the components of the SDQ was highly skewed, whereas total difficulties scores were normally distributed, which allowed for the use of linear mixed models.
Parenting behaviours
LSAC contains a number of items assessing different types of parenting behaviours. Based on previous literature and preliminary analyses, three maternal parenting behaviours were found to be most relevant to children's social-emotional wellbeing: warmth, hostility and consistency. Mothers assessed the frequency in which they performed a number of parenting behaviours related to warmth, hostility and consistency, and these items were then averaged to generate a scale. The warmth scale contained six items including: 'How often do you hug or hold this child for no particular reason?' and 'How often do you tell this child how happy he/she makes you?' The hostility scale contained four items including: 'Of all the times you talk to this child about his/her behaviour, how often is this disapproval?' and 'How often are you angry when you punish this child?' The consistency scale included four items such as: 'How often does this child get away with things that you feel should have been punished?' and 'When you discipline this child, how often does he/she ignore the punishment?'. The response options for each item were: 'not true', 'somewhat true', and 'certainly true'. Scales were constructed incorporating the technical guidelines provided by Zubrick, Lucas, Westrupp, and Nicholson (2014). The list of all items included in each scale and response options are provided in the appendix (Table 19).
Given that these scales were highly skewed, binary variables were generated and used in the analysis. Following the approach taken by Lucas, Nicholson, and Maguire (2011), cut-off points for the binary variables were designed to identify the 15-20% of the sample experiencing less optimal parenting on each of the scales. That is, these cut-off points identify the 15-20% of children who, relative to the rest of the sample, experience a lower frequency of maternal warmth, higher frequency of maternal hostility, and lower frequency of maternal consistency (three separate variables).
The cut-off point for maternal hostility was defined as a mean score higher than 2.25 points in the hostility scale (hostile parenting between 'less than half the time' and 'about half the time'). Children who experienced an average frequency of hostile parenting above 2.25 points were classified as having 'high hostility', while the rest of the sample was classified into the 'low hostility' group. Similarly, the cut-off for maternal consistency was defined as a mean score higher than 2.6 points in the consistency scale (inconsistent parenting between 'less than half the time' and 'about half the time'). Children who experienced an average frequency of maternal inconsistency above 2.6 were classified as being in the 'low consistency' group. The rest of the sample was classified as experiencing 'high consistency'. These cut-off points were maintained across time points for the hostility and consistency scales, as the distribution of scores was relatively constant over time.
For the maternal warmth variable, however, the point separating the 15-20% of children experiencing lower frequency of warm parenting, relative to the rest of the sample, changed as children got older. Since the frequency of warm parenting behaviours decreased slightly over time, different cut-off points were used at different time points (warm parenting less frequent than 'often': mean < 4.1 at ages 4-5 and 6-7, mean < 4 at ages 8-9 and 10-11, and mean < 3.8 at age 12-13). Children who had a mean score lower than these cut-off points were classified as experiencing low maternal warmth. The rest of the sample was classified into the 'high warmth' group.
The percentage of children classified in each parenting group at each age is shown in Table 2. Children who experience low maternal warmth, or high maternal hostility or low maternal consistency, are referred to in this paper as experiencing 'less optimal' parenting. It is important to keep in mind that 'low warmth', 'high hostility' and 'low consistency', as well as 'less optimal', parenting are relative terms; these are high/low relative to the rest of the sample as defined by the cut-off points mentioned above, and they are not an absolute measure of the quality of parenting behaviours.
By definition, the categories presented above identify the 15-20% of children exposed to 'less optimal' parenting at each time point separately for maternal warmth, hostility and consistency, meaning that, for each parenting measure, 80-85% of children experience 'optimal' parenting at each age. Figure 1 provides further information in terms of the persistence of 'less optimal' parenting over time among those who completed at least three interviews between the ages of 4-5 and 12-13. Nearly 60% did not experience low maternal warmth in this time period, while 24% experienced low maternal warmth on two or more occasions. A higher percentage of children did not experience high maternal hostility during the observation period (64%) compared with low warmth, and 20% experienced high hostility in two or more occasions. Similar to maternal hostility, 63% of children did not experience low consistency between the ages of 4-5 and 12-13, while 19% experienced low consistency in two or more occasions.
| Parenting behaviours | Distribution of children by mother's parenting behaviours | ||||
|---|---|---|---|---|---|
| Age 4-5 (2008) (%) | Age 6-7 (2010) (%) | Age 8-9 (2012) (%) | Age 10-11 (2014) (%) | Age 12-13 (2016) (%) | |
| High warmth | 76.7 | 79.4 | 83.9 | 79.4 | 78.2 |
| Low warmth | 23.3 | 20.6 | 16.1 | 20.6 | 21.8 |
| Total, N | 3,802 | 4,152 | 3,942 | 3,611 | 3,221 |
| Low hostility | 84.4 | 83.6 | 83.3 | 83.4 | 84.4 |
| High hostility | 15.6 | 16.4 | 16.7 | 16.6 | 15.6 |
| Total, N | 3,789 | 4,150 | 3,942 | 3,611 | 3,219 |
| High consistency | 83.4 | 84.8 | 85.0 | 84.9 | 85.6 |
| Low consistency | 16.6 | 15.3 | 15.0 | 15.2 | 14.4 |
| Total, N | 3,786 | 4,150 | 3,942 | 3,611 | 3,215 |
Notes: At age 4-5, the primary caregiver questionnaire was a paper form designed to be completed while the interviewer was in the home. Given the large proportion who did not complete the questionnaire, the data collection method changed to a computer-assisted self-interview in the next wave, which significantly increased response rates.
Source: LSAC Waves 3-7, B cohort, unweighted
Figure 1: Exposure to less optimal maternal parenting between the ages of 4-5 and 12-13
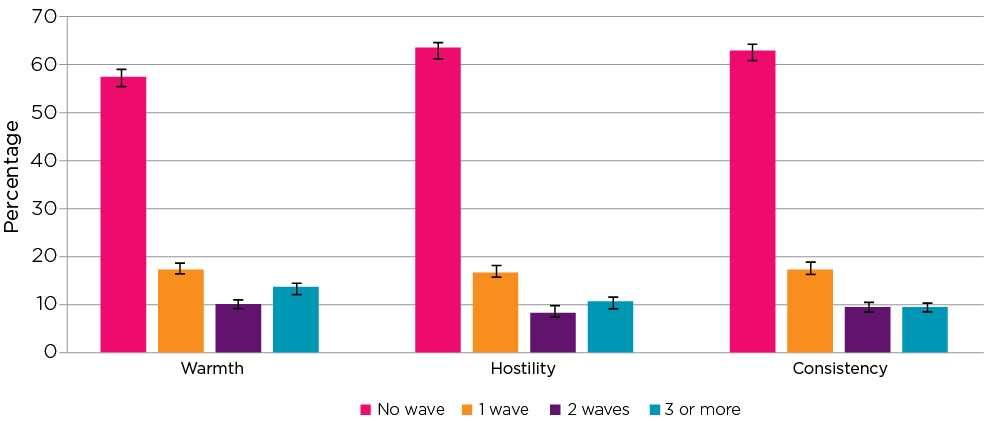
Notes: N = 4,009 (completed at least three interviews between the ages of 4-5 and 12-13). 95% confidence intervals are shown by 'I' bars in each column.
Source: LSAC Waves 3-7, B cohort, age 4-5 to 12-13, weighted
Parents' mental health and health behaviours
Parental mental health was assessed using the Kessler 6 Psychological Distress Scale (K6; Kessler et al., 2003). This scale includes six questions about anxiety and depressive symptoms experienced during the previous four weeks. Using norms based on previous research (Hilton et al., 2008) respondents were classified into one of three groups:
- low psychological distress (mental disorder is unlikely to be present), a score of 0-7
- moderate psychological distress (the individual may have a mental disorder), a score of 8-12
- High psychological distress (the individual is very likely to have a mental disorder), a score of 13-24.
For the purpose of the analysis presented here, respondents with moderate or high levels of psychological distress were grouped together and compared to those with low levels of distress. Mothers' and fathers' psychological distress were examined. However, given the high proportion of missing data for fathers, an additional category for 'no information' had to be included in the analysis for fathers to retain those observations.
Two types of health behaviours were examined in this paper: use of alcohol and smoking. Problematic use of alcohol was assessed using three questions from the AUDIT-C scale (Bush et al., 1998), a brief screening test designed to identify hazardous drinking: 'How often do you have a drink containing alcohol?', 'How many standard drinks do you have on a typical day when you are drinking?' and 'How often do you have five or more standard drinks on one occasion (if female) or seven or more standard drinks on one occasion (if male)?' Problematic alcohol use was defined as engaging in heavy daily alcohol consumption (>4 drinks for men >2 for women) or frequent binge drinking (7+ drinks in one sitting for men at least twice per month; 5+ for women at least twice per month). Parents were also asked to report on their smoking habits at each interview.
The percentage of children whose mothers experienced moderate or high psychological distress ranged from 8% to 11% across ages (Table 3). For fathers, this percentage was between 4% and 6%. However, 24-27% of resident fathers did not complete the relevant questionnaire and between 11% and 15% of children did not have a resident father between the ages of 4-5 and 12-13. The proportion of fathers with no information was also high for the questions on alcohol and smoking. The percentage of mothers with problematic use of alcohol increased slightly across waves, from around 9% to nearly 14%. In contrast, the percentage of mothers who smoked decreased over time but was generally higher than the percentage with problematic use of alcohol: from 18% when children were aged 4-5, to 13% when children were aged 12-13. Among fathers, the percentage with problematic use of alcohol and smoking seemed to decrease over time, from 17% when children were aged 4-5, to 8% when children were aged 12-13 for alcohol, and from 12% to 7% for smoking at the same ages. However, there was a high proportion of resident fathers who did not participate in the study.
It is important to note that Table 3 presents a cross-section at each time point. That is, there could be selection bias, if fathers with problematic alcohol use or mothers who smoke are less likely to continue in the sample (Bandara et al., forthcoming).
Similar to the parenting behaviours, exposure to poor parental mental health and health behaviours in childhood are presented below. The first figure shows that the vast majority of children did not experience any of these risk factors between the ages of 4-5 and 12-13 (Figure 2). However, over 10% of children were exposed to poor maternal mental health, mother's problematic use of alcohol, or mother's smoking on two or more occasions between these ages.
| Health variables | Parents' mental health and health behaviours | ||||
|---|---|---|---|---|---|
| Age 4-5 (2008) (%) | Age 6-7 (2010) (%) | Age 8-9 (2012) (%) | Age 10-11 (2014) (%) | Age 12-13 (2016) (%) | |
| Mother psychological distress | |||||
| Low | 77.4 | 87.2 | 87.0 | 85.7 | 86.2 |
| Moderate/high | 8.3 | 10.4 | 9.4 | 10.1 | 10.6 |
| No Information | 14.1 | 1.9 | 3.0 | 3.4 | 2.2 |
| No resident mother | 0.2 | 0.5 | 0.7 | 0.8 | 1.1 |
| Total, N | 4,386 | 4,241 | 4,077 | 3,759 | 3,319 |
| Father psychological distress | |||||
| Low | 56.7 | 59.3 | 56.1 | 58.2 | 56.5 |
| Moderate/high | 5.5 | 4.3 | 4.2 | 3.9 | 4.6 |
| No Information | 26.9 | 24.4 | 26.5 | 23.8 | 24.1 |
| No resident father | 10.9 | 12.1 | 13.2 | 14.2 | 14.8 |
| Total, N | 4,386 | 4,241 | 4,077 | 3,759 | 3,319 |
| Mother problematic alcohol use | |||||
| No | 90.3 | 73.2 | 85.1 | 83.7 | 83.2 |
| Yes | 8.9 | 11.4 | 11.6 | 12.3 | 13.7 |
| No Information | 0.5 | 14.9 | 2.7 | 3.2 | 2.1 |
| No resident mother | 0.2 | 0.5 | 0.7 | 0.8 | 1.1 |
| Total, N | 4,386 | 4,242 | 4,077 | 3,759 | 3,319 |
| Father problematic alcohol use | |||||
| No | 46.1 | 46.4 | 50.6 | 53.2 | 52.5 |
| Yes | 16.7 | 9.1 | 10.1 | 9.1 | 8.3 |
| No Information | 26.4 | 32.4 | 26.2 | 23.6 | 24.4 |
| No resident father | 10.9 | 12.1 | 13.2 | 14.2 | 14.8 |
| Total, N | 4,386 | 4,241 | 4,077 | 3,759 | 3,319 |
| Mother smoking | |||||
| No | 81.3 | 80.9 | 81.3 | 83.1 | 84.1 |
| Yes | 17.9 | 17.0 | 15.4 | 13.0 | 12.9 |
| No Information | 0.5 | 1.7 | 2.7 | 3.2 | 2.0 |
| No resident mother | 0.2 | 0.5 | 0.7 | 0.8 | 1.1 |
| Total, N | 4,386 | 4,242 | 4,077 | 3,759 | 3,319 |
| Father smoking | |||||
| No | 50.9 | 53.9 | 52.1 | 54.5 | 54.7 |
| Yes | 12.4 | 10.0 | 8.7 | 8.2 | 7.1 |
| No Information | 25.9 | 23.9 | 26.0 | 23.1 | 23.4 |
| No resident father | 10.9 | 12.1 | 13.2 | 14.2 | 14.8 |
| Total, N | 4,386 | 4,241 | 4,077 | 3,759 | 3,319 |
Note: Percentages may not total exactly 100.0% due to rounding.
Source: LSAC Waves 3-7, B cohort, unweighted
Figure 2: Exposure to maternal risk factors between ages 4-5 and 12-13
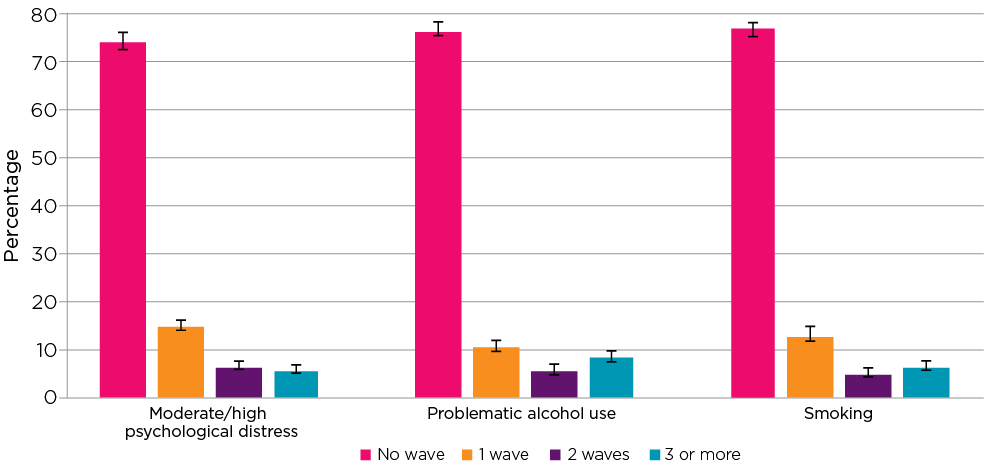
Notes: N = 4,009 (completed at least three interviews between age 4-5 and 12-13). 95% confidence intervals are shown by 'I' bars in each column.
Source: LSAC Waves 3-7, B cohort, age 4-5 to 12-13, weighted
Noting the large proportion of missing data (26-35% across time points and items), 82% of children in two-parent households, who completed at least three interviews, were not exposed to poor paternal mental health or problematic use of alcohol, while 11% had a father with moderate or high levels of psychological distress or problematic use of alcohol on at least one occasion between the ages of 4-5 and 12-13 (Figure 3). The prevalence of smoking was higher, with 69% of children not being exposed to father's smoking and 17% being exposed to this risk factor on at least two occasions between the ages of 4-5 and 12-13.
Figure 3: Exposure to paternal risk factors between the ages of 4-5 and 12-13
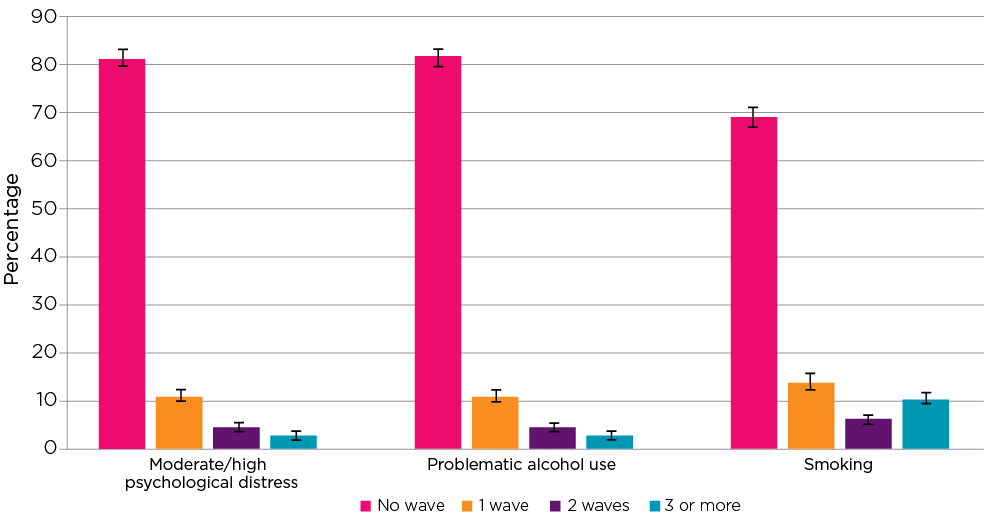
Notes: N = 2,704 psychological distress; N = 2,722 alcohol use; N = 2,716 smoking (resident father data available in at least three interviews between the ages of 4-5 and 12-13). 95% confidence intervals are shown by 'I' bars in each column.
Source: LSAC Waves 3-7, B cohort, age 4-5 to 12-13, weighted
Methodology
Two main research questions were investigated in this paper. First, descriptive analyses were conducted to examine whether the proportion of children with elevated social-emotional symptoms differed by maternal parenting behaviours, parents' mental health and parents' health behaviours. For example, the percentage of children with elevated emotional symptoms was compared between those with high levels of maternal warmth and those with lower levels of maternal warmth. For fathers, an additional category - 'no information' - was included in the analysis to account for the large proportion of resident fathers who did not participate in the study. Significant associations between SDQ components and the variables of interests at each age were assessed using chi-squared tests of association. Confidence intervals (CIs) are also presented for each estimated proportion, to indicate whether two particular point estimates are significantly different from each other (where the 95% CI does not overlap).
Multilevel mixed effects models were then used to examine differences in the level of total difficulties scores (level 2, between-person differences) by parenting behaviours, parents' mental health and health behaviours, and also trajectories of total difficulties scores over time (level 1, within-person effects). The mixed model includes fixed effects - the sample average - and random effects - individual variation around the sample average (Singer & Willett, 2003). In this model, longitudinal data are used to assess the associations between predictors and total difficulties scores, allowing respondents to have their own intercept (initial total difficulties score) and slope (rate of change in difficulties score), and uses all available cases (Rabe-Hesketh & Skrondal, 2012). In addition, interaction effects between the key independent variables and time were incorporated in the analysis. Time was centred at baseline in all models (age 4-5).
The mixed effects models can include time-invariant and time-varying predictors (Singer & Willett, 2003). Time-invariant predictors do not change over time, while time-varying predictors can have different values at each time point between the ages of 4-5 and 12-13. The parenting variables in the mixed effects growth models were decomposed into within- and between-person variables (Curran & Bauer, 2011). The three within-person parenting variables are time-varying and indicate whether a child experienced less optimal parenting at each particular point in time: '1' if less optimal parenting was experienced, '0' otherwise, at each wave, for each of the three parenting behaviours examined (warmth, hostility and consistency). In contrast, the between-person parenting variables are time-invariant and indicate whether a child experienced less optimal parenting (either low warmth, high hostility or low consistency) at any time between age 4-5 and age 12-13 ('1' if less optimal parenting was experienced across waves, '0' otherwise, for each parenting behaviour). Having separate within- and between-person parenting variables means the ability to identify the effect of less optimal parenting at the individual level, as well as the differences between those who experience less optimal parenting at least once and those who do not.
In the current analysis, the variables for parents' mental health and health behaviours were computed as time-invariant (i.e. their values remain constant in the models but longitudinal data were used to derive these variables). For maternal mental health, alcohol use and smoking, children were classified as having at least one episode, between the ages of 4-5 and 12-13, of a mother (three separate variables):
- experiencing moderate or high psychological distress
- experiencing problematic use of alcohol
- smoking.
For fathers, these variables also include a 'no information' category if these data were not provided in all completed waves.
There are three different types of time-invariant control variables in the models presented:
- Variables measured at the first wave of data collection, when children were aged 0-1. These variables were maternal separation anxiety, mothers' mental health problems in pregnancy, maternal age at birth, Indigenous status, and sex.
- Variables measured when study children were age 4-5. These variables identify the child's and family's socio-demographic characteristics at the beginning of the study period (parental education, parent-reported general health of the child, study child with special health-care needs, language other than English (LOTE) at home, birth order, area of residence and index of neighbourhood advantage).
- Variables indicating whether additional risk factors were experienced at any time point during the observation period, when children were aged between 4-5 and 12-13 (income support as main source of income, household member with disability or long-term health condition, lowest 25% of equivalised parental income). In addition, a dummy variable indicating single-parent household at each age (from 4-5 to 12-13) was included in the models. The distribution of all variables included is provided in the appendix (Table 21).
Following the estimation of the mixed effects regression models, predicted values for a number of different scenarios were estimated to illustrate the effects of the relevant independent variables on children's total difficulties scores.
1 In LSAC, when the study children were aged 4-5, parents completed the age 2-4 version of the SDQ questionnaire. See Table 18 (appendix) for details.
Results
Parenting behaviours
The following tables present the percentages of children with elevated symptoms for each SDQ component and total difficulties, by parenting behaviours. At each age, the percentage of children with elevated emotional symptoms was higher among children whose mothers showed lower levels of maternal warmth (Table 4). This difference remained stable over time (between 6% and 7%).
Similarly, a larger percentage of children who experienced high maternal hostility had elevated levels of emotional symptoms across ages. The difference in the percentage of children with elevated symptoms was largest by maternal hostility (around 20%) than it was by maternal warmth. Likewise, a higher percentage of children who experienced low maternal consistency showed elevated levels of emotional symptoms at each time point. This difference remained stable as children got older, and was slightly larger than that observed for maternal warmth.
| Children with elevated emotional symptoms | ||||||||||
|---|---|---|---|---|---|---|---|---|---|---|
| Age 4-5 (2008) | Age 6-7 (2010) | Age 8-9 (2012) | Age 10-11 (2014) | Age 12-13 (2016) | ||||||
| % | Cl | % | Cl | % | Cl | % | Cl | % | Cl | |
| Maternal warmth | ||||||||||
| High warmth | 19.2 | [17.6,20.8] | 16.0 | [14.4,17.6] | 17.1 | [15.6,18.6] | 19.7 | [18.0,21.5] | 19.9 | [18.0,21.7] |
| Low warmth | 25.5 | [22.2,28.7] | 23.0 | [19.8,26.2] | 24.5 | [20.3,28.7] | 25.3 | [21.6,29.0] | 27.0 | [23.0,30.9] |
| Total, N | 3,796 | 4,152 | 3,940 | 3,610 | 3,220 | |||||
| Maternal hostility | ||||||||||
| Low hostility | 17.2 | [15.7,18.8] | 14.0 | [12.6,15.4] | 15.2 | [13.9,16.6] | 17.8 | [16.1,19.5] | 17.7 | [15.9,19.4] |
| High hostility | 37.1 | [32.7,41.4] | 33.2 | [29.0,37.5] | 32.8 | [28.8,36.8] | 35.3 | [30.7,39.8] | 40.4 | [35.3,45.5] |
| Total, N | 3,784 | 4,150 | 3,939 | 3,610 | 3,219 | |||||
| Maternal consistency | ||||||||||
| High consistency | 18.6 | [17.1,20.2] | 15.7 | [14.2,17.2] | 16.3 | [14.9,17.7] | 19.2 | [17.5,20.8] | 19.7 | [18.0,21.5] |
| Low consistency | 29.4 | [25.6,33.3] | 25.8 | [21.5,30.2] | 29.1 | [24.9,33.4] | 29.7 | [24.9,34.4] | 30.9 | [25.9,35.8] |
| Total, N | 3,781 | 4,150 | 3,939 | 3,610 | 3,215 | |||||
Notes: Chi-squared test significant for warmth, hostility and consistency at each age at 95% level. CI: confidence interval. Confidence intervals that do not overlap indicate a statistically significant difference between two point estimates. The cut point is different at age 4-5.
Source: LSAC Waves 3-7, B cohort, weighted
There was a higher percentage of children with elevated levels of hyperactivity among those who experienced lower levels of maternal warmth, particularly from age 8-9 onwards (Table 5). Similarly, a higher percentage of children showed elevated levels of hyperactivity among those who experienced high levels of maternal hostility. The difference in the percentage of children with elevated hyperactivity by maternal hostility was much larger than that observed for maternal warmth. The percentage of children with elevated levels of hyperactivity remained stable among children who experienced high levels of maternal consistency and peaked at age 8-9 among those who experienced low consistency.
| Children with elevated hyperactivity | ||||||||||
|---|---|---|---|---|---|---|---|---|---|---|
| Age 4-5 (2008) | Age 6-7 (2010) | Age 8-9 (2012) | Age 10-11 (2014) | Age 12-13 (2016) | ||||||
| % | Cl | % | Cl | % | Cl | % | Cl | % | Cl | |
| Maternal warmth | ||||||||||
| High warmth | 13.6 | [12.1,15.1] | 18.0 | [16.4,19.6] | 18.9 | [17.4,20.4] | 15.3 | [13.8,16.8] | 13.5 | [11.8,15.2] |
| Low warmth | 18.2 | [15.3,21.1] | 21.3 | [18.2,24.5] | 27.9 | [24.2,31.7] | 26.1 | [22.3,29.9] | 23.0 | [18.9,27.0] |
| Total, N | 3,795 | 4,152 | 3,940 | 3,610 | 3,219 | |||||
| Maternal hostility | ||||||||||
| Low hostility | 10.8 | [9.5,12.0] | 13.6 | [12.3,15.0] | 15.6 | [14.2,17.0] | 12.9 | [11.5,14.3] | 11.8 | [10.4,13.3] |
| High hostility | 33.4 | [28.9,37.9] | 41.9 | [37.6,46.1] | 42.5 | [38.0,47.1] | 39.1 | [34.6,43.6] | 34.5 | [29.4,39.7] |
| Total, N | 3,782 | 4,150 | 3,939 | 3,610 | 3,218 | |||||
| Maternal consistency | ||||||||||
| High consistency | 11.8 | [10.5,13.1] | 15.6 | [14.2,17.1] | 16.6 | [15.3,18.0] | 14.0 | [12.6,15.4] | 12.9 | [11.3,14.6] |
| Low consistency | 27.1 | [23.1,31.2] | 33.3 | [28.8,37.8] | 40.1 | [35.6,44.6] | 35.5 | [30.9,40.0] | 30.5 | [25.6,35.3] |
| Total, N | 3,779 | 4,150 | 3,939 | 3,610 | 3,214 | |||||
Notes: Chi-squared test significant for warmth, hostility and consistency at each age at 95% level except for maternal warmth at age 6-7. CI: confidence interval. Confidence intervals that do not overlap indicate a statistically significant difference between two point estimates.
Source: LSAC Waves 3-7, B cohort, weighted
The percentage of children with elevated levels of conduct problems decreased with age among those with higher levels of maternal warmth (Table 6). However, this percentage remained at around 30-35% among children who experienced lower levels of maternal warmth. Around 50% of children experiencing high maternal hostility showed elevated levels of conduct problems. The percentage of children with elevated levels of conduct problems was highest at age 6-7 among those with low maternal consistency and decreased with age. The difference in the percentage of children with elevated levels of conduct problems by maternal hostility was much larger than for maternal warmth and consistency (over 30%).
| Children with elevated conduct problems | ||||||||||
|---|---|---|---|---|---|---|---|---|---|---|
| Age 4-5 (2008) | Age 6-7 (2010) | Age 8-9 (2012) | Age 10-11 (2014) | Age 12-13 (2016) | ||||||
| % | Cl | % | Cl | % | Cl | % | Cl | % | Cl | |
| Maternal warmth | ||||||||||
| High warmth | 20.0 | [18.5,21.5] | 21.2 | [19.4,23.0] | 17.2 | [15.8,18.7] | 13.2 | [11.8,14.7] | 10.4 | [8.9,11.8] |
| Low warmth | 29.8 | [26.4,33.3] | 33.5 | [29.4,37.6] | 34.5 | [30.1,38.9] | 29.4 | [25.6,33.3] | 29.0 | [24.8,33.1] |
| Total, N | 3,797 | 4,152 | 3,940 | 3,610 | 3,220 | |||||
| Maternal hostility | ||||||||||
| Low hostility | 16.3 | [15.0,17.7] | 16.6 | [15.0,18.2] | 13.0 | [11.7,14.3] | 10.0 | [8.7,11.3] | 8.1 | [6.7,9.5] |
| High hostility | 50.7 | [46.5,54.9] | 56.6 | [52.6,60.7] | 52.3 | [47.9,56.7] | 47.2 | [42.4,52.1] | 46.8 | [41.3,52.2] |
| Total, N | 3,784 | 4,150 | 3,939 | 3,610 | 3,219 | |||||
| Maternal consistency | ||||||||||
| High consistency | 18.1 | [16.7,19.6] | 18.9 | [17.2,20.6] | 15.2 | [13.8,16.6] | 12.2 | [10.8,13.7] | 10.9 | [9.3,12.4] |
| Low consistency | 40.5 | [36.3,44.6] | 47.3 | [42.9,51.8] | 45.0 | [40.7,49.4] | 38.6 | [34.2,43.0] | 34.9 | [29.6,40.2] |
| Total, N | 3,781 | 4,150 | 3,939 | 3,610 | 3,215 | |||||
Notes: Chi-squared test significant for warmth, hostility and consistency at each age at 95% level. CI: confidence interval. Confidence intervals that do not overlap indicate a statistically significant difference between two point estimates. The cut point is different at age 4-5.
Source: LSAC Waves 3-7, B cohort, weighted
The difference in the percentage of children with elevated levels of peer problems by maternal warmth varied between 6% and 10% across ages (Table 7). The percentage of children with elevated levels of peer problems remained stable among children who experienced low maternal hostility. Among those who experienced high maternal hostility, this percentage increased between the ages of 4-5 and 8-9. A similar pattern was observed by maternal consistency but with a smaller difference between parenting groups in the percentage of children with elevated peer problems.
| Children with elevated peer problems | ||||||||||
|---|---|---|---|---|---|---|---|---|---|---|
| Age 4-5 (2008) | Age 6-7 (2010) | Age 8-9 (2012) | Age 10-11 (2014) | Age 12-13 (2016) | ||||||
| % | Cl | % | Cl | % | Cl | % | Cl | % | Cl | |
| Maternal warmth | ||||||||||
| High warmth | 19.2 | [17.4,21.0] | 20.7 | [19.1,22.3] | 22.2 | [20.5,23.9] | 22.8 | [21.0,24.7] | 21.8 | [19.8,23.7] |
| Low warmth | 28.2 | [24.9,31.5] | 27.2 | [23.5,30.8] | 28.3 | [24.4,32.3] | 32.6 | [28.9,36.3] | 32.3 | [28.4,36.3] |
| Total, N | 3,796 | 4,152 | 3,940 | 3,610 | 3,220 | |||||
| Maternal hostility | ||||||||||
| Low hostility | 18.8 | [17.1,20.5] | 19.0 | [17.4,20.6] | 19.6 | [18.0,21.1] | 21.4 | [19.6,23.2] | 20.8 | [18.9,22.7] |
| High hostility | 32.6 | [28.0,37.1] | 36.2 | [32.0,40.4] | 40.5 | [36.1,44.8] | 41.0 | [36.5,45.5] | 41.0 | [35.9,46.0] |
| Total, N | 3,783 | 4,150 | 3,939 | 3,610 | 3,219 | |||||
| Maternal consistency | ||||||||||
| High consistency | 19.5 | [17.8,21.2] | 20.2 | [18.5,21.9] | 21.0 | [19.4,22.6] | 22.4 | [20.7,24.2] | 21.8 | [19.9,23.7] |
| Low consistency | 28.2 | [24.3,32.2] | 31.0 | [27.0,35.1] | 35.1 | [30.7,39.6] | 37.1 | [32.5,41.8] | 36.9 | [31.4,42.4] |
| Total, N | 3,780 | 4,150 | 3,939 | 3,610 | 3,215 | |||||
Notes: Chi-squared test significant for warmth, hostility and consistency at each age at 95% level. CI: confidence interval. Confidence intervals that do not overlap indicate a statistically significant difference between two point estimates.
Source: LSAC Waves 3-7, B cohort, weighted
The total difficulties score is the sum of the four subscales already presented: emotional symptoms, hyperactivity, conduct problems and peer problems. Therefore, results for the total difficulties score reflect what was observed for each component (Table 8). Overall, the percentage of children with elevated total difficulties was higher among those who experienced lower warmth, higher hostility or lower consistency compared with other children, at every age. Looking at maternal warmth, the percentage of children with elevated total difficulties decreased with age among those with high warmth. Among children who experienced low warmth, the percentage with elevated total difficulties peaked at age 8-9.
For each individual component, the largest gap between parenting groups in terms of the percentage of children with elevated difficulties was observed for maternal hostility. This percentage remained stable across ages at around 32 percentage points. Similar to the findings for maternal warmth, the percentage of children with elevated total difficulties decreased slightly over time among those who experienced high maternal consistency, while this percentage was highest at age 8-9 among children who experienced low levels of consistency.
| Children with elevated total difficulties | ||||||||||
|---|---|---|---|---|---|---|---|---|---|---|
| Age 4-5 (2008) | Age 6-7 (2010) | Age 8-9 (2012) | Age 10-11 (2014) | Age 12-13 (2016) | ||||||
| % | Cl | % | Cl | % | Cl | % | Cl | % | Cl | |
| Maternal warmth | ||||||||||
| High warmth | 17.0 | [15.4,18.7] | 15.0 | [13.4,16.6] | 15.1 | [13.7,16.5] | 12.6 | [11.1,14.1] | 12.3 | [10.6,14.0] |
| Low warmth | 27.3 | [24.1,30.6] | 21.8 | [18.1,25.6] | 28.1 | [24.0,32.3] | 26.7 | [23.0,30.5] | 25.7 | [21.8,29.7] |
| Total, N | 3,793 | 4,152 | 3,940 | 3,610 | 3,219 | |||||
| Maternal hostility | ||||||||||
| Low hostility | 13.9 | [12.5,15.3] | 10.7 | [9.4,12.0] | 11.5 | [10.1,12.8] | 10.0 | [8.7,11.3] | 10.0 | [8.5,11.5] |
| High hostility | 46.1 | [42.0,50.1] | 42.6 | [38.4,46.8] | 44.3 | [40.0,48.6] | 41.1 | [36.4,45.9] | 42.0 | [36.6,47.4] |
| Total, N | 3,781 | 4,150 | 3,939 | 3,610 | 3,218 | |||||
| Maternal consistency | ||||||||||
| High consistency | 15.7 | [14.2,17.3] | 12.9 | [11.4,14.4] | 13.5 | [12.1,14.9] | 11.9 | [10.5,13.4] | 12.1 | [10.6,13.7] |
| Low consistency | 35.8 | [31.8,39.8] | 33.4 | [29.0,37.8] | 37.1 | [32.8,41.4] | 33.5 | [28.7,38.2] | 32.9 | [27.8,37.9] |
| Total, N | 3,778 | 4,150 | 3,939 | 3,610 | 3,214 | |||||
Notes: Chi-squared test significant for warmth, hostility and consistency at each age at 95% level. CI: confidence interval. Confidence intervals that do not overlap indicate a statistically significant difference between two point estimates. The cut point is different at age 4-5.
Source: LSAC Waves 3-7, B cohort, weighted
The difference in the percentage of children with low levels of prosociality, by maternal warmth, was larger at age 4-5 and remained stable between the ages of 6-7 and 12-13 (Table 9). Consistent with previous findings, this percentage was higher among children who experienced high maternal hostility at each age. This difference was larger at age 4-5, decreased slightly between ages 6-7 and 10-11, and increased again at age 12-13. The percentage of children with low levels of prosociality was also higher among those with low maternal consistency, and this difference was largest at ages 4-5 and 12-13. This pattern was similar to that observed for maternal hostility but the difference between parenting groups was smaller for maternal consistency.
| Children with slightly low or low prosociality | ||||||||||
|---|---|---|---|---|---|---|---|---|---|---|
| Age 4-5 (2008) | Age 6-7 (2010) | Age 8-9 (2012) | Age 10-11 (2014) | Age 12-13 (2016) | ||||||
| % | Cl | % | Cl | % | Cl | % | Cl | % | Cl | |
| Maternal warmth | ||||||||||
| High warmth | 22.2 | [20.6,23.9] | 6.2 | [5.2,7.1] | 5.7 | [4.8,6.5] | 4.0 | [3.2,4.7] | 7.4 | [6.2,8.7] |
| Low warmth | 39.4 | [35.8,43.0] | 16.8 | [13.9,19.8] | 15.0 | [12.2,17.9] | 16.9 | [13.8,20.1] | 20.1 | [16.8,23.4] |
| Total, N | 3,800 | 4,152 | 3,940 | 3,610 | 3,220 | |||||
| Maternal hostility | ||||||||||
| Low hostility | 23.6 | [21.9,25.2] | 5.9 | [4.9,6.8] | 5.1 | [4.3,5.9] | 4.9 | [4.0,5.9] | 7.3 | [6.2,8.4] |
| High hostility | 38.3 | [34.0,42.7] | 20.0 | [16.6,23.4] | 16.6 | [13.6,19.6] | 14.6 | [11.4,17.8] | 25.3 | [20.9,29.7] |
| Total, N | 3,787 | 4,150 | 3,939 | 3,610 | 3,219 | |||||
| Maternal consistency | ||||||||||
| High consistency | 24.3 | [22.7,26.0] | 7.0 | [6.0,7.9] | 5.8 | [5.0,6.6] | 5.8 | [4.8,6.8] | 8.5 | [7.2,9.8] |
| Low consistency | 34.0 | [30.0,38.1] | 15.3 | [12.2,18.3] | 14.2 | [11.1,17.4] | 10.9 | [8.1,13.7] | 19.7 | [15.6,23.9] |
| Total, N | 3,784 | 4,150 | 3,939 | 3,610 | 3,215 | |||||
Notes: Chi-squared test significant for warmth, hostility and consistency at each age at 95% level. CI: confidence interval. Confidence intervals that do not overlap indicate a statistically significant difference between two point estimates. The cut point is different at age 4-5.
Source: LSAC Waves 3-7, B cohort, weighted
Summary of findings
This section examined the differences in the proportions of children with an elevated risk of difficulties for each of the components of the SDQ, comparing children classified in the 15-20% of less optimal parenting with the rest of the sample (low vs high warmth, high vs low hostility, and low vs high consistency). The results of this analysis indicate that:
- A higher percentage of children who experienced low maternal warmth, high maternal hostility or low maternal consistency showed elevated levels of difficulties across all components of the SDQ at all ages, compared with the rest of the sample (except for hyperactivity and maternal warmth at age 6-7).
- The difference in the percentage of children with elevated difficulties was larger for maternal hostility for all the outcomes examined, except prosocial behaviour.
- Mothers' parenting behaviours, particularly maternal hostility and consistency, appeared to have a larger effect on conduct problems than on other social-emotional outcomes.
Parents' mental health and health behaviours
A higher proportion of children whose mothers were classified as having moderate or high levels of psychological distress - according to the Kessler 6 - showed elevated levels of emotional problems at every age (Table 10). The proportion of children with elevated levels of emotional symptoms was between 37% and 43% among children whose mothers had moderate or high levels of psychological distress, while this proportion was between 14% and 18% among children whose mothers had low psychological distress.
The proportion of children with elevated emotional symptoms was higher among those whose fathers presented moderate or high levels of psychological distress, compared with children whose fathers had low levels of distress, at every age. Among children whose resident father did not complete an interview or had missing data on this question (24-27% across ages), the proportion with elevated emotional problems was in-between that of the other two groups.
Regarding mothers' alcohol use, the proportion of children with elevated emotional problems was lower among mothers with problematic use of alcohol compared with mothers with no problematic use of alcohol at age 4-5. However, there was no reliable association between problematic alcohol use and emotional problems at other ages. For fathers, there was a significant association between alcohol use and emotional symptoms only at ages 8-9 and 10-11, and mainly between those with problematic use of alcohol and those with no information. There were no significant differences in the proportion of children with elevated emotional symptoms between those with and those without problematic alcohol use.
Mothers' smoking was not consistently associated with emotional symptoms but fathers' smoking was associated with children's emotional problems between the ages of 6-7 and 10-11; the lowest proportion of children with elevated emotional symptoms was among those whose fathers did not smoke. The proportion of children with elevated emotional symptoms was similar between children whose fathers smoked and children with no information on this item.
| Parent health variables | Children with elevated emotional problems | |||||||||
|---|---|---|---|---|---|---|---|---|---|---|
| Age 4-5 (2008) | Age 6-7 (2010) | Age 8-9 (2012) | Age 10-11 (2014) | Age 12-13 (2016) | ||||||
| % | Cl | % | Cl | % | Cl | % | Cl | % | Cl | |
| Mother psychological distress | ||||||||||
| Low distress | 18.3 | [16.9,19.7] | 13.6 | [12.2,15.0] | 15.9 | [14.6,17.1] | 17.8 | [16.2,19.4] | 18.3 | [16.7,20.0] |
| Moderate/high distress | 38.7 | [33.1,44.2] | 43.1 | [37.8,48.3] | 37.2 | [31.5,42.8] | 43.2 | [37.1,49.3] | 42.4 | [36.5,48.2] |
| Total, N | 3,752 | 4,141 | 3,926 | 3,601 | 3,211 | |||||
| Father psychological distress | ||||||||||
| Low distress | 18.7 | [17.1,20.2] | 14.5 | [12.9,16.1] | 15.1 | [13.4,16.7] | 16.7 | [14.8,18.6] | 18.1 | [16.0,20.3] |
| Moderate/high distress | 29.4 | [21.9,37.0] | 22.5 | [15.8,29.2] | 24.7 | [17.2,32.1] | 27.3 | [18.5,36.2] | 31.3 | [22.3,40.3] |
| No information | 20.3 | [17.1,23.6] | 18.7 | [15.6,21.7] | 20.0 | [17.1,22.9] | 21.5 | [18.3,24.7] | 20.5 | [16.9,24.2] |
| Total, N | 3,446 | 3,703 | 3,479 | 3,149 | 2,793 | |||||
| Mother alcohol use | ||||||||||
| Problematic | 15.5 | [11.3,19.6] | 15.7 | [11.6,19.7] | 16.1 | [12.6,19.7] | 22.0 | [17.5,26.4] | 18.1 | [14.6,21.7] |
| Not problematic | 21.2 | [19.6,22.7] | 16.2 | [14.7,17.7] | 18.7 | [17.1,20.3] | 20.8 | [18.9,22.6] | 22.0 | [20.0,23.9] |
| Total, N | 3,804 | 3,588 | 3,936 | 3,606 | 3,215 | |||||
| Father alcohol use | ||||||||||
| Problematic | 19.4 | [16.2,22.5] | 14.4 | [9.9,18.8] | 15.3 | [11.4,19.3] | 21.4 | [16.5,26.3] | 20.7 | [14.5,26.9] |
| Not problematic | 20.0 | [17.9,22.0] | 15.4 | [13.5,17.2] | 15.9 | [14.2,17.6] | 16.7 | [14.8,18.7] | 19.1 | [16.9,21.4] |
| No information | 20.0 | [16.8,23.3] | 17.7 | [15.1,20.3] | 20.0 | [17.1,22.9] | 21.5 | [18.3,24.8] | 20.3 | [16.7,23.9] |
| Total, N | 3,446 | 3,703 | 3,479 | 3,149 | 2,793 | |||||
| Mother smoking | ||||||||||
| Smokes | 19.9 | [16.0,23.8] | 19.3 | [16.1,22.5] | 22.0 | [18.4,25.7] | 24.0 | [19.9,28.1] | 24.0 | [19.0,28.9] |
| Does not smoke | 20.8 | [19.2,22.5] | 16.9 | [15.3,18.6] | 17.5 | [16.0,19.0] | 20.3 | [18.5,22.0] | 21.0 | [19.2,22.8] |
| Total, N | 3,804 | 4,150 | 3,937 | 3,609 | 3,219 | |||||
| Father smoking | ||||||||||
| Smokes | 23.8 | [19.4,28.1] | 17.4 | [13.2,21.5] | 17.1 | [13.3,20.9] | 20.0 | [15.2,24.9] | 19.4 | [12.6,26.2] |
| Does not smoke | 18.7 | [17.0,20.4] | 14.5 | [12.8,16.2] | 15.5 | [13.8,17.3] | 16.8 | [14.9,18.6] | 19.2 | [17.0,21.3] |
| No information | 20.1 | [16.8,23.4] | 18.9 | [15.8,22.0] | 20.0 | [17.2,22.9] | 22.0 | [18.7,25.3] | 20.7 | [17.0,24.3] |
| Total, N | 3,446 | 3,703 | 3,479 | 3,149 | 2,793 | |||||
Notes: Chi-squared test significant at 95% level for: psychological distress (mother and father) at all ages, mothers' alcohol use age 4-5, fathers' alcohol use ages 8-9 and 10-11, mothers' smoking age 8-9, fathers' smoking from age 6-7 to 10-11. Children with no resident mother/father at each age are excluded from mothers'/fathers' measures. CI: confidence interval. Confidence intervals that do not overlap indicate a statistically significant difference between two point estimates. The cut point is different at age 4-5.
Source: LSAC Waves 3-7, B cohort, weighted
The proportion of children with elevated levels of hyperactivity was significantly lower among children whose mothers had low levels of psychological distress (Table 11). This was consistent across ages, although the individual proportions varied over time, with the highest proportion of children with elevated hyperactivity observed at age 8-9. Overall, a lower proportion of children whose fathers were classified as having low levels of psychological distress showed elevated levels of hyperactivity compared with children whose fathers had moderate or high levels of distress. Among children with no information, the proportion of children with elevated hyperactivity fluctuated between 12% and 21% across ages.
Mothers' and fathers' alcohol use was not reliably associated with children's levels of hyperactivity. In contrast, there was a significant association between parents' smoking and children's levels of hyperactivity. Among mothers who smoked, a higher proportion of children had elevated hyperactivity, compared with children whose mothers did not smoke across ages (except age 10-11). Overall, a slightly lower proportion of children whose fathers did not smoke had elevated hyperactivity.
| Parent health variables | Children with elevated hyperactivity | |||||||||
|---|---|---|---|---|---|---|---|---|---|---|
| Age 4-5 (2008) | Age 6-7 (2010) | Age 8-9 (2012) | Age 10-11 (2014) | Age 12-13 (2016) | ||||||
| % | Cl | % | Cl | % | Cl | % | Cl | % | Cl | |
| Mother psychological distress | ||||||||||
| Low distress | 13.5 | [12.2,14.9] | 16.9 | [15.4,18.4] | 19.0 | [17.5,20.4] | 15.8 | [14.4,17.2] | 13.9 | [12.2,15.7] |
| Moderate/high distress | 23.6 | [18.4,28.7] | 30.8 | [26.1,35.6] | 32.2 | [26.9,37.5] | 30.2 | [25.0,35.4] | 26.9 | [21.1,32.7] |
| Total, N | 3,751 | 4,141 | 3,926 | 3,601 | 3,210 | |||||
| Father psychological distress | ||||||||||
| Low distress | 13.4 | [11.9,14.9] | 16.4 | [14.8,18.0] | 17.6 | [15.8,19.4] | 14.7 | [13.0,16.5] | 13.5 | [11.4,15.6] |
| Moderate/high distress | 19.8 | [13.9,25.8] | 23.4 | [16.3,30.6] | 23.1 | [16.5,29.8] | 19.5 | [12.1,27.0] | 18.6 | [9.8,27.4] |
| No information | 12.4 | [9.6,15.2] | 18.8 | [16.2,21.5] | 21.1 | [18.4,23.9] | 19.3 | [16.2,22.3] | 16.0 | [12.8,19.1] |
| Total, N | 3,444 | 3,703 | 3,479 | 3,149 | 2,792 | |||||
| Mother alcohol use | ||||||||||
| Problematic | 16.1 | [11.5,20.7] | 20.0 | [15.7,24.3] | 24.0 | [19.7,28.4] | 19.8 | [15.6,23.9] | 16.9 | [12.7,21.2] |
| Not problematic | 14.5 | [13.0,16.0] | 18.9 | [17.2,20.6] | 19.9 | [18.4,21.5] | 17.2 | [15.6,18.8] | 15.4 | [13.6,17.1] |
| Total, N | 3,803 | 3,588 | 3,936 | 3,606 | 3,214 | |||||
| Father alcohol use | ||||||||||
| Problematic | 14.7 | [11.9,17.4] | 17.0 | [12.7,21.3] | 21.4 | [17.1,25.7] | 16.0 | [11.2,20.7] | 13.3 | [7.7,18.8] |
| Not problematic | 13.7 | [11.9,15.6] | 16.7 | [14.9,18.5] | 17.2 | [15.3,19.1] | 15.2 | [13.4,17.1] | 14.2 | [12.0,16.4] |
| No information | 12.4 | [9.5,15.3] | 18.6 | [16.3,21.0] | 21.3 | [18.5,24.1] | 18.7 | [15.6,21.7] | 15.6 | [12.6,18.7] |
| Total, N | 3,444 | 3,703 | 3,479 | 3,149 | 2,792 | |||||
| Mother smoking | ||||||||||
| Smokes | 19.0 | [15.6,22.5] | 24.0 | [20.4,27.7] | 27.6 | [23.6,31.7] | 20.6 | [16.6,24.7] | 19.6 | [15.1,24.2] |
| Does not smoke | 13.5 | [12.2,14.9] | 17.2 | [15.7,18.7] | 18.8 | [17.3,20.3] | 16.9 | [15.4,18.5] | 14.9 | [13.1,16.6] |
| Total, N | 3,803 | 4,150 | 3,937 | 3,609 | 3,218 | |||||
| Father smoking | ||||||||||
| Smokes | 17.9 | [14.1,21.7] | 21.6 | [17.3,25.9] | 22.1 | [17.1,27.1] | 18.4 | [13.3,23.6] | 18.4 | [12.2,24.6] |
| Does not smoke | 12.9 | [11.3,14.5] | 16.0 | [14.3,17.7] | 17.2 | [15.3,19.0] | 14.7 | [12.9,16.4] | 13.4 | [11.3,15.4] |
| No information | 12.4 | [9.6,15.3] | 18.7 | [16.1,21.3] | 21.3 | [18.5,24.1] | 19.0 | [15.9,22.1] | 15.7 | [12.6,18.8] |
| Total, N | 3,444 | 3,703 | 3,479 | 3,149 | 2,792 | |||||
Notes: Chi-squared test significant at 95% for: psychological distress (mother and father), fathers' alcohol use at age 8-9, mothers' smoking all ages except 10-11, fathers' smoking all ages except 12-13. Children with no resident mother/father at each age are excluded from mothers'/fathers' measures. CI: confidence interval. Confidence intervals that do not overlap indicate a statistically significant difference between two point estimates.
Source: LSAC Waves 3-7, B cohort, weighted
Overall, the proportion of children with elevated conduct problems decreased over time for every group, from age 6-7 (Table 12). However, children whose mothers had moderate or high levels of psychological distress consistently showed a higher proportion of elevated conduct problems. This difference was largest at age 6-7. Similarly, a lower proportion of children whose fathers had low psychological distress had elevated levels of conduct problems compared with children whose father had moderate or high psychological distress, or had no information available.
Mothers' problematic use of alcohol was generally not associated with raised levels of conduct problems. However, an association was observed for fathers' alcohol consumption. At every age, a smaller proportion of children whose fathers did not show problematic use of alcohol had elevated conduct problems. The highest proportion of children with elevated conduct problems was among those whose fathers had problematic alcohol use at ages 4-5 and 6-7, and among those with no information at later ages.
Smoking was also associated with conduct problems. In general, there was a lower proportion of elevated conduct problems among children whose mothers and fathers did not smoke.
| Parent health variables | Children with elevated conduct problems | |||||||||
|---|---|---|---|---|---|---|---|---|---|---|
| Age 4-5 (2008) | Age 6-7 (2010) | Age 8-9 (2012) | Age 10-11 (2014) | Age 12-13 (2016) | ||||||
| % | Cl | % | Cl | % | Cl | % | Cl | % | Cl | |
| Mother psychological distress | ||||||||||
| Low distress | 20.2 | [18.7,21.7] | 20.8 | [19.1,22.5] | 18.1 | [16.6,19.5] | 14.2 | [12.8,15.6] | 12.1 | [10.6,13.5] |
| Moderate/high distress | 37.8 | [32.0,43.5] | 43.2 | [37.0,49.4] | 35.8 | [30.3,41.3] | 33.3 | [28.1,38.5] | 31.1 | [25.3,36.9] |
| Total, N | 3,753 | 4,141 | 3,926 | 3,601 | 3,211 | |||||
| Father psychological distress | ||||||||||
| Low distress | 18.8 | [17.2,20.5] | 20.4 | [18.5,22.3] | 15.8 | [14.2,17.5] | 13.1 | [11.3,14.9] | 10.8 | [9.0,12.6] |
| Moderate/high distress | 33.2 | [26.2,40.2] | 30.7 | [23.3,38.2] | 25.5 | [19.0,32.1] | 21.6 | [13.6,29.6] | 25.4 | [16.0,34.9] |
| No information | 24.5 | [21.2,27.7] | 25.1 | [21.9,28.3] | 21.3 | [18.6,24.1] | 18.0 | [15.2,20.9] | 16.1 | [12.9,19.3] |
| Total, N | 3,446 | 3,703 | 3,479 | 3,149 | 2,793 | |||||
| Mother alcohol use | ||||||||||
| Problematic | 26.2 | [21.1,31.3] | 26.2 | [21.3,31.1] | 21.7 | [17.2,26.2] | 22.6 | [17.9,27.3] | 13.9 | [9.7,18.0] |
| Not problematic | 21.8 | [20.2,23.3] | 23.2 | [21.2,25.1] | 19.8 | [18.2,21.3] | 15.7 | [14.2,17.3] | 14.7 | [12.9,16.5] |
| Total, N | 3,805 | 3,588 | 3,936 | 3,606 | 3,215 | |||||
| Father alcohol use | ||||||||||
| Problematic | 25.6 | [22.2,29.0] | 27.8 | [22.1,33.6] | 17.7 | [13.3,22.1] | 17.1 | [12.4,21.8] | 10.5 | [6.0,15.0] |
| Not problematic | 18.2 | [16.5,20.0] | 20.3 | [18.3,22.4] | 16.4 | [14.5,18.2] | 12.9 | [11.1,14.7] | 12.6 | [10.4,14.8] |
| No information | 24.7 | [21.3,28.1] | 23.6 | [20.8,26.5] | 21.3 | [18.6,24.1] | 18.5 | [15.7,21.2] | 15.5 | [12.4,18.6] |
| Total, N | 3,446 | 3,703 | 3,479 | 3,149 | 2,793 | |||||
| Mother smoking | ||||||||||
| Smokes | 31.5 | [28.0,35.0] | 32.4 | [28.5,36.2] | 29.5 | [25.4,33.6] | 24.9 | [20.5,29.3] | 19.0 | [14.6,23.4] |
| Does not smoke | 19.8 | [18.2,21.4] | 21.4 | [19.5,23.3] | 17.8 | [16.4,19.3] | 15.0 | [13.5,16.5] | 13.8 | [12.0,15.6] |
| Total, N | 3,805 | 4,150 | 3,937 | 3,609 | 3,219 | |||||
| Father smoking | ||||||||||
| Smokes | 24.8 | [20.9,28.7] | 30.3 | [25.2,35.5] | 20.1 | [15.7,24.5] | 19.9 | [14.8,25.0] | 16.9 | [11.1,22.8] |
| Does not smoke | 19.0 | [17.2,20.8] | 19.4 | [17.5,21.2] | 15.9 | [14.1,17.6] | 12.6 | [10.8,14.3] | 11.5 | [9.5,13.5] |
| No information | 24.5 | [21.2,27.9] | 24.7 | [21.5,27.9] | 21.5 | [18.7,24.3] | 18.2 | [15.4,21.0] | 15.8 | [12.6,19.0] |
| Total, N | 3,446 | 3,703 | 3,479 | 3,149 | 2,793 | |||||
Notes: Chi-squared test significant at 95% for: psychological distress (mother and father) all ages, mothers' alcohol use age 10-11, fathers' alcohol use all ages except 12-13, smoking (mother and father) all ages. Children with no resident mother/father at each age are excluded from mothers'/fathers' measures. CI: confidence interval. Confidence intervals that do not overlap indicate a statistically significant difference between two point estimates. The cut point is different at age 4-5.
Source: LSAC Waves 3-7, B cohort, weighted
The percentage of children with an elevated risk of peer problems, by parents' mental health, alcohol use and smoking, is presented in Table 13. Similar to the results for conduct problems, there were significant associations between the percentage of children with elevated peer problems and parents' mental health and health behaviours, except for mothers' alcohol use. Overall, a lower proportion of children presented elevated peer problems if their mothers had low levels of psychological distress (vs moderate or high) and did not smoke (vs smoking). Among children whose mothers had moderate or high levels of psychological distress, the proportion with an increased risk of peer problems peaked at age 8-9 (44%). The difference in the percentage of children with an elevated risk of peer problems between groups was larger for mothers' psychological distress than for mothers' smoking.
For fathers' psychological distress, the percentage of children with elevated peer problems was consistently lower among those whose fathers had low levels of distress. The proportion of children with these difficulties was higher among those with moderate or high distress at some ages, and among those whose fathers did not provide information, at other ages (compared with the low distress group). The percentage of children with elevated peer problems was generally similar for those with fathers with and without problematic use of alcohol. However, this proportion was slightly higher among those with no information, particularly at age 10-11. A different pattern was observed for fathers' smoking. The proportion of children with elevated peer problems was consistently lower among those whose fathers did not smoke but the difference between groups varied across ages.
| Parent health variables | Children with elevated peer problems | |||||||||
|---|---|---|---|---|---|---|---|---|---|---|
| Age 4-5 (2008) | Age 6-7 (2010) | Age 8-9 (2012) | Age 10-11 (2014) | Age 12-13 (2016) | ||||||
| % | Cl | % | Cl | % | Cl | % | Cl | % | Cl | |
| Mother psychological distress | ||||||||||
| Low distress | 19.4 | [17.8,21.0] | 19.1 | [17.6,20.6] | 20.6 | [19.0,22.2] | 22.3 | [20.6,23.9] | 22.1 | [20.1,24.0] |
| Moderate/high distress | 37.0 | [31.5,42.6] | 41.3 | [35.9,46.8] | 43.6 | [38.2,49.0] | 42.3 | [37.0,47.5] | 37.5 | [31.5,43.6] |
| Total, N | 3,752 | 4,141 | 3,926 | 3,601 | 3,211 | |||||
| Father psychological distress | ||||||||||
| Low distress | 18.5 | [16.7,20.3] | 18.1 | [16.3,19.9] | 19.0 | [17.3,20.8] | 19.6 | [17.7,21.6] | 20.1 | [17.9,22.3] |
| Moderate/high distress | 29.7 | [23.4,36.0] | 25.9 | [17.5,34.4] | 32.6 | [24.1,41.0] | 27.6 | [19.5,35.6] | 30.6 | [22.5,38.6] |
| No information | 22.1 | [18.6,25.7] | 25.9 | [22.8,29.1] | 23.7 | [20.8,26.7] | 28.9 | [25.2,32.5] | 26.7 | [22.9,30.5] |
| Total, N | 3,445 | 3,703 | 3,479 | 3,149 | 2,793 | |||||
| Mother alcohol use | ||||||||||
| Problematic | 20.9 | [15.9,25.8] | 22.7 | [18.4,27.1] | 22.9 | [18.7,27.0] | 25.8 | [21.0,30.5] | 20.9 | [16.1,25.6] |
| Not problematic | 21.3 | [19.6,23.0] | 19.6 | [17.9,21.2] | 23.3 | [21.6,25.0] | 24.7 | [22.9,26.5] | 24.7 | [22.5,26.8] |
| Total, N | 3,804 | 3,588 | 3,936 | 3,606 | 3,215 | |||||
| Father alcohol use | ||||||||||
| Problematic | 18.3 | [15.0,21.6] | 20.5 | [15.5,25.4] | 21.7 | [17.2,26.2] | 20.7 | [15.5,25.8] | 20.7 | [14.1,27.2] |
| Not problematic | 20.1 | [18.1,22.1] | 19.0 | [17.1,20.9] | 19.8 | [17.9,21.7] | 20.3 | [18.3,22.3] | 21.5 | [19.1,23.9] |
| No information | 22.1 | [18.5,25.6] | 23.5 | [20.8,26.2] | 23.7 | [20.8,26.6] | 28.4 | [24.7,32.1] | 25.9 | [22.2,29.5] |
| Total, N | 3,445 | 3,703 | 3,479 | 3,149 | 2,793 | |||||
| Mother smoking | ||||||||||
| Smokes | 25.2 | [21.4,29.1] | 28.3 | [24.6,31.9] | 32.5 | [28.7,36.4] | 33.5 | [29.2,37.9] | 33.4 | [28.0,38.8] |
| Does not smoke | 20.2 | [18.5,21.9] | 20.4 | [18.7,22.0] | 21.1 | [19.5,22.8] | 23.2 | [21.4,24.9] | 22.2 | [20.3,24.2] |
| Total, N | 3,804 | 4,150 | 3,937 | 3,609 | 3,219 | |||||
| Father smoking | ||||||||||
| Smokes | 23.6 | [19.2,27.9] | 24.6 | [19.6,29.6] | 25.7 | [20.7,30.7] | 29.5 | [24.0,35.0] | 25.2 | [18.2,32.1] |
| Does not smoke | 18.6 | [16.9,20.4] | 17.4 | [15.7,19.1] | 19.1 | [17.1,21.0] | 18.8 | [16.9,20.7] | 20.6 | [18.3,22.8] |
| No information | 22.0 | [18.4,25.5] | 25.9 | [22.7,29.1] | 23.7 | [20.8,26.6] | 28.4 | [24.7,32.1] | 26.4 | [22.6,30.2] |
| Total, N | 3,445 | 3,703 | 3,479 | 3,149 | 2,793 | |||||
Notes: Chi-squared test significant at 95% for: psychological distress (mother and father) all ages, fathers' alcohol age 6-7 and 10-11, smoking (mother and father) all ages. Children with no resident mother/father at each age are excluded from mothers'/fathers' measures. CI: confidence interval. Confidence intervals that do not overlap indicate a statistically significant difference between two point estimates.
Source: LSAC Waves 3-7, B cohort, weighted
There was a significant association between children's total difficulties and parents' mental health and health behaviours (Table 14) except for mothers' alcohol use, as it was found for each of the components of the total difficulties score.
Similar to the findings already presented for each component of the SDQ, the proportion of children with elevated total difficulties was lower among those whose mothers had low levels of distress. The largest difference between groups was at age 6-7 where 13% of children whose mothers had low distress and 42% of children whose mothers had moderate or high distress showed elevated levels of difficulties. For fathers, there was not a large difference in the proportion of children with elevated difficulties between those with moderate/high distress and those with no information. However, the proportion of children with elevated difficulties was consistently lower among those whose fathers had low levels of psychological distress.
A lower proportion of children presented elevated difficulties among those whose fathers did not have a problematic use of alcohol compared with those whose fathers provided no information, particularly between the ages of 8-9 and 10-11. This proportion was fairly similar for those with and without the problematic use of alcohol.
Parents' smoking was also associated with total difficulties, with a higher proportion of children showing elevated difficulties among those whose mothers smoked, compared with those whose mothers did not smoke. For fathers, in turn, there was a lower proportion of children with elevated total difficulties among those whose fathers did not smoke, compared with both those whose fathers did smoke (except for ages 8-9 and 12-13) and those with no information (except for ages 4-5 and 12-13).
| Parent health variables | Children with elevated total difficulties | |||||||||
|---|---|---|---|---|---|---|---|---|---|---|
| Age 4-5 (2008) | Age 6-7 (2010) | Age 8-9 (2012) | Age 10-11 (2014) | Age 12-13 (2016) | ||||||
| % | Cl | % | Cl | % | Cl | % | Cl | % | Cl | |
| Mother psychological distress | ||||||||||
| Low distress | 17.0 | [15.6,18.5] | 12.6 | [11.2,13.9] | 14.8 | [13.4,16.3] | 12.7 | [11.3,14.2] | 12.4 | [10.8,13.9] |
| Moderate/high distress | 38.7 | [33.3,44.1] | 41.6 | [35.8,47.4] | 36.8 | [31.6,42.1] | 35.5 | [30.1,40.9] | 34.8 | [28.9,40.6] |
| Total, N | 3,749 | 4,141 | 3,926 | 3,601 | 3,210 | |||||
| Father psychological distress | ||||||||||
| Low distress | 16.3 | [14.6,18.0] | 12.5 | [10.9,14.1] | 12.4 | [10.9,13.9] | 10.4 | [8.8,12.0] | 11.0 | [9.2,12.9] |
| Moderate/high distress | 31.3 | [24.3,38.3] | 23.6 | [16.6,30.5] | 23.2 | [16.3,30.1] | 17.4 | [10.4,24.5] | 21.7 | [12.9,30.4] |
| No information | 19.3 | [16.2,22.4] | 18.7 | [15.7,21.7] | 20.0 | [17.3,22.6] | 19.0 | [15.9,22.0] | 16.2 | [13.0,19.3] |
| Total, N | 3,443 | 3,703 | 3,479 | 3,149 | 2,792 | |||||
| Mother alcohol use | ||||||||||
| Problematic | 20.0 | [15.2,24.8] | 16.2 | [12.2,20.1] | 16.1 | [12.3,19.8] | 18.2 | [13.9,22.4] | 13.6 | [9.7,17.6] |
| Not problematic | 19.4 | [17.8,20.9] | 15.3 | [13.6,16.9] | 17.5 | [15.8,19.1] | 15.1 | [13.5,16.8] | 15.6 | [13.8,17.4] |
| Total, N | 3,801 | 3,588 | 3,936 | 3,606 | 3,214 | |||||
| Father alcohol use | ||||||||||
| Problematic | 19.6 | [16.4,22.9] | 15.0 | [10.3,19.6] | 12.9 | [9.3,16.5] | 13.2 | [8.9,17.6] | 11.8 | [6.1,17.4] |
| Not problematic | 17.4 | [15.4,19.3] | 13.3 | [11.5,15.1] | 13.1 | [11.5,14.8] | 10.6 | [8.8,12.4] | 12.4 | [10.3,14.5] |
| No information | 18.8 | [15.7,22.0] | 17.2 | [14.5,19.9] | 20.2 | [17.5,22.9] | 18.8 | [15.8,21.9] | 15.4 | [12.4,18.5] |
| Total, N | 3,443 | 3,703 | 3,479 | 3,149 | 2,792 | |||||
| Mother smoking | ||||||||||
| Smokes | 25.7 | [22.1,29.3] | 23.1 | [19.4,26.7] | 24.1 | [20.2,28.0] | 21.8 | [17.6,26.1] | 20.5 | [15.7,25.4] |
| Does not smoke | 17.8 | [16.1,19.5] | 14.6 | [13.0,16.2] | 15.7 | [14.2,17.2] | 14.3 | [12.7,15.8] | 14.4 | [12.6,16.1] |
| Total, N | 3,801 | 4,150 | 3,937 | 3,609 | 3,218 | |||||
| Father smoking | ||||||||||
| Smokes | 22.7 | [18.6,26.9] | 19.5 | [15.0,23.9] | 17.2 | [13.1,21.3] | 17.9 | [13.1,22.7] | 17.4 | [10.6,24.3] |
| Does not smoke | 16.6 | [14.8,18.4] | 11.9 | [10.3,13.6] | 12.4 | [10.9,14.0] | 9.8 | [8.1,11.4] | 11.3 | [9.3,13.3] |
| No information | 19.0 | [15.8,22.2] | 18.8 | [15.8,21.9] | 20.1 | [17.4,22.8] | 18.9 | [15.8,22.0] | 15.9 | [12.7,19.1] |
| Total, N | 3,443 | 3,703 | 3,479 | 3,149 | 2,792 | |||||
Notes: Chi-squared test significant at 95% for: psychological distress (mother and father) all ages, fathers' alcohol use age 6-7 to 10-11, smoking (mother and fathers) all ages. Children with no resident mother/father at each age are excluded from mothers'/fathers' measures. CI: confidence interval. Confidence intervals that do not overlap indicate a statistically significant difference between two point estimates. The cut point is different at age 4-5.
Source: LSAC Waves 3-7, B cohort, weighted
Results for the association between prosociality and parents' mental health and health behaviours are presented in Table 15. A significant association was found for mothers' psychological distress from age 6-7 onwards; there was a lower proportion of children with low prosocial behaviours among those whose mothers had low levels of psychological distress, compared with those whose mothers had moderate or high distress, and this difference increased slightly with age. For fathers, there was no consistent association between psychological distress and prosocial behaviours.
There were no significant associations between prosociality and mothers' alcohol use (except for age 4-5), mothers' smoking (except for age 12-13) and fathers' smoking. For fathers' alcohol use, a significant association was found from age 10-11, where there was a somewhat higher proportion of children with slightly low or low prosociality among those with no information on alcohol use.
| Parent health variables | Children with slightly low or low prosociality | |||||||||
|---|---|---|---|---|---|---|---|---|---|---|
| Age 4-5 (2008) | Age 6-7 (2010) | Age 8-9 (2012) | Age 10-11 (2014) | Age 12-13 (2016) | ||||||
| % | Cl | % | Cl | % | Cl | % | Cl | % | Cl | |
| Mother psychological distress | ||||||||||
| Low distress | 25.4 | [23.8,27.1] | 7.8 | [6.8,8.8] | 6.7 | [5.9,7.6] | 5.8 | [4.9,6.7] | 9.4 | [8.1,10.7] |
| Moderate/high distress | 29.9 | [24.9,34.9] | 11.6 | [8.4,14.8] | 11.0 | [7.6,14.5] | 12.3 | [8.4,16.2] | 15.7 | [11.0,20.5] |
| Total, N | 3,756 | 4,141 | 3,926 | 3,601 | 3,211 | |||||
| Father psychological distress | ||||||||||
| Low distress | 25.4 | [23.5,27.2] | 7.5 | [6.3,8.6] | 6.1 | [5.1,7.1] | 5.4 | [4.4,6.5] | 7.8 | [6.5,9.1] |
| Moderate/high distress | 25.1 | [19.4,30.7] | 12.4 | [6.9,17.8] | 7.4 | [2.6,12.2] | 8.4 | [2.1,14.7] | 13.1 | [6.6,19.6] |
| No information | 26.5 | [23.1,29.8] | 9.0 | [7.0,11.0] | 6.6 | [4.9,8.3] | 7.6 | [5.2,9.9] | 12.0 | [9.1,14.8] |
| Total, N | 3,448 | 3,703 | 3,479 | 3,149 | 2,793 | |||||
| Mother alcohol use | ||||||||||
| Problematic | 32.2 | [26.8,37.7] | 9.1 | [5.8,12.3] | 7.8 | [5.2,10.4] | 5.3 | [3.0,7.5] | 10.3 | [7.2,13.5] |
| Not problematic | 25.5 | [23.8,27.1] | 8.0 | [6.9,9.0] | 7.1 | [6.2,8.0] | 6.8 | [5.8,7.9] | 10.2 | [8.9,11.6] |
| Total, N | 3,808 | 3,588 | 3,936 | 3,606 | 3,215 | |||||
| Father alcohol use | ||||||||||
| Problematic | 26.0 | [22.6,29.4] | 8.6 | [5.4,11.7] | 4.5 | [2.3,6.7] | 5.3 | [2.6,8.0] | 7.6 | [4.4,10.7] |
| Not problematic | 24.9 | [22.9,26.9] | 8.1 | [6.7,9.5] | 6.5 | [5.3,7.7] | 5.4 | [4.3,6.4] | 8.5 | [7.0,9.9] |
| No information | 27.0 | [23.4,30.5] | 8.3 | [6.6,9.9] | 6.6 | [4.9,8.4] | 8.3 | [5.8,10.7] | 11.8 | [8.9,14.7] |
| Total,N | 3,448 | 3,703 | 3,479 | 3,149 | 2,793 | |||||
| Mother smoking | ||||||||||
| Smokes | 29.4 | [25.1,33.8] | 8.6 | [6.3,11.0] | 8.3 | [6.1,10.6] | 7.1 | [4.3,10.0] | 14.7 | [10.8,18.7] |
| Does not smoke | 25.2 | [23.6,26.9] | 8.3 | [7.3,9.4] | 6.9 | [6.0,7.8] | 6.6 | [5.6,7.6] | 9.3 | [8.0,10.6] |
| Total, N | 3,808 | 4,150 | 3,937 | 3,609 | 3,219 | |||||
| Father smoking | ||||||||||
| Smokes | 24.1 | [20.0,28.3] | 6.8 | [4.0,9.7] | 8.3 | [5.0,11.6] | 7.0 | [3.6,10.4] | 8.4 | [3.8,13.0] |
| Does not smoke | 25.6 | [23.7,27.4] | 8.1 | [6.8,9.3] | 5.8 | [4.7,6.8] | 5.3 | [4.2,6.4] | 8.4 | [7.0,9.8] |
| No information | 26.8 | [23.3,30.3] | 8.9 | [6.9,10.9] | 6.6 | [4.9,8.3] | 7.8 | [5.4,10.3] | 11.7 | [8.8,14.6] |
| Total, N | 3,448 | 3,703 | 3,479 | 3,149 | 2,793 | |||||
Notes: Chi-squared test significant at 95% for: mothers' psychological distress age 6-7 onwards, fathers' psychological distress age 12-13, mothers' alcohol use age 4-5, fathers' alcohol use age 10-11 onwards, mothers' smoking age 12-13. Children with no resident mother/father at each age are excluded from mothers'/fathers' measures. CI: confidence interval. Confidence intervals that do not overlap indicate a statistically significant difference between two point estimates. The cut point is different at age 4-5.
Source: LSAC Waves 3-7, B cohort, weighted
Summary of findings
There was a general pattern of a lower proportion of children with elevated risk of social-emotional difficulties among parents with more positive mental health and health behaviours. However, this pattern did not apply to all outcomes or all health behaviours. Some of the main findings from this section were:
- There were significant associations between mothers' mental health and fathers' mental health and all the components of the total difficulties score. A lower proportion of children had elevated difficulties among mothers and fathers with low psychological distress.
- Mothers' problematic use of alcohol was not reliably associated with social-emotional difficulties. That is, there was no consistent pattern of better social-emotional outcomes among those whose mothers had no problematic alcohol use.
- Fathers' alcohol use and smoking were associated with most outcomes examined. However, some of the differences were compared with the group that had no information, and not between children with fathers with and without problematic alcohol use/smoking.
- Mothers' smoking was associated with a greater risk of social-emotional problems among children. There was a lower proportion of children with elevated conduct problems, peer problems and total difficulties among those whose mothers did not smoke, at all ages.
- Overall, prosociality was not consistently associated with fathers' mental health, parents' alcohol use and parents' smoking.
Longitudinal trajectories of total difficulties
The descriptive analysis discussed above did not control for the effect of other variables. For example, certain health conditions are more common among certain groups in the population, which can also be associated with children's social-emotional outcomes. In addition, the descriptive analysis was cross-sectional. The analysis in this section included longitudinal data and controlled for potential confounders.
Results from the mixed models are presented in Table 16. On average, the main effects model shows that total difficulties scores decreased slightly over time. The coefficients for the three time-varying parenting variables - maternal warmth, hostility and consistency - indicate significant within-person effects of parenting behaviours. For maternal warmth, a child's total difficulties score was higher on occasions when he or she experienced low warmth, compared with occasions when the same child experienced high maternal warmth. Similarly, a child's total difficulties score was higher on occasions when he or she experienced high maternal hostility, compared with occasions when the same child experienced low levels of maternal hostility. The same result applied to maternal consistency. The largest effect was observed for high maternal hostility (nearly 2 points in the total difficulties score scale, or 0.41 standard deviations).
Between-person effects for maternal hostility and consistency were also significant. These effects show that children who experienced high maternal hostility or low maternal consistency at any time between the ages of 4-5 and 12-13 had higher total difficulties scores compared with children who did not experience these parenting behaviours, with a larger effect for maternal hostility (around 2 points in the total difficulties score scale, or 0.42 standard deviations).
Mothers' psychological distress was negatively related to children's total difficulties scores. Children between the ages of 4-5 and 12-13 whose mothers experienced at least one episode of moderate or high psychological distress had higher total difficulties scores compared with children of mothers with no episodes of psychological distress. Children whose mothers were smokers, on at least one wave of data collection, had higher total difficulties scores than those whose mothers did not smoke over the observation period, although the coefficient was smaller than for mothers' mental health and parenting behaviours. Children whose mothers were older and had no mental health problems during pregnancy had lower total difficulties scores at age 4-5.
Unsurprisingly, the child's health was significantly associated with total difficulties scores. Children who were not in 'excellent' health and those with special health care needs had higher total difficulties scores at age 4-5. Consistent with other research, boys had higher levels of total difficulties compared with girls.
In terms of socio-demographic characteristics, children in less advantaged neighbourhoods at baseline, whose parents had lower levels of education, experienced income support as their main source of income (at least once), or lived with a person with a disability or health condition (at least once) had higher total difficulties scores at age 4-5.
The random effects indicate that, after controlling for a number of factors in the fixed part of the model, such as socio-demographic characteristics of the parents and the child, parenting behaviours, parents' mental health and health behaviours, there was still significant variation around the average intercept at age 4-5 (around 3 points, 0.6 of a standard deviation) and slope.
The second model includes time interactions for the predictors of interest. Time interactions were tested for each of the parenting behaviours, mothers' psychological distress and mothers' smoking. The two interaction effects that were significant - between person hostility and mothers' psychological distress - were included in the final model and are presented in Table 16. The time interactions test whether the positive effect of high maternal hostility on total difficulties scores (i.e. high hostility leading to higher difficulties), for example, depends on time. The significant coefficient for the interaction between maternal hostility and time indicates that the difference in total difficulties score between children with low maternal hostility (lower difficulties score) and high maternal hostility (higher difficulties score) becomes larger as time goes on. A similar result was observed for mothers' psychological distress, but the effect was smaller. These effects will be illustrated in the next section.
| Independent variables | Main effects | Time interactions | ||
|---|---|---|---|---|
| Coef. | 95% CI | Coef. | 95% CI | |
| Time | -0.20*** | [-0.24,-0.16] | -0.34*** | [-0.39,-0.28] |
| Parenting | ||||
| Low warmth WP | 0.59*** | [0.43,0.74] | 0.57*** | [0.42,0.73] |
| High hostility WP | 1.93*** | [1.76,2.10] | 1.94*** | [1.77,2.10] |
| Low consistency WP | 0.61*** | [0.44,0.78] | 0.60*** | [0.44,0.77] |
| Low warmth BP | 0.02 | [-0.23,0.26] | 0.02 | [-0.22,0.27] |
| High hostility BP | 1.98*** | [1.70,2.25] | 1.67*** | [1.37,1.96] |
| Low consistency BP | 0.60*** | [0.33,0.86] | 0.60*** | [0.33,0.87] |
| Parents' psychological distress (ref. no waves moderate/high) | ||||
| Mother | ||||
| At least one wave moderate/high | 1.31*** | [1.03,1.60] | 1.08*** | [0.77,1.38] |
| Father | ||||
| At least one wave moderate/high | 0.32 | [-0.02,0.66] | 0.32 | [-0.02,0.66] |
| No information | 1.41 | [-0.07,2.89] | 1.40 | [-0.08,2.88] |
| Parents' problematic alcohol use (ref. no waves problematic alcohol use) | ||||
| Mother | ||||
| At least one wave | -0.09 | [-0.36,0.18] | -0.09 | [-0.36,0.19] |
| Father | ||||
| At least one wave | -0.02 | [-0.30,0.26] | -0.02 | [-0.30,0.26] |
| No information | -3.23 | [-7.33,0.87] | -3.24 | [-7.34,0.87] |
| Parents' smoking (ref. no waves smoking) | ||||
| Mother | ||||
| At least one wave smoking | 0.41** | [0.11,0.70] | 0.40** | [0.11,0.70] |
| Father | ||||
| At least one wave smoking | 0.22 | [-0.09,0.54] | 0.22 | [-0.09,0.53] |
| No information | 3.11 | [-1.07,7.28] | 3.10 | [-1.07,7.28] |
| Parents' general health (ref. no waves fair/poor) | ||||
| Mother | ||||
| At least one wave fair/poor | 0.30* | [0.00,0.61] | 0.30* | [0.00,0.61] |
| Father | ||||
| At least one wave fair/poor | 0.29 | [-0.04,0.62] | 0.29 | [-0.04,0.62] |
| No information | -0.67 | [-1.76,0.43] | -0.67 | [-1.76,0.43] |
| Study child characteristics | ||||
| Aboriginal or Torres Strait Islander | 0.12 | [-0.52,0.77] | 0.12 | [-0.52,0.77] |
| Male | 0.73*** | [0.51,0.95] | 0.73*** | [0.51,0.95] |
| Study child general health (ref. Excellent - baseline) | ||||
| Very good | 0.58*** | [0.33,0.83] | 0.58*** | [0.33,0.83] |
| Good | 1.10*** | [0.70,1.49] | 1.10*** | [0.70,1.49] |
| Fair/poor | 1.68*** | [0.86,2.50] | 1.69*** | [0.86,2.51] |
| Study child with special health care needs (baseline) | 1.66*** | [1.33,1.99] | 1.66*** | [1.34,1.99] |
| LOTE (baseline) | -0.26 | [-0.67,0.16] | -0.26 | [-0.68,0.16] |
| Birth order (ref. Oldest - baseline) | ||||
| Middle/twin | -0.27 | [-0.60,0.06] | -0.27 | [-0.60,0.05] |
| Youngest | -0.19 | [-0.47,0.10] | -0.19 | [-0.47,0.10] |
| Only child | 0.52* | [0.11,0.93] | 0.52* | [0.11,0.93] |
| Pregnancy and birth | ||||
| Mother's age at birth | -0.03** | [-0.06,-0.01] | -0.03** | [-0.06,-0.01] |
| Mother separation anxiety (Age 0-1) | -0.07 | [-0.20,0.07] | -0.07 | [-0.20,0.07] |
| Mother mental health problem in pregnancy (ref. Yes) | ||||
| No | -0.50** | [-0.82,-0.19] | -0.51** | [-0.83,-0.19] |
| No information | -0.21 | [-0.66,0.23] | -0.22 | [-0.66,0.23] |
| Household characteristics | ||||
| Area of residence (ref. Major city - baseline) | ||||
| Inner regional | 0.08 | [-0.21,0.37] | 0.08 | [-0.21,0.37] |
| Regional or remote | 0.21 | [-0.16,0.58] | 0.21 | [-0.16,0.59] |
| Neighbourhood advantage (ref. Lowest 25% - baseline) | ||||
| Middle 50% | -0.28 | [-0.56,0.01] | -0.28 | [-0.56,0.01] |
| Highest 25% | -0.38* | [-0.74,-0.01] | -0.38* | [-0.74,-0.01] |
| Lowest 25% of equivalised parental income (any wave) | 0.16 | [-0.09,0.42] | 0.17 | [-0.09,0.42] |
| Parental education (Ref. year 12 or below) | ||||
| Certificate/diploma | -0.18 | [-0.54,0.19] | -0.18 | [-0.54,0.19] |
| Degree | -0.63** | [-1.02,-0.24] | -0.62** | [-1.02,-0.23] |
| Income support (any wave) | 0.64** | [0.24,1.05] | 0.64** | [0.24,1.04] |
| Household member with health condition or disability (any wave) | 0.57*** | [0.27,0.86] | 0.57*** | [0.27,0.86] |
| Single parent age 6-7 (ref. single parent age 4-5) a | -0.12 | [-0.62,0.38] | -0.11 | [-0.61,0.38] |
| Single parent age 8-9 | 0.25 | [-0.28,0.78] | 0.25 | [-0.29,0.78] |
| Single parent age 10-11 | 0.72* | [0.16,1.28] | 0.72* | [0.16,1.28] |
| Single parent age 12-13 | -0.86*** | [-1.35,-0.37] | -0.86*** | [-1.35,-0.37] |
| Constant | 7.15*** | [6.17,8.13] | 7.31*** | [6.33,8.29] |
| Interaction effects | ||||
| High hostility BP * wave | - | - | 0.25*** | [0.16,0.34] |
| Moderate/high psychological distress * wave | - | - | 0.19*** | [0.10,0.29] |
| Random-effects parameters | Estimate | 95% CI | Estimate | 95% CI |
| Time slope | 0.85 | [0.80,0.89] | 0.83 | [0.79,0.88] |
| Intercept | 3.21 | [3.10,3.32] | 3.20 | [3.09,3.31] |
| Correlation intercept*time slope | -0.13 | [-0.19,-0.07] | -0.12 | [-0.18,-0.06] |
| Residual | 2.66 | [2.63,2.70] | 2.66 | [2.36,2.70] |
Notes: * p < 0.05, ** p < 0.01, *** p < 0.001. WP: within person. BP: between person. CI: confidence interval. Time is centred at age 4-5. Ref: reference category. a Single-parent variables control for single-parent households at each age but do not compare children in single-parent families with children in dual-parent families. Temperament was not included in the models as there were over 790 cases missing in each of the scales (irritability, approach and cooperativeness).
Source: LSAC Waves 1-7, B cohort, age 0-1 to 12-13
Scenarios: changing parenting behaviours
Using the models discussed in the previous section, predicted values of total difficulties scores for a number of possible scenarios were estimated to illustrate the level of total difficulties of children living in different circumstances (Figure 4). In the predicted scenarios, we assign different values to parenting behaviours, mothers' mental health and mothers' health behaviours while keeping everything else constant.2 These scenarios were generated for children in vulnerable circumstances (e.g. mother in fair or poor health, income support as main source of income, household member with a disability, low parental education - upper panel in Figure 4) as well as for less vulnerable children (mother in good health, no income support, no household member with a disability, high parental education - lower panel in Figure 4). Given that the predicted scenarios are the same for both groups of children, the difference in total difficulties scores across scenarios, as explained below, is constant across both groups. The assumptions for each predicted scenario were as follows (also represented in Table 17 below):
- Baseline: all variables not included in the definition of vulnerability were set to the mean.
- Scenario 1: 'optimal' parenting at all ages (high warmth, low hostility, high consistency), 'positive' mothers' mental health and health behaviours (all ages between 4-5 and 12-13).
- Scenario 2: 'optimal' parenting at all ages (high warmth, low hostility, high consistency), 'poor' mothers' mental health and health behaviours (at least once between age 4-5 and 12-13).
- Scenario 3: 'less optimal' parenting at all ages (low warmth, high hostility, low consistency), 'positive' mothers' mental health and health behaviours (all ages between 4-5 and 12-13).
- Scenario 4: 'less optimal' parenting at all ages (low warmth, high hostility, low consistency), 'poor' mothers' mental health and health behaviours (at least once between age 4-5 and 12-13).
| Scenario | 'Optimal' parenting behaviours (all ages) | Positive mental health/health behaviours (all ages) |
|---|---|---|
| 1 | Yes | Yes |
| 2 | Yes | No |
| 3 | No | Yes |
| 4 | No | No |
The baseline scenario for each group shows the predicted total difficulties scores for the 'average child' living in vulnerable circumstances and less vulnerable circumstances as defined above. In this scenario, children had total difficulties scores of nearly 11 and 7 points respectively for those in vulnerable and less vulnerable circumstances, and scores decreased slightly with age.
Scenario 1 illustrates the total difficulties scores for children with high maternal warmth (all ages), low hostility (all ages), high consistency (all ages), as well as good maternal mental health and health behaviours. This scenario provided the lowest total difficulties scores for both groups of children, with a score of 9 and 5 at age 4-5 and 8 and 4 at age 12-13 respectively for children in vulnerable and less vulnerable circumstances. In Scenario 2, 'optimal' parenting was maintained (i.e. high maternal warmth at all ages, low hostility at all ages and high consistency at all ages), but moderate or high maternal psychological distress, mothers' problematic alcohol use and smoking (at least once) were assumed. In this scenario, the total difficulties scores were around 1 point higher than in Scenario 1 (0.3 standard deviations). Children in vulnerable circumstances started with a total difficulties score of 10 at age 4-5 and showed a very slight decrease over time. Similarly, children in less vulnerable circumstances had a mean value of 7 at age 4-5 and had a score of 6 by age 12-13.
Scenario 3 assumed low psychological distress, as well as no problematic alcohol use and no smoking - similar to Scenario 1 - but with 'less optimal' parenting (low maternal warmth, high hostility and low consistency) at all ages. A much larger gap in total difficulties scores at age 4-5 was observed between this scenario and the two scenarios previously discussed (Scenario 1 and Scenario 2). At age 4-5, the predicted total difficulties score for Scenario 3 was over 14 for children in vulnerable circumstances and nearly 11 for those in less vulnerable circumstances; a difference of over 5 points (or 1.1 standard deviations) compared with Scenario 1 ('optimal' parenting and 'good' health and health behaviours) and a difference of 4 points (or 0.85 standard deviations) compared with Scenario 2 ('optimal' parenting and 'poor' health and health behaviours). So far, all predicted values were within the average range of total difficulties score (0-12 for age 4-5 and 0-13 from age 6-7 onwards).
In Scenario 4, we assumed low maternal warmth (all ages), high hostility (all ages), low consistency (all ages), as well as mothers' moderate or high psychological distress, problematic alcohol use and smoking (at least once). The predicted total difficulties scores at age 4-5 in Scenario 4 were within the elevated range for children in vulnerable circumstances (around 16) and close to the elevated range (over 12) for children in less vulnerable circumstances. The difference between total difficulties scores in Scenario 4 and Scenario 1 was large: at age 4-5, children in Scenario 4 had total difficulties scores nearly 7 points higher than those in Scenario 1 (or 1.5 standard deviations), illustrating the significant impact that parenting behaviours and parents' mental health and health behaviours have on children's social-emotional wellbeing.
Furthermore, given the significant interaction effect between maternal hostility and psychological distress and time, the gap in total difficulties increased as children got older. By age 12-13, the difference in total difficulties between children who experienced 'less optimal' parenting, and poor maternal mental health and health behaviours and those who did not, increased to over 8 points (or 1.8 standard deviations). These scenarios show that, while for children who experience positive parenting and whose mothers have low levels of psychological distress total difficulties scores on average decrease over time, these scores remain stable and even increase when children are exposed to less optimal conditions, such as less positive parenting behaviours and poor maternal mental health.
It is important to note that, in all scenarios and at any given age, there was a difference of over 3 points (or 0.77 standard deviations) between children living in vulnerable circumstances and those living in less vulnerable circumstances. This difference becomes even more important when looking at children experiencing 'less optimal' parenting as well as poor maternal mental health and health behaviours. Among this group, the predicted values fall within the elevated range, where total difficulties may reflect clinically significant problems.
The scenarios presented in Figure 4 are a useful way to understand the magnitude of the potential impact of different variables on children's total difficulties. They illustrated the difference in total difficulties scores if mothers showed different parenting behaviours, mental health and health behaviours, while holding everything else constant at defined values. However, these scenarios are fictional and do not represent the reality of most children. For example, given the definition of 'less optimal' parenting for each scale - warmth, hostility and consistency - around 60% of children in the LSAC sample did not experience 'less optimal' parenting on any of these scales during the observation period. Similarly, the majority of children were not exposed to poor maternal mental health - as defined by the K6 scale - between the ages of 4-5 and 12-13. In addition, the predictions above assume that, besides the variables modified in each scenario, the average children who experience high or low hostility, for example, are otherwise the same.
Figure 4: Predicted adjusted means total difficulties scores for different scenarios (upper panel children in vulnerable families; lower panel other children)

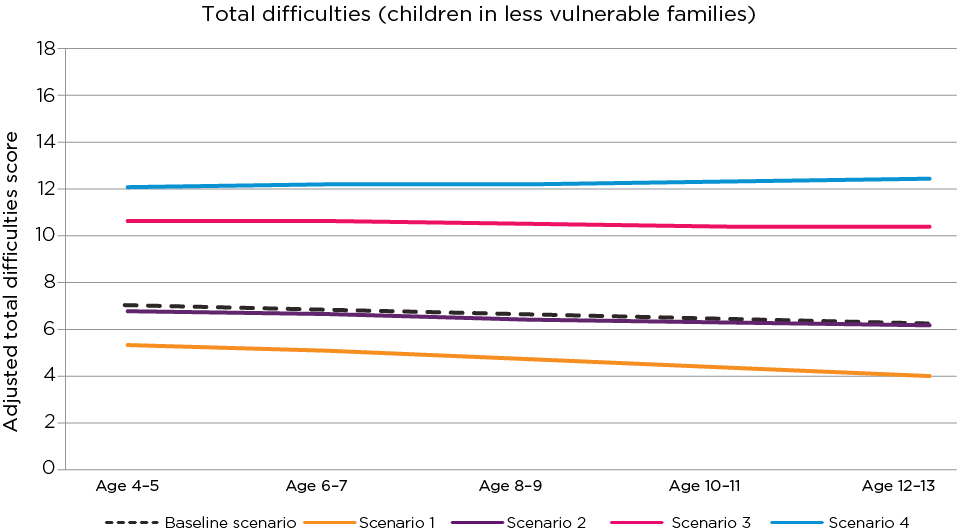
Notes: Scenario 1: high warmth (all ages), low hostility (all ages), high consistency (all ages), mother low psychological distress, no problematic alcohol use and no smoking (at least once). Scenario 2: high warmth (all ages), low hostility (all ages), high consistency (all ages), mother moderate/high psychological distress, problematic alcohol use and smoking (at least once). Scenario 3: low warmth (all ages), high hostility (all ages), low consistency (all ages), mother low psychological distress, no problematic alcohol use and no smoking (at least once). Scenario 4: low warmth (all ages), high hostility (all ages), low consistency (all ages), mother moderate/high psychological distress, problematic alcohol use and smoking (at least once). Baseline scenario: parenting, parents' mental health and health behaviours set to mean.
Upper figure assumes children were exposed to the following risk factors on at least one occasion: mother in fair or poor health, income support as main source of income, person with a disability in the household, parental education Year 12 or lower, child in 'very good' health, mother had mental health problems in pregnancy, living in disadvantaged neighbourhood (bottom 25%). Lower figure assumes children not exposed to risk factors above, as well as parental education university degree, child in 'excellent' health, living in advantaged neighbourhood (top 25%). Other variables not defined in the scenarios above were set to their mean.
Source: LSAC Waves 1-7, B cohort, age 0-1 to 12-13. Predicted values using model with interactions in Table 16
Figure 5, in contrast, presents the predicted total difficulties scores for children experiencing different levels of maternal hostility, without holding other variables constant. This figure illustrates what the total difficulties score would look like for a child who experienced, for example, high maternal hostility at age 4-5, followed by low levels of hostility at older ages, without changing the values of any other variables. Figure 5 shows that children's predicted total difficulties were lowest among those who did not experience high maternal hostility between the ages of 4-5 and 12-13, and their score decreased over time (Line 1).
Line 2 (high hostility at 4-5 years old) shows the average total difficulties score for children who experienced high maternal hostility at age 4-5 but low hostility at other ages. There is a drop in total difficulties scores between the ages of 4-5 and 6-7 of over 2 points (or 0.46 standard deviations). However, this line also shows that, even when maternal hostility changed from high to low at an early age, these children's total difficulties scores were still, on average, higher than that of children who experienced low hostility at every age (Line 1) and did not decrease over time.
Line 3 (high hostility up to 8-9 years old) shows predicted average total difficulties scores for children who experienced high maternal hostility up to age 8-9, and low hostility at ages 10-11 and 12-13. These children had a constant average score of 12 while experiencing high hostility, and a score of 10 when experiencing low hostility; a drop of 2 points or 0.43 standard deviations.
Comparing Line 3 (low hostility from age 10-11) with Line 2 (low hostility from age 6-7) indicates that total difficulties scores at age 12-13 are similar for these two groups, with less than one point difference (or 0.21 standard deviations). However, Line 3 is further away from the 'ideal' scenario where children do not experience high hostility between the ages of 4-5 and 12-13: their total difficulties score at age 12-13 is nearly one standard deviation higher than for those with low hostility at all ages. At the same time, both Line 3 and Line 2 depart from the trajectory that children would follow if no reduction in maternal hostility occurred (Line 4).
Line 4 illustrates predicted average difficulties scores for children who experienced high maternal hostility at every age. These scores started from a higher level of total difficulties at age 4-5 compared with other children (just below 13) and their score did not decrease over time. This line shows the expected trajectory of total difficulties scores if no change in maternal hostility was implemented. At age 12-13, the predicted average score for these children was 7 points higher (or 1.5 standard deviations) than the predicted average score for children who experienced low hostility at every age.
This figure indicates that, given other characteristics associated with children's total difficulties scores, even if parenting behaviours improved, the level of total difficulties would still not be as low as for those who experienced optimal parenting at every age, for example.
Figure 5: Mean trajectories of total difficulties scores by maternal hostility
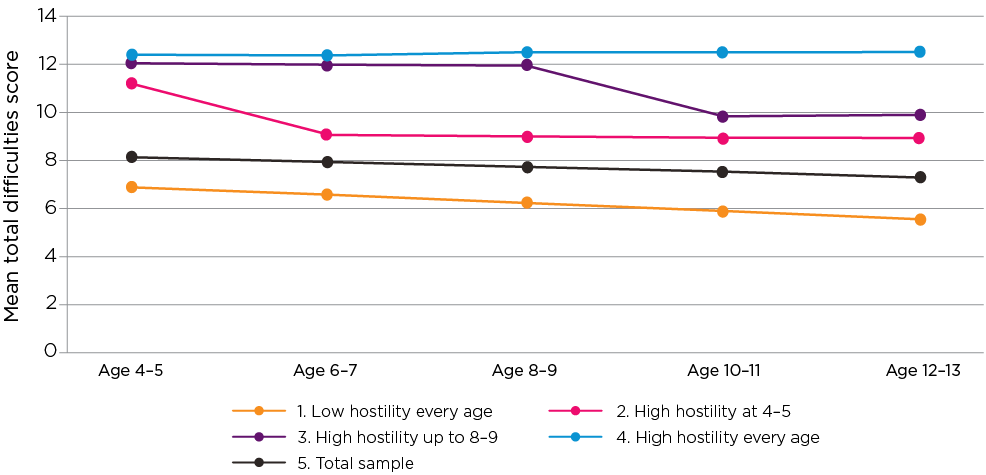
Source: LSAC Waves 1-7, B cohort, age 0-1 to 12-13. Predicted values using model with interactions in Table 16
This section has shown the significant effect of parenting behaviours, mothers' mental health and health behaviours on children's social-emotional wellbeing, as measured by the total difficulties score from the SDQ. Even though these effects are significant and of moderate magnitude, it is important to keep in mind that, by definition, over 60% of the sample experienced positive parenting.
2 Variables set at the mean value unless otherwise stated. In the case of categorical variables, say that 30% are in category 1, 20% in category 2 and 50% in category 3, the 'average' would incorporate the coefficients for each category, weighted by the 30%, 20% and 50% values. Fathers' mental health and health behaviours were set at the mean due to the large proportion with no information (and the lack of significant associations in the model).
Discussion and implications
This paper examined children's social-emotional adjustment using LSAC data, with a particular focus on mothers' parenting behaviours, parents' mental health and parents' health behaviours. The SDQ was used to measure social-emotional outcomes, including emotional symptoms, hyperactivity, conduct problems, peer problems, total difficulties (the sum of the previous four scales) and prosocial behaviours. Bivariate descriptive analyses were presented, as well as mixed effects models for total difficulties.
The parenting behaviours examined included maternal warmth, maternal hostility and maternal consistency. The results indicate that around 60% of children experienced 'optimal' parenting (high warmth, low hostility or high consistency) between the ages of 4-5 and 12-13. Around 18% of children experienced one episode of 'less optimal' parenting between the ages of 4-5 and 12-13 (18% experienced low warmth once, 17% experienced high hostility once, and 18% experienced low consistency once), while 20% of children (and one in four for maternal warmth) experienced 'less optimal' parenting (either low warmth, high hostility or low consistency) on two or more occasions during the study period. Results consistently showed that children who experienced 'less optimal' parenting on any of the scales examined were more likely to be classified as having elevated difficulties, according to the cut-off points of the SDQ, at each age. This was found for every outcome examined and for the three parenting behaviours, although parenting behaviours had the largest impact on conduct problems, particularly maternal hostility.
In terms of parents' mental health and health behaviours, 15% of mothers experienced moderate or high levels of psychological distress on at least one occasion over the eight years of the study, and 13% on two or more occasions.3 Similar proportions of children were exposed to mothers' smoking (13% once and 12% on two or more occasions) and problematic use of alcohol (11% once and 15% on two or more occasions) over the study period.4 The association between mother's mental health and social-emotional outcomes was consistent: a higher proportion of children whose mothers experienced moderate or high levels of psychological distress were classified as having elevated difficulties (or low prosociality) at every age. The largest difference in the proportion of children at risk of mental health problems, by maternal psychological distress, was for emotional symptoms, followed by conduct problems and peer problems. With the exception of emotional symptoms and prosocial behaviours, mothers' smoking was also negatively associated with children's social-emotional outcomes.
Results for fathers were less clear, mainly due to the large proportion of resident fathers who did not participate in the study. However, there was a general pattern of a lower proportion of children with an elevated risk of difficulties among those whose fathers had good mental health, had no problematic use of alcohol and did not smoke.
The descriptive analysis discussed above did not control for the effect of other variables. For example, certain health conditions are more common among certain groups in the population, which can also be associated with children's social-emotional outcomes. In addition, the descriptive analysis was cross-sectional. That is, each association was examined separately at each time point. These aspects were addressed in the multivariable analysis. This analysis confirmed that, after controlling for a range of relevant socio-demographic characteristics of the child and the parents, parenting behaviours had a significant influence on children's total difficulties score.
Two types of effects were identified. First, children who experienced high maternal hostility or low maternal consistency at any time between the ages of 4-5 and 12-13 had higher total difficulties scores on average, compared with those who did not experience these parenting behaviours during the observation period. Second, children had higher total difficulties scores at times when they experienced less optimal parenting (low warmth, high hostility or low consistency), compared with times when the same child did no experience less optimal parenting, with the largest effect observed for maternal hostility. These two effects imply that it is best for children's social-emotional wellbeing not to be exposed to high parental hostility or low consistency during childhood, but if they are, changing parenting behaviours has a positive effect. The significant interaction between maternal hostility and time means that the difference in total difficulties scores between children experiencing low and high hostility increased over time.
The mental health and health behaviours of mothers had a significant effect on children's social-emotional adjustment. Children whose mothers experienced moderate or high psychological distress on at least one measurement occasion had higher total difficulties scores, and this difference increased as children got older. Furthermore, children whose mothers experienced mental health problems during pregnancy also had higher total difficulties scores on average compared with those whose mothers did not experience mental health problems in pregnancy. This finding highlights the importance of early experiences. Even after controlling for psychological distress across waves, the early experience of mental health problems in pregnancy still showed an independent and significant effect on children's total difficulties, although small.
In line with previous research, socio-economic characteristics were significantly associated with children's social-emotional adjustment over and above parents' mental health, health behaviours and parenting. As has been previously established in the literature, reducing disadvantage in childhood is likely to have a positive impact on children's mental health and development (McLoyd, 1998; Warren, 2017). Similarly, the presence of a household member with a disability at any time between the ages of 4-5 and 12-13 had a negative impact on children's social-emotional adjustment. The present study also showed that children with poorer general health and special health care needs also had higher total difficulties scores.
The findings discussed in this paper suggest that the early experiences of mothers' mental health, including during pregnancy, have a significant and long-lasting effect on children's social-emotional outcomes. It is noteworthy that mothers' mental health during pregnancy has an impact on children's difficulties at age 4-5, over and above the effect of maternal mental health in childhood and after controlling for several other relevant factors. Previous research has also shown that prenatal stress has a direct effect on children's internalising problems at age 5, and an indirect effect on externalising difficulties via child negative affect and increased maternal hostility in infancy (Hentges et al., 2019). The potential negative effect of mothers' psychological distress on children's mental health is probably attenuated in the current analysis, as the measure used refers to whether the mother experienced moderate or high distress at least once during the study period. This effect is likely to be even larger when examined concurrently with children's total difficulties at each time point (O'Connor et al., forthcoming).
Policy and practice implications
Early detection of risk factors that are detrimental for mothers' and children's mental health can be difficult in practice. For example, children with difficult emotions or behaviours may not have these behaviours identified as problematic until the child starts school. In a recent national survey of children's and young people's mental health in Australia, 40% of parents or caregivers of children who needed help for emotional or behavioural problems were advised by a school staff member to seek help for their child's difficulties (Lawrence et al., 2015). These children would be starting their school years at a significant disadvantage, as mental health difficulties affect learning and the development of positive social relations in school (Lawrence et al., 2015; Sawyer et al., 2001).
Engagement with health professionals is a key opportunity to identify both mothers and children who are experiencing poor mental health. Recent research using LSAC and Medicare linked data found that children have contact with GPs more than with any other service (Quinn, Warren, & Daraganova, forthcoming). There is an opportunity for GPs to identify mental health concerns when children present for other reasons. The present study showed that children with poorer general health and special health care needs also had higher total difficulties scores. This aligns with recent research that found that children with elevated difficulties according to the SDQ, particularly those with raised emotional symptoms, were more likely to have contact with most health services (Quinn et al., forthcoming). For the children experiencing multiple health concerns, who may have higher contact with health and other services, these services play an important role in the identification of mental health difficulties.
However, even where mental health difficulties are identified, many children are not accessing the services they need. Recent Australian research showed that 49% of children aged 4-11 who had a mental disorder used services directed to address behavioural or emotional problems in the previous 12 months (Lawrence et al., 2015). In Australia, only 11.6% of children aged 6-17 with mental health disorders had enough contact with the health system to achieve minimal adequate treatment during the 18 months after being identified as having the mental disorder (Sawyer, Reece, Sawyer, Hiscock, & Lawrence, 2019). There is also a need for more and better-quality services for children.
Health professionals and other service providers also have an important role to play in supporting parents to achieve and maintain good mental health, and to implement warm and consistent parenting practices, especially during difficult circumstances. Results from the present analysis indicate that when parents are able to increase the frequency of supportive parenting behaviours, such as an increase in the frequency of warm and consistent parenting, while reducing the frequency of hostile parenting behaviours, this leads to better social-emotional outcomes, even when parents may be facing other challenges that can negatively affect children's outcomes. This suggests that there is an opportunity to support parents through their contact with health or other services, particularly when they are faced with adversity.
To support parents in both their own wellbeing and in their parenting, health professionals and other service providers need to be able to both identify when parents and children are at risk of poor mental health and be equipped to provide appropriate referrals and/or supports. This means individual practitioners need the knowledge to do this and the systems they work in need to be both prevention and early intervention focused and to work in integrated ways.
Limitations
A limitation of longitudinal studies is that not all participants who were recruited at the first interview (Wave 1) continue to participate in the study over time (i.e. sample attrition). A number of socio-demographic characteristics are associated with non-response in LSAC (Bandara et al., forthcoming). This means that some families are under-represented in the present analysis.
Another limitation of the present study is that we only include mothers' parenting behaviours, as there was a large proportion of missing data for fathers. Although research has consistently shown an association of mothers' parenting behaviours with children's outcomes, fathers' parenting behaviours also play a significant role (Giallo, Cooklin, Wade, D'Esposito, & Nicholson, 2014b). Efforts directed to obtain better data from fathers are necessary to obtain a full picture of children's relationships with both mothers and fathers, and both parents' role in children's healthy development.
In addition, all the measures included in the present study were self-reported. That is, no clinical measures of children's social-emotional adjustment or parents' mental health were used. The frequency of parenting behaviours was also self-reported, and no observations of parent-child interactions were available.
Finally, even though this study used longitudinal methods of data analysis to take into account individual heterogeneity and change over time, the findings presented here show associations and do not necessarily identify causal effects.
References
- Australian Institute of Health and Welfare (AIHW). (2014). Australia's Health 2014. Canberra: AIHW.
- AIHW. (2016). Australian Burden of Disease Study: impact and causes of illness and death in Australia 2011. Canberra: AIHW.
- Australian Mental Health Outcomes and Classification Network (AMHOCN). (2005). Strengths and Difficulties Questionnaire: Training manual. Parramatta, NSW: Australian Mental Health Outcomes and Classification Network.
- Bandara, D., Gasser, C., Jessup K., Renda J., Warren D., & Daraganova G. (forthcoming). Factors associated with non-response in Growing Up in Australia: The Longitudinal Study of Australian Children (LSAC technical paper no. 23). Melbourne: AIFS.
- Bayer, J., Ukoumunne, O., Lucas, N., Wake, M., Scalzo, K., & Nicholson, J. (2011). Risk factors for childhood mental health symptoms: national longitudinal study of Australian children. Pediatrics, 128(4), e865-e879.
- Brooks-Gunn, J. & Duncan, G. J. (1997). The effects of poverty on children. The Future of Children, 7(2), 55-71.
- Bush, K., Kivlahan, D. R., McDonell, M. B., Fihn, S. D., & Bradley, K. A. et al. (1998). The AUDIT Alcohol Consumption Questions (AUDIT-C): An effective brief screening test for problem drinking. Archives of Internal Medicine, 158(16), 1789-1795.
- Christensen, D., Fahey, M. T., Giallo, R., & Hancock, K. J. (2017). Longitudinal trajectories of mental health in Australian children aged 4-5 to 14-15 years. PLoS ONE, 12(11). Retrieved from search.ebscohost.com/login.aspx?direct=true&db=psyh&AN=2018-15454-001&site=ehost-live
- Conners-Burrow, N. A., McKelvey, L., Pemberton, J. R., Lagory, J., Mesman, G. R., & Whiteside-Mansell, L. (2013). Moderators of the relationship between maternal substance abuse symptoms and preschool children's behavioral outcomes. Journal of Child and Family Studies, 22(8), 1120-1129. Retrieved from search.ebscohost.com/login.aspx?direct=true&db=edsbl&AN=RN340249609&site=eds-live
- Curran, P. J., & Bauer, D. J. (2011). The disaggregation of within-person and between-person effects in longitudinal models of change. Annual Review of Psychology, 62(1), 583-619.
- Duncan, G. J., & Brooks-Gunn, J. (2000). Family poverty, welfare reform, and child development. Child Development, 71(1), 188-196.
- Duncan, G. J., Brooks-Gunn, J., & Klebanov, P. K. (1994). Economic deprivation and early childhood development. Child Development, 65(2), 296-318.
- Giallo, R., Cooklin, A., Brown, S. Christensen, D., Kingston, D., Liu, C. et al. (2015). Trajectories of fathers' psychological distress across the early parenting period: Implications for parenting. Journal of Family Psychology, 29, 766-776. doi/10.1037/fam0000109
- Giallo, R., Cooklin, A., Wade, C., D'Esposito, F., & Nicholson, J. M. (2014a). Maternal postnatal mental health and later emotional-behavioural development of children: The mediating role of parenting. Child: Care, Health & Development, 40(3), 327-336. doi: 10.1111/cch.12028
- Giallo, R., Cooklin, A., Wade, C., D'Esposito, F., & Nicholson, J. M. (2014b). Fathers' postnatal mental health and child well-being at age five: The mediating role of parenting behavior. Journal of Family Issues, 35(11), 1543-1562. doi: 10.1177/0192513X13477411
- Goodman, R. (2001). Psychometric properties of the strengths and difficulties questionnaire. Journal of the American Academy of Child & Adolescent Psychiatry, 40(11), 1337-1345.
- Gray, M., & Smart, D. (2009). Growing Up in Australia: The Longitudinal Study of Australian Children: A valuable new data source for economists. Australian Economic Review, 42(3), 367-376.
- Gunlicks, M. L., & Weissman, M. M. (2008). Change in child psychopathology with improvement in parental depression: a systematic review. Journal of the American Academy of Child & Adolescent Psychiatry, 47(4): 379-389.
- Hawes, D. J., & Dadds, M. R. (2004). Australian data and psychometric properties of the Strengths and Difficulties Questionnaire. Australian and New Zealand Journal of Psychiatry, 38(8): 644-651.
- Hentges, R. F., Graham, S. A., Plamondon, A., Tough, S., & Madigan, S. (2019). A developmental cascade from prenatal stress to child internalizing and externalizing problems. Journal of Paediatric Psychology. Retrieved from doi.org/10.1093/jpepsy/jsz044
- Hilton, F. M., Whiteford, H. A., Sheridan, J. S., Cleary, C. M., Chant, D. C., Want, P. S., & Kessler, R. C. (2008). The prevalence of psychological distress in employees and associated occupational risk factors. Journal of Occupational and Environmental Medicine, 50(7), 746-757.
- Homel, J., & Warren, D. (2019). The relationship between parent drinking and adolescent drinking: Differences for mothers and fathers and boys and girls. Substance Use & Misuse, 54(4), 661-669.
- Jacob, T., & Johnson, S. (1997). Parent-child interaction among depressed fathers and mothers: Impact on child functioning. Journal of Family Psychology, 11(4), 391-409.
- Kessler, R. C., Barker, P. R., Colpe, L. J., Epstein, J. F., Gfroerer, J. C., Hiripi, E. et al. (2003). Screening for serious mental illness in the general population. Archives of General Psychiatry, 60(2), 184-189.
- Kessler, R. C., Amminger, P. G, Aguilar-Gaxiola, S., Alonso, J., Lee, S., & Ustün, T. B. (2007). Age of onset of mental disorders: A review of recent literature. Current Opinion in Psychiatry, 20(4), 359-364.
- Kiernan, K. E., & Huerta, M. C. (2008). Economic deprivation, maternal depression, parenting and children's cognitive and emotional development in early childhood. The British Journal of Sociology, 59(4). doi: 10.1111/j.1468-4446.2008.00219.x
- Kingston, D., Tough, S., & Whitfield, H. (2012). Prenatal and postpartum maternal psychological distress and infant development: A systematic review. Child Psychiatry and Human Development, 43(5), 683-714.
- Lawrence, D., Johnson, S., Hafekost, J., Boterhoven De Haan, K., Sawyer, M. et al. (2015). The Mental Health of Children and Adolescents. Report on the second Australian Child and Adolescent Survey of Mental Health and Wellbeing. Canberra: Department of Health.
- Low, S. M. & Stocker, C. (2005). Family functioning and children's adjustment: Associations among parents' depressed mood, marital hostility, parent-child hostility, and children's adjustment. Journal of Family Psychology, 19(3), 394-403.
- Lucas, N., Nicholson, J. M., & Maguire, B. (2011). Parenting practices and behaviours. In Australian Institute of Family Studies (Ed.) Growing Up in Australia: The Longitudinal Study of Australian Children Annual Statistical Report 2010. Melbourne: AIFS.
- McLoyd, V. C. (1998). Socioeconomic disadvantage and child development. American Psychologist, 53(2), 185.
- Mesman, J., & Koot, H. M. (2001). Early preschool predictors of preadolescent internalizing and externalizing DSM-IV diagnoses. Journal of the American Academy of Child & Adolescent Psychiatry, 40(9), 1029-1036.
- Mundy, L. K., Canterford, L., Tucker, D., Bayer, J., Romaniuk, H., Sawyer, et al. (2017). Academic performance in primary school children with common emotional and behavioral problems. Journal of School Health, 87, 593-601.
- O'Connor, M., Romaniuk, H., Gray, S., & Daraganova, G. (forthcoming). Internalising difficulties: Identifying factors associated with continuity from childhood into adolescence. Research Report. Melbourne: Australian Institute of Family Studies.
- Quinn, B., Warren, D., & Daraganova, G. (forthcoming). Use of health services among children at risk of social-emotional problems: Opportunities for early intervention. Research Report. Melbourne: Australian Institute of Family Studies.
- Rabe-Hesketh, S., & Skrondal, A. (2012). Multilevel and longitudinal modelling using Stata. (3rd Ed., Vol 1). College Station, TX: Stata Press.
- Sanders, M. R. Kirby, J. N., Tellegen, C. L., & Day, J. J. (2014). The Triple P-Positive Parenting Program: A systematic review and meta-analysis of a multi-level system of parenting support. Clinical Psychology Review, 34(4), 337-357.
- Sawyer, M. G., Arney, F. M., Baghurst, P. A., Clark, J. J., Graetz, B. W., Kosky, R. J., et al. (2001). The mental health of young people in Australia: key findings from the child and adolescent component of the national survey of mental health and well-being. Australian and New Zealand Journal of Psychiatry, 35(6):806-814.
- Sawyer, M. G., Reece, C. E., Sawyer, A. C., Hiscock, H., & Lawrence, D. (2019). Adequacy of treatment for child and adolescent mental disorders in Australia: A national study. Australian and New Zealand Journal of Psychiatry, 53(4), 326-335. doi: 10.1177/0004867418808895
- Singer, J., & Willet, J. (2003). Applied longitudinal data analysis: Modelling change and event occurrence. Oxford University Press.
- Stone, L. L., Otten, R., Engels, R. C. M. E., Vermulst, A. A., & Janssens, J. M. A. M. (2010). Psychometric properties of the parent and teacher versions of the Strengths and Difficulties Questionnaire for 4- to 12-year-olds: A review. Clinical Child and Family Psychology Review, 13(3), 254-274.
- Sutin, A. R., Flynn, H. A., & Terracciano, A. (2017). Maternal cigarette smoking during pregnancy and the trajectory of externalizing and internalizing symptoms across childhood: Similarities and differences across parent, teacher, and self reports. Journal of Psychiatric Research, 91, 145-148. doi: 10.1016/j.jpsychires.2017.03.003
- Teti, D. M., Cole, P. M., Cabrera, N., Goodman, S. H., McLoyd, V. C., & Society for Research in Child Development. (2017). Supporting parents: How six decades of parenting research can inform policy and best practice. Social Policy Report, 30(5). Washington, D. C.: Society for Research in Child Development. Retrieved from search.ebscohost.com/login.aspx?direct=true&db=eric&AN=ED581662&site=eds-live
- Usback, S. (2018). The Longitudinal Study of Australian Children: Wave 7 Weighting and Non-Response (LSAC technical paper no. 20). Melbourne: AIFS.
- Vassallo, S., Warren, D., Daraganova, G., Gasser, C., O'Connor, & Hoang, C. (forthcoming). Childhood conduct problems and adolescent delinquency: Prevalence, continuity and risk factors. Research Report. Melbourne: AIFS.
- Warren, D. (2017). Low-income and poverty dynamics: Implications for child outcomes. Canberra: Commonwealth of Australia, Department of Social Services.
- Warren, D. (2018). Children's use of Health Care Services. In Australian Institute of Family Studies (Ed.) Growing Up in Australia: The Longitudinal Study of Australian Children Annual Statistical Report 2017. Melbourne: Australian Institute of Family Studies.
- Xue, Y., Leventhal, T., Brooks-Gunn, J., & Earls, F. (2005). Neighborhood residence and mental health problems of 5- to 11-year-olds. Archives of General Psychiatry, 62(5), 554-563.
- Zubrick, S. R., Lucas, N., Westrupp, E. M., & Nicholson, J. M. (2014). Parenting measures in the Longitudinal Study of Australian Children: construct validity and measurement quality, Waves 1 to 4. (LSAC technical paper no. 12). Melbourne: AIFS.
Appendix: Supplementary tables
| Scale | Item (different wording at age 4-5) | Other differences in items across ages | Range for slightly raised and high difficulties (range at age 4-5 if different) |
|---|---|---|---|
| Conduct problems | Often loses temper (Often has temper tantrums or hot tempers) | 3 and 4-10 (4 and 5-10) | |
| Generally well behaved, usually does what adults request (Generally obedient, usually does what adults request) | |||
| Often fights with other children or bullies them | 'children' replaced by 'youth' at age 12-13 | ||
| Often lies or cheats (Often argumentative with adults) | |||
| Steals from home, school or elsewhere (Can be spiteful to others) | |||
| Emotional problems | Often complains of headaches, stomach aches or sickness | 4 and 5-10 (3 and 4-10) | |
| Many worries, often seems worried | |||
| Often unhappy, depressed or tearful (Often unhappy, down-hearted or tearful) | |||
| Nervous or clingy in new situations, easily loses confidence | 'Nervous in new situations, easily loses confidence' at age 12-13 | ||
| Many fears, easily scared | |||
| Hyperactivity | Restless, overactive, cannot stay still for long | 6 and 7-10 | |
| Constantly fidgeting or squirming | |||
| Easily distracted, concentration wanders | |||
| Thinks things out before acting (Can stop and think things out before acting) | |||
| Good attention span, see chores or homework through to the end (Sees tasks through to the end, good attention span) | 'Good attention span, sees work through to the end' at age 8-9, 10-11 and 12-13 | ||
| Peer problems | Rather solitary, tends to play alone | 'Rather solitary, prefers to play alone' at age 8-9 and 'Would rather be alone than with other youth' at age 12-13 | 3 and 4-10 |
| Has at least one good friend | |||
| Generally liked by other children | 'children' replaced by 'young people' at age 12-13 | ||
| Picked on or bullied by other children | 'children' replaced by 'young people' at age 12-13 | ||
| Gets on better with adults than with other children | 'children' replaced by 'young people' at age 12-13 | ||
| Total difficulties score | Sum of scores for each of the problem subscales | 14-16 and 17+ (13-15 and 16+) | |
| Prosocial behaviours | Considerate of other people's feelings | Slightly low and low: 5 and 4-0 (6 and 5-0) | |
| Shares readily with other children (treats, toys, pencils, etc.) | 'children' replaced by 'youth' at age 12-13 | ||
| Helpful if someone is hurt, upset or feeling ill | |||
| Kind to younger children | |||
| Often volunteers to help others (parents, teachers, other children) |
| Parenting behaviour | Items | Response options |
|---|---|---|
| Warmth | How often do you hug or hold this child for no particular reason? | 1 Never/Almost never 2 Rarely 3 Sometimes 4 Often 5 Always/Almost always |
| How often do you tell this child how happy he/she makes you? | ||
| How often do you have warm, close times together with this child? | ||
| How often do you enjoy listening to this child and doing things with him/her? | ||
| How often do you feel close to this child both when he/she is happy and when he/she is upset? | ||
| How often do you express affection by hugging, kissing and holding this child? | ||
| Hostility | Of all the times you talk to this child about his/her behaviour, how often is this disapproval? | 1 Never/Almost never 2 Less than half the time 3 About half the time 4 More than half the time 5 All the time |
| How often are you angry when you punish this child? | ||
| How often do you feel you are having problems managing this child in general? | ||
| How often do you tell this child that he/she is bad or not as good as others? | ||
| Consistency | If you tell this child he/she will get punished if he/she doesn't stop doing something, and he/she keeps doing it, how often will you punish him/her? (reverse coded) | 1 Never/Almost never 2 Less than half the time 3 About half the time 4 More than half the time 5 All the time |
| How often does this child get away with things that you feel should have been punished? | ||
| How often is this child able to get out of punishment when he/she really sets his/her mind to it? | ||
| When you discipline this child, how often does he/she ignore the punishment? | ||
| How often do you think that the level of punishment you give this child depends on your mood? |
| Variable | Description | Time of measurement |
|---|---|---|
| Child demographic characteristics | ||
| Study child sex | Age 0-1 | |
| Indigenous status | Binary variable indicating whether the study child was identified as being of Aboriginal or Torres Strait Islander origin by the responding parent | Age 0-1 |
| Child early experiences | ||
| Maternal separation anxiety | Mean score of 5 items of the maternal separation anxiety scale, completed when the child was aged 0-1. Items included 'I worry when someone else cares for child' and 'I am naturally better at keeping child safe than any other person'. | Age 0-1 |
| Mental health problems in pregnancy | Categorical variable indicating mother's report of having experienced mental health problems in pregnancy. Due to missing data, a third category 'no information' was included in the analysis. | Age 0-1 |
| Mother's age at birth | Continuous variable for mother's age at birth, ranging from 14 to 64 (mean 31). Derived as the difference between the mother's date of birth and the child's date of birth (note that this includes non-biological mothers). | Age 0-1 |
| Child and family socio-demographic characteristics at the beginning of the study period | ||
| Child general health | Child's general health status reported by the primary carer at age 4-5. Five response options were provided, including 'excellent', 'very good', 'good', 'fair', and 'poor'. The last two categories were grouped due to low frequency. | Baseline (age 4-5) |
| Special health care needs | Binary variable indicating whether the primary carer reported that the study child had special health care needs at age 4-5 (child has a condition which has lasted or is expected to last for at least 12 months, which causes them to use medicine prescribed by a doctor, other than vitamins, or more medical care, mental health or educational services) | Baseline (age 4-5) |
| LOTE | Binary variable indicating whether the study child was regularly spoken to in a LOTE (reported by primary carer) | Baseline (age 4-5) |
| Birth order | Categorical variable indicating whether the study child was: the youngest child, middle or twin child, the oldest child or the only child in the family | Baseline (age 4-5) |
| Parental education | Categorical variable indicating parents' highest level of education (either parent) including 'year 12 or lower', 'certificate or diploma', or 'university degree' when the child was aged 4-5 | Baseline (age 4-5) |
| Area of residence | Categorical variable indicating whether the child resided in a major city, inner regional or regional/remote area at age 4-5 | Baseline (age 4-5) |
| Neighbourhood socio-economic advantage | Measured using the Socio-Economic Indexes for Areas (SEIFA) Index of Relative Socio-economic Advantage and Disadvantage for children's home neighbourhood. Classified into population-weighted quartiles. The middle two categories were then collapsed to give three categories: 'lowest 25%', 'middle 50%' and 'highest 25%'. Higher scores indicate the most advantaged areas. | Baseline (age 4-5) |
| Socio-demographic characteristics | ||
| Parents' general health | Binary variables for mothers and fathers indicating whether each parent experienced poor or fair health at least once (based on the Global Health Measure from the SF-6). The variable for fathers also included a category 'no information', due to the large proportion of missing data. | Between age 4-5 and 12-13 |
| Parental income | Binary variable indicating whether equivalised parental income was at the lowest quartile at any wave during the study period | Between age 4-5 and 12-13 |
| Income support | Binary variable indicating whether the main source of income for the household was income support at any wave during the study period | Between age 4-5 and 12-13 |
| Household member with a disability | Binary variable indicating whether there was a person in the household with a medical condition or disability that had lasted or was likely to last for 6 months or more at any wave during the study period | Between age 4-5 and 12-13 |
| Single parent at each age | Binary variable indicating whether the child lived in a single-parent household at each data collection point. It was necessary to include dummy variables for each age as the 'no information' category for fathers' physical health, mental health and health behaviours included single-parent households and non-responding resident fathers. | Each age between 4-5 and 12-13 |
| Variables at age 4-5 | N | %/ mean | CI |
|---|---|---|---|
| Total difficulties score (mean) | 3,821 | 8.57 | [8.37,8.77] |
| Parenting | |||
| Maternal warmth (age 4-5) | |||
| High warmth | 2,916 | 77.3 | [75.7,78.8] |
| Low warmth | 886 | 22.7 | [21.2,24.3] |
| Total | 3,802 | 100.0 | |
| Maternal hostility (age 4-5) | |||
| Low hostility | 3,197 | 82.9 | [81.4,84.2] |
| High hostility | 592 | 17.1 | [15.8,18.6] |
| Total | 3,789 | 100.0 | |
| Maternal consistency (age 4-5) | |||
| High consistency | 3,159 | 81.8 | [80.4,83.2] |
| Low consistency | 627 | 18.2 | [16.8,19.6] |
| Total | 3,786 | 100.0 | |
| Low maternal warmth at least once | |||
| No | 2,632 | 60.8 | [59.0,62.5] |
| Yes | 1,754 | 39.2 | [37.5,41.0] |
| Total | 4,386 | 100.0 | |
| High maternal hostility at least once | |||
| No | 2,911 | 65.2 | [63.4,66.9] |
| Yes | 1,475 | 34.8 | [33.1,36.6] |
| Total | 4,386 | 100.0 | |
| Low maternal consistency at least once | |||
| No | 2,904 | 64.5 | [63.0,66.1] |
| Yes | 1,482 | 35.5 | [33.9,37.0] |
| Total | 4,386 | 100.0 | |
| Mother moderate/high psychological distress | |||
| No | 3,334 | 74.0 | [72.4,75.5] |
| At least once | 1,052 | 26.0 | [24.5,27.6] |
| Total | 4,386 | 100.0 | |
| Father moderate/high psychological distress | |||
| No | 3,023 | 64.2 | [62.2,66.1] |
| At least once | 575 | 12.8 | [11.8,14.0] |
| No information | 788 | 23.0 | [21.2,24.9] |
| Total | 4,386 | 100.0 | |
| Mother problematic use of alcohol | |||
| No | 3,360 | 76.4 | [74.9,77.9] |
| At least once | 1,026 | 23.6 | [22.1,25.1] |
| Total | 4,386 | 100.0 | |
| Father problematic use of alcohol | |||
| No | 2,022 | 41.8 | [40.2,43.5] |
| At least once | 731 | 14.9 | [13.8,16.2] |
| No information | 1,633 | 43.3 | [41.4,45.1] |
| Total | 4,386 | 100.0 | |
| Mother smoking | |||
| No | 3,342 | 71.8 | [69.8,73.8] |
| At least once | 1,044 | 28.2 | [26.2,30.2] |
| Total | 4,386 | 100.0 | |
| Father smoking | |||
| No | 2,748 | 57.0 | [54.7,59.1] |
| At least once | 847 | 20.0 | [18.6,21.5] |
| No information | 791 | 23.0 | [21.3,24.9] |
| Total | 4,386 | 100.0 | |
| Mother fair/poor health | |||
| No | 3,542 | 79.7 | [78.2,81.1] |
| At least once | 844 | 20.3 | [18.9,21.8] |
| Total | 4,386 | 100.0 | |
| Father fair/poor health | |||
| No | 3,040 | 65.7 | [63.8,67.5] |
| At least once | 615 | 13.2 | [12.2,14.3] |
| No information | 731 | 21.2 | [19.4,23.0] |
| Total | 4,386 | 100.0 | |
| Study child characteristics | |||
| Indigenous or Torres Strait Islander origin | |||
| No | 4,237 | 95.1 | [94.0,96.0] |
| Yes | 149 | 4.9 | [4.0,6.0] |
| Total | 4,386 | 100.0 | |
| Sex | |||
| Female | 2,135 | 48.9 | [47.2,50.5] |
| Male | 2,251 | 51.1 | [49.5,52.8] |
| Total | 4,386 | 100.0 | |
| General measure of health (at age 4-5) | |||
| Excellent | 2,432 | 53.5 | [51.7,55.3] |
| Very good | 1,438 | 33.5 | [31.9,35.1] |
| Good | 428 | 10.8 | [9.7,12.0] |
| Fair/poor | 87 | 2.2 | [1.7,2.7] |
| Total | 4,385 | 100.0 | |
| Special health care needs (at age 4-5) | |||
| No | 3,750 | 85.2 | [84.0,86.2] |
| Yes | 634 | 14.8 | [13.8,16.0] |
| Total | 4,384 | 100.0 | |
| Main LOTE at home (at age 4-5) | |||
| No | 3,973 | 87.0 | [84.5,89.2] |
| Yes | 411 | 13.0 | [10.8,15.5] |
| Total | 4,384 | 100.0 | |
| Birth order (at age 4-5) | |||
| Oldest | 1,325 | 29.1 | [27.7,30.6] |
| Middle/twin | 837 | 19.5 | [18.2,21.0] |
| Youngest | 1,770 | 39.9 | [38.3,41.5] |
| Only child | 454 | 11.4 | [10.3,12.6] |
| Total | 4,386 | 100.0 | |
| Pregnancy and birth | |||
| Mother mental health problems in pregnancy | |||
| Yes | 688 | 15.9 | [14.7,17.2] |
| No | 3,106 | 67.3 | [65.4,69.1] |
| No information | 515 | 16.9 | [15.1,18.8] |
| Total | 4,309 | 100.0 | |
| Maternal separation anxiety score (mean) | 4,252 | 2.6 | [2.57,2.65] |
| Mother age at birth (mean) | 4,374 | 30.8 | [30.54,31.12] |
| Household characteristics | |||
| Area of residence (at age 4-5) | |||
| Major city | 2,871 | 68.5 | [65.3,71.5] |
| Inner regional | 951 | 19.9 | [17.0,23.2] |
| Outer regional or remote | 558 | 11.6 | [9.2,14.4] |
| Total | 4,380 | 100.0 | |
| Neighbourhood advantage (at age 4-5) | |||
| Lowest 25% | 1,147 | 27.9 | [24.5,31.7] |
| Middle 50% | 2,194 | 49.6 | [45.5,53.6] |
| Highest 25% | 1,045 | 22.5 | [19.1,26.3] |
| Total | 4,386 | 100.0 | |
| Equivalised parental household income in lowest quartile | |||
| No | 2,311 | 47.1 | [44.8,49.5] |
| At least once | 2,075 | 52.9 | [50.5,55.2] |
| Total | 4,386 | 100.0 | |
| Highest level of parental education (at age 4-5) | |||
| Year 12 | 541 | 15.3 | [13.9,16.9] |
| Certificate/diploma | 1,884 | 46.2 | [44.1,48.3] |
| University degree | 1,947 | 38.5 | [35.9,41.1] |
| Total | 4,372 | 100.0 | |
| Pension main source of income | |||
| No | 3,700 | 79.3 | [77.4,81.1] |
| At least once | 686 | 20.7 | [18.9,22.6] |
| Total | 4,386 | 100.0 | |
| Person with disability in the household | |||
| No | 3,584 | 81.1 | [79.7,82.5] |
| At least once | 802 | 18.9 | [17.5,20.3] |
| Total | 4,386 | 100.0 | |
| Single parent (at age 4-5) | |||
| No | 3,900 | 85.8 | [84.2,87.1] |
| Yes | 486 | 14.3 | [12.9,15.8] |
| Total | 4,386 | 100.0 | |
Notes: Percentages may not total exactly 100.0% due to rounding. CI: confidence interval.
Source: LSAC Waves 1-7, B cohort, weighted
The research presented in this paper was commissioned by Emerging Minds through the National Workforce Centre for Child Mental Health. The National Workforce Centre for Child Mental Health is funded by the Australian Government Department of Health under the National Support for Child and Youth Mental Health Program. The Parenting Research Centre fulfilled the role of Contract and Project Manager for this work in collaboration with the Australian Institute of Family Studies (AIFS). Growing Up in Australia: The Longitudinal Study of Australian Children is conducted in partnership between the Department of Social Services (DSS), AIFS and the Australian Bureau of Statistics (ABS). The views reported in this report are those of the authors and should not be attributed to DSS, AIFS, ABS, PRC or Emerging Minds. The authors also thank Elly Robinson and Catherine Wade for their valuable feedback.
Featured image: © GettyImages/Daisy-Daisy