The consequences of divorce for financial living standards in later life
You are in an archived section of the AIFS website
February 2007
Download Research report
Overview
As the first generation that experienced high rates of divorce reaches retirement age, the number of older Australians who have experienced divorce at some point in their lives will increase dramatically in coming decades. There is very little empirical evidence in Australia on the financial consequences of divorce for older people. This report begins to fill this gap by providing some of the first estimates of the financial consequences of divorce for Australians aged 55 to 74 years. Using data from the Household, Income and Labour Dynamics in Australia (HILDA) Survey, it was found that, on average, having been divorced had negative consequences for income in older age for both men and women. However, the negative financial impacts of divorce were substantially reduced by remarriage. For some measures of financial circumstances, those who had remarried following divorce were very similar to the married and never-divorced. Older divorced single Australians were much more likely to experience material hardships and to report having a lower level of prosperity than the married and never-divorced. The divorced and single were more reliant on the public pension than those who had not divorced. This will have important implications for the financing of retirement incomes in Australia in coming decades and the extent to which the taxpayer will have to bear the costs of providing for retirement incomes.
As the first generation that experienced high rates of divorce reaches retirement age, the number of older Australians who have experienced divorce at some point in their lives will increase dramatically in coming decades. The effect of the increase in divorce rates in the mid-1970s is compounded by the structural ageing of the Australian population, with the first of the “baby boomers” (those born between 1946 and 1965) turning 60 in 2006. This means that not only will larger numbers of people be entering older age, but also that a much greater proportion of these people will have experienced divorce at some point in their lives.
Divorce is relatively unlikely to occur in older age, with the most common age for divorce being in the late twenties to early forties. Although most divorces occur before people enter later life, this does not mean that these earlier divorces are without consequences for people later in life. One potential impact is financial. There is very little empirical evidence in Australia on the financial consequences of divorce for older people. This report begins to fill this gap by providing some of the first estimates of the financial consequences of divorce for Australians aged 55 to 74 years.
A number of measures of financial living standards are examined, including:
- annual household income;
- housing tenure;
- superannuation;
- receipt of income support payments;
- per capita net household assets;
- perceived prosperity; and
- experience of financial hardships.
The analysis reveals that, on average, having been divorced has negative consequences for income and financial circumstances in older age. However, the negative financial impacts of divorce are substantially reduced by remarriage. For some measures of financial circumstances, the divorced and remarried are very similar to the married never-divorced.
Home ownership
- Home ownership rates of both the divorced and remarried and the divorced singles were lower than the rate of those who were married and had never-divorced.
- Three-quarters of the married never-divorced men owned a home outright, compared to just 40.9 per cent of the divorced single men and 57.8 per cent of the divorced and remarried men.
- The pattern was similar for women. The main difference between men and women following divorce is that older divorced single women had higher rates of outright home ownership (49.4 per cent) than older divorced single men (40.9 per cent).
- Divorced and remarried people, especially men, were the most likely to be purchasing a home.
- Those who were divorced and single were substantially more likely to be renting than the married (ever- and never-divorced). Of the divorced single men, 49.4 per cent were renting, compared to just 20.9 per cent of the divorced and remarried men and 15.0 per cent of the married never-divorced men.
Assets
- Divorced single men and women had lower median levels of per capita household assets than those who were married and never divorced ($199,900 and $178,300 respectively).
- For both men and women, per capita assets of the divorced and remarried and the married never-divorced were similar. Taken overall, it appears that remarriage following divorce returned men and women to a similar net asset position as the married never-divorced.
Superannuation
- Married never-divorced older women were substantially less likely to have had superannuation (37.8 per cent) than divorced and single women (49.3 per cent) and divorced and remarried women (46.4 per cent). However, the divorce history of women makes relatively little difference to their average amount of superannuation.
- Older divorced single men were less likely than either divorced remarried men or married never-divorced men to have superannuation (43.6 per cent, 57.5 per cent and 57.9 per cent respectively). Divorced singles also had much lower levels of superannuation assets ($44,600) than the other groups. Remarried divorced men had the highest amount of superannuation ($128,300), with the married never-divorced having an average amount of superannuation of $100,000.
Income
- For older men, the median household equivalent income (household income adjusted for household size and composition) was lowest for divorced single men ($15,500), followed by married never-divorced men ($24,500), and was highest for those who had divorced and remarried ($28,900).
- For women, there was no relationship between marital history and median incomes (ranging from $22,000 for divorced singles to $22,900 for married never-divorced women).
- Divorced and single men and women received higher levels of income support payments (including the age pension) than either the divorced and remarried or the married never-divorced.
Perceived prosperity and material hardships
- Older divorced single Australians are much more likely to experience material hardships than the married never-divorced.
- For men, the divorced and remarried are more likely to report having experienced financial hardship than the married never-divorced, but less likely than the divorced and single. For women, no difference in the rates of experiencing financial hardship were found between the divorced and remarried and the married never-divorced.
- For both men and women, the divorced and single reported having a lower level of prosperity than the married never-divorced. The self-reported prosperity of the divorced and remarried and the married never-divorced were similar.
Differences in the educational, employment and other characteristics between the groups did not appear to explain these relationships between marital history and financial circumstances.
The finding that divorced singles were more reliant on the public pension than those who had not divorced has important implications for the financing of retirement incomes in Australia in coming decades and the extent to which the taxpayer will have to bear the costs of providing for retirement incomes.
While the Australian age pension system offsets some of the financial disadvantages faced by divorced older people who are single, the lower level of financial living standards experienced by those who have been divorced could be reduced by encouraging greater levels of labour force participation among divorced women prior to retirement age. Other strategies could involve assisting the divorced to obtain further education or retraining, and delaying retirement. However, increased labour market earnings alone will almost certainly not completely offset the negative financial consequences of divorce in older age.
As the first generation that experienced high rates of divorce reaches retirement age, the number of older Australians who have experienced divorce at some point in their lives will increase dramatically in coming decades. Due to the sharp increase in divorce in the mid-1970s, there is a “divorce bulge”, where an increasing number of divorced people are now reaching later life.1 The effect of this divorce bulge is compounded by the structural ageing of the Australian population, with the first of the “baby boomers” turning 60 in 2006.2 This means that not only will larger numbers of people be entering older age, but also that a much greater proportion of these people will have experienced divorce at some point in their lives. Other countries have also experienced very substantial increases in divorce rates (see section 2) and will also have an increasing proportion of their older age population who have been divorced at some point in their lives.
While divorce can occur at any age, it is relatively unlikely to occur in older age, with the most common age for divorce being in the late twenties to early forties (Appendix, Figure A1). Although most divorces occur before people enter later life, this does not mean that these earlier divorces are without consequences for people later in life. This report focuses on the implications of divorce, occurring at any point in adulthood, for people’s financial wellbeing in later life.
There is an extensive literature on the impact of divorce on the specific financial circumstances of women. Studies from a number of countries have found that women experience a decline in financial circumstances following divorce.3 What has received less attention is the lifetime financial consequences of divorce.4 There is little Australian research on the financial consequences of divorce in older age (retirement age). Whiteford and Stanton (2002) reported that divorced, separated and never-married women were less likely to have assets than widows, who, in turn, were less likely to have assets than married women. Overall, around 45 per cent of divorced or separated age pensioners had less than $5,000 worth of assets (Whiteford & Stanton, 2002).
This report extends our understanding of the consequences of divorce in older age using a new longitudinal Australian survey, the Household, Income and Labour Dynamics in Australia (HILDA) Survey.5 HILDA is Australia’s first nationally representative large-scale household-based panel. It contains detailed information on income and the type and value of both assets and liabilities. In this report, income levels, home ownership rates, value of superannuation and net household assets, reliance on government income support and the experience of financial stress of older Australians are examined. Using these measures, we compare the financial situation of older people who have ever divorced to that of older Australians who are married and have never divorced. Comparisons are also made between older Australians who have been divorced and are currently remarried and those who have divorced and are currently single.6 The results in the paper provide some preliminary estimates of the likely impact of divorce on financial circumstances in older age. This is an area in which the authors intend to conduct further research, including using the longitudinal nature of the HILDA to extend the analysis presented in this report.
The focus on assets is important, given that asset ownership can confer a number of advantages on older people. Assets can be invested to produce an income or, in the case of home ownership, can reduce the need for income to pay rent. Assets can also be sold to meet consumption needs, including care (Whiteford & Stanton, 2002). Analysis of the range of financial variables available from HILDA provides a comprehensive picture of the financial position of older Australians who have been divorced, compared to older Australians who have never divorced.
The potential effects of divorce on retirement incomes and assets are complex and depend on a range of factors, including the effects on employment and retirement decisions post-divorce, the proportion of pre-divorce assets received by each partner, the stage of life at which the divorce occurred (including whether the couple had children), whether or not the divorced person remarried, the amount of child support received or paid, whether the couple had entered the housing market, and whether additional government benefits were received.
There are good reasons for expecting divorce to have a negative effect on retirement incomes. These include the effects of divorce on asset accumulation, the impact of legal fees incurred in negotiating property settlements, and the increases in living costs when a family separates (related to the loss of economies of scale). It is generally argued (supported by the limited data available) that the negative impact is greatest for women who have had children, since these women are the least likely to have a strong labour market position to enable them to recover financially. It is expected that the negative financial impact of divorce on women would be ameliorated if they repartnered with someone who had similar financial assets and earnings as their first husband. On the other hand, divorce may prompt an increase in labour force participation for financial reasons (in the economic literature, termed an “income effect”).
The remainder of this report is structured as follows. Section 2 describes divorce rates across a number of countries. In the third section the Australian system of provision for retirement incomes is outlined, and in the fourth the data used to analyse the impact of divorce on financial living standards in older age are described. In section 5 the socio-economic and demographic characteristics of older Australians who have been divorced are compared to those who are married and never divorced, and in section 6 the effects of divorce on financial circumstances are analysed. In the final section concluding comments are made.
1 The divorce rate of married Australian men and women increased from 2.8 per 1,000 married couples in 1961 to 18.5 in 1976 and has been stable at around 13 per 1,000 since the mid-1980s. These figures only describe formal divorce and not the ending of de facto relationships.
2 The “baby boom” generation is generally defined to have been those born between 1946 and 1965.
3 Examples of international research in this area include Jarvis and Jenkins (1997), Perry, Douglas, Murch, Bader, and Borkowski (2000), Pulkingham (1995), and Smock, Manning, and Gupta (1999). Australian research includes Funder, Harrison, and Weston (1993), Kelly and Harding (2005), McDonald (1986), Sheehan and Hughes (2001), and Smyth and Weston (2000).
4 An example of a study that does this is Davies, Joshi, Rake, and Alami, (2000), who estimated the consequence of divorce for the lifetime income of women in the United Kingdom.
5 The Household, Income and Labour Dynamics in Australia (HILDA) Survey, a longitudinal survey funded by the Commonwealth Department of Families, Housing, Community Services and Indigenous Affairs, is conducted by a consortium comprising the Melbourne Institute of Applied Economic and Social Research, University of Melbourne (the lead agency), the Australian Institute of Family Studies, and the Australian Council for Educational Research.
6 The analysis in this report is restricted to those who have ever been married. Older Australians who have never been married but have previously been in a cohabiting relationship are excluded from this analysis. This is because it is difficult to determine the “seriousness” of cohabiting relationships using the HILDA Survey. The number of older Australians who have never been married but have previously been in a cohabiting relationship is small and our results are not sensitive to the exclusion of these respondents from the analysis.
Australia is not alone in confronting the dual impact of the baby boom and the rapid increase in divorce rates. In English-speaking OECD countries, at least, there was a divorce boom between the late 1960s and the mid-1980s. Although the precise timing of the divorce boom varied between countries, the pattern of a rapid and substantial increase in divorce was common among most English-speaking OECD countries. Figure 1 shows the pattern in six such countries.
Figure 1: Annual divorce rates for six English-speaking OECD countries, 1951–1998
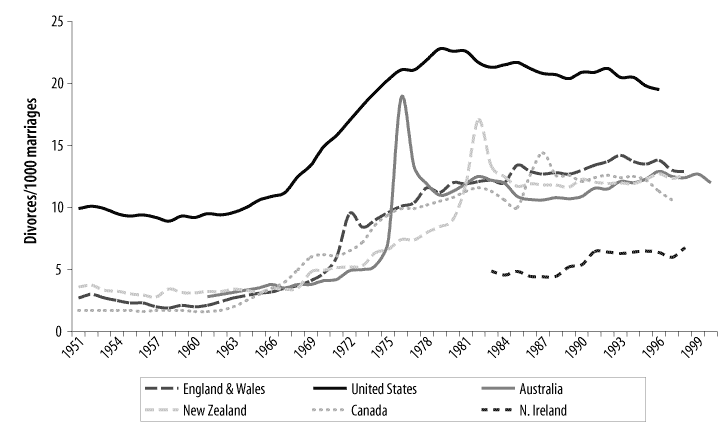
In England and Wales, rates started to climb slowly in the early 1960s, but rose sharply in 1971 following the 1969 Divorce Reform Act, which included “no-fault” grounds for divorce. Similarly, in Australia, the divorce rates started to climb from the mid-1960s and rose very sharply following the introduction of the Family Law Act 1975 that introduced no-fault divorce. The sharpness of the divorce peak in 1976 was partly due to a backlog of long-term marital separations for which the end of the marriage was formalised as soon as the new Act came into effect. Following the 1976 peak, the divorce rate subsequently declined and has since been stable, but at a much higher level than prior to the introduction of the new Act.
New Zealand exhibited a very similar pattern a decade later, again with a pattern of gradual increase in divorce rates, and a sharp rise in 1981 following the introduction of no-fault divorce in the same year.
The pattern in the US is also similar to these countries. The rise in divorce began in the mid-1960s, but rose strongly from 1969 through to 1979. The first US no-fault divorce was introduced in 1969 in California under Governor Ronald Reagan. The rate of the US increase in divorce was less steep and more prolonged than in the countries discussed above, as over the decade no-fault divorce was only introduced gradually in its different state jurisdictions.
The Canadian pattern is a little different. The increase in divorce came in two waves. There was an initial rise in the early 1960s, followed by the passing of the Divorce Act in 1968, and there was another rise in 1986 due to further changes to the Divorce Act in the same year.
All these countries, and no doubt many other OECD countries, will now be experiencing a substantial increase of older people who at some earlier point in their lives have been divorced. High annual rates of divorce translate eventually into large numbers and high percentages of older people having experienced divorce. In Australia it is estimated (depending on the method of estimation) that between a third and 45 per cent of people who marry will divorce. The US has higher rates of people who ever divorce. We can therefore expect that, in many countries, up to half of the people who are entering later life, either now or in the future, will have been divorced at some point.
As governments explore ways of managing the financial consequences of structural ageing and seek to encourage financial self-sufficiency of older people, they will need to be aware of any financial consequences of divorce earlier in life on financial wellbeing and self-sufficiency in later life.
In order to understand the potential impact of divorce in Australia on assets and income in older age, it is necessary to understand the Australian system of provision for retirement incomes. This system differs in some important respects from that of many other OECD countries.7
The Australian system of provision for retirement incomes can be characterised as a three-pillar model.8 The three pillars are:
- a flat-rate, means-tested pension financed from general government revenue (the age pension);
- compulsory saving through an employment-based system, known as the Superannuation Guarantee; and
- voluntary superannuation, assisted by tax concessions or other private saving, particularly housing.
The first pillar was introduced in Australia at the beginning of the 20th century. The second pillar of compulsory saving through the Superannuation Guarantee was introduced much more recently, during the 1990s, and now covers the majority of the employed population. However, it will take many years before those reaching retirement age will have had paid sufficient compulsory superannuation throughout their working lives to make a significant difference to their retirement incomes. The policy intention is that the mandatory second pillar and voluntary third pillar will reduce the pressure on the government of providing direct financial support for retirement incomes.
3.1 The age pension
A feature of the Australian system is that public spending on age pensions is low compared to most other OECD countries. Nevertheless, coverage is comprehensive, and the system appears to be highly redistributive to groups often poorly served by social insurance systems, such as women, those with long-term disabilities, low-wage earners and others with marginal or incomplete attachment to the labour force.9 Indeed, the Australian pension system has been described as “radically redistributive” (Aaron, 1992). Males aged over 65 are eligible to receive the age pension subject to income and asset tests. The age at which females are eligible to receive the age pension depends on when they were born and ranges from 60.5 years for those born before 31 December 1936 to 65 years for those born after 1 January 1949.
The Australian age pension is income-tested. Income above a specified amount (the “free area” or income disregard) reduces the amount of age pension received. For single age pensioners, each dollar of income above $128 per fortnight decreases the amount of pension received by 40 cents. For married (partnered) age pensioners, each dollar above $228 per fortnight reduces the amount of pension received by 20 cents (see Table 1 for details). The amount of private income at which the age pension cuts out is $1,423 per fortnight for single age pensioners and $2,381 per fortnight for (married) couples.
| Value in $A at September 2006 | |
|---|---|
| Standard (single) pension rate | $512.10 per fortnight (plus $18.20 pension supplement) |
| Married pension rate (each) | $427.70 per fortnight (plus $15.20 pension supplement) |
| Supplementary Rent Assistance | Up to $103.20 per fortnight for singles, $97.40 per fortnight for couples |
| Pharmaceutical Allowance | $5.80 per fortnight (single and combined) |
| Income allowed before pension is reduced (free area or income disregards) | |
| Single | $128.00 per fortnight |
| Combined Married | $228.00 per fortnight |
| Withdrawal rate | 40% for single and 20% for each of a couple |
| Cut-out points | |
| Single | $1,422.75 per fortnight |
| Combined Married | $2,381.00 per fortnight |
| Assets test | Allowable assets* | No rate paid above |
|---|---|---|
| Single home owners | $161,500 | $334,250 |
| Single non-home owners | $278,500 | $451,250 |
| Married home owners | $229,000 | $516,500 |
| Married non-home owners | $346,500 | $633,500 |
Notes: * Assets over this amount reduce the pension received by $3 per fortnight for every $1,000 above the limit.
Source: A guide to Australian Government payments, 20 September–31 December 2006.
In addition to the income test, there is an assets test applied to the receipt of the age pension. The rate of pension is calculated under both the income and assets tests, with the test that results in the lower rate being the one applied. The age pension is indexed twice each year, in line with the Consumer Price Index (CPI). The Australian Government also maintains the single rate of pension at a minimum of 25 per cent of male total average weekly earnings (MTAWE), and this flows on to the married pension rate.
The assets test thresholds are very high and exclude the value of the family home. Rather than being a residual system targeted only to the very poor, the Australian pension system is designed to exclude the relatively well-off. The extent to which the income test targets only the well-off is illustrated by the fact that nearly 80 per cent of older Australians receive at least a part pension. Indeed, a couple could still receive some pension even when their private income in retirement exceeds average male earnings.
In addition to the basic rates of payment set out in Table 1, pensioners may qualify for additional assistance, depending on their circumstances. This includes Rent Assistance, Pharmaceutical Allowance, Telephone Allowance, Remote Area Allowance and pension concession cards. Concession cards entitle the holder to Commonwealth health concessions, such as low-cost pharmaceuticals. State-based concessions may include reductions in property and water rates, reductions in energy bills, reduced fares on public transport, reductions on motor vehicle registration, and other health, household, educational and recreational concessions. Concession cardholders are also more likely to receive free medical care under “bulk-billing” arrangements, although this is at the discretion of private doctors. In addition, many private sector companies provide discounts to concession card holders.
3.2 Superannuation
The proportion of employees with superannuation increased from 55 per cent in 1988 to 91 per cent in 2000 (Australian Bureau of Statistics [ABS], 2002). The amount of superannuation held is closely linked to the value of contributions made to superannuation over time. In 2000, the median total superannuation assets for employees aged 15–64 years was $10,200 and the median balance for male employees was more than double that of female employees. Data from the Australian Bureau of Statistics for 2000 reveal that “the difference between the superannuation balances of male and female employees increased with age to the point where male employees of retirement age (55–64 years) had more than twice the amount of superannuation of female employees ($44,700 compared with $19,800)” (ABS, 2002, p. 178).
A number of papers have discussed differences between men and women in amounts of superannuation accumulated over their working lives (Jefferson & Preston, 2005; Kelly, Percival, & Harding, 2002). In particular, there has been discussion on the impact on superannuation of broken work patterns and low earnings (both because of low hourly wages and because of part-time employment), which are much more common for women than men. The assumption that is often made is that the much lower levels of superannuation that will be accumulated by women who have had children will be compensated for by higher levels of superannuation accumulated by their partner, and that this superannuation is shared. While this is probably true while a couple remains married, it usually breaks down following divorce.
Superannuation fund assets increased from only 3 per cent of GDP in 1972 to 19 per cent in the early 1980s, and in 1999 were equivalent to 70 per cent of GDP (Whiteford & Stanton, 2002). Government estimates suggest that by 2020, fund assets could approach 120 per cent of GDP (Tinnion & Rothman, 1999). While the new compulsory superannuation system has grown rapidly in significance, it will be many years before the system is mature. As a result, the living standards of current pensioners are largely influenced by the public pension system and its interaction with private sources of income and wealth. The largest part of superannuation payouts is in the form of lump sums, which people then use in retirement as they see fit.
Divorce may have an impact upon financial circumstances (current financial living standards and net assets) in a number of ways. These include the following:
- Divorce will normally result in the creation of two households rather than one. This may lead to a decline in living standards and to the loss of economies of scale, which in turn will make it more difficult to save and accumulate assets.
- Divorce may affect labour force participation. In some cases, it may lead to withdrawal from the labour force (for example, to enable a lone parent to care for children or qualify for financial assistance or reduce the non-resident parent’s liability for child support). In other cases, divorce may require a person to re-enter the workforce or to stay in the workforce longer than they may have intended so that they can accumulate sufficient funds for retirement.
- The amount of age pension (and most other government income support payments) depends upon relationship status.
Following marriage breakdown, a couple’s assets need to be split. If the couple is unable to agree on how to do this, the Family Court (or Federal Magistrates Court) decides.10 The general approach used by the Family Court is to identify what each spouse owns and owes, the contributions made by the respective members of the couple during the course of the marriage and future requirements. There is no assumption that the starting position should be a 50–50 split. The Court considers both the financial and non-financial contributions made by each spouse.
In 2002, amendments to the Family Law Act gave courts the capacity to treat superannuation assets in the same way as any other form of property. The 2002 amendments require that superannuation assets be disclosed to the Court and that their value be taken into account when determining each member of the couple’s entitlements to assets.
Research by Sheehan and Hughes (2001), using data from the Australian Divorce Transitions Project collected by the Australian Institute of Family Studies in 1998, reported that, on average, 55 per cent of property and financial resources at the time of distributing assets following divorce was received by the wife and 45 per cent by the husband. In 42 per cent of cases, respondents reported that the wife received 60 per cent or more of the property. Twenty-nine per cent of respondents reported receiving the middle range of 40–59 per cent each, and 29 per cent reported the wife receiving less than 40 per cent of the property. Focusing on property only, Sheehan and Hughes (2001) found that 59 per cent of women received 60 per cent or more of the property.
7 This section draws heavily on Whiteford and Stanton (2002).
8 The three-pillar model terminology was coined by the World Bank (1994).
9 Hutton and Whiteford (1992), using data from the Luxembourg Income Study, showed that the Australian public pension system was more “pro-female” than any insurance system in operation at that time (although women were still much worse off than men).
10 For de facto couples, property disputes are resolved in state or territory courts.
4.1 Overview of HILDA
This analysis of the effects of divorce on the incomes, assets and living standards of older Australians is based upon the HILDA Survey. The HILDA Survey has a number of advantages for studying this issue. These advantages relate to its detailed information on current marital status and marital history, the size and national representativeness of the sample, the household nature of the survey and its detailed information on household wealth.
The annual survey, which commenced in 2001, tracks all members of an initial sample of 7,682 households across Australia. The HILDA Survey collects data in three main areas: economic and subjective wellbeing, labour market dynamics, and family dynamics. This report uses data from the second wave of the survey that were collected in 2002—the only wave to date that collected detailed information on household wealth.
Within each household, interviews were sought from all members aged 15 and older. In wave 1, face-to-face interviews were conducted with nearly 14,000 household members and further information was obtained from self-completed questionnaires from 13,055 of these household members. Watson and Wooden (2004) provide a detailed discussion of the design of the survey. The rate of attrition between wave 1 and 2 was 13.2 per cent, with 86.8 per cent of respondents in wave 1 successfully re-interviewed in wave 2 (Watson & Wooden, 2004).
4.2 HILDA measures of income, wealth, financial hardship and prosperity
Wave 2 of the survey contained detailed information on income and wealth. The following financial variables are analysed for this report:
- annual household income;
- annual household income adjusted for household size and composition (equivalised household income11);
- housing tenure (own house without debt, purchasing house, other housing tenure (mainly rental));
- whether a person had superannuation, and the value of that superannuation;12
- whether a person was in receipt of a government income support payment (including the age pension); and
- per capita net household assets13 (net assets in household divided by number of adults in the household).
A significant proportion of respondents were unable to quantify the value of one or more of the types of assets or liabilities. Taken overall, total net household wealth could not be directly determined for just over 39 per cent of all wave 2 responding households (Watson & Wooden, 2004). For individual respondents with missing information on assets or liabilities, a set of variables that imputed the missing information was included with the data set (see Watson and Wooden (2004) for a detailed description of the imputation process used). The analysis in this report uses measures of wealth that include imputed data; for individuals with missing information on income, the imputed income variable is used.
Although the proportion of respondents with imputed values for one or more types of assets or liabilities was relatively high, in many cases the missing information was restricted to only one or two of the asset and liability items.14 After a comprehensive assessment of the quality of the assets and liabilities data in wave 2 of HILDA, Watson and Wooden (2004) concluded that “overall, it is our assessment that the HILDA Survey has done a reasonable job in measuring total household wealth. Nevertheless, net worth is almost certainly overstated. This reflects both under-reporting of debts and, though more speculative, over-reporting of assets” (p. 24). They also emphasised that the main weakness associated with imputing missing data was that “even if imputation does generate unbiased cross-section estimates, estimates of change are unlikely to be so well behaved” (p. 24).
While income and assets provide measures of financial circumstances, the welfare or poverty consequences of a lack of income depend upon a range of factors, including individual consumption preferences and budget constraints, and can only be drawn with reference to a set of prices (Mayer & Jencks, 1989; Travers & Richardson, 1993). Consequently, we include subjective measures of financial stress and wellbeing. In the HILDA Survey, respondents were asked the question: “Given your current needs and financial responsibilities, would you say that you and your family are prosperous, very comfortable, reasonably comfortable, just getting along, poor, or very poor?” We term this measure “perceived prosperity”.
The HILDA Survey also contains questions on financial difficulties. Respondents were asked whether any of the following things had occurred in the previous 12 months due to a shortage of money: could not pay electricity bills, gas or telephone bills on time; could not pay the mortgage or rent on time; pawned or sold things; went without meals; was unable to heat their home; asked for financial help from friends or family; or asked for help from welfare/community organisations. Given the relatively low incidence of these financial hardships for older Australians, the measure used in this report is whether or not the respondent had experienced one or more of these hardships in the previous 12 months.
4.3 Characteristics of the sample for analysis
Our analysis is restricted to males and females aged 55 to 74 years who were married at the time of the interview or who had previously been married. This age grouping was chosen in order to obtain a sufficient sample size of older Australians to allow an analysis by gender.15 The age of 55 is also the age beyond which labour force participation rates drop substantially.
According to the HILDA Survey, 17 per cent of males aged 55 to 74 years who had ever been married had divorced in the past but were remarried at the time of interview, and 9 per cent were divorced and single at the time of interview. Overall, almost 26 per cent had ever divorced, 72 per cent were married and had never divorced and 3 per cent were widowed. For females, 11 per cent had been divorced but were remarried at the time of the interview, and 11 per cent were divorced and single at the time of interview. Overall, 22 per cent had ever divorced, 62 per cent were married and had never divorced and 16 per cent were widowed.
11 The new OECD equivalence scale gives the first adult in the household the value of 1. The second and subsequent adults each add 0.5, and each child adds 0.3 to the equivalence scale.
12 The value of superannuation assets excludes the income generated from superannuation, which is included in the household income measure.
13 Total household assets include: equity investments (shares, managed funds, property trusts); cash investments; trusts; own bank accounts; joint bank accounts; children’s bank accounts; redeemable insurance policies; retirees’ superannuation; non-retirees’ superannuation; home value; other property value; collectibles (substantial assets such as antiques, works of art, other collectibles); businesses; and vehicles. Total household debts include: property debt; business debt; total credit card debt; HECS debt; and other debt.
14 The missing information on assets and liabilities ranges from a low of 2.1 per cent in the case of credit card debt up to a high of 29 per cent in the case of trusts. For superannuation, 10.5 per cent of the respondents had missing information (Watson & Wooden, 2004, p. 21).
15 Respondents aged 75 years and older are excluded for several reasons. First, only a small proportion of those aged over 75 years have ever been divorced and thus reliable estimates of the effects of divorce for this age group are not possible. Second, income and assets are related to age (even within the older population) (Dolan, McLean, & Roland, 2005). The widowed are excluded from the analysis in this report, given its focus on the effects of divorce. Nonetheless, a comparison of the financial circumstances of the widowed with the married, never divorced and divorced would be interesting. While a number of women aged 55 to 74 years are widowed, few men in this age group are.
There were a number of important differences in the characteristics of men and women who had divorced and remained single, who had divorced and remarried, and who were married and had never divorced (Table 2).16
| Men | Women | |||||||
|---|---|---|---|---|---|---|---|---|
| Divorced and single | Divorced and remarried | All divorced | Married and never divorced | Divorced and single | Divorced and remarried | All divorced | Married and never divorced | |
| Age (mean) | 62.7 | 61.8 | 62.1 | 63.4 | 61.9 | 61.2 | 61.5 | 63.0 |
| Years since divorce (mean) | 14.0 | 20.4 | 18.3 | 16.6 | 26.3 | 21.6 | ||
| Highest education attainment | ||||||||
| Degree or higher | 4.1% | 21.6% | 15.8% | 13.1% | 26.0% | 12.7% | 19.0% | 8.1% |
| Some post-school qualification | 42.5% | 40.2% | 40.9% | 40.0% | 21.6% | 19.8% | 20.7% | 19.1% |
| Year 12 or less | 53.4% | 38.3% | 43.3% | 46.9% | 52.4% | 67.5% | 60.3% | 72.8% |
| Employment status | ||||||||
| Employed | 33.4% | 45.9% | 41.7% | 39.6% | 44.2% | 32.9% | 38.3% | 22.2% |
| Not employed | 66.6% | 54.1% | 58.3% | 60.4% | 55.8% | 67.1% | 61.7% | 77.8% |
| Number of children (mean) | 2.7 | 2.8 | 2.8 | 2.9 | 2.5 | 2.7 | 2.9 | 3.0 |
| Country of birth | ||||||||
| Australia | 70.3% | 60.8% | 64.0% | 61.0% | 70.5% | 61.5% | 65.8% | 69.3% |
| Other mainly English-speaking countries | 18.7% | 19.6% | 19.3% | 15.1% | 18.6% | 25.9% | 22.4% | 11.5% |
| Non-English speaking countries | 11.0% | 19.6% | 16.8% | 23.9% | 10.8% | 12.6% | 11.8% | 19.2% |
| Number of observations | 98 | 201 | 299 | 853 | 140 | 144 | 284 | 800 |
Notes: The divorced and remarried category includes a small number of respondents who were cohabiting at the time of the interview. Estimates are based on weighted data.
Source: HILDA, wave 2, 2002.
The most important of these differences were:
- On average, men and women who had divorced and remained single became divorced more recently than those who had divorced but remarried. Men who had remarried became divorced, on average, 20.4 years ago, and those who were single became divorced, on average, 14 years ago. Women who had remarried became divorced, on average, 26.3 years ago and those who were single became divorced, on average, 16.6 years ago.17
- Men who had ever divorced (regardless of whether they remarried) had similar levels of education to those who were married and had never divorced. There are, however, big differences within the divorced group. Men who had divorced and remarried had higher levels of education (21.6 per cent with a degree or higher-level qualification) than those who had divorced but remained single (4.1 per cent). Men who had divorced but never remarried had the lowest level of education of the three groups of men.
- Among women the opposite pattern held. Divorced women who remained single had the highest level of education among the women. Twenty-six per cent of divorced but single women had a degree, compared to 12.7 per cent of the divorced and remarried women, and 8.1 per cent of the married and never-divorced women.
- Divorced women who remained single had a much higher level of education (26.0 per cent with a degree) than divorced men who remained single (4.1 per cent).
- Men who were divorced but remarried had the highest rate of employment (45.9 per cent), while men who had remained single had the lowest rate of employment (33.4 per cent). Among women, the reverse was true: 32.9 per cent of remarried women were employed, compared to 44.2 per cent of divorced single women.
Taken overall, women who divorced and remained single had better education and employment rates than married women (both ever- and never-divorced), while the reverse was true for divorced and single men. These men were less advantaged than both married men (ever- and never-divorced) and divorced single women.
The fact that divorced and remarried men had a higher level of human capital than divorced single men, and the reverse pattern was found for divorced women, is consistent with research into partnering patterns. This research shows that women tend to marry men with a higher level of education, labour market earning capacity and assets than themselves, whereas men tend to marry women with the same or lower levels of educational attainment, labour market earning capacity and assets than themselves (Birrell & Rapson, 1998). This may be particularly pronounced for second marriages. The pattern in which men and women with similar characteristics tend to marry each other is referred to as assortative mating and the tendency for men to have educational and labour market capacity at least a little higher than their partners is called the marriage gradient.
In this section, the level of income, assets and reliance on government income support of ever-divorced Australians aged 55 to 74 years is compared to that of those who have never divorced. The effects of remarriage are also analysed. In section 6.1, financial circumstances of the ever-divorced are compared with those of the never-divorced. In section 6.2, the question of whether remarriage impacts upon the financial effects of divorce in older age is addressed. The level of financial hardship and perceived prosperity according to marital history is explored in section 6.3.
The differences in characteristics such as education between those who divorced and remarried, those who divorced and remained single, and those who married and never divorced are likely to have an impact on financial circumstances in older age. This should be borne in mind when interpreting the information in section 6.3 on financial circumstances by marital history and financial hardship and perceived prosperity that do not take account of these differences in characteristics.
Section 6.4 presents the relationship between divorce and financial circumstances in older age, after adjusting for differences in the economic and socio-economic characteristics of the divorced single, divorced and remarried, and married never-divorced. Regression (multivariate) analysis is used to adjust for these differences in characteristics. While the regression analysis does go some way towards controlling for differences in characteristics according to marital history, it is unlikely that the characteristics available from the HILDA Survey are all of the relevant characteristics. Therefore, the possibility that differences in financial and income situation according to marital status are explained by selection effects cannot be discounted. The HILDA data does not, in most cases, provide information on the characteristics of ex-partners (unless the relationship breakdown occurred during the period covered by the HILDA Survey).
6.1 Financial circumstances according to whether ever-divorced
In this section, the overall differences between older Australians who had ever divorced and the married and never-divorced are described (Table 3). Males who had ever divorced had much lower rates of home ownership than currently married and never-divorced males. Of married never-divorced males, 74.7 per cent owned a home outright (that is, had no debt), compared to just 52.2 per cent of ever-divorced males. Ever-divorced men were more likely to be purchasing a home (17.5 per cent) compared to married and never-divorced men (10.3 per cent). Men who had been divorced were twice as likely as the never-divorced neither to own nor be purchasing a home. The pattern and levels of home ownership for women was similar to that of men.
| Men | Women | |||
|---|---|---|---|---|
| Ever divorced | Married and never divorced | Ever divorced | Married and never divorced | |
| Housing tenure | ||||
| Own house outright | 52.2% | 74.7% | 55.9% | 73.4% |
| Purchasing house | 17.5% | 10.3% | 17.9% | 7.6% |
| Other tenure | 30.3% | 15.0% | 26.2% | 19.0% |
| Annual household equivalent income | ||||
| Median | $23,000 | $24,500 | $22,100 | $22,900 |
| Mean | $37,200 | $33,700 | $29,800 | $31,800 |
| Per capita household net assets | ||||
| Median | $169,500 | $199,900 | $153,800 | $178,800 |
| Mean | $321,100 | $308,400 | $262,800 | $310,100 |
| Superannuation | ||||
| Has superannuation | 52.9% | 57.9% | 47.8% | 37.8% |
| Amount | $100,600 | $100,000 | $37,800 | $42,800 |
| Income support payment (including age pension) | ||||
| Receives income support | 47.7% | 48.6% | 53.3% | 56.1% |
| Amount received per week (mean) | $91.00 | $78.90 | $96.40 | $87.80 |
| Number of observations | 299 | 853 | 284 | 800 |
Notes: Estimates are based on weighted data.Source: HILDA, wave 2, 2002.
Ever-divorced men and women had fewer assets than the married never-divorced. Married and never-divorced men had median assets to the value of $199,900, compared to $169,500 for the ever-divorced men. The pattern for women is similar, with median assets of $178,800 and $153,800 respectively. Ever-divorced men had assets with a higher median value than ever-divorced women ($15,700 more). Similarly, never-divorced men had $21,100 more in assets than never-divorced women.
Men who had ever divorced had similar rates of superannuation coverage as married and never-divorced men, and had superannuation assets of the same level.18 Ever-divorced women were substantially more likely to have superannuation than those who had never divorced. This is a reflection of the fact, shown in Table 2, that ever-divorced women had higher rates of employment (38.3 per cent) than women who had never divorced (22.2 per cent).
As expected, a higher proportion of men than women aged 55 to 74 years had superannuation. The much higher value of the superannuation of men reflects the higher lifetime employment rate and the fact that, until recently, superannuation assets were not generally redistributed as part of divorce settlements.
There were a number of respects in which ever-divorced and married and never-divorced people were indistinguishable. For example, among both men and women, the ever-divorced had very similar levels of receipt of income support payments. Furthermore, men and women who had ever divorced had a similar equivalent median family income to the married and never-divorced group.19
6.2 Does remarriage following divorce make a difference?
So far, we have distinguished between the financial circumstances of the ever-divorced and the married and never-divorced. However, the ever-divorced group consists of two very different types of people—the divorced who have remarried and those who have remained single. Table 2 has already shown that these two types of ever-divorced people have quite different characteristics (for example, in education and employment), which in turn may affect their financial circumstances in old age.
The analysis that is presented in Table 4 compares the financial circumstances of older men and women who had divorced and remarried with those who had divorced and remained single and those who were married and had never divorced.
| Men | Women | |||||
|---|---|---|---|---|---|---|
| Divorced and single | Divorced and remarried | Married and never divorced | Divorced and single | Divorced and remarried | Married and never divorced | |
| Housing tenure | ||||||
| Own house outright | 40.9% | 57.8% | 74.7% | 49.4% | 61.8% | 73.4% |
| Purchasing house | 9.6% | 21.3% | 10.3% | 15.2% | 20.4% | 7.6% |
| Other tenure | 49.4% | 20.9% | 15.0% | 35.5% | 17.8% | 19.0% |
| Annual gross household income | ||||||
| Median | $19,700 | $51,000 | $41,400 | $26,900 | $40,800 | $35,900 |
| Mean | $29,900 | $75,500 | $60,800 | $33,300 | $52,400 | $55,800 |
| Annual household equivalent income | ||||||
| Median | $15,500 | $28,900 | $24,500 | $22,000 | $22,500 | $22,900 |
| Mean | $24,200 | $43,600 | $33,700 | $26,800 | $32,500 | $31,800 |
| Per capita household net assets | ||||||
| Median | $130,400 | $200,000 | $199,900 | $130,100 | $178,300 | $178,800 |
| Mean | $233,500 | $364,500 | $308,400 | $231,700 | $291,300 | $310,100 |
| Superannuation | ||||||
| Has superannuation | 43.6% | 57.5% | 57.9% | 49.3% | 46.4% | 37.8% |
| Amount | $44,600 | $128,300 | $100,000 | $35,700 | $39,700 | $42,800 |
| Income support payment (including age pension) | ||||||
| Receives income support | 58.6% | 42.2% | 48.6% | 57.6% | 49.3% | 56.1% |
| Amount received per week (mean) | $125 | $74 | $79 | $116 | $79 | $88 |
| Number of observations | 98 | 201 | 853 | 140 | 144 | 800 |
Notes: The divorced and remarried include a small number of respondents who were cohabiting. Estimates are based on weighted data.
Source: HILDA, wave 2, 2002.
The home ownership rates of both the divorced and remarried and the divorced singles were lower than the rate of those who were married and had never divorced. To reiterate, three-quarters of married and never-divorced men owned a home outright (that is, had no debt), compared to just 40.9 per cent of the divorced single men and 57.8 per cent of the divorced and remarried men. The pattern was similar for women. The main difference between men and women following divorce is that divorced single older women had higher rates of outright ownership (49.4 per cent) than divorced single older men (40.9 per cent). This probably reflects the patterns of allocation of property following divorce, with women often getting a greater share of property (Sheehan & Hughes, 2001).
Divorced and remarried people, especially men, were the most likely to be purchasing a home. The married and never-divorced were relatively unlikely to be purchasing, since three-quarters had already achieved outright ownership. The divorced singles were unlikely to be purchasing a home, but were in the “other tenure” category. Most people in this category were renting their house and were thus not accumulating housing equity. Those who were divorced and single were substantially over-represented among both male and female renters, particularly the males. Of the divorced single men, 49.4 per cent were renting, compared to just 20.9 per cent of the divorced and remarried men and 15.0 per cent of the married and never-divorced men. Among women, the divorced singles had double the rental rate (35.5 per cent) of those who had divorced and remarried (17.8 per cent).
It is clear therefore that the divorced single men in particular, followed by divorced single women, were in the worst situation as far as housing equity was concerned. This has important financial implications, because the primary residence is excluded from the assets test for the age pension, which, in turn, means that holding wealth in this form can be financially advantageous. Home ownership also is important in providing housing security and eliminating the need to pay rent (although home owners do have to pay various charges associated with owning a home and maintenance costs). In addition, in recent years, the value of housing in Australia has increased substantially.
As expected, the median total annual gross household income was lowest for divorced single older men and women and higher for those who were married (both ever- and never-divorced). This probably reflects divorced singles’ lower levels of assets that generate an income stream (including superannuation), lower employment rates and the fact that their households, on average, had fewer members.
The median total household incomes for older men and women were higher for the divorced and remarried group than for the never-divorced. This probably reflects the higher employment rates among the divorced and remarried and higher incomes that may flow from their relatively higher levels of education.
Total household income can be adjusted for household size and composition using an equivalence scale. For older men, the median household equivalent income was lowest for the divorced single men ($15,500), followed by the married and never-divorced men ($24,500), and was highest for the divorced and remarried men ($28,900). For women, no pattern was apparent in median incomes according to marital history (ranging from $22,000 for the divorced singles to $22,900 for the married and never-divorced women). As expected, the mean equivalent incomes were higher than the median equivalent incomes, an indication that the distribution was skewed. When mean equivalent incomes are considered, divorced single older women had a lower equivalent income ($26,800) than the divorced and remarried ($32,500) and the married and never-divorced ($31,800).
Overall, men aged 55 to 74 years lived in households with a higher median level of per capita assets than women. However, divorced single men and women had nearly identical levels of per capita assets ($130,400 and $130,100 respectively). Divorced single men and women had lower median levels of per capita household assets than both men and women who had married and never divorced ($199,900 and $178,300 respectively). Per capita assets were similar for both divorced and remarried men and married and never-divorced men. Similarly, the per capita assets of the divorced-remarried women were similar to those of the married and never-divorced women. Taken overall, it appears that remarriage following divorce returned men and women to a similar net asset position as the married and never-divorced.
Ever-divorced older women were substantially more likely to have had superannuation than married women who had never divorced. This is a reflection of the higher employment rates of ever-divorced compared to married and never-divorced women. However, the divorce history of women makes relatively little difference to their average amount of superannuation. Divorced single women had, on average, $7,100 less superannuation than married never-divorced women.
Older divorced but single men were less likely to have superannuation than either the divorced and remarried men or the married and never-divorced men (43.6 per cent, 57.5 per cent and 57.9 per cent respectively). The divorced singles also had much lower levels of superannuation assets ($44,600) than the other groups. Divorced and remarried men had the highest amount of superannuation ($128,300), with the married and never-divorced having an average amount of superannuation of $100,000.
The differences in the levels of assets, income and employment rates between the different groups are associated with the receipt of income support payments (including the amount received). Older divorced single men had a higher rate of receipt of income support payments than the other groups of men. The income testing of the Australian age pension means that the age pension tends to offset the financial disadvantages of divorce, albeit it to a limited extent. This is evident in the HILDA data, with divorced single women and men receiving a higher average amount of income support payment than other groups.
6.3 Financial hardship and perceived prosperity
To assess the link between divorce history and subjective living standards in later life, we examine the extent to which respondents had recently experienced financial difficulties and saw themselves as prosperous or otherwise.
Older ever-divorced men were more likely than married and never-divorced men to report having experienced at least one financial hardship in the previous 12 months. Consistent with the effects of divorce on income and assets, divorced single older men were more likely to report a financial hardship than divorced and remarried men (25.6 per cent and 15.9 per cent respectively). Just 10.1 per cent of married and never-divorced men reported having experienced a financial hardship.
Divorced but remarried older women had similar levels of financial difficulties to the married never-divorced women (8.1 and 8.4 per cent respectively). Older divorced single women had the highest rates of having experienced a financial hardship (33.3 per cent).
The response to the question about how the respondent and their family was getting along financially (perceived prosperity) revealed that older divorced single men and women had the lowest levels of perceived prosperity. They were much more likely than those who were married (both ever- and never-divorced) to say that they were “just getting along”, “poor” or “very poor”. Correspondingly, the divorced singles were less likely to say that they were reasonably comfortable. For example, 61.6 per cent of older divorced single women said that they were “just getting along”, “poor” or “very poor”, compared to 28.3 per cent of the married never-divorced women, and 32.7 per cent of the divorced and remarried women.
| Men | Women | |||||
|---|---|---|---|---|---|---|
| Divorced and single | Divorced and remarried | Married and never divorced | Divorced and single | Divorced and remarried | Married and never divorced | |
| In previous 12 months | ||||||
| Experienced financial hardship | 25.6% | 15.9% | 10.1% | 33.3% | 8.1% | 8.4% |
| Perceived prosperity | ||||||
| Prosperous/very comfortable | 10.1% | 12.1% | 12.9% | 6.1% | 10.0% | 12.9% |
| Reasonably comfortable | 37.4% | 56.8% | 57.9% | 32.3% | 57.3% | 58.8% |
| Just getting along/poor/very poor | 52.6% | 31.1% | 29.2% | 61.6% | 32.7% | 28.3% |
| Number of observations | 86 | 185 | 791 | 133 | 136 | 740 |
Notes: The divorced and remarried include a small number of respondents who were cohabiting at the time of the interview. Estimates are based on weighted data. Sample sizes differ slightly from those in previous tables because of the exclusion of cases with missing information on financial hardship and perceived prosperity.
Source: HILDA, wave 2, 2002.
6.4 Multivariate analysis
As discussed, some of the differences identified in the previous section between the financial situation of the groups of men and women according to their divorce history may be attributable to other characteristics associated with each of these groups (see Table 2). In order to control for differences in the characteristics (for example, education and employment levels) of the different groups, regression (multivariate) analysis was used. A series of regression models were estimated for a range of measures of the financial circumstances analysed above.
For binary variables (receipt of a pension, owning home outright and having superannuation), a logistic model was used. For continuous variables (value of assets and equivalent income), ordinary least squares (OLS) was used. The full estimation results are provided in the appendix. The explanatory variables included were age and age squared (age squared was included to control for a possible non-linear relationship between age and financial circumstances), educational attainment, number of children, employment status and country of birth. The effects of marital history and current marital status were estimated using measures of being divorced and remarried, divorced and single, and married and never divorced. The regression models were estimated separately for men and women. The omitted category in these estimates was married and never-divorced.
These regression results were then used to calculate the effect of divorce status for a hypothetical (“base case”) older person on the variable of interest, holding constant the effects of all other variables. The resulting effects are presented in Table 6. This method of presenting the results of regression analysis is often termed “marginal effects”. The marginal effects show the effects of being divorced and single and being divorced and remarried on each measure of financial circumstances relative to being married and never divorced, holding constant the effects of the socio-economic demographic characteristics included in the statistical modelling. We have chosen the “modal” value for categorical variables and the mean for continuous variables as the base case. The base case was married and never divorced, was 63 years old, had no post-school qualification, was not employed, had three children, and was born in Australia. The base case values were the same for men and women.
| Men | Women | |||
|---|---|---|---|---|
| Divorced and single | Divorced and remarried | Divorced and single | Divorced and remarried | |
| Own house outright | –35%* | –14%* | –24%* | –11%* |
| Annual household equivalent income | –$9,000* | $6,000 | –$12,300* | –$3,400 |
| Total net assets per person in the household | –$56,000 | $19,000 | –$156,800 * | –$44,000 |
| Has superannuation | –21%* | –12%* | –6%# | –2% |
| Amount of superannuation | –$51,200* | $1,700 | –$26,700* | –$11,800 |
| Receiving any government pension or benefit, including age pension | 9%# | 3% | 17%* | 3% |
| Amount of government benefit or pension per week | $37.30* | $10.00 | $61.30* | $10.00 |
Note:* Indicates the underlying coefficient in the multivariate analysis is different from the reference group of the currently married and never-divorced at 5% significance level. # Indicates significance at the 10% level.Source: Derived from Appendix, Tables A1–A7.
An example may assist in interpreting the marginal effects. For the base case older man, being divorced and remarried was estimated to reduce the likelihood of owning a home outright by 14 percentage points compared to being married and never divorced (Table 6). Being divorced and single was estimated to reduce the likelihood of the base case man owning a home outright by 35 percentage points compared to being married and never divorced. The underlying coefficients are statistically significant.
Similarly, being divorced and single reduced the probability of the base case woman owning a home outright by 24 percentage points compared to being married and never divorced, while being divorced and remarried reduced the probability of outright home ownership by 11 percentage points. The underlying coefficients are statistically significant. The relatively large negative effect on home ownership of being divorced and single for men most probably reflects the outcomes of post-divorce property settlements and suggests that on this criterion divorce affects single men’s home ownership levels particularly severely.
Among men, the divorced singles had the lowest levels of household equivalent income. After controlling for characteristics for the base case man, being divorced and single was estimated to reduce equivalent incomes by $9,000 compared to being married and never divorced. The underlying coefficient is statistically significant. However, for men, being divorced and remarried was estimated to increase equivalent income by $6,000 compared to being married and never divorced, although the underlying coefficient is not statistically significant. This higher level of income for the remarried men, after controlling for education, workforce participation and other characteristics, is interesting and may reflect an increased incentive to catch up or recover from the financial impacts of divorce.
Once educational, employment and other characteristics were held constant, older single divorced women had a much lower level of household equivalent income than did comparable married and never-divorced women ($12,300 less). The underlying coefficient is statistically significant. For the base case older woman, the divorced and remarried had a $3,400 per annum lower equivalent income than the married and never-divorced, although the underlying coefficient is not statistically significant.
Where total net household assets per person are concerned, for women, being divorced and single had a substantial negative impact compared to being married and never divorced. For the base case woman, being divorced and single was estimated to reduce net per capita assets by $156,800 compared to being married and never divorced. Divorced and remarried women were just $44,000 worse off than their never-divorced counterparts. The underlying coefficient is not statistically significant.
For men, the effects on per capita net household assets of being divorced and single are not nearly as strong as for women and are not statistically significant. For the base case older man, being divorced and single was estimated to reduce assets by $56,000 compared to being married and never divorced (although the underlying coefficient is not statistically significant).
Divorce is strongly linked to superannuation levels, especially for men. For the base case older man, being divorced and single was estimated to reduce the probability of having superannuation by 21 per cent compared to being married and never divorced.20 For men, being divorced and single was also found to have negative effects on their amount of superannuation compared to being married and never divorced ($51,200 less). Divorced single women also did less well than married and never-divorced women. Being divorced and single was estimated to reduce the probability of having superannuation by 6 per cent for the base case compared to being married and never divorced (the underlying coefficient is significant at the 10 per cent confidence level). It was also estimated to reduce the amount of superannuation held by $26,700 compared to being married and never divorced.
Even when divorced men remarried, they were worse off than married and never-divorced men in relation to superannuation. The base case divorced but remarried man was estimated to be 12 per cent less likely to have superannuation than the married and never-divorced. However, no effect from being divorced and remarried compared to being married and never divorced was found on the amount of superannuation.
For base case men and women, being divorced and single was estimated to increase the likelihood of receiving government income support by 9 and 17 percentage points respectively compared to being married and never divorced. Being divorced and remarried for men and women had little effect on the levels of government income support compared to being married and never divorced. Similarly, the divorced and single were estimated to receive considerably higher amounts of government income support than the never-divorced group.
In summary, the multivariate analysis shows that once the different characteristics of the groups were taken into account, divorce and marital history still had a considerable impact on financial circumstances in later life. Both men and women who had divorced and remained single were consistently worse off than their married and never-divorced counterparts.
Remarriage was associated with a considerable improvement in the financial situation of both older men and women, but did not always restore their financial situation to that of married and never-divorced men and women. Remarried divorced men had a higher estimated level of home ownership than divorced singles, but a level that was still worse than married and never-divorced men. Remarried men also had lower rates of superannuation coverage. However, older divorced and remarried men had comparable levels of net household assets, similar levels of government income support and similar amounts of money in superannuation to never-divorced men.
Remarriage among divorced women was still linked with lower levels of home ownership. On most other measures, remarried divorced women had slightly poorer financial situations than married and never-divorced older women, but these differences are not statistically significant.
Although the marginal effects show the effects of divorce on financial circumstances, taking account of the effects of a range of observable socio-economic and demographic characteristics, the cross-sectional nature of the analysis means that it was not possible to interpret the results with confidence as showing the causal effects on financial circumstances of divorce. In order to identify the causal effects on financial circumstances of divorce, longitudinal data covering a significant period of time will be required. The HILDA Survey will provide this opportunity over time.
18 The measure of superannuation used in this report is individual superannuation rather than total family superannuation.
19 Among men, however, the ever-divorced had a higher mean income than the never-divorced men, suggesting some outliers in this group of ever-divorced men. Given the skewed distribution of income, we focus on the median income measure.
20 The proportion of men aged 55 to 74 years without superannuation seems relatively low given that, at the time of writing, a high proportion of employees have superannuation. While the HILDA data does not allow the reasons for the relatively low superannuation coverage in this age group to be identified, the explanation is probably related to the fact that superannuation coverage was much lower until relatively recently and so some of the men in this age group would not have been employees during the period of high coverage of superannuation. Also, some of the men may have had superannuation that by the time of the HILDA Survey had been entirely spent.
The increase in the divorce rate since the mid-1970s means that many Australians now reaching later life have been divorced. The effect of this divorce bulge is compounded by the structural ageing of the Australian population, in which the first of the baby boomers turn 60 years of age in 2006. This means that not only are larger numbers of people entering older age, but also that a much greater proportion of these people have experienced divorce at some point in their lives. The increase in the numbers of people entering older life who have been divorced is also taking place in a number of other countries.
There is very little empirical evidence in Australia of the financial consequences of divorce in older age. This report uses data from an Australian longitudinal survey (HILDA) to provide some of the first estimates of the financial consequences of divorce for Australians aged 55 to 74 years.
The analysis in this report demonstrates that, on average, having been divorced has negative consequences for income in older age. However, the negative financial impacts of divorce are substantially reduced by remarriage. For some measures of financial circumstances, the divorced and remarried are very similar to the married and never-divorced.
A challenge that needs to be addressed when estimating the effects of divorce on living standards is that those who divorce may have systematically different characteristics that are related to both the probability of divorce and income-earning capacity. Similarly, whether or not a person remarries following divorce may be related to factors that influence earning capacity (such as education level). While the analysis in this report does go some way towards controlling for possible selection effects to explain differences in characteristics according to marital history, it is unlikely that the characteristics that are available from the HILDA Survey capture all of the relevant characteristics. Therefore the possibility that selection effects explain the differences in financial and income situation according to marital status cannot be discounted.
An implication of the results of this report is that older Australians who have been divorced and are single in older age will have lower incomes and fewer assets than they would have had if they had remained married. Older divorced single Australians are much more likely to experience material hardships and report having a lower level of prosperity than the married and never-divorced. The divorced and single are more reliant on the public pension than those who do not divorce, and this will have important implications for the financing of retirement incomes in Australia in coming decades and the extent to which the taxpayer will have to bear the costs of providing for retirement incomes.
While the Australian age pension system offsets some of the financial disadvantages faced by divorced older people who are single, the lower level of financial living standards experienced by those who have been divorced could be reduced by encouraging greater levels of labour force participation prior to retirement age among divorced women, assisting in obtaining further education or retraining following divorce, and delaying retirement. However, increased labour market earnings alone will almost certainly not completely offset the negative financial consequences of divorce for older people. The best way to offset the financial consequence of divorce for retirement living standards will almost certainly continue to be to remarry.
- Aaron, H. (1992). The economics and politics of pensions: Evaluating the choices. In E. Duskin (Ed.), Private pensions and public policy. Paris: OECD.
- Australian Bureau of Statistics. (2002). Sources of income: Employee superannuation (Australian Social Trends Cat. No. 4102.0). Canberra: Author.
- Australian Bureau of Statistics. (2004). Divorces, Australia, 2004 (Cat. No. 3307.0.55.001). Canberra: Author.
- Birrell, B., & Rapson, V. (1998). A not so perfect match: The growing male/female divide, 1986–1996. Clayton: Centre for Population and Urban Research, Monash University.
- Bradshaw, J. (2003, July). How has the notion of social exclusion developed in the European discourse? Paper presented at the Australian Social Policy Conference, University of New South Wales, Sydney.
- Davies, H., Joshi, H., Rake, K., & Alami, R. (2000). Partnership and partnership breakdown. In K. Rake (Ed.), Women’s incomes over the lifetime. London: The Stationery Office.
- Dewar, J., Sheehan, G., & Hughes, J. (1999). Superannuation and divorce in Australia (Working Paper No. 18). Melbourne: Australian Institute of Family Studies.
- Dolan, A., McLean, P., & Roland, D. (2005, February). Home equity, retirement incomes and family relationships. Paper presented to the 9th Australian Institute of Family Studies Conference, Families Matter, Melbourne.
- Funder, K., Harrison, M., & Weston, R. (1993). Settling down: Pathways of parents after divorce. Melbourne: Australian Institute of Family Studies.
- Hutton, S., & Whiteford, P. (1992). Women and social security in retirement: A comparative analysis (Luxembourg Income Study Working Paper No. 82). Syracuse, NY: Center for Policy Research, Syracuse University.
- Jarvis, S., & Jenkins, S. (1997), Marital splits and income changes: Evidence for Britain (Innocenti Occasional Paper No. 60). Florence, Italy: UNICEF International Child Development Centre.
- Jefferson, T., & Preston, A. (2005). Australia’s “other” gender wage gap: Baby boomers and compulsory superannuation accounts. Feminist Economics, 11(2), 79–101.
- Kelly, S., & Harding, A. (2005). Love can hurt, divorce will cost: Financial impact of divorce in Australia (AMP.NATSEM Income and Wealth Report Issue 10). Sydney: AMP.
- Kelly, S., Percival, R., & Harding, A. (2002). Women and superannuation in the 21st century: Poverty or plenty? In A. Eardley & B. Bradbury (Eds.), Competing visions: Proceedings of the National Social Policy Conference, Sydney, 4–6 July 2001 (SPRC Report 1/02, pp. 223–247). Sydney: Social Policy Research Centre, University of New South Wales.
- Mayer, S., & Jencks, C. (1989). Poverty and the distribution of material hardship. Journal of Human Resources, 24(1), 88–114.
- McDonald, P. (Ed.). (1986). Settling up: Income and property distribution in Australia. Sydney: Prentice-Hall.
- Perry, A., Douglas, G., Murch, M., Bader, K., & Borkowski, M. (2000). How parents cope financially on marriage breakdown. York, UK: Family Policy Studies Centre in association with Joseph Rowntree Foundation.
- Pulkingham, J. (1995). Investigating the financial circumstances of separated and divorced parents: Implications for family law reform. Canadian Public Policy, 21(1), 1–19.
- Saunders, P. (2003). Can social exclusion provide a new framework for measuring poverty? (Discussion paper No. 127). Sydney: Social Policy Research Centre, University of New South Wales.
- Sheehan, G., & Hughes, J. (2001). Division of matrimonial property in Australia (Research Paper No. 25). Melbourne: Australian Institute of Family Studies.
- Smock, P., Manning, W., & Gupta, S. (1999). The effect of marriage and divorce on women’s economic well-being. American Sociological Review, 64(6), 794–812.
- Smyth, B., & Weston, R. (2000). Financial living standards after divorce: A recent snapshot (Research Paper No. 23). Melbourne: Australian Institute of Family Studies.
- Tinnion, J., & Rothman, G. (1999, July). Retirement income adequacy and the emerging superannuation system: New estimates. Paper presented to the Seventh Colloquium of Superannuation Researchers, University of Melbourne (Conference Paper 99/2).
- Travers, P., & Richardson, S. (1993). Living decently: Material well-being in Australia. Melbourne: Oxford University Press.
- Watson, N., & Wooden, M. (2004). Assessing the quality of the HILDA Survey wave 2 data (HILDA Project Technical Paper Series 5/04). Melbourne: Melbourne Institute of Applied Economic and Social Policy, University of Melbourne.
- Whiteford, P., & Stanton, D. (2002, June). Targeting, adequacy and incentives: Assessing the Australian system of retirement incomes. Paper presented to the 9th International Research Seminar on Issues in Social Security, Seminar on Pension Reform, Foundation for International Studies on Social Security and Swedish Federation of Social Insurance Offices, Sigtuna, Sweden.
- World Bank. (1994). Averting the old age crisis: Policies to protect the old and promote growth. Oxford: Oxford University Press.
Figure A1: Age-specific divorce rates, Australian males, 1981-2001
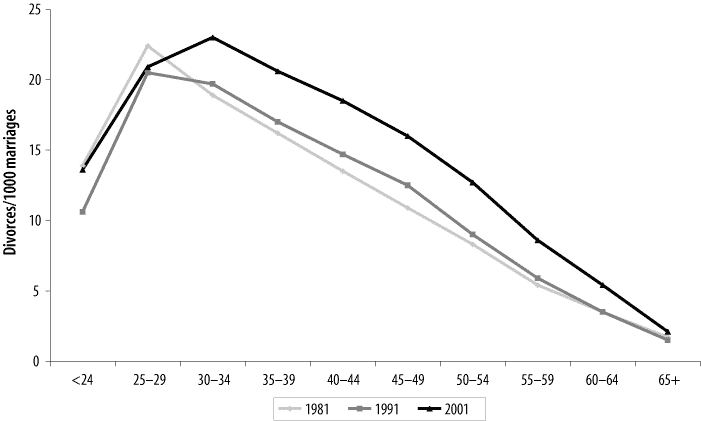
Source: Australian Bureau of Statistics (2004).
| Men Coefficient | Women Coefficient | |
|---|---|---|
| Current marital status | ||
| Divorced and remarried | -0.729 (p<0.001 ) | -0.550 (p<0.1) |
| Divorced and single | -1.599 (p<0.001 ) | -1.149 (p<0.001 ) |
| Widowed and never divorced | - | -0.121 |
| (Married and never divorced) | - | - |
| Age a | 0.088 (p<0.1) | 0.067 (p<0.01) |
| Age squared | -0.005 | -0.007 (p<0.01) |
| Educational qualification | ||
| Degree or higher | 0.161 | 0.033 |
| Some post-school qualification | 0.292 (p<0.1) | 0.143 |
| (No post-school qualification) | ||
| Employed | -0.235 | -0.079 |
| Number of children | -0.132 (p<0.1) | -0.199 (p<0.001 ) |
| Country of birth | ||
| Other mainly English-speaking countries | -0.226 | -0.015 |
| Non-English speaking countries | -0.609 (p<0.01) | -0.499 |
| (Australia) | ||
| Intercept | 1.803 (p<0.001 ) | 1.967 (p<0.001 ) |
| Chi-square | 107.48 (p<0.001 ) | 70.43 (p<0.001 ) |
| Number of observations | 1152 | 1290 |
Note: For binary explanatory variables, the omitted (reference) category is in brackets.
a - age is centred at 63.
Source: HILDA, wave 2, 2002.
| Men Coefficient | Women Coefficient | |
| Current marital status | ||
| Divorced and remarried | 0.182 | 0.154 |
| Divorced and single | 0.507 (p<0.1) | 1.242 (p<0.001 ) |
| Widowed and never divorced | 0.968 (p<0.001 ) | |
| (Married and never divorced) | ||
| Age a | 0.121 (p<0.001 ) | 0.140 (p<0.001 ) |
| Age squared | 0.005 | -0.007 (p<0.1) |
| Educational qualification | ||
| Degree or higher | -1.530 (p<0.001 ) | -1.162 (p<0.001 ) |
| Some post-school qualification | -0.279 | -0.677 (p<0.001 ) |
| (No post-school qualification) | ||
| Employed | -2.684 (p<0.001 ) | -2.104 (p<0.001 ) |
| Number of children | 0.026 | 0.145 (p<0.01) |
| Country of birth | ||
| Other mainly English-speaking countries | 0.080 | 0.308 |
| Non-English speaking countries | 0.408 | 0.593 (p<0.1) |
| (Australia) | ||
| Intercept | 0.750 (p<0.001 ) | 0.560 (p<0.01) |
| Chi-square | 266.86 (p<0.001 ) | 286.58 (p<0.001 ) |
| Number of observations | 1152 | 1290 |
Notes: For binary explanatory variables, the omitted (reference) category is in bracket.
a - age is centred at 63.
Source: HILDA, wave 2, 2002.
| Men Coefficient | Women Coefficient | |
|---|---|---|
| Current marital status | ||
| Divorced and remarried | -0.481 (p<0.1) | -0.144 |
| Divorced and single | -0.852 (p<0.01) | -0.377 (p<0.1) |
| Widowed and never divorced | 0.112 | |
| (Married and never divorced) | ||
| Age a | -0.100 (p<0.001) | -0.127 (p<0.001) |
| Age squared | -0.004 | -0.005 |
| Education | ||
| Degree or higher | 0.990 (p<0.001) | 1.111 (p<0.001) |
| Some post-school qualification | 0.320 (p<0.1) | 0.709 (p<0.001) |
| (No post-school qualification) | ||
| Employed | 1.569 (p<0.001) | 2.280 (p<0.001) |
| Number of children | -0.135 (p<0.01) | -0.121 (p<0.1) |
| Country of birth | ||
| Other mainly English-speaking countries | -0.310 | 0.080 |
| Non-English speaking countries | -1.089 (p<0.001) | -0.692 (p<0.1) |
| (Australia) | ||
| Intercept | 0.476 (p<0.1) | -0.727 (p<0.001) |
| Chi-square | 216.2 (p<0.001) | 289.1 (p<0.001) |
| Number of observations | 1152 | 1290 |
Notes: For binary explanatory variables, the omitted (reference) category is in bracket. a age is centred at 63.
Source: HILDA, wave 2, 2002.
| Men Coefficient | Women Coefficient | |
|---|---|---|
| Current marital status | ||
| Divorced and remarried | 5.98 | -3.41 |
| Divorced and single | -8.98 (p<0.01) | -12.34 (p<0.001) |
| Widowed and never divorced | - | -3.38 |
| (Married and never divorced) | ||
| Age a | -1.02 (p<0.001) | -1.13 (p<0.001) |
| Age squared | 0.03 (p<0.1) | 0.08 (p<0.01) |
| Education | ||
| Degree or higher | 14.50 (p<0.001) | 13.17 (p<0.001) |
| Some post-school qualification | 0.30 | 6.96 (p<0.01) |
| (No post-school qualification) | ||
| Employed | 15.59 (p<0.001) | 13.30 (p<0.001) |
| Number of children | -1.43 (p<0.1) | -0.82 |
| Country of birth | ||
| Other mainly English-speaking countries | 0.58 | -1.66 |
| Non-English speaking countries | -5.66 (p<0.1) | -3.41 |
| (Australia) | ||
| Intercept | 30.2 (p<0.001) | 27.3 (p<0.001) |
| R-squared | 0.131 | 0.129 |
| Number of observations | 1152 | 1290 |
Notes: For binary explanatory variables, the omitted (reference) category is in bracket. a age is centred at 63.
Source: HILDA, wave 2, 2002.
| Men Coefficient | Women Coefficient | |
|---|---|---|
| Marital status | ||
| Divorced and remarried | 19.00 | -44.45 |
| Divorced and single | -56.20 | -156.77 (p<0.001) |
| Widowed and never divorced (Married and never divorced) | 35.60 | |
| Age a | 0.05 (p<0.001) | 2.16 |
| Age squared | 0.00 (p<0.001) | -0.51 |
| Education | ||
| Degree or higher | 307.44 (p<0.001) | 212.46 (p<0.001) |
| Some post-school qualification (No post-school qualification) | 76.93 (p<0.001) | 104.24 (p<0.001) |
| Employed | 112.63 (p<0.001) | 119.02 (p<0.01) |
| Number of children | -24.28 (p<0.001) | -27.93 (p<0.001) |
| Country of birth | ||
| Other mainly English-speaking countries | -21.53 | -50.96 (p<0.1) |
| Non-English speaking countries (Australia) | -120.68 (p<0.001) | -53.78 |
| Intercept | 330.63 (p<0.001) | 363.15 (p<0.001) |
| R-squared | 0.122 | 0.07 |
| Number of observations | 1152 | 1290 |
Notes: For binary explanatory variables, the omitted (reference) category is in bracket. a age is centred at 63.
Source: HILDA, wave 2, 2002.
| Men Coefficient | Women Coefficient | |
|---|---|---|
| Current marital status | ||
| Divorced and remarried | 9.85 | 10.25 |
| Divorced and single | 37.30 (p<0.001) | 61.33 (p<0.001) |
| Widowed and never divorced | 54.98 (p<0.001) | |
| (Married and never divorced) | ||
| Age a | 1.46 (p<0.1) | 4.26 (p<0.001) |
| Age squared | 0.37 (p<0.001) | -0.06 |
| Education | ||
| Degree or higher | -40.74 (p<0.001) | -37.76 (p<0.001) |
| Some post-school qualification | -13.36 (p<0.1) | -25.14 (p<0.001) |
| (No post-school qualification) | ||
| Employed | -98.74 (p<0.001) | -78.03 (p<0.001) |
| Number of children | 0.78 | 6.09 (p<0.001) |
| Country of birth | ||
| Other mainly English-speaking countries | -4.37 | 11.63 |
| Non-English speaking countries | 2.40 | 23.08 (p<0.001) |
| (Australia) | ||
| Intercept | 113.95 (p<0.001) | 90.82 (p<0.001) |
| R-squared | 0.353 | 0.403 |
| Number of observations | 1152 | 1290 |
Notes: For binary explanatory variables, the omitted (reference) category is in bracket. a age is centred at 63.
Source: HILDA Wave 2, 2002.
| Men Coefficient | Women Coefficient | |
|---|---|---|
| Current marital status | ||
| Divorced and remarried | 1.72 | -11.76 |
| Divorced and single | -51.22 (p<0.001) | -26.72 (p<0.01) |
| Widowed and never divorced | -15.54 (p<0.1) | |
| (Married and never divorced) | ||
| Age a | -3.73 (p<0.001) | -0.17 |
| Age squared | -0.32 (p<0.1) | -0.27 (p<0.1) |
| Education | ||
| Degree or higher | 172.06 (p<0.001) | 56.24 (p<0.001) |
| Some post-school qualification | 34.03 (p<0.001) | 20.58 (p<0.1) |
| (No post-school qualification) | ||
| Employed | 31.09 (p<0.1) | 30.33 (p<0.1) |
| Number of children | -5.74 (p<0.1) | -3.13 (p<0.1) |
| Country of birth | ||
| Other mainly English-speaking countries | -32.71 (p<0.001) | -3.27 |
| Non-English speaking countries | -81.63 (p<0.001) | -11.31 |
| (Australia) | ||
| Intercept | 104.41 (p<0.001) | 48.56 (p<0.001) |
| R-squared | 0.147 | 0.061 |
| Number of observations | 1152 | 1290 |
Notes: For binary explanatory variables, the omitted (reference) category is in bracket. a age is centred at 63.
Source: HILDA Wave 2, 2002.
List of tables
- Table 1. Payment rates of the Australian age pension system, September 2006
- Table 2. Selected characteristics by marital status and gender, aged 55–74 years, Australia, 2002
- Table 3. Financial circumstances by marital history and gender, aged 55–74 years, Australia, 2002
- Table 4. Financial situation by detailed marital history and gender, aged 55–74 years, Australia, 2002
- Table 5. Financial hardship and perceived prosperity by detailed marital history and gender, aged 55–74 years, Australia, 2002
- Table 6. Effects of divorce on financial assets, and marginal effects on various financial measures by gender, aged 55–74 years, Australia, 2002
- Table A1. Determinants of probability of owning house outright, logit model
- Table A2. Determinants of receiving an income support payment, logit model
- Table A3. Determinants of having superannuation, logit model
- Table A4. Determinants of equivalent household income ($‘000), ordinary least squares
- Table A5. Determinants of per capita net household wealth ($‘000), ordinary least squares
- Table A6. Determinants of amount of government pension/benefits per week, ordinary least squares
- Table A7. Determinants of amount of superannuation ($‘000), ordinary least squares
List of figures
de Vaus, D., Gray, M., Qu, L., & Stanton, D. (2007). The consequences of divorce for financial living standards in later life (Research Paper No. 38). Melbourne: Australian Institute of Family Studies.
978 0 642 39546 7