Families Then & Now: Couple relationships
July 2020
Download Research report
Overview

Many changes have occurred in Australia since the establishment of the Australian Institute of Family Studies in 1980. This snapshot presents some changes in relation to couple relationships.
Key trends
The trends in couple relationships
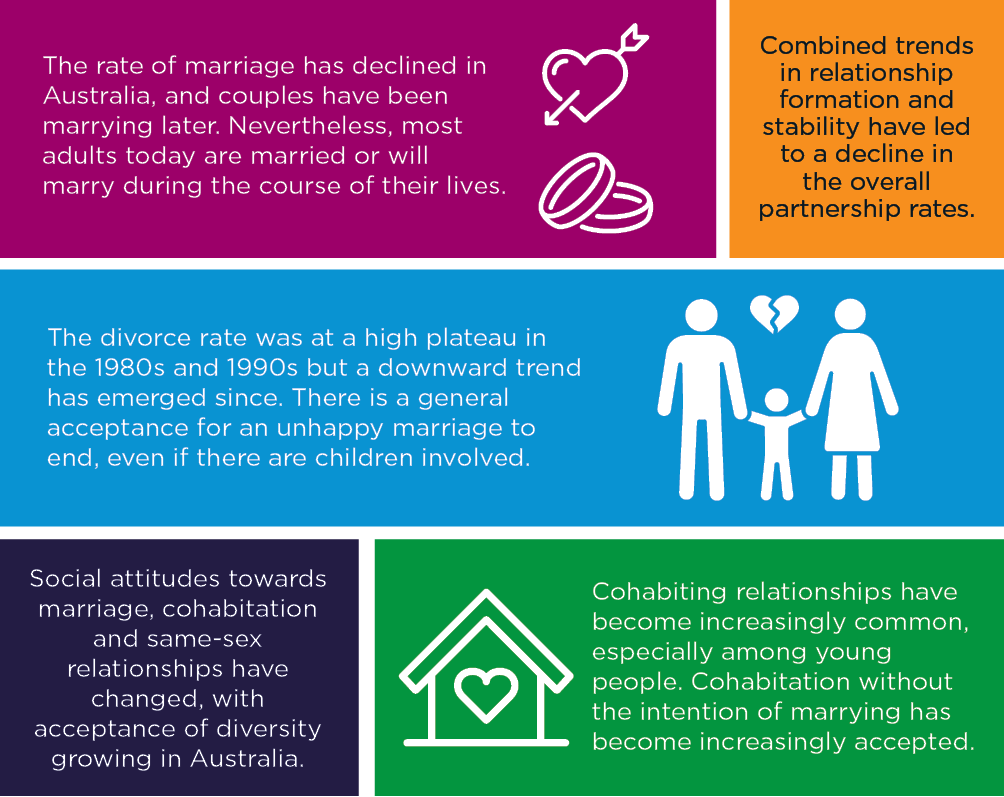
Fall in marriage
The overall trend for the number of marriages that were registered each year increased from the beginning of the 20th century until the early 1970s (even though there were decreases across some years, especially between 1920 and 1931, and between 1942 and 1945), and since then fluctuated (Figure 1). During the period of 2000-13, the number of marriages registered each year has mostly increased, with some fluctuation, from 113,429 in 2000, with the number being 119,188 in 2018.1
The crude marriage rate is a measure of marriage across the total population and is based on the number of marriages registered during a calendar year per 1,000 people in the population.
- The last three decades of the 20th century generally saw a progressive decrease in the rate.
- The rate remained fairly stable in the first decade of the new millennium but showed a downward trend in the last decade.
Figure 1: Number of marriages and crude marriage rate, 1901-2018
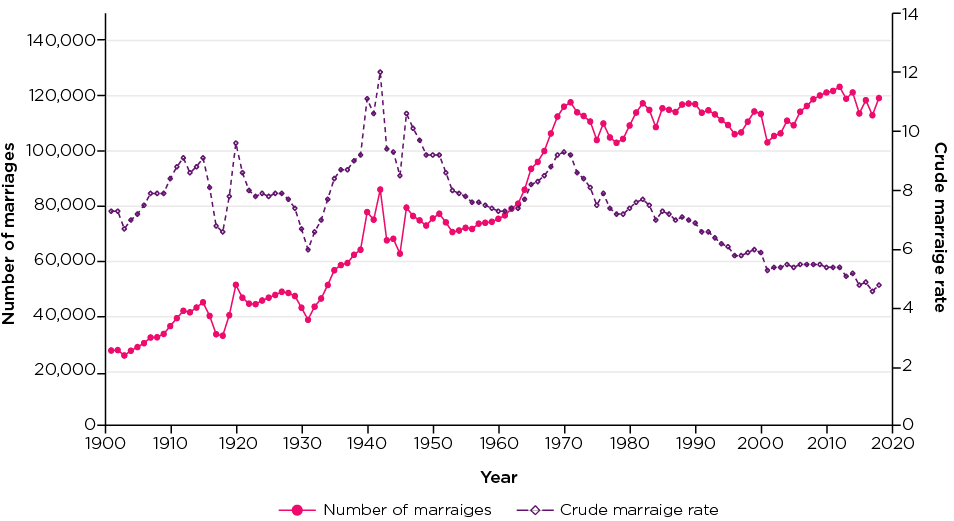
Note: Crude marriage rate = number of marriages per 1,000 of estimated resident population at June for each reference year.
Sources: Australian Bureau of Statistics (ABS) (various years) Marriages and divorces Australia (Cat. No. 3310.0)
Credit: Australian Institute of Family Studies 2020
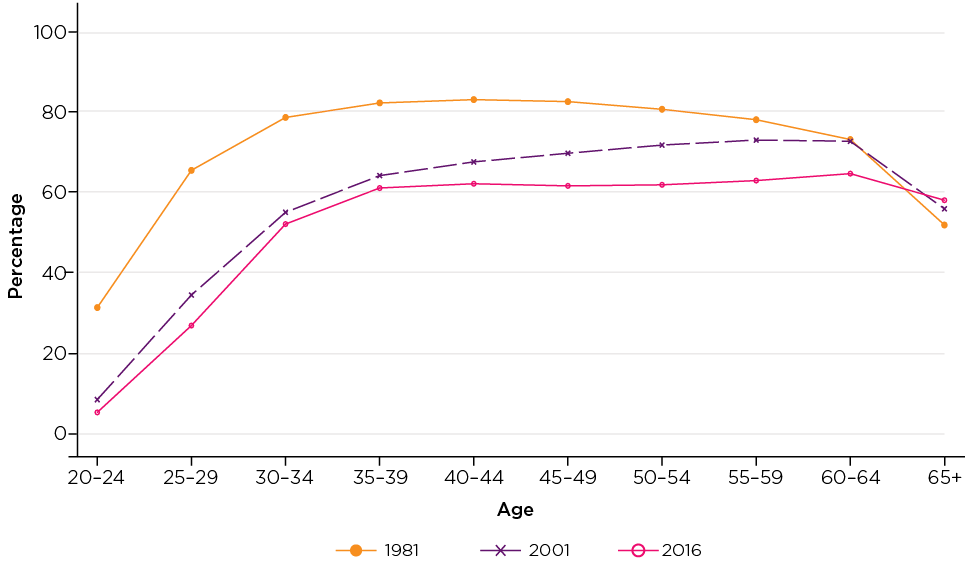
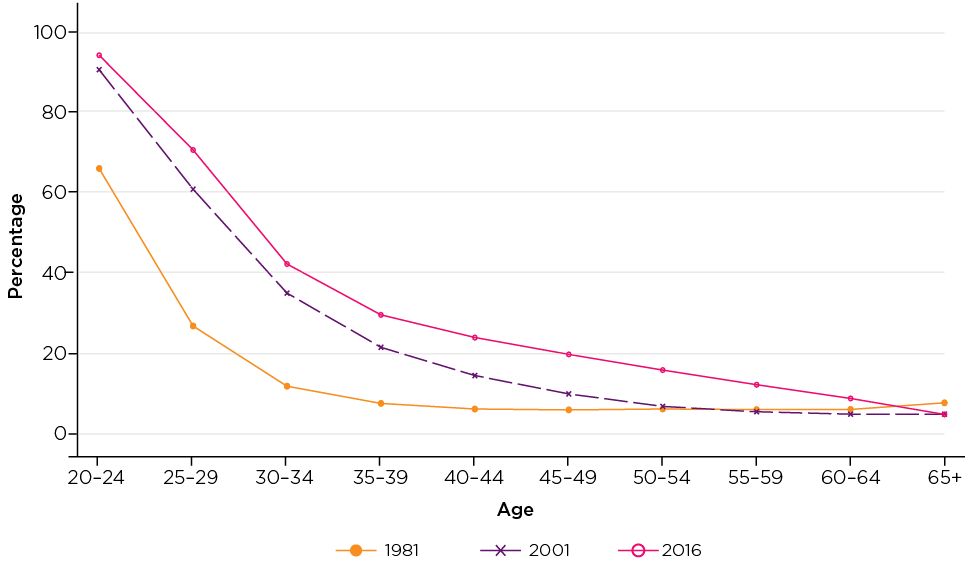
The decline in the marriage rate is evident in Figures 2 and 3, which show the proportions of persons who were married and who never married by age in the selected three census years of 1981, 2001 and 2016.
- The proportion of people who were married had declined and the proportion of never married had increased across all age groups except the oldest age group (65+ years) from 1981 to 2016.
- These patterns became less apparent with increasing age.
- For the age groups under 50 years, the decline in being married and rise in never married were greater for the period of 1981-2001 than they were for the period of 2001-16.
- For the age groups above 50 years, the decline in being married and rise in never married was more apparent for the recent period of 2001-16 than the earlier period.
Figure 2: Proportion of persons who were married by age, 1981, 2001 and 2016
Sources: ABS (1988) 1986 Census household sample file (1%) - Confidentialised Unit Record File; ABS (2012) Census of Population and Housing, Time Series Profile: T04 (Cat. no. 2003.0); ABS (2017) 2016 Census of population and housing - Basic Community Profile (Cat no. 2001.0).
Credit: Australian Institute of Family Studies 2020
Figure 3: Proportion of persons who were never married by age, 1981, 2001 and 2016
Sources: Australian Bureau of Statistics (ABS) (1988) 1986 Census household sample file (1%) - Confidentialised Unit Record File; ABS (2012) Census of Population and Housing, Time Series Profile: T04 (Cat. no. 2003.0); ABS (2017) 2016 Census of population and housing - Basic Community Profile (Cat no. 2001.0).
Credit: Australian Institute of Family Studies 2020
Entering first marriage at later ages
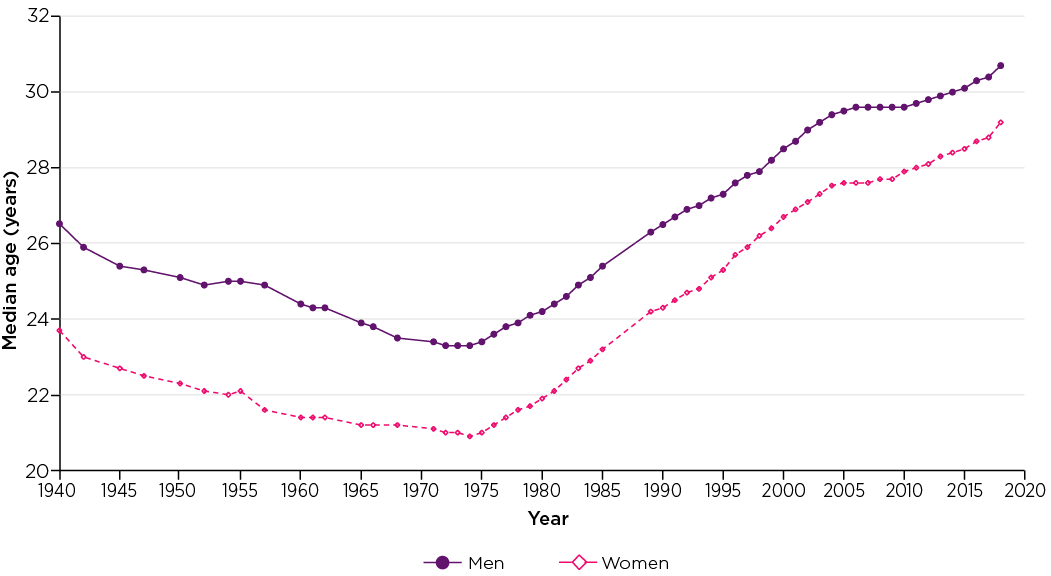
The age at getting married is one of the many factors affecting the crude marriage rate. Figure 4 shows the median age of men and women at first marriage, from 1970 to 2018.
- Since the mid 1970s, the median age at first marriage increased for both men and women.
- The rise in median age at first marriage for men and women appeared to pause between 2006 and 2010, and has resumed its rising pattern since then, but at a slower pace compared to the decades before the new millennium. In 2018, the median age at first marriage was 30.7 and 29.2 years for men and women respectively.
- It is also worth noting that the gap in median age at first marriage between men and women has narrowed from 2.3 years in 1980, to 1.8 in 2000 and 1.5 years since 2018.
Figure 4: Median age at first entering marriage, 1940-2018
Sources: ABS (various years). Marriages Australia (Cat. no. 3306.0); ABS (1997) Australian social trends (Cat. no. 4102.0); ABS Unpublished data.
Credit: Australian Institute of Family Studies 2020
Fall in church weddings
There has been a significant shift in the choice of celebrant for marriage ceremonies over the final decades of the 20th century and into the 21st century. An increasing number of couples have turned to a civil celebrant to conduct their marriage ceremony rather than a minister of religion, shown in Figure 5.
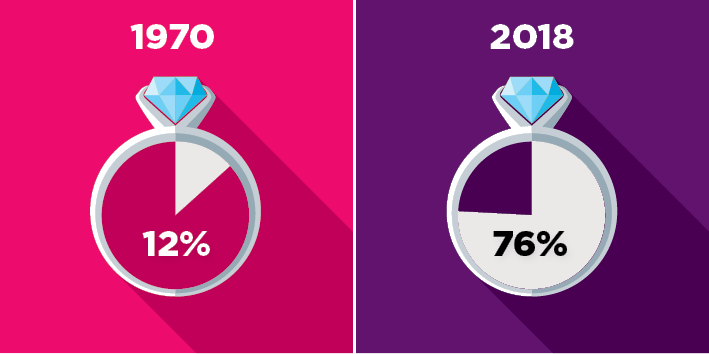
- In 1970, ministers of religion performed 88% of marriages, while marriages conducted by civil celebrants accounted for 12%. Since then the number of marriages performed by civil celebrants has surged dramatically.
- In 1980, 36% of marriages were performed by civil celebrants. By 2018, 80% of marriages were conducted by civil celebrants (76%) while one-fifth were conducted by ministers of religion (Figure 6).
Figure 5: Marriage celebrants, 1902-2018

Sources: ABS (various years) Marriages and divorces Australia (Cat. no. 3310.0); Commonwealth Bureau of Census and Statistics (various years) Australian demography bulletin (ABS Cat. no. 3140.0)
Credit: Australian Institute of Family Studies 2020
Figure 6: Marriages performed by civil celebrants, 1970 and 2018
Sources: ABS (various years) Marriages and divorces Australia (Cat. no. 3310.0); Commonwealth Bureau of Census and Statistics (various years) Australian demography bulletin (ABS Cat. no. 3140.0)
Credit: Australian Institute of Family Studies 2020
Rise and fall in divorce
The trends in the number of divorces and crude divorce rate since the beginning of the 20th century are depicted in Figure 7. Prior to World War II, divorce was rare, while becoming more common in the 1960s and 1970s. The Federal Government introduced the Family Law Act 1975 in 1976, which removed 'fault-based' grounds for divorce and allowed a divorce on only one ground - irretrievable breakdown - as evidenced by at least 12 months of separation.
- The crude divorce rate rose rapidly to a peak of 4.6 in 1976, mainly due to the formalisation of some long-term separations and some divorces filed previous years being brought forward and finalised.
- The crude divorce rate was 2.7 in 1980, and showed an upward trend after reaching a trough.
- Since the turn of the new millennium, the crude divorce rate declined progressively and it was 2.0 in 2018.
Figure 7: Number of divorces and crude divorce rate, 1901-2018
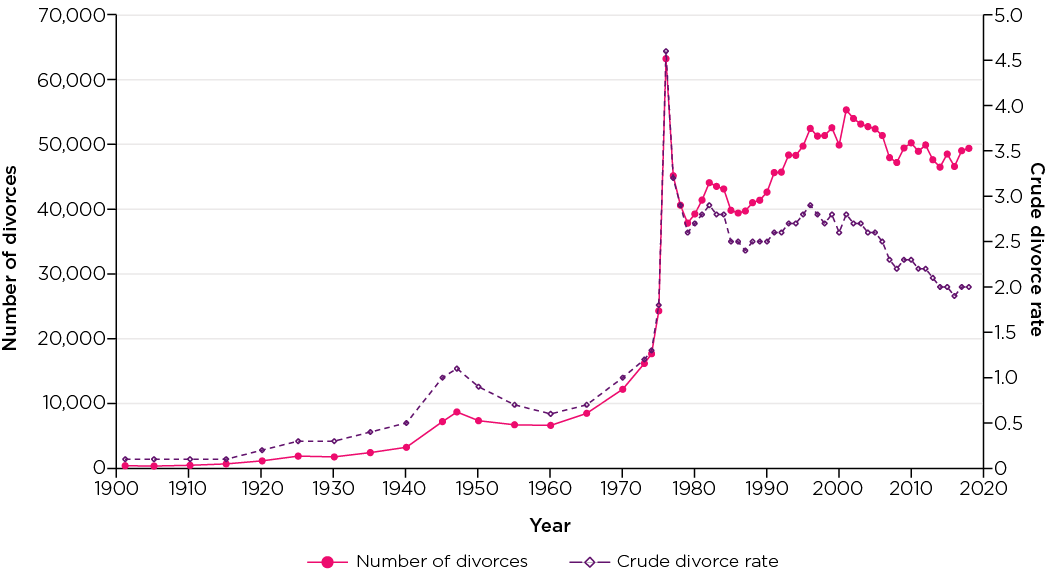
Note: Crude divorce rate is the number of divorces per 1,000 of estimated resident population at June for each reference year.
Sources: ABS (various years) Marriages and divorces Australia (Cat. no. 3310.0); ABS (various years). Divorces Australia (Cat. no. 3307.0, 3307.0.55.001).
Credit: Australian Institute of Family Studies 2020
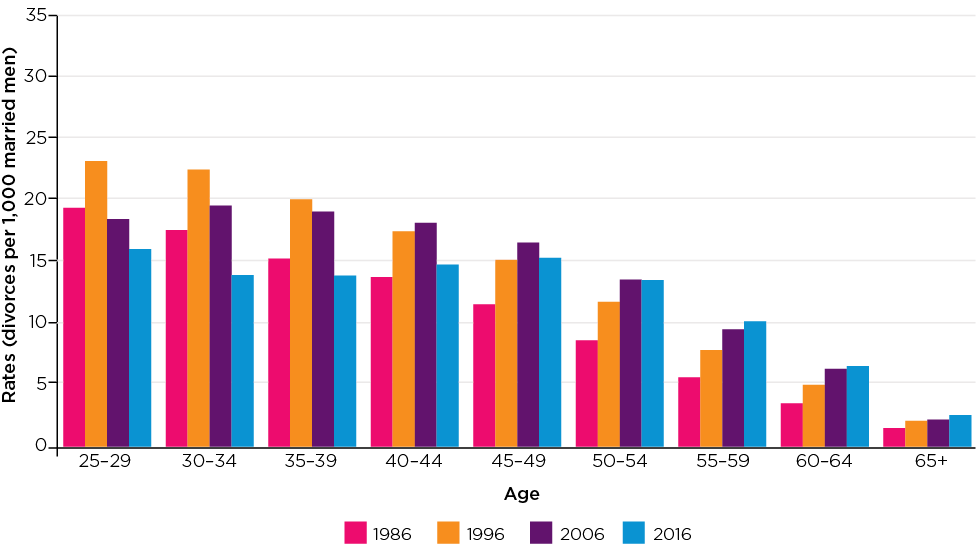
Figures 8 and 9 show more detailed patterns of divorce - the rates of divorce for specific age groups for married men and women, from 1986 to 2016.
- Age-specific divorce rates increased between 1986 and 2016, across all age groups of both men and women.
- Since 1996 the trends in divorce rates differed between younger and older age groups:
- falling for men under 45 years and women under 40 years
- increasing for men aged 50 years and older and women aged 45 years and older.
Figure 8: Age-specific divorce rates, men, 1986 and 2016
Source: ABS (2019) Marriages and divorces Australia 2018 (Cat. no. 3310.0)
Credit: Australian Institute of Family Studies 2020
Figure 9: Age-specific divorce rates, women, 1986-2016
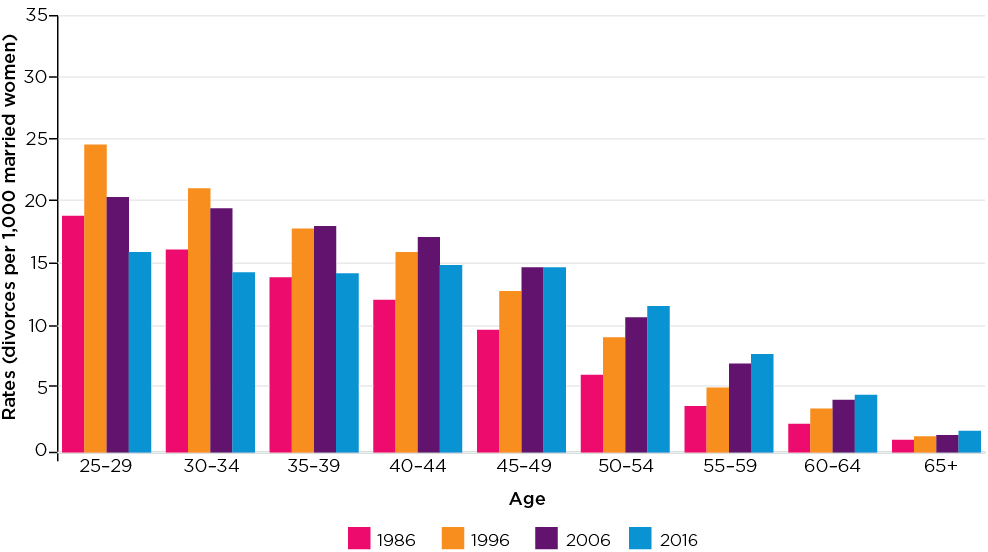
Source: ABS (2019) Marriages and divorces Australia 2018 (Cat. no. 3310.0)
Credit: Australian Institute of Family Studies 2020
The trends in divorce discussed above apply only to married couples and do not capture the extent to which people in cohabiting relationships separate over time. Research indicates that cohabitation relationships are more likely than marriages to end in separation, particularly when cohabitating couples have not otherwise gone on to marry (Hewitt & Baxter, 2015; Qu, Weston, & de Vaus, 2009).
Rise in cohabitation
While the marriage rate has declined, the cohabitation rate has increased.
- In 1986, 6% of all couples were cohabiting.
- The proportion has steadily increased across the census years. It was 12% in 2001 and 18% in 2016.
The rise in cohabitation is also evident in the extent of pre-marital cohabitation shown in Figure 10. The proportion of marriages that were preceded by cohabitation has increased since the mid 1970s.
- Sixteen per cent of marriages in 1975 were preceded by cohabitation. The proportion was 81% in 2017, and the rate appears to have been stable at around 80% in the last few years.2
Figure 10: Percentage of marriages preceded by cohabitation, 1980-2017
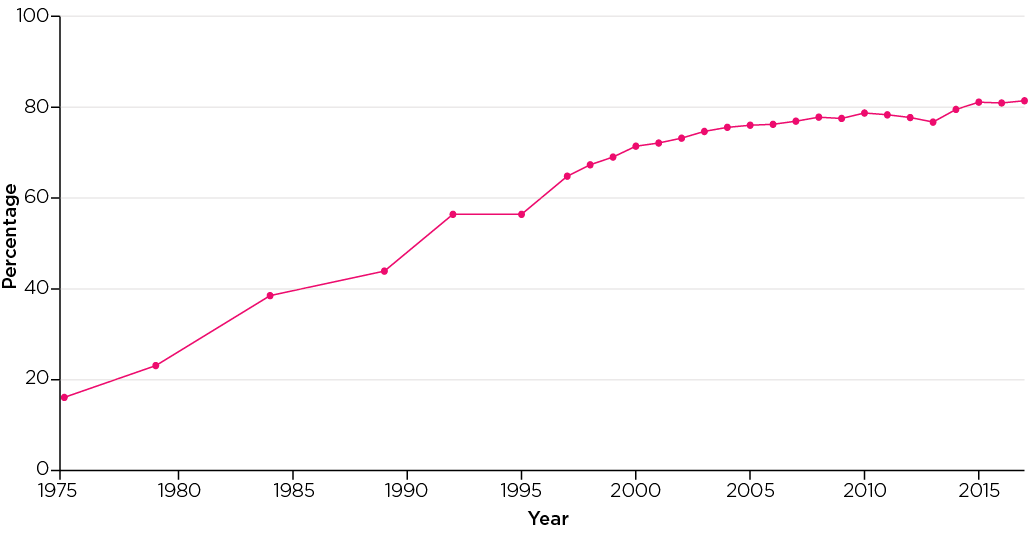
Note: ABS noted that Victorian data on premarital cohabitation for 2012 and 2013 were calculated from a weighted sample. Because of this, care should be taken in interpreting premarital cohabitation trends (ABS, 2014).
Source: ABS (various years) Marriages and divorces Australia 2016 (Cat. no. 3310.0)
Credit: Australian Institute of Family Studies 2020
Cohabiting relationships are more common among younger people than older people as shown in Figure 11.
- In 2016, the majority of people under 25 years living with a partner were cohabiting, while the majority of those over 25 years who lived with a partner were married to their partner.
- Across all age groups, the proportions of partnered persons who were cohabiting rather than married increased across the three time periods.
- Between 1986 and 2001, the increases were apparent for the younger age groups, especially those in their early and late 20s, and diminished with increasing age.
- Between 2001 and 2016, the increases were similar across all the age groups.
Figure 11: Proportion of people living with a partner who were in a cohabiting relationship, 1986, 2001 and 2016
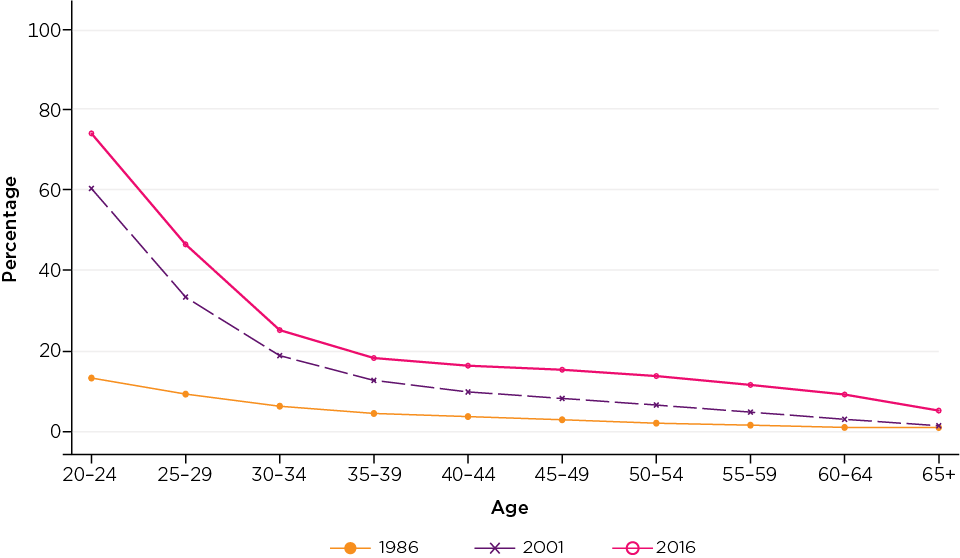
Sources: ABS (1988) 1986 Census household sample file (1%) - Confidentialised Unit Record File; ABS (2003) 2001 Census of Population and Housing, Time Series Profile: T04 ((Cat.no. 2003.0); ABS (2018b) 2016 Census of population and housing, TableBuilder.
Credit: Australian Institute of Family Studies 2020
Fewer living with a partner
The proportions of men and women living with a partner by age has changed across three selected census years (1986, 2001 and 2016, shown in Figure 12).
- The proportion of persons who were living with a partner has declined since 1981 across all age groups.
- The fall was particularly marked for the age groups under 30 years.
- Between 1986 and 2001, the fall in the rate of partnership was more apparent for younger age groups.
- Between 2001 and 2016, the rate of partnership fell slightly for the age groups under 40, but the fall was greater for the older age groups, except those 65 years and older.
- For people aged 65 years and older, the partnership rate increased during the period 2001-16, which is partly attributed to the narrowing gap in the life expectancies between men and women.
Figure 12: Proportion of people who were living with a partner by age, 1986, 2001 and 2016
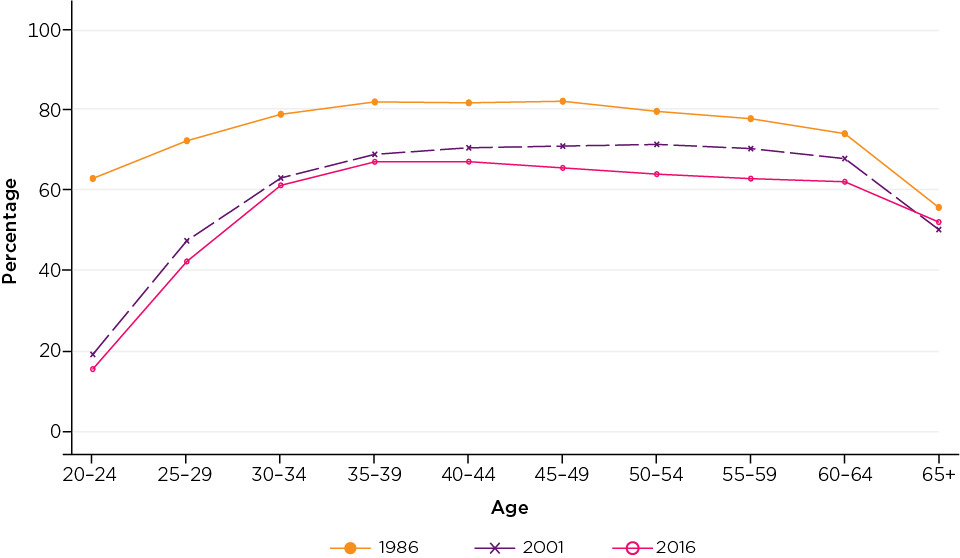
Note: Total includes persons in 'Visitors only' and 'Other non-classifiable' households, 'Non-private dwellings', and 'Migratory, off-shore and shipping', and excludes overseas visitors.
Sources: ABS (1988) 1986 Census household sample file (1%) - Confidentialised Unit Record File; ABS (2003) 2001 Census of Population and Housing, Time Series Profile: T04 ((Cat.no. 2003.0); ABS (2018b) 2016 Census of population and housing, TableBuilder.
Credit: Australian Institute of Family Studies 2020
Marriage is not outdated
As discussed above, the trends relating to marriage indicate the crude marriage rate had fallen since the 1970s and had a downward trend again from 2010, whereas cohabitation has been on the rise during that time. Consistent with this, there have also been changes in attitudes towards marriage and cohabitation.
Figure 13 shows attitudes towards marriage using the extent to which people agreed with four statements about marriage in 2005 and 2015 based on data from the Household, Income and Labour Dynamics in Australia (HILDA) Survey. Over this time:
- A large majority of people rejected the notion 'marriage is an outdated institution'. In other words, most people endorse the concept of marriage.
- In 2015, two-thirds disagreed with the statement, less than one-fifth (17%) held the opposite view.
- Compared to 2005, there was slight decline in support for marriage as an institution.
- The proportion of people who agreed 'marriage is a lifetime relationship' decreased.
- 54% of people agreed with the statement in 2005, then the proportion fell to 43% a decade later.
- Most people agreed with cohabitation 'even if they have no intention of marrying', and this view had become more prevalent in 2015 than it was in 2005 (75% vs 66%).
- Most people supported that 'it was alright for an unhappy married couple to divorce even if they have children' in both years, especially in 2015.
Figure 13: Attitudes towards marriage, percentage in agreement/disagreement with each of four statements, 2005 and 2015

Source: HILDA (2005, 2015)
Credit: Australian Institute of Family Studies 2020
Strong support to equal rights for same-sex couples
The Australian Census started collecting information on same-sex couples in 1996.3 According to the 2016 Census, there were 46,770 same-sex couples in Australia, representing a rise of 39% since 2011 and 83% since 2006. Same-sex couples accounted for 0.9% of all couple households in 2016, compared with 0.6% in 2006 and 0.3% in 1996. The ABS noted that the apparent rise might partly reflect an increasing willingness for same-sex couples to disclose their relationship. It could also be the case that same-sex partners are now more prepared to form a couple household, rather than maintain separate homes.
- Of the same-sex families in 2016, 51% were male couples and 49% were female couples.
- Same-sex partners were most commonly aged 25-39 years (representing around 41% of all such couples) and tended to be younger than opposite-sex partners.
- Of same-sex couples, 15% had children, including adult children, living with them. (In the broader population the figure is over 50%.)4
- A significantly higher proportion of female couples than male couples had children living with them (22% and 3% respectively).
Amendments to the Marriage Act 1961 came into effect on 9 December 2017, enabling same-sex couples to legally marry in Australia. Same-sex marriages were included in ABS vital statistics on marriages registered for the first time in 2018. In 2018, there were 6,538 same-sex marriages registered, with more female same-sex marriages than male same-sex marriages (58% vs 42%) (ABS, 2019). Same-sex marriages represented 5.5% of all marriages in 2018.
Community views about same-sex couples appear to have changed significantly over the past decade. The HILDA Survey has collected data on attitudes to the equal rights of same-sex couples and opposite-sex couples in some survey waves. In 2005, 2008, 2011 and 2015, respondents aged 15 years and over were asked to rate their level of agreement or disagreement with the statement, 'Homosexual couples should have the same rights as heterosexual couples do', on a scale ranging from (1) strongly disagree to (7) strongly agree.
Figure 14 shows the proportion of respondents who indicated some level of agreement (i.e. ratings of 5-7) with the statement across the four years.
- Support for equal rights between same-sex couples and opposite-sex couples has increased steadily from 38% in 2005, to 51% in 2011 and 63% in 2015.
- The proportion of respondents who indicated strong agreement (i.e. the top rating of 7) increased from 18% in 2005 to 29% in 2011 and 43% in 2015 (data not shown in the figure).
- The proportion of respondents who neither agreed nor disagreed with the statement remained stable in the three time points (13-16%) (data not shown in the figure).
- The proportion of respondents who expressed disagreement (i.e. ratings of 1-3) has fallen from 47% in 2005 to 23% in 2015.
Figure 14: Percentage of respondents who indicated their agreement with the equal rights of same-sex and opposite-sex couples in 2005-15
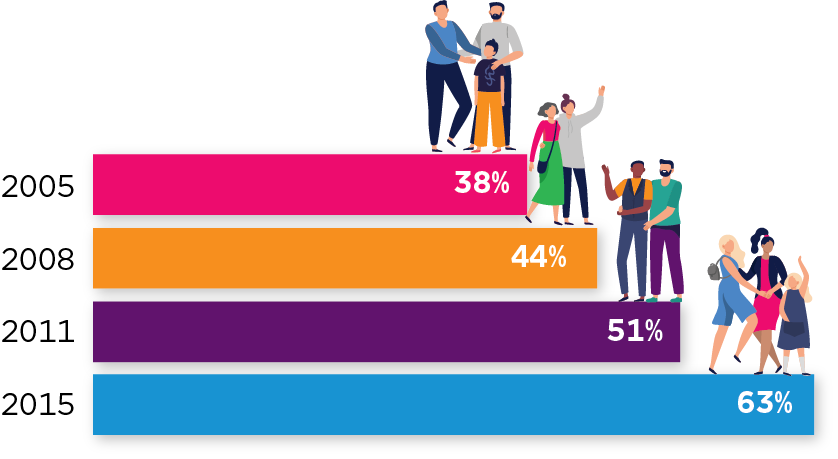
Note: Percentages based on weighted data. Agreements refer to the ratings of 5-7 on a scale from (1) strongly disagree to (7) strongly agree with the statement that homosexual couples should have the same rights as heterosexual couples.
Source: HILDA (2005-2015)
Credit: Australian Institute of Family Studies 2020
References
- Australian Bureau of Statistics (ABS). (various years). Marriages Australia (Catalogue no. 3306.0). Canberra: ABS.
- Australian Bureau of Statistics (various years). Divorces Australia (Catalogue no. 3307.0). Canberra: ABS.
- Australian Bureau of Statistics (various years). Marriages and divorces Australia (Catalogue no. 3310.0). Canberra: ABS.
- Australian Bureau of Statistics. (1988). 1986 Census household sample file (1%) - Confidentialised unit record file. Findings based on use of ABS Microdata. Canberra: ABS.
- Australian Bureau of Statistics. (1997). Australian social trends (Cat. no. 4102.0). Canberra: ABS.
- Australian Bureau of Statistics. (2003). 2001 Census of Population and Housing, Time Series Profile: T04 (Cat. no. 2003.0). Retrieved from quickstats.censusdata.abs.gov.au/census_services/getproduct/census/2001/communityprofile/0?opendocument
- Australian Bureau of Statistics. (2012). 2011 Census of Population and Housing, Time Series Profile: T04 Registered marital status by age by sex (Cat. no. 2003.0). Retrieved from quickstats.censusdata.abs.gov.au/census_services/getproduct/census/2011/communityprofile/0?opendocument
- Australian Bureau of Statistics. (2014). Marriages and divorces Australia 2013 (Cat. no. 3310.0). Canberra: ABS.
- Australian Bureau of Statistics. (2017). 2016 Census of population and housing - Basic Community Profile (Cat. no. 2001.0). Retrieved from quickstats.censusdata.abs.gov.au/census_services/getproduct/census/2016/communityprofile/036?opendocument
- Australian Bureau of Statistics. (2018a). Census of Population and Housing: Reflecting Australia - Stories from the Census, 2016 (Same-sex couples) (Cat. no. 2017.0). https://www.abs.gov.au/ausstats/[email protected]/mf/2071.0
- Australian Bureau of Statistics. (2018b) 2016 Census of population and housing, TableBuilder. Findings based on use of ABS TableBuilder data.
- Australian Bureau of Statistics. (2019). Marriages and divorces Australia, 2018 (Cat. no. 3310.0). Canberra: ABS.
- Commonwealth Bureau of Census and Statistics (CBCS). (various years). Australian Demography Bulletin (No. 30-87). Canberra: CBCS.
- Hewitt, B., & Baxter, J. (2015). Relationship dissolution. In Heard, G., & Arunachalam D. (Eds.), Family formation in 21st century Australia. Springer, Dordrecht.
- Higgins, D. J. (2002). Gay men from heterosexual marriages: Attitudes, behaviours, childhood experiences, and reasons for marriage. Journal of Homosexuality, 42(4), 15-34.
- Qu, L., Weston, R., & de Vaus, D. (2009). Cohabitation and beyond: The contribution of each partner's relationship satisfaction and fertility aspirations to pathways of cohabiting couples. Journal of Comparative Family Studies, 40(4) 587-601.
1 Prior to 2018 ABS marriage data only covered heterosexual marriages recognised under Australian law. Same-sex marriages were included in these data for the first time in 2018 (see section on same-sex families in this document).
2 There was an apparent dip in 2012 and 2013. This could be caused by the fact that the data of premarital cohabitation in Victoria in 2012 and 2013 were based on a weighted sample and caution should be taken in interpreting trends involving the years. Data for 2018 was not available.
3 Same-sex couples are identified in the ABS Census based on responses to relationship in household and sex questions and are defined as a subset of couple households. This means there are some limitations on these data (ABS 2071.0 2018). First, only couples living together are counted. Second, the 2016 Census did not directly collect information on sexual orientation and may therefore not represent some sex and gender diverse people
4 Children in same-sex parented families may have been raised from birth by a co-parenting gay or lesbian couple, raised by a single parent, conceived in the context of previous heterosexual relationships or adopted (Higgins, 2002).
This document was updated in July 2022. The changes were as follows:
• Figure 11: legend date changed from 1981 to 1986
• Fewer living with a partner section, first sentence: date changed from 1981 to 1986
• Figure 12: legend date changed from 1981 to 1986.
The HILDA (Households, Income and Labour Force Dynamics in Australia survey) project was initiated and is funded by the Australian Government Department of Social Services (DSS) and is managed by the Melbourne Institute of Applied Economic and Social Research. The findings and views based on these data are those of the authors and should not be attributed to either DSS or the Melbourne Institute.
Featured images: © GettyImages/shapecharge