Inclusion Support Program
Findings from the Child Care Package evaluation
October 2022
Download Research snapshot
Overview
This snapshot presents findings from the 2018–2021 evaluation of the Inclusion Support Program, this evaluation having been conducted alongside the evaluation of the Australian Government's Child Care Package.
The Inclusion Support Program (ISP) was introduced by the Australian Government on 1 July 2016 as an element of the Child Care Safety Net of the Child Care Package, replacing previous programs focused on inclusion in child care services. This snapshot provides an overview of the ISP evaluation findings. The evaluation drew on ISP program data as well as survey data collected from services and Inclusion Professionals. Data collection for the ISP evaluation continued up to early 2021.
Background
The objectives of the Inclusion Support Program are:
- To support eligible mainstream ECEC services to improve their capacity and capability to provide quality inclusive practices for all children, to address access and participation barriers and to support the inclusion of children with additional needs, with their typically developing peers
- To provide parents or carers of children with additional needs with access to appropriate and inclusive ECEC services that assist those parents or carers to increase their activity including work, study and training. (DESE, 2020a, p. 8)
The program has a number of antecedents stretching back to the early 1980s. A 'refresh' of the program guidelines saw some program changes in March 2020.1
The program seeks to make child care more inclusive. Primary support is from Inclusion Agencies (IAs) to promote inclusive practice in the child care sector, including to build the capacity and capability of services through a Strategic Inclusion Plan (SIP). The program also assists services to implement a quality, inclusive and equitable practice under the National Quality Framework (NQF) and in accordance with the National Quality Standard (NQS) and Approved Learning Frameworks.
The Inclusion Development Fund (IDF), managed by the Inclusion Development Fund Manager (IDFM), provides four streams of funding to assist eligible ECEC services. The development of a SIP is done in collaboration with the IA and the mechanism for accessing ongoing support and funding through the IDF. The Inclusion Support Portal (IS Portal) is the avenue through which services interact with the program to complete their SIP online and apply for funding through any of the four streams of the IDF.
Inclusion Agencies and Inclusion Professionals
Inclusion Agencies' roles include to provide advice and support to services about inclusive practice, to guide services in the development of their Strategic Inclusion Plans (SIPs) and to review these plans once completed. The agencies also are involved in Inclusion Development Fund applications. There is one Inclusion Agency in most jurisdictions.2
One of the issues that emerged in the evaluation was that the approach to tendering for Inclusion Agencies did not pay sufficient attention to the implications for agencies retaining skilled staff. In particular, the lack of certainty of future employment where tender and related contract decisions were made close to the expiry date of earlier contracts was seen as a key problem.
The Inclusion Agencies largely operate as consortia of different organisations, each operating a number of individual hubs that service a geographic area. Operating out of these hubs is a network of Inclusion Professionals who provide advice and support to services on effective inclusive practice, to build their capacity and capability to provide and embed inclusive practice and address barriers to inclusion experienced by children with additional needs. In 2020 the Inclusion Agencies employed almost 300 Inclusion Professionals.
Program data from Inclusion Agencies showed a high level of contact between Inclusion Agencies and services, with the proportion of services contacting Inclusion Agencies increasing over time, although with a large impact of COVID-19 in 2020 on these visits and contacts (Figure 1).
Figure 1: Proportion of services contacted, visited and requested support, Inclusion Agencies January-June 2017 to July-December 2020

Source: Inclusion Agency 6 monthly reports
Program data indicated that key activities undertaken by Inclusion Professionals included support with the development of SIPs, support for funding applications, and assistance with the ISP portal (Figure 2). The most frequently reported activity was that of providing support to services with their SIP. The next highest activities were providing IT support and support with applications for the IDF. Over time there has been an increase in contact that involves inclusion activities other than those associated with the Inclusion Development Fund.
Figure 2: Services, excluding OSHC, with which Inclusion Agencies had contact, focus of contact January-June 2017 to July-December 2020
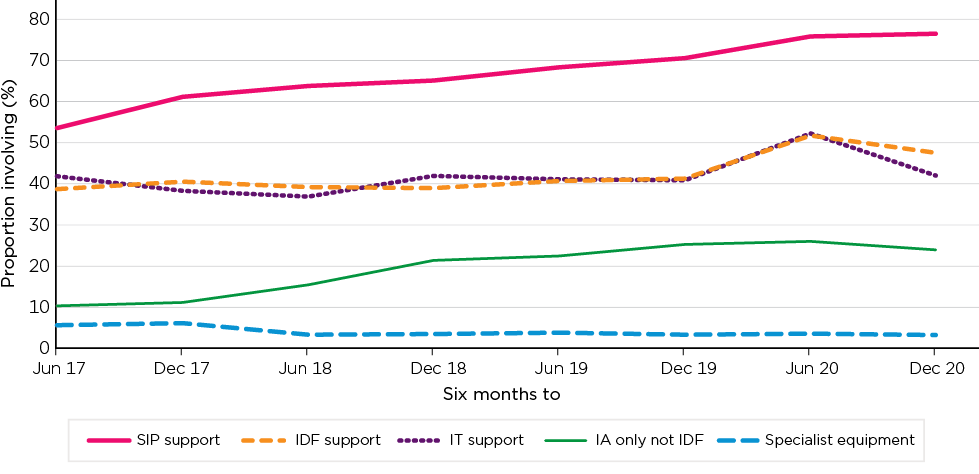
Notes: Activity identified if occurred in any contact with service in the six-month period. OSHC services excluded as data for period prior to July-December 2018 collected on basis of each Before School, After School and Vacation Care service.
Source: Inclusion Agency 6 monthly reports
Service provision by Inclusion Professionals was often delivered remotely during 2020, due to the impacts of COVID-19. The evaluation found that this means of service delivery could continue to play an important role going forward, but a balanced approach would be needed that combines this with face-to-face contact.
The evaluation found that the role of the Inclusion Agencies is important and should be maintained. Survey responses collected for the evaluation indicated that the operation of the Inclusion Agencies was seen as broadly effective. Services rated the support of Inclusion Agencies highly. The staff of the agencies themselves strongly believed that the agencies are effective in their mission and in their internal management and, on balance, considered that the level of resources provided for the agencies is appropriate.
Services reported high levels of satisfaction with their Inclusion Professional. Data from the Survey of Early Learning and Care Services, which was designed to represent all child care services, revealed high levels of satisfaction, with 46% of services having had contact with an Inclusion Professional very satisfied and 31% mostly satisfied. Higher levels of satisfaction were apparent in the survey of services that had engaged with ISP in the past year.
Strategic Inclusion Plan
A core element of the Inclusion Support Program is the Strategic Inclusion Plan (SIP). The SIP is an inclusion assessment and planning tool for services, to help them to identify barriers to inclusion, and short- and longer-term strategies for improving and embedding inclusive practice. The SIP also seeks to recognise current inclusive capacity, and capability, and outline objectives for quality inclusion practices. SIPs are developed by services with support from Inclusion Agencies. The SIP is also the mechanism for accessing ongoing support from the program and is necessary to obtain funding through the Inclusion Development Fund. Operationally, the SIP is prepared on the Inclusion Support Portal using a structured online form.3
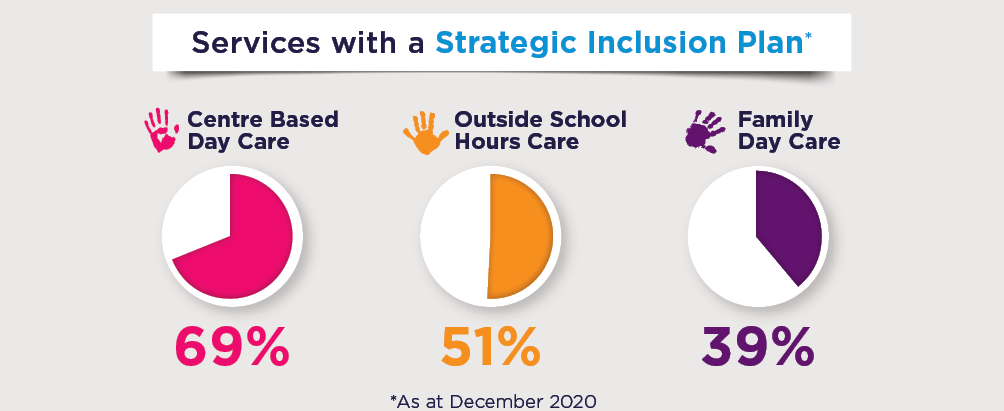
There has been strong growth in the number and proportion of services that have a SIP (Figure 3). At end 2020, 69% of CBDC services, 51% of OSHC services and 39% of FDC services had a SIP. This represents increases of 20-30 percentage points on the June 2017 proportions.
The proportion of services with a SIP varies markedly by state, and by regions ('hubs') within states. The state differences at December 2020, for example, are shown in Figure 4.
Figure 3: Proportion of services with a SIP by service type, June 2017-December 2020
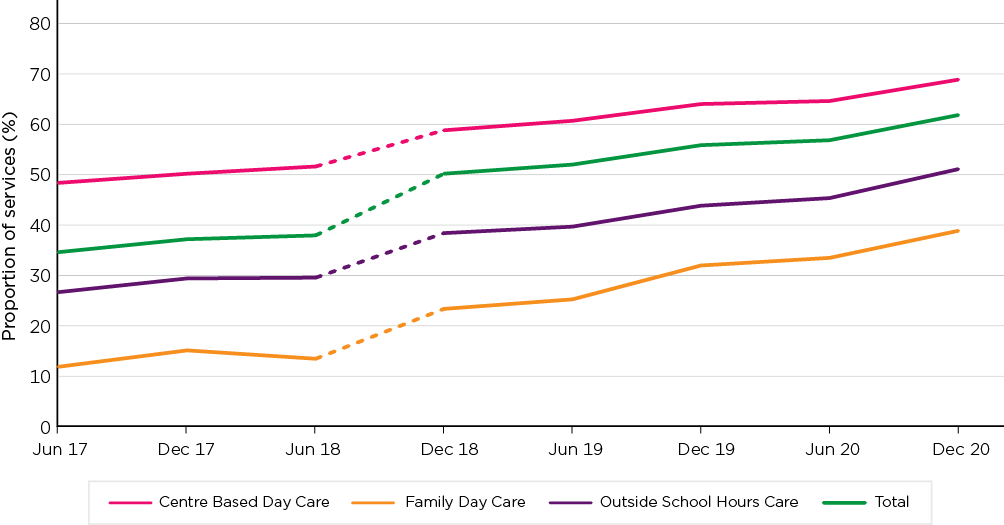
Source: Inclusion Agency 6 monthly reports
Figure 4: Proportion of services with a SIP by state, December 2020
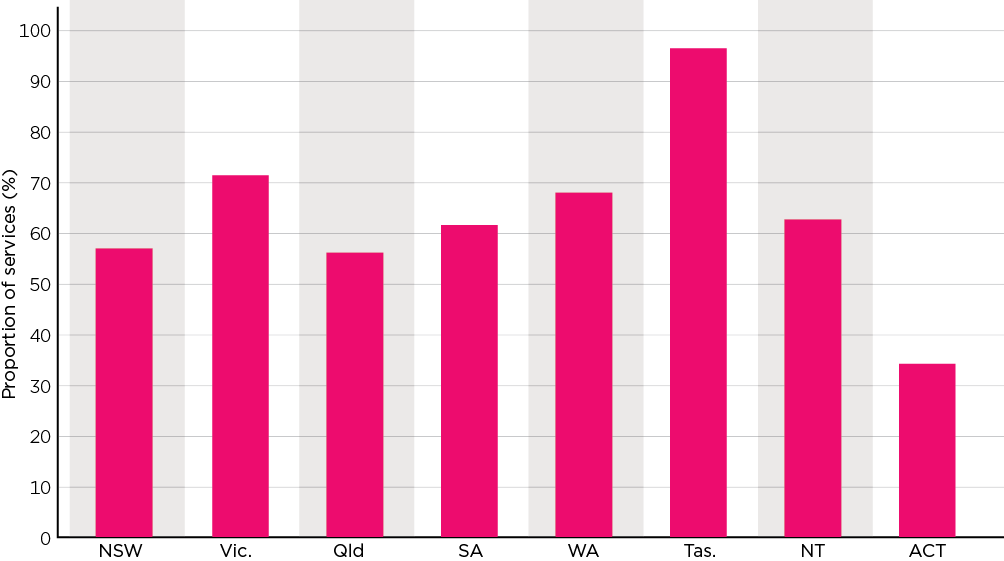
Source: Inclusion Agency 6 monthly reports
A majority of services and Inclusion Professionals agreed that the SIP is a useful tool for addressing inclusion (Figure 5). Also, a high proportion of services saw the main purpose of the SIP as accessing funding. There was a strong view by Inclusion Professionals that the SIP could be better designed, and some agreement with this from services. On balance, the 'barriers' approach was seen as useful.
Figure 5: Proportions of Inclusion Professions and ISP services agreeing on statements about the Strategic Inclusion Plan
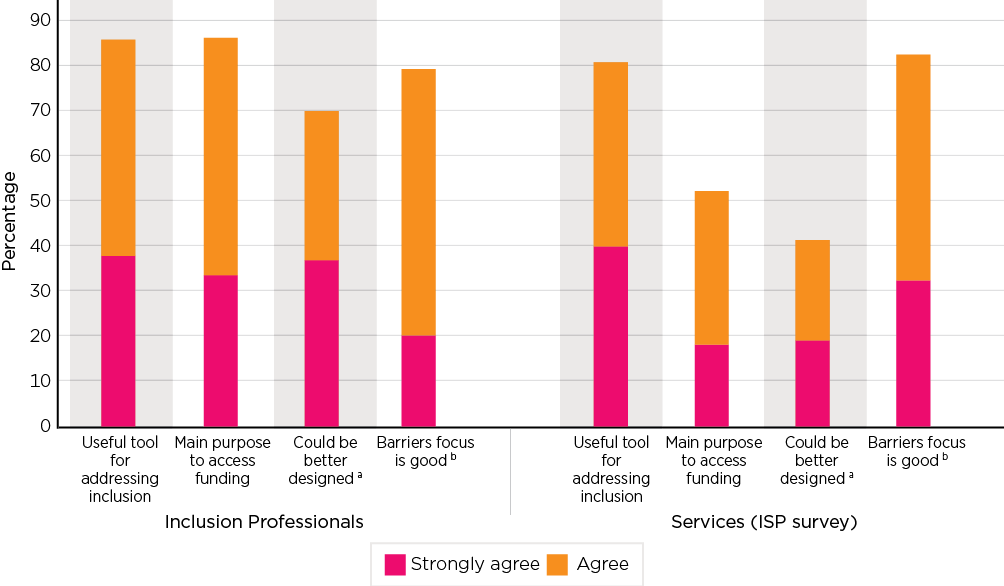
Notes: Service respondents are those services with a SIP. a SIP could be better designed to identify how inclusive this service is and what else we can do to improve our capacity to be inclusive of children with additional needs; b The barriers focus of the SIP provides a good framework for identifying where services need to focus attention to be more inclusive.
Source: ISP Services Survey, December 2020-February 2021; Inclusion Professionals Survey, October-November 2020.
Issues were raised about the SIP including better integration with the National Quality Framework Quality Improvement Plans, and making the SIP more effective as a day-to-day on the floor tool. A key barrier to the effectiveness of the SIP was the IT system (see also Information Technology and Portal issues). The structure of the SIP for Family Day Care Services was also seen as problematic.
Inclusion Development Fund
There are four specific funding streams within the scope of the Inclusion Support Program and which are funded from the Inclusion Development Fund (IDF). (See Inclusion Support Program - Department of Education, Skills and Employment, Australian Government (dese.gov.au) for details.) These are:
- Additional Educator
- Immediate/Time Limited support
- Family Day Care (FDC) Top Up
- Innovative Solutions Support.
The total number of subsidies since the introduction of ISP, by type of support and year of commencement, is shown in Figure 6.
In 2019, 30% of services accessed one or more of the subsidies under the IDF. This proportion varies by state (Figure 7), as was the case also in considering other engagement with the program (see also Figure 3). Some state-level variance will reflect different levels of demand, but the evaluation findings suggested that the large variation by state also reflects a lack of equity of access by services.
Figure 6: Number of IDF subsidies by IDF stream, 2016-20
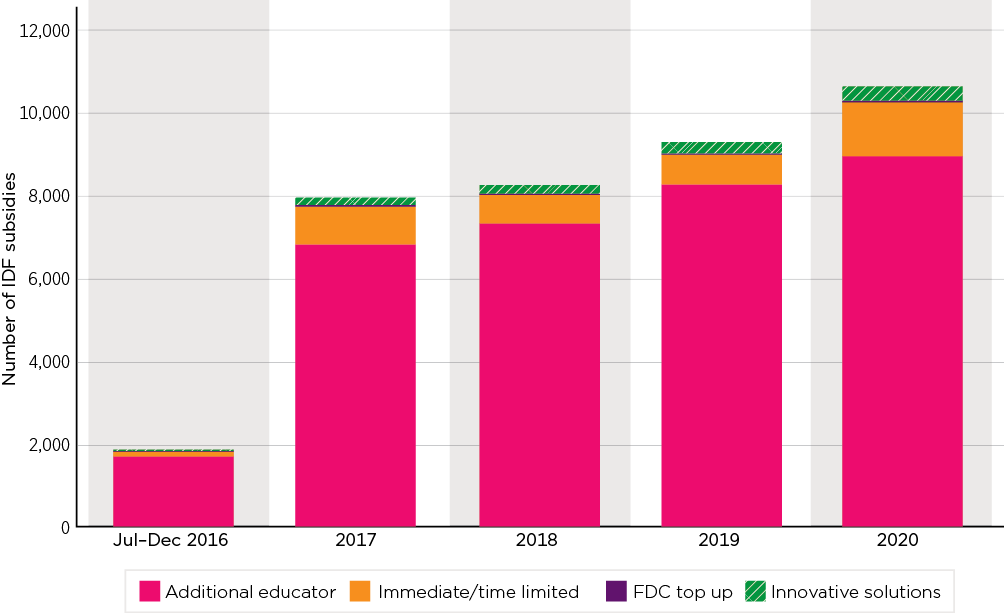
Notes: Year is based on start date.
Source: DESE Administrative data
Figure 7: Proportion of services in receipt of an IDF subsidy by state, 2019
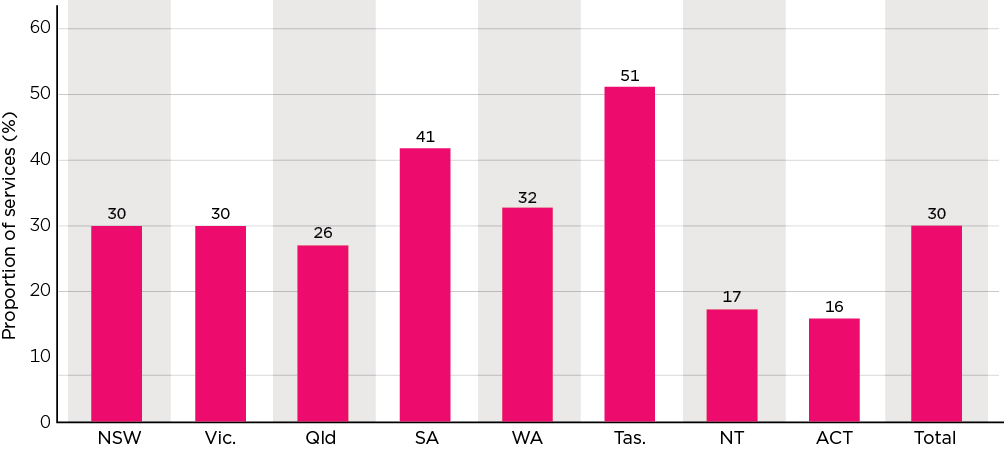
Notes: Excludes In Home Care. Year is based on start date.
Source: DESE Administrative data
Additional Educator
In 2020, the Additional Educator subsidy accounted for almost 85% of approvals.
- In 2019, 34% of CBDC services and 21% of OSHC services received Additional Educator support.
- Over 80% of Inclusion Professionals considered that the Additional Educator subsidy is an effective tool for supporting inclusion.
- Of services having received Additional Educator support, 76% reported that it had well or very well supported inclusion in their service.
At the time of the evaluation, for an application related to a single child, the rate of subsidy was $23 per hour for 25 hours per week for up to 52 weeks. The evaluation highlighted issues around the adequacy of the rate of subsidy and inflexibility with regard to the number of hours a child was in care. Given the costs of engaging an educator, the level of subsidy leaves a cost to the service of including the child with additional needs, relative to a child with no additional needs. Further, with the subsidy provided for up to 25 hours per week, this results in a differential level of support, especially when the child attends long sessions over the whole week. Some issues were also raised through the evaluation about the Additional Educator application process. These mainly related to portal and Strategic Inclusion Plan matters, although documentation posed challenges for some services.
Immediate/Time Limited
Small proportions of services receive Immediate/Time Limited support, which is available to CBDC and OSHC services to employ an additional educator where there is an immediate barrier associated with a particular child with high support needs (5.9% of CBDC services and 2.0% of OSHC services in 2019).
Overall, this element of ISP was viewed positively, although less so than the Additional Educator subsidy. Of those who had used the Immediate/Time Limited Support, 31% reported that the recruitment of the educator under the IDF Immediate/Time Limited support 'very well' achieved the goal of including the child in the service, and 29% said it did it 'well', 34% said it did so 'adequately' and 6% 'not at all well'.
The most common way of recruiting staff under this element was extending the working time of an existing staff member; however, a significant group of those who recruited beyond this reported some difficulty. The evaluation found that there was confusion and some inconsistency as to whether this support could be used as a bridge for the development of an Additional Educator subsidy.
Family Day Care Top Up
Only some 25-35 subsidies are provided each year under the Family Day Care Top Up. In 2019, 3% of FDC services had received this support.
A range of concerns were identified with this element of ISP including its conceptual approach (as a top up when less than the allowed number of children were cared for), and the extent to which applications required significant effort by services who received no benefit.
Innovative Solutions Support
Innovative Solutions Support assistance is a flexible funding stream based on proposals submitted by services. There has been significant underspend in this element of the ISP over much of its existence but over the past two years it has shown very strong growth. This appears to have been associated with greater awareness of this funding stream by services, promotion of it including clarifying its role and, most recently, the March 2020 'refresh' of the program guidelines.
The proportions of services having used Innovative Solutions Support are low at 2.8% of CBDC services and less than 1% of FDC and OSHC services in 2019. There are large differences between states in the rate at which services received this support, as with other elements of ISP. Multivariate analysis of the probability of a service being in receipt of an Innovative Solutions Support subsidy in 2019, taking into account other service-level characteristics, found this probability was significantly higher in South Australia, Western Australia and Tasmania than in the base state of New South Wales. It was significantly lower in Victoria.
Grants under Innovative Solutions can be used for a wide range of purposes, including many more traditional activities, such as the short-term engagement of a bilingual support worker to assist with the transition of a child from a non-English speaking background into the service. See Figure 8 for the activities supported in 2020.
Figure 8: Innovative Solutions Support, distribution of projects by purpose, 2020
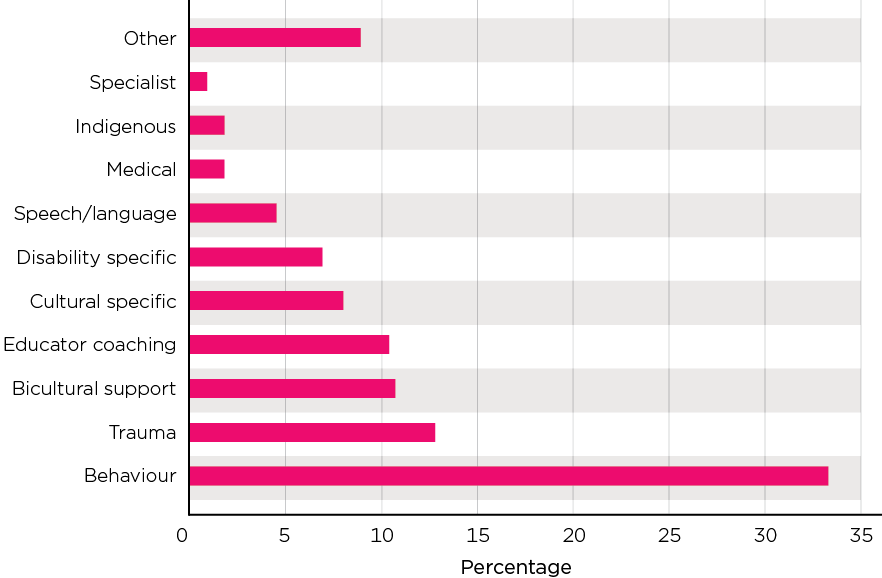
Notes: Bicultural support, Cultural specific and Disability categories are coded into the administrative data. Other categories have been derived from key words used in project descriptions.
Source: DESE Administrative data
Innovative Solutions Support was generally seen positively and as being a powerful way of improving the capacity of services to address inclusion barriers. The majority of services indicated that the Innovative Solutions Support achieved the goal of providing inclusive care - 51% indicated it did so very well and 24% indicated it did so well. Another 19% indicated it did so adequately, while 6% indicated it did so not at all well or less than adequately.
While Innovative Solutions Support was viewed positively, the application process was seen by many services as difficult:
- Among services that had Innovative Solutions Support currently or in the past year, 33% agreed that it was 'relatively simple and easy', 29% neither agreed nor disagreed and 39% disagreed.
A high proportion of services received help from others to complete their Innovative Solutions Support application. Of those with current/recent Innovative Solutions Support, 53% indicated this had been done with the assistance of a provider organisation and 90% reported assistance of an Inclusion Professional.
Differences in program use
There were significant differences in the relative use of ISP funding across services. The program was used disproportionately by CBDC services, and there was an overall tendency for higher levels of program use in South Australia, Western Australia and Tasmania and lower use in Queensland and the Australian Capital Territory, and in remote and very remote locations. Usage was higher in the not-for-profit sector and amongst services rated more highly by ACECQA.
Overall, since its introduction, the ISP has significantly underspent its budget although the extent of this appears to have diminished.
Information technology and portal issues
In data collections for the ISP evaluation, the IT environment for the program was strongly criticised, specifically the Inclusion Support Portal ('the portal'), which is the web-based application used by services to access the ISP. It is where the SIP is completed and where services apply for any of the four streams of funding. The Inclusion Agencies play an important role in providing support to services in accessing the Inclusion Support Portal to complete the SIP and apply for funding.
In the survey of Inclusion Professionals, a majority disagreed when asked whether the portal was easy to use for developing and lodging SIPs. While fewer services disagreed when surveyed, this likely reflected the effectiveness of Inclusion Professionals' support of this activity. Positive ratings of the portal by services also seemed to be associated with having used the portal more frequently. Given the nature of the ISP, however, it cannot be expected that most services will have the frequency of use (nor necessarily that the same person will be involved) to build expertise. For a group of services, issues with the portal acted as a barrier to accessing support.
Related to the IT system also, obtaining data on many aspects of the program's operation proved difficult for the evaluation, with the data often stored in formats such as spreadsheets that made access difficult and suggesting there had been barriers to the usefulness of the data for monitoring of program activity.
Child care services and children with additional needs
Most services had a diversity of children using their child care services, including children with additional needs. Services reported positively on their commitment to inclusion and the use of inclusive techniques. This included having a range of activities associated with the inclusion of Aboriginal and Torres Strait Islander children, and of children from culturally and linguistically different backgrounds. However, they also expressed concern about meeting the needs of all children if a particular child needed intensive support. Inclusion Professionals were less emphatic in their agreement about the quality of services' approaches to inclusion, although overall agreed that the quality of inclusion in services was good or better. Also, while they rated inclusionary practice for children with disabilities, developmental delays, and health conditions, as adequate or better, it was seen less adequate for other children with additional needs, especially those with behavioural issues and who had experienced trauma.
Services reported needing additional resources to effectively include some groups of children. For many other groups of children, advice and support was more important. Children who exhibit violence and disruptive behaviour were seen as being more difficult to include. Specific issues arose in the OSHC sector where qualification requirements and staffing ratios were lower and where management of behaviour including absconding as well as high personal care needs were seen as significant, especially when facilities were not appropriate for inclusive care.
Child care participation and children with additional needs
Survey-based data on the relative participation of children with additional needs did not find any consistent significant differences in participation, although this was subject to high sampling variability. Administrative data from the Family Tax Benefit system on children with a significant health or related condition suggests that, overall, participation was similar to those without such conditions.
Around one in five parents of a child with additional needs reported having to change child care because of issues with care. This was double the rate of those parents without such a child. The rate of exclusion experienced by parents with a child with additional needs was four times higher than that of those without. Parents of children with additional needs were less likely to report that it was easy to find quality care.
The conceptual approaches to inclusion and broader issues
The evaluation also reported on the concept of inclusion and broader contextual issues that are relevant to the Inclusion Support Program.
With regard to the concept of inclusion, there are two divergent approaches. One sees inclusion as an 'intrinsic' value, or right, of all children to participate equally, the other considers it as having an 'instrumental' role of improving the outcomes for children with additional needs. While the two approaches frequently involve similar practices, their motivations and how they are assessed vary.
The tension in the concepts of inclusion can be seen in terms of services', parents' and inclusion professionals' different approaches to the role of child care in socialisation and in children learning how to fit in with others and with norms. Internationally there is a growing reorientation of inclusion policies from a focus on equitable access of children with additional needs towards a more proactive role of early education and care as a strategy for addressing social exclusion and the needs of children facing disadvantage and, in particular, in seeking to address education disadvantage.
Also relevant to inclusion are anti-discrimination practices and laws that are directed at preventing exclusion. Child care is, however, excluded from the Disability Standards for Education.
The need for SIPs to be better integrated with the NQF Quality Improvement Plans was noted earlier. Further, while there are obvious links between service quality and inclusion practices, there was in most states either no, or only occasional, contact by Inclusion Professionals with State/Territory Authorised Officers responsible for service assessment, and a general view by these professionals that the ACECQA quality ratings only partially reflected services that had good inclusion practices.
On another broader issue, there was general agreement among participants in the evaluation that base levels of qualification of child care staff did not encompass inclusion adequately and that there was a need for, and strong interest in, professional development. Existing arrangements frequently made it difficult to access this professional development.
Summary
Overall, the program is supportive of inclusion of children with additional needs and makes a positive contribution. There is a strong stakeholder view that it is effective in achieving improved inclusion of children with additional needs in child care. However, there are significant elements of the program that are not wholly effective, where operationalisation can be improved and where policy and policy intent is not fully clear. The program operates somewhat independently of the much broader framework relevant to inclusion and outcomes for children with additional needs.
Some priorities for the program that were identified through the evaluation were the redevelopment of the SIP and improvement of the IT system, both for service users and for program management purposes. The evaluation also indicated there is clear scope for building better links with other services and authorities that impact the outcomes of children with additional needs in child care.
Importantly, the evaluation also noted that there is a need to consider the different concepts of inclusion - as articulated through the instrumental and intrinsic perspectives - and its alignment with the wider objectives of child care. More broadly, it should be considered in the context of the evolving focus of inclusion in early childhood education and care in other countries where a key priority is its role of addressing wider social exclusion that will otherwise become manifest in ongoing educational disadvantage.
Child Care Package evaluation
In July 2018 the Australian Government introduced the Child Care Package. The Australian Institute of Family Studies in association with the Social Research Centre, the UNSW Social Policy Research Centre and the ANU Centre for Social Research and Methods were commissioned by the Australian Government Department of Education, Skills and Employment to undertake an independent evaluation of the new Child Care Package. The consortium was also commissioned to evaluate the Inclusion Support Program, which was introduced by the Australian Government on 1 July 2016 as an element of the Child Care Safety Net of the Child Care Package. The ISP evaluation had separate data collections and additional reporting requirements. This snapshot summarises findings from the ISP evaluation. The evaluation drew on ISP program data as well as survey data collected from services and Inclusion Professionals. Data collection for the ISP evaluation continued up to early 2021.
1 The updates that accompanied the 'refresh' are outlined in Inclusion Support Program Guidelines.
2 New South Wales and the Australian Capital Territory are serviced by a single agency.
3 In some cases, the SIP can be completed in paper form; for example, where services have poor connectivity to the internet.
Australian Institute of Family Studies. (2022). The 2018–2021 Child Care Package: Inclusion Support Program. (Findings from the Child Care Package evaluation). Melbourne: Australian Institute of Family Studies.
Download Research snapshot
Related publications

In Home Care evaluation
The revised In Home Care program was introduced as part of the Child Care Package. This summarises key findings of the…
Read more
Evaluation of the Inclusion Support Program
This evaluation considers the impact of the Inclusion Support Program – an element of the Child Care Package.
Read more