Are we actually doing more for families affected by family and domestic violence?
March 2016
Jamie Lee
Practitioner’s Corner is a column where practitioners can discuss work-related issues and new resources, and share their insight and practice wisdom. Please contact us if you would like to contribute an article.
Recently, a big Australian study told us that families affected by physical and emotional abuse were much more likely to approach services such as counselling, mediation and Family Dispute Resolution, confirming how families "at the complex end of the spectrum" rely on such services.
But what happens after these families approach services? Does the presence of family and domestic violence (FDV) make a difference to service response, or is it just business as usual? Do we as service providers actually do more for these families?
The answers to these questions are especially important to Relationships Australia South Australia because they also tell us about the practice of universal screening. We routinely ask all clients about the risks they and their families face – including the possibility they may abuse or perpetrate violence against others. We do that through Family Law DOORS, a validated tool to detect risk in post-separation clients. Detailed analysis of matched pairs of DOORS clients showed high corroboration of FDV risk. In other words, that when one parent in a dispute reported feeling unsafe (i.e. high risk of victimisation), the other parent was highly likely to report unsafe behaviour (i.e. high risk of perpetration).
To answer the question about "doing more", we presumed that families affected by FDV would need more support from service providers. We then hypothesised that when our services detect risk and complexity using universal screening, they would offer families more support. Though it’s not compulsory, of course, we hoped families at risk would accept our offer. Hence they would use additional services as well as the initial presenting service.
The idea was simple but the measurement issues were fiendish. How could we identify FDV "caseness" – whether a client is directly affected by FDV – across an agency seeing over 15,000 clients per year across 9 locations in 16 distinct programs? And how could we be sure if referral for further support from our agency actually resulted in the client receiving another service?
We solved these issues like so:
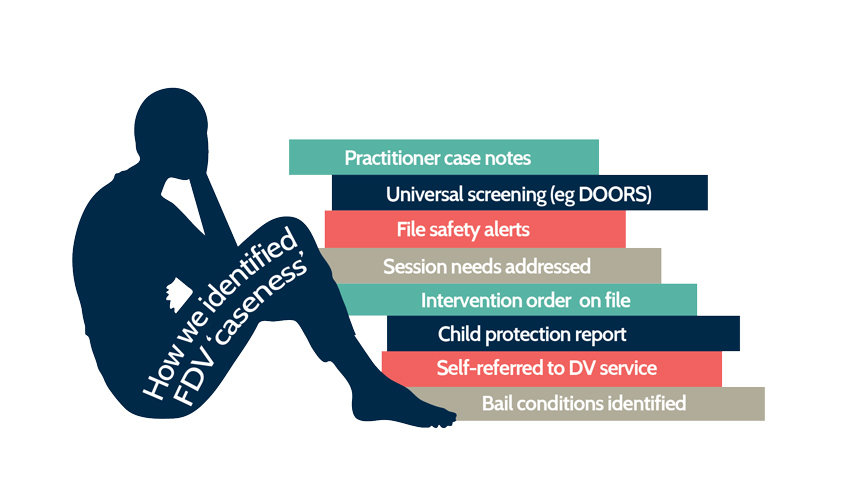
- Presence of FDV. We analysed multiple possible FDV indicators from Penelope, our client information system. This ranged from client self-report of FDV indicators in DOOR 11 through to scanning practitioner case notes or child protection reports for key words like "violence" in the right context (such as "Client described acts of physical *violence* in the relationship"). The full search terms are shown in Figure 1.
- Referrals completed. We counted the number of additional services delivered to a client after the original presenting service (where the client attended at least one appointment – excluding no shows).
Figure 1: Sources for FDV "caseness"
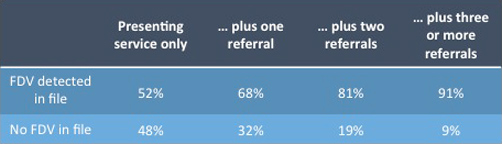
The results? Overall we found that 63% of our clients were directly affected by FDV in 2013-14 and 2014-15. That’s broadly consistent with other research with clients in services. But when we split clients by the number of additional services they used after the original presenting service – if any – we were reassured. Clients who used additional services were increasingly likely to have FDV as an issue in their files. Table 1 shows the numbers.
Table 1: Internal referrals taken by client, based on FDV presence
So how does this help us as service providers? Firstly, we can discount the fear we have been over-servicing the worried well. These numbers show that the families most in need of support are getting it. Secondly, these findings help us at Relationships Australia South Australia evaluate an organisation-wide implementation of universal screening in routine practice. Numbers of families affected by FDV detected by staff have steadily increased, boosted by ongoing training and supervision. And finally, it shows the usefulness of large scale clinical audit – of 31,331 clients! – through extraction of data from e-records. So yes, it seems we are doing more for families affected by FDV.
Footnotes
1. McIntosh, J. E. (2011). DOOR 1: Parent Self-Report Form. In: The Family Law DOORS Handbook. Accessible via www.familylawdoors.com.au
2. Kaspiew, R., & Qu, L. (2014, 7 October). Hounouring the role and meeting the challenges. Paper presented at the Inaugural National ICL Training Conference, Sydney. Cited in Kaspiew R., Carson, R., Dunstan, J., De Maio, J., Moore, S., Moloney, L., Smart, D., Qu, L., Coulson, M. and Tayton, S. (2015). Experiences of Separated Parents Study. Melbourne, Australia: Australian Institute of Family Studies.
The feature image is by Andreas Levers, CC BY-NC 2.0. Additional graphics and tables were supplied by the author.