Early childhood education and care sector and viability
June 2023
Download Research snapshot
Overview
This snapshot presents findings from the 2018–2021 evaluation of the Australian Government’s Child Care Package.
The evaluation of the Child Care Package reported on the early childhood education and care sector and its viability, using data about the sector up to December 2019. This snapshot includes an overview of the sector at December 2019, and changes to the sector; the contribution of subsidies to the funding of the child care sector, including the Child Care Subsidy and the Community Child Care Fund; reports from services of their financial viability and a summary of issues reported to be impacting the viability of the sector. The scope of this work did not include the impacts of the COVID-19 pandemic on the sector.1
The ECEC sector at end 2019
Some key statistics about the child care sector at the December 2019 quarter:
- There were 13,118 services providing child care.
- This comprised 8,104 Centre Based Day Care (CBDC) services, 4,513 Outside School Hours Care (OSHC) services, 461 Family Day Care (FDC) services and 40 In Home Care (IHC) services.
- When weighted by the number of hours of care charged for, CBDC accounted for 80% of the industry, OSHC 11% and FDC 9%. IHC is a very small percentage, at 0.2%, based on hours provided to a family.
- 63% of services were for-profit. This proportion varied from 50% for IHC to 69% for CBDC.
- The 13,118 services operated under the umbrella of 6,152 provider organisations.
- 4,919 (38%) services were individual services – that is, they were both a service and a provider; 2,397 (18%) were members of small providers (2–4 services); 3,443 (26%) were part of providers with 5–99 services; and 2,380 (18%) were operated by a provider with 100 or more services.
The distribution of services varied across states within Australia in the number of services and whether they were provided by the for-profit or not-for profit sector (Figure 1). There was also considerable variation by location as measured by remoteness. For example, the proportion provided by the for-profit sector was highest, at 69%, in capital cities and lowest in remote (22%) and very remote areas (9%).
Figure 1: Number of services and proportion provided by the for-profit sector by state, 2018–19
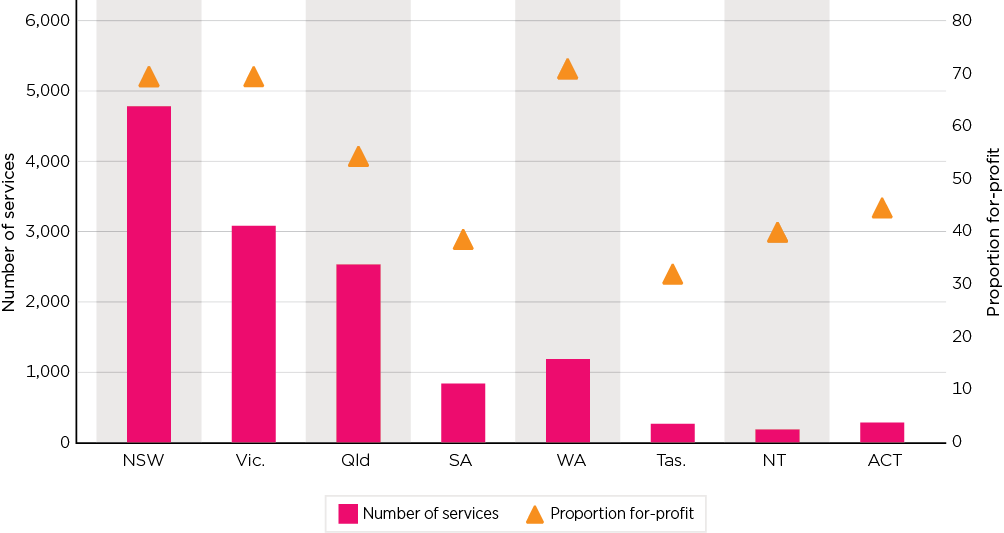
Source: DESE and DSS administrative data (December quarter 2019)
Changes to the sector
Exits and entrances
Since the introduction of the Child Care Package to end 2019, the number of child care services increased by 338, a 3% growth.
- In the 12 months to end June 2019 there were 1,171 exits and 1,530 entries recorded. This was higher than in the previous 12 months to June 2018 in which 1,037 exits and 1,170 entries were recorded.
- Compliance activity in the FDC sector saw a large number of FDC services closed; in particular, up to and including the June 2018 quarter. Over the period Jan 2017–Sept 2019, 352 for-profit services closed – 84% of which had sanction action taken against them. Over this period the number of children attending for-profit FDC fell from 100,000 to less than half this in the second half of 2019.
- Excluding FDC, the movements were 1,094 exits and 1,517 entries in 2018–19, and 826 exits and 1,150 entries in 2017–18, with the ratio of exits to entries in each of the 12-month periods being the same at 72:100.
- There was a spike in entries in the September quarter 2018. This, in part, reflected some delayed entries into the system pending the introduction of the Child Care Subsidy.
Further analysis of exits and entrances of services to the sector revealed varied patterns across service types, by state, by location, and by whether they were provided by the for-profit or not-for-profit sector. Generally, there was little evidence of there having been any major shift in the patterns of entry or exit, or in the mix of services, since the introduction of the Child Care Package.
Market concentration
Market concentration is a measure of whether child care is provided equally across services and providers who are delivering child care, or whether there are particular services or providers that provide a disproportionate share of the child care. That is, the extent to which some services or some providers have a small number of children and others a large number provides a measure of market concentration.
In relation to whether concentration at the service level or provider level changed with the introduction of the Child Care Package, analysis of administrative data indicated there had been little change. At the provider level, the OSHC sector is the most concentrated, with a small number of providers dominating the market. In terms of concentration of children within services, it is the only sector identified as consistently becoming more concentrated over the three years analysed from 2017 to 2019.
Funding under the Child Care Package
Child Care Subsidy and other funding
The Child Care Subsidy (CCS) is the main form of Australian Government financial support to parents as a subsidy for child care costs. Also, the Additional Child Care Subsidy (ACCS) is a top-up payment to the CCS, providing additional fee assistance to families facing barriers in accessing affordable child care. CCS and ACCS are usually paid to the service as an offset to the fee that would otherwise be paid by the parent. The balance of fees, after CCS and/or ACCS, is paid by families. For more information refer to other Child Care Package Evaluation snapshots.
Services may receive other funding from the government, including funding through the Inclusion Support Program (ISP) snapshot or through the Community Child Care Fund (CCCF, see below).2
Child care subsidies as a proportion of fees
On average, subsidies to child care services (excluding ISP and CCCF), as recorded in the child care administrative system in 2018–19, were equal to 60.7% of the fees charged by services. This compared with 59.5% in 2017–18.3
Figure 2 shows the total amount of subsidy as a proportion of total fees charged, by service type and for-profit status for 2017–18 and 2018–19.
- The proportion for CBDC was similar in both the for-profit and not-for-profit sectors, and each showed a small increase in subsidies between 2017–18 and 2018–19.
- The proportion was higher for FDC, especially in the for-profit sector. Changing proportions between 2017–18 and 2018–19 were impacted somewhat by the compositional change of the FDC sector following compliance activity.4
- The subsidy amount as a proportion of total fees was lowest for OSHC, being more marked in the for-profit sector. The proportion fell for OSHC between 2017–18 and 2018–19.
- The subsidy amount as a proportion of total fees was highest for IHC. The proportion fell between 2017–18 and 2018–19, with a larger fall for the for-profit providers in the sector.
Figure 2: Child care subsidies as a proportion of total fees charged, by service type and for-profit, not-for-profit status, 2017–18, 2018–19
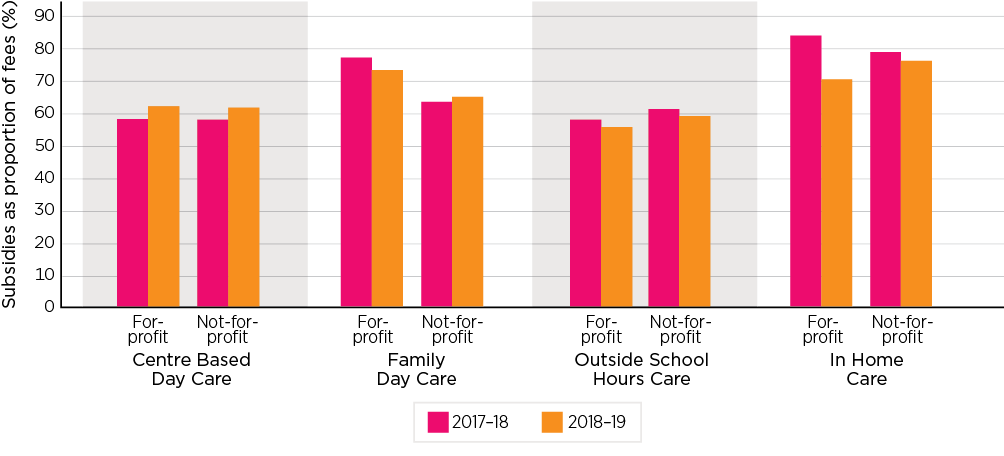
Source: DESE administrative data
Community Child Care Fund
The Community Child Care Fund (CCCF) provides grants to child care services with the objective of reducing barriers to child care, especially in disadvantaged, regional and remote communities. It has two main components, open competitive grants and restricted non-competitive grants:5
Open competitive grants
Funding under the CCCF open competitive grants is awarded in three categories:
- Sustainability support to help services remain viable and sustainable.
- Community support to identify and address community-level barriers to child care participation so more children can attend child care.
- Capital support to contribute to the cost of modifying, renovating, extending or building child care facilities that results in more child care places where there is unmet demand.
The CCCF competitive grants are targeted at geographically defined priority areas, although with some variation over time in both the areas identified, and the actual eligibility criteria.
Special circumstances grants are also available under this stream. These grants may be available when a service is: at risk of closure due to an unforeseen event or circumstance; for example, a natural disaster; at risk of permanent closure where this would result in a lack of suitable child care for the community; or seeking to open a new service in a community where there is no suitable child care.
The number and value of grants awarded between July 2018 and December 2019 is presented in Table 1.6
- Sustainability support was the largest component both in dollar value and number of grants. These grants were also of longer duration than other grants.
- Special circumstances grants were much lesser in value and they were mostly short-term grants.
| Sustainability support | Community support | Capital support | Special circumstances | Total | |
|---|---|---|---|---|---|
| Total value of grants ($) | |||||
| 2018–19 Financial Year | 101,414,959 | 20,679,113 | 1,259,500 | 858,013 | 124,211,585 |
| June–December 2019 | 4,187,634 | 3,150,918 | 873,250 | 746,640 | 8,958,442 |
| Average | 147,284 | 151,784 | 164,058 | 29,175 | |
| Grant value ($) | |||||
| Median | 96,591 | 108,900 | 149,000 | 11,000 | |
| Total grants | 717 | 157 | 13 | 55 | |
Source: DESE operational reports
CCCF restricted grants and former BBF services
The CCCF restricted non-competitive grant opportunity is primarily for former Budget Based Funded (BBF) child care services and a small number of other specified child care services.7 This grant funding is intended to support continuity of services following the transition to the Child Care Package and ensure these services’ viability under the new arrangements. Restricted grant funding is calculated on a formula basis reflecting previous service funding levels with adjustments for factors such as expected fee income and subsidies from the CCS. Further adjustments are made over the grant period if these expected levels vary or viability is impacted by unexpected circumstances. The formula base at the commencement of the program was based on a five-year timetable with some tapering of the grant value over time.
For services receiving CCCF restricted grants in 2018–19, the CCCF funding equated to 99% of the funding obtained under the 2017–18 program arrangements.
- This varied across services. Some received higher assistance through CCCF grants than they did under their previous funding. This includes almost half (47%) of the former BBF services. For 18% of former BBF services, CCCF funding in 2018–19 was less than half the amount received from previous funding while for 20% the CCCF funding was between 50% and 75% of the previous funding, and for 16% of services it was between 75% and 100% of previous funding.
More insights about the former BBF services and CCCF funding is reported below (see Viability of former BBF services), and also in the vulnerable families snapshot.
CCCF grants and the child care sector
Considering all streams of CCCF grants, there were marked differences in the distribution of these grants (Figure 3). For example, in 2018–19:
- Relatively high proportions of not-for-profit FDC and IHC services received grant funding (34% and 32% respectively).
- The average value of grants varied across sectors, with IHC grants being of lower value, on average, than those for FDC.
Overall, for-profit services were less likely to receive a grant than not-for-profit services, and the average value of grants received was lower. One reason for this difference is that for-profit services are less common in regional and remote locations, which are the focus of the CCCF.
Figure 3: Proportion of services receiving a CCCF grant by service type and sector and average value of grant 2018–19
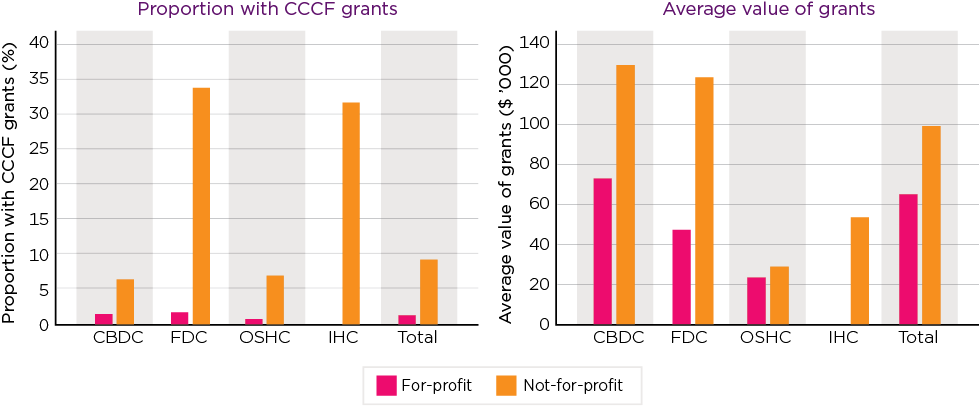
Notes: Only includes grants made for 2018–19. Includes both capital and recurrent grants. Restricted grants take account of adjustments made to the grant level. Open grants have been allocated to the financial year on a pro rata basis taking into account the total period for which the grant was made and the proportion of this period that was within 2018–19.
Source: DESE administrative data and operational reports
Other service characteristics associated with the receipt of grants:
- Reflecting the geographic targeting to the program, 68% of services in very remote locations received a grant, compared with less than 1% of those in capital cities.
- Services with higher representation of particular demographics (e.g. children who are Aboriginal or Torres Strait Islanders and, to a lesser extent, the children of single-parent families) had a higher likelihood of having received a grant.
- Larger services, as measured by the number of children attending, were less likely to receive grant funding.
Financial viability in the ECEC sector
Self-reported viability
To contribute to the understanding of sector viability, services were asked to self-assess their financial viability in the Survey of Early Learning and Care Services (SELCS). This was captured in the survey conducted just before the introduction of the Child Care package, in May–June 2018, and again in June–July 2019.
The reports were varied in both surveys but, overall, were positive, with around one in four strongly agreeing that their service was financially viable, and around four in ten agreeing. See Figure 4. While the responses in 2019 were marginally less positive than those in 2018, the extent of shift was not great.
Figure 4: Services’ self-assessed financial viability, May–June 2018 and June–July 2019
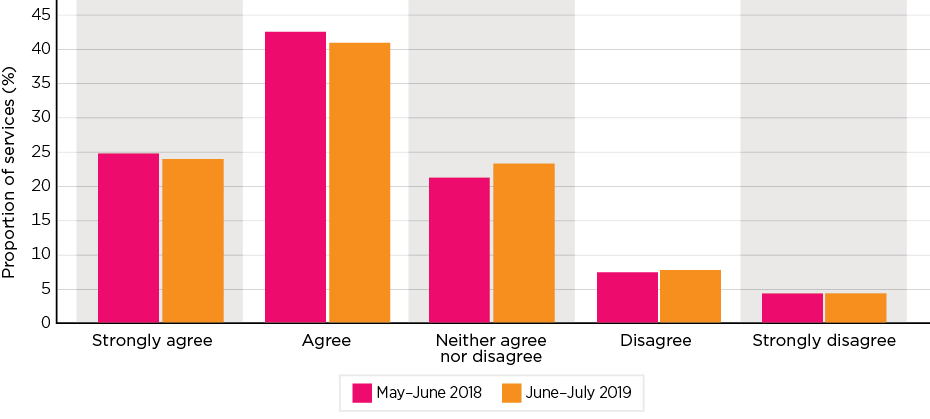
Source: Survey of Early Learning and Care Services, May–June 2018 (Wave 1) and June–July 2019 (Wave 2)
By service type:
- FDC services and IHC services were more negative than other service types about their financial viability. This was especially marked for IHC services. In contrast, OSHC services were more positive than the other sectors about their financial viability.
Some of the other characteristics associated with poorer perceptions of financial viability were:
- services having previously been funded under the Budget Based Funding (BBF) model
- services in the remote parts of Australia and services in the lower socio-economic areas
- smaller services, as measured by number of staff
- services that were not for profit, and particularly government services, relative to for-profit services.
Viability of former BBF services
As noted above, CCCF supports the viability of many of the former BBF services.
In consultation with the sector, several key themes related to financial viability emerged. Some of these were:
- It was considered that for many services, the CCCF grant funding would need to continue to ensure viability.
- Many former BBF services are operating in remote areas, so have high locational costs, which were not taken into account in the funding sourced from CCS.
- Services reported that they had been established to focus on child wellbeing and development, and to meet the needs of local Aboriginal and Torres Strait Islander communities. Their purpose was not seen to be aligned with the overall focus of the Child Care Package on parental workforce participation, including the role of the activity test in determining the number of subsidised hours.
Family Day Care
As noted earlier, the FDC sector declined in size in large part due to compliance measures. While most of the decline has been in the for-profit sector, there has also been attrition in the not-for-profit sector. The FDC sector reported a significantly lower level of self-assessed financial viability and draws on a disproportionate level of financial support through the CCCF.
Issues related to the viability of FDC reported in consultations with the sector and stakeholders as posing challenges for the sector included:
- the lower hourly rate cap relative to that of CBDC
- concerns about debt; in particular, when CCS was recouped by Centrelink8
- concerns about compliance. Services generally supported crackdowns on unscrupulous providers but this was impacting on the sector as services were concerned that any minor lapse in process or other errors could see them subject to compliance action.
However, this sector has some advantage compared to other services in its flexibility. The lower level of reliance upon managing staffing profiles across environments and over times of day enables it to have more flexibility around its service offerings.
In Home Care
IHC is available to families who are in one of the identified cohorts and who are unable to access suitable mainstream care. The different cohorts are parents or carers working non-standard or variable hours, outside normal child care service hours; parents or carers geographically isolated from other types of approved child care, including because they reside in a rural or remote location; and families with challenging or complex needs.
The IHC sector was substantially impacted by changes to the IHC program that accompanied the introduction of the Child Care Package. There was a marked fall in the number of services providing IHC and in families receiving it at the introduction of this new program.
Issues identified as challenging the viability of IHC include:
- difficulties for services in recruiting educators to deliver IHC. Recruitment challenges were impacted by the alignment of IHC to the Child Care Package including new requirements related to the qualification levels of educators. The nature of IHC work also contributes to these difficulties.
- the adequacy of the hourly rate cap. This hourly rate cap was increased significantly six months after the introduction of the Child Care Package (see fees snapshot) but there is still concern that the hourly rate cap does not make provision for care provided at times that penalty rates for educators apply.
These and other issues relating to IHC are discussed in the IHC snapshot.
Issues raised about viability
Across the research underpinning the evaluation a number of aspects of the child care system were cited as being particular risks for the viability of services. These issues are briefly summarised below.
The rate cap, indexation and costs
Services generally saw operational costs increasing, but without recognition of this in the Child Care Package. There were also some specific issues related to the cost of provision of services and how these aligned with the funding model. These included the costs of providing care in high-cost locations, the cost of care out of usual hours that could incur penalty rates for staff, and the costs of care for babies and young children where there are requirements for higher staffing to child ratios.
The charging model and managing debt
The viability of CBDC and OSHC services reflects the underlying sessional structure of care, and charging regimes based on this, that allow services to provide some flexibility to parents in exactly when, within a session of care, children may attend the service. There were concerns that elements of the Child Care Package signalled changes that would move services away from this charging model to a more casualised model that would link subsidies instead to the hours that children attend child care. From a viability perspective, this was viewed with concern, given a service’s costs of providing care are based on the broader session of care, rather than only the hours children attend care.
The new activity test, and bands of subsidised hours, also resulted in many services revisiting their charging models to have session lengths that provided options for parents who were seeking to align their hours charged to their subsidised hours. To meet the needs of more vulnerable or disadvantaged families who were entitled to 24 subsidised hours per fortnight, some services were offering shorter (six-hour) sessions of care. These sessions were often reported to be provided at a cost to the service, although given viability concerns, some services charged the same (or just a little less) for these sessions relative to longer ones.
With regard to charging for child care under the Child Care Package, when families first commence at a service, prior to the determination of CCS eligibility and the rate of subsidy, services are advised to charge full fees until CCS entitlements are confirmed. However, many services instead reported that they estimated the subsidy and charged families accordingly. This came from a position of understanding the difficulties some families face paying full fees and a commitment to service the local community and ensure that children can access education and care. However, this had implications for management of debt when families’ entitlement was later determined to be less than had been anticipated.
Concern about managing debt was a recurrent matter raised by services. In the second wave of the SELCS, 33% of services reported an increase in the amount of debt families owed to the service since the introduction of the Package, while only 11% reported a reduction.
According to a range of evaluation data collections, two main factors that were seen to contribute to this were:
- the charging practices by services when families first commence using a service (see above)
- the requirement for the families’ contribution to child care costs on top of the 5% withholding leading to concerns about affordability and heightened risk that families would build up debt with the service.
Oversupply and the state of the market
Services are offering child care services in a child care market that varies significantly by location, including, in some locations, an oversupply of services. Statistics on vacancies in child care provided some insights on this being quite varied by location. Factors within the local market, over and above any changes introduced through the Package, were important in determining long-term service viability, and markets were often shaped more by local demographic and economic circumstances. The degree of competition affected service offerings in terms of competitive fees and specific facilities offered. Services discussed challenges to remaining viable, while maintaining attention to quality, when operating in an area of oversupply.
Administrative burden
A recurrent theme of administrative burden was cited by many services as impacting their financial sustainability. This included issues with the range of administrative tasks to be done, including those related to the administration of the CCS. Part of this was reported to be the significant ongoing role of services in providing support to parents with their interaction with the CCS.
Summary
The child care sector is dominated by CBDC, accounting for the majority of services and most of the hours of care provided by the sector. Two-thirds of services are for-profit, with this varying by sector and geography. While the child care sector has grown since the introduction of the Child Care Package, the broad pattern of growth is consistent with the pattern of a longer period, although there was some disruption in patterns of exit and entrance coinciding with the introduction of the Package.
In 2018–19, child care subsidies accounted for just over 60% of services’ revenue from care provision.
In broad terms, according to the analysis undertaken for the evaluation, the CBDC and OSHC sectors – the main elements of the child care sector – are robust and viable.
However, it is noted:
- Services’ operational costs were expected to increase, with no evidence of policies that might constrain this.
- In part, viability reflects the underlying sessional structure of care and charging regimes based on this. Concerns remain that there will be further changes to the subsidies that instead assume a more casual charging model, making use of information on children’s attendance rather than sessions.
- The sector has been evolving, including with the consolidation by large providers in both the for-profit and not-for-profit sectors. While this has not changed significantly with the introduction of the Package, it remains a trend that offers both some gains in economies of scale and a capacity to achieve consistent quality but also some dangers of locational monopolies and potentially predatory behaviour.
Particular segments of the sector are facing challenges to their viability. For some, the CCCF funding is particularly important to maintaining viability. Most notably, this includes the former BBF services who are facing other significant challenges, including to their underlying focus on providing culturally appropriate child care to Aboriginal and Torres Strait Islander children in their communities. The FDC sector has been severely impacted by the incidence of fraud and other misconduct, and the actions taken to eliminate this. Further challenges for the sector are apparent in the not-for-profit part of the FDC sector for which one-third of services accessed CCCF funds in 2018–19. IHC services have continued to face challenges, with some of this related to the changes to the program and difficulties recruiting educators to supply the child care.
Issues raised with regard to viability for the sector more generally, in the context of the Child Care Package, included concerns about the basis of charging, issues of debt and the expectation of full–fee charging until determination of eligibility for CCS, and the cost of administrative activities. Across all sectors there are tensions in terms of the viability of services as child care providers seek to balance the provision of early childhood education to support child development with the provision of child care to enable parents to engage in the labour market.
This evaluation reports up to end 2019 and so does not take in to account economic and social disruptions associated with COVID-19.
Child Care Package evaluation
In July 2018 the Australian Government introduced the Child Care Package. The Australian Institute of Family Studies in association with the Social Research Centre, the UNSW Social Policy Research Centre and the ANU Centre for Social Research and Methods were commissioned by the Australian Government Department of Education, Skills and Employment to undertake an independent evaluation of the new Child Care Package. Findings presented here are based on data collected and analysed for the Child Care Package evaluation. The evaluation commenced in December 2017 prior to the introduction of the Package and reported on data collected up to December 2019. The evaluation was impacted by external events, particularly COVID-19, which resulted in the suspension of the child care funding system for a period during 2020. As a result, the evaluation only draws on data to the end of 2019 and does not include data from 2020.
1 The policy settings described in this snapshot refer to those that applied at the time of the evaluation. There have been some updates to policy settings since this time, and the Department of Education, Skills and Employment (DESE) is now the Department of Education.
2 Services may have access to other sources of state or Commonwealth funding that were not part of the Child Care Package, so are not covered here.
3 The 2017–18 estimate is based on the total of CCB (including SCCB and GCCB), CCR, and JETCCFA. This may exclude some CCB lump sums. In 2018–19 total subsidies include CCS and ACCS. No adjustments reflecting reconciliation have been made. This comparison may be impacted by the inclusion of children with no subsidies post-July 2018 and the inclusion of former BBF services only in the 2018–19 data.
4 The for-profit FDC sector was the focus of compliance actions and, in larger states, its role declined dramatically.
5 Also, the Connected Beginnings program provides support to integrate early childhood, maternal and child health, and family support services with schools in a selected number of Aboriginal and Torres Strait Islander communities experiencing disadvantage.
6 Two grant rounds were completed in the period covered by the evaluation. The outcomes of the first round of grants were announced in April 2018, with round 2 outcomes announced in August 2019.
7 Before July 2018, some child care services, including non-mainstream services in rural, remote and Aboriginal and/or Torres Strait Islander communities, were directly funded under the Budget Based Funded (BBF) Program. About 117 former BBF services were providing child care in 2019. More than 3,600 children were using these services in December 2019. A small number of services eligible for these grants fell outside the scope of the evaluation.
8 Where this occurs in FDC it can have a disproportionate impact on the individual educator who is directly affected by the subsidy reduction, in contrast to other service types where the effect is spread out over a larger child and family population.
Australian Institute of Family Studies. (2023). The 2018–2021 Child Care Package Evaluation: Early childhood education and care sector viability. (Findings from the Child Care Package evaluation). Melbourne: Australian Institute of Family Studies.