Child Care Package Evaluation: Final report
Executive summary
Child care plays an important economic and social role in Australia. For parents, it supports their participation in employment, education and training. For children, quality care can support child development, particularly for vulnerable and disadvantaged children and their families. In recognition of its importance, child care in Australia is substantially subsidised by the Australian Government via fee subsidies and some specific direct funding to some services. Child care services are regulated in relation to quality and other aspects of their operation.
In July 2018 the Australian Government introduced the 'Child Care Package' as a significant reform to child care provision and funding. It involved a major restructuring of subsidies and a range of other measures, and significant additional government expenditure. The core objectives of the Package are to support families to be able to access quality early learning, enable and encourage greater workforce participation and simplify child care payments, and targeting assistance to low and middle income families. Its goal was for child care to be 'simpler, more affordable, more accessible and more flexible'.
The new Child Care Package has 2 key elements:
- Child Care Subsidy (CCS) - this is the main form of Australian Government financial support to parents as a subsidy for child care costs. Key elements of this are: a subsidy paid as a proportion of the cost of care up to an hourly fees cap with the rate tapering, from 85 per cent, with increasing income, and with the total value of subsidy capped for some households; along with limits on the number of hours of care for which the subsidy is paid, determined by the level of parents' participation. The subsidy is usually paid to the service as an offset to the fee that would otherwise be paid by the parent.
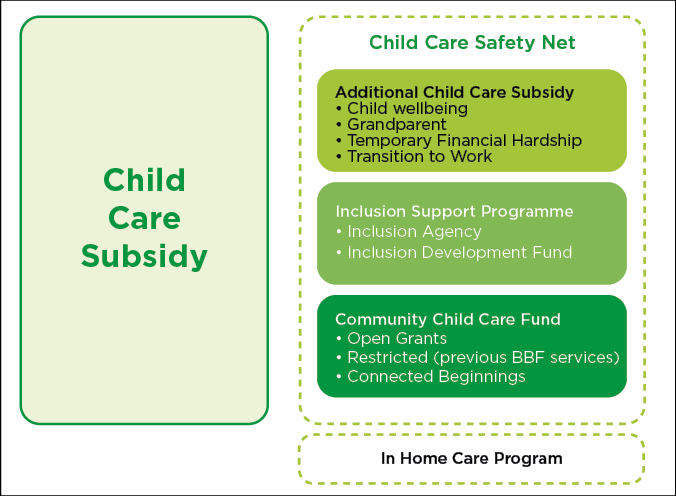
- The Child Care Safety Net comprising:
- Additional Child Care Subsidy (ACCS) - additional fee assistance directed at families and children who may face barriers in accessing affordable child care
- Inclusion Support Program (ISP) - support for services to build their capacity and capability to include children with additional needs in mainstream services
- Community Child Care Fund (CCCF) - grants to child care services to help them address barriers to participation and to support service sustainability, and for services in areas of high unmet demand.
It also involved regulatory change, a new IT system and the incorporation of some 'Budget Based Funding' (BBF) services into the main child care system.
Prior to the Child Care Package, there were 2 main forms of child care assistance for parents: Child Care Benefit (CCB) and Child Care Rebate (CCR); along with a range of complementary programs addressing children with additional needs, and families with barriers to access and services.
The Australian Institute of Family Studies, ANU Centre for Social Research and Methods, UNSW Social Policy Research Centre and the ANU Social Research Centre were commissioned by the Department of Education, Skills and Employment ('the Department') to undertake an evaluation of the new Child Care Package ('the Package'). The evaluation commenced in December 2017 prior to the introduction of the Package in July 2018.
The evaluation primarily considers the impact of the new child care subsidy system (comprising the Child Care Subsidy (CCS), Additional Child Care Subsidy (ACCS) and the Community Child Care Fund (CCCF). It also covers the Inclusion Support Program and the In Home Care Program, which are subject to separate reporting, with some findings synthesised into this overall evaluation.
The evaluation drew heavily upon the administrative data on the children's and families' use of child care along with surveys implemented by the Department and by the evaluation team, as well as extensive qualitative data from consultations and location-based case studies. It also drew upon contemporary literature and data published by the ABS and others.
The evaluation was impacted by external events, particularly COVID-19, which resulted in the suspension of the child care funding system for a period during 2020. As a result, the evaluation only draws on data to the end of 2019 and does not include data from 2020 as originally intended. We, however, consider that the elements of the Package were sufficiently implemented, and the evaluation had collected adequate information, to enable conclusions to be drawn on the program outcomes and impacts.
Use and provision of child care
- In the December quarter 2019 over 1.3 million children from 933,648 families used a child care service in Australia provided by 13,118 child care services. Of these services 61.8 per cent were Centre Based Day Care services, 34.4 per cent were Outside School Hours Care services, 3.5 per cent were Family Day Care Services and 0.3 per cent were In Home Care services.
- Overall, parents have a relatively high level of satisfaction with the quality of child care, with around half stating that they were 'satisfied' and a bit over a third saying they were 'very satisfied'. There was no change in parental satisfaction with the quality of child care with the introduction of the Package.
The evaluation assesses the Child Care Package against 4 key outcomes and 3 key impacts that reflect its policy objectives. In addressing these the evaluation has largely adopted a comparative focus; that is, whether the Package has had any positive or negative impacts relative to outcomes under the previous funding arrangements.
Outcome 1: Child care services are accessible and flexible relative to families' needs, including disadvantaged and vulnerable families
Accessibility
- Access to child care has several dimensions including quality and cost. While access and flexibility for all families is considered, a particular focus is on outcomes for children from more vulnerable groups.
- Analysis of data at the time of the implementation of the CCS and the following 18 months shows no marked changes in access to child care. There are though large differences in access geographically, and issues for children with additional needs.
- Parents generally had a positive view about the accessibility of child care. There was an increase in the satisfaction of parents with a child aged 5-12 years using care with regard to ease in finding quality child care and with child care in a convenient location but not across other measures. For parents with a younger child in child care - that is, for the main group of parents - there was no improvement in satisfaction.
- Some parents report having greater difficulties in accessing child care for children with additional needs. There is also evidence that exclusionary practices within the child care sector are impacting access.
Flexibility
- As part of the Package, regulatory requirements related to the hours and days services must be open and some other regulatory requirements that limited flexibility were removed. Services were encouraged to look at more flexible offerings, including shorter sessions, in response to these changes, and the limits on subsidised hours of care provided under the CCS.
- There are mixed levels of parental satisfaction with flexibility. Capacity to change hours received the second lowest parental satisfaction rating (only above affordability). Other aspects of flexibility were more neutrally rated by parents. These ratings have not changed following the introduction of the Package.
- There was little change in the hours for which care was available since September 2018. Within the Centre Based Day Care sector there has been some shift to services offering shorter sessions and multiple sessions in a day. About one in 20 children are using shorter sessions following the changes, and only 2.2 per cent of children are using 6-hour sessions. Analysis, however, suggests that much of this change has been designed to work around the structure of the CCS to maintain revenue and limit parents' costs, rather than representing any real change in provision. Where shorter sessions have been introduced, they often have fixed and limited start and end times.
- In Home Care does provide a form of flexible care to families, and there is a high degree of satisfaction with In Home Care among those who use it. But there have been challenges with the program, particularly related to the availability of suitably qualified educators. The Family Day Care sector also has the capacity to deliver flexible care.
- The key barriers to providing more flexibility in child care are economic. The failure of services to respond to the demand for these types of flexible care largely reflects the costs involved.
In summary, the introduction of the Child Care Package has had little impact on the accessibility or flexibility of child care provision. There is though considerable variability in experiences of access to child care, and barriers to access for some children, particularly those with additional needs whose access may be affected by exclusionary practices by services. These exclusionary practices warrant further investigation to better understand the extent of them, as well as their cause and impact.
Outcome 2: Access to child care support is simple for families and services
- A key feature of the Package was the replacement of the 2-part, CCB and CCR, subsidy arrangement with the single CCS. This was accompanied by regulatory changes for services to reduce some constraints and streamline processes, along with a new IT system. These were all seen as elements that would improve the simplicity of the provision of child care support. At the same time, more detailed activity testing and the use of Centrelink for all access to subsidies can make the system more difficult to navigate. The system has become simpler for some and more complex for others.
- Parents were only weakly supportive of the system being easier to understand than the previous system, with the largest group neither agreeing nor disagreeing that the CCS system is simpler. Low to middle income earners were more likely to see the new system as being simpler than those on higher incomes.
- For most people, the processes operate relatively smoothly. However, when issues arise, resolution of these are reported as being difficult. Two specific issues had prominence in responses to the evaluation data collections. The first was the 2-stage process associated with agreeing: the Complying Written Agreement and then confirming the enrolment. The second was the operation of both the DESE Helpdesk and Centrelink Helpdesk, with strong negative feedback on these including tardiness and issues not being resolved. There were also concerns raised about the functionality and ease of use of the Centrelink calculator relative to that produced by DESE prior to the transition.
Outcome 3: Child care is affordable to families especially those with limited means
- Improving affordability of child care for low and middle income families was central to the Child Care Package, with the new CCS also including a taper reducing, and then ceasing, the payment of subsidies to high income earners, along with a cap on subsidies for some. The hourly fees cap, indexed by CPI, limited the level of subsidy and was seen as a means of putting downward pressure on fees. The shift to the CCS is estimated to have resulted in additional government expenditure of 6.3 per cent or $453 million in 2018-19 as compared to what would have been spent under the previous system.
- There had been a long history of government interventions to reduce the cost of child care as measured by the CPI. These historically, while reducing the cost in the short term, did not impact the long-term trend, with the cost of child care trending well above the CPI but consistent with trends in earnings.
- Fees charged by services have increased at a similar rate following the introduction of the Package to what they were before the changes, with the exception of In Home Care - where associated with the new program structure, the hourly fee is dramatically higher than under the former program- and in Family Day Care, with a continuing shift from sessional to hourly charging. Moreover, the subsidy fees cap is regularly exceeded by services. This suggests that the Package has not been effective, to date, in reducing increases in child care fees.
- In 2018-19, 13.3 per cent of hours of child care paid for were unsubsidised and 52.6 per cent of families have some unsubsidised hours. While much of the volume of unsubsidised hours relates to people who have no receipt of CCS, the incidence of unsubsidised hours of care, although varying, persists across all points of the income distribution including those on low income, and across the bands of approved hours.
- Extensive modelling was undertaken of the impact of the CCS relative to the CCB/CCR system. This used the 2018-19 population of child care users and estimated, using their actual current fees, income and usage, the value of assistance under the CCS and the old subsidies. This found that the CCS had:
- Reduced the net cost of child care for 62.2 per cent of families using child care, had little impact on the cost for 8.6 per cent and increased the net cost for 29.2 per cent. The annual average income of those that gained was $95,848 compared to $177,240 for those whose cost increased although, overall, there is little difference in net child care costs for the income range $157,335-$240,818 per annum.
- For those with a reduced cost under the CCS, the average proportion of gross income spent on child care fell from 6.7 per cent to 4.5 per cent, with annual net spending falling from $5,412 to $4,026, and the median cost fell from 4.4 per cent of gross family income to 3.2 per cent, and actual spending from $3,472 to $2,436.
- Across all families the Package has reduced the median annual net cost of child care from $2,957 to $2,507 per annum. As a proportion of gross family income, it has fallen from 3.0 per cent to 2.7 per cent.
- The gains were strongest for low income families, families with larger numbers of children using child care, families using longer periods of care and for those using for-profit Family Day Care. Once controlled for family characteristics there were no strong regional effects.
- Parents' survey responses showed a marked and statistically significant increase in parents reporting that child care was affordable following the introduction of the CCS. However, in November 2019, parents with a youngest child aged under 5 were still more likely to disagree (54.7 per cent) than agree (28.4 per cent) that child care was affordable, although those with older children were more equally balanced.
- The Consumer Price Index shows that the changes resulted in an 11.8 per cent decline in the costs of child care in September 2018. Prices have been adjusted at a faster rate than the overall CPI since June 2018. By March 2020 almost three-quarters of the reduction in the child care CPI had been lost.
- The annual subsidy cap only impacts a small number of families (about 14,500 in 2018-19) mainly in the income band of $186,958-$251,248, and it is estimated that it only reduced government expenditure on CCS by $24 million in 2018-19.
- More broadly, while the higher benefits from the Package have reduced the immediate cost of child care to families, there is little evidence in the data available to the evaluation of the hourly fee cap working as a constraint on fees being charged by services. Additionally, there is a significant group of parents being charged for hours beyond those subject to the CCS.
Outcome 4: Child care services are viable and the sector robust
- It is noted that this evaluation is of the operation of the system to the end of 2019 and thus does not take account of the economic and social disruptions associated with COVID-19.
- In 2018-19 child care subsidies accounted for some 60.7 per cent of services' revenue from care provision. The largest parts of the sector, Centre Based Day Care and Outside School Hours Care, are considered to be robust and viable. Other than a spike at the point of introduction, there was no change in the level of new services entering and exiting.
- Since Q2 2017 there has been strong growth in the number of Centre Based Day Care services and a marked decline in Family Day Care, with 79.6 per cent of exits in this sector being associated with government compliance activity.
- The roles of these sectors vary considerably across locations, with the not-for-profit sector providing an increasing proportion of services outside the capitals, especially in non-urban locations. There has been a trend towards consolidation across the sector. At the provider level, the Outside School Hours Care sector is the most concentrated and the only sector identified as consistently becoming more concentrated (i.e. the extent to which market share is concentrated among a small number of providers) over the past 3 years.
- Analysis of self-reported service viability indicates that most services viewed themselves as viable, although there was a slight, but statistically significant, drop in this pre and post the introduction of the Package. Relative to Centre Based Day Care, the In Home Care sector was much more negative, and Family Day Care somewhat more negative about their viability, while Outside School Hours Care services were more positive.
In summary, the introduction of the Package appears to have had little impact on the viability of the sector as a whole. The for-profit Family Day Care sector has been the focus of compliance actions and, in larger states, its role has declined dramatically; at the same time, there has been a small but steady reduction in the for-profit sector. In the In Home Care sector, the new program and the increase in subsidy rates are still bedding down and longer-term viability is unclear. A number of services, in particular former BBF services, are effectively underpinned by the CCCF, with the program appearing to be acting, and potentially required, as an ongoing complementary funding stream for services that are unlikely to be viable under the CCS alone.
Impact 1: Parents of children can engage in work, education and the community
- The Package was designed to increase parents' participation in employment. More affordable, flexible and accessible child care was designed to increase the financial returns from employment and to allow parents to increase their workforce participation.
- ABS Labour Force Survey data, surveys of parents conducted for the evaluation and child care system administrative data show small increases in parental activity, including employment, since the Package was introduced. However, these increases are not inconsistent with increases over a period of years.
- When asked about changes in employment in response to the Package, some parents reported increasing activity and others reducing, consistent with expected economic behaviour. On average, the proportion reporting an increase was higher than those reporting a fall; by some 1.5 percentage points for single parents and 1.9 percentage points for couples. These results though were not statistically significant. There is no data available on the actual magnitude of this increased activity.
- The introduction of the Package has reduced the Effective Marginal Tax Rates (EMTRs) facing parents increasing their work activity, although they remain very high for some. A range of scenarios were modelled and across these there was an average reduction of 8.5 percentage points in the impact of EMTRs on the earnings parents would gain from working an additional day. After these reductions, the median EMTR was 67.5 per cent, and a quarter of the scenarios had an EMTR of over 78.3 per cent. Generally, single parents had higher EMTRs than a second earner in a couple, and the EMTR tended to be higher when people moved, for example, from 4 to 5 days work, than from zero to one day.
In summary, the evidence suggests that the Package has had diverse impacts on parents' participation in employment. While, on balance, positive, the extent of this is small, and the overall trends are not inconsistent with historical trends in the workforce participation of families with children.
Impact 2: Vulnerable and disadvantaged children are engaged and supported
- The introduction of the Package has had little impact on the overall use of child care among low and lower middle income families. Analysis indicates a small increase (0.2 of a percentage point) in participation for children aged 0-4 years who live in families in receipt of FTB, and a slightly larger but still small fall (0.6 of a percentage point) for those 5-12 years. There is no clear pattern on access for population subgroups, including those at a higher risk of vulnerability. Relative to overall changes, children of parents on a humanitarian visa, some children whose parents were in receipt of full-rate income support and some lower income single parents had a decrease in access, while Aboriginal and Torres Strait Islander children had a more positive shift. However, these changes are mostly small and do not represent a substantive change in access.
- While access levels are close to overall community rates for some groups, such as children with identified health conditions, there are substantially lower participation rates for a number of vulnerable groups. These include Aboriginal and Torres Strait Islander children, low income families, especially those reliant on income support, some groups of children with CALD backgrounds, including children of humanitarian visa holders. A central issue is the extent to which these groups do not just require 'equal access' and are not obtaining this but, rather, for many of these children early childhood education can play a critical role in addressing their disadvantage.
- The reduction in the minimum hours of subsidised care from 24 hours a week to 24 hours per fortnight has disproportionately impacted children in more disadvantaged circumstances.
- Overall, the ACCS appears to be effective, but with a significant administrative overhead and with a number of aspects of its operation, including continuity of support, initial access, treatment of kinship and other caring arrangements and the concepts of child wellbeing and 'at risk' having potential for refinement.
Impact 3: Child care funding is sustainable for government
- There is little evidence of any changes to the economic fundamentals of child care provision. While the industry is robust, and there is evidence of continued investment, this appears to be more related to the maturing of the sector and competition for market share. The main driver of cost is wages and it is to be expected that these, consistent with wage growth, will increase at a rate above CPI.
- The evaluation did not identify any significant changes that would impact the ongoing drivers of costs in the provision of child care. Historically, while a series of other subsidy and related interventions have been successful in reducing the real cost of child care to families in the short term, none to date has changed the longer-term trajectory.
The assessment of the sustainability of child care funding is essentially an issue for government in terms of a balance of revenue and expenditure priorities. The evaluation did not address this question. From the evaluation findings there is little evidence of the Package impacting the fundamental drivers of cost in the provision of care. While indexation of the fees cap to the CPI will curtail the extent of cost increases to the government, this is by transferring these to parents.
Recommendations
- The evaluation has made a number of recommendations:
- Specific recommendations are made about improving processes when children commence care, review of approved hours under the activity test and safety net, especially for those with 24 hours a fortnight, the removal of the annual benefit cap, refinement of aspects of the ACCS, and reviewing the helpdesks and the calculator.
- More broadly, the evaluation notes there are significant challenges in the provision of early childhood education and care, including the balance between child care as an enabler of parental workforce participation and the role of early childhood education and care in child development and as an instrument to address disadvantage.
Glossary
| Abbreviation | Description |
|---|---|
| ABS | Australian Bureau of Statistics |
| ACCS | Additional Child Care Subsidy |
| ACECQA | Australian Children's Education and Care Quality Authority |
| AEDC | Australian Early Development Census |
| AIFS | Australian Institute of Family Studies |
| ANAO | Australian National Audit Office |
| ANU | Australian National University |
| ANZSCO | Australian and New Zealand Standard Classification of Occupations |
| ARIA | Accessibility/Remoteness Index of Australia |
| ASCO | Australian Standard Classification of Occupations |
| ATO | Australian Taxation Office |
| BBF | Budget Based Funded Program |
| CALD | Culturally and Linguistically Diverse |
| CAPI | Computer Assisted Personal Interview |
| CATI | Computer Assisted Telephone Interview |
| CBDC | Centre Based Day Care |
| CCB | Child Care Benefit |
| CCB/CCR CCB/R | Former funding model comprised of CCB and CCR |
| CCCF | Community Child Care Fund |
| CCSS | Child Care Subsidy System (formerly the Child Care IT System (CCITS)) |
| CCMS | Child Care Management System |
| CCPFamS | Child Care Package Families Survey |
| CCR | Child Care Rebate |
| CCS | Child Care Subsidy |
| CCTR | Child Care Tax Rebate |
| CPI | Consumer Price Index |
| CRN | Customer Reference Number |
| CSP | Community Support Program |
| Cpl | Couple |
| CWA | Complying Written Arrangement |
| DESE | Department of Education, Skills and Employment. Also refers to predecessors: Department of Education and Training to 29 May 2019, and Department of Education to 1 February 2020 |
| DET | (Former) Department of Education and Training - see DESE |
| DHS | Department of Human Services (On 1 February 2020, DHS became Services Australia) |
| DSS | Department of Social Services |
| ECE | Early Childhood Education |
| ECEC | Early Childhood Education and Care |
| ECEI | Early Childhood Early Intervention |
| EMTR | Effective Marginal Tax Rate |
| FDC | Family Day Care |
| FTB | Family Tax Benefit |
| FTE | Full-time equivalent |
| GCCB | Grandparent Child Care Benefit |
| GST | Goods and Services Tax |
| HILDA | Household, Income and Labour Dynamics in Australia Survey |
| IAS | Indigenous Advancement Strategy |
| IHC | In Home Care |
| IRSAD | Index of Relative Socio-Economic Advantage and Disadvantage |
| ISP | Inclusion Support Program |
| IS | Income Support |
| IT | Information Technology |
| ITRG | Implementation and Transition Reference Group |
| JETCCFA | Jobs, Education and Training, Child Care Fee Assistance |
| LDC | Long Day Care |
| LinA | Life in Australia survey |
| LOTE | Language Other Than English |
| NDIS | National Disability Insurance Scheme |
| NFF-OCC | Non-Formula Funded Occasional Child Care |
| NHMRC | National Health and Medical Research Council |
| NQA ITS | National Quality Agenda Information Technology System |
| NQF | National Quality Framework |
| NQS | National Quality Standard |
| OECD | Organisation for Economic Co-operation and Development |
| OLS | Ordinary Least Squares |
| ORIMA | ORIMA Research Pty Ltd |
| OSHC | Outside School Hours Care |
| PAES | Portfolio Additional Estimates Statements |
| PEP | Provider Entry Point |
| PIR | Post Implementation Review |
| PolicyMod | ANU Centre for Social Research and Methods microsimulation model |
| PRODA | Provider Digital Access |
| rhs | right hand scale |
| SCCB | Special Child Care Benefit |
| SEIFA | Socio-Economic Indexes for Area |
| SELCS | Survey of Early Learning and Care Services |
| SES | Socio-Economic Status |
| SNAICC | SNAICC (Secretariat of National Aboriginal and Islander Child Care) - National Voice for Children |
| SIH | Survey of Income and Housing |
| SP | Single Parent |
| SPRC | Social Policy Research Centre |
| SRC | Social Research Centre |
| UNSW | University of New South Wales |
1. Introduction: The Child Care Package
This is the final evaluation report on the Child Care Package that was introduced by the Australian Government, in large part, in July 2018.
Due to the impact of COVID-19, some aspects of the evaluation of this program were curtailed, and the timing of the final report brought forward from mid 2021 to early 2021. Specifically:
- The evaluation focuses on the implementation and outcomes of the program to end December 2019, as after this date parents using child care and services were significantly affected by the pandemic and policy responses to it. In the case of child care, this included the introduction of an Early Childhood Education and Care Relief Package which operated from 6 April to 12 July 2020 and which included the suspension of Child Care Subsidy payments, a Transition Payment over the period 13 July to 27 September 2020 involving a reintroduction of the payments, and a Recovery Package commencing on 28 September 2020 and which was anticipated to continue to 31 January 2021.
- A number of data collection activities envisaged as providing central inputs into the final evaluation were not able to be conducted. This included not being able to undertake the third wave of the services survey.
1.1 The Child Care Package
In July 2018 the Australian Government introduced the 'new Child Care Package' through the Family Assistance Legislation Amendment (Jobs for Families Child Care Package) Act 2017. The new Child Care Package has 4 key elements:
- Child Care Subsidy (CCS) - the main form of Australian Government financial support to parents as a subsidy for child care costs
- Additional Child Care Subsidy (ACCS) - additional fee assistance directed at families and children who may face barriers in accessing affordable child care
- Inclusion Support Program (ISP) - support for services to build their capacity and capability to include children with additional needs in mainstream services
- Community Child Care Fund (CCCF) -enables grants to child care services to help them address barriers to participation and to support service sustainability, and funding for services in areas of high unmet demand.
The Additional Child Care Subsidy, Inclusion Support Program and Community Child Care Fund are collectively referred to as the Child Care Safety Net that provides additional targeted assistance for disadvantaged communities and vulnerable children and their families to address barriers to participation in child care and employment. The structure of the program is illustrated in Figure 1.
Figure 1: Structure of the Child Care Package
1.1.1 Program objectives
The Package's core objectives include addressing issues of affordability and increasing costs, improving flexibility and increasing the targeting of financial assistance, in particular, to support those parents who are working or looking for work.
This was articulated in the second reading speech by the Minister for Social Services as:
Almost one million Australian families will benefit as a result of this child care assistance package. Low- and middle-income families will be the greatest beneficiaries …
Together, these reforms will ensure that, in a fiscally sustainable way, we can achieve three important goals:
- continue to assist families in raising their children and provide access to quality early learning opportunities over the long term
- enable and encourage greater workforce participation; and
- simplify our child care payments and social security systems …
Our objective is to help parents who want to work, or who want to work more, while still focusing on early childhood education.
Having two parents in paid employment has become the preferred choice for most families because of the changes in our society and economy over many years. More affordable access to quality child care puts the opportunity of work within far better reach of more families.
The Jobs for Families Child Care Package is designed to support more families, including jobless families, to increase their participation in work, training, study or volunteering. The government's significant investment is targeted to those who need it most - low and middle income families who are juggling work and parenting responsibilities. (Porter, 2016)
The policy was seen as a major initiative. Minister Porter referred to it as a 'once in a generation reform to child care' (Porter, 2017a), a sentiment reflected in the Departmental media release on the passing of the legislation:
This legislation gives effect to the most significant reform to the early education and care system in decades and will better target those who want work or work more. It will give around one million Australian families relief from out-of-pocket child care cost pressures and provide more children with the opportunity to benefit from early education.
Over the next 15 months, the Australian Government will implement a new child care system which is more affordable, accessible and flexible. (Department of Education, Skills and Employment (DESE), 2017)
1.1.2 Implementation
The Australian Government Department of Education, Skills and Employment (DESE)1 is responsible for the implementation of the Package, with the operationalisation of the CCS through the Centrelink element of Services Australia, an agency within the Social Services portfolio.
The Child Care Subsidy commenced operation on 2 July 2018. Its introduction was complemented by a new Information Technology system which was developed with the objective of providing a simpler interface for both parents and services, and to automate the payment system. This includes, as of January 2019, a requirement for services to report actual 'in' and 'out' times of children as part of sessional reporting.
Changes were also made to the child care services regulatory framework. These included a strengthened set of requirements that services need to comply with, including reporting on children's actual hours of attendance, as well as the removal of some requirements related to hours of operation.
Some elements of the Package were implemented prior to the introduction of the Child Care Subsidy, with the Child Care Safety Net being progressively rolled out from July 2016. At this time, the Inclusion Support Program was introduced, as was the Connected Beginnings program, which is part of the Community Child Care Fund. Another early element of the Child Care Package was the Nanny Pilot Programme, initially called the Interim Home Based Carer Subsidy Programme. A new In Home Care (IHC) program was introduced in July 2018, which replaced the previous In Home Care program and the previous Nanny Pilot Programme.
Since its initial implementation, a number of changes and other measures have been introduced. In addition to those associated with COVID-19, as detailed in the introduction, these include:
- A set of mainly technical reforms in a series of legislative instruments. Of note these included: an extension of the 'eight week' rule (see Chapter 3); increases in the In Home Care hourly rate (see Chapter 4); and the removal of the 50 per cent ACCS (Child Wellbeing) rule (see Chapter 7).
- Changes to the Inclusion Support Program, including revised guidelines issued in March 2020 and changes in the IT environment for this program.
- Additional emergency measures, mainly through the Community Child Care Fund (CCCF) program to support services adversely affected by drought and bushfires, but also including support for families in bushfire declared areas by exempting them from the CCS activity test for the financial year.
In addition to these, enhanced compliance activities in the child care sector, initially introduced in 2014, and mainly directed at addressing fraud and related misconduct, have been maintained. The impacts of these - in particular, with regard to Family Day Care services - are discussed in Chapter 9.
1.1.3 The Child Care Subsidy
The Child Care Subsidy (CCS) is the main element of the Package and provides targeted assistance with the cost of child care. The parameters of the system include:
- a cap on the hourly rate charged for child care to which the subsidy rate will apply
- a subsidy rate that declines as family income increases
- an annual cap on the total level of assistance paid to some higher income households
- a limit on the number of hours of care for which the subsidy is payable for each child based on an activity test applied to the parent(s).
In addition, parents are required to meet residency requirements, and the child must meet immunisation requirements, be aged 13 years and under, and not be attending secondary school.2
The change to the CCS also introduced the concept of a family co-contribution, so that families pay a portion of their child care fees.3 There are, however, intersections between this and the Additional Child Care Subsidy (ACCS), which tops up the subsidy for families and children facing barriers to accessing affordable child care (see discussion of ACCS below).
Notionally, the CCS is calculated as a direct offset to the charges that would otherwise be paid by the parents. However, in most cases, the actual subsidy paid to a provider is 95 per cent of the amount of CCS the parent is eligible for, as 5 per cent of parents' actual entitlement is initially withheld by government.4 After annual reconciliation, this withheld amount is either then paid to the family or is used to offset any debt they may have to the Commonwealth; in particular, where an underestimation of annual income has resulted in the subsidy being paid at an incorrect and higher rate.
- Key features of CCS are 3 parameters that determine the financial level of subsidy, and one on the quantum of child care that is subject to the subsidy.
- The hourly rate caps are a limit on the rate charged by child care providers that is subject to the subsidy. Where a provider charges a rate less than the cap, families will receive their applicable percentage of the actual fee charged, while where the rate charged is above the cap, the percentage applies to the hourly rate cap.5 As of 1 July 2019, the rate cap was: $11.98 for children below school age and $10.48 an hour for school-aged children in Centre Based Day Care and Outside School Hours Care; $11.10 per hour for Family Day Care, and on a per family basis $32.58 for In Home Care. These caps are to be indexed annually based on the All Groups CPI.
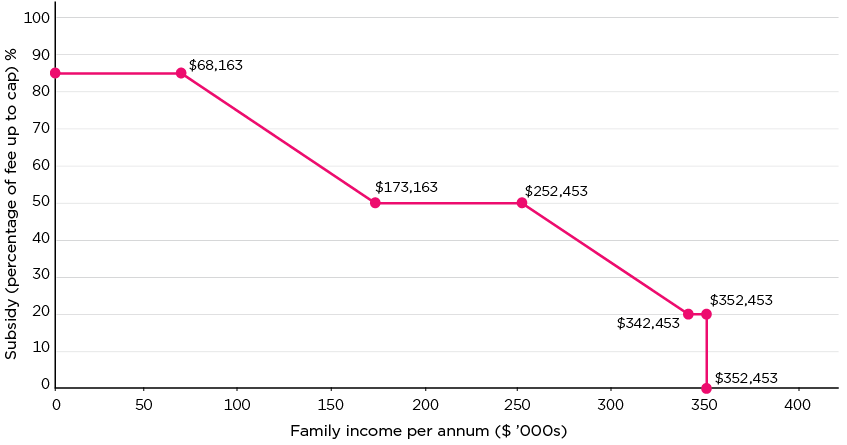
- The percentage of Child Care Subsidy rate is the proportion of the capped fee that is provided as a subsidy and is based on a sliding scale that reduces with family income. For 2019-20 the maximum rate is 85 per cent for families with an income of up to $68,163. The rate of assistance then tapers to 50 per cent at an income of $173,163, remaining at this rate up to a family income of $252,453, before again tapering to a rate of 20 per cent at $342,453, and holding at this rate until family income reaches $352,453.6 Families with an annual income at or above this amount have zero Child Care Subsidy entitlement. (See Figure 2).
Figure 2: Child Care Subsidy, rate of subsidy by family income, 2019-20
Source: Derived from program criteria
- The annual cap is the maximum level of subsidy that will be paid to a family in any one year. For 2019-20 it was $10,373 per child per annum and applies to families with a joint income over $188,163 (and less than $352,453) per annum.7 For families with lower incomes there is no cap.
- The activity test operates to restrict the number of hours of Child Care Subsidy a family is entitled to, on a per child per fortnight basis, with the number of hours being determined by the level of 'recognised activity' parents are engaged in. Reflecting the program's focus on participation, and employment in particular, 'recognised activity' includes: paid work; self-employment; unpaid work in a family business; looking for work; volunteering; and studying. When applied to couples, the test is based on the hours of activity of the member with the fewest hours. There are a number of exemptions to the activity requirement for some families. Table 1 illustrates the operation of the activity test and details the main exemptions.
| Step | Hours of approved activity per fortnight | Maximum number of fortnightly hours of subsidy per child |
|---|---|---|
| Persons subject to the activity test | ||
| 1 | 8 hours to 16 hours | 36 hours |
| 2 | More than 16 hours to 48 hours | 72 hours |
| 3 | More than 48 hours | 100 hours |
| Activity test exemptions 8,9 | ||
| Child Care Safety Net - families with an annual income of $68,163 or less who do not meet the activity test | 24 hours | |
| Families who do not meet and are not exempt from the activity test and have a preschool aged child who attends preschool at a centre based day care service (for preschool child only) 10 | 36 hours | |
| Includes: Grandparent principal carers, Disability Support Pensioners and Carer Payment recipients 11 | 100 hours | |
1.1.4 The Child Care Safety Net
The 3 elements of the Child Care Safety Net have been identified above. The specific objective of these is described by the Department as giving 'the most vulnerable and disadvantaged children, as well as those from regional and remote communities, a strong start through access to quality early childhood education and care' (DESE, 2020a).
Additional Child Care Subsidy
The Additional Child Care Subsidy (ACCS) is a top-up payment to the Child Care Subsidy. It provides additional fee assistance to families and children facing barriers in accessing affordable child care. As with the Child Care Subsidy, it is paid to services as an offset to the charge on parents. It has 4 components:
- ACCS (Child Wellbeing) is for children who are at risk of serious abuse or neglect.
- ACCS (Grandparent) supports grandparent primary carers, who receive an income support payment.
- ACCS (Temporary Financial Hardship) is short-term increased child care fee assistance to families who, due to exceptional circumstances, are experiencing significant financial stress with the cost of child care.
- ACCS (Transition to Work) is for parents who are transitioning from income support to work by engaging in work, study or training activities.
With the exception of the Transition to Work element, the subsidy is equal to the actual fee charged (up to 120 per cent of the hourly rate cap), and is provided for up to 100 hours per fortnight without an activity test. In the case of the Temporary Financial Hardship element, the activity exemption applies for a maximum of 13 weeks per financial hardship event. Under the Transition to Work element, the subsidy is equal to 95 per cent of the actual fee charged (up to a rate equal to 95 per cent of the hourly rate cap), with the number of hours of subsidised care being determined by the individual's activity test result, while the duration of assistance varies with the activity undertaken. In addition, the subsidy can continue for a further 12 weeks if parents gain employment and their income support payments cease. Assistance under the Child Wellbeing provision can be initially granted for 6 weeks on the basis of a certificate issued by the service provider, and for renewable periods of 13 weeks on the basis of a determination by Services Australia.
Inclusion Support Program
The Inclusion Support Program provides support to early childhood and child care services to build their capacity and capability to include children with additional needs in mainstream services. It commenced in July 2016 and replaced the previous Inclusion and Professional Support Program. It aims to increase the proportion of children with additional needs attending mainstream services, improve the capacity of the sector over time and ensure parents of children with additional needs have access to appropriate and inclusive child care services.
Under the program, support is provided to services to enable them to provide inclusive approaches to the provision of child care. This includes, but is not limited to, inclusive practices for children who may have additional needs as they:
- have a disability or developmental delay
- are presenting with challenging behaviours
- have a serious medical or health condition, including mental health
- are presenting with trauma-related behaviours.
And in meeting the needs and requirements of:
- Aboriginal and Torres Strait Islander children
- children from culturally and linguistically diverse backgrounds
- children from refugee or humanitarian backgrounds.
The program operates through 7 state/territory-based Inclusion Agencies (essentially community-based organisations), along with a national Inclusion Development Fund Manager responsible for the management of the Inclusion Development Fund. Support under the Inclusion Support Program is implemented through Inclusion Professionals, employed at the Inclusion Agencies. These agencies undertake a range of roles in providing support to services to generally develop more inclusive approaches, support in the development of Strategic Inclusion Plans, and specific in providing support to assist services address barriers that individual children or groups of children may face. Inclusion Agencies operate equipment libraries for use by services.
There are 4 streams of funding available through the Inclusion Development Fund:
- A subsidy for an additional educator in centre-based services to support ongoing high support needs, prioritised to assisting children with a diagnosed disability.
- A subsidy for immediate/time-limited (up to 8 weeks12) support for centre-based services where there is an immediate barrier to enrolling a child with disability or other additional needs and while an alternative and more stable solution is being determined.
- Top-up support for Family Day Care services where an educator is unable to enrol the maximum number of children they are permitted to because of the demands on the educator of including a child with a disability or high care needs.
- Innovative Solutions Support that allows all service types to receive financial support for creative solutions to address barriers to inclusion.
Services wishing to access financial support through the Inclusion Development Fund must first develop a Strategic Inclusion Plan, except those applying for immediate support. The Strategic Inclusion Plan, developed through collaboration with the Inclusion Agency, outlines the current inclusion practices of the service, barriers to inclusion, and strategies to address those barriers. It may also involve inclusion-related training, development of policies and procedures, sourcing resources from the local community, changes to educators' planning and pedagogy, and modifications to the child care and early learning environment. While part of this evaluation, it is noted that some aspects of the evaluation of the Inclusion Support Program are continuing beyond the scope of this report.
Community Child Care Fund
The Community Child Care Fund (CCCF), the third element of the Child Care Safety Net, provides grants to child care services to help them address barriers to participation. The purpose of the fund, as described in 2017 by the then Minister for Education and Training, was to help 'new and existing services, particularly in rural, regional or vulnerable communities, to reduce the barriers for families to access those services and to increase the supply of places in areas of high, unmet demand' (Birmingham, 2017). More specifically the fund is designed to:
- reduce barriers in accessing child care, in particular for disadvantaged or disadvantaged and vulnerable families and communities
- provide sustainability support for child care services experiencing viability issues
- provide capital support to increase the supply of child care places in areas of high unmet demand.
One specific objective of the program is to assist former Budget Based Funded services to transition to the new child care arrangements.
The program has 3 components:
- CCCF Open Competitive Grants: These are available to eligible, approved child care services and are intended to supplement fee income. Eligibility targets services operating in selected disadvantaged communities, with funding awarded for up to 5 years.
- CCCF Restricted Non-Competitive Grants: To help eligible former Budget Based Funded services (and a small number of other services, see Section 9.7) to build capacity and operate sustainably under the new child care system and support services to increase participation by Aboriginal and Torres Strait Islander children.
- Connected Beginnings: To help Aboriginal and Torres Strait Islander children in areas of high need to be well prepared for school by supporting pregnant Aboriginal and Torres Strait Islander women and Aboriginal and Torres Strait Islander children from birth to school age. Connected Beginnings has operated since July 2016 and provides support to integrate early childhood, maternal and child health, and family support services with schools in a selected number of Aboriginal and Torres Strait Islander communities experiencing disadvantage. This program is jointly funded and implemented by the Federal Departments of Education, Skills and Employment, and of Health, with an annual budget of around $12 million. While Connected Beginnings was separately evaluated, the findings from this have been drawn upon in Chapter 7.
1.1.6 Former child care funding model
Prior to the Child Care Package, there were 2 main forms of child care assistance: the Child Care Benefit (CCB) and Child Care Rebate (CCR).
CCB was a means tested benefit covering up to 50 hours of approved child care use per child per week provided that parents satisfied an activity test of at least 15 hours per week. Families that did not meet the activity test were eligible for CCB for up to 24 hours of child care per child per week. The maximum rate of CCB was $4.30 per hour for a non-school child ($215 for a 50-hour week), and 85 per cent of this rate for a school-aged child. The maximum rate of Child Care Benefit was payable for families with an annual income under $45,114 or families on income support with the rate then reducing up to a limit of $156,914 for a family with one child in care, with this cap increasing with the number of children.
In addition, parents were eligible for CCR. This was a non-means tested payment that provided up to 50 per cent of a family's out-of-pocket child care expenses (after CCB was deducted) to a maximum of $7,613 per child per year. To be eligible for the rebate, parents were required to have had some work, training or study related commitments during the week, although there was no minimum number of hours of such activity required.
There were a range of different payment options available to parents, including whether assistance was paid directly to services as an offset to fees, or was paid to parents periodically or annually. CCB was subject to an annual reconciliation process as it was paid on the basis of estimated income.
These payments were complemented by a range of other assistance including Jobs, Education and Training Child Care Fee Assistance, and Special and Grandparent Child Care Benefit, and the Community Support Program, the In Home Care and Nanny Pilot Programs and the Inclusion and Professional Support Program. Additionally, some child care services, including non-mainstream services in rural, remote and Aboriginal and Torres Strait Islander communities, were directly funded under the Budget Based Funded Program.
1.1.7 Other changes
The introduction of the Child Care Package also involved some structural and related changes.
Service classification
There was a consolidation of types of child care service. Specifically:
- Long Day Care services and Occasional Care Services were classified together as Centre Based Day Care Services.
- Before-School, After-School and Vacation Care services were grouped together as Outside School Hours services (in many cases involving what had been previously treated as 3 separate services even where they were run by the same organisation now being seen as a single service).
- Budget Based Funded (BBF) services were reclassified on the basis of their type of service - typically Centre Based Day Care services or Outside School Hours Care Services.
- The funding changes, along with this classification, also resulted in those children attending these services being recorded in the Child Care IT environment.
For ease of analysis, reporting about services uses the new classification even when reporting on child care prior to July 2018, except where there is specific analysis relevant to one of the old sectors.
In particular, some dedicated analysis of the former BBF services is presented in the report, given the need to explore the transition experiences and outcomes for those services. These services were eligible for CCCF-restricted funding upon transition to the Child Care Subsidy. However, the former BBF services were identified in survey and interview data to allow a focus on them, separate to other services in the Child Care Package that are eligible for CCCF-restricted grant funding.
Program nomenclature and change
Additionally, it is noted that while there appear to be a number of analogues between the old and new program environments, there are frequently considerable differences in the actual nature of the programs. This applies in particular to:
- In Home Care under the new arrangements and the former In Home Care Programme and Nanny Pilot Programme
- Additional Child Care Subsidy (Child Wellbeing/ Grandparents/Temporary Financial Hardship/ Transition to Work) relative to the Jobs, Education and Training Child Care Fee Assistance, and Special and Grandparent Child Care Benefit programs
- the Inclusion Support Program and the former Inclusion and Professional Support Program.
Priority placement
The introduction of the new program saw the removal of the 'Priority of Access Guidelines' that services were required to use to allocate available places. These identified 2 priority groups: Priority 1 - a child at risk of serious abuse or neglect; and Priority 2 - a child of a single parent who satisfies, or of parents who both satisfy, the work, training, study test, and a need to provide within these groups and in enrolling children outside of these groups, priority to: Aboriginal and Torres Strait Islander families; families that include a disabled person; low income families and those on income support; families from a non-English speaking background; socially isolated families; and single parent families.
1.2 The broader environment
The child care program operates in a wider context and there are interactions between it and other interventions. Three of particular note are:
- quality monitoring and assessment
- preschool education
- preschool education
1.2.1 Quality monitoring and assessment
The day-to-day monitoring of the quality of child care provision is a state/territory government responsibility being undertaken by these governments, usually through education departments or agencies. The activity fits into a broader National Quality Framework (NQF) that includes the Australian Children's Education and Care Quality Authority (ACECQA), an independent national authority, that assists governments in administering the framework; National Quality Standards (NQS) that establish a national benchmark for the provision of quality services across 7 areas, which then feed into the national quality rating system under the aegis of ACECQA; and the Education and Care Services National Law (National Law) and related regulations that form a national system for the regulation and enforcement of the NQS. While nationally consistent, this law is legislated individually in each state or territory.
A total of 15,004 Early Childhood Education and Care (ECEC) services were rated under the NQF in Q4 2019. Of these 12,007 were child care services, with the others being preschools and kindergartens. The NQS quality ratings of child care services are considered in Chapter 2.
1.2.2 Preschool
The Australian Early Childhood Education and Care system encompasses both preschool and child care. The relationship between these functions, and the way in which they are delivered, varies significantly across the country. This is illustrated in Table 2. While in some states/territories including South Australia, Western Australia, Tasmania and the Northern Territory, preschool education mainly takes place in the education system, in New South Wales and Queensland it is overwhelmingly delivered in the child care sector, with this largely also being the case in Victoria, although that state also has a strong independent community based preschool sector.
NSW | Vic. | Qld | SA | WA | Tas. | NT | ACT | Aust. | |
|---|---|---|---|---|---|---|---|---|---|
Composition of preschool education delivery (%) | |||||||||
| Government School | 4.1 | 10.7 | 1.9 | 46.1 | 54.7 | 49.6 | 61.5 | 37.2 | 15.9 |
| Private school | 1.8 | 2.6 | 3.1 | 3.2 | 19.8 | 14.8 | 2.9 | 2.6 | 4.5 |
| Community | 22.0 | 31.2 | 23.1 | 0.7 | 0.0 | 0.0 | 0.0 | 0.0 | 19.9 |
| Other | 0.0 | 0.1 | 0.1 | 0.0 | 0.0 | 0.0 | 0.0 | 0.0 | 0.0 |
| Mixed provider type | 6.4 | 9.3 | 4.1 | 18.7 | 19.7 | 12.9 | 22.4 | 24.4 | 9.6 |
| Within CBDC | 65.7 | 46.1 | 67.8 | 31.4 | 5.7 | 22.7 | 13.1 | 35.9 | 50.1 |
| Total | 100.0 | 100.0 | 100.0 | 100.0 | 100.0 | 100.0 | 100.0 | 100.0 | 100.0 |
Source: Australian Bureau of Statistics: Preschool Education, Australia, 2019
The nature of preschool provision within child care services was one of the aspects of the pre-transition child care structure examined in the Baseline Survey of Early Learning and Care Services (SELCS)13 undertaken in April 2018. Across services as a whole, excluding Outside School Hours Care where most children were of an older age group, 88.4 per cent of those responding that had children in the preschool age group reported providing a preschool or kindergarten program for children in the year before full-time school. Among Long Day Care services14 this proportion was 93.7 per cent, with a further 3.0 per cent arranging access to a program run externally. Just 3.3 per cent said they made no provision. Across the Family Day Care sector, 35.5 per cent reported having a program, with 33.6 per cent arranging access to an external program, almost a third (30.9 per cent) said they made no provision.
Nationally there is a commitment to 'universal access' to preschool. This seeks to ensure that a quality preschool program is available to all children in the year before full-time school. While states and territories are responsible for the provision of preschool, the Commonwealth provides funding as a contribution to 'top up' arrangements and to ensure families have nationally consistent access to 15 hours per week, or 600 hours per year, in the year before school. This is complemented in those cases where the preschool program is provided in a Centre Based Day Care service by support via the Child Care Subsidy, which allows families who do not meet the activity test to obtain 36 hours of subsidised care per fortnight for a preschool-aged child who attends preschool at a centre-based day care service. Parents are still required to meet the income test to obtain this assistance.15
As noted above, the role of ACECQA extends across both the child care and preschool sectors.
1.2.3 NDIS
Inclusion is a key objective of the Australian child care system. Under the Package this is supported by access to the Additional Child Care Subsidy, the Inclusion Support Program and the In Home Care program. Children who have an impairment, serious illness or condition that is likely to be permanent are also potentially eligible for support through the National Disability Insurance Scheme (NDIS). A specific objective of the NDIS is investing in people with disability early to improve their outcomes later in life.
The NDIS has been rolled out across Australia, commencing in 2013, including from the rolling out of the specific Early Childhood Early Intervention (ECEI) approach that began in 2016. This measure supports children aged 0-6 years who have a developmental delay or disability and their families and/or carers, with a focus on providing supports to families to help children develop the skills they need to take part in daily activities and achieve the best possible outcomes throughout their life. The approach is currently under review and it is anticipated that an implementation reset process will be finished by mid-2021.
With respect to child care, the focus of the NDIS is on providing 'individualised supports to enable a child to attend an early learning service'. The program approach, however, limits this to those 'situations where a child has very significant and complex care needs that are beyond a reasonable expectation for child care services to provide. For example, a child requiring ventilation, which must be supervised by a trained carer or nurse' (NDIS, 2014). With the exception of these specific circumstances, the early childhood and child care services have responsibility for the education and care needs of children, including children with disability or developmental delay.
1.3 The evaluation
The Australian Institute of Family Studies in association with the Social Research Centre, the UNSW Social Policy Research Centre and the ANU Centre for Social Research and Methods were commissioned by the Australian Government Department of Education, Skills and Employment to undertake an independent evaluation of the new Child Care Package. The evaluation commenced in December 2017, prior to the introduction of the Package, and was expected to continue until June 2021. The In Home Care program and the Inclusion Support Program, in addition to being within the overall evaluation scope, are subject to separate reporting, with as noted some of the Inclusion Support Program evaluation continuing past the date of this report.
As noted in the introduction, the evaluation was disrupted by COVID-19 and associated restrictions, as well as changes to government assistance to families and the child care sector, and as a consequence this report only considers outcomes to the end of 2019. This focus, while bringing some constraints as to what was able to be done and limiting the capacity to identify longer-term consequences of the introduction of the Package, ensures that the outcomes and impacts reported on are those that relate to the Package itself, and not the consequences of these other interventions, nor the evolving circumstances in which services operate.
In particular, it is noted that because of disruptions to the sector, it was not possible to undertake the third wave of the Services Survey that was designed to better understand the impact of the Package on service operations, rather than the more transitional experiences that dominated the earlier waves.
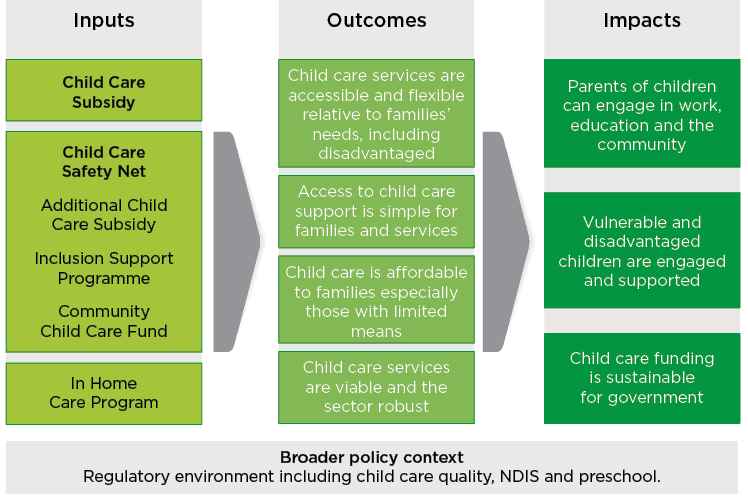
The evaluation is guided by the Evaluation Framework that was agreed with the Department.16 The Evaluation Framework, as detailed in Figure 3, sets out 4 key outcomes and 3 key impacts against which the new Child Care Package is being evaluated. These reflect the policy objectives set by the government for the Package. In large part, they relate to medium to long term effects of the Package and its consequences for families, children and the child care sector.
Figure 3: Evaluation Framework
1.3.1 The evaluation approach
The primary focus of the evaluation, as detailed in the evaluation framework, is on the outcomes and impacts of the Child Care Package. This contrasts with other evaluative tasks, such as process or implementation evaluation, that are more concerned with the way in which programs are implemented and the extent to which implementation has occurred as intended and whether the program has been fully and properly implemented in accord with its guidelines and procedures. Notwithstanding this focus, Chapter 10 addresses questions of implementation in the context of the transition to the new program.
In undertaking the evaluation, it is noted that a number of balances have needed to be struck in the approach. These include the degree to which comparative or absolute outcomes and impacts are considered, the effective weighting of positive and negative outcomes, the extent to which outcomes and impacts can be attributed to the policy and program changes, and the degree to which the time scale of this report and the data available to the evaluation can fully identify the effects of the program. Additionally, there are questions concerning the nature and role of child care provision that are not necessarily wholly reflected in the evaluation framework. These are considered further below.
Comparative and absolute outcomes
In large part, the focus of the evaluation is comparative. That is, comparing the outcomes and impacts being achieved following the introduction of the Package, relative to those under the previous arrangements. In terms of affordability, for example, this is a focus on whether child care is more affordable to families under the CCS than it was under CCB/CCR. This approach reflects the fact that few of the concepts can be measured in purely absolute terms, or where the metrics of an absolute measure - for example, what constitutes 'affordable child care' - tend to be value laden.
At the same time, consideration of absolute outcomes in some cases is also important. For example, treating access in purely relative terms, when it comes to questions such as access for disadvantaged groups, ignores the important social imperative to ensure that children at risk have access to appropriate child care and related services.
Balancing of outcomes
Some aspects of the new child care policy have the potential to have differential impacts across the population, benefiting some, and disadvantaging others, in either absolute or relative terms. In the evaluation both of these are important, and care needs to be exercised in not just focusing on average effects but also the distribution of these. Such a focus, however, tends to limit the ability to draw concise, as opposed to more extended, nuanced findings that take account of these diversities. While, alternatively, some summative measures can be considered, these involve a range of potential value judgements about how to weigh gains and losses, including the extent to which these may be recorded by quite different population subgroups. In some cases, though, it is noted that program objectives, such as the refocusing of assistance from higher income families to those on lower and middle incomes, provides a normative weighting for such considerations.
Attribution
Attributing changes in outcomes to the effect of the Child Care Package can be problematic. For example, parents' perceptions of affordability may be affected by changes in their income and in other expenses - as well as, more widely, by perceptions of their financial circumstances and opportunities. Similarly, changes in employment can result from changes in the labour market and the demand for labour, as well as other policies such as the rates and conditions related to income support, and shifts in attitudes relating to parental workforce engagement. Disentangling the roles of each of these factors is difficult; in particular, as there is no counterfactual, control population that can be used as a reference point, as the policy applies to the entire parental population. While not all parents use the assistance, given that take-up is impacted by individual circumstances, attitudes and aspirations, these operate effectively as a selection effect that renders non-user parents unsuitable as a comparator. Additionally, as will be discussed in Chapter 8, the impact of the program needs to be considered across parents as a whole.
More widely, other policies, including universal access to preschool and its interaction with different state preschool systems, the introduction of the National Disability Insurance Scheme, and a wide range of other initiatives all, in turn, also have impacts on the outcomes of populations of children and families who use child care. The interaction of these confound any attempt to attribute changes to child care programs alone.
Time scale
The evaluation is considering the impact of the introduction of the Package over an 18-month period, with much analysis, due to potential seasonal effects, the more limited focus of the November 2019 DESE ORIMA parent survey and the curtailment of the evaluation specific services survey, being restricted to a 12-month period. Little information is available to assess whether this time scale is sufficient to fully identify the impact of the program. Two potentially sensitive dimensions relate to the impact on labour force engagement where people may either plan an engagement trajectory over time or where changes in their engagement are triggered by external factors, such as a job loss or a specific job offer.
The role of child care
As identified earlier, the rationale for the Package was described as having the objective 'to help parents who want to work, or who want to work more, while still focusing on early childhood education'. The 2 elements of this statement reflect 2 facets of child care. Given the evaluation framework, and the overall legislative intent as described by the Department 'that, in relation to early learning and child care, the primary role of the Australian Government is to provide families with financial assistance to help cover the cost of child care, while supporting workforce participation' (DESE, 2020b, p. 2) the focus of the evaluation is primarily on the first, and even to the extent to which questions such as access are considered, the orientation of the framework is on achieving access - not what access provides.
We address this further in our concluding chapter.
Terminology
In describing the sector, we have chosen to use the language of 'child care' rather than the alternative of 'early childhood education and care'. This decision was based on 3 grounds:
- the terminology of the main program element, the 'Child Care Subsidy', and of the legislation Family Assistance Legislation Amendment (Jobs for Families Child Care Package) Act 2017
- the extent to which the evaluation, as noted above, is directed at the child care role, rather than the content of early childhood education
- the wider scope of the concept of 'early childhood education and care' that encompasses the preschool sector, and indeed some would also argue the early years of formal schooling.
Data and analysis
The evaluation draws very extensively upon administrative data provided by the Department; in particular, weekly records of child care use, surveys of parents, including one of the Department's surveys as well as those undertaken by the consortium, 2 major waves of surveys of services, a series of case studies, and extensive consultations. From these sources the evaluation has had a rich collection of quantitative and qualitative data that is reported on here. Data sources are described in detail in Appendix 1.
In addition to the direct reporting and interpretation of this data, the evaluation also undertook a major modelling exercise, reported on in Chapter 4, of the impact of the package on affordability.
1.3.2 Structure of report
This report is largely structured around the outcomes and impacts identified in the framework, specifically:
- Chapter 2 'Child Care in Australia' provides an overview of the child care system and of the state of child care at the end of 2019.
- Chapter 3 'Simplicity' addresses the second identified outcome - that of the simplicity of the system; in particular, for parents and services.
- Chapter 4 'Child Care costs, subsidies and affordability' responds to the third identified outcome - the affordability of child care. This also has implications for the third impact - that of the sustainability of the child care funding, although we note that the substantive consideration of this is for government, which needs to weigh up decisions on priorities both in expenditures and revenues.
- Chapter 5 'Flexibility' addresses the second half of the first outcome.
- Chapter 6 'Access' encompasses the second half of the first outcome.
- Chapter 7 'Vulnerable' focuses on the second impact, as well as aspects of these groups' experiences as identified in the first and third outcomes.
- Chapter 8 'Employment participation impacts' addresses the first impact. It also covers some of the specific aspects of the safety net programs, including ACCS.
- Chapter 9 'Viability and robustness of the industry sector' addresses the fourth outcome and informs on the third impact. The Chapter also discusses the operation of the CCCF and the impact of compliance activity.
- Chapter 10 'The transition to the Child Care Package', in contrast to these other chapters that are concerned with program outcomes and impacts, focuses on the processes of the transition, the experiences of services and families and of the policy responses to these.
- Chapter 11 'Conclusions and recommendations' presents the conclusions of the evaluation and recommendations for consideration drawn from these.
The evaluation framework also identified a series of cross-cutting issues, including the different sectors of child care provision, geographic outcomes, and the experiences of different families, as well as the effect of different program elements. In general, these are discussed across the chapters.
Appendix 1 'Evaluation process and data' reports more fully on the evaluation activities undertaken and the data sources drawn on, including those used in this report.
1 The Department of Education and Training became the Department of Education on 29 May 2019, then changed to the Department of Education, Skills and Employment (DESE) on 1 February 2020. In this report the Department, and its predecessors, is referred to as DESE or the Department.
2 In addition, where a child may be cared for by others, the person applying for the subsidy needs to meet a requirement with respect to the level of care that they provide to the child.
3 In the explanatory memorandum for the original Jobs for Families and Child Care Package legislation this was described as 'a provision that obliges approved providers to ensure that they recover, from individuals, the difference between a fee reduction (made available through CCS or ACCS) and the actual fee charged to the individuals, where there is a difference. The CCS payment is designed with a concept of co-contribution to the cost of child care. This provision intends to address an issue that has arisen with CCB where some child care services did not actually pursue the difference between fee reductions and actual fee charged to the individual' (Porter, 2017b, p. 87). In the accompanying Regulation Impact Statement (Department of Education and Training, 2015a), the Department indicated 'A minimum co-contribution from all child care users was seen by stakeholders as acceptable, fair and necessary. A co-contribution can encourage parents to be conscious of the fees charged and help keep downward pressure on child care fees' (p. 43).
4 Parents can apply to have this proportion increased.
5 Notwithstanding the introduction of the hourly rate cap, child care fee assistance continues to be calculated on the length of the session of care the parent is charged for, and not time actually attended. Where services charge by the session the hourly rate used to determine the relationship with the fee cap is derived by dividing the session charge by the session length.
6 In 2018-19 these values were $66,958, $171,958, $251,248, $341,248 and $351,248 respectively.
7 In 2018-19 the cap was $10,190 and applied to incomes above $186,958.
8 This is a summary of exemptions only. In some cases, exemptions apply to a specific child and, in other cases, to all children. It is further noted than in 2 parent families, where one person has an exemption, the hours of subsidised care for the family is based on the person with the lowest activity test result.
9 In exceptional circumstances families can make an application to Centrelink that it would be unreasonable for them in their circumstances to satisfy the activity test. This provision also allows for a subsidy for more than 100 hours per fortnight.
10 See Section 1.2.2 for further discussion of this provision.
11 The Department (Department of Education and Training, 2018a) indicates that people in the following circumstances are exempt from the activity test:
- people with disability or impairment, including those who receive Disability Support Pension or an invalidity service pension or who have been diagnosed by a registered medical practitioner or clinical psychologist as impaired to a significant degree
- people living or travelling outside Australia (the individual claiming Child Care Subsidy will usually be exempt for up to 6 weeks)
- recipients of Newstart, Youth Allowance (jobseeker), Parenting Payment or Special Benefit, with an exemption from mutual obligation requirements (with some exceptions)
- being in gaol or psychiatric confinement due to being charged with an offence
- being a carer who receives Carer Payment
- being a carer who provides constant care for an adult or child but they or the person they are caring for do not meet means or assets tests for Carer Payment
- grandparents who are the principal carers of their grandchild or grandchildren but who do not receive income support payments and are therefore not eligible for Additional Child Care Subsidy (grandparent).
12 This was extended to 12 weeks in March 2020.
13 This is one of the surveys conducted as part of the evaluation. The survey is described in Appendix 1.
14 In this data Occasional Care Services were separately identified. 54.6 per cent of these had a pre-school program.
15 To receive CCS and the 36 allowed hours for the children in the year before school, families must be otherwise eligible for child care subsidy. This is also only an exemption from the activity test, the amount of subsidy is still defined by the income test. As such, while as part of the Universal Access National Partnership children may access preschool programs run in Centre Based Day Care services, these attendances may not necessarily receive CCS.
16 https://aifs.gov.au/research/research-snapshots/child-care-package-activity-test
2. Child Care in Australia
This chapter describes the Australian child care sector during the period covered by the evaluation, including key statistics on the sector and the families and children who used child care services at the end of 2019. It also reports on the families' level of satisfaction with the child care services they receive, and how this has changed during the period since the introduction of the Child Care Package. This can be seen as an important metric for considering the impact of the new policies. The Chapter draws heavily on administrative data held in the Child Care Subsidy System and the DESE/ORIMA parent survey.17
2.1 The child care system
2.1.1 The structure of the system
The Australian early childhood education and care system, and the role of child care services within this, is complex. The Commonwealth Government provides subsidies to most parents who use child care. It also provides direct funding to services for specific activities, such as the inclusion of children with additional needs, and support to services in particular circumstances, including in some disadvantaged areas and other areas of need. State and territory governments regulate the sector,18 with local government also having a role including with regard to planning approvals. Jointly the Commonwealth and the states and territories agreed, in 2008, to a National Partnership Arrangement with the introduction of a national framework, Belonging, Being, Becoming - Early Years Learning Framework, in 2009. Standards in the sector are monitored and reported on, and qualifications assessed, by the independent Australian Children's Education and Care Quality Authority (ACECQA). The actual assessment and rating of the services is undertaken by the relevant state or territory regulatory authority. In addition to the formal child care sector, there are a range of private arrangements, some non-commercial and voluntary, such as care by relatives, and more commercial arrangements, including families who employ nannies and au pairs to care for their children. These are outside of the funding arrangements considered in this evaluation.
In addition to the provision of child care services as considered in this evaluation, as noted in Chapter 1, the Australian Government provides financial support for preschool education.19 In some cases, these services are provided within the formal child care sector and, in other cases, within state education systems or through private or community based providers.
Formal child care services are provided through a range of providers in the private, community and government sectors. For the purposes of the operation of the child care subsidy, and of the analysis undertaken here, 4 types of care services are identified:
- Centre Based Day Care: Services that typically offer long continuous sessions of care within services primarily focused on the early childhood education and care needs of children aged between 0 and 6 years. These services, as with those of other care types, operate both as individual services and as part of larger provider organisations. This also includes some services, classified as Occasional Care Services prior to the introduction of the Package, that provided shorter sessions of care. Many of these services continue to promote themselves as providers of occasional care including short sessions of care, and, or casual child care.
- Family Day Care: This care is provided to a small number of children by individual educators, in most cases, in the educator's own home. These educators are usually contracted, or employed, by a Family Day Care provider (which constitutes the 'service' in subsequent analysis of this sector) that manages a number of individual educators, with some larger services having over a hundred educators.20 This structure means that, in contrast to Centre Based Day Care and Outside School Hours Care, the actual services are not usually directly engaged in the provision of care to children. Additionally, the geographic location of the service does not necessarily relate to the actual locations where care is provided by individual educators.
- Outside School Hours Care: These services usually offer shorter sessions of care immediately before and/or after school hours, and/or longer sessions during school vacations. These services have programs focused on the developmental and supervisory needs of school-aged children.
- In Home Care: This is a small sector that provides care to children for whom other forms of care are not suitable or accessible. This may be because of parental working arrangements outside of normal child care hours, due to geographic isolation including rural and remote locations, and where families have challenging or complex needs.
The structure of Commonwealth financial support for child care has been detailed in Chapter 1.
2.2 Child care in Australia - services and users
Over the course of Q4 2019, 1,327,238 children attended 13,118 child care services in Australia.21 Across the whole of the 2019 calendar year 1,579,459 individual children were recorded as using a child care service at some point.22
In presenting this overview it is noted that in addition to the complexity of the sector, at times the data and concepts reported on are complex or definitions are particularly nuanced. For example, a single child may attend multiple child care services, of different types, for different periods, even within a single week. For some children, the different care, or indeed even sometimes different sessions of care within a single service, may be funded by different parents who live in separate families. Similarly, while some providers only manage services providing one form of care, others manage several different types. Additionally, some services and providers operate across state and territory borders and in different locations in states and territories, or indeed provide services across a state or territory, rather than in a more limited geographic location. As noted in Appendix A, there are also some limitations imposed by the nature of much of the data used due to it being administrative by-product data rather than being specifically collected or curated to be used for the purposes of analysis or evaluation.
2.2.1 Structure of provision - services
The broad structure of the sector is shown in Table 3. The data is presented on the basis of the sectors as identified above, and whether or not the service is provided by for-profit or not-for-profit providers. (This differentiation is made as it may be considered that the motivations of these may differ, and this in turn may result in differential outcomes.) At the same time, however, such a classification conceals many differences within each of these sectors, with for-profit providers ranging from listed companies to small family businesses, and the not-for-profit sector ranging from very large social enterprises to local governments and small community-based organisations.
Table 3 illustrates how different measures can lead to different assessments/impressions of the relative contribution of different forms of care and different sectors. For example, the largest group of services identified in the table are for-profit Centre Based Day Care services. These represent 42.5 per cent of services and are attended by 40.7 per cent, of the children who attend child care services, they provide however 56.7 per cent of the total hours of care. Family Day Care services also disproportionately provide a much higher volume of services relative to the actual number of services. The contrary is the case of Outside School Hours Care sectors, where the proportion of hours of care provided is low relative to the proportion of services and children attending.
| Service type: | Total | ||||
|---|---|---|---|---|---|
| CBDC | FDC | OSHC | IHC | ||
| For-profit | |||||
| Services | |||||
| Number | 5,572 | 263 | 2,388 | 20 | 8,243 |
| Proportion (%) | 42.5 | 2.0 | 18.2 | 0.2 | 62.8 |
| Proportion of children a (%) | 40.7 | 4.2 | 17.3 | 0.1 | 62.3 |
| Proportion of hours b (%) | 56.7 | 5.7 | 5.3 | 0.1 | 67.8 |
| Not-for-profit | |||||
| Services | |||||
| Number | 2,532 | 198 | 2,125 | 20 | 4,875 |
| Proportion (%) | 19.3 | 1.5 | 16.2 | 0.2 | 37.2 |
| Proportion of children (%) | 17.0 | 3.6 | 17.0 | 0.1 | 37.7 |
| Proportion of hours (%) | 22.7 | 3.4 | 5.9 | 0.1 | 32.2 |
| Total | |||||
| Services | |||||
| Number | 8,104 | 461 | 4,513 | 40 | 13,118 |
| Proportion (%) | 61.8 | 3.5 | 34.4 | 0.3 | 100.0 |
| Proportion of children (%) | 57.7 | 7.8 | 34.3 | 0.2 | 100.0 |
| Proportion of hours (%) | 79.5 | 9.1 | 11.2 | 0.2 | 100.0 |
Notes: a Proportion based on the number of unique child service records in the quarter. b Proportion based on the number of attended hours recorded in the quarter.
Source: DESE administrative data
Services and providers
While 37.5 per cent of services operate as independent entities, the remainder are parts of a larger provider structure,23 with the largest providers having over 600 services. As illustrated in Table 4, the role of large providers is particularly significant in the for-profit Outside School Hours Care sector, along with the not-for-profit Centre Based Day Care Sector. This latter reflects the role of Goodstart, a social enterprise established in the wake of the collapse of the private provider ABC Learning in 2008.
| Provider size (number of services providers have) | Services | Total | Providers | |||
|---|---|---|---|---|---|---|
| Service type: | ||||||
| CBDC | FDC | OSHC | IHC | |||
| Number of services | Number of providers | |||||
| For-profit | ||||||
| Single | 2,766 | 225 | 403 | 9 | 3,403 | 3,403 |
| 2-4 | 1,333 | 36 | 307 | 11 | 1,687 | 690 |
| 5-9 | 356 | 2 | 130 | 0 | 488 | 78 |
| 10-24 | 316 | 0 | 142 | 0 | 458 | 30 |
| 25-99 | 306 | 0 | 387 | 0 | 693 | 13 |
| 100 + | 495 | 0 | 1,019 | 0 | 1,514 | 5 |
| Total | 5,572 | 263 | 2,388 | 20 | 8,243 | 4,219 |
| Not-for-profit | ||||||
| Single | 750 | 58 | 707 | 1 | 1,516 | 1,516 |
| 2-4 | 376 | 58 | 247 | 8 | 689 | 282 |
| 5-9 | 237 | 28 | 181 | 3 | 449 | 72 |
| 10-24 | 269 | 31 | 344 | 3 | 647 | 42 |
| 25-99 | 246 | 23 | 434 | 5 | 708 | 18 |
| 100 + | 654 | 0 | 212 | 0 | 866 | 3 |
| Total | 2,532 | 198 | 2,125 | 20 | 4,875 | 1,933 |
| Total | ||||||
| Single | 3,516 | 283 | 1,110 | 10 | 4,919 | 4,919 |
| 2-4 | 1,709 | 94 | 554 | 19 | 2,376 | 972 |
| 5-9 | 593 | 30 | 311 | 3 | 937 | 150 |
| 10-24 | 585 | 31 | 486 | 3 | 1,105 | 72 |
| 25-99 | 552 | 23 | 821 | 5 | 1,401 | 31 |
| 100+ | 1,149 | 0 | 1,231 | 0 | 2,380 | 8 |
| Total | 8,104 | 461 | 4,513 | 40 | 13,118 | 6,152 |
Source: DESE administrative data
Service size
The size of services varies. While services, on average, have around 80 individual children attending in most weeks, 25 per cent have fewer than 50 children, while 25 per cent have more than 120. These counts, however, do not provide the whole picture. The level of services provided is also impacted by the intensity of use, with some of these children only attending on some days, or for limited periods. Table 5 presents a conceptual description of effective service size based on a measure of the average number of 'effective places' (a measure that seeks to account for the number of children who only attend for some days of the week).24,25
As shown, just under a quarter of services have under 25 effective places, with these being particularly significant in the Outside School Hours Care and In Home Care sectors. Additionally, some 35 per cent of services have 25-49 places, a third between 50 and 99 places, with the remaining 8.7 per cent being larger. This though varies by type of service.
While, as noted, actual Family Day Care services are usually provided by single educators in their own home to a small number of children, these educators operate within the aegis of a larger Family Day Care service and, as such, the service size represents this organisational structure rather than the nature of actual child care service provision. In contrast, while In Home Care services operate a similarly dispersed network of educators who provide services to individual families in their own home, the specialist nature of these services tends towards smaller service sizes.
| Places a | Service type: | Total | |||
|---|---|---|---|---|---|
| CBDC | FDC | OSHC | IHC | ||
| Distribution of services (%) | |||||
| Under 25 | 15.2 | 9.3 | 36.5 | 70.0 | 22.5 |
| 25-49 | 38.1 | 15.8 | 33.5 | 15.0 | 35.7 |
| 50-99 | 39.7 | 33.6 | 21.7 | 12.5 | 33.2 |
| 100-149 | 6.3 | 18.9 | 6.1 | 2.5 | 6.7 |
| 150-199 | 0.6 | 11.5 | 1.7 | 0.0 | 1.4 |
| 200-249 | 0.1 | 6.3 | 0.3 | 0.0 | 0.4 |
| 250 and over | 0.0 | 4.6 | 0.2 | 0.0 | 0.2 |
| Total | 100.0 | 100.0 | 100.0 | 100.0 | 100.0 |
Notes: a Places have been derived by estimating the number of children who could attend a service if they all attended each day of the week over which the service operates. This is a conceptual volume measure of the level of service provision and does not necessarily relate to the number of approved places that a service has, or the maximum number of children who attend the service at any one time.
Source: DESE administrative data
Service location
Most, 67.6 per cent, of child care services are located26 in the capital cities of states and territories, see Table 6. There is some variation in the geographic distribution of services by sector, with a higher proportion of Family Day Care and In Home Care services in smaller urban areas and inner regional areas. There are also significant differences between states and territories, reflecting their different patterns of settlement. In particular, in Western Australia and South Australia, some 80 per cent of services are in the capital city, as are 75 per cent of those in Victoria, and over 99 per cent in the ACT.27 In contrast in the Northern Territory 28.3 per cent of services are in non-urban locations, as are 23.7 per cent of services in Tasmania. The implications of these distributions are considered more in Chapter 6.
| Urban and regional location a | Service type: | Total | |||
|---|---|---|---|---|---|
| CBDC | FDC | OSHC | IHC | ||
| Number of services | |||||
| Capital Cities | 5,402 | 302 | 3,139 | 22 | 8,865 |
| Urban 100k plus | 1,049 | 36 | 513 | 2 | 1,600 |
| Urban 50k-<100k | 320 | 22 | 193 | 2 | 537 |
| Urban 20k-<50k | 358 | 31 | 174 | 5 | 568 |
| Urban 10k-<20k | 173 | 18 | 84 | 2 | 277 |
| Inner Regional | 376 | 24 | 248 | 1 | 649 |
| Outer Regional | 287 | 23 | 130 | 3 | 443 |
| Remote | 51 | 3 | 11 | 1 | 66 |
| Very Remote | 88 | 2 | 21 | 2 | 113 |
| Total | 8,104 | 461 | 4,513 | 40 | 13,118 |
Notes: a The geography used in this, and subsequent, tables is a hybrid based on a combination of ABS Significant Urban Areas (with the added differentiation between the state and territory capitals and other major urban agglomerations) and the distribution of areas outside of these cities according to the ABS remoteness classification. In all cases the location is based on the geographical SA2 level.
Source: DESE administrative data
Most of the services operating in Q4 2019 have been established for some time. The measurement of the duration of operation is, however, difficult, as changes in ownership, with little impact on the service itself, can result in the services being identified as 'new', while an existing service may take on quite different characteristics with; for example, a new director. Based on data on child attendance since January 2017, 77.3 per cent of services that operated in Q4 2019 have been in operation since that date, 5.2 per cent had a commencement date later in that year, 9.3 per cent commenced in 2018, and 8.2 per cent in 2019. By type of care the highest proportion of long-standing services was in the Family Day Care sector where 90.6 per cent of services operating in Q4 2019 were operating in January 2017. This was followed by the Outside School Hours Care sector (77.6 per cent), Centre Based Day Care (76.3 per cent) and In Home Care (76.2 per cent).
Service quality
The quality of ECEC services are, as noted earlier, assessed by the states and reported on by ACECQA against the National Quality Standards. In their 2019 Annual Performance Report the Agency reported that: 'The proportion of children's education and care services rated "Meeting NQS" or above has increased every year since the NQF was introduced' (ACECQA, 2019, p. 6).
This pattern of improvement is reflected in data over the period from Q2 2018 to Q4 2019. While, as shown in Figure 4, there has been an apparent fall in the proportion with the highest quality ratings,28 this reflects a change in the classification system. The agency reports that this makes it 'more challenging for a service to achieve a rating of Exceeding NQS' (p. 7). Change over the period can hence be seen better in terms of the proportion of services rated as meeting or exceeding the standards. This has increased from 74.2 per cent in Q2 2018 to 76.6 per cent in Q4 2019. In both periods the number of services rated as 'significant improvement required' is very small, 0.2 per cent in Q2 2018, and 0.1 per cent in Q4 2019.
Figure 4: Rating of child care services against the National Quality Standards, Q2 2018 and Q4 2019
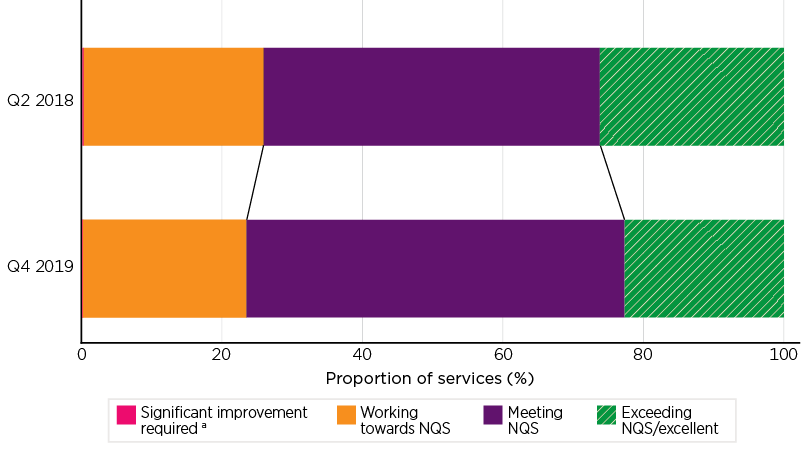
Notes: a Not visible on chart, only 0.2 per cent of services in Q2 2018 and 0.1 per cent in Q4 2019. Includes Family Day Care, Centre Based Day Care and Outside School Hours Care services only as In Home Care Services are out of scope. Excludes services without an overall quality rating.
Source: ACECQA, Quarterly National Quality Standard Data (Q3 2013 - Q4 2019) Released on 6 February 2020 (ACECQA, 2020a).
Further analysis of the ratings indicate some systematic differences across the sector. Table 7 illustrates some of these. Of note are the very marked differences between the for-profit and not-for profit sector, and between service types. While 39.3 per cent of not-for-profit Centre Based Day Care services have a rating of Exceeding NQS or Excellent, this rate falls to just 4.8 per cent for for-profit Family Day Care services. In general, the differences between the for-profit and not-for-profit sectors are most marked in the Family Day Care and Centre Based Day Care sectors, while the Outside School Hours sector is more marked by its relatively low rating relative to the other 2 sectors, than the difference between for-profit and not-for-profit providers.
| ACECQA rating: | For-profit | Not-for-profit | ||||||
|---|---|---|---|---|---|---|---|---|
| CBDC | FDC | OSHC | Total | CBDC | FDC | OSHC | Total | |
| Proportion of services (%) | ||||||||
| Exceeds/Excellent | 23.1 | 4.8 | 14.7 | 20.0 | 39.3 | 26.5 | 16.0 | 28.4 |
| Meets | 53.8 | 28.6 | 60.2 | 54.9 | 49.6 | 44.9 | 56.5 | 52.4 |
| Working towards | 23.0 | 65.7 | 25.0 | 25.0 | 11.1 | 28.1 | 27.5 | 19.1 |
| Needs significant improvement | 0.1 | 0.8 | 0.1 | 0.1 | 0.0 | 0.5 | 0.1 | 0.0 |
| Total | 100.0 | 100.0 | 100.0 | 100.0 | 100.0 | 100.0 | 100.0 | 100.0 |
| Services with rating (count) | 5,100 | 248 | 2,216 | 7,564 | 2,261 | 196 | 1,968 | 4,425 |
Notes: Total is Family Day Care, Centre Based Day Care and Outside School Hours Care services only, as In Home Care Services are out of scope. Excludes services without an overall quality rating. Based on matched ACECQA and DESE data using DESE service details including whether for-profit. This does not necessarily match the ACECQA classification.
Source: ACECQA Q4 2019 and DESE administrative data
Further analysis indicates that there is a concentration of the highest quality services in the major urban areas relative to regional locations and, in particular, remote and very remote areas. While there is some variation in the pattern of fees by the quality rating of services, this varies by sector and by service type. It is most marked for not-for-profit Centre Based Day Care services where the average hourly fee charged by services rated as Excellent or Exceeding, of $10.48, is well above the $9.69 charged by the much smaller group of services rated as Working Towards.
These variations in the quality rating of services are, in turn, reflected in the quality of the service received by different children. Table 8 details the distribution of children, grouped on the basis of parental income, by the rating of the service they attend. It clearly shows a strong association between children from higher income families attending higher quality services. For example, well over 30 per cent of children of parents in the upper 2 income bands attend services rated as Exceeding the standard, and just 20 per cent attend services rated as Working Towards'. In contrast only some 20 per cent of those children whose parents earn under $50,000 attend these higher ranked services, and well over a quarter attend those falling below the standard.
| Family gross income range: | ACECQA rating: | ||||
|---|---|---|---|---|---|
| Exceeding NQS/ Excellent | Meeting NQS | Working towards NQS | Significant improvement required | Total | |
| Distribution of children (%) | |||||
| Zero | 19.1 | 50.7 | 30.1 | 0.1 | 100.0 |
| $1-<25k | 20.2 | 51.9 | 27.8 | 0.2 | 100.0 |
| $25-<50k | 20.4 | 51.8 | 27.7 | 0.1 | 100.0 |
| $50-<100k | 23.6 | 53.5 | 22.7 | 0.1 | 100.0 |
| $100-<150k | 26.4 | 53.7 | 19.9 | 0.1 | 100.0 |
| $150-<250k | 28.3 | 52.8 | 18.9 | 0.1 | 100.0 |
| $250-<500k | 31.6 | 50.6 | 17.7 | 0.1 | 100.0 |
| $500+k | 34.8 | 48.9 | 16.2 | 0.1 | 100.0 |
| Missing | 27.5 | 51.9 | 20.6 | 0.1 | 100.0 |
| Total | 25.9 | 52.8 | 21.2 | 0.1 | 100.0 |
Notes: Family Day Care, Centre Based Day Care and Outside School Hours Care services only as In Home Care Services are out of scope. Excludes services without an overall quality rating. Based on first service attended by child in the quarter.
Source: ACECQA Q4 2019 and DESE administrative data
The extent of this relationship varies by type of care, with there being relatively little relationship between family income and the rating of the Outside School Hours Care the child attends, but a much steeper gradient for Centre Based Day Care services.
While providing some insight into the nature of child care provision, these quality ratings, however, are of limited value in assessing the impact of the Package on the quality of care because, in most cases, the rating of the service was undertaken prior to the introduction of the Package.29
2.2.2 Characteristics of users - children
As detailed earlier, 1,327,238 children attended child care services in Q4 2019. Over the quarter, 92.4 per cent of children attended a single service, 7.2 per cent 2 services, with the remainder attending more than 2. Such multiple use, as well as reflecting a specific pattern of use chosen by parents, includes children who may have changed the service that they attended at some point over the quarter or, for example, used one service during school vacations and another in school terms. In any one week only some 2.5 per cent are reported as attending multiple services, with virtually all of these only attending 2 services.
Child care attendance over time, as shown in Figure 5, displays a number of patterns, within and across sectors. In the case of Centre Based Day Care there is a pattern of increasing attendance over the year, as well as steep reductions in use over the Christmas/New Year period. The upward slope over the year reflects the way in which families may have a need for, or take a decision to use, child care over the year, but then for whole cohorts of children to be withdrawn in the new year, when they enter formal schooling. The sector also shows an increase in the number of children using care in each of the 3 years.30 The Outside School Hours Care sector's pattern of use reflects the impacts of school terms, and lesser levels of vacation care. The number of children attending Family Day Care services shows a marked decline over the period. In part, this is associated with enforcement action, which will be discussed further in Chapter 9. While only a very small number of children use In Home Care services, notable in this data was a sharp fall from some 3,000-3,500 children using this type of care up to July 2018, to around 1,800 after that date, reflecting the tightened eligibility criteria for the new program.
Figure 5: Children attending child care services, by week and service type, January 2017 to December 2019
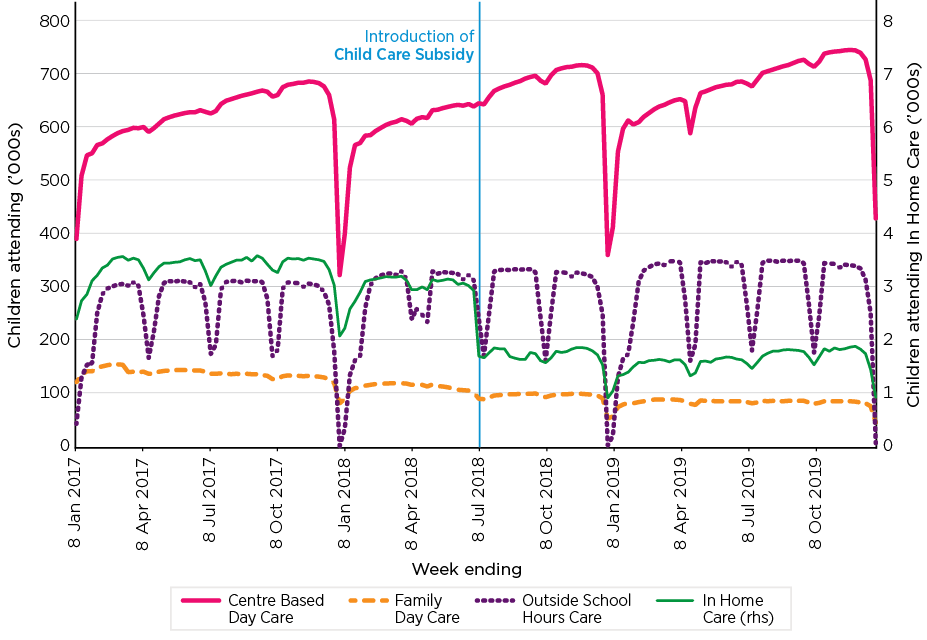
Notes: This is the raw count of all children identified in the administrative dataset as of each week. Children who attend different service types in the same week are counted under each service type they attend.
Source: DESE administrative data
The pattern of children's participation by age is shown in Figure 6. This records the number of children in child care at a particular age as a proportion of the estimated Australian population of this age. This ratio reaches a peak for the 3-year-old age group where 62.2 per cent of all children of this age were estimated to have attended a child care service in Q4 2019. While participation remains high, at 59.6 per cent, for those aged 4 years, it then declines relatively rapidly.
By age group it is estimated that 45.6 per cent of children aged under 5 years attended child care in Q4 2019, along with 30.6 per cent of those aged 5-9 years and 9.2 per cent of those aged 10-13 years.
Also distinct in the chart are the differing roles of the care sectors. Most of the care in the youngest age group is provided by Centre Based Day Care services, along with some contribution by the Family Day Care sector, with the Outside School Hours Care sector, commencing for those children aged 5 years, then being the major provider. The In Home Care sector only makes a very minor contribution across the period sitting at some 0.07-0.08 per cent of the population of children between the ages of one and 5 years, and then declining to 0.01 per cent for those aged 13 years.
Figure 6: Estimated rate of child care use, by child age and service type, Q4 2019
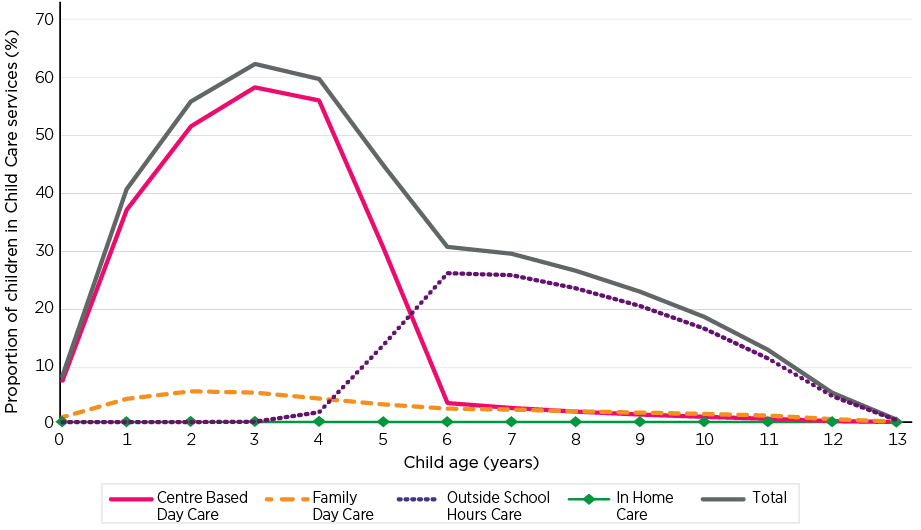
Notes: As children may attend more than one form of care the components will add up to greater than the total. Population data are June 2019 estimates.
Source: DESE administrative data; ABS 3101.0 National, state and territory population, March 2020
In Q4 2019, 3.5 per cent of children attending child care services are identified as being a child of an Indigenous family31 and 3.6 per cent as coming from a family where one or both parents speak a language other than English. These children are considered further in Chapter 7.
Pattern of attendance - Days per week
Overall, children attend child care services on an average of 2.83 days a week (as estimated from the number of days for which a child is charged). There is a slight tendency for this proportion to increase with age. It rises from 2.63 days for those aged under one year to 2.84 days at age 4, and then to a peak of 2.97 for those aged 13 years.
As shown in Table 9 most commonly children attend a child care service for 2 days (28.4 per cent), or 3 days (25.6 per cent) per week. Only around one in 7 children, 14.5 per cent, attend for 5 days a week, and less than 1 per cent receive child care services on 6 or 7 days, although 11.3 per cent of children in Family Day Care services report sessions on 6 days a week.
| Days charged | ||||||||
|---|---|---|---|---|---|---|---|---|
| 1 | 2 | 3 | 4 | 5 | 6 | 7 | Total | |
| Distribution of children attending (%) | ||||||||
| CBDC | 14.0 | 30.6 | 28.5 | 13.8 | 13.0 | 0.0 | 0.0 | 100.0 |
| FDC | 18.9 | 23.2 | 17.1 | 11.5 | 17.8 | 11.3 | 0.2 | 100.0 |
| OSHC | 23.7 | 24.4 | 20.9 | 14.0 | 17.1 | 0.0 | 0.0 | 100.0 |
| IHC | 14.2 | 18.0 | 16.0 | 13.7 | 32.3 | 5.2 | 1.4 | 100.0 |
| Total | 16.9 | 28.4 | 25.6 | 13.7 | 14.5 | 0.9 | 0.0 | 100.0 |
Notes: This is based on the number of days in the week in which sessions of care for the child were recorded.
Source: DESE administrative data
Pattern of attendance - Hours per session
There is also considerable variation in the length of time children attend services for when they do attend. This can be considered in 2 ways. Firstly, the length of the 'session'32 that children attend and for which parents are charged and, secondly, the actual time they spend at the service. The structure of sessions, and the extent to which these have changed with the introduction of the Child Care Package, is one of the matters considered in Chapter 5. In terms of the operation of the system, both these parameters are important, with the hourly fee and the fee cap, as well as approved hours of care, all operating on a session length basis but children's experience of child care being associated with the duration of actual attendance.
For children aged under 6 years, for those days on which they attended care, the derived average daily charged session length was 10.2 hours, which children attended for 7.1 hours. For those aged 6 years and over the session length was 4.3 hours, and children attended for 2.7 hours, see Table 10.
| Service type: | Total | ||||
|---|---|---|---|---|---|
| CBDC | FDC | OSHC | IHC | ||
| Hours per day | |||||
| Children aged 0-5 years: | |||||
| Average charged session length | 10.6 | 8.3 | 4.5 | 7.9 | 10.2 |
| Average time attended | 7.3 | 7.0 | 2.8 | 7.6 | 7.1 |
| Children aged 6 years and over: | |||||
| Average charged session length | 4.9 | 6.0 | 4.1 | 6.3 | 4.3 |
| Average time attended | 2.9 | 4.7 | 2.5 | 5.9 | 2.7 |
Notes: Data available for this part of the evaluation contained the number of hours charged per week, the number of hours they attended the service (based on their drop off/pick up times) and the number of days on which session were recorded. Session length and average period attended were derived from this. More detailed analysis of session length is in Chapter 5.
Source: DESE administrative data.
The distribution of time spent as detailed in Table 11 shows the distribution of the average time children spent in care on those days they received care over Q4 2019. Children who attended Centre Based Day Care most frequently attended for between 6 and 8 hours (35.6 per cent) or between 8 and 10 hours (38.9 per cent). In contrast, those attending an Outside School Hours Care service most frequently spent less than 2 hours at the service, although a proportion of periods of attendance of 8 to 10 hours were also recorded. This latter reflects the role of this sector in providing whole day care over school vacations.
| Hours attended | Service type: | Total | |||
|---|---|---|---|---|---|
| CBDC | FDC | OSHC | IHC | ||
| Distribution of average duration of attendance (%) | |||||
| Under 2 hrs | 2.7 | 5.7 | 52.2 | 3.7 | 16.4 |
| 2-<4 hrs | 6.9 | 13.6 | 35.8 | 13.8 | 15.3 |
| 4-<6 hrs | 12.6 | 21.1 | 2.2 | 18.5 | 10.4 |
| 6-<8 hrs | 35.6 | 34.0 | 3.6 | 19.8 | 26.7 |
| 8-<10 hrs | 38.9 | 22.3 | 5.7 | 25.3 | 28.6 |
| 10+ hrs | 3.4 | 3.3 | 0.5 | 18.9 | 2.7 |
| Total | 100.0 | 100.0 | 100.0 | 100.0 | 100.0 |
Notes: Distribution of weekly average period attended on days attended.
Source: DESE administrative data
Cost of services
Across all services the cost of an average hour of care (excluding In Home Care where the cost is per family) and based on the formal session period was $9.78. This varied between services, service types, and locations. The detailed distribution of fees, and the implication of these for affordability, is addressed in Chapter 4. The distribution by service type and location is shown in Table 12. Across all non-In Home Care services, and locations, the average cost of care in services provided by not-for-profit providers was $9.30 per hour, and by for-profit providers $10.05. This though also reflects the mix of services by state, location, and service type. In the Centre Based Day Care sector, for example, there was little difference between the average not-for-profit fees of $10.24 compared with $10.37 in the for-profit sector. This was also the case in the Family Day Care sector where the average hourly rate charged by a not-for-profit provider of $10.69 was the same as that charged on average by for-profit providers.
As illustrated, there were some marked differences between states, with particularly high costs in the Australian Capital Territory, followed by Western Australia and Victoria.
| State | For-profit services | Not-for-profit services | ||||||||
|---|---|---|---|---|---|---|---|---|---|---|
| CBDC | FDC | OSHC | IHC | Total a | CBDC | FDC | OSHC | IHC | Total a | |
| $ per hour per child | $ per hour per family | $ per hour per child | $ per hour per child | $ per hour per family | $ per hour per child | |||||
| NSW | 10.54 | 10.95 | 7.98 | 34.30 | 10.07 | 10.47 | 10.89 | 7.59 | 33.63 | 9.32 |
| Vic. | 10.67 | 10.67 | 9.61 | 39.14 | 10.40 | 10.76 | 10.68 | 7.73 | 10.26 | |
| Qld | 9.63 | 10.35 | 6.82 | 37.82 | 9.30 | 9.34 | 10.40 | 7.04 | 25.89 | 8.32 |
| SA | 10.31 | - | 7.69 | 37.22 | 9.91 | 9.99 | 9.98 | 6.95 | 8.56 | |
| WA | 10.68 | 10.56 | 10.43 | 35.26 | 10.60 | 10.43 | 11.00 | 9.90 | 31.66 | 10.38 |
| Tas. | 9.79 | 10.31 | 9.10 | - | 9.68 | 9.35 | 10.73 | 8.94 | 31.19 | 9.47 |
| NT | 9.81 | 10.42 | 8.18 | - | 9.12 | 9.07 | 10.38 | 7.67 | 8.81 | |
| ACT | 11.83 | 11.45 | 9.62 | - | 11.27 | 11.61 | 11.66 | 10.19 | 28.37 | 10.93 |
| Total | 10.37 | 10.69 | 8.71 | 37.41 | 10.05 | 10.24 | 10.69 | 7.58 | 29.64 | 9.30 |
Notes: a Excludes In Home Care.
Source: DESE administrative data
The more detailed analysis in Chapter 4 indicates that not only do 14.3 per cent of services have an average above the cap, but just the minority, 44.1 per cent, do not record having charged care for a child at a rate above the cap, at some point in Q4 2019.
2.2.3 Structure of users - families
In Q4 2019, 933,648 families33 had children who attended child care services. Of these families, 63.1 per cent had a single child who attended a service in the quarter, 31.8 per cent had 2 children attending child care, 4.5 per cent 3 children and the remaining 0.6 per cent more than this.
The administrative data for Q4 2019 indicates that 78.9 per cent of the families with children attending child care were couple families, and 21.1 per cent single parents. The number of children attending child care per family in single parent families was typically smaller than in couple families, with 68.3 per cent of single parents having just one child in child care, compared with 61.7 per cent of couple families.
While there are some differences in the number of children attending child care services for families in different circumstances, in most cases the differences are slight, although, overall, families with higher incomes tend to have more children attending relative to those on middle and lower incomes. There was little variation by region.
Engagement with the child care system by parents tends to be persistent. Of those parents who commenced using child care before or during 2017, 69.1 per cent were still using child care in 2019, and of those who commenced in 2018, 82.8 per cent were using it in 2019.
Families by activity
Table 13 shows the distribution of families by state and classified by their level of participation in employment and other activities, based on their reported activity in the context of the CCS activity test.34 As illustrated, most families using child care engage in significant levels of activity. In Q4 2019, of the single parent families, 40.1 per cent report being engaged on a part-time basis (activity of between 10 and 34 hours per week), and 41.4 per cent on a full-time basis (35 hours or more of reported activity per week). Among couple families, the most frequently reported forms of engagement are: 46.7 per cent of couples report one person with part-time activities and one with full-time; and 35.9 per cent where both parents report activity of more than 35 hours per week.
This data also highlights some marked differences between states. While on average, across states, the proportion of single parents reporting part-time and full-time activity are similar, in the Northern Territory a much higher proportion of this group report being engaged at the full-time level. Similarly, there is considerable difference between states in the level of activity reported by couples. For example, while across Australia there are some 77 couples where both undertake full-time activity for every 100 who have one member with part-time activity and one with full-time activity, this proportion varies from just 46:100 in Tasmania to 101:100 in the ACT and 172:100 in the Northern Territory.
| Activity a | State | Total | |||||||
|---|---|---|---|---|---|---|---|---|---|
| NSW | Vic. | Qld | SA | WA | Tas. | NT | ACT | ||
| Distribution of families (%) | |||||||||
| Single parent | |||||||||
| Missing activity b | 2.1 | 2.0 | 2.4 | 2.4 | 2.1 | 2.8 | 1.7 | 0.8 | 2.1 |
| Low | 1.6 | 1.6 | 2.2 | 1.8 | 1.8 | 2.4 | 1.2 | 0.6 | 1.8 |
| Part-time | 7.9 | 8.0 | 9.7 | 9.7 | 8.7 | 11.4 | 5.8 | 5.5 | 8.5 |
| Full-time | 7.9 | 7.3 | 11.6 | 8.6 | 8.6 | 7.8 | 14.2 | 8.6 | 8.8 |
| Total Single parent | 19.5 | 18.8 | 26.0 | 22.5 | 21.3 | 24.4 | 22.9 | 15.6 | 21.1 |
| Couple | |||||||||
| Missing Activity | 4.8 | 4.3 | 3.6 | 4.0 | 3.5 | 3.6 | 4.1 | 3.2 | 4.2 |
| Low Activity | 0.2 | 0.2 | 0.2 | 0.1 | 0.1 | 0.2 | 0.2 | 0.0 | 0.2 |
| Some Part-time | 6.2 | 6.8 | 5.4 | 6.7 | 5.3 | 7.9 | 4.5 | 7.1 | 6.2 |
| 1 Low, 1 Full-time | 3.3 | 3.3 | 3.0 | 2.9 | 4.1 | 3.2 | 1.7 | 1.6 | 3.2 |
| 1 Part-time 1 Full-time | 35.7 | 39.2 | 33.6 | 40.6 | 40.5 | 41.6 | 24.5 | 36.0 | 36.8 |
| 2 Full-time | 30.3 | 27.4 | 28.2 | 23.1 | 25.2 | 19.2 | 42.1 | 36.5 | 28.3 |
| Total Couple | 80.5 | 81.2 | 74.0 | 77.5 | 78.7 | 75.6 | 77.1 | 84.4 | 78.9 |
| Total | 100.0 | 100.0 | 100.0 | 100.0 | 100.0 | 100.0 | 100.0 | 100.0 | 100.0 |
| Families | 307,771 | 230,734 | 209,354 | 60,998 | 78,575 | 16,274 | 7,728 | 22,292 | 933,726 |
Notes: Data relates to a range of approved activities, one of which is employment, and also includes journey to work and related travel time. Data is reported on a fortnightly basis and has been converted to a weekly basis assuming equal time was spent in each week. a Low includes zero and less than 10 hours per week; Part-time is 10 to under 34 hours per week, Full-time is 35 hours or more a week. b There are a number of reasons why activity may be missing. One, discussed in Section 2.3, is that there are some families who do not apply for subsidies. Second, there may be non-reporting by families' who have an exemption from the activity test. It should also be noted that this group may be over-reported as being single parents, as without full reporting, associated with activity, a partner may not be identified.
Source: DESE administrative data
Family income
The distribution of families using child care, and children in care in Q4 2019, by whether they are a single parent family, or a couple, by gross household income, is shown in Table 14. Dominant in the table is the concentration of single parents at the lower end of the income distribution, with both 56.3 per cent of these families and children in these families attending child care reporting incomes under $50,000 per annum35 compared to just 5.0 per cent of couple families. In contrast, 46.5 per cent of couple families, and 48.4 per cent of the children of such families who attend child care, report incomes of $150,000 or more.
| Family gross income a | Single parent | Couple | Total | Single parents as share of total | ||||
|---|---|---|---|---|---|---|---|---|
| Families | Children | Families | Children | Families | Children | Families | Children | |
| Distribution (%) | Proportion (%) | |||||||
| Zero | 1.5 | 1.4 | 0.1 | 0.1 | 0.4 | 0.3 | 87.3 | 87.4 |
| $1-<25k | 24.5 | 24.4 | 0.7 | 0.7 | 5.7 | 5.5 | 90.5 | 90.5 |
| $25-<50k | 31.8 | 31.9 | 4.3 | 4.3 | 10.1 | 10.0 | 66.5 | 65.7 |
| $50-<100k | 32.6 | 32.8 | 18.3 | 17.4 | 21.4 | 20.6 | 32.3 | 32.6 |
| $100-<150k | 5.9 | 5.9 | 28.3 | 27.6 | 23.6 | 23.1 | 5.3 | 5.3 |
| $150-<250k | 2.0 | 2.0 | 35.9 | 37.1 | 28.7 | 29.9 | 1.4 | 1.3 |
| $250-<500k | 0.3 | 0.3 | 9.9 | 10.6 | 7.9 | 8.5 | 0.9 | 0.8 |
| $500+k | 0.0 | 0.0 | 0.6 | 0.7 | 0.5 | 0.5 | 1.2 | 1.0 |
| Missing | 1.4 | 1.2 | 1.9 | 1.6 | 1.8 | 1.5 | 16.6 | 16.0 |
| Total | 100.0 | 100.0 | 100.0 | 100.0 | 100.0 | 100.0 | 21.1 | 20.5 |
| Families | 196,731 | - | 736,917 | - | 933,648 | - | - | - |
Notes: a Estimated gross income as reported.
Source: DESE administrative data
Further analysis of family income of families using child care, including the distribution of income with regard to the steps of the CCS subsidy rate, is presented in Chapter 4.
Data from the DESE/ORIMA parent survey suggests that, on balance, among families with children those who used child care were less sanguine about their financial situation than those who did not. The distribution of responses to the question 'Given your current needs and financial responsibilities, would you say that you and your family are …?' are shown in Figure 7. While there is clearly a skew towards more negative responses by those using child care, only the differences in the categories 'Very comfortable', and 'Just getting by', were statistically significant.
Figure 7: Families with children aged under 13, perception of financial circumstances, by use of child care, DESE/ORIMA parent survey, June 2019
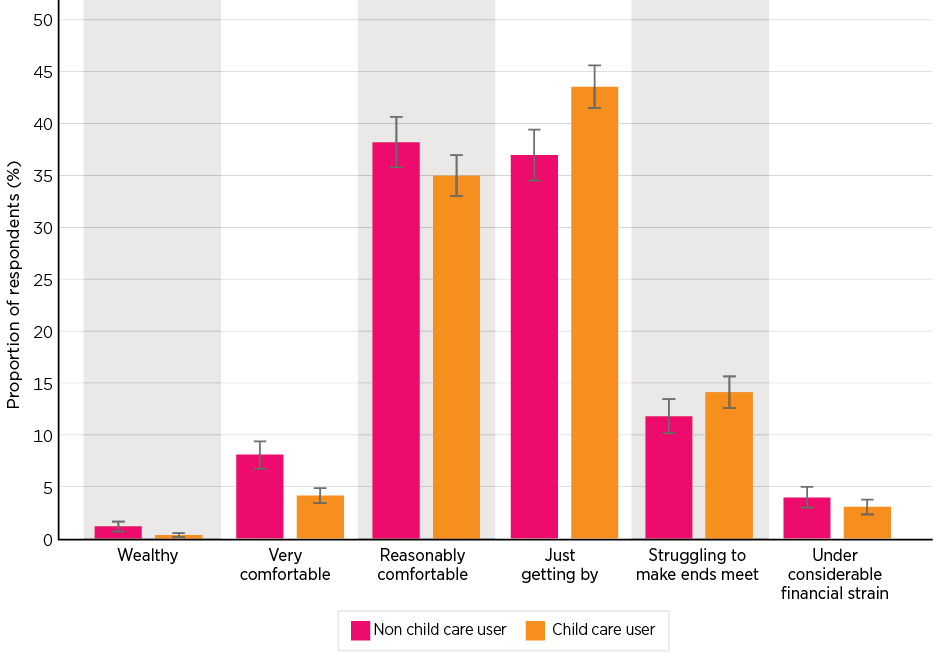
Notes: Child care user defined as a parent who has a reference child in an identified formal child care reference care. (See Section 2.4.2). Error bars on the chart show the 95 per cent confidence interval on the estimate.
Source: DESE/ORIMA Parent survey, June 2019
2.3 Costs and subsidies
The cost of child care is considered in detail in Chapter 4. This section considers the notional distribution of costs over time and the aggregate budget impact.
2.3.1 Fees and subsidies over time
The level of weekly fees charged and notional subsidies paid shows a number of patterns over time (Figure 8).36 These are driven by the patterns of use of child care services, the level of fees, and the structure of assistance to parents. Overall, the pattern of total fees reflects the number of children receiving care, as seen in Figure 5. The pattern of subsidies, however, also shows 2 distinct features relating to the old and new subsidy systems:
- In the period up to July 2018, there is a distinct pattern of the level of subsidies declining over the financial year. This reflects, in large part, the impact of the CCR cap. This progressively cut in across the financial year as more people reached their cap and lost eligibility for further assistance.
- In the post July 2018 period, the subsidy shows a distinct sawtooth pattern. This is largely a product of the caps on the number of hours of care a family is entitled to in a fortnight, with a small number of families reaching this cap in the second week of each of the assessable fortnights and hence receiving a lesser amount than they did the previous week. The operation of the activity test is considered in Chapter 6.
Figure 8: Total weekly fees and notional fee relief subsidies, January 2017 to December 2019
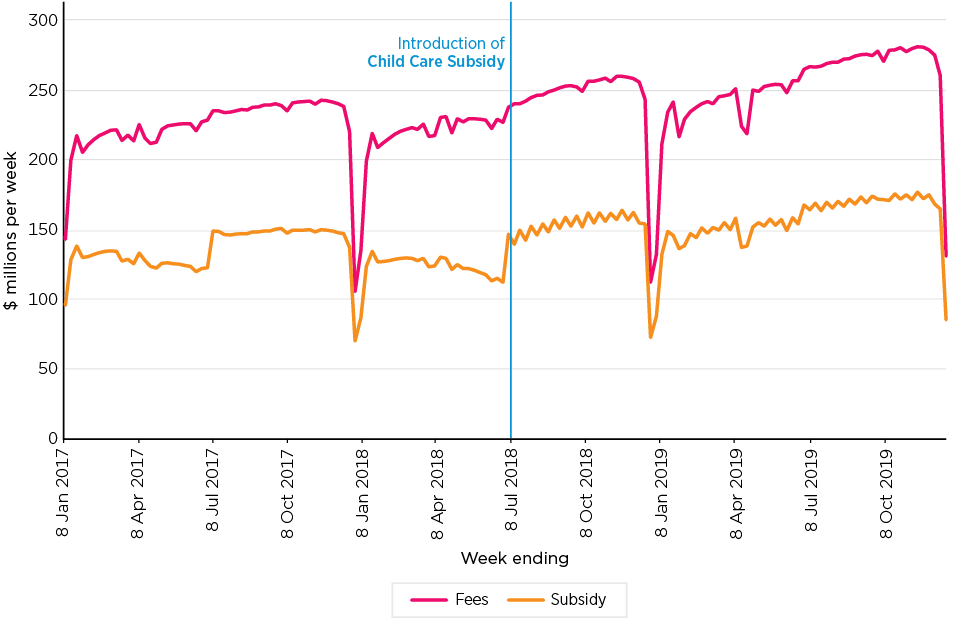
Source: DESE administrative data
More detailed analysis of the impact of subsidies on the affordability of child care is undertaken in Chapter 4.
Non-receipt of subsidies
While most children in child care do receive subsidy support, a small proportion, estimated at 5.6 per cent of children, do not. There are a number of reasons for this. In some cases, a parent will not meet the residency criteria for eligibility for subsidy or provide less than the 14 per cent minimum level of care, they may fail to meet immunisation requirements, or the family may have an income above the cut-off for CCS eligibility, or consider that the amount of subsidy due to them is not worth the effort of applying for the subsidy, or parents may simply be reluctant to register with Centrelink. In the case of administrative data, such as that used here for analysis, it is also possible that a single snapshot of data may record some incomplete administrative processes.
The incidence of non-receipt is highest in Outside School Hours Care where 10.7 per cent of children who attended such services, and had fees paid for, did not record having received a subsidy. In contrast, the proportion was just 0.6 per cent for children in In Home Care,37 2.2 per cent for those in Family Day Care, and 3.2 per cent for those in Centre Based Day Care. Across the population of children, the incidence of non-receipt is concentrated in higher income families, or those with missing information on income.
Figure 9: Proportion of children not receiving subsidy, Q4 2019
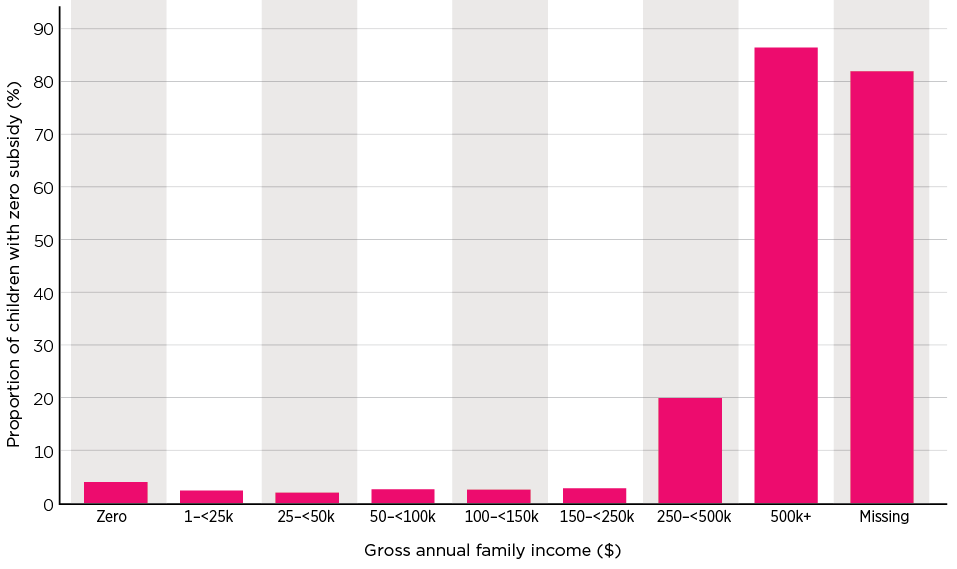
Note: Children for whom no subsidy is recorded in the quarter although they have recorded fees charged.
Source: DESE administrative data
2.3.2 Government expenditure
Budget expenditure by the Department of Education, Skills and Employment on child care programs is shown in Table 15. More generally, the Productivity Commission reports an increase in real spending by the Australian Government on ECEC of 74.8 per cent, from $4.498 billion in 2009-10 to $7.861 billion in 2018-19. The Productivity Commission also reports, in addition, spending of $1.964 billion in 2018-19 by state and territory governments.
As shown in Table 15, the overwhelming proportion of expenditure by the portfolio is on the subsidy programs. The support programs primarily involve spending on the Inclusion Support Program and the Community Child Care Fund, which are discussed in Chapters 7 and 9, but prior to 2018-19 also included expenditure on the Budget Based Funded Services.
Drawing strong conclusions from this budget information is, however, limited by some outstanding issues with the accrual accounting estimates for 2018-19. Over the financial year 2018-19, the Departmental administrative data reports the total value of the (unreconciled) Child Care Subsidy at $7.69 billion. While data for the 2019-20 financial year is included in the table, it is noted that this estimate also includes the impact of policies implemented as a response to COVID and hence is not a reflection of the impact of the Package on program expenditure.
| Program elementsa | Actual Expenses | Revised Estimate | |||
|---|---|---|---|---|---|
| 2015-16 | 2016-17 | 2017-18 | 2018-19 b | 2019-20 | |
| $ millions | |||||
| Child care support | 111.7 | 238.3 | 252.5 | 267.8 | 342.7 |
| JETCCFA | 17.4 | 26.4 | 49.9 | -0.6 | - |
| CCB | 2,578.4 | 3,649.0 | 3,246.6 | - | - |
| CCR | 2,450.9 | 3,627.4 | 3,766.6 | - | - |
| CCS | - | - | - | 7,440.3 | 8,317.2 |
| JETCCFA/CCB/CCR/CCS | 5,046.7 | 7,302.8 | 7,063.1 | 7,439.8 | 8,317.2 |
| Total | 5,158.4 | 7,541.1 | 7,315.6 | 7,707.5 | 8,659.9 |
Notes: a Selected program elements, excludes items such as communications campaigns and contributions to the Early Years Quality Fund. b DESE reports that in addition to this estimate of their actual expenses on an accrual accounting basis, the Department has also contingent assets and liabilities which relate to reconciliation and related debt issues.
Source: 2015-16: Education and Training Portfolio, Portfolio Additional Estimates Statements (PAES) 2016-17, 30-31; 2016-17: Education and Training Portfolio, PAES 2017-18, 25-26; 2017-18: Education and Training Portfolio, PAES 2018-19, 29; 2018-19 & 2019-20: Education, Skills and Employment Portfolio, PAES 2019-20, 37
2.4 Satisfaction with child care
Parental attitudes to the role and use of child care are important both in determining levels of use of these services and with respect to their satisfaction with access, quality and cost. The specific aspects of parental experiences and satisfaction with affordability will be considered in Chapter 4, those relating to flexibility in Chapter 5, and access in Chapter 6. This section considers, firstly, the attitudes of parents who both use and do not use child care services towards the role of this sector, and, secondly, what parents who use these services consider to be important, and their levels of satisfaction with aspects of provision.
The data used here has been drawn from a series of parent surveys undertaken by ORIMA Research for the Department of Education, Skills and Employment and made available to the evaluation as the key data source on parental experiences and attitudes. The survey is detailed further in Appendix A and will be drawn on in other chapters where it offers particular insight into the questions being considered. The June 2018, November 2018 and June 2019 surveys included a sample of parents using and not using child care. The November 2019 survey only sampled parents using care.
Most of the data on satisfaction and attitudes was collected on a 5-point scale, with parents rating their agreement or otherwise with a series of statements, with responses ranging from 'Strongly disagree' to 'Strongly agree'. In the following analysis, some results are presented as the original distribution, in other cases, a single summated score has been derived, with the mean, average, score being shown. This score ranges from -2 if everybody strongly disagreed with a statement to +2 if everyone strongly agreed.
2.4.1 Parental attitudes to child care
Parents were surveyed with regard to their attitudes to work and child care, including the benefits they saw children could obtain from participation. The questions sought parents' level of agreement with statements that child care benefits children in terms of their social skills, and benefits their learning and development. The results, as average scores, are presented in Figure 10. The data is presented for 2 different parental classifications, one by family type and labour force participation, the second by family type, age of youngest child and whether or not the respondent used child care.
Figure 10: Parental views on the benefits of child care for children, mean agreement, June 2019
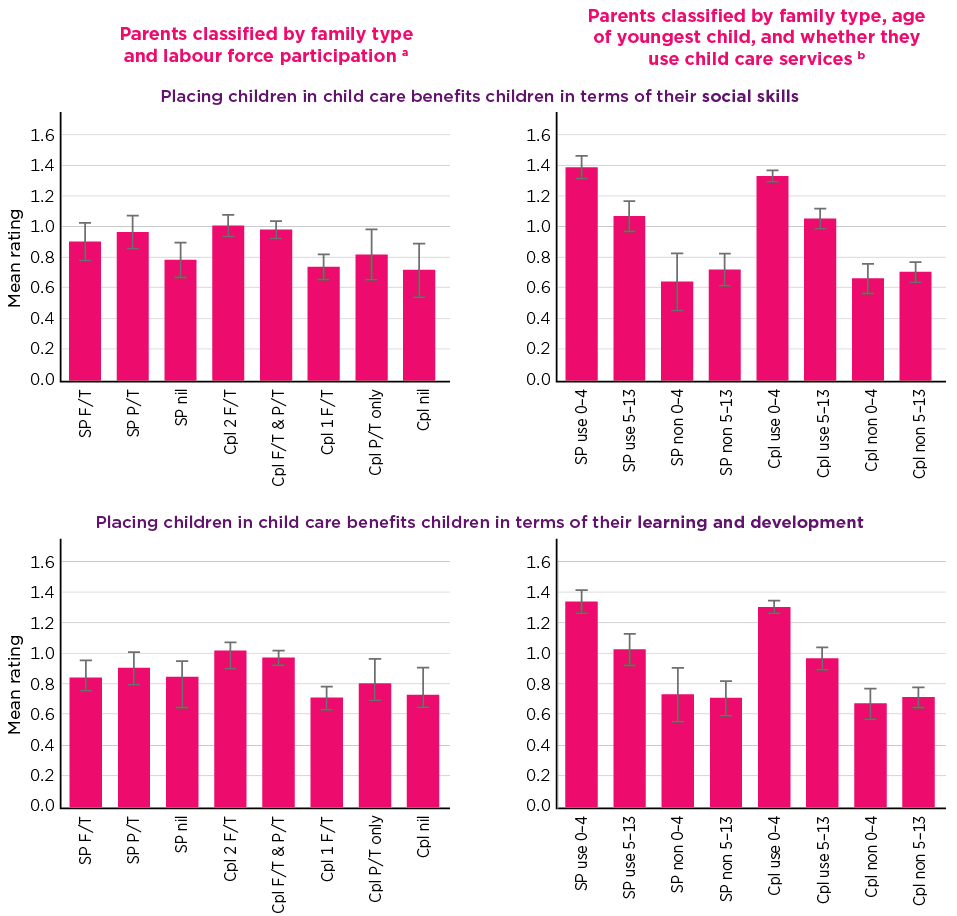
Notes: These questions asked a respondent parent to state their level of agreement with a series of statements. The charts show the mean score on a 5-point scale centred on those who neither agree nor disagree. The weights attached were 'Strongly disagree': -2; 'Disagree': -1; 'Neither agree nor disagree': 0; 'Agree': +1; and 'Strongly agree': +2. Error bars on the chart show the 95 per cent confidence interval on the estimate. a The labour force status of families has been derived from the reported employment activity of respondents and their partners and data on hours of work. SP F/T: Single Parent full-time employed; SP P/T: Single Parent part-time employed; SP Nil: Single Parent not employed; Cpl 2 F/T: Couple, both full-time employed; Cpl F/T & P/T: Couple, 1 full-time and 1 part-time employed; Cpl 1 F/T: Couple, 1 full-time employed and other not employed; Cpl P/T only: Couple, no full-time but one or both part-time employed; Cpl Nil: Couple, neither employed; b SP use 0-4: Single parent uses child care, youngest child aged 0-4 years; SP use 5-13: Single parent uses child care, youngest child aged 5-13; SP non 0-4: Single parent does not use child care, youngest child aged 0-4; SP non 5-13: Single parent does not use child care, youngest child aged 5-13; Cpl use 0-4: Couple uses child care, youngest child aged 0-4; Cpl use 5-13: Couple uses child care, youngest child aged 5-13; Cpl non 0-4: Couple does not use child care, youngest child aged 0-4; Cpl non 5-13: Couple does not use child care, youngest child aged 5-13.
Source: DESE/ORIMA Parent Survey June 2019
The data using this second classification, in particular, highlights some very large differences in the attitudes of parents. Although all groups reported on balance a positive level of agreement with the statements concerning child care having benefits for children, the force of this agreement was markedly, and statistically significantly, higher for each of the groups of parents who used child care, relative to the equivalent group of parents who did not use care.
Although the differences on the basis of labour force participation were not as marked, a key difference was seen among couples where both parents were working, especially working full-time, relative to those couples where there was a single full-time breadwinner. This latter group of respondents reported much, and statistically significantly, lower levels of agreement.
This result has a bearing on considerations in Chapter 8 on employment participation.
2.4.2 Parental satisfaction with child care
Parents were also asked questions about their overall level of satisfaction with the quality of paid child care. The first question asked about all paid child care that they had used over a defined reference period. The second was focused on a specific child care service received by a specific child in their family - the 'reference care' accessed by a 'reference child'.38 This latter is the focus of consideration here.39 Figure 11 presents the distribution of responses to this question across the 4 waves of the survey.
Satisfaction with the quality of care
Overall, parents expressed satisfaction with the child care their child was attending, with around half stating they were 'satisfied' and a bit over a third saying they were 'very satisfied', around 8 per cent said they were 'neither satisfied nor dissatisfied', some 4 per cent said they were 'dissatisfied', and around 1 per cent that they were 'very dissatisfied'. In general, there was little change in these responses over the 4 surveys, other than in November 2019. The proportion of parents reporting that they were very satisfied with the quality of care in this survey, of 32.3 per cent was statistically significantly lower than the 37.9 per cent recorded in June 2019 and 36.7 per cent in June 2018. Conversely, there was a statistically significant increase in the proportion reporting that they were satisfied between June 2019 and November 2019, but not relative to June 2018.40
Figure 11: Distribution of parental satisfaction with quality care, June 2018 to November 2019
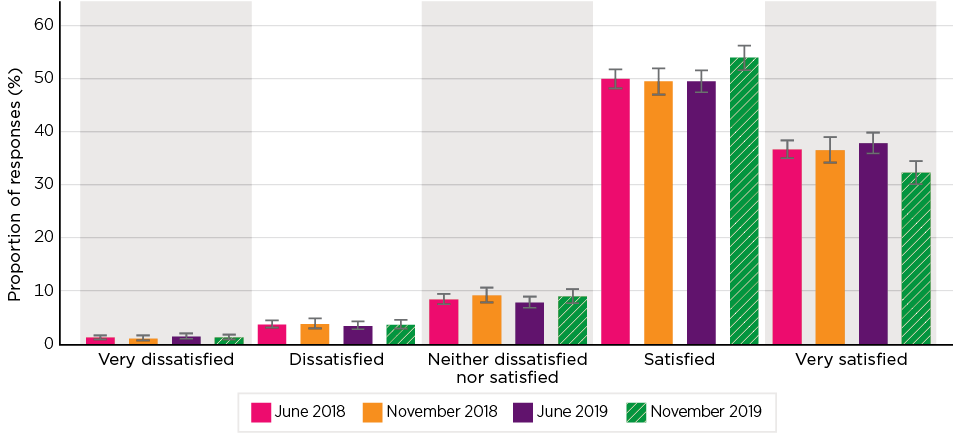
Notes: Reference care of reference child. Error bars on the chart show the 95 per cent confidence interval.
Source: DESE/ORIMA Parent Survey, June 2018, November 2018, June 2019 and November 2019
The pattern of stability seen in this distribution is also seen when the responses are combined into a single scale. This identified a small fall from June 2018 to November 2018 and then an increase to June 2019, and a decline to November 2019. However, none of the movements, either between individual surveys, or overall, were statistically significant at the 95 per cent confidence level, although the June to November 2019 fall was significant at the 90 per cent level. Figure 12 shows this single scale measure disaggregated by the type of care which was identified as the reference care.
While the results for the In Home Care sector are shown in the diagram, these will not be discussed, as the small sample size for this sector makes the estimates unreliable. Looking firstly at the relative ranking of the other sectors across the surveys, Family Day Care had a significantly higher level of satisfaction with the quality of care relative to both Outside School Hours Care and Centre Based Day Care in all surveys. In turn, Centre Based Day Care recorded statistically significant higher satisfaction with the quality of care than Outside School Hours Care in all but the November 2019 survey.
With respect to changes over time, there were no significant changes in satisfaction in any of the sectors, at the 95 per cent level of confidence and, indeed, across the sectors a range of diverse movements are recorded. Using the less stringent 90 per cent confidence measure, the decline in satisfaction with quality in Centre Based Day Care seen in November 2019 is a significant decline from that in June 2019 but not relative to June or November 2018.
Figure 12: Trends in mean satisfaction with quality of care, by sector, June 2018 to November 2019
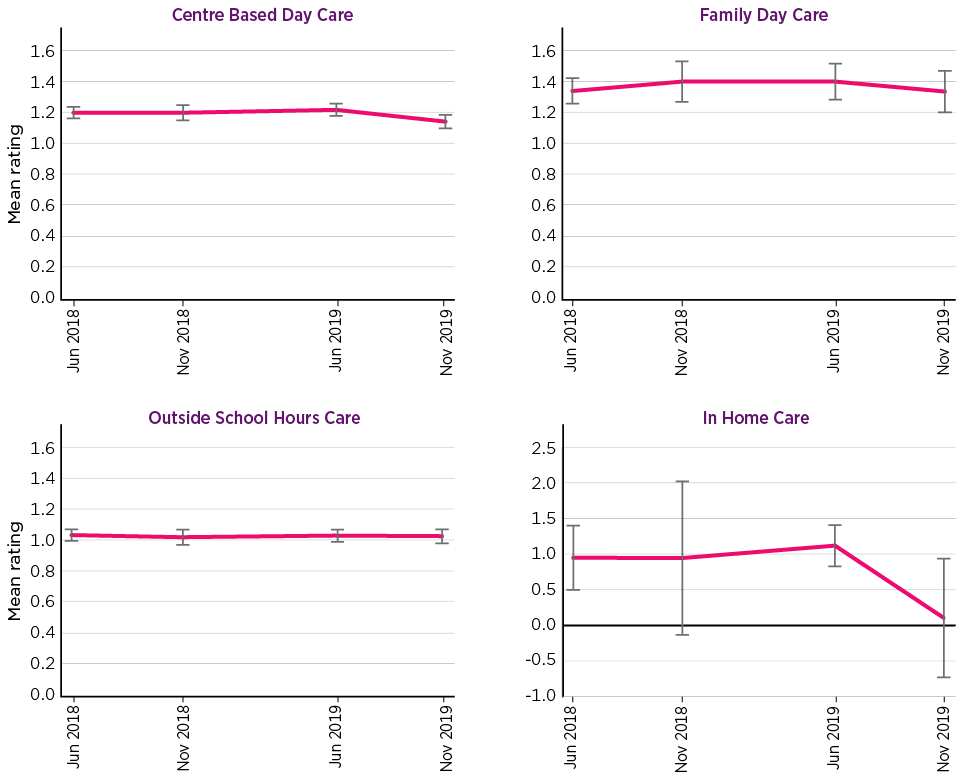
Notes: Reference care of reference child. Error bars on the chart show the 95 per cent confidence interval.
Source: DESE/ORIMA Parent Survey, June 2018, November 2018, June 2019 and November 2019
Two snapshots of satisfaction by state and territory in June 2018 and November 2019 are shown in Figure 13. In June 2018 respondents in Western Australia reported a significantly higher level of satisfaction with the quality of care received by the reference child compared to Victoria and Queensland but with no other significant differences with other states and territories. In November 2019 the only significant difference was a higher level of satisfaction in Tasmania relative to Victoria.
Turning to change over time, between June 2018 and November 2019 all states other than NSW showed a decline in satisfaction, although none of these, nor the very slight increase in NSW, were statistically significant at the 95 per cent confidence level, although the decline in Western Australia was significant at the 90 per cent confidence level.
Figure 13: Mean satisfaction with quality of care, by state, June 2018 and November 2019
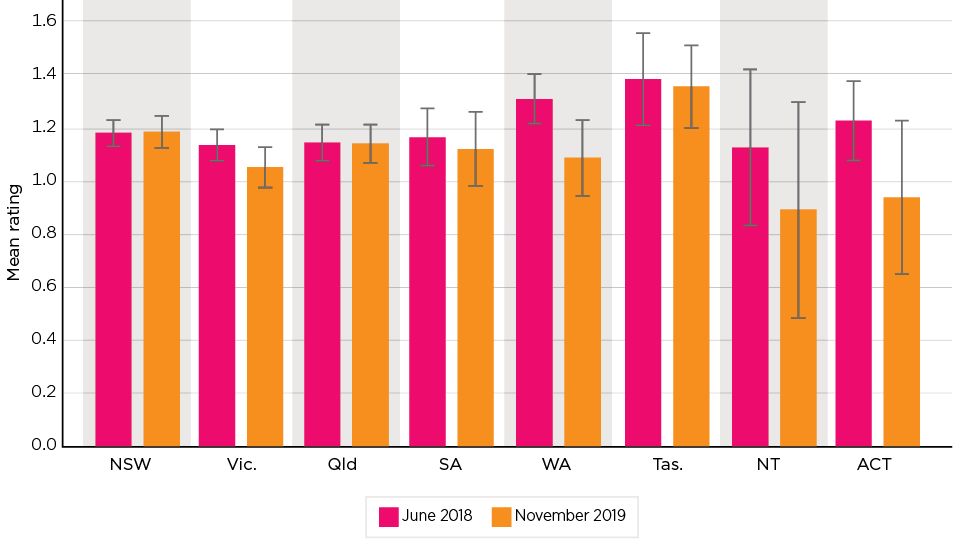
Notes: Reference care of reference child. Error bars on the chart show the 95 per cent confidence interval.
Source: DESE/ORIMA Parent Survey, June 2018 and November 2019
Importance of, and satisfaction with, aspects of care
The surveys asked parents about their level of satisfaction with a number of different aspects of child care. Specifically, parents were asked about their level of agreement with the following statements:
- Your child care service offers good learning and development opportunities for your child.
- Your child care service provides a place for your child to socialise with other children.
- Your child care service offers a healthy and safe environment for your child.
- The workers at your child care service are trained and experienced educators.
- Your child care service provides culturally appropriate care to your child.
- I am able to change my child care hours or days if I need to.
Additionally, in the baseline June 2018 survey, parents were also asked about the importance of these dimensions of child care provision, using a similar 5-point scale. Figure 14 illustrates the responses in that survey to both the question on importance and that on the level of satisfaction. The data is provided separately with respect to where the reference child is aged under 5 years, and for those aged 5-13 years.
The first 3 aspects seen as being most important were the same for both groups of children: firstly, health and safety, followed by having trained and experienced educators and, thirdly, providing opportunities for socialisation. Learning was fourth ranked with regard to care of younger children, followed by parental capacity to change hours and days, and for the older age group these 2 were reversed. While in rank terms, this reversal of position of learning is relatively minor, the mean scores show a marked difference; a mean rating of 1.2 for the younger age group and just 0.6 from parents with a reference child in the older age range. For both groups, cultural appropriateness is last ranked, with other analysis suggesting this is a very amorphous concept.
Figure 14: Parental views of importance of, and satisfaction with, aspects of child care provision, by age group of youngest child, June 2018
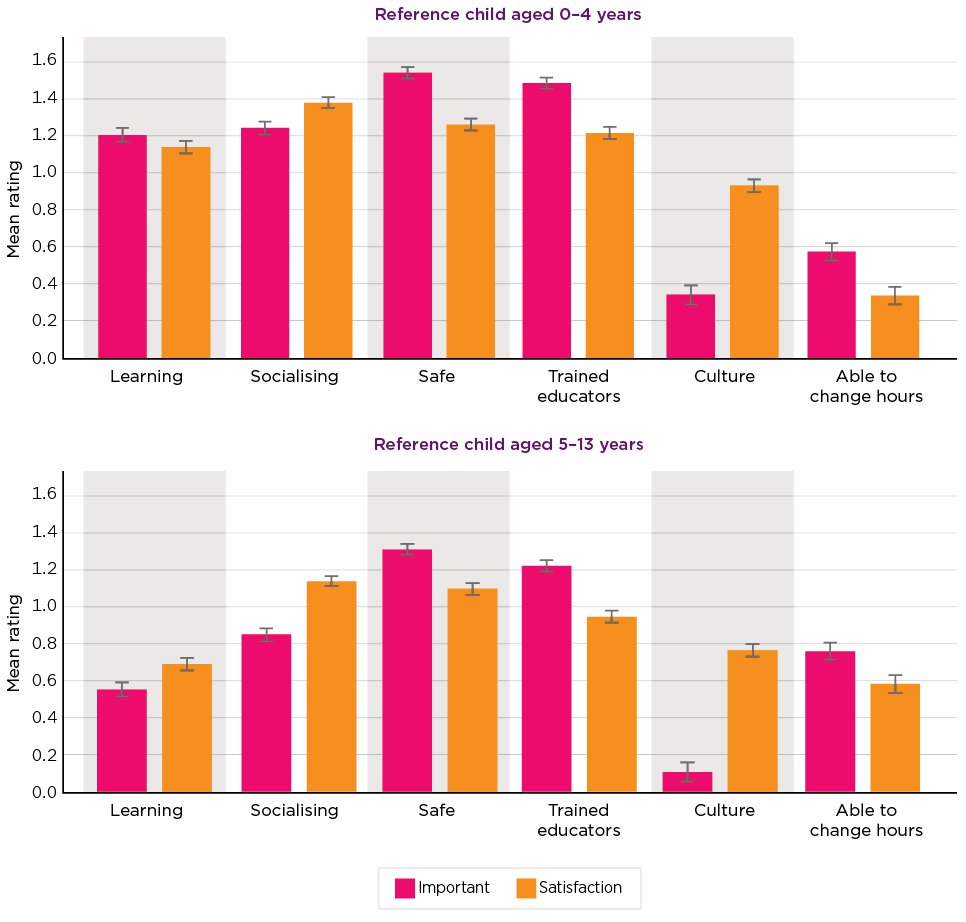
Notes: Satisfaction relates to reference care of reference child. Error bars on the chart show the 95 per cent confidence interval.
Source: DESE/ORIMA Parent Survey, June 2018
The trends in satisfaction against each of these dimensions, across the 4 surveys from June 2018 to November 2019, are shown in Figure 15.41 The time series for satisfaction with the first 4 aspects of satisfaction: good learning and development opportunities; socialising with other children; providing a healthy and safe environment for children; and having trained and experienced educators all show the same pattern. This is an increase in satisfaction to a peak in June 2019 to reach a level statistically significantly higher than that in June 2018, and then a decline to November 2019 leaving the measure at a level somewhat above, but not statistically significantly higher, than it was in June 2018.
Satisfaction with care being culturally appropriate shows a similar pattern but with the level in November 2019 being statistically significantly above that recorded in June 2018.
In contrast, satisfaction with their ability to change hours and days, as well as having a much lower level of satisfaction in each of the surveys when compared with any of the other dimensions of provision, shows a pattern of declining satisfaction, with the level of satisfaction in November 2019 being statistically significantly lower than it was in June 2018. This is an aspect that will be considered in Chapter 5.
Figure 15: Parental satisfaction with elements of child care provision, June 2018 to November 2019
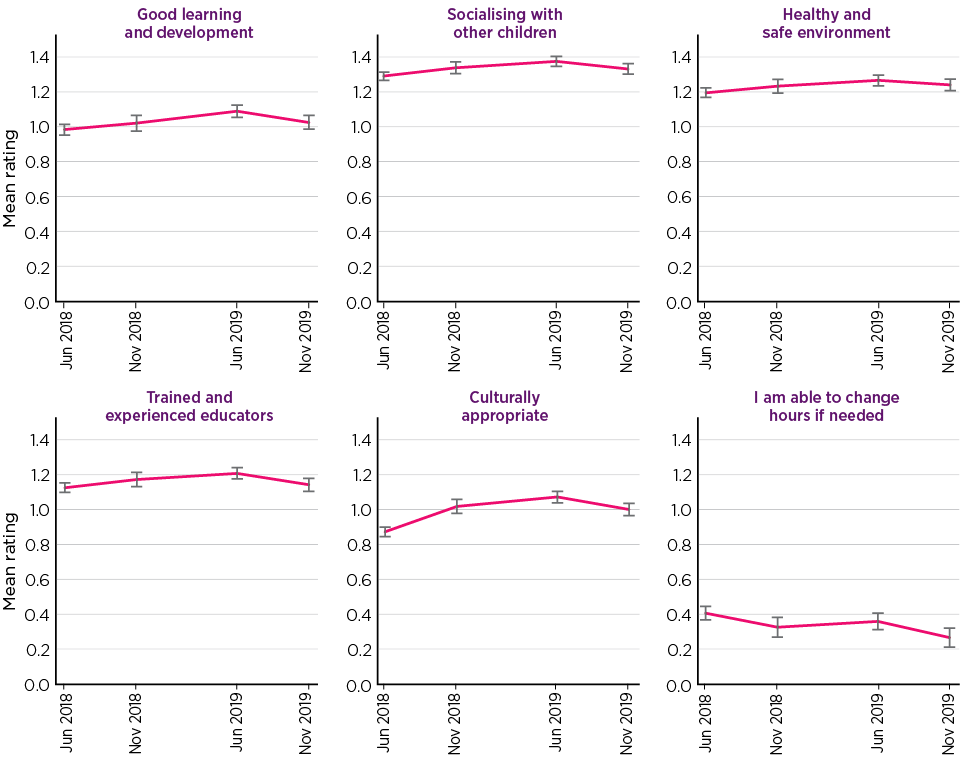
Notes: Reference care of reference child. Error bars on the chart show the 95 per cent confidence interval.
Source: DESE/ORIMA Parent Survey, June 2018, November 2018, June 2019 and November 2019
Taken together, this would suggest that, while on balance there have been some increased satisfaction by parents with some aspects of child care provision, these have been relatively modest and not statistically significant, due in some cases to a decline at the end of the period, as well as one measure showing a decline over the period. More generally, the responses to the aggregate question on satisfaction with quality showed no significant change. While clearly pointing to there not having been any systematic decline in these aspects of care associated with the introduction of the new Child Care Package, neither does this data suggest that there has been any significant improvement.
2.4.3 Service perspective on system
There is less systematic material available on services' perspectives of the state of the sector, although the Early Learning: Everyone Benefits report summarised it as:
At a national scale, the picture presented in this report is largely positive; however, focusing on the detail reveals challenges. While the headline figures indicate strong national progress in ECEC provision and quality, closer examination highlights significant pockets of unmet need, and problems of affordability and workforce planning. The picture also differs between states and territories, where differences in the ECEC landscape combine with varying policy settings to produce inconsistent results for children and families. (Early Learning: Everyone Benefits, 2019, p. 1)
2.5 Summary
The data in this Chapter has sought to describe the structure and magnitude of the child care sector in Australia and some of the main characteristics of the services that provide care and the families and children who use them. It has identified a number of specific aspects of the system, which will be addressed in later chapters.
While there has been a trend to improving quality in child care services as measured by ratings under the National Quality Standards, this data does not provide a basis for examining changes related to the impact of the Child Care Package.
The Chapter also reports on parental satisfaction with the child care system. This indicates:
- Overall, parents have a relatively high level of satisfaction with the quality of the child care that their children receive, with a distribution of views on what is important in the services provided by the sector.
- While satisfaction with some particular aspects of care have shown some improvements between some of the surveys, these have not necessarily been consistent over time, or with each other. More generally, there has been no significant change in parental satisfaction with the overall quality of care provided by child care services since June 2018. This suggests, at a minimum, that there have been no adverse impacts in these areas associated with the changes introduced with the Child Care Package in July 2018 but, equally, no evidence of any positive effects.
16 aifs.gov.au/sites/default/files/cc_package_ef_0.pdf
17 This survey was commissioned by DESE to be the main source of data on parents for the evaluation. The survey was managed and designed by the Department and was conducted on the Department's behalf by ORIMA Research.
18 The regulatory framework is complex. Centre Based Day Care services, Outside School Hours Care services and Family Day Care services must hold approval under the National Law. In Home Care services are not regulated under the National Law but in some states are subject to state and territory legislation. All In Home Care services need to meet quality standards as detailed in the Commonwealth Minister's Rules. Services also need to gain approval under Commonwealth Family Assistance Law to be eligible for receipt of Child Care Subsidy.
19 The legislation specifically excludes from eligibility to receive CCS a 'service that primarily provides an early educational program to children in the year that is 2 years before grade one of school (such as a preschool or kindergarten)', the rationale for this is that 'Preschool and kindergarten education is a financial responsibility of state and territory governments, including the distribution of Commonwealth contributions provided to states and territories through the National Partnership on Universal Access to Early Childhood Education' (DESE, 2020b, p. 2).
20 In some cases, a single educator or small group of educators may constitute a service.
21 In this analysis a child attending child care is defined as a child who has at least one record of hours of care in the DESE administrative dataset. This approach has been adopted to allow for some of the analyses that take into account actual attendance data. The figure of 1,327,238 children derived from this methodology compares with a raw count of 1,331,903 children in the dataset, and 1,330,205 if records that have no recorded child care fees are excluded. The restricted dataset used here identifies 13,118 services, compared with 13,135 in the raw dataset. These differences are considered to be immaterial for the purposes of the analysis undertaken, although it is noted that as different restrictions are used across particular parts of the evaluation analysis, similar small variations in counts will occur and hence numbers reported may vary.
22 This is based on the number of unique child identifiers. In some cases, a child may have more than one identifier as a result of a change in parenting arrangements, or other factors.
23 Analysis of provider structure is based upon the (confidentialised) provider CRN within the DESE administrative dataset. These identifiers do not, however, necessarily relate to legal or corporate structures. Analysis indicates that in some cases some organisations may have multiple CRNs; for example, when operating in different states, and hence be identified as being separate providers.
24 Hence while in November 2019 services had an average of 94 children attending, the estimated number of effective places was 53. This reflects the pattern of attendance of children discussed later in Table 9.
25 The state/territory approval process for services usually involves the specification of a number of 'approved places' that represent the maximum number of children who can attend the service. This data was not available comprehensively for this evaluation, nor does the approved size of a service necessarily reflect the actual current operating scale of the service.
26 It is noted that for both the Family Day Care and In Home Care sectors, location refers to the location of the service and may not reflect the actual location of service provision, as the latter is determined by the actual location of the educators operating within the service.
27 The ACT includes Jervis Bay.
28 The rating system also contains a classification of Excellent. This is the highest rating and is available, by application, for services which are rated as Exceeding the National Quality Standard in all 7 quality areas. Specifically it recognises services using innovative practice to achieve higher outcomes for the children and families using the service, their communities and the wider education and care sector. In Q4 2019 27 child care services had this rating. In the material presented here this category is combined with those rated as Exceeding.
29 Once services are rated, state authorities tend to monitor standards on a risk based approach with a focus on those services with lesser outcomes. Services can also apply for a re-rating. Data indicates that only 25.6 per cent of ratings, as at December 2019, were issued after the introduction of the Child Care Package (taking into account the 10-week period associated with conducting and issuing a rating). Additionally, some of the overall improvement in service ratings appears to be related to the exit of lower rated services. Data indicates that around one third of those services that had a last child record between Q3 2018 and Q3 2019 had a rating of working towards, or needing significant improvement, compared with some 23 per cent of those continuing.
30 Some caution needs to be exercised in comparing the pre-July 2018 data with the subsequent period. This reflects the extent to which the new data collection associated with the CCS may be more comprehensive in its coverage of children for whom subsidies are not being claimed, as well as changes in the underlying database as part of the IT changes associated with the package. In addition, children who attended what were then Budget Based Funded Services in this earlier period were not included in the data.
31 As discussed in Chapters 6 and 7, monitoring the levels of participation of Indigenous children in child care services is complicated by a change in the way these children are recorded in the data from July 2018 onwards, and the shift of the group of former Budget Based Funded services, which predominantly provided services to Indigenous children, into the fee and subsidy based sector as at the same date. These services are discussed in more detail in Chapter 10.
32 Essentially this is a measure of charged hours. While this may represent a formal session length in some cases; for example; when an hourly fee is charged, it may represent the number of hours which are charged.
33 The actual administrative data records for each child record a unique identifier for the 'customer', and where there is one, for a 'customer partner'. These are usually the parents of the child and are defined here as a family. In some cases, a child may have multiple families identified in the data; for example, if their parents are separated and have joint custody and each is responsible for arranging and paying for child care for those periods in which they care for the child. Except for the subgroup of children for whom additional information is available from the matched FTB file, no information is available in the administrative data on any other children in the family who do not use child care.
34 Parental activity and the approach to classification of activity is considered in more detail in Chapter 9, see also table notes to Table 13.
35 Excluding those with a reported zero income.
36 The level of subsidies shown in the chart are 'notional' in that while they relate to the actual subsidies paid to services in a particular week (plus the proportion withheld), as calculated based on the reported current income and activity of parents, these payments are subject to annual reconciliation and hence do not necessarily equate to the actual subsidy families receive. This is considered more in Chapter 5.
37 This result may be an artefact of the data, as the guidelines for In Home Care specify that: 'to access In Home Care, families must be eligible for CCS' (DESE, 2020c, p. 10).
38 Where families had more than one child, the reference child was the youngest child in the family attending paid child care. If the child attended more than one form of child care, the form of care used as the reference care was randomly selected.
39 This focus has been adopted as the first question potentially included the use of a range of paid child care services including nannies, etc., outside the scope of consideration here. In addition, the focus on a particular form of care where a child used multiple forms allowed the responses to be analysed by type of care.
41 There is a possibility that the difference between the June and November surveys may also reflect somewhat of a seasonal pattern. There is, however, insufficient data to allow this to be wholly explored.
3. Simplicity
The second program outcome identified for the evaluation was that 'Access to child care support is simple for families and services'. This is addressed in this chapter. The role of the Package in delivering a simpler system was emphasised in the second reading speeches on the legislation: 'A new, simpler Child Care Subsidy, which will improve affordability' (Birmingham, 2017) and 'a simpler, more affordable, more accessible and more flexible early education and childcare system' (Porter, 2016).
3.1 Program changes and simplicity
3.1.1 Program changes
A number of elements of the Package can be seen as making the child care system simpler. These included:
- The replacement of the dual subsidy approach of Child Care Benefit and Child Care Rebate with the single Child Care Subsidy.
- Improved processes for services in relation to regulations around approvals and opening hours. This included improving the consistency of language and streamlining required processes.
- A new IT system. The Department indicated this would 'support the major changes to the Child Care Package and will positively impact child care services, families and all levels of government with streamlined processes, reduced administrative and regulatory burden and increased information sharing' (Department of Education and Training, 2017a, p. 2).
At the same time, the new program arrangements introduced new, and modified other, elements of the program including: the new Income and Activity Tests, along with new processes for accessing child care assistance and enrolment processes, new reporting requirements and the hourly rate cap. These all have implications for the operation of child care for both parents and services. The Department considered that the new IT system would 'reduce regulatory burden on service providers by allowing parents to electronically record the times their child attends a child care service … [and] would remove the need for services to undertake administrative tasks, such as preparing and storing attendance sheets, … [and] would also streamline the reporting processes for services' (Department of Education and Training, 2015a, p. 101). While aspects of the enrolment and reporting process were seen as improving compliance and were 'required to support the integrity of the child care system, … [a]ll providers will be required to invoice families fortnightly, rather than quarterly, to provide families with information about their usage and entitlements' (p. 103).
In late 2019 the government revised one aspect of the new policy, changing what was known as the '8-week rule'. Under this, enrolments were deemed to lapse after 8 weeks of absence and required a new application for any further assistance. The change extended this period to 14 weeks. This addressed a concern by services that the 8-week period was too short, especially for the Outside School Hours Care sector, and had created a more complex and less efficient framework for the program. Because of the timing of data collections for the evaluation, most of the information used here predated this change and hence its impact cannot be reported on, and responses reported on may reflect this earlier issue.
3.1.2 Evaluating simplicity
Evaluating simplicity has a number of challenges, some of which have been exacerbated by the curtailment of some planned evaluation activities as a consequence of the pandemic, and the changed timing of this final report. These challenges include:
- The nature of the evaluation, which is focused on outputs and impacts, rather than being a formative evaluation. As such, it has not incorporated the type of systems analysis that would more directly inform on the complexity of processes. In the absence of this type of analysis and, as previewed in the evaluation strategy, a strong reliance on perceptions of simplicity, rather than direct measurement of this.
- The extent to which simplicity can be intermediated by the actions of the parties. For example, parental assessment of simplicity may be influenced by the extent to which services provide support to parents in their interactions with the child care system. Similarly for services, the quality of the software they use (as provided by a third party), significantly shapes their experience of the complexity of their interactions.
- The degree to which perceptions of simplicity are impacted on by 'difference' rather than 'complexity'. That is, people learn systems, and the introduction of a new system involves a new learning process, which means that, even if the new arrangement is simpler, they are less familiar. In this context, responses collected by the evaluation on 'simplicity' may be impacted by the experience of doing something different.
- Similarly, over time, as people become habituated to a system and learn how to navigate its complexities, they can confuse their increasing facility in working with it as simplicity.
- The introduction of the Package involved very substantial change and, in many cases, a very high workload, in particular for services, in making preparations and adjustments to their operations for the new system. Differentiating these transition effects relative to ongoing simplicity is difficult, especially where there is a high reliance upon subjective reporting.
The relationship between simplicity, and knowledge, and understanding, is also important. Some simple processes can appear, or become, complex if people cannot obtain, or understand, information about them, and even quite complex processes can be relatively simple to complete if people are readily able to access and understand clear information and guidance. For this reason, questions about access to, and understanding of, information about the system and its processes are also considered here.
In evaluating simplicity, 2 other key issues are:
- Whether or not the focus is on an absolute or a relative concept of simplicity. The evaluation largely considers this in relative terms - are the arrangements introduced with the Package simpler than what existed before, and how does the complexity of the operation of the Package compare with other administrative arrangements?
- How to treat problems experienced with processes; for example, slow administrative processes, systems issues, and other factors that impinge on the efficiency of the system, in the context of simplicity. In this chapter, we have included some dimensions of this. Underlying this approach is that a system that is conceptually simple but operationally inefficient, does not meet common concepts of simplicity in public administration.
The experiences of simplicity for families and services are also relevant to other outcomes and impacts in this report. For families who find access to child care assistance complex, or do not understand application processes, this may impact on both access to, and affordability of, child care. For more vulnerable families, this may be especially relevant, and is discussed in Chapter 7. For services, concerns about more complex or administratively burdensome processes may contribute to concerns about viability.
This Chapter initially considers parents' perceptions of whether the new subsidy arrangements are easier to understand, along with their level of understanding of the system, how easy they find information on child care to understand, as well as the sources they use to access this. A similar approach is then taken with services.
3.2 Parental perceptions and experience of the Child Care Subsidy
In addressing the question of simplicity from the perspective of parents a focus is their ease of understanding and ability to successfully operate within the system.
3.2.1 Overall assessment of the child care subsidy
The November 2018 and June 2019 DESE/ORIMA parent surveys asked parents a broad overview question about their level of agreement with a statement: 'The new child care subsidy is easier to understand than the old Child Care Benefit and Child Care Rebate.'
This question elicited a consistent pattern of responses in both the November 2018 and June 2019 surveys. That is, the perception of the relative ease of understanding the Child Support Subsidy system compared to the old was viewed consistently shortly after its introduction and a year after. This pattern suggests that the responses reflect a measured assessment, rather than being unduly influenced by familiarity or difference. As shown in Figure 16, the most common response was that people neither agreed nor disagreed with the statement, with just over 43 per cent of respondents giving this answer in both surveys. Some 33-34 per cent reported a degree of agreement with the statement, and 22-24 per cent disagreement. In both these cases - and more so in the case of agreement - these were heavily weighted towards the more moderate response of 'agreement', rather than 'strong agreement'.
Figure 16: Parental agreement 'The new child care subsidy is easier to understand than the old Child Care Benefit and Child Care Rebate', DESE/ORIMA parent survey, November 2018 and June 2019
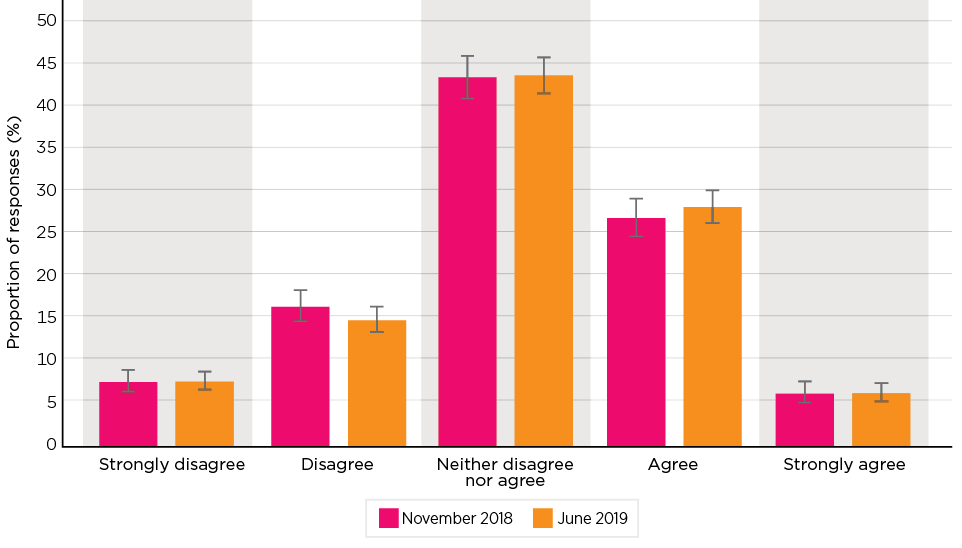
Notes: Parents with a 'reference child' in an identifiable 'reference care'. Error bars on the chart show the 95 per cent confidence interval on the estimate.
Source: DESE/ORIMA Parent Survey November 2018 and June 2019
More detailed analysis of these responses found some variation in responses for different population subgroups. Most marked, as seen in Figure 17, were variations between families on the basis of family income. While lower and middle income families tended towards being neutral or weakly positive, higher income families were negative in their assessment of the ease of understanding of the new policies. However, the 2 groups with strong negative responses represent very small population groups - 3.3 per cent and 1.4 per cent, respectively.
The largest population group - those families with children in child care with gross family incomes between $65,000 and $125,000 per annum, who accounted for around 30 per cent of the estimated population of parents in November 2018, was the only group that recorded a statistically significant average positive rating in both November 2018 and June 2019 in response to this question on the CCS being easier to understand, although those families with an income of between $30,000 and $65,000 also did so in the June 2019 survey but not in the preceding November survey. While the 2 lower income groups both reported an increase in their assessment of the relative ease of understanding the program between these 2 waves of the survey, the reverse was the case for all other groups, although none of these changes were statistically significant.
The pattern of responses, in particular the more adverse responses by higher income groups, would appear to reflect several factors. One is the extent to which families with higher incomes were more likely to have a decrease in their level of subsidy rather than any increase, and the structure of the new administrative arrangements that required them to engage with Centrelink, that many of those with lower incomes had already had some experience with.
While there were some other statistically significant variations, these were not consistent across the surveys and were small in magnitude.42
Figure 17: Mean parental agreement 'The new child care subsidy is easier to understand than the old Child Care Benefit and Child Care Rebate', by family income group DESE/ORIMA parent survey, November 2018 and June 2019

Notes: Parents with a 'reference child' in an identifiable 'reference care'. The chart shows the mean score on a 5-point scale centred on those who neither agree nor disagree. The weights attached were 'Strongly disagree': -2; 'Disagree': -1; 'Neither agree nor disagree': 0; 'Agree': +1; and 'Strongly agree': +2. Error bars on the chart show the 95 per cent confidence interval on the estimate.
Source: DESE/ORIMA Parent Survey, November 2018 and June 2019
Overall, this would suggest that while the Package measures were, on balance, seen more positively than negatively in terms of parents' ease of understanding, the magnitude of this was small. The average rating in November 2018 was 0.08, just one twelfth of a response category above neutral and, in June 2019, 0.11 of a category.43 While both of these were statistically significantly different to being neutral, the strength of agreement was very weak. While responses to this question varied across population subgroups; in general, these were small, other than the more negative response by those on higher incomes. Overall, these results suggest a very small marginal effect, rather than any significant shift in perceptions around the simplicity of child care support.
3.2.2 Parents and the Child Care Subsidy
Parents' assessment of their understanding
Parents were asked (in CCPFamS) how well they understand how eligibility for CCS works. In November 2018, 31.8 per cent said they understood this 'very well' or 'well'. Another 42.2 per cent reported they understood it 'somewhat', while 25.9 per cent said they understood this 'not very much' or 'not at all'. When this same question was asked in September 2019, responses were similar, although with a little more understanding reported: 35.2 per cent said they understood how eligibility to CCS works 'very well' or 'well'.
Figure 18 presents, for this question, and a number of more specific questions about the operation of the subsidy, the mean score reported by parents in these 2 survey waves. A positive score represents a balance of responses above that of 'somewhat understanding' and a negative score a balance below this - that is somewhere between 'somewhat' and 'not very much'.
The chart indicates that there was some variation in parents' understanding of different aspects of the program, and some shift in the level of understanding over time:
- Overall, the average scores reported by parents were just slightly above 'somewhat of an understanding'.
- The most well-understood component was what parents needed to do if their circumstances changed, and the least well-understood was the 5 per cent withholding.
- Over time, between November 2018 and September 2019, there was some improvement in understanding by parents, as reported in this survey.
- This was relatively slight in the case of understanding how eligibility for the Child Care Subsidy works, and how income and activity affects entitlement. In each of these, the gain was just one tenth of a step between response categories.
- In contrast, understanding of what to do if circumstances change, and of the 5 per cent withholding, increased by around 0.4-0.5 of a step.
Figure 18: Parents' self-reported understanding of aspects of the Child Care Subsidy, CCPFamS, November 2018 and September 2019
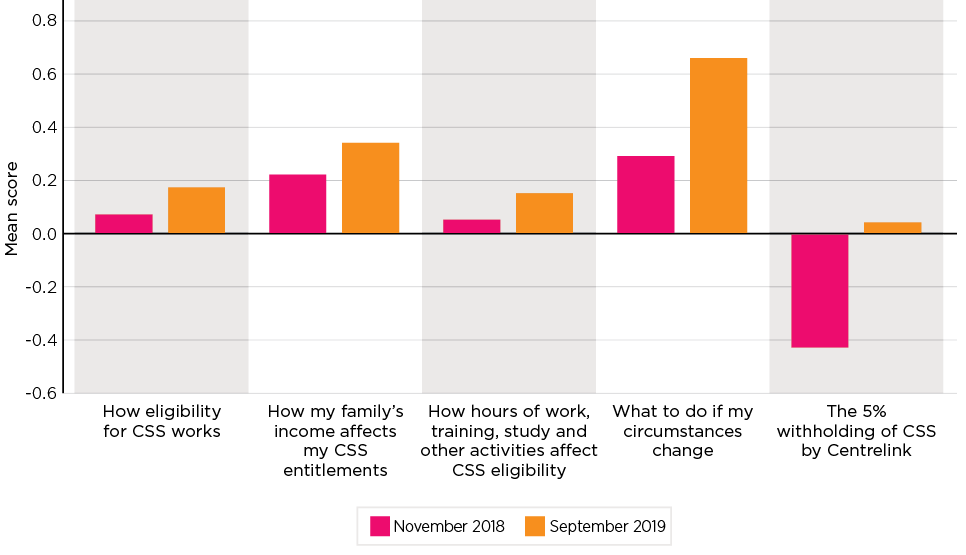
Notes: The chart shows the mean score on a 5-point scale centred on those who report they 'somewhat understand'. The weights attached were 'Not at all': -2; 'Not very much': -1; 'Somewhat': 0; 'Well': +1; and 'Very Well': +2.
Source: Child Care Package Family Survey, Wave 1 (November 2018) and Wave 2 (September 2019)
Multivariate analysis of these responses did not identify any strong patterns of association other than those who reported they or their partner worked variable hours, reporting a lower degree of understanding to most of the questions. This was a marked half a category difference with respect to eligibility, and a third of a category on the role income plays in determining entitlement.
Parents' experience of the CCS
A series of more experiential questions relating to the ease of interaction with the Child Care Subsidy were asked in the DESE/ORIMA parent survey. While some of these questions were asked in each wave of the survey, and provide some basis for identifying the extent to which the Package was relatively simpler than previous funding arrangements, others were only asked of the new arrangements. The results are shown as summary mean ratings in Figure 19. Again, these are rated with agreement being positive on a 2-step scale and disagreement negatively, with neutrality being neither agreement nor disagreement.
As shown, the largest negative response was with regard to it being 'easy to understand government information about child care fee assistance'. This series, though, does show a statistically significant improvement between June 2018, when the question related to the old funding arrangements, and the subsequent surveys, which relate to the Child Care Subsidy. The pattern of these responses is considered further in Figure 20, which shows the proportion of parents 'strongly disagreeing' with the statement falling from 20.9 per cent to 15.8 per cent between June 2018 and November 2019, and the proportion 'agreeing' increasing from 21.5 per cent to 26.2 per cent, with both these movements being statistically significant. In addition, there was a fall in those 'disagreeing' and a slight increase in those 'strongly agreeing', but neither of these was statistically significant.
While suggesting that information on the Child Care Subsidy was more easily understood (or presented), the actual magnitude of change needs to be given some attention. This change equates to a fall of 7.3 percentage points in the proportion of parents who disagreed with the statement, and an increase of 5.2 percentage points in the proportion agreeing. More so, even after this improvement, some 49.8 per cent of parents disagreed with the statement and just 28.7 per cent agree.
Additionally, while there has been a small improvement in understanding, it has not been accompanied by any consistent increase in parents' perception of the ease with which they can obtain this information.
Figure 19: Mean parental agreement with statements on aspects of the operation of the Child Care Subsidy, DESE/ORIMA parent survey, June 2018 to November 2019
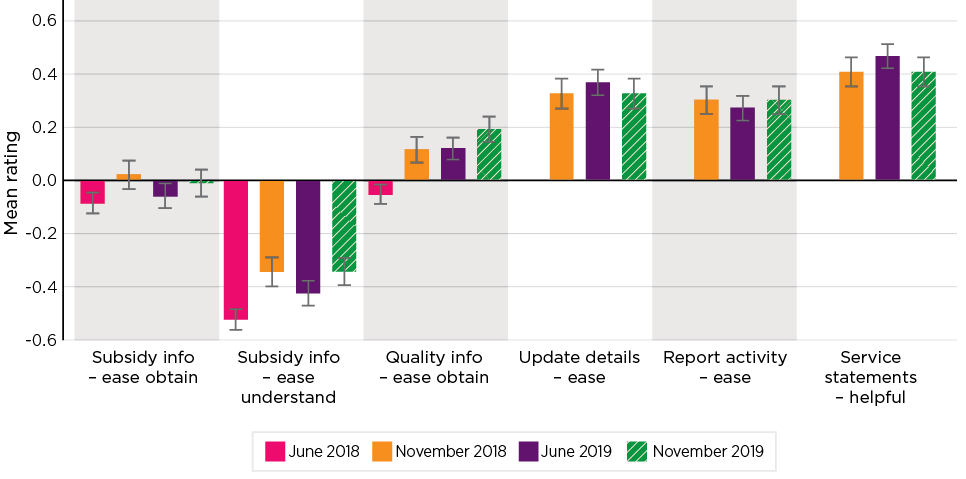
Notes: Parents with a 'reference child' in an identifiable 'reference care'. The chart shows the mean score on a 5-point scale centred on those who neither agree nor disagree. The weights attached were 'Strongly disagree': -2; 'Disagree': -1; 'Neither agree nor disagree': 0; 'Agree': +1; and 'Strongly agree': +2. Error bars on the chart show the 95 per cent confidence interval on the estimate.
Source: DESE/ORIMA Parent Survey, November 2018 and June 2019
Figure 20: Parental agreement that 'It is easy to understand Government information about child care assistance', DESE/ORIMA parent survey, June 2018 and November 2019
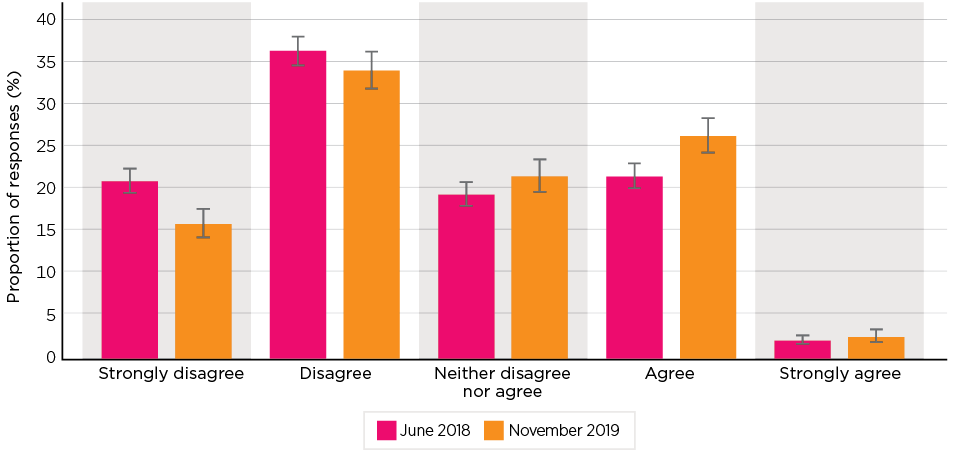
Notes: Parents with a 'reference child' in an identifiable 'reference care'. Error bars on the chart show the 95 per cent confidence interval on the estimate.
Source: DESE/ORIMA Parent Survey, November 2018 and June 2019
The only other question that recorded a consistent significant change over time was that concerning information on service quality: 'It is easy to access information on the quality of child care.' There does not seem to be any activity associated with the Package that could impact on this change, which was seen across the country.
Turning to the other questions, it is noted that:
- The balance of responses to questions about the ease of being able to 'provide (or update) my details for child care assistance via the myGov website or Centrelink'44 and it being 'easy for me to report fortnightly hours of activity for the Child Care Subsidy Activity Test', were positive, although this was only weakly so. On average, the responses to these questions were just a little above one third of the way to 'agreement', relative to 'neither agreeing or disagreeing', with fewer than one in 10 respondents strongly agreeing.
- There was no time trend in these responses, which suggests that lack of familiarity with the system in the early stages of introduction was not a factor in the relatively low scores.
- Parents reported (CCPFamS (Wave 2)), in September 2019, a considerable degree of confidence that they had reported their activity details correctly (85.4 per cent agreed or strongly agreed). However, about half (50.6 per cent) the parents reported being worried that they would end up with a child care debt at reconciliation if they did not get their activity details right. The majority indicated they did not overestimate or underestimate their activity hours, in contrast to the minority reporting to overestimate (6.6 per cent), or underestimate (11.5 per cent), the hours of activity they report to Centrelink. Overall, these responses indicate that while the majority of parents make an effort to record their activity details correctly and in a timely manner, many are still concerned about having a child care debt associated with incorrect reporting of activities (referred to as 'activity debt' by the Department).45
- There was a weakly significant negative association between parents who had variable hours of employment and their reporting of ease of completing these various administrative tasks. There was also a tendency for higher income families to be more negative.
- Statements [Statements of Entitlement]46 provided by services were seen most positively of any of the aspects covered by these questions.
3.2.3 How parents gain information
To access information about child care assistance, families may go online for general information, with information provided on Services Australia and Department of Education, Skills and Employment websites, as well as being available from different child care providers and stakeholders. They may also contact Centrelink by phone or in person. Where parents go to for information about government child care fee assistance, as reported in the November 2019 ORIMA/DESE survey, indicates that by far the most common information source among those using paid child care, see Table 16, was Centrelink/myGov, with three-quarters of respondents citing this as one of the sources they used.
| Source: (Multiple sources could be given) | Proportion of parents accessing (%) |
|---|---|
| Centrelink/myGov | 75.4 |
| Child care service | 24.1 |
| Word of mouth, e.g. family, friends, work colleagues, etc. | 15.3 |
| General web search | 14.0 |
| MyChild/Child Care Finder | 5.1 |
| Advertising | 1.4 |
| Other | 1.1 |
Notes: Parents with children attending paid child care.
Source: DESE/ORIMA Parent survey, November 2019
Centrelink/myGov as an information source was reported by a similar percentage in June 2019 (77.0 per cent) but before this, in May 2018 and November 2018, was reported by much lower proportion (50.8 per cent and 43.4 per cent respectively). In contrast, the percentage of families reporting that they sourced information from their child care service was lower in June 2019 (27.6 per cent) and November 2019 (24.1 per cent) compared to a much higher 49.9 per cent previously in November 2018. ('Child care service' was not a response category in the May 2018 survey.) The changing information sources appear to indicate a pattern of strong reliance upon services during the transition and then a shift toward Centrelink/myGov.
3.2.4 Parental reports of issues arising
This section draws on some of the qualitative data collected in the evaluation through surveys, consultations and case studies to identify some of the more recurrent themes in parental and provider responses concerning issues that have arisen in parents' interaction with the child care system.
The activity test
The activity test was frequently raised. This test is both simple in some aspects and complex in others,47 and while at times appearing to be applied as 'indicative' rather than prescriptive, parents' statements of activity are subject to random spot checks, with a requirement for documentation of evidence, and the potential for the creation of a significant level of debt. For example, the documentation provided to parents indicates 'If your work hours change each fortnight, you need to give us an estimate of your hours. Estimates should be the highest number of hours you expect to work in a fortnight over the next 3 months' (Services Australia, 2019). However, parents are also warned that they may be subject to spot checks and be required to provide evidence of their level of activity. But there appears to be no guidance on what happens if the 'expected hours' do not eventuate, or any warning to parents of the potential debt they may incur. These concerns about activity related debt are consistent with the data from the Child Care Package Family Survey reported in Chapter 4.
As detailed above, parents' views on the ease of reporting on the activity test were on balance positive, with just over half (51.4 per cent) agreeing (although only 6.1 per cent strongly agreeing), 29.4 per cent neither agreeing nor disagreeing, and 19.2 per cent disagreeing, although around half indicated they were worried that they would end up with a reconciliation debt if they did not get their details right.
Against this background, services and stakeholders expressed some concern about parent understanding of the activity test, particularly where the parent/carer is engaged in casual or intermittent work, or undertaking non-paid work activity, that would be eligible towards meeting the activity test. Services, who, as reported in Section 3.3.2, saw the activity test as having a negative impact on their operation, reported that they had experienced a number of cases where families did not recognise that these were eligible activities, referring to a range of circumstances including farming activities and volunteering. One stakeholder referred to their experiences working with parents who often had unstable working arrangements:
… for many families and particularly for women at the bottom end of the labour market … circumstances would be constantly changing … women who are on casual rosters and on short term contracts and highly variable work arrangements, and for them to navigate the complexity of the activity test … It was much more likely that women would think, 'Oh no, I'm not going to be able to access that subsidy because I don't have stable work. And I can't be sure that I'm always going to meet the activity test and I don't want to take the risk that one fortnight I'm going to lose it.' And so that they would rule themselves out
[Child care stakeholder, November 2018]
This lack of understanding of the operation of the activity test, and of reporting, was also evident in responses from parents:
My husband lost his job, and after a few months, we changed his income and were entitled to a higher rebate. However, as I didn't adjust his hours for 'looking for work' and, on paper, he was technically doing 0 hours work, we got less than one day subsidised care. Our weekly child care cost jumped to $1000 without notice for the 3 days our children attended. We could not pay this until my husband resumed work, and we couldn't withdraw them from care because we would not have been able to get them back in. We had to take out a loan.
[Family using CBDC, October 2019]
Some of the questions on the forms around CCS need to be clarified. As I know I incorrectly put down my weekly instead of fortnightly hours and had to submit a correction. In particular, more definitions or examples would be helpful. It can be confusing for parents.
[Family using CBDC and OSHC, October 2019]
The Income Test and costs of care
Different experiences of understanding child care costs have been evident in the comments by parents in the qualitative interviews and surveys. Overall, parents considered they did know how much child care was costing them, although there is little evidence of this understanding having improved with the introduction of the Child Care Package.48 In November 2018, 74.8 per cent of families in CCPFamS strongly agreed or agreed that they knew how much child care was costing them, and this compares to 73.5 per cent of the same respondents having indicated in May 2018 (in the DESE/ORIMA survey) that they knew how much child care was costing them.49
Notwithstanding this general response, there were extensive comments made by parents in the data collections that highlighted some specific problems parents encountered, or where they felt that the system could be improved. These included:
CCS is very hard to predict. Once I started working more I didn't know how much I'd need to budget until my first direct debit from day care came in. It seems arbitrary and all the calculations, for a working parent are ridiculous. Create a calculator that a parent can access online, that would help greatly.
[Family using CBDC, October 2019]
I think because I went back to work more hours, it increased the percentage I had to pay. It wasn't a huge debt … Annoying though … It was far easier when it was the 50 per cent. Life is busy enough, without constantly thinking about changing my income and work details. I do not have the time for that.
[Family using CBDC, October 2019]
Related to this, parents also reported difficulties in understanding how their child care costs would be impacted by changes in circumstances. According to findings in one of the case study sites, this was exacerbated in situations that involved possible transition from income support payments to employment, in which parents were unclear how their income support and rent assistance payments would be affected, along with not understanding how much child care would cost them.
The issue of having a calculator to assist parents work out their child care costs was, as identified above, raised on a number of occasions. Prior to the transition to the Child Care Package, online estimators were available to help parents determine their eligibility for child care assistance under the new arrangements, and help them estimate their future costs of child care. Initially, an estimator was made available through the DESE website. From April 2018, the Services Australia Payment and Service Finder was enabled, and the DESE estimator was disabled.50 The Services Australia Payment and Service Finder continues to be available. Comments from families in the November 2018 CCPFamS indicated greater satisfaction with the initial DESE calculator provided during transition, when compared to the Services Australia one.
I used to use the child care calculator to work how the costs would change if I worked more or less. The website seems to have changed (sometime before the transition) and now it is far less helpful. Having to answer questions to see what payments I might be eligible for before being able to move to the calculator I was hoping to quickly pop some figures in.
[Family using CBDC, October 2019]
The existing Services Australia estimator first steps parents through whether they are entitled to other subsidies and payments administered by Centrelink/Services Australia, so is a more complex process than some parents are seeking, particularly those that are not seeking any information about government assistance other than for child care. Further, this estimator does not provide a straightforward means for parents to experiment with different work hours or child care characteristics to determine their child care costs under different scenarios. The initial DESE estimator allowed parents to do this. Some of the large providers have developed their own estimators that are available through their websites to fill this demand.
Interactions with Centrelink
Many comments in the evaluation data collections about families' experiences of CCS refer not to the subsidy itself, but to experiences of needing to rely on Centrelink for information or assistance, or what parents saw as the complexity of Centrelink processes and inadequacy of information. This was apparent from parent reports in the CCPFamS. In 2019, comments specifically about Services Australia/Centrelink centred on a number of key themes about poor customer service and long waiting times for assistance from Centrelink, information being difficult to understand, difficulties navigating myGov and long waiting times for end of financial year balancing.51
An example of the adequacy/clarity of information and the time taken in dealing with Centrelink is illustrated in one parent's report:
When applying for child care subsidy or updating my family income estimate, the website doesn't explain very well that if you're on maternity leave you leave your hours at 80 per fortnight for up to 12 months post baby being born. It doesn't give you the option to tick 'on maternity leave' so I had to call Centrelink and wait for 55 minutes to get through to a customer service representative to find that out.
[Family using CBDC, November 2018]
3.2.5 Services' perspectives on parents and simplicity
Services who participated in the case studies largely agreed that the move from 2 separate subsidies to a single subsidy was more streamlined for families and that, aside from initial issues during the transition, most families had become competent at navigating myGov, updating their income and hours of activity, and managing enrolments. However, consistent with findings of the Evaluation Stakeholder Survey from 2019, service directors spoke of the CCS application process remaining confusing for some families who were new to the process and voiced their concerns that these processes posed particular challenges for disadvantaged or vulnerable families. In this regard, they reported that in their experience the process was also less straightforward when family circumstances required supplementary applications or when families needed to make complex calculations, for example calculating hours of activity when a parent is engaged in casual or intermittent work.
A consequence of this was that many services reported needing to assist families to understand or navigate through some of the less obvious elements of the new package.
I've got my teams now and they regularly search out information that's not promoted. It's an 'in the back' 'in the fine print' process that directly affects our frontline staff and it affects our families. The intricacies of the administration that is probably not visible or understandable to the families.
[CBDC and OSHC stakeholder, April 2020]
Issues cited included understanding the reconciliation process at the end of the financial year and how accrued debt would be recouped, the 8-week rule (in data collected before the changed policy), the need for a child to be physically present on their last day of enrolment at a service, and how the billing cycle works when the hours of care used by a family are greater than the number of subsidised hours they receive.
3.2.6 Simplicity and parents - summary
The above analysis suggests that while the child care arrangements introduced with the Package are somewhat simpler, from the perspective of parents, the extent of change is quite small. At best, parental views on aspects of the system are weakly positive, including with regard to accessing information, understanding it and applying it to their operational interface with the payment system. While, on one hand, many families were able to 'set and forget' their child care payments once they had navigated the initial processes - which could be challenging for some - for others it was more difficult.
In particular, the analysis suggests that the system is seen as less simple by those with unstable or varying employment, and also by higher income earners. This latter, though, is a relatively small group and their attitude is likely to also reflect the extent to which they are now having to interact with a means tested payment and with Centrelink, rather than the more universal Child Care Rebate. For those who are already dealing with uncertainty in employment this, in turn, can be amplified by their concerns with how this impacts their child care assistance.
Underpinning parents' attitudes are a wide range of more specific issues. One element of this concerns the lack of responsiveness of the system to queries and problems, with Centrelink being seen as central to this, and, more generally, that when problems do arise they can take a very long time to be resolved. One specific aspect of timing, identified here but also discussed in Chapter 6, relates to the initial approval process and the Departmental view that services should charge full fees over this period.
While some of the analysis suggests that parents' experiences have improved as they have become more familiar with aspects of the system, this would appear to relate more to their level of understanding, rather than seeing the actual system as being simpler. Ease of access to information about the CCS is viewed less favourably than a number of other aspects of the program.
3.3 Services and simplicity
As discussed in the introduction, in the evaluation a key challenge in assessing the service perspective and experience of simplicity in the new arrangements was the significant complexity and high workload that services experienced in the transition process (see Chapter 10) and the way this permeated their responses. This was exacerbated as the final phase of research for this question, which was to involve an additional survey wave of services at a time more removed from the introduction, was curtailed by the COVID-19 pandemic.
3.3.1 Service understanding of the Child Care Package
As is the case for families, service understanding of the Child Care Package is both a reflection of the simplicity of arrangements and of their having the prerequisite knowledge to function within the arrangements. Just prior to the introduction of the Child Care Package, about half the services rated their understanding of the Package as poor or fair. By the second wave of the services survey in July 2019, there had been a marked improvement in understanding, with fewer than 15 per cent reporting their understanding was only fair or poor. A similar percentage rated their understanding as excellent, see Figure 21.
Figure 21: Services' assessment of their understanding of the Child Care Package, SELCS, June 2018 and July 2019
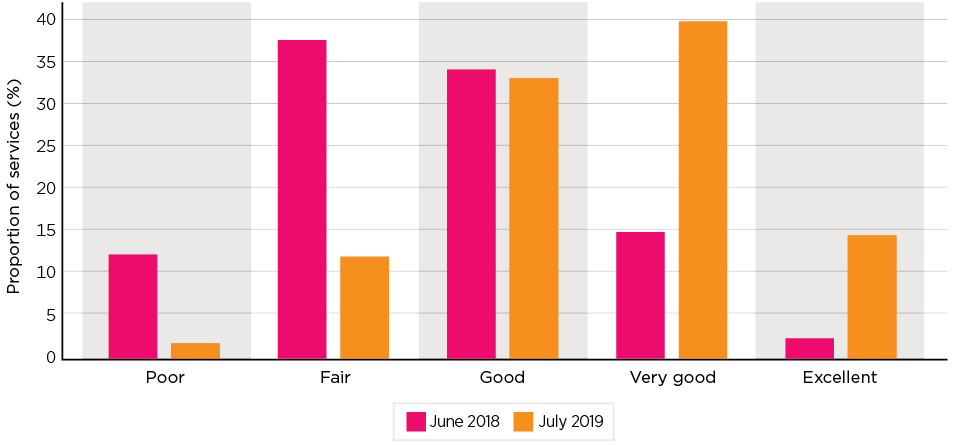
Source: Survey of Early Learning and Care Services, May/June 2018 and July 2019
This pattern of increase is seen across all sectors, see Figure 22, and is particularly marked in the Centre Based Day Care sector, where there was an average full category improvement in self-reported understanding. The lowest level of understanding, in both waves, was reported by Outside School Hours Care services.
Figure 22: Services' mean assessment of their understanding of the Child Care Package, by service type, SELCS, June 2018 and July 2019
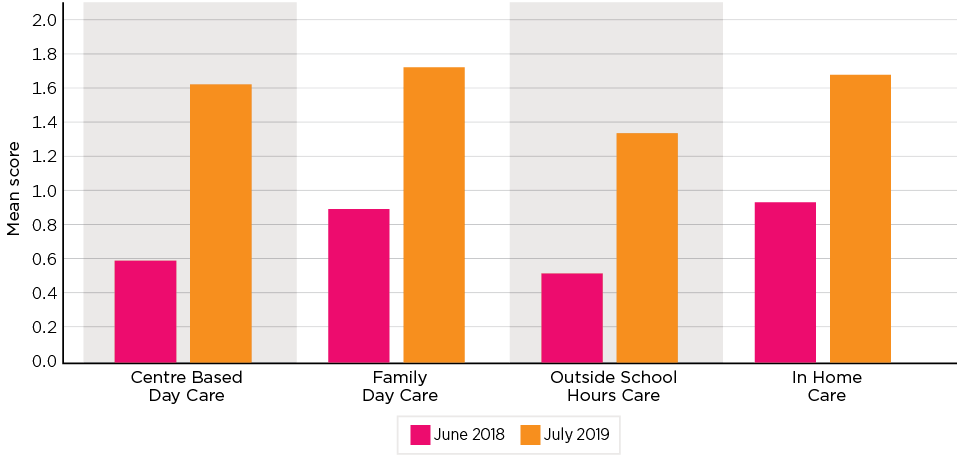
Notes: The chart shows the mean score on a 5-point scale centred on those who report a fair understanding. The weights attached were: 'Poor' -1; 'Fair' 0; 'Good' 1; 'Very Good' 2; 'Excellent' 3.
Source: Survey of Early Learning and Care Services, May/June 2018 and July 2019
Those reporting a poor understanding in July 2019 were asked which aspect or aspects of the Package they found difficult to understand. While only a limited number of observations were recorded, one recurrent theme concerned a lack of understanding about back-payments of subsidy and whether these would go to services or families. The Department provided more advice to services about this in 2019 but, given the curtailment of the data collections, it is not possible to determine whether this has been wholly addressed.
3.3.2 Services' perspectives on simplicity
In the SELCS, in addition to asking about their assessment of parents' understanding of the policy and of simplicity from a parent's perspective, services were asked if they thought the changes introduced in July 2018 had led to a simpler process for child care payments for services. Responses from services in July 2019, as illustrated in Figure 23, were disparate across services and within sectors. Across services, as a whole, 5.6 per cent strongly agreed that it had, with a further 31.2 per cent agreeing. The largest group, 32.6 per cent, neither agreed nor disagreed, while 19.3 per cent disagreed and 11.2 per cent disagreed strongly.
While Centre Based Day Care services showed the same pattern as the aggregate, as shown in the chart:
- Family Day Care Services, which had a similar proportion in the 2 categories of agreement to Centre Based Day Care, had a much higher proportion disagreeing, and disagreeing strongly, and fewer providing the neutral response.
- A similar, although less extreme, pattern was seen among Outside School Hours Care services.
- Responses in the In Home Care sector were more polarised. While this sector had the highest proportion of services strongly agreeing (8.3 per cent), it also had the highest proportion disagreeing (24.4 per cent) and strongly disagreeing (35.6 per cent).
Figure 23: Agreement with statement 'Changes to the child care system has led to simpler process for child care payments to services', SELCS, July 2019
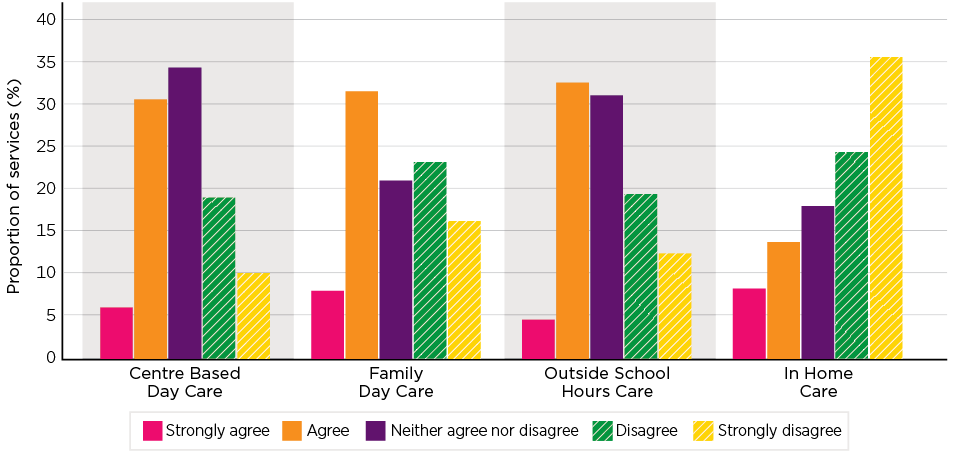
Source: Survey of Early Learning and Care Services, Wave 2 July 2019
Multivariate analysis, however, suggests the In Home Care service response reflects a range of other factors. While, overall, the model only had a limited fit (r2 = 0.074) and many of the parameters were non-significant, there was no statistically significant findings by type of service, and the magnitude of the coefficients for service type were generally small. There were limited state effects, with both Tasmanian and Australian Capital Territory services being more positive. Services with larger numbers of staff tended to be less positive, while those who simply relied on the Provider Entry Point52 were more positive. The strongest association was with services' perceptions of their financial viability, with those services who reported positive financial viability reporting more positively on the new arrangements as being simpler. However, it is not possible to determine the direction of causality in this relationship - or even if the 2 are directly related - or may be the result of another factor; for example, management capacity.53
The polarity of views about this was also apparent when discussing simplicity with services in interviews in mid-2019 and in the CALD case study in late 2019. There were diverse issues raised in these interviews, with many services focusing on the problems they had encountered, including in the transition, or were currently dealing with, rather than addressing the broader question of whether the Child Care Package was simpler and easier for services to understand and administer than the previous arrangements. A commonly raised and reported persistent issue was the workload associated with resolving issues and problems with the CCS. There was similarly a diverse set of perspectives recorded in the Evaluation Stakeholder Survey (August 2019), with comments again referring to the challenges in needing to put resources into helping families with their CCS applications and, in particular, in providing these supports to disadvantaged or vulnerable families.
Services were asked, in the SELCS in July 2019, to report on the impacts on their service of different aspects of the Child Care Package, see Figure 24. The most adverse responses were recorded with respect to the 8-week rule, which as noted in the introduction, has since been revised. This was followed by the application and confirmation process, and the activity test, with lesser, but still a balance of negative, impact being identified for enrolments, the hourly rate caps and income test. The only aspect of the Package that had on balance a positive response was the marginally above neutral response to the question on the impact of reporting attendance.
Figure 24: Aspects of the Package that have an impact on services, mean score, SELCS, July 2019
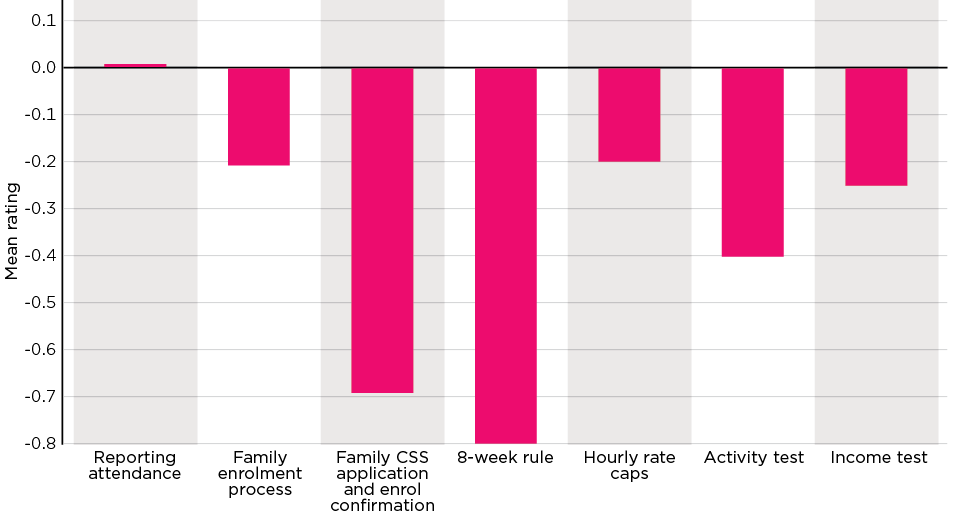
Notes: The chart shows the mean score on a 5-point scale centred on those who neither agree nor disagree. The weights attached were: 'Large, positive impact' +2; 'Small, positive impact' +1; 'No impact' 0; 'Small, negative impact' -1; 'Large, negative impact' -2.
Source: Survey of Early Learning and Care Services, Wave 2 July 2019
As noted, the question on 'families completing the CCS application and enrolment confirmation' had the second most negative response, with 24.6 per cent of services reporting this process had a large negative impact and 41.0 per cent reporting it had a small negative impact. Another 18.1 per cent reported it had no impact, 11.0 per cent a small positive impact and 5.2 per cent a large positive impact. The negative reports by services were related to their needing to support families through the application and enrolment process, and to support them in communicating with Centrelink. While not directly indicating whether or not these elements of the Package represent a move towards simplicity, they provide insight into which aspects involve additional work and more complex operations.
Operation of safety net programs
Services were also asked questions about the ease of undertaking a number of tasks related to the 2 safety net programs, Additional Child Care Subsidy (ACCS), and the Inclusion Support Program. Mean scores, with a positive score indicating the degree to which the task was seen as easy, are shown in Figure 25. In broad terms, while there were differences between the specifically identified elements, the table suggests that while ACCS was the easier for services to operationalise (although 2 out of 3 specific aspects were on average rated towards difficult, from a base of neither easy nor difficult), a much higher burden arose in the case of the Inclusion Support Program, particularly in the preparation of a Strategic Inclusion Plan.
Figure 25: Ease of process, aspects of safety net programs, mean score, SELCS, July 2019
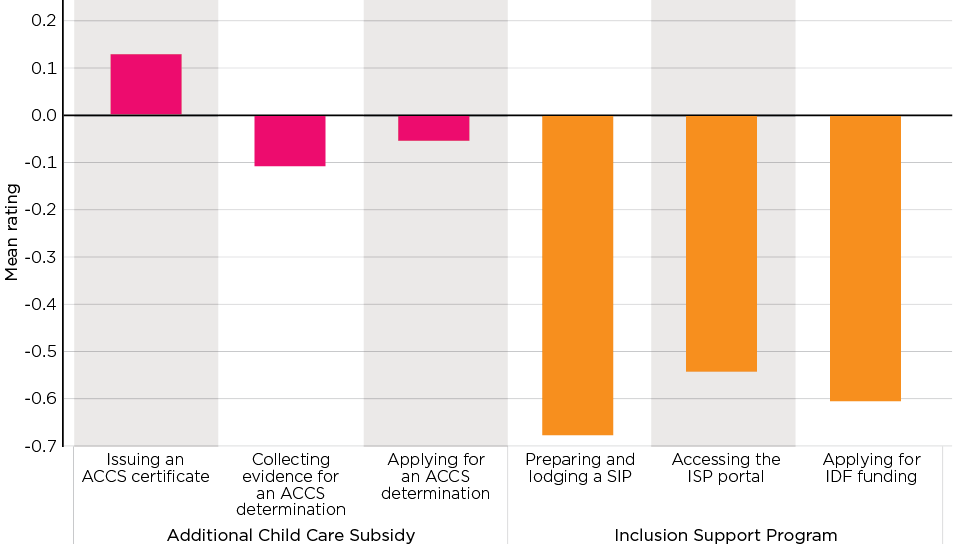
Notes: The chart shows the mean score on a 5-point scale centred on those who neither agree nor disagree. The weights attached were: 'Very easy' +2; 'Mostly easy' +1; 'Neither easy nor difficult' 0; 'Somewhat difficult' -1; 'Very difficult' -2.
Source: Survey of Early Learning and Care Services, Wave 2 July 2019
3.3.3 Issues arising out of the experiences of services
In the 2019 data collections, most services reported that the majority of families were managing to successfully navigate the CCS application process independently, and that families' understanding of the CCS had improved since the transition period. However, services echoed the previously raised concern that when a problem arose with a CCS application, or subsidy payments, it was often difficult to resolve, and that this frequently placed a burden on services. This kind of comment was typical:
If you really think, out of the 1,000 children that we have, we probably have issues with less than 50. … but the ones that we do have problems with can cause us weeks of problems.
[FDC provider, October 2019]
While it is not possible from the qualitative data to determine the magnitude of incidence of this type of problem, nor the extent to which it always reflects a lack of simplicity in the system, this section reports some of the issues that were reported to the evaluation.
Applications and Centrelink
Problems with Centrelink were a recurrent theme of many responses. Services reported long delays in Centrelink processing applications for CCS for a minority of their families. While services were not always sure of the cause of the delay, they cited examples such as processing errors by Centrelink, immunisation records not being up-to-date or supplied, and some issues with CRNs. Former BBF services reported a range of issues associated with families not having documentation such as birth certificates.54
A number of services argued that the requirement for families to apply for CCS through Centrelink had increased the complexity of child care assistance for families. They noted that it was difficult for families to contact Centrelink, particularly for families for whom English was not their first language, with services commenting on Centrelink using confusing terminology. Additionally, there were multiple reports of Centrelink providing incorrect or incomplete information for example not telling families about other payment types that they could be eligible for, such as ACCS temporary financial hardship, as well as some services reporting that they found advice and support from Centrelink was variable across different Centrelink staff. Again, while the specific issues raised by services in these discussions were not able to be followed through by the evaluation to ascertain the validity of criticisms of Centrelink, the extent of reporting of this type of issue suggests it does have substance.
According to interviewed services, some families were spending a long time waiting on the phone for support from Centrelink. Many services reported that families made a number of visits to Centrelink to resolve issues and that they needed to prepare families to visit Centrelink by providing them with screenshots and print-outs of Child Care Package policy.
A further issue raised by some services related to ACCS (Child Wellbeing). Whereas under the previous arrangements, child care services could contact the department responsible for Special Child Care Benefit claims, with the Child Care Package ACCS (Child Wellbeing) claims are processed by Centrelink and services reported that they had been advised that Centrelink cannot discuss these claims with them.
Enrolments
Another recurrent issue raised was that of the enrolment process. For parents, there are 2 main steps to their enrolment in child care following registration for CCS through myGov. The first is agreeing to a Complying Written Agreement (CWA) with the service. The second is confirming the enrolment. This step involves logging into myGov, reviewing and confirming the child's details, and accepting the declaration. Many services reported a lack of understanding by families of the need to do this second step, and the workload in having to follow up with families:
You've got to constantly chase those CWAs. All the time.
[CBDC provider, March 2019]
And the other big issue with all this too, is they'll say, the parent hasn't confirmed … A lot of these people do speak English quite well, but they don't understand these systems. And go on the computer, forget it. They've got to find the daughter, or a son or like, you know, [name] here can help them. They don't know how to manipulate that, go on myGov and confirm it. They can't do that. They can't even understand what I'm saying to them.
[CBDC provider, June 2019]
A number of services reported it was difficult to support families to use myGov because they did not receive any information about myGov and did not know what families needed to do. A further issue, which is more fully addressed in later chapters, concerned the fact that services are advised to charge full fees until CCS eligibility is determined.
Other issues
Services reported that when problems arose in families' enrolment or CCS payment, they could not always locate the source of errors or the problem (although some cited what they saw as IT system 'glitches' and Centrelink errors) and found it difficult to resolve issues. A pattern of cyclical help-seeking by families and services was reported in a little over half of the interviews with services in 2019. These services reported spending substantial amounts of time contacting third party software providers, the CCS helpdesk55 and sending families to Centrelink, but then having families referred back to the service, without issues being resolved.
Service directors who participated in the case studies noted that this frustration is exacerbated by services being prevented from directly liaising with Centrelink on specific queries about the subsidy arrangements of families, and this has contributed to delays in resolving issues:
We thought it would be a little bit more streamlined. We would be able to ring up and have a lot more access to parent's data […] Hopefully that might change down the track. We are approved providers. We've done our police checks to get access to query data. So, I do not know why we can't just find out that bit of extra information.
[CBDC provider, April 2020]
The other issues raised were predominantly payment-related, with services citing issues such as an incorrect overpayment of CCS, session reports that would not submit, or backdated readjustments to CCS payments that required a service to manually find the period which had been adjusted. The following quote provides an illustration of how one Family Day Care provider described the impact of the Child Care Package on their work. This experience was typical of comments provided by a number of services about the impact of the Child Care Package in relation to their services' administration and workload.
So, each of these issues is taking really complex problem solving and a huge amount of investment in terms of time to work through each of these issues to get outcomes for families. And our resourcing is the same now as it was when the changes came in on July 1. And we're struggling to keep up with the demands, and every time the team feel that they are getting on top of some of these issues or they're getting a better understanding of how this is working, another issue comes out left field. And to be honest with you, there's a word that we use in here, at our team meetings that I'm going to share with you, and that is that it's `relentless'.
[FDC provider, April 2019]
Service information sources and help-seeking
For services' access to support on their own issues, there were mixed reports from interviewees about the utility of the CCS helpdesk. Some interviewees reported avoiding the helpdesk, finding it too slow. Others found that issues were resolved, but that it took a long time and many exchanges. These perspectives can be seen in interview responses:
I very rarely ring them because it's too long and too drawn out. I just go through my software provider. And try and get the answers from there.
[OSHC provider, March 2019]
Software providers, as cited in this quote, were frequently mentioned by services as a source of information and support. This included for basic information about the Child Care Package as well as resolving issues such as changes to enrolments or payments. For some services interviewed in 2019, the software provider was reported as their first point of contact to resolve issues or queries.
3.3.4 Summary simplicity and services
As with parents, there were mixed views by services as to the impact of the Package on simplicity with no strong consensus. Indeed, it was split into 3 almost equal groups - with just over a third saying it had made things simpler, a third that it had made no difference and just under a third disagreeing. Services on average reported a negative impact from a range of specific aspects of the policy. This included the 8-week rule, which has now been addressed, and the enrolment process - especially around confirmation. While the operation of the ACCS generally does not appear to be overly burdensome, a more negative assessment was given to aspects of the Inclusion Support Program.
A core theme was that while problems tended to be the exception, rather than the rule, when they did occur, they were difficult and slow to resolve, and support for resolution from both the Child Care Subsidy Helpdesk and Centrelink was often slow or lacking.
3.4 Summary
On balance, the data suggests that the Child Care Package can be seen as being a little simpler than the former arrangements. However, the perspectives of both services and parents, while on balance pointing to this, show a diverse experience, with the system becoming simpler for some, but more complex for others. This would appear to be a persistent finding over time, notwithstanding the extent to which both parents and services have become more confident and knowledgeable about the system, especially the operation of the Child Care Subsidy.
Some of the factors that appear to be particular blockages to system simplicity include:
- the initial enrolment process, and specifically:
- the 2-stage application process; in particular, the confirmation step
- initial assessment of the amount of subsidy families are entitled to and the subsequent issues with the policy that services should charge full fees over this period
- problems for people who have irregular or unstable employment and/or earnings with regard to both the activity and income test
- Parents, while reporting some improvement in being able to understand subsidy information, still report negatively on this, and do not report any increased ease of access to this information.
- One specific issue is that of the Centrelink calculator and the ease with which parents can explore how their activities impact the support available to them through the subsidy.
- poor problem resolution; in particular, the time taken to resolve issues. Specifically, across the range of service reporting there was a view that while most interactions were unproblematic, when problems did arise, these were frequently very difficult to resolve. Issues identified by them related to:
- the Helpdesk - which was generally reported to be slow
- Centrelink, with problems relating to attempting to make contact, inconsistent advice (often with a lack of understanding of child care related programs). Centrelink was also poorly reported on by parents.
While the replacement of the 8-week rule addressed one of the major concerns, these other issues persist.
42 In general most of the differences between the subgroups were just some one tenth or one fifth of a response category.
43 A response category is the equivalent from moving from one response to another - for example, from strong disagreement to disagreement, or from neither agreeing or disagreeing to agreeing. Obviously, a movement of a whole response category can be considered to be a marked shift, whereas fractional movements might be considered as a more gentle movement.
44 While there was an analogous question in the June 2018 survey relating to the operation of the former subsidies, the language of this question was considered to be significantly different to preclude any comparison. The mean score for this item in June 2018 was -0.28.
45 An 'activity debt' may occur when parents back-date their activity details, and the altered activity details mean they have been overpaid CCS for a period of time. The 'activity debt' is not apparent to parents immediately, but will be detected as part of the end of year reconciliation process.
46 Services are required as part of the new arrangements to provide parents with a fortnightly 'Statement of Entitlement' that includes information of the child, the service, sessions of care provided and attended including actual in and out times, fees, including the hourly session fee, and details of subsidy amounts and the number of hours for which fees are reduced.
47 The activity test, for example, is explained in 3,700 words in the Family Assistance Guide. (Australian Government, 2020a).
48 Although, at a time when costs for child care and other services are often paid through direct debit, being unaware of child care costs may also reflect such an arrangement, which parents 'set and forget'.
49 The CCPFamS November 2018 sample is a subset of those responding to the May 2018 DESE/ORIMA survey. These calculations are based on the 456 parents who answered this question in the DESE/ORIMA survey as well as the CCPFamS.
50 At the time of transition and for most of the data collections, Services Australia was the Department of Human Services. DESE was the Department of Education and Training.
51 In Wave 2, 114 out of 563 respondents provided a comment in response to this question.
52 Services can interface with the CCS system either through third party software (which usually incorporates a wider range of child care service management tools), or where they choose not to use such a package directly through the Provider Entry Point, see also discussion in Section 10.4.1.
53 It should also be noted that the largest coefficient difference was 0.56, that is just over half a step between these categories, indicating that this factor alone is not responsible for the large differences between service responses.
54 The issue of delays in Centrelink processing applications for CCS could result in families incurring debts to services. This issue is considered in Section 9.5.3.
55 The Child Care Subsidy Helpdesk is operated by the Department as a support centre for services and providers, in particular with regard to the operation of the CCS. A separate support team operates to provide support with regard to ACCS.
4. Child care costs, subsidies and affordability
A key objective of the Child Care Package was to improve affordability, especially for 'low- and middle-income families' and address increasing costs. This Chapter reports on the extent to which these outcomes and impacts have been achieved. This addresses the evaluation outcome that 'Child care is affordable to families especially those with limited means'.
This Chapter considers:
- some of the conceptual issues related to defining affordability and the approaches adopted by the evaluation
- an overview of the elements of the Child Care Subsidy (CCS) system, as well as the previous funding arrangements, that directly impact affordability and the extent to which different segments of the child care user population are impacted by each of the key changes
- the number of families affected by the replacement of the special child care payments (Grandparent and Special Child Care Benefit and JETCCFA) with the Additional Child Care Subsidy (ACCS)
- analysis of trends in child care fees over time, and more specifically following the introduction of the Package
- parental perceptions of affordability and changes in affordability
- microsimulation modelling of the first round direct effects of the impact of the Package on affordability overall, and for different groups of users. This is the key focus of the evaluation of the impact of the Child Care Package on affordability.
- analysis of the extent to which child care users are incurring debts to the government as a result of the annual income reconciliation process.
In addressing these questions in the evaluation, it is noted that the time frame of the evaluation is limited to the first 18 months of operation of the Child Care Package which means that the longer run impact of the Package on child care fees and affordability is not considered in this evaluation.
As noted above, the primary focus of the analysis of the impact of the Child Care Package on affordability is a static microsimulation of the comparative affordability outcomes of the Child Care Package relative to the former funding arrangements. As a consequence, affordability is largely considered from the relative perspective of whether child care under the new CCS is more affordable than it was under the former Child Care Benefit/Child Care Rebate System. Static in this context means that the analysis focuses on the outcomes of these 2 systems on the same structure of child care usage and same child care fees. It does not take any account of the extent to which patterns of use of child care may have changed as a result of the introduction of the Package, nor the impact of fee changes (which may or may not be attributable to the introduction of the Package).
4.1 Defining and measuring affordability
The concept of affordability of child care is open to many different interpretations. Economic theory assumes that a family purchases a bundle of goods and services and takes decisions on the trade-off they make between work and 'leisure' in ways that maximise wellbeing (utility) subject to the financial resources available and preferences. Differences in preferences result in different expenditure choices and thus what is an affordable price is a normative question that will vary between families with the same financial resources. Stated differently, affordability depends in part upon the trade-offs that families are prepared to make between different consumption bundles. For discussions of the definition of affordability see Maclennan and Williams (1990) and Niëns et al. (2012).
These sorts of issues can be seen in the decisions people make. Some will consider affordability in terms of the net gain they will obtain from working and purchasing child care to enable this. Others will place this in a longer-term perspective and see the cost of care as an investment. This could be an investment in their own future earnings through minimising time out of the paid workforce while caring for young children to maintain or further develop their human capital, through education or maintaining career progression. In these cases, they will view the cost relative to these future returns. Others may see it more through a lens of investment in their children's development - and will weigh up the cost relative to other investments they can make, including the trade-offs of their own time. Linked with this type of consideration are questions about the quality of care. That is, it is not just the actual cost that is important, but rather the value of the service that is being purchased. This consideration is not just one that is taken in deciding between different types of formal child care, or between what is being offered by specific child care services,56 but also whether to use formal care, or unpaid or other informal care arrangements.
4.1.1 Evaluation approaches
In this evaluation we are taking 2 approaches to measuring affordability and change in affordability. The first approach is on the conventional measure of the net child care costs incurred by families (out-of-pocket costs) relative to income. The conceptual basis is that the lower the child care costs incurred by families relative to their income, the more affordable child care is. This approach uses the results of modelling of entitlement to child care subsidies under the previous CCB/CCR system and the new CCS system. The second approach draws on parents' assessments and perceptions of: (i) whether they consider child care to be affordable; and (ii) the extent to which they consider child care costs have been impacted by the amount of child care they are using. These self-report measures, while lacking the apparent 'objectivity' of costs relative to income measure, can be seen as better capturing the full range of factors that go into determining whether families consider child care is affordable. In all of the analysis the focus is on the extent to which the affordability of child care has changed since the introduction of the CCS Package in July 2018.
4.1.2 Modelling - Child care costs relative to income affordability
Two ways of modelling the impact of the CCS Package on affordability have been undertaken. These differ in the data sources used and how child care cost relative to income is calculated. The main modelling has been undertaken using administrative data from the CCS system. This is a rich dataset from a child care operational perspective which permits a very detailed review of the impact of the subsidy arrangements on families, but is limited in that the only measure of income is that of the parent, and, if they have one, their partner's, taxable income (i.e. gross or before-tax income). From an affordability perspective this is a limitation because affordability needs to be considered in terms of the actual resources available and the measure of gross income that is available from the administrative data ignores the amount of income tax they have to pay, and also does not account for the number of people in the household who this income needs to support. A consequence of this is that comparisons between households who may be spending similar proportions of gross income on child care may be misleading.
This modelling using the administrative data from the CCS system has therefore been supplemented by modelling based on the Australian Bureau of Statistics (ABS) Survey of Income and Housing. While the modelling based on the Survey of Income and Housing does not permit the same degree of precision in estimating the actual costs and subsidies for child care as the modelling based on the administrative data, it does permit the change in costs to be considered on the basis of the household's after-tax (disposable) incomes, and on the basis of equivalised income that takes into account the different needs of households with different compositions.
As has been noted above, this modelling is primarily focused on relative affordability - addressing the question of how the affordability of child care for families changed with the introduction of the new Package.
4.1.3 Self-reported affordability of child care
Data on parents' assessments of the affordability of child care is drawn from the 4 waves of DESE/ORIMA family surveys, the first of which was collected in June 2018 just prior to the introduction of the Child Care Package. Data on self-reported affordability of child care considers both the perspectives of those parents who are currently using child care and parents not using child care. For parents using child care, the data covers parents' assessment of affordability per se, collected before and after the changes to the child care system, assessment of the financial impact of the Child Care Package and whether child care is value for money. For parents not using child care, the data covers their assessment of the extent to which affordability is a barrier.
4.2 The structure of the Child Care Package and affordability
This section describes the structure of the child care subsidy arrangements under the Child Care Package and the former funding arrangements that directly impact affordability, and examines the extent to which the key structural elements of the CCS impact families using child care.
4.2.1 Elements of the CCS
Key elements
The key aspects of the Child Care Package introduced in July 2018 are described in Chapter 1. Under the Child Care Package and the new CCS there are 4 components which determine the rate of CCS and, hence, the amount of child care payment to which families are entitled. These are:
- hourly rate caps, which limit the hourly fee charged by child care providers that will be subject to the subsidy57
- the percentage rate of CCS families are eligible for, which applies to the capped hourly fee. The subsidy rate commences at a rate of 85 per cent of the fees paid, up to the hourly rate cap, and then is tapered, in stages, as family income increases, becoming zero for families with income at or above an annual income of $351,248 (2018-19 level).58 One feature of this rate structure was that of ensuring that parents made a co-payment towards the cost of child care59
- the annual cap, which is the maximum amount of CCS that will be paid to a family in any one financial year. In 2018-19 it was $10,190 per child per annum. The annual cap only applies to families with an annual income over $186,958 (2018-19 level)
- approved hours as determined under the activity test. Families are subject to an activity test that limits the maximum number of hours of CCS a family is entitled to on a per child per fortnight basis, with the number of hours determined by the level of activity parents are undertaking. For couples, the activity test is based on the hours of activity of the member of the couple with the fewest activity hours. There are exemptions to the activity requirements in certain circumstances. Details of the maximum hours of subsidy per child under the activity test and exemptions are provided in Chapter 1, Table 1.
The type of care being used also has an impact on the amount of CCS that can be received because there are some differences in the hourly rate caps between children below school age and school-aged children, and between Centre Based Day Care and Outside School Hours Care and Family Day Care. For In Home Care the hourly rate cap operates on a per family basis.
Safety net support
While the CCS is the main form of government financial support for the costs of child care to families, families and children who may face barriers in accessing affordable child care may be eligible for the Additional Child Care Subsidy (ACCS). The ACCS is paid to services as an offset to the charge to parents. To be eligible to receive ACCS, a carer must be eligible for CCS and meet one of the following criteria: an eligible grandparent getting an income support payment (ACCS (Grandparent)); transitioning from certain income support payments to work (ACCS (Transition to Work)); experiencing temporary financial hardship (ACCS (Temporary Financial Hardship)); or caring for a child who is vulnerable or at risk of harm, abuse or neglect (ACCS (Child Wellbeing)). The amount of ACCS received depends on the type the family is eligible for. Irrespective of the type of ACCS being received, subject to the specific conditions of the support, there is no annual cap on the amount of ACCS received. ACCS payments are not subject to a withholding amount and the ACCS payments are not balanced at the end of the financial year. The amounts of ACCS that can be received are:
- Under the Grandparent, Temporary Financial Hardship and Child Wellbeing elements the amount is the lower of: 100 per cent of the fee charged where it is equal to or below the hourly rate cap; or up to 120 per cent of the hourly rate cap where the fee charged is above the hourly rate cap.
- While there is no time limit on how long a person can receive ACCS (Grandparent), ACCS (Temporary Financial Hardship) is paid for up to 13 weeks, and ACCS (Child Wellbeing) is initially available for 6 weeks on the basis of a service's certification and, after this, for a renewable 13-week period on the basis of determination by the Department of Human Services.
- The ACCS rate for the Transition to Work component is the lower of: 95 per cent of the fee charged where it is equal to or below the hourly rate cap; up to 95 per cent of the hourly rate cap, where the fee charged is above the hourly rate cap. The length of time that this subsidy can be received is complicated and depends on whether the person is studying, looking for a job, working or training.
Differences between the old and new subsidy system
The primary focus of the analysis of affordability, as noted above, is on the impact of the Child Care Package relative to the previous funding arrangements. The main differences that will impact the amount of child care payment and hence affordability between the CCS and the previous Child Care Benefit (CCB) and Child Care Rebate (CCR) payments which it replaced are:
- Under the previous system, CCB was a means tested benefit that provided a subsidy for up to 50-hours of child care per child per week. This was complemented by the CCR, which was non-means tested and provided up to 50 per cent of a family's out-of-pocket child care expenses (after CCB was deducted) to a maximum of $7,613 per child per year. The means testing of the full child care payment under the new system make the CCS more targeted than CCB and CCR.
- Under the old CCB and CCR system there was an activity test that had 2 levels. First, a universal 24 hours of care per week (48 hours per fortnight) per child. Second, up to 50 hours per week (100 hours per fortnight) per child for those with more than 24 hours of activity per week.60 There was only limited review and testing of claimed activity. The more graduated activity test and number of hours to which the subsidy applies under the CCS means that under the new system there is greater potential for families to need more hours of child care than they are subsidised for and hence to have a proportion of the hours they pay for unsubsidised.
- While there is an hourly rate cap under the new CCS system, there was also an implicit hourly rate cap that operated via the maximum subsidy rate of CCB and the fact that CCR only applied to 50 per cent of the net (post CCB) fee.
The relative size of the subsidies under the CCB/CCR system compared to the CCS system depends on a range of factors including income, number of children using care, level of activity, number of hours of care used and the hourly fee paid for services.
Under the old child care system, additional support for some families was available through Jobs, Education and Training Child Care Fee Assistance (JETCCFA), Grandparent Child Care Benefit (GCCB) and Special Child Care Benefit (SCCB). The JETCCFA provided financial assistance to eligible parents who qualified for the maximum rate of CCB and it paid for most of the gap in out-of-pocket costs while a parent was working, studying or training. SCCB was available for families experiencing financial hardship or for children at risk. Grandparents who were primary carers of a child may have been eligible for GCCB. SCCB and GCCB could be up to the full costs of child care and were not subject to an activity test.
4.2.2 Hourly fee rate cap
As outlined in Chapter 1 and in Section 4.2.1, the Child Care Package introduced an hourly rate cap, which is a limit on the hourly fee charged by child care providers that will be subject to subsidy. This will have an effect on affordability as one of the consequences of this cap is that parents need to fully pay for any cost of child care above the hourly fee rate cap.
The hourly fee rate cap is seen as having an important role to play in seeking to contain increases in the cost of child care. As discussed in Section 4.3 and further explored in Chapter 5, the concept of hourly fees in child care services is not straightforward. This is because most children are provided care on a sessional basis, rather than on an hourly basis. In turn, sessions are variously structured to meet several disparate objectives. First, they provide a structure for the operation of a child care service, allowing services to plan to offer a certain number of child care places for specific sessions and to organise staffing schedules around these. Second, they provide flexibility for parents around start and finishing times, with longer sessions allowing for this. Third, there are interactions, considered further below, between session structure and lengths and the operation of allowed hours under the activity test.
While most services do adopt a sessional structure, some instead charge by the hours of actual use (see Chapter 5). Additionally, when services offer multiple sessions, the hourly fee they charge parents can vary significantly across sessions, especially where shorter sessions have been introduced as a means of avoiding the strictures of the activity test.
In this context, while the child care hourly rate plays a very important role in the determination of the actual rate of subsidy paid to parents, it is also very much a notional concept, being based on dividing the sessional fee charged to parents by the nominal length of the session. Because of the nature of the administrative data provided by the Department, in this report, estimates of the hourly fee are based on total weekly fees paid and total weekly sessions (hours charged for). While this may slightly underestimate the proportion of fees that are in excess of the hourly cap, the impact of this is considered to be relatively small.61
The focus in this section is on the impact of the hourly fee rate cap on the subsidy paid to parents. First, the extent to which children have any care charged at a rate higher than the cap, and the proportion of hours paid for that are being charged at a rate higher than the cap, is considered. Second, the extent to which services are charging any families above the cap is documented. Average service level fees in comparison to the hourly rate cap are presented in Section 4.3.1.62
The hourly fee rate cap varies according to the age of the child and the type of care. As of 1 July 2019, the hourly fee rate cap was $11.98 per hour for children below school age and $10.48 per hour for school-aged children in Centre Based Day Care and for Outside School Hours Care, and $11.10 per hour for children below school age in Family Day Care and $10.29 for those of school age. For In Home Care the cap is on a per family basis and is $32.58 per hour. The former CCB had an implied hourly fee rate cap with a maximum rate payable of $4.30 per hour for a non-school-aged child and the rate for school-aged children was 85 per cent of the non-school child rate. The cap rates over the financial year 2018-19 are detailed in Table 17.
| Service type: | July 2018-December 2018 | January 2019-June 2019 | July 2019-June 2020 | |||
|---|---|---|---|---|---|---|
| Below school age | School-aged a | Below school age | School-aged | Below school age | School-aged | |
| ($ per hour) | ||||||
| Centre Based Day Care | 11.77 | 10.29 | 11.77 | 10.29 | 11.98 | 10.48 |
| Family Day Care | 10.90 | 10.90 | 11.10 | |||
| Outside School Hours Care | 11.77 | 10.29 | 11.77 | 10.29 | 11.98 | 10.48 |
| In Home Care (per family) | 25.48 | 32.00 | 32.58 | |||
Notes: a A child is considered to be 'school-aged' if they are in school, including being home schooled, or 6 years or older. Hourly rate caps for all services were increased in July 2019, in line with indexation.
Source: Department of Education, Skills and Employment
Figure 26 shows the proportion of child hours per week being charged over the hourly fee rate cap by service type since July 2018. This data shows a number of distinct patterns by service type:
- While In Home Care only accounts for a small proportion of child hours of care, because a much higher proportion of In Home Care hours are charged over the hourly rate cap, it dominates the chart.64 Over time, 2 key features can be seen in relation to In Home Care. The first is the very high proportion of hours charged above the fee cap prior to the 25.6 per cent increase in the cap in January 2019. The second is the trend to an increasing proportion of hourly rates being above the cap since this initial fall in January 2019.
- Centre Based Day Care services showed an increasing proportion of child hours being charged above the cap across 2018-19, before a fall with the indexation of the cap in January 2019 and a slight increase since then. Nevertheless, in the second half of 2019, 15 per cent or more of child hours of care were charged above the cap, compared with some 11 to 13 per cent in the same period in 2018.
- Family Day Care services were more likely to charge above the cap than were the Centre Based Day Care sector, with some 19 to 25 per cent of hours being charged above the cap over the period (excluding the late December and early January period). Again, this sector shows a fall in the proportion of hours of care being charged above the cap with the indexation of the cap. While this initially brought the rate of charging above the cap down in July 2019 below that of a year earlier, there has since been an upwards drift in the proportion.
- The pattern of charging above the cap in Outside School Hours Care is dominated by the differences between this care being provided over the school term and during vacation times. This sector has the lowest rate of charging above the cap.
Figure 26: Proportion of child hours per week charged over the hourly rate cap, by service type, July 2018 to December 2019
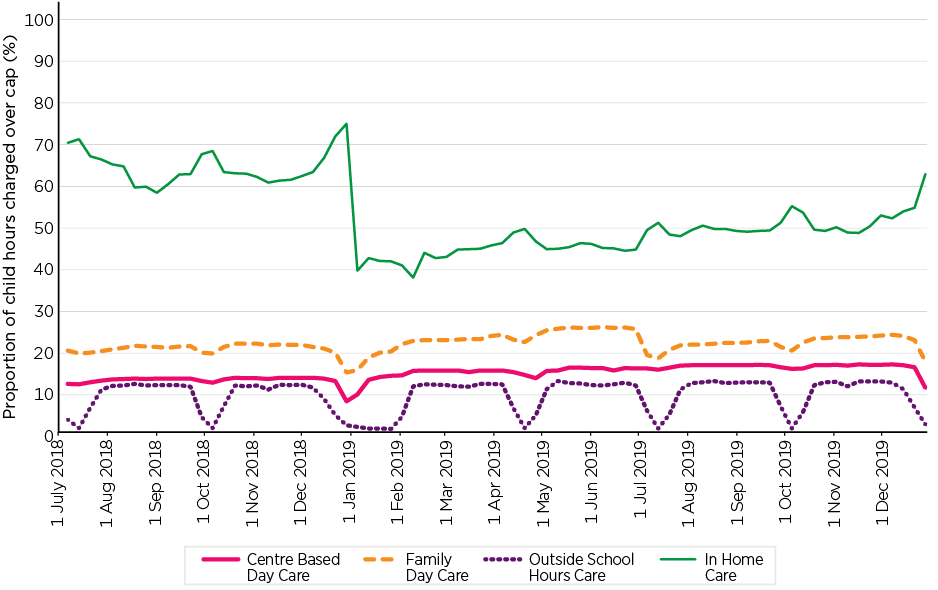
Notes: Data shown from 8 July 2018 onward as data for 1 July 2018 was affected by transition issues. For In Home Care the hourly rate is reported at the family level and all children within the family using the In Home Care are assigned the same hourly fee. Where rates vary for school-aged children, as per next footnote all children aged 6 years and over are treated as being of school age.64 Weighted by number of hours each child uses the service for.
Source: DESE administrative data
From an affordability perspective the most important issue is the amount by which fees exceed the hourly rate cap. Table 18 presents information, for Q4 2019, on how much above the hourly fee rate cap, the hourly fee is for child hours that are charged at a rate above the cap. The 'excess' charge is presented as a proportion of the hourly fee rate cap. For Centre Based Day Care, Family Day Care and Outside School Hours Care one-quarter of the above cap child hours of care (i.e. the 25th percentile) are charged only marginally higher than the cap (2.6 per cent to 4.0 per cent). For In Home Care, a quarter of the above cap child hours of care (i.e. the 25th percentile) are charged at 10.5 per cent above the hourly fee rate cap. However, at the upper end of the distribution (90th percentile), 10 per cent of child hours are charged at rates ranging from 23.3 per cent above the cap in Centre Based Day Care to 31.2 per cent in In Home Care.
| Service type: | At: | Average | |||
|---|---|---|---|---|---|
| 25th percentile | 50th percentile | 75th percentile | 90th percentile | ||
| 'Excess' as proportion of cap (%) | |||||
| Centre Based Day Care | 2.6 | 6.8 | 14.1 | 23.3 | 10.3 |
| Family Day Care | 3.0 | 8.1 | 16.2 | 26.4 | 11.3 |
| Outside School Hours Care | 4.0 | 9.4 | 18.1 | 29.8 | 13.3 |
| In Home Care | 10.5 | 16.6 | 21.3 | 31.2 | 17.4 |
Notes: For In Home Care the hourly rate is reported at the family level and all children within the family using the In Home Care are assigned the same hourly fee. Where rates vary for school-aged children, all children aged 6 years and over are treated as being of school age.
Source: DESE administrative data
Figure 27 shows the proportion of services that charged at least one child an hourly fee that is greater than the hourly fee rate cap for each week. Over three-quarters of Family Day Care services are charging at least one child above the hourly fee, and the proportion of Centre Based Day Care services charging at least one child over the hourly rate cap increases from around 40 per cent in early July 2018 to nearly 60 per cent by December 2019.
Figure 27: Proportion of services charging any child over the hourly fee rate cap, by week, July 2018 to December 2019
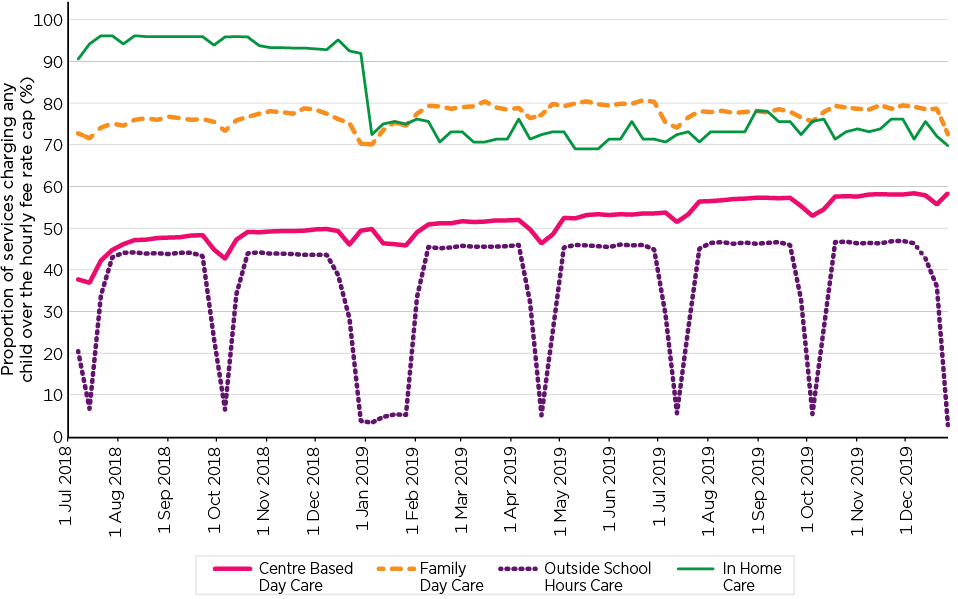
Notes: Data shown from 8 July 2018 on, as data for 1 July 2018 was affected by transition issues. For In Home Care the hourly rate is reported at the family level and all children within the family using the In Home Care are assigned the same hourly fee. Where rates vary for school-aged children, all children aged 6 years and over are treated as being of school age.
Source: DESE administrative data
In order to better understand the extent to which this charging above the cap is an occasional occurrence Figure 28 shows the proportion of hours in the quarter being charged over the cap (at the child level) by the cumulative proportion of children being charged below this proportion of hours above the cap. The data is for Q4 2019. This figure shows that, when any time is charged over the hourly cap, in the majority of cases a substantial proportion of hours used by the child are charged above the hourly fee rate cap. For example, of those being charged at least one hour above the cap, just 0.2 per cent of all children have 5 per cent or less of their hours charged above the cap, 4.3 per cent have 10 per cent or less of their hours charged above the cap and 76.2 per cent have three-quarters or more of their hours charged above the cap.
Figure 28: Proportion of hours of care used per child charged over the hourly fee rate cap, by cumulative proportion of children, Q4 2019
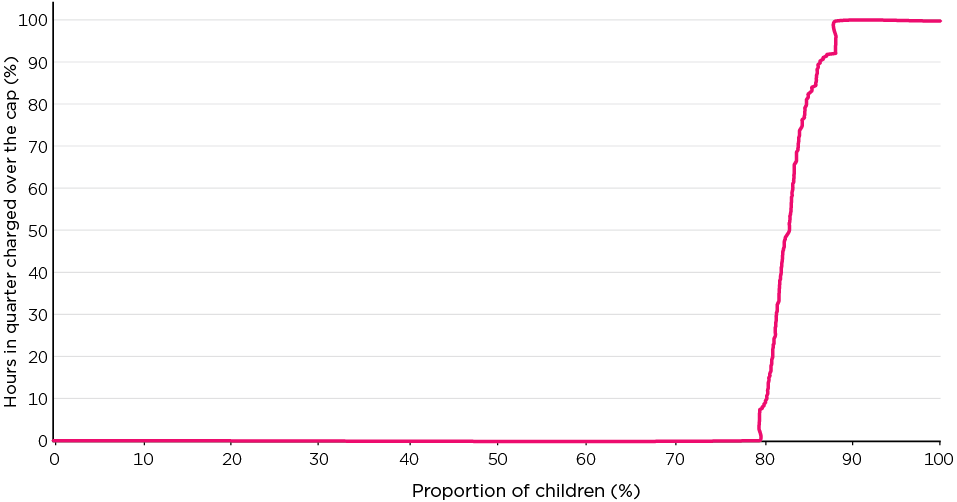
Source: DESE administrative data
Table 19 provides information on the proportion of hours of care charged by services that have an hourly fee that is above the hourly fee rate cap for the service, and how this varies according to whether the service is a for-profit/not-for-profit type of service and the geographic remoteness of the service. The geographic remoteness measured, first described in Chapter 2,65 is a population/remoteness measure that categorises areas according to whether they are a capital city, if not a capital city the population size, and then for small population areas whether the area is categorised as being an inner regional, outer regional, remote or very remote area.
For Centre Based Day Care, 41.0 per cent of services charge no hours at all above the cap, 27.5 per cent charge 1-10 per cent of hours above the cap, 12.5 per cent of services charge 11-25 per cent of hours above the cap, 5.2 per cent charge 26-50 per cent of hours above the cap, 2.1 per cent charge 51-75 per cent of hours above the cap, 7.6 per cent charge 76-99 per cent of hours above the cap and just 4.3 per cent charge 100 per cent of hours above the cap. A smaller proportion of Family Day Care services charge no hours above the cap (21.0 per cent), with 20.1 percent, 19.1 per cent and 19.3 percent charged 1-10 per cent, 11-25 per cent and 26-50 per cent of hours, respectively, above the cap. For Outside School Hours Care, 52.2 per cent of services charge no hours above the fee cap, and 15.5 per cent charge 1-10 per cent of hours above the cap.
Not-for-profit services are more likely to charge no hours above the hourly fee rate cap than are for-profit services (54.1 per cent compared to 38.2 per cent). There are some differences by geographic remoteness with very remote services substantially more likely to not charge any hours above the fee cap (62.5 per cent) than services in other areas. Services in major cities are the most likely to charge at least some hours above the hourly fee rate cap.
| Proportion of hours charged above cap | |||||||
|---|---|---|---|---|---|---|---|
| 0% | 1-10% | 11-25% | 26-50% | 51-75% | 76-99% | 100% | |
| Distribution of proportion of above cap charging (%) | |||||||
| Whether for-profit or not-for-profit | |||||||
| For-profit | 38.2 | 24.0 | 12.3 | 6.5 | 4.3 | 10.5 | 4.3 |
| Not-for-profit | 54.1 | 21.6 | 8.9 | 4.6 | 2.8 | 5.1 | 2.9 |
| Type of service | |||||||
| CBDC | 41.0 | 27.5 | 12.5 | 5.2 | 2.1 | 7.6 | 4.2 |
| FDC | 21.0 | 20.1 | 19.1 | 19.3 | 10.8 | 6.3 | 3.5 |
| OSHC | 52.2 | 15.5 | 7.6 | 5.5 | 5.9 | 10.2 | 3.1 |
| IHC | 18.6 | 16.3 | 2.3 | 9.3 | 11.6 | 27.9 | 14.0 |
| Urban and regional location | |||||||
| Capital Cities | 40.9 | 21.4 | 11.0 | 6.4 | 4.4 | 11.0 | 4.9 |
| Urban 100k plus | 51.2 | 30.3 | 10.0 | 3.6 | 1.5 | 2.3 | 1.3 |
| Urban 50k-<100k | 42.0 | 27.1 | 15.2 | 4.1 | 3.2 | 6.0 | 2.4 |
| Urban 20k-<50k | 46.9 | 26.0 | 13.4 | 7.2 | 2.1 | 3.5 | 0.9 |
| Urban 10k-<20k | 45.7 | 22.7 | 16.6 | 5.4 | 3.6 | 5.0 | 1.1 |
| Inner Regional | 54.8 | 24.7 | 8.7 | 3.7 | 2.1 | 3.8 | 2.1 |
| Outer Regional | 59.0 | 22.1 | 8.8 | 4.5 | 3.4 | 1.6 | 0.7 |
| Remote | 47.8 | 23.9 | 7.5 | 7.5 | 3.0 | 9.0 | 1.5 |
| Very Remote | 62.5 | 19.6 | 7.1 | 1.8 | 2.7 | 5.4 | 0.9 |
| All services | 44.1 | 23.1 | 11.0 | 5.8 | 3.7 | 8.5 | 3.8 |
Notes: Excludes a small number of services whose for-profit/not-for-profit status is 'other'.
Source: DESE administrative data
Characteristics of families being charged over the hourly fee rate cap
This section considers how the characteristics of families vary according to the extent to which the number of hours of care they pay for are charged in excess of the hourly fee rate cap. The analysis is based on child care used during Q4 2019. Hours are categorised according to whether they had no hours charged in excess of the hourly cap for the quarter, greater than 0 per cent and less than 50 per cent of hours charged in excess of the cap, 50 per cent to less than 90 per cent of hours charged in excess of the cap and 90 per cent or more of hours charged in excess of the cap.
Overall, in Q4 2019, 76.8 per cent of families were charged no hours in excess of the hourly fee rate cap, 6.2 per cent were charged some hours in excess of the cap but less than 50 per cent of hours in excess of the cap, 4.5 per cent were charged 50 per cent to less than 90 per cent of hours in excess of the cap, and 12.5 per cent were charged 90 per cent or more of hours in excess of the cap.
Table 20 shows the proportion of hours that families at different points in the distribution of hours were being charged in excess of the hourly fee rate cap for Q4 2019. For families who were being charged some hours in excess of the hourly fee rate cap but less than 50 per cent, the median percentage hours being charged in excess of the cap is 15.6. For families being charged 50 per cent to less than 90 per cent of hours in excess of the hourly fee rate cap, the median percentage is 73.4 per cent and for those being charged 90 per cent or more of hours in excess of the cap it is 100 per cent from the 25th percentile and above.
| Percentage of hours family charged in excess of hourly fee rate cap | At: | ||||
|---|---|---|---|---|---|
| 5th percentile | 25th percentile | 50th percentile | 75th percentile | 95th percentile | |
| Average proportion of hours charged in excess of cap (%) | |||||
| 0% | 0.0 | 0.0 | 0.0 | 0.0 | 0.0 |
| >0%-<50% | 1.4 | 6.8 | 15.6 | 30.8 | 46.2 |
| 50%-<90% | 50.1 | 61.8 | 73.4 | 82.8 | 88.2 |
| 90%+ | 92.3 | 100.0 | 100.0 | 100.0 | 100.0 |
Source: DESE administrative data
Table 21 shows how the proportion of hours that are charged in excess of the hourly fee rate cap varies according to CCS subsidy income thresholds for Q4 2019. The proportion of hours that families are charged in excess of the hourly rate cap gradually increases with income. Eight in 10 (80.5 per cent) families with an annual income below $66,958 were charged no hours in excess of the hourly fee rate cap, compared to 62.2 per cent of families with an income over $351,247. Correspondingly, 10.3 per cent of families with an income less than $66,958 had 90 per cent or more of hours charged in excess of the hourly fee rate cap as compared to 21.9 per cent of families with an income of over $351,247.
Figure 29 shows how the proportion of hours that are charged in excess of the hourly fee rate cap varies according to income vigintile. The proportion of hours charged in excess of the cap increases gradually with income from around income vigintile 13. Income vigintiles 19 and 20 have a substantially smaller proportion of hours charged at or below the cap (65.2 and 59.1 per cent respectively) and correspondingly an increase in the proportion of families with 90 per cent or more of hours being charged in excess of the hourly fee rate cap.
| Gross annual family income category: | Proportion of hours in quarter charged over the cap: | Number of families | |||
|---|---|---|---|---|---|
| 0% | >0% to <50% | 50% to <90% | 90%+ | ||
| Distribution of families (%) | (count) | ||||
| Up to $66,958 | 80.5 | 5.7 | 3.5 | 10.3 | 208,418 |
| $66,958-$171,957 | 79.6 | 5.9 | 3.7 | 10.8 | 422,097 |
| $171,958-$186,957 | 75.6 | 6.7 | 4.9 | 12.8 | 51,426 |
| $186,958-$251.247 | 72.4 | 7.1 | 5.8 | 14.7 | 131,007 |
| $251,248-$341,246 | 66.8 | 7.4 | 7.2 | 18.6 | 65,932 |
| $341,247-$351,247 | 64.1 | 7.4 | 8.6 | 20.0 | 3,927 |
| Over $351,247 | 62.2 | 7.4 | 8.5 | 21.9 | 36,305 |
| Total | 76.8 | 6.2 | 4.5 | 12.5 | 935,472 |
Notes: Excludes families with missing income data.
Source: DESE administrative data
Figure 29: Extent to which families are charged over the hourly fee rate cap, by gross family income vigintile, Q4 2019
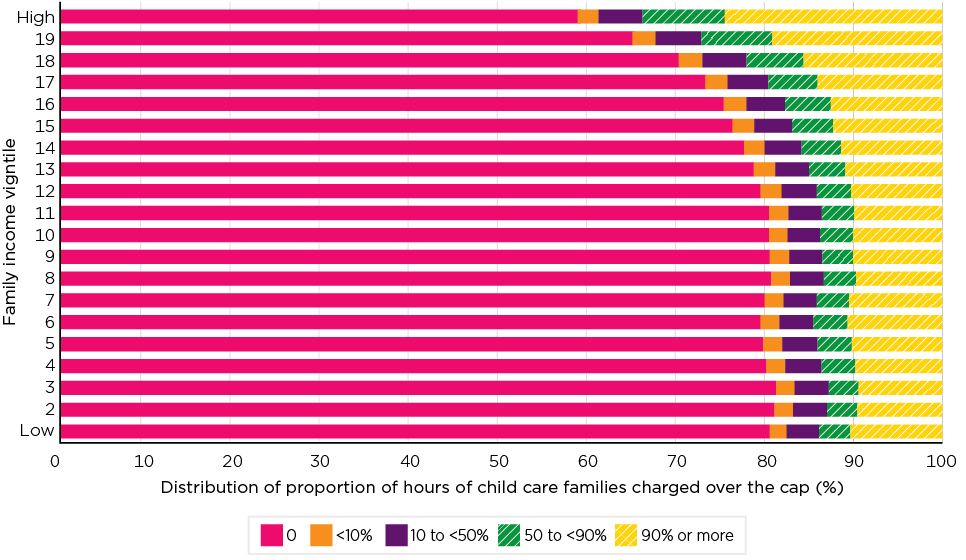
Notes: See Table 40 for the income ranges that apply to each income vigintile.
Source: DESE administrative data
There are differences in the extent to which families are being charged over the hourly fee rate cap between states and territories and for areas of different population sizes and geographic remoteness (Table 22). Families are much more likely to be charged fees in excess of the hourly fee rate cap in the Australian Capital Territory, followed by Western Australia, Victoria and New South Wales. The states/territories with the lowest proportion of families being charged fees over the hourly fee rate cap are Queensland, Northern Territory, South Australia and Tasmania. This is consistent with the differences in fees between states and territories.
There are also differences in the extent to which families are being charged in excess of the hourly fee rate cap according to population/geographic remoteness, with the highest proportion in capital cities, remote and very remote areas and lower rates in other areas (Table 22).66
In terms of child related factors, there are small differences according to the age of the youngest child in the family using child care, with a slightly higher proportion of hours being charged in excess of the hourly fee rate cap for children with a youngest child using care under the age of 3 years than for those with a youngest child aged 3-5 years or 6-13 years (Table 23).
Families being charged for a relatively low number of hours of care per week (up to 10 hours per week for whole family) are substantially more likely to be charged hours in excess of the hourly rate cap and are substantially more likely to be charged in excess of the hourly fee rate cap for 90 per cent or more of the hours of care they are charged for.
| Proportion of hours in quarter charged over the cap | Number of families | ||||
|---|---|---|---|---|---|
| 0% | >0% to <50% | 50% to <90% | 90%+ | ||
| Distribution of families (%) | (count) | ||||
| State/territory | |||||
| New South Wales | 77.5 | 4.5 | 4.4 | 13.6 | 308,412 |
| Victoria | 68.3 | 8.0 | 5.6 | 18.1 | 231,214 |
| Queensland | 89.7 | 3.9 | 2.2 | 4.2 | 209,674 |
| South Australia | 86.8 | 5.2 | 2.5 | 5.5 | 61,128 |
| Western Australia | 63.0 | 12.9 | 7.5 | 16.6 | 78,673 |
| Tasmania | 84.0 | 7.0 | 3.1 | 5.9 | 16,295 |
| Northern Territory | 89.7 | 5.8 | 1.8 | 2.7 | 7,756 |
| Australian Capital Territory | 45.1 | 10.5 | 12.2 | 32.2 | 22,320 |
| Urban and regional location | |||||
| Capital Cities | 73.2 | 6.3 | 5.3 | 15.2 | 649,702 |
| Urban 100k plus | 87.4 | 4.9 | 2.2 | 5.5 | 124,706 |
| Urban 50k-<100k | 81.6 | 7.3 | 3.6 | 7.6 | 39,709 |
| Urban 20k-<50k | 82.4 | 6.8 | 2.9 | 7.9 | 41,971 |
| Urban 10k-<20k | 82.7 | 6.5 | 3.2 | 7.5 | 19,654 |
| Inner Regional | 85.1 | 5.8 | 2.4 | 6.7 | 33,986 |
| Outer Regional | 86.5 | 5.7 | 2.2 | 5.7 | 20,852 |
| Remote | 75.3 | 6.7 | 3.7 | 14.2 | 2,271 |
| Very Remote | 79.3 | 9.9 | 3.2 | 7.6 | 2,621 |
| Total | 76.8 | 6.2 | 4.5 | 12.5 | 935,472 |
Source: DESE administrative data
| Proportion of hours in quarter charged over the cap | Number of families | ||||
|---|---|---|---|---|---|
| 0 | >0% to <50% | 50% to <90% | 90%+ | ||
| Distribution of families (%) | (count) | ||||
| Age youngest child using child care | |||||
| 0-2 | 74.2 | 6.2 | 4.7 | 14.9 | 324,848 |
| 3-5 | 77.8 | 6.4 | 4.3 | 11.5 | 385,897 |
| 6-3 | 78.8 | 5.7 | 4.5 | 11.0 | 224,478 |
| Average hours charged per week (for whole family) | |||||
| Up to 10 hours | 69.3 | 5.3 | 4.2 | 21.2 | 111,958 |
| Over 10-20 hours | 76.8 | 5.6 | 4.5 | 13.2 | 192,802 |
| Over 20-30 hours | 79.4 | 4.8 | 3.7 | 12.1 | 202,451 |
| Over 30-40 hours | 78.2 | 5.8 | 4.2 | 11.8 | 160,110 |
| Over 40-50 hours | 78.3 | 6.5 | 4.7 | 10.6 | 126,643 |
| Over 50-60 hours | 73.8 | 10.1 | 6.0 | 10.1 | 55,647 |
| Over 60 hours | 77.9 | 9.4 | 5.9 | 6.8 | 85,861 |
| Total | 76.8 | 6.2 | 4.5 | 12.5 | 935,472 |
Source: DESE administrative data
There are interactions between the various characteristics of families, their use of child care and geographic location. To better understand the characteristics of families and location that are charged over the hourly fee cap, a regression model is used. The model estimated is a logit model of the probability of being charged at least one hour in Q4 2019 over the hourly fee rate cap as compared to having all hours charged at or below the hourly fee rate cap. The results of the model are presented in Table 24 using marginal effects. The large sample size means that virtually all of the underlying coefficients are statistically significant and, thus, the focus in this discussion is on the marginal effects that are larger in size. The relationship between income and being charged hours in excess of the hourly fee rate cap is apparent in the regression model, with the probability of those in the 20th vigintile being charged in excess of the hourly fee cap being 17.8 percentage points higher than the 10th income vigintile. This appears to reflect the fact that very high income families generally choose more expensive child care services even after control for location, age of youngest child and hours of child care charged per week.
| Average marginal effect (%) | Average marginal effect (%) | |||
|---|---|---|---|---|
| Gross family income vigintile | Urban and regional location | |||
| 1 | 0.9*** | Capital Cities | base | |
| 2 | 0.7*** | Urban 100k plus | -7.9*** | |
| 4 | 1.9** | Urban 50k-<100k | -5.5*** | |
| 5 | 2.1*** | Urban 20k-<50k | -7.5*** | |
| 6 | 2.1*** | Urban 10k-<20k | -8.5*** | |
| 7 | 1.2*** | Inner Regional | -10.2*** | |
| 8 | 0.2 | Outer Regional | -7.9*** | |
| 9 | 0.2 | Remote | 2.9*** | |
| 10 | base | Very Remote | -1.3 | |
| 11 | -0.01 | Age of youngest child using child care | ||
| 12 | 0.8*** | 0-2 years | base | |
| 13 | 1.3*** | 3-5 years | -4.6*** | |
| 14 | 2.2*** | 6-13 years | -10.9*** | |
| 15 | 3.2*** | Average hours charged per week (for whole family) | ||
| 16 | 4.1*** | up to 10 hours | base | |
| 17 | 5.7*** | over 10-20 hours | -8.8*** | |
| 18 | 8.3*** | over 20-30 hours | -14.1*** | |
| 19 | 12.3*** | over 30-40 hours | -13.5*** | |
| 20 | 17.8*** | over 40-50 hours | -13.9*** | |
| State/territory | over 50-60 hours | -10.4*** | ||
| New South Wales | base | over 60-70 hours | -13.8*** | |
| Victoria | 8.2*** | over 70 hours | -8.8*** | |
| Queensland | -11.2*** | |||
| South Australia | -9.8*** | |||
| Western Australia | 12.2*** | |||
| Tasmania | -6.1*** | |||
| Northern Territory | -12.8*** | |||
| Australian Capital Territory | 27.1*** | |||
Notes: *, **, *** indicate that the underlying coefficient is significant at the 90 per cent, 95 per cent and 99 per cent confidence levels respectively. The marginal effect represents the change in the proportion of families being charged hours in excess of the cap relative to the base case. See Table 40 for the income ranges that apply to each income vigintile.
Source: DESE administrative data
Large differences between state and territories and population size/geographic remoteness are apparent in the regression model and are similar to those in the bivariate analysis (Table 22). Families with a youngest child using child care aged 6-13 years were 10.9 percentage points less likely to be charged hours in excess of the cap than families with a youngest child of under 2 years. The relationship with hours of care remains with families using less than 10 hours of care per week being more likely to be charged hours in excess of the hourly fee rate cap.
4.2.3 Subsidy taper rate
The second aspect of the structure of child care subsidies that impacts affordability is the rate of subsidy and the extent to which this reduces with increasing family income. As noted in Section 4.2.1 and described in Chapter 1, CCS is a maximum rate of 85 per cent of the capped child care fee for families up to an income threshold (which was $66,958 in 2018-19) and then tapers to 50 per cent on income of $171,958, remaining at this rate up to a family income of $251,248, before again tapering to a rate of 20 per cent at $341,248 and holding at this rate until family income reaches $351,249, beyond which CCS is reduced to zero.
This section considers the number of families that are in the different income ranges and hence subject to a different rate of CCS, and the actual rates of subsidy they obtain. About one-quarter of families have a reconciled annual income below $66,958, and hence the maximum subsidy percentage of 85 per cent of fees (up to the hourly fee rate cap) applies (Table 25). Almost half of families are in the income range between $66,958 and $171,958 per annum and hence receive a subsidy rate of between 85 per cent and 50 per cent depending on where their income is in this range.
Table 25 also shows the mean and median effective subsidy rates received by families in each income threshold group. This is calculated by dividing modelled CCS/ACCS by fees based on reconciled family income. The details of how CCS/ACCS are modelled and the reconciled family income measure are described in Section 4.5.1.67 For all income groups up to an income of $251,248 (except for the income group $66,958 to $171,958 for whom the subsidy rate tapers from 85 per cent to 50 per cent), while the median effective subsidy is generally relatively close to the program structure, the mean effective subsidy rate is substantially less than the rate of CCS subsidy. For example, the mean effective subsidy rate for families with an income below $66,958 is 75.3 per cent which is substantially lower than the formal 85 per cent subsidy rate (up to the hourly fee rate cap).
| Gross family income category: | Subsidy rate (%) | Families | |||
|---|---|---|---|---|---|
| Formal | Average modelled effective | Median modelled effective | Distribution (%) | Number | |
| Up to $66,958 | 85 | 75.3 | 84.0 | 27.7 | 313,180 |
| Over $66,958-$171,958 | 85 to 50 | 61.0 | 64.2 | 47.6 | 538,583 |
| Over $171,958-$186,958 | 50 | 44.3 | 49.6 | 4.5 | 51,167 |
| Over $186,958-$251,248 | 50 | 43.0 | 48.8 | 11.5 | 129,531 |
| Over $251,248-$341,247 | 50 to 20 | 31.8 | 34.7 | 4.8 | 54,125 |
| Over $341,247-$351,247 | 20 | 14.4 | 17.8 | 0.2 | 2,725 |
| Over $351,247 | No subsidy | 0.5 | 0.0 | 3.7 | 41,866 |
| Total | 100.0 | 1,131,177 | |||
Notes: Based on the income measure that includes reconciled income for the 75 per cent of families for whom reconciled income data was available. For the remaining families, the income reported to Centrelink during the course of the year is used. This means that some families with an income over $251,257 received some benefits during the course of the year. Because the reconciled income measure is used in this table, the average effective subsidy received is modelled based on reconciled income. The table includes families with zero or negative income in the income category up to $66,958. These families are excluded from the modelling and hence the average modelled actual excludes these families.
Source: DESE administrative data
This lower effective subsidy rate for many families, as reflected in the mean effective subsidy rate, is due to the combined effect of the hourly fee rate cap, with 20.7 per cent of hours charged above the hourly fee rate cap in Q4 2018, the impact of the activity test (see Section 4.2.5) and the use of hours in excess of allowable fortnightly hours (see Section 4.2.5). A small number of families in the income range over $186,958 to $351,247 were also impacted by the annual subsidy cap.
Differences in income levels between families with different characteristics, levels of activity and income support/FTB receipt status result in a different distribution of families across the income thresholds that are used to determine the applicable CCS subsidy rate (Table 26). About 4 in 5 (81.9 per cent) of single parents have an income below $66,958 and hence are in the range for the 85 per cent subsidy rate and 15.0 per cent are in the income bracket $66,958 to $171,958 and hence have a subsidy rate that tapers in the range 85 per cent to 50 per cent. Only 14.6 per cent of couple parent families have an income under $66,958 and hence a subsidy rate of 85 per cent. Just over half (55.5 per cent) have an income in the range $66,958 to $171,958 and the remainder have higher incomes with 14.2 per cent in the range $186,958 to $251,248 and hence have a subsidy rate of 50 per cent.
The table can also be viewed on page 72 of the PDF.
| Gross family income threshold: | Population | |||||||
|---|---|---|---|---|---|---|---|---|
| Up to $66,958 | $66,958 to $171,958 | $171,958 to $186,958 | $186,958 to $251,248 | $251,248 to $341,247 | $341,247 to $351,247 | Over $351,247 | ||
| Distribution of families (%) | Families | |||||||
| Family type | ||||||||
| Couple parent | 14.6 | 55.5 | 5.6 | 14.2 | 5.9 | 0.3 | 4.0 | 910,271 |
| Single parent | 81.9 | 15.0 | 0.1 | 0.2 | 0.1 | 0.0 | 2.7 | 227,842 |
| Family income support/family payment status a | ||||||||
| Single parent | ||||||||
| Full-rate IS | 94.1 | 4.3 | 0.1 | 0.1 | 0.0 | 0.0 | 1.4 | 94,994 |
| Part-rate IS | 90.6 | 8.5 | 0.1 | 0.1 | 0.0 | 0.0 | 0.7 | 44,687 |
| FTB only | 64.3 | 34.5 | 0.3 | 0.4 | 0.1 | 0.0 | 0.4 | 77,259 |
| No FTB | 34.8 | 52.3 | 2.2 | 4.9 | 2.0 | 0.1 | 3.8 | 38,631 |
| Couple parent | ||||||||
| Both full-rate IS | 95.0 | 4.7 | 0.0 | 0.1 | 0.0 | 0.0 | 0.2 | 10,639 |
| Some IS | 80.9 | 18.6 | 0.1 | 0.2 | 0.1 | 0.0 | 0.1 | 26,822 |
| FTB only | 40.2 | 59.4 | 0.1 | 0.2 | 0.0 | 0.0 | 0.1 | 175,125 |
| No FTB | 3.1 | 56.4 | 7.5 | 19.2 | 8.1 | 0.4 | 5.3 | 654,361 |
| Family activity status b | ||||||||
| Single parent | ||||||||
| Missing | 74.4 | 4.0 | 0.2 | 0.6 | 0.3 | 0.0 | 20.5 | 26,680 |
| Low | 97.0 | 2.2 | 0.0 | 0.1 | 0.0 | 0.0 | 0.6 | 23,435 |
| Part-time | 88.5 | 11.0 | 0.1 | 0.1 | 0.0 | 0.0 | 0.3 | 95,194 |
| Full-time | 72.3 | 26.8 | 0.2 | 0.3 | 0.1 | 0.0 | 0.4 | 82,533 |
| Couple parent | ||||||||
| Missing | 34.7 | 36.8 | 2.7 | 7.2 | 3.4 | 0.2 | 15.2 | 94,694 |
| Low | 76.8 | 17.7 | 0.9 | 2.4 | 1.1 | 0.1 | 1.1 | 2,559 |
| Some part-time | 32.0 | 48.0 | 3.8 | 9.5 | 4.1 | 0.2 | 2.3 | 76,116 |
| Low and full-time | 30.1 | 54.7 | 2.9 | 6.7 | 3.0 | 0.2 | 2.5 | 37,254 |
| Part-time and full-time | 9.9 | 62.2 | 5.9 | 14.0 | 5.4 | 0.3 | 2.4 | 396,407 |
| Both full-time | 7.6 | 54.9 | 7.0 | 18.8 | 8.3 | 0.4 | 3.1 | 303,241 |
| Total | 28.0 | 47.4 | 4.5 | 11.4 | 4.8 | 0.2 | 3.7 | 1,138,113 |
Notes: a Family income support/family payment status is derived from the income support and Family Tax Benefit dataset. Full-rate income support means that the families' income is below the threshold beyond which the amount of income support payment is reduced. b Variable defined in Chapter 2. Based on the reconciled income measure.
Source: DESE administrative data
As expected, for both single parent and couple parent families that are in receipt of full-rate income support, the vast majority have an income of less than $66,958 and hence are in the 85 per cent subsidy rate. For couple parents that do not receive FTB, 56.4 per cent are in the income range $66,958 to $171,958, 7.5 per cent in the range $171,958 to $186,958 and 19.2 per cent in the income range $186,958 to $251,248.
Table 27 shows how the distribution of families across the income thresholds that are used to determine the applicable CCS subsidy rate varies according to geographic location. There are some differences in the extent to which families are subject to the subsidy taper rate. In capital cities 25.3 per cent of families have an income below $66,958 and hence are in the range for the 85 per cent subsidy rate and 46.1 per cent are in the income range $66,958 to $171,958 and hence have a subsidy rate that tapers in the range 85 per cent to 50 per cent. As population size decreases and remoteness increases, the proportion of families with an income below $66,958 increases. In remote and very remote areas 28.8 and 29.7 per cent, respectively, have an income below $66,958 and a higher proportion have an income of $186,958 to $251,248. The impact of the subsidy taper rate is quite similar in capital cities and remote and very remote areas, with a smaller impact in other areas due to the lower income levels.
There are some differences in the distribution of families across the CCS subsidy rate income thresholds. Families in the Australian Capital Territory and, to a lesser extent, the Northern Territory are much more likely to be in the income range of $186,985 to $254,248 and therefore subject to the 50 per cent subsidy rate than families in the states, and those in Tasmania, South Australia and Queensland are the least likely to be in this income range.
The table can also be viewed on page 73 of the PDF.
| Gross family income threshold: | Population | |||||||
|---|---|---|---|---|---|---|---|---|
| Up to $66,958 | $66,958 to $171,958 | $171,958 to $186,958 | $186,958 to $251,248 | $251,248 to $341,247 | $341,247 to $351,247 | Over $351,247 | ||
| Distribution of families (%) | Families | |||||||
| Urban and regional location | ||||||||
| Capital Cities | 25.3 | 4.9 | 4.9 | 13.1 | 5.9 | 0.3 | 4.4 | 790,021 |
| Urban 100k plus | 31.6 | 4.2 | 4.2 | 8.6 | 2.5 | 0.1 | 2.2 | 148,332 |
| Urban 50k-<100k | 35.7 | 3.4 | 3.4 | 6.9 | 1.7 | 0.1 | 1.9 | 48,264 |
| Urban 20k-<50k | 36.5 | 3.4 | 3.4 | 6.5 | 1.7 | 0.1 | 1.7 | 51,808 |
| Urban 10k-<20k | 35.2 | 3.7 | 3.7 | 8.4 | 2.4 | 0.1 | 1.8 | 24,409 |
| Inner Regional | 36.7 | 2.9 | 2.9 | 5.9 | 1.5 | 0.1 | 2.0 | 41,797 |
| Outer Regional | 37.9 | 3.0 | 3.0 | 6.0 | 1.6 | 0.1 | 2.2 | 26,591 |
| Remote | 28.8 | 4.6 | 4.6 | 12.1 | 3.4 | 0.2 | 3.1 | 3,086 |
| Very Remote | 29.7 | 4.5 | 4.5 | 13.1 | 3.4 | 0.1 | 5.4 | 3,638 |
| State/territory | ||||||||
| New South Wales | 27.4 | 44.8 | 4.6 | 12.3 | 6.0 | 0.3 | 4.6 | 374,786 |
| Victoria | 27.5 | 48.3 | 4.4 | 11.0 | 4.8 | 0.2 | 3.8 | 281,495 |
| Queensland | 32.4 | 47.7 | 4.2 | 9.7 | 3.2 | 0.2 | 2.7 | 253,863 |
| South Australia | 28.7 | 53.2 | 3.9 | 8.6 | 2.7 | 0.1 | 2.9 | 74,897 |
| Western Australia | 24.8 | 48.9 | 5.1 | 12.9 | 4.8 | 0.2 | 3.3 | 96,794 |
| Tasmania | 31.8 | 54.1 | 3.2 | 6.7 | 1.9 | 0.1 | 2.2 | 20,008 |
| Northern Territory | 20.4 | 47.5 | 5.9 | 16.3 | 5.9 | 0.2 | 3.8 | 9,643 |
| Australian Capital Territory | 12.2 | 44.2 | 7.1 | 22.1 | 9.4 | 0.5 | 4.6 | 26,460 |
| Total | 28.0 | 47.4 | 4.5 | 11.4 | 4.8 | 0.2 | 3.7 | 1,138,113 |
Notes: Based upon the reconciled income measure.
Source: DESE administrative data
4.2.4 Annual benefit cap
As outlined above, there is an annual cap on the maximum amount of CCS per child that families with an income in excess of $186,958 (in 2018-19) can receive. This section provides data on how many families were impacted by the benefit cap in 2018-19.
Only 14,667 or 1.3 per cent of families are estimated to have been affected by the annual benefit cap (Table 28). Among couple parent families, as expected, the vast majority of those impacted by the annual benefit cap have both parents working full-time, along with a smaller number which have one parent working full-time and the other part-time. Virtually all of those impacted by the cap are in couple parent families (14,447 out of 14,667) and the vast majority lived in a capital city (12,876 out of 14,667). Among families with an income above the fee cap threshold ($186,958) and below the income at which entitlement to any CCS is lost ($351,247), 8.7 per cent are impacted by the annual fee cap (Table 29).
| Impacted by the annual benefit cap | ||
|---|---|---|
| (%) | Number | |
| Family type | ||
| Single parent | 0.1 | 220 |
| Couple parent | 1.7 | 14,447 |
| Family activity status | ||
| Single parent | ||
| Missing | 0.0 | 0 |
| Low | 0.0 | 1 |
| Part-time | 0.1 | 45 |
| Full-time | 0.2 | 174 |
| Couple parent | ||
| Missing | 0.0 | 8 |
| Low | 0.0 | 1 |
| Some part-time | 0.3 | 252 |
| Low and full-time | 0.1 | 36 |
| Part-time and full-time | 0.9 | 3,670 |
| Both full-time | 3.5 | 10,480 |
| Urban and regional location | ||
| Capital Cities | 1.7 | 12,876 |
| Urban 100k plus | 0.6 | 950 |
| Urban 50k-<100k | 0.5 | 228 |
| Urban 20k-<50k | 0.5 | 251 |
| Urban 10k-<20k | 0.7 | 159 |
| Inner Regional | 0.3 | 115 |
| Outer Regional | 0.2 | 58 |
| Remote | 0.3 | 10 |
| Very Remote | 0.6 | 20 |
| Total | 1.3 | 14,667 |
Notes: Based on the most commonly reported income during the year income measure.
Source: DESE administrative data
| Income threshold: | Total income | |||
|---|---|---|---|---|
| $186,958-$251,248 | $251,248-$341,247 | $341,247-$351,247 | $186,958-$351,247 | |
| Number of families | ||||
| Fees exceed $10,190 per child | 12,675 | 1,990 | <20 | 14,667 |
| Number in income range | 120,978 | 45,575 | 2,421 | 168,974 |
| (%) | ||||
| Proportion impacted by the annual benefit cap | 10.4 | 4.4 | <1.0 | 8.7 |
Notes: <20: estimate is too small for publication, sum of row may not equal total. Based on the most commonly reported income during the year income measure.
Source: DESE administrative data
Because the annual benefit cap applies only to families with an income in excess of $186,958, it is of interest to compare the circumstances of the families just above the threshold income who are impacted by the cap and those just below the threshold income who have per child care costs in excess of $10,190 and who therefore would have been impacted by the cap if their income had been higher than the cap threshold. There are 5,290 families with an income in the threshold below the annual benefit cap who received more CCS than the cap and would have had their CCS capped if their income was above the cap (Table 30). Within this income range there is a very similar proportion of families (9.9 per cent) as the proportion of families in the next income threshold range which places them above the cap threshold income and who had their CCS capped (10.5 per cent).
The proportion of single and couple parent families just below the income threshold who received an amount of CCS in excess of the cap is very similar to that in the next income threshold up who had their CCS capped. This is also the case for family activity status and geographic location.
| Over $171,958-$186,958 | Over $186,958-$251,248 | |||
|---|---|---|---|---|
| Would be impacted by cap if income higher | Impacted by cap | |||
| (%) | Number | (%) | Number | |
| Family type | ||||
| Couple family | 13.0 | 122 | 11.5 | 188 |
| Single parent family | 9.8 | 5,168 | 10.5 | 12,487 |
| Family activity status | ||||
| Single parent | ||||
| Missing | 10.0 | 2 | 0.0 | 0 |
| Low | 0.0 | 0 | 0.0 | 0 |
| Part-time | 4.7 | 2 | 1.4 | 1 |
| Full-time | 13.6 | 118 | 12.3 | 187 |
| Couple parent | ||||
| Missing | 2.4 | 21 | 3.1 | 61 |
| Low | 0.0 | 0 | 0.0 | 0 |
| Some part-time | 1.5 | 1 | 2.2 | 4 |
| Low and full-time | 1.7 | 4 | 2.1 | 12 |
| Part-time and full-time | 0.8 | 43 | 0.7 | 86 |
| Both full-time | 11.1 | 5,099 | 11.8 | 12,324 |
| Urban and regional location | ||||
| Capital Cities | 10.9 | 4,361 | 11.5 | 11,003 |
| Urban 100k plus | 7.4 | 487 | 7.4 | 878 |
| Urban 50k-<100k | 6.4 | 108 | 6.9 | 212 |
| Urban 20k-<50k | 7.6 | 145 | 7.3 | 236 |
| Urban 10k-<20k | 6.4 | 64 | 7.0 | 138 |
| Inner Regional | 5.7 | 82 | 5.0 | 123 |
| Outer Regional | 3.4 | 29 | 3.6 | 58 |
| Remote | 3.2 | 5 | 1.7 | 6 |
| Very Remote | 4.7 | 9 | 4.8 | 21 |
| Total | 9.9 | 5,290 | 10.5 | 12,675 |
Notes: Based on the most commonly reported income during the year income measure.
Source: DESE administrative data
4.2.5 Approved hours of care and the activity test
The Child Care Package involved significant changes to the number of hours of child care that were eligible for subsidy with the introduction of a more structured, multi-level rigorously applied activity test. This has implications for both access to child care, see Chapter 6, and affordability. In particular, relative to previous activity testing, many families, in particular those on the safety net provision, are eligible for fewer hours of subsidised care. One consequence is that some of these now use hours in excess of their allowed hours. This latter group is the focus of this section.
The new activity test, as described in Chapter 1, introduced a tiered approach with universal access of 24 hours per fortnight (12 hours per week) for low income households who did not meet the activity test, and then tiers of 36, 72 and 100 hours per fortnight above this depending on the number of hours of activity undertaken per fortnight. There are a range of exemptions to the application of the activity test. In addition to the 24 hours per fortnight noted above, these include, for those families who do not meet the activity test sufficiently, 36 hours per fortnight for children to attend preschool where this is delivered through a Centre Based Day Care service, and up to 100 hours per fortnight for those who receive Additional Child Care subsidy.68
In some cases, parents may not be eligible for any hours of subsidised care. This includes some families with high incomes that preclude eligibility, some cases where fees are met by a third party, and others where a family fails to meet other CCS eligibility criteria such as residency or immunisation requirements.
In 2018-19, 13.3 per cent of hours of child care paid for were unsubsidised. However, if families that have zero approved hours (largely because of the exclusions noted above) are excluded, the proportion is 9.0 per cent and if families that received no CCS (based on the reconciled income) are excluded, then 5.4 per cent of total hours are unsubsidised.
Overall, 47.4 per cent of families received subsidy for every hour paid for and 52.6 per cent paid for at least one hour of unsubsidised child care during 2018-19 (Figure 30). About one-quarter (24.8 per cent) of families had some but 5 per cent or less of their hours unsubsidised, and 8.4 per cent had none of their hours subsidised. When the analysis excludes families with zero approved hours of care, the distribution is very similar, although the proportion with all hours subsidised increases to 49.8 per cent, and those who have some, but 5 per cent or fewer of their hours unsubsidised, increases to 26.0 per cent.
Figure 30: Distribution of families by the proportion of hours paid for that are unsubsidised, 2018-19
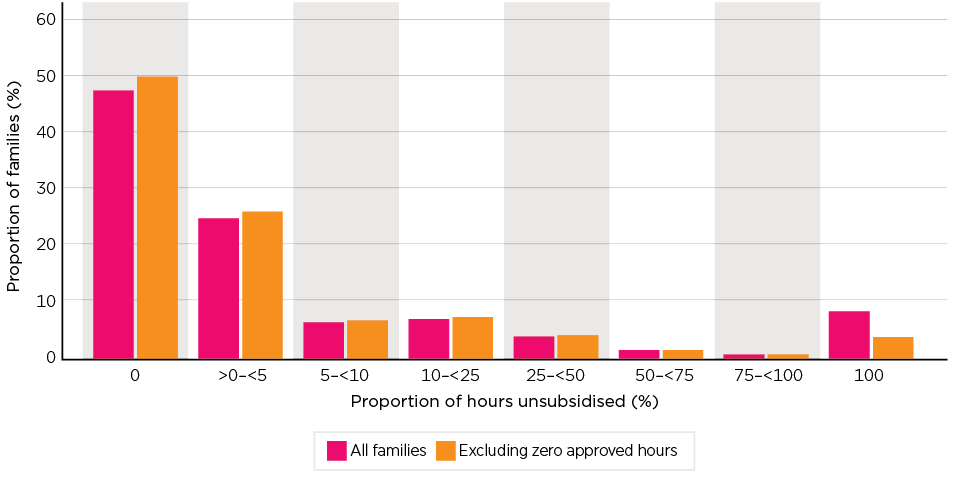
Source: DESE administrative data
Figure 31 shows the mean and median percentage of hours paid for by families that are unsubsidised by the CCS income threshold of the family. The income measure used is reconciled family income. There is relatively little difference in the proportion of hours paid for which are unsubsidised across the taper reduction income ranges69 until the $341,248-$351,248 bracket is reached (Figure 31). Families in this group have 21.3 per cent of their hours unsubsidised and for those with an income of over $351,248, 73.0 per cent of hours of child care that are paid for are unsubsidised. While families with an income of over $351,248 will not be eligible for any CCS and hence all hours will be unsubsidised, the measure of unsubsidised hours reported in this section is constructed by aggregating across 12 months hours that were paid for and hours for which CCS was paid and there are fortnights in which the income reported to Centrelink is below the income threshold. Families that have a reconciled income in excess of $351,248 will incur a child care debt to the government that will have to be repaid.
Figure 31: Proportion of hours paid that are unsubsidised, by CCS income thresholds, 2018-19

Notes: Excludes families with zero approved hours. Reconciled family income. Weighted by number of hours paid for.
Source: DESE administrative data
Figure 32 shows the proportion of hours that are unsubsidised by the ranges of approved hours of care. While the proportion of hours that is unsubsidised decreases as the number of allowed hours increases, there are unpaid hours across all of the categories of approved hours including an average of 8 per cent or more of the hours for those who were approved for 72 or 100 hours, although the median value of zero indicates that at least half of the hours are subsidised. For families with 36 approved hours per fortnight, the proportion of hours that are unsubsidised increases to 19.8 per cent. It is 22.8 per cent for those with 24 hours per fortnight of approved activity, and for families with zero hours of approved activity virtually all hours of care are unsubsidised (mean of 97.5 per cent and median of 100.0 per cent).
Figure 32: Proportion of hours paid for that are unsubsidised, by allowed hours, 2018-19
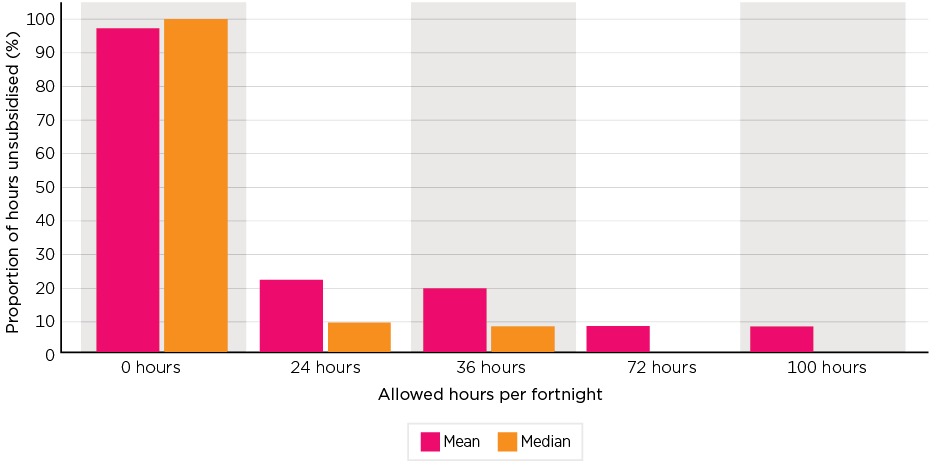
Notes: Weighted by number of hours paid for.
Source: DESE administrative data
The highest proportion of hours paid for that are unsubsidised is in very remote areas (11.0 per cent), followed by remote areas (6.8 per cent) and capital cities (6.5 per cent) (Figure 33). This is consistent with the higher income levels among the child care population in remote and very remote areas and in capital cities, compared to the other areas.
Figure 33: Proportion of hours paid for that are unsubsidised, by urban and regional location, 2018-19
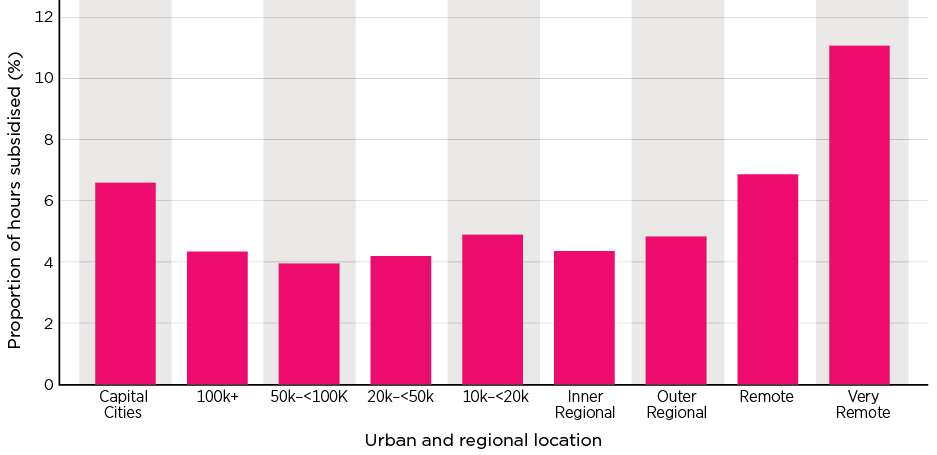
Notes: Excludes families with zero approved hours. Weighted by number of hours paid for. See note on Table 6 for a description of the urban and regional location variable.
Source: DESE administrative data
Table 31 shows the percentage of hours paid for that are unsubsidised by income vigintile. The percentage of hours paid for that are unsubsidised is slightly higher for the lowest income vigintile than for the second income vigintile. The proportion of unsubsidised hours among families with at least one unsubsidised hour, initially decreases as income increases, is then relatively stable for income vigintiles 3-19, and then increases sharply for the highest income group. That is, 56-59 per cent of families that use child care and who are in the lowest 2 income vigintiles have at least one hour of unsubsidised care and, among this group who have at least one unsubsidised hour, about 1 in 5 hours are unsubsidised. Families in the lowest income vigintile have a reported income of under $21,000, which is less than the minimum social security entitlement for full-income support for a family with one child. Families in the second income vigintile have reported income between $21,000 and less than $31,399 per annum, which is less than the minimum full-rate social security entitlement for most families with child care aged children.70
If the reported income is an accurate reflection of the family's access to economic resources, then it is difficult to understand how they can afford a significant number of unsubsidised hours. While we are not able to definitely determine the explanation for this, with the data we have available, we think that it is probably in part due to the reported incomes for many of these families not an accurate reflection of their access to economic resources for a range of reasons. These include significant support being provided by family or friends or that the family has significant assets but their income is low in the particular year due to capital losses, business losses or tax minimisation strategies. It may also be the case that child care services are not in fact receiving payment for unsubsidised hours from some of the families in this situation and are 'writing off' their debts.
| Gross family income vigintile | Child care users with at least one hour of unsubsidised care | Proportion of hours unsubsidised if have at least one unsubsidised hour | Number of unsubsidised hours (over year) if have at least one unsubsidised hour |
|---|---|---|---|
| (%) | (%) | Annual hours | |
| 1 | 59.5 | 20.1 | 144.5 |
| 2 | 56.0 | 17.6 | 133.2 |
| 3 | 53.9 | 16.0 | 119.7 |
| 4 | 53.0 | 15.5 | 114.0 |
| 5 | 52.4 | 15.3 | 113.1 |
| 6 | 51.2 | 15.4 | 110.2 |
| 7 | 48.8 | 16.1 | 111.4 |
| 8 | 46.9 | 15.6 | 103.1 |
| 9 | 45.3 | 15.3 | 100.4 |
| 10 | 44.2 | 14.8 | 97.8 |
| 11 | 44.4 | 14.2 | 95.6 |
| 12 | 44.6 | 14.3 | 94.4 |
| 13 | 44.9 | 13.9 | 93.1 |
| 14 | 44.7 | 14.0 | 95.7 |
| 15 | 46.3 | 14.5 | 93.5 |
| 16 | 47.3 | 14.1 | 100.2 |
| 17 | 49.3 | 14.3 | 106.8 |
| 18 | 51.3 | 14.3 | 115.1 |
| 19 | 54.8 | 16.2 | 140.3 |
| 20 | 78.4 | 65.2 | 710.9 |
| Total | 50.4 | 18.0 | 142.1 |
Notes: Excludes families with zero approved hours. Reconciled family income. See Table 40 for the income ranges that apply to each income vigintile.
Source: DESE administrative data
4.2.6 Trends in the effective child care subsidy rate
This section reports on the trends in the child care subsidy rate received by families, as measured by the child care subsidy as a proportion of child care fees, from the beginning of 2017 to the end of 2019. The proportion of families receiving a child care subsidy rate of zero, greater than zero and less than 50 per cent, 50 to less than 75 per cent, 75 to less than 95 per cent and 95 per cent and over is shown in Figure 34 on a weekly basis. Prior to the introduction of the Child Care Package in July 2018, a large majority of families received a subsidy rate of 50 to less than 75 per cent (mid-60 per cent to just below 80 per cent), and between about 13 and 25 per cent received a subsidy rate of 75 to less than 95 per cent. A smaller proportion received a zero subsidy rate, a subsidy rate of under 50 per cent or a subsidy rate of 95 per cent or more. The effect of families hitting caps towards the end of the financial year can be seen in the figure, with the proportion receiving no subsidy or a subsidy less than 50 per cent increasing towards July 2017, before dropping and then increasing again towards July 2018.
Following the introduction of the Child Care Package there has been a substantial fall in the proportion of families receiving a subsidy rate of 50 or more but under 75 per cent and substantial increases in the proportions receiving 75 or more but under 95 per cent and the proportion receiving some subsidy but less than 50 per cent, reflecting a combination of the shift to income testing the full amount of child care subsidy, the effect of the more graduated activity test and approved hours and some of the other changes. There was also a substantial increase in the proportion of families receiving no subsidy due in substantial part to having an income high enough that they are no longer eligible to receive CCS.
Figure 34: Actual weekly child care subsidy rate received by families, 2017-19

Notes: Uses unreconciled estimate of weekly subsidy.
Source: DESE administrative data
4.2.7 Additional Child Care Subsidy
As discussed earlier, the Additional Child Care Subsidy, as part of the Child Care Safety Net, replaced a diverse range of programs under the previous funding arrangements that provided additional assistance with the costs of child care for families with specific additional needs, including Grandparent Child Care Benefit, Special Child Care Benefit, and Jobs, Education and Training Child Care Fee Assistance.
The focus in this Chapter is the impact of the replacement of the additional forms of assistance with the costs of child care in place under the previous system with the Additional Child Care Subsidy. This section briefly describes the numbers of families that received the various forms of additional child care assistance under the old and new systems; further analysis of the transition from the old to the new system is provided in Chapter 7.
In 2017-18 there were 23,447 families that received SCCB, 5,559 families that received GCCB and 11,356 families that received transition to work (JETCCFA) during at least one week during 2017-18. In total, 40,362 families received one of the additional payments in 2017-18, which is 3.7 per cent of all families (1,091,549) that received a child care subsidy during the year. In 2018-19 there were 32,419 families that received Additional Child Care Subsidy during at least one week during 2018-19, which is 3.1 per cent of all families (1,041,692) that received a child care subsidy during the year. This means that there were 7,943 fewer families that received additional child care payments after the introduction of the Package.71
There were 5,159 families who received SCCB in the last week of June 2018 and, of these, 38 per cent were receiving ACCS in the first week of August 2018, 49 per cent were receiving CCS and 13 per cent were not in the child care system. There were 3,120 families who received GCCB in the last week of June 2018 and, of these, 78 per cent were receiving ACCS in the first week of August 2018, 8 per cent were receiving CCS and 15 per cent were not in the child care system. There were 4,005 families who received JETCCFA in the last week of June 2018 and, of these, 42 per cent were receiving ACCS in the first week of August 2018, 53 per cent were receiving CCS and 5 per cent were not in the child care system.
Our estimates from the 2017-18 administrative data are that the additional amount of support (on top of what would have been received under the standard CCB/CCR payment) provided under the GCCB program was $203.6 million, under the SCCB it was $108.6 million and under JETCCFA it was $30.4 million. This compares to the amount of additional support (on top of what would have been received under the standard CCS payment) for 2018-19 of $294.3 million.
4.2.8 Impact of program settings on affordability - summary
There are 4 components of the CCS that determine the amount of subsidy to which families are entitled: hourly rate caps; percentage rate of Child Care Subsidy; the annual cap; and approved hours as determined under the activity test. There is also additional government financial support for families and children who may face barriers in accessing affordable child care via the ACCS.
The relative size of the subsidies under the Child Care Benefit/Child Care Rebate systems and CCS depends on a range of factors including income, number of children using care, level of activity, number of hours of care used, hourly fee paid for services and type of care used.
A substantial minority of hours of care paid for are charged above the hourly rate cap. During the second half of 2019, across the period, in most weeks, the proportion of hours charged above the cap was between about 13 and 18 per cent,72 for Centre Based Day Care around 15-16 per cent of hours were charged above the cap, for Family Day Care around 20-23 per cent of hours were charged above the cap73 and Outside School Hours Care had the lowest proportion of hours charged above the cap and much lower proportions being charged above the cap during school holiday weeks. While In Home Care comprises only a small proportion of total hours of child care used, a high proportion of hours are charged over the hourly rate cap (ranging from just under 40 per cent of hours to around 75 per cent of hours over the period since 1 July 2018).
Where the hourly fee is being charged above the cap, the average amount above the cap varies from 10.3 per cent for Centre Based Day Care and 11.3 per cent for Family Day Care to 17.4 per cent for In Home Care. At the 90th percentile, the amount being charged in excess of the cap is substantial, being 23.3 per cent for Centre Based Day Care and up to 31.2 per cent for In Home Care.
While the majority of hours of care are not charged above the hourly rate cap, the cap does impact particularly families using In Home Care and families with higher incomes, with a youngest child using child care of under 3 years, using very short hours of care and those using child care services in capital cities or remote or very remote areas. For the majority of hours charged above the cap, the amount in excess of the cap is relatively small but there are a small proportion of hours that are charged well in excess of the hourly fee rate cap.
The subsidy taper rate, which reduces the amount of subsidies paid as income increases, has a substantial impact. Overall, 4.8 per cent of families have an income in the range over which the CCS rate reduces from 50-20 per cent and 3.7 per cent do not receive any subsidy due to their income being above the threshold at which the subsidy rate goes to zero. Very important to note is that there is a difference between the formal subsidy rate and the effective subsidy rate received by families. For example, for families with an income of up to $66,958, the formal subsidy rate is 85 per cent but the rate received is in fact only 75.3 per cent. This is for a range of reasons including the impact of the activity test, which means that some hours paid for are unsubsidised, and the annual cap among other factors.
The annual benefit cap impacts a small number of families with an income above $186,958 (14,667 families or 1.3 per cent of all families using child care). Amongst families with an income in excess of $186,958 and up to $351,247, 8.7 per cent were impacted by the annual benefit cap.
The changes to the approved hours of care and the associated activity test have had a significant impact on families. Overall, 13.3 per cent of hours paid for by families were unsubsidised, with just over half of families paying for at least one hour of unsubsidised care during the year. While most families that pay for at least one subsidised hour have only a small proportion of hours unsubsidised, there are some families that are charged for substantial numbers of unsubsidised hours. The highest proportion of hours that are unsubsidised are for high income families (in excess of $341,248 per annum). For families on an income of less than this, there are only small differences in the proportion of hours that are unsubsidised, being a bit under 10 per cent of hours.
4.3 Child care fees
The fees charged by child care services are an important determinant of the affordability of child care. Historically, child care costs have increased at a faster rate than CPI and, hence, have increased in real terms (Section 4.3.3). The July 2018 changes to the child care system were designed to put downward pressure on child care fees via the introduction of the hourly fee rate cap and the concept of a family co-contribution, so that families pay a portion of their child care fees.74
4.3.1 The distribution of hourly child care fees
This section provides a summary of the distribution of hourly fees charged by services in Q4 2019 and how this varies according to type of care. Fees are reported at various points in the distribution of fees (p5, p10, p25, p50 (median), p75, p90, p95) and the average fee. The average fees for child care type combined (excluding In Home Care) is $9.78 per hour and is slightly higher in for-profit services ($10.05) than not-for-profit services ($9.30) (Table 32). The median hourly fee is similar to the average hourly fee, which is because the distribution of fees is not skewed. There is a little more variation between fees at the bottom end of the distribution and the top end of the distribution in not-for-profit services than in for-profit services. The average fees are highest in Family Day Care services ($10.69), slightly lower in Centre Based Day Care services ($10.34) and substantially lower in Outside School Hours Care services ($8.14). The range of hourly fees charged (5th-95th percentile) is smallest in Family Day Care services, followed by Centre Based Day Care services and largest in Outside School Hours Care services.
The table can also be viewed on page 83 of the PDF.
| At: | Mean | |||||||
|---|---|---|---|---|---|---|---|---|
| 5th percentile | 10th percentile | 25th percentile | 50th percentile | 75th percentile | 90th percentile | 95th percentile | ||
| ($ per hour) | ||||||||
| Centre Based Day Care | ||||||||
| For-profit | 7.67 | 8.25 | 9.17 | 10.21 | 11.48 | 12.65 | 13.62 | 10.37 |
| Not-for-profit | 7.43 | 8.09 | 9.07 | 10.18 | 11.33 | 12.29 | 13.15 | 10.24 |
| Total | 7.60 | 8.18 | 9.14 | 10.20 | 11.43 | 12.55 | 13.48 | 10.34 |
| Family Day Care | ||||||||
| For-profit | 8.60 | 9.03 | 10.00 | 10.60 | 11.10 | 12.33 | 13.42 | 10.69 |
| Not-for-profit | 8.51 | 8.95 | 9.57 | 10.50 | 11.45 | 12.75 | 13.78 | 10.69 |
| Total | 8.57 | 9.00 | 9.80 | 10.55 | 11.21 | 12.51 | 13.53 | 10.69 |
| Outside School Hours Care | ||||||||
| For-profit | 5.35 | 5.95 | 6.89 | 8.33 | 10.30 | 11.99 | 12.95 | 8.71 |
| Not-for-profit | 4.89 | 5.40 | 6.35 | 7.33 | 8.50 | 10.00 | 10.86 | 7.58 |
| Total | 5.05 | 5.64 | 6.62 | 7.69 | 9.47 | 11.18 | 12.18 | 8.14 |
| In Home Care | ||||||||
| For-profit | 24.83 | 29.00 | 35.00 | 38.40 | 40.70 | 43.20 | 46.41 | 37.41 |
| Not-for-profit | 17.20 | 20.85 | 25.00 | 30.70 | 35.22 | 37.70 | 38.60 | 29.64 |
| Total | 19.13 | 22.95 | 27.85 | 34.50 | 38.40 | 41.00 | 43.00 | 32.94 |
| Total excluding In Home Care | ||||||||
| For-profit | 6.53 | 7.43 | 8.80 | 10.00 | 11.30 | 12.50 | 13.48 | 10.05 |
| Not-for-profit | 5.52 | 6.31 | 7.67 | 9.36 | 10.83 | 11.96 | 12.78 | 9.30 |
| Total | 6.00 | 6.90 | 8.37 | 9.85 | 11.11 | 12.33 | 13.28 | 9.78 |
Notes: For In Home Care the hourly rate is reported at the family level. Records with zero fees or zero hours are excluded.
Source: DESE administrative data
As discussed in Section 4.2.2, while the majority of child hours are charged at rates below the hourly rate cap, a significant proportion of services are charging at least some children at rates that exceed the hourly rate cap. Table 33 shows the proportion of services with an average hourly fee above the hourly rate cap, by service type, along with the proportion of services where at least one child is charged an average fee across the quarter above the hourly rate cap. These approaches produce very different results, which is due to there being variation in the fees charged to families within a service. Using average hourly fees to compare to the hourly rate cap does not fully capture this possible variation, so underestimates the extent to which services are charging above this rate.
| Proportion with mean fee above rate cap | Proportion with at least one child charged average fee above rate cap | |
|---|---|---|
| (%) | ||
| Centre Based Day Care | ||
| For-profit | 12.6 | 60.8 |
| Not-for-profit | 9.0 | 55.0 |
| Total | 11.6 | 59.0 |
| Family Day Care | ||
| For-profit | 18.1 | 65.4 |
| Not-for-profit | 21.6 | 97.5 |
| Total | 19.4 | 79.0 |
| Outside School Hours Care | ||
| For-profit | 11.9 | 63.4 |
| Not-for-profit | 2.4 | 30.2 |
| Total | 6.9 | 47.8 |
| In Home Care | ||
| For-profit | 94.4 | 95.5 |
| Not-for-profit | 45.4 | 66.7 |
| Total | 62.7 | 81.4 |
| Total excluding In Home Care | ||
| For-profit | 12.9 | 61.7 |
| Not-for-profit | 8.7 | 45.8 |
| Total | 11.5 | 55.8 |
Notes: For In Home Care the hourly rate is calculated at the family level. Records with zero fees or zero hours are excluded.
Source: DESE administrative data
4.3.2 Trends in average hourly child care fees
This section provides an overview of the hourly fees charged by services over the period Q1 2017 to Q4 2019, and of the extent to which there is any evidence of a change in the trend in the hourly child care fee following the introduction of the Child Care Package in July 2018.
As discussed in Section 4.2.2, in the context of the hourly fee rate cap, the concept of an hourly fee is in most cases a post facto construction based on nominal session length and the session fee.75 This means it is possible for hourly fees to increase in response to a nominal reduction in session length without the actual cost to parents increasing.
Across all services (excluding In Home Care where the cost is per family), and based on the formal session length, the cost of an average hour of care increased from $8.71 in Q1 2017 to $9.96 in Q4 2019 (Figure 35), an increase of 14.4 per cent. Inspection of Figure 35 shows that the average hourly fee being charged by Centre Based Day Care (CBDC) and Outside School Hours Care (OSHC) was increasing prior to the introduction of the Child Care Package in July 2018 and this has continued after the introduction of the Package. For Family Day Care there was a sharp increase in the hourly fee between Q2 and Q3 2018 following the introduction of the Child Care Package.
Figure 35: Quarterly average hourly fees, Centre Based Day Care, Family Day Care and Outside School Hours Care, Q1 2017 to Q4 2019
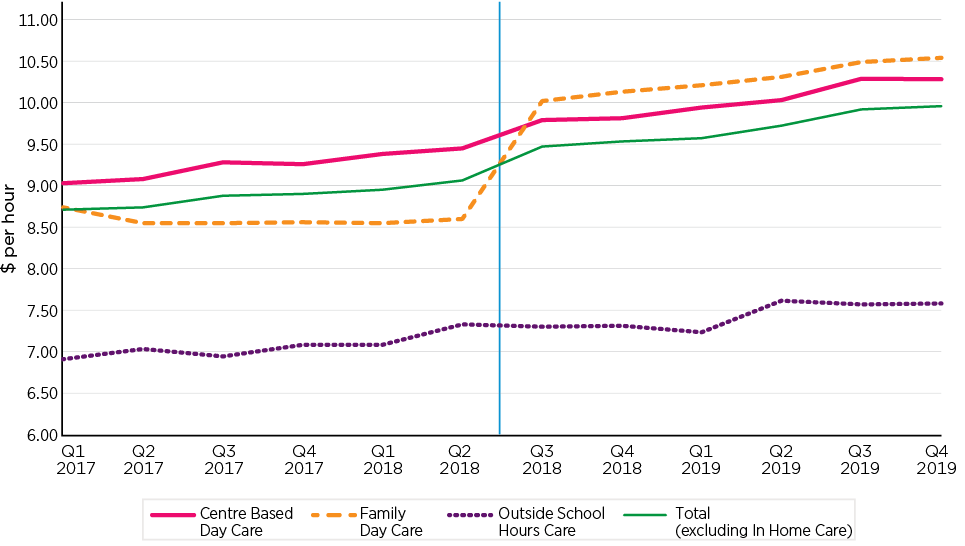
Source: DESE administrative data
The average hourly fee charged by In Home Care services over this period is shown in Figure 36. The average fee charged by In Home Care was increasing prior to the introduction of the Child Care Package and increased very substantially immediately following the changes from $18.93 per hour (on a family basis) in Q2 2018 to $29.08 per hour in the Q3 2018. This, in part, reflects the significant changes associated with the new In Home Care program and its alignment to the Child Care Package. These changes were expected to result in changes to the charging practices of the In Home Care services (see also Section 5.6).
Figure 36: Quarterly average hourly fees per family, In Home Care services, Q1 2017 to Q4 2019
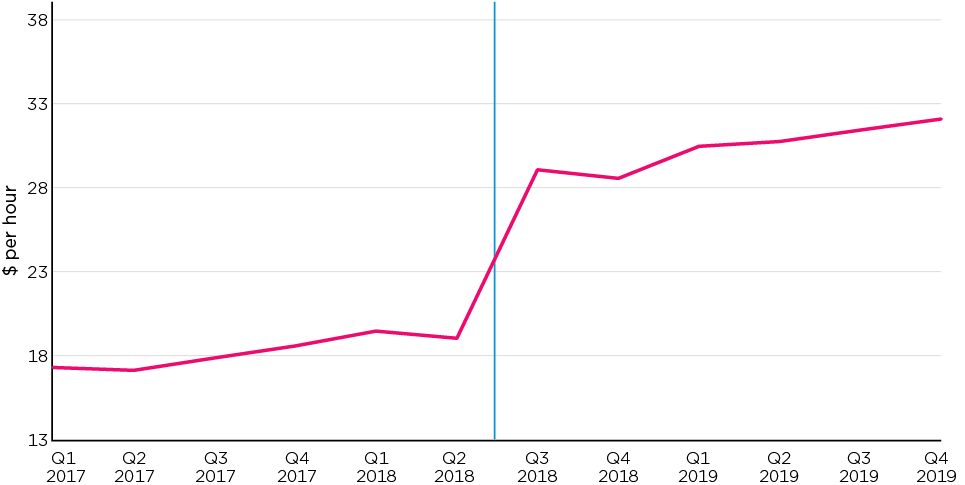
Notes: In order to take into account the shift in In Home Care from charging on a per child to a per family level (see footnote 63), In Home Care fees prior to July 2018 are calculated by summing fees charged to individual children.
Source: DESE administrative data
Figure 37 shows the changes in the average hourly fee for the 12 months prior to the changes to the child care system (Q2 2017 to Q2 2018) and the 12 months following the changes to the child care system (Q2 2018 to Q2 2019). The increase in hourly fees for Family Day Care is apparent with a 0.6 per cent increase in the 12 months prior to the changes and a 19.9 per cent increase in the 12 months post the changes. For In Home Care there was a big increase in the family hourly fee in the 12 months prior to the changes (11.3 per cent) and a massive increase of 62.7 per cent following the changes. Across all services (excluding In Home Care) the average increase in fees in the 12 months prior to the changes was 3.7 per cent and in the 12 months following the changes the increase was 7.3 per cent.
The change in the average hourly fee charged by Centre Based Day Care and Outside School Hours Care is similar in the 12 months prior to the changes to the system and in the 12 months after the changes to the system, with a slightly higher percentage increase for Centre Based Day Care post the changes than before and a slightly lower percentage increase for Outside School Hours Care following the introduction of the Package relative to that prior.
Figure 37: Change in hourly fees 2017 to 2018 and 2018 to 2019, by service type
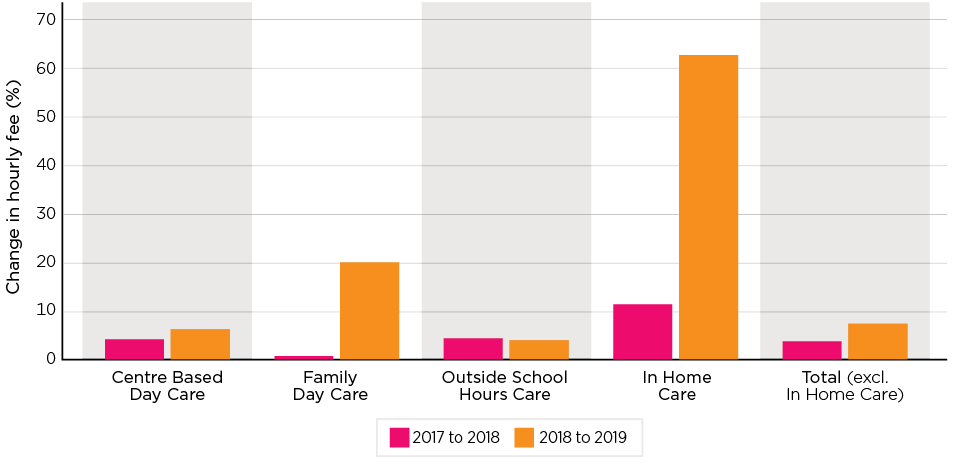
Notes: In order to take into account the shift in In Home Care from charging on a per child to a per family level (see footnote 63), In Home Care fees prior to July 2018 are calculated by summing fees charged to individual children.
Source: DESE administrative data
Figure 38 shows the increases over 2 periods, June 2017 to June 2018, and June 2018 to June 2019 by type of service provider. In both periods the overall increase in fees was higher for for-profit services relative to not-for-profit, although this did not hold for all service types. In particular, for-profit services in the Family Day Care sector had smaller increases in the 2017-18 period and much larger in the 2018-19 period than not-for-profit services. In the Outside School Hours Care sector, the increase in fees for not-for-profit providers was above that of for-profit providers in both time periods.
Figure 38: Annual percentage change in average hourly fee, by type of service and whether for-profit or not-for-profit, 2017 to 2018 and 2018 to 2019
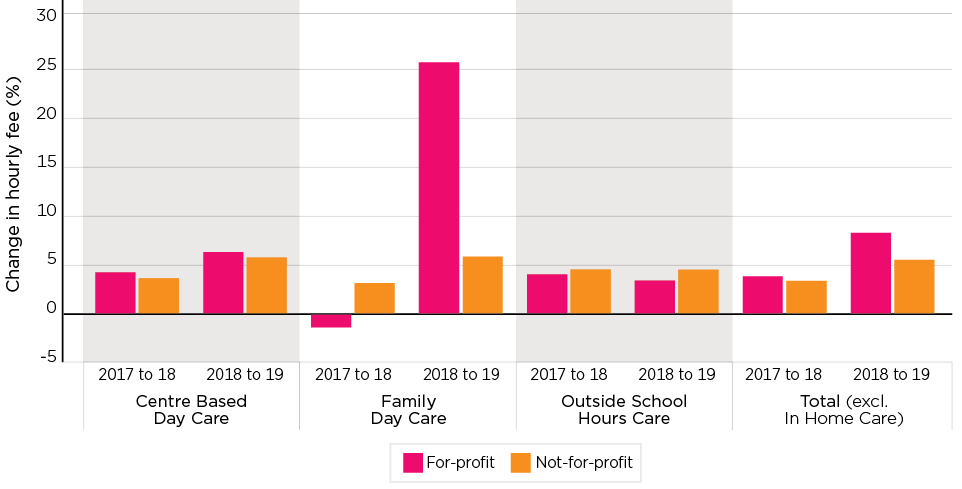
Notes: Change in fees is June quarter to June quarter.
Source: DESE administrative data
The big increase in the average hourly fee being charged by for-profit Family Day Care providers led to a convergence of the hourly fee being charged by for-profit providers to that being charged by not-for-profit providers (Figure 39). Before July 2018, for-profit Family Day Care providers were charging a substantially lower per hour fee than were not-for-profit Family Day Care providers. After the changes, the hourly fee charged by for-profit Family Day Care providers increased to be the same as that being charged by not-for-profit providers. Post the shift to the new system, the hourly fee charged by for-profit and not-for-profit Family Day Care providers has increased at about the same rate.
Figure 39: Average hourly fee, Family Day Care, by whether provider is for-profit or not-for-profit, Q1 2017 to Q4 2019

Source: DESE administrative data
As documented in Chapter 9, a significant number of for-profit Family Day Care services have ceased operating since the beginning of 2017. Also as outlined in Chapter 9, this is in substantial part due to fraud and a range of non-compliance issues. Figure 40 shows the hourly fee charged by for-profit Family Day Care providers over the period Q1 2017 to Q4 2019 according to whether the service continued operation in 2018-19. There is very little difference in the hourly fee charged between services that ceased operating and those that continued to operate post June 2018. This demonstrates that the increase in the hourly fee being charged by for-profit Family Day Care services is not due to compositional change among Family Day Care services.
Figure 40: Hourly fee, by whether services continued into 2018-19, for-profit Family Day Care services, Q1 2017 to Q4 2019
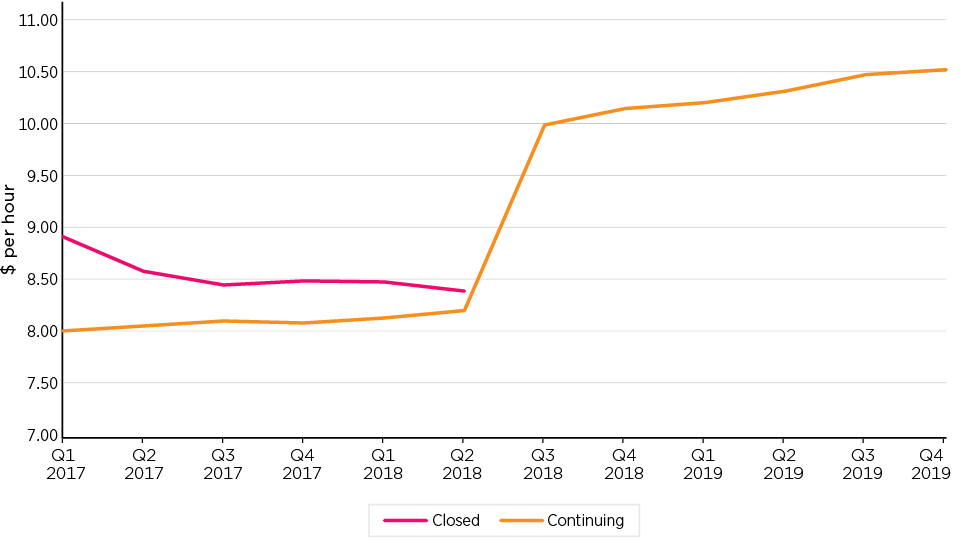
Source: DESE administrative data
Table 33 provides further insights into the reason for the apparent big increase in the hourly rate being charged by for-profit Family Day Care providers. Between 2017-18 and 2018-19, while the per hour cost of care charged by for-profit Family Day Care providers increased by 22.2 per cent, the annual number of hours of care per child paid for by families using for-profit Family Day Care decreased by 23.3 per cent (from 1,104 to 847 hours per year). Among not-for-profit Family Day Care providers there was a much smaller increase in the per hour cost of care being charged for (increase of 5.9 per cent) and hours per child charged for decreased by 3.5 per cent.
The increase in the hourly rate being charged by for-profit Family Day Care providers appears to be due to a change to the basis on which many for-profit Family Day Care providers are charging families. This is consistent with the data from the SELCS Wave 2 (June-July 2019) (Chapter 5) that shows that 56.0 per cent of Family Day Care services charge on an hourly basis.
There are some differences across states/territories in the change in hourly fee charge and per child hours of care paid in the Family Day Care sector. There were increases in the hourly fee in all states/territories except for the Northern Territory, where there was a small fall in the hourly fee (1.2 per cent). There were smaller increases in the hourly fee charged in the Australian Capital Territory (5.2 per cent increase) and Tasmania (5.8 per cent increase). The largest increase in the hourly fee was in New South Wales (20.7 per cent) followed by Victoria (17.2 per cent increase). The states in which the hourly fee increased by the largest amount also were the states with the largest decrease in the number of hours of care used.
| Fee/hour | Hours/child | Change | ||||
|---|---|---|---|---|---|---|
| 2017-18 | 2018-19 | 2017-18 | 2018-19 | $/hr | Hrs/child | |
| ($ per hour) | (Annual hours) | (%) | ||||
| State/territory | ||||||
| New South Wales | 8.50 | 10.26 | 952 | 789 | 20.7 | -17.2 |
| Victoria | 8.73 | 10.23 | 1,056 | 777 | 17.2 | -26.4 |
| Queensland | 8.44 | 9.94 | 838 | 764 | 17.7 | -8.8 |
| South Australia | 8.33 | 9.17 | 661 | 605 | 10.1 | -8.5 |
| Western Australia | 8.98 | 10.04 | 840 | 728 | 11.8 | -13.4 |
| Tasmania | 9.41 | 9.96 | 497 | 467 | 5.8 | -5.9 |
| Northern Territory | 10.05 | 9.93 | 909 | 868 | -1.2 | -4.6 |
| Australian Capital Territory | 10.57 | 11.11 | 859 | 799 | 5.2 | -7.0 |
| Australia | 8.64 | 10.15 | 934 | 761 | 17.5 | -18.5 |
| For-profit / not-for-profit | ||||||
| For-profit | 8.33 | 10.17 | 1,104 | 847 | 22.2 | -23.3 |
| Not-for-profit | 9.54 | 10.10 | 644 | 622 | 5.9 | -3.5 |
Source: DESE administrative data
4.3.3 Distribution of changes in fees
The above analysis has focused on changes in average fees across services. This section considers the question of whether there have been differences in the rate of change in the hourly child care fee across services. Of particular interest is the potential impact of the new hourly fee cap, both among services charging well below the cap, and the possibility that the introduction of the cap was interpreted by these services as a signal that they should be charging more, and the intended effect of this measure of reducing increases in hourly fees above the cap.
The analysis is restricted to Centre Based Day Care services, given the substantial changes in how Family Day Care services and In Home Care services were charging associated with the introduction of the Child Care Package. As the data is longitudinal, it relates only to those services operating across the period of the comparison, and hence does not take into account changes in the composition of services over the period as a result of entries and exits.
A challenge in considering this question is the time period over which change should be considered, and the extent to which focus is on the pattern of fee change since the introduction of the package or this pattern relative to that prior to the change. In this section, 4 measures are used:
- The first is the change in the average quarterly hourly fee between Q2 2017 and Q2 2018, and Q2 2018 and Q2 2019. This gives a measure of the immediate impact of the changes.
- The second measure is the change in the annual increase in hourly fees between 2017 and 2018, and 2018 and 2019. This measure is focused more on the trend in the change in hourly fees than the immediate impact of the introduction of the Child Care Package.
- The third measure is the change in fees between the December quarter at the end of one year and the following June quarter - that is, the change from December 2017 to June 2018 and the change from December 2018 to June 2019. This measure focuses of trends in fees unaffected by the actual changes that occurred with the introduction of the package.
- This is complemented by the fourth comparison, which considers the change between Q1 2017 to Q4 2017 and Q1 2019 to Q4 2019. This again excludes the short term impact associated with the introduction of the package.
In addition, a regression modelling approach is used to estimate whether there are distinctive changes in the pattern of fee increases for services at different points of the fee distribution following the introduction of the Child Care Package, in absolute terms and relative to what they were prior to the changes.
As has been detailed in Table 32 there is considerable variation in the fees charged by services, with, for example, in Q4 2019, the average hourly fee charged by a Centre Based Day Care service at the 95th percentile point of the fees distribution of $13.48 compared to $7.60 for a service at the 5th percentile. For this analysis, services have been grouped into 10 deciles based on their hourly fee.76
Figure 41 shows the change in hourly fees between the June quarter (Q2) 2017 and Q2 2018 and between Q2 2018 and Q2 2019 for Centre Based Day Care services ranked by their decile of hourly fee in Q2 2017. This second change effectively picks up the impact of fee increases associated with the introduction of the package. Specifically, it shows that while in the period prior to the introduction of the package the dollar value of the increase in fees was relatively flat across services by their decile of fee, this changed with the introduction of the package. In this latter period, there was a very distinct pattern of higher increases for those services that had the lowest fees, and much smaller increases among higher fee services. This is emphasised in the chart, with the line showing the ratio of fee increases in the second period relative to those in the first.
Figure 41: Centre Based Day Care Services, ranked by decile of fee in Q2 2017, change in hourly fees between Q2 2017 and Q2 2018 and Q2 2018 and Q2 2019
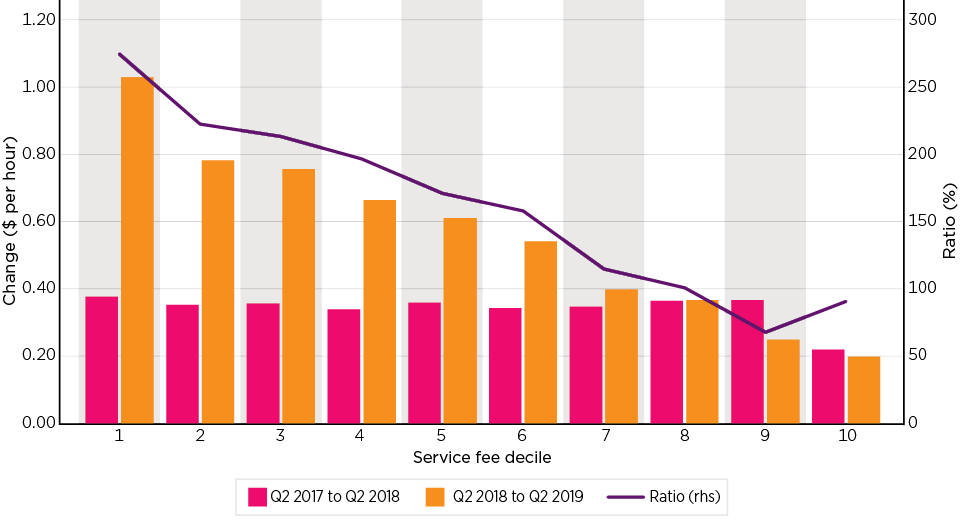
Source: DESE administrative data
The additional analyses are focused more on the longer-term changes in the pattern of fee increases, rather than the immediate impact of the package - and suggest that this experience differs from the shorter term.77
Figure 42 shows the change in annual average hourly fees between 2017 and 2018 and between 2018 and 2019 for Centre Based Day Care services, this time ranked by their decile of annual average hourly fee in 2017. The figure also shows the ratio of the change in the hourly fee in the second period relative to the first. A ratio of more than 100 indicates that the fee increase was higher between 2018 and 2019 than it was between 2017 and 2018. This data shows a pattern of decreasing increases for the higher fee deciles in the second period but, in this case, shows this as being consistent with the earlier period. As a consequence, the ratio of increases across the 2 periods is almost flat (with the exception of the highest fee decile where the increase is higher in the second period) - suggesting no change in the pattern of fee change for most of the distribution. This data is, however, still impacted by the changes at the time of the introduction of the package.
Figure 42: Centre Based Day Care Services, ranked by decile of fee in 2017, change in annual average hourly fee, 2017 to 2018 and 2018 to 2019
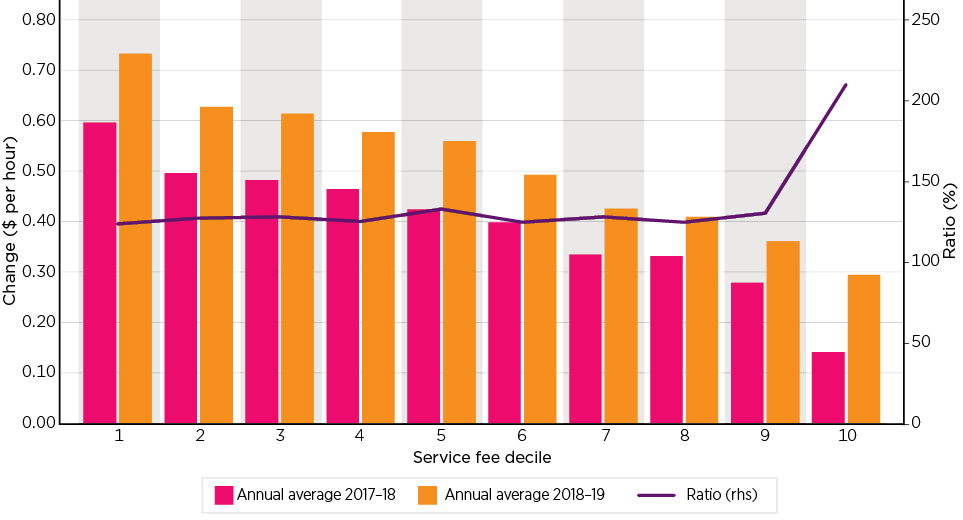
Source: DESE administrative data
To address this, Figure 43 and Figure 44 look at changes over 3 quarter periods that exclude the impact of the changes. Figure 43 shows the change in hourly fees between the December quarter (Q4) 2017 and the June quarter (Q2) 2018 and the December quarter (Q4) 2018 and the June quarter (Q2) 2019 for Centre Based Day Care services ranked by their decile of hourly fee in Q4 2017. The conclusion from this analysis is also that the pattern of changes in hourly fees by fee decile is similar post the Child Care Package to what it was prior to the changes to the child care system, and the growth in the second period was higher than in the first.
Figure 43: Centre Based Day Care services, ranked by decile of fee in Q4 2017, change in quarterly average hourly fee, Q4 2017 and Q2 2018 and Q2 2019

Source: DESE administrative data
Figure 44 presents changes in the average quarterly hourly fee between Q1 2017 and Q4 2017, and between Q1 2019 and Q4 2019. This shows a similar picture to Figure 43 but with an indication of a relatively higher ratio of growth for the upper deciles.
Figure 44: Centre Based Day Care services, ranked by decile of fee in Q1 2017, change in quarterly average hourly fee Q1 2017 to Q4 2017 and Q1 2019 to Q4 2019
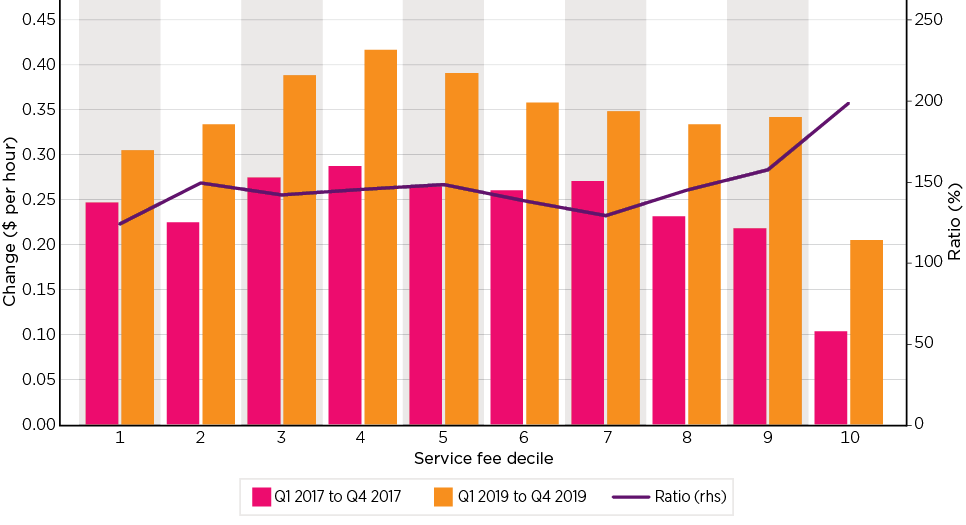
Source: DESE administrative data
Given that there were some changes in the pattern of use of child care following the introduction of the Child Care Package, including session length, which affects the calculation of the hourly fee, as well as the potential for a range of other service characteristics to have an impact on price changes, a regression model of the extent to which the quarterly change in the hourly child care fees differs before and after the introduction of the package has been estimated. In this model, the dependent variable is the quarterly change in the hourly fees in dollar per hour terms and the explanatory variables include the time (measured quarterly), and the decile of service fee in Q1 2018 interacted with whether the quarter was before or after the introduction of the Child Care Package from July 2018. In addition, the average hours of care per child is controlled for, as is the size of the service in terms of child weeks of care in the quarter and the size of the provider, the service location and whether the service was for-profit. The model is estimated for the period Q2 2017 to Q4 2019, with change between Q2 2018 and Q3 2018 excluded.
In terms of the key question as to the pattern of fee increase across services ranked by their fee level in the post package period, the model suggests a differential pattern of an increase of some 4 cents per hour per quarter for services in deciles 1-6 and of 3 cents an hour for those in deciles 7-9, with decile 10 excluded due to the model structure. While these are statistically significant, their magnitude is very small. This suggests that the fee decile of the service makes relatively little contribution to the relative change in fees in the period following the introduction of the package.
This analysis suggests that, while there was a tendency for lower fee Centre Based Day Care services to increase their fees more rapidly at the point of transition to the CCS, possibly indicative in the short term of there being a 'benchmark effect', in the longer term the pattern of increase is relatively consistent across the fees distribution.
| Variable | Coefficient | Variable | Coefficient | ||
|---|---|---|---|---|---|
| Quartera | Whether for-profit | ||||
| Q2 2017 | 0.000*** | For-profit | base | ||
| Q3 2017 | 0.155*** | Not-for-profit | -0.020*** | ||
| Q4 2017 | -0.050*** | Urban and regional location | |||
| Q1 2018 | 0.080*** | Capital Cities | base | ||
| Q2 2018 | 0.010*** | Urban 100k plus | -0.003 | ||
| Q4 2018 | -0.046*** | Urban 50k-<100k | -0.001 | ||
| Q1 2019 | 0.071*** | Urban 20k-<50k | 0.001 | ||
| Q2 2019 | -0.001 | Urban 10k-<20k | -0.008 | ||
| Q3 2019 | 0.176*** | Inner Regional | 0.000 | ||
| Q4 2019 | -0.084*** | Outer Regional | -0.003 | ||
| Remote | -0.010 | ||||
| Average child hours | -0.027*** | Very Remote | -0.028 | ||
| Child weeks | 0.000 | State | |||
| Child weeks squared | 0.000 | New South Wales | base | ||
| Interaction | Victoria | 0.009*** | |||
| Pre/Post | Fee decile | Queensland | 0.017*** | ||
| Pre | 1 | -0.042*** | South Australia | 0.001 | |
| Pre | 2 | -0.018*** | Western Australia | 0.004 | |
| Pre | 3 | -0.013*** | Tasmania | -0.006 | |
| Pre | 4 | -0.007 | Northern Territory | -0.002 | |
| Pre | 5 | base | Australian Capital Territory | 0.019** | |
| Pre | 6 | -0.001 | Whether former BBF | ||
| Pre | 7 | 0.005 | Not | base | |
| Pre | 8 | 0.004 | Former BBF | -0.013 | |
| Pre | 9 | 0.013** | Provider size | ||
| Pre | 10 | 0.015** | 1 service | base | |
| Post | 1 | 0.043*** | 2 services | -0.002 | |
| Post | 2 | 0.042*** | 3-5 services | 0.001 | |
| Post | 3 | 0.041*** | 6-99 services | 0.006 | |
| Post | 4 | 0.038*** | 100+ services | 0.012*** | |
| Post | 5 | 0.040*** | |||
| Post | 6 | 0.038*** | Constant | 0.036*** | |
| Post | 7 | 0.031*** | |||
| Post | 8 | 0.031*** | |||
| Post | 9 | 0.028*** | |||
| Post | 10 | omitted | |||
| N = 70,715 | |||||
| r2 = 0.304 | |||||
Notes: a change to quarter, excludes change from Q2 2018 to Q3 2018. OLS regression with robust standard errors.
*, **, *** indicate that the underlying coefficient is significant at the 90 per cent, 95 per cent and 99 per cent confidence levels respectively.
Source: DESE administrative data
4.3.4 Trends in the costs of child care: Consumer Price Index (CPI) data
The history of the cost of child care as measured by the Australian Bureau of Statistics' Consumer Price Index is one of rapidly increasing prices (especially since the early 1990s) punctuated by strong price falls as Commonwealth governments have increased the generosity of payments or introduced new programs (Figure 45).
Interpreting these changes in the child care CPI requires an understanding of the methodology that the ABS uses to calculate price change for child care. The ABS methodology involves collecting gross child care prices and then subtracting government child care payments. Government child care payments are calculated through the use of customer profiles for a sample of households. The methodology takes into account payments that are made to families that reduce child care costs to families, but not when this assistance was provided through the tax system.
Specifically highlighted in Figure 45 are some of the major changes. The ABS report these changes as:
- a fall of 14.7 per cent in child care fees in the March quarter 1991. This was as a consequence of the introduction of Childcare Assistance in January of that year (effectively the extension of the 'Fee relief' that has been available in the community sector).
- a 5.1 per cent decrease in the September quarter 1994. This was 'largely due to the introduction of the Commonwealth Government Childcare Cash Rebate Scheme that came into effect on 1 July 1994' (ABS 6401.0, September 1994, p. 2).
Figure 45: ABS Child Care and All Groups CPI, March 1982 to March 2020
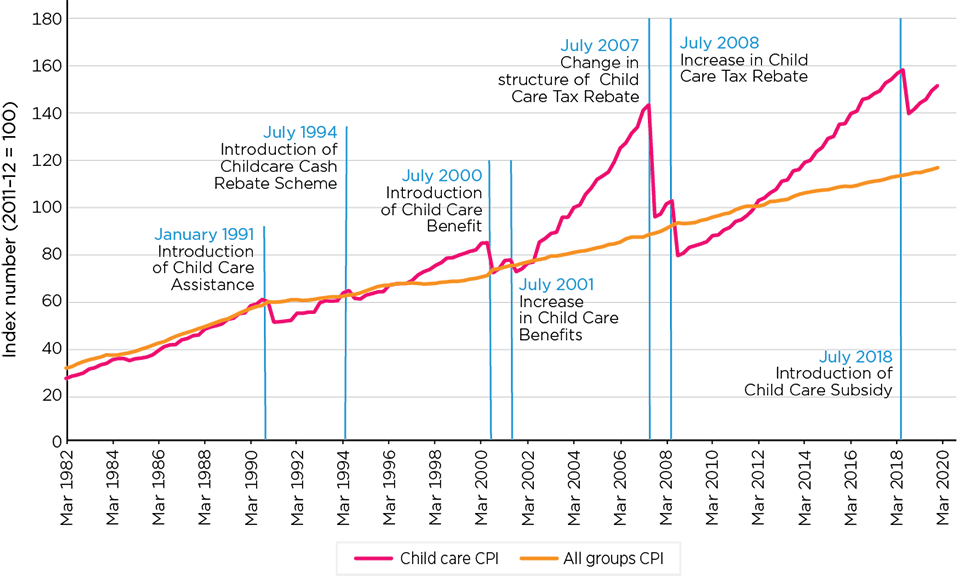
Source: ABS (various years). 'Consumer Price Index, Australia', ABS Catalogue No. 6401.0, ABS, Canberra.
- a fall of 15.1 per cent in the September quarter 2000. No detailed explanation of this is given by the ABS, in part as this release also encompassed the effect of the introduction of the GST. The change appears to reflect the impact of the introduction of the Child Care Benefit and the higher rates of assistance this provided.
- a fall in September 2001. ABS reported 'a fall in the cost of child care (-6.4 per cent) due to an increase in Commonwealth child care benefits' (ABS 6401.0, September 2001, p. 4).
- a fall of 33.4 per cent in September quarter 2007. The ABS reports this as resulting 'from a change in the eligibility criteria for the Child Care Tax Rebate (CCTR) that has brought it in-scope of the CPI this quarter and from the additional 10 per cent indexation of the Child Care Benefit (CCB) rates on top of the usual annual CPI indexation' (ABS 6401.0, September 2007, p. 1).78
- a further fall of 22.9 per cent in the September quarter 2008. This is ascribed by the ABS to 'the increase in the Child Care Tax Rebate (CCTR) from 30 per cent to 50 per cent that was implemented as of 1 July 2008' (ABS 6401.0, September 2008, p. 5).
The ABS reported the introduction of the Child Care Package and the CCS as resulting in an 11.8 per cent decline in the cost of child care in September 2018: 'The fall in child care is due to the introduction of the CCS from 2 July 2018, which replaced the Child Care Rebate and Child Care Benefit' (ABS 6401.0, September 2018, p. 3).
The ABS CPI data suggests that child care prices have been adjusted continuously since June 2018, rather than there being a large jump at the beginning of the new calendar year. Over the period September 2018 to September 2019 the ABS Child Care CPI has increased by 7.0 per cent and the overall CPI increasing by 1.7 per cent. By March 2020 almost three-quarters (72.6 per cent) of the reduction in the child care CPI due to the Package had been lost.
Figure 46 shows the child care CPI (real child care costs) and child care CPI relative to male and female full-time adult ordinary time average earnings. This measure is clearly linked to affordability because the large majority of those using child care and paying child care fees have at least one parent in paid employment.
Figure 46: ABS Child Care CPI relative to male and female full-time adult ordinary time average earnings, March 1982 to December 2019
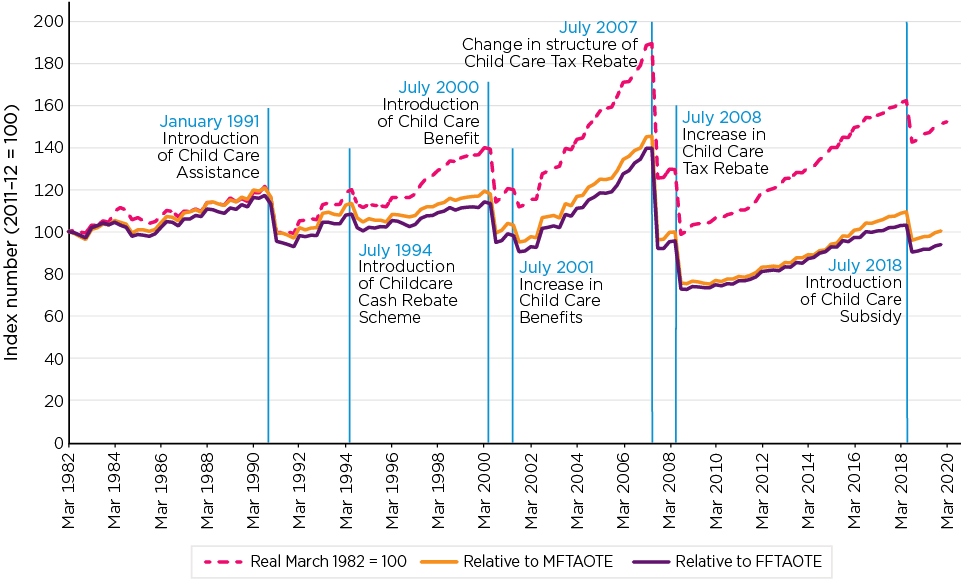
Notes: MFTAOTE - Male Full-time Adult Ordinary Time Earnings. FFTAOTE - Female Full-time Adult Ordinary Time Earnings.
Source: ABS (various years). 'Consumer Price Index, Australia', ABS Catalogue No. 6401.0, ABS, Canberra. ABS (various years). 'Average Weekly Earnings Australia', ABS Catalogue No. 6302.0. ABS, Canberra.
The real price index for child care was 152.3 in March 2020 compared with 162.4 in June 2018, just prior to the introduction of the Package and 142.6 in September 2018, just after it was introduced. While real net child care costs have increased substantially since 1982, relative to earnings they are no higher in March 2020 than they were in March 1982.
This is open to several interpretations. One is that the very large increases in government child care assistance over the period have had no impact on the actual proportion of earnings that parents need to pay for child care. Alternatively, it may be argued that the government assistance has largely been absorbed by quality improvements, including, for example, improved staff to child ratios and more qualified staff.
In addition, wages of child care workers have for many years been increasing at a faster rate than CPI. The ABS Survey of Employee Earnings and Hours conducted every 2 years provides data on earnings and hours for detailed occupational classifications. There are some challenges resulting from changes in occupational classifications with the shift from the Australian Standard Classification of Occupations (ASCO) to the Australian and New Zealand Standard Classification of Occupations (ANZSCO) in 2006. Over the period from 2006-18 the average week total cash earnings of full-time non-managerial adult employee child care workers increased by 45.3 per cent and average hourly total cash earnings increased by 47.4 per cent.79 The increase in the wages of child care workers is substantially more than the 31.5 per cent increase in CPI over this period.80 Because wages are a substantial proportion of the costs of providing child care (wages in 2018-19 were around 60 per cent of child care revenue and about two-thirds of costs) (Richardson, 2019) and because the ability to find costs savings in other areas is limited, it means that it is almost inevitable that child care costs will increase at a faster rate than CPI.
4.3.5 Child care costs - summary
The average hourly fees being charged by child care centres increased in the 12 months following the introduction of the Child Care Package, and for Centre Based Day Care and Outside School Hours Care, the change in the 12 months following the changes to the child care system were very similar to the increases in the 12 months prior to the changes to the child care system. While there was an apparent very large increase in the hourly fees charged by for-profit Family Day Care providers, this reflects a change in the charging practices of these services from charging per session to charging per hour of care used, with an increase in the hourly fee charged and a reduction in the number of hours paid for. When this is taken into account, there appears to be little change in the fees being paid by families using for-profit Family Day Care services. For In Home Care where the program was substantially changed there has been a very large increase of 62.7 per cent in the hourly fee being charged in the 12 months following the child care changes.
The Australian Bureau of Statistics CPI data shows child care prices have been adjusted continuously since June 2018, child care CPI has increased by 7.0 per cent and the overall CPI by 1.7 per cent. By March 2020 almost three-quarters of the reduction in the child care CPI due to the Package had been lost. Child care costs as a proportion of average earnings are no higher now than they were in 1982.
4.4 Parental perceptions of affordability
This section reports data on parental perceptions of the affordability of child care using the DESE/ORIMA cross-sectional surveys of parents.81 As detailed earlier, there have been 4 waves of the DESE/ORIMA parents' survey: the first in June 2018 just before the changes to the child care system, which provides a baseline, and the other 3 in November 2018, June 2019 and November 2019, after the introduction of the Package.
This section draws on a number of questions in these surveys that provide an insight into perceptions of affordability. The initial focus is on parents' level of agreement or disagreement with the statement 'The cost of child care is affordable' - which was asked in all waves of the survey.
4.4.1 Parental perceptions of affordability
Parental perspectives on the affordability of child care are diverse, although on balance negative. In November 2019, 22.5 per cent of parents with a reference child aged under 5 years 'strongly disagreed' with the statement that the cost of child care was affordable, with a further 32.2 per cent 'disagreeing'. In contrast, only 24.6 per cent of these parents 'agreed' with the statement, and just 3.8 per cent 'strongly agreed' (Figure 47). Noticeable in the distribution is the degree of polarisation with just 16.8 per cent expressing a neutral position - that of 'neither agreeing nor disagreeing'. This pattern is also seen for parents with an identified reference child aged 5-13 years, although they were more likely to agree or strongly agree that child care was affordable than those with a younger reference child. Of parents with a reference child aged 5-13 years, 15.3 per cent 'strongly disagreed' and 25.6 per cent 'disagreed' with the statement that child care was affordable, 20.2 per cent stated that they 'neither agree nor disagree', 32.4 per cent 'agreed', and 6.5 per cent 'agreed strongly'.
On balance:
- Parents with a younger child (aged 0-4 years) were more likely to disagree that child care was affordable - with 54.7 per cent disagreeing compared with 28.4 per cent agreeing.
- Perspectives of parents with a youngest child using care aged 5 years and over were almost equally balanced, with 38.9 per cent agreeing it was affordable, and 40.9 per cent disagreeing. However, those expressing disagreement were twice as likely to report their disagreement as 'strong disagreement' compared to those agreeing who reported this as 'strong agreement'.
Figure 47: Parents' agreement that child care is affordable, distribution, November 2019
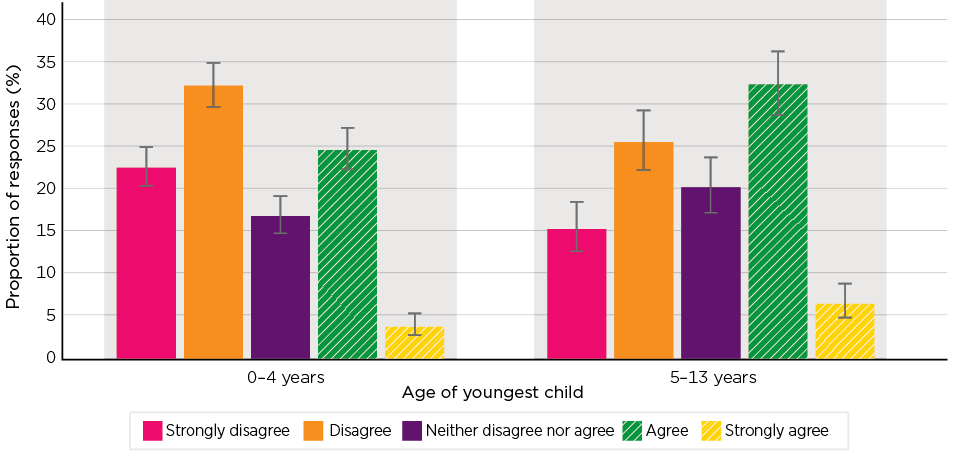
Notes: Parents with a reference child who is in identifiable formal child care. Error bars on the chart show the 95 per cent confidence interval.
Source: DESE/ORIMA Parent Survey, November 2019
There was some increase in the balance of parents who agreed that child care is affordable between the June 2018 survey, conducted just before the changes took effect, and November 2019. Figure 48 shows the mean score of disagreement/agreement with the statement that child care is affordable with a value of -2 for strongly disagree, -1 for disagree, 0 for neither agree nor disagree, 1 for agree and 2 for strongly agree.
For parents with a reference child aged under 5 years there is a clear and statistically significant increase in the mean score of agreement between June 2018 and the subsequent surveys, although the average remains below zero (the neutral score of neither agreeing nor disagreeing) and there is a slight downward trend from November 2018 to November 2019, although this is not statistically significant. A similar pattern is shown by the data in responses by parents with an older reference child, and while the mean rating is below the neutral zero in all time periods, the extent is much less than that for those parents with a younger child.
Figure 48: Parents' agreement that child care is affordable, by child age group, mean rating, June 2018 to November 2019

Notes: Parents with a reference child who is in identifiable formal child care. Error bars on the chart show the 95 per cent confidence interval. Responses scored: 'Strongly agree': +2; 'Agree': +1; 'Neither agree nor disagree': 0; 'Disagree': -1; 'Strongly disagree': -2.
Source: DESE/ORIMA Parent Survey, June 2018 to November 2019.
The November 2019 survey data suggests that the balance of parents' agreement on the affordability of child care statement is most negative for those with a reference child under 2 years of age (-0.51), followed by a reference child aged 2-4 years.
By type of care it is clear, see Figure 49, that parents who have a child in Centre Based Day Care have the lowest level of agreement that child care is affordable, with a statistically significant lower agreement than those in either Family Day Care and Outside of School Hours Care, and a statistically significant mean rating below zero indicating a tendency to disagreement. There are no statistically significant differences among other types of care on affordability, and no statistically significant difference from zero, meaning neither agree nor disagree.
Figure 49: Parents' agreement that child care is affordable, by type of care, mean rating, June and November 2019 pooled sample
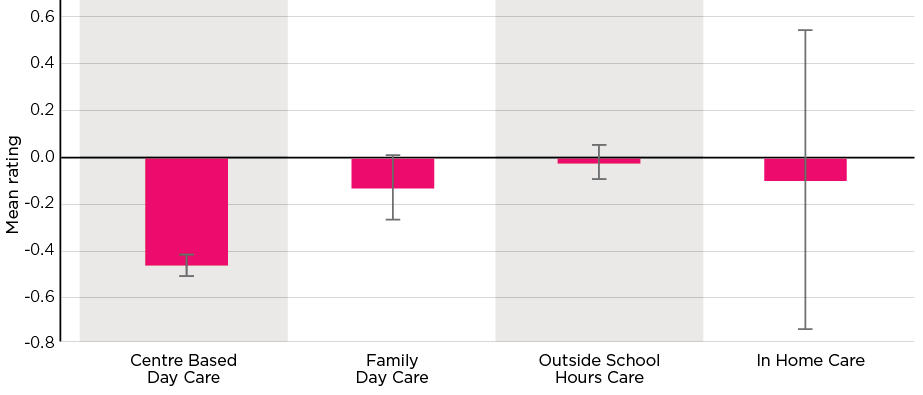
Notes: The June and November 2019 surveys have been pooled in order to reduce the sampling error. Parents with a reference child who is in identifiable formal child care. Error bars on the chart show the 95 per cent confidence interval. Responses scored: 'Strongly agree': +2; 'Agree': +1; 'Neither agree nor disagree': 0; 'Disagree': -1; 'Strongly disagree': -2.
Source: DESE/ORIMA Parent Survey, June 2018 to November 2019
Figure 50 presents the mean scores of agreement on the affordability of child care by family labour force type for June 2018 and November 2019. Considering, first, the November 2019 data, the highest negative average rating, -0.58, was recorded for couple families with both members employed full-time, with this being significantly different to all couple families, other than those with nil employment and all groups of single parents. None of the other differences, either between the different groups of single parents, or within couples, were significant at the 95 per cent confidence level.
With respect to changes over time, all groups, except for couples with no recorded employment, had higher levels of agreement with the statement that child care was affordable in November 2019 than in June 2018. For 4 of these groups the changes were statistically significant. These were single parents with part-time employment, single parents with no employment and couples with one employed full-time and one part-time employed, and those with just one member employed full-time.
Figure 50: Parents' agreement that child care is affordable, by parents' employment status, mean score, June 2018 and November 2019
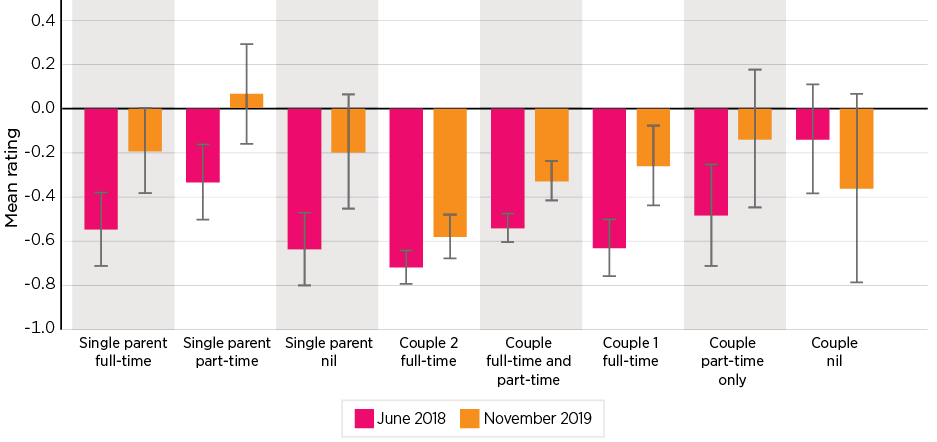
Notes: Parents with a reference child who is in identifiable formal child care. Responses scored: 'Strongly agree': +2; 'Agree': +1; 'Neither agree nor disagree': 0; 'Disagree': -1; 'Strongly disagree': -2. Refer to Figure 10 for family labour force classification. Error bars on the chart show the 95 per cent confidence interval.
Source: DESE/ORIMA Survey June 2018 and November 2019
As noted in the introduction, and considered later in this chapter, the introduction of the Child Care Package was expected to have a range of diverse impacts on the affordability of child care, dependent on family income. The changes to the system were expected to reduce the level of subsidy provided to higher income parents and, all else being equal, thus to reduce affordability. For middle income parents the changes were expected to increase the level of subsidy, and for lower income parents, to increase the level of subsidy for those who met the new activity test.
Figure 51 shows the mean score of the affordability question by gross family income using the June 2018 and November 2019 data. Between June 2019 and November 2019 there was, on average, a perception of an improvement in the affordability of child care for those income groups below an income of $170,000 per annum. Specifically, for all categories of families the overall rating given to affordability was negative:
- The 6.6 per cent of families82 with a reported income of less than $30,000 per annum reported an improvement of 0.13 of a response category. This was not statistically significant.
- A large and statistically significant 0.40 of a response category gain was reported by the 22.5 per cent of families with reported gross incomes of $30,000 to $65,000.
- A lesser, but still marked and statistically significant, gain of 0.24 of a response category was reported by those with incomes of $65,000 to $125,000 who accounted for 54.9 per cent of families.
- A small and statistically insignificant increase of one tenth of a response category was reported by the 11.2 per cent of families with incomes of $125,000 to $170,000 per annum.
- In contrast, the other 3 income groups which account for just 5 per cent of the population of parents in the survey, reported a worsening of their perception of the affordability of child care, with this being around 0.35 of a response category for the 2 higher income ranges. None of these changes were statistically significant.
Figure 51: Parents' agreement that child care is affordable, by gross family income, mean score, June 2018 and November 2019
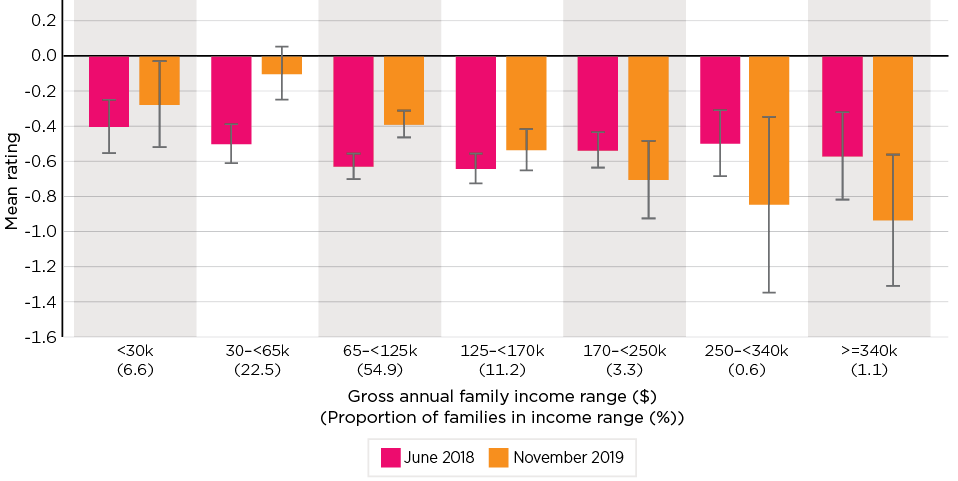
Notes: Parents with a reference child who is in identifiable formal child care. Responses scored: 'Strongly agree': +2; 'Agree': +1; 'Neither agree nor disagree': 0; 'Disagree': -1; 'Strongly disagree': -2. Error bars on the chart show the 95 per cent confidence interval.
Source: DESE/ORIMA Parent Survey, June 2018 and November 2019
While this suggests that, on average, families in the income classifications up to $170,000 were more likely to report that child care was affordable (or in fact be less likely to report it was not affordable) in November 2019 than they did in June 2018, it is emphasised that this is, however, an average for these groups and not the experience of all families within the income classification.83 The distribution of outcomes is considered further below.
4.4.2 Parents' assessment of financial impact of the Package and value for money
When asked in the June 2019 Parent Survey specifically about whether they were financially better off under the CCS compared to the old system,84 almost half (46.1 per cent) of those parents with a child identified as being in care neither agreed nor disagreed, and slightly more agreed that they were better off (5.5 per cent strongly agreed and 25.0 per cent agreed) than disagreed (14.0 per cent disagreed and 9.5 per cent strongly disagreed). Consistent with the pattern of changes in self-assessed affordability by income group discussed above, those in lower income households, as shown in Figure 52, were more likely to agree that they were better off under the CCS compared to those from higher income households.
Views on the impact of the new subsidy are dispersed within each of the income bands, although the balance varies considerably. In the lowest income range, up to $30,000, the number of positive responses, 34.3 per cent, significantly outweighs the 12.5 per cent negative answers. This balance, although diminishing, continues up to the $65,000 to $125,000 bracket, where while 33.3 per cent still express agreement that they are better off, the proportion expressing disagreement increased to 19.2 per cent. These proportions are almost reversed in the $125,000-$170,000 grouping, with just 20.5 per cent expressing agreement, and 34.1 per cent disagreement. This pattern continues until, in the very high income group, that is families with an income of over $340,000 per year, 86.7 per cent report disagreement and just 2.0 per cent agreement.
Figure 52: Parents' agreement 'I am better off under the new CCS than under the old CCB/CCR', by gross family income, November 2019
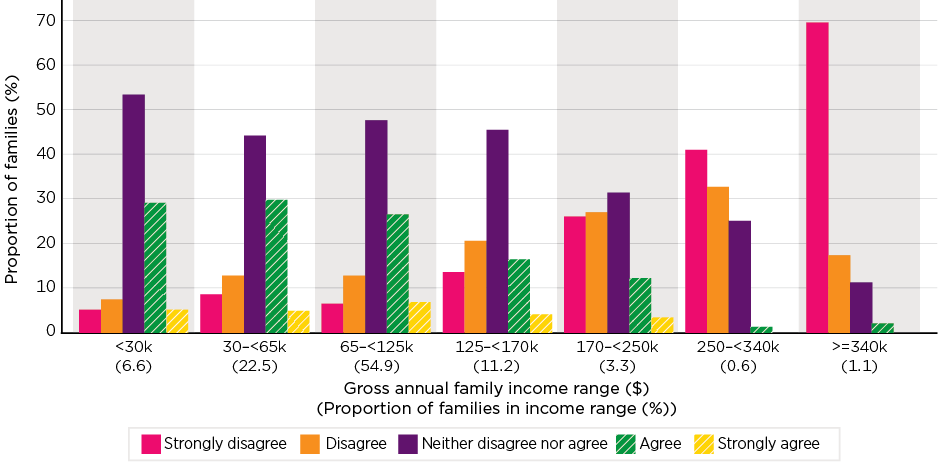
Notes: Parents with a reference child who is in identifiable formal child care. Population restricted to those who has used paid child care prior to 2 July 2018.
Source: DESE/ORIMA Parent Survey, June 2018 and November 2019
Overall, single parents were more positive about being better off under the new arrangements, with 36.3 per cent agreeing that they were, as opposed to 17.2 per cent disagreeing. Couples were more evenly divided, with 29.3 per cent agreeing, and 25.0 per cent disagreeing.
A further question that provides some insight into the wider question of affordability was asked in the last 3 waves of the survey. This was whether parents considered the child care that they were using provided good value for money. As this question was not asked prior to the introduction of the Package, it is not possible to investigate whether the new arrangements have impacted this aspect. While, as shown in Figure 53, there was a slight decline in the mean score given by parents who were using child care to this question over the 3 surveys for which information is available, none of the differences between the survey waves were statistically significant. The level of the mean score indicates a level of agreement with the statement well above neutral, and tending towards agreement.
Figure 53: Parents' satisfaction with child care, providing good value for money, November 2018 to November 2019
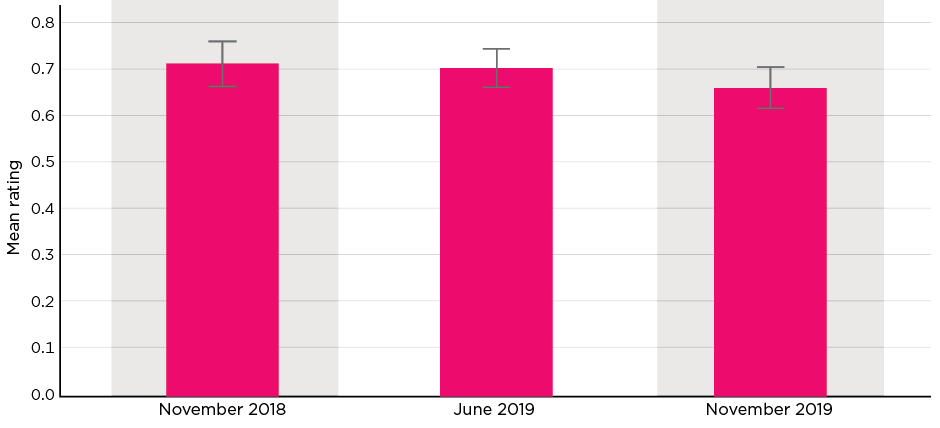
Notes: Parents with a reference child who is in identifiable formal child care, refers to satisfaction of the reference care of the reference child. Responses scored: 'Strongly agree': +2; 'Agree': +1; 'Neither agree nor disagree': 0; 'Disagree': -1; 'Strongly disagree': -2. Error bars on the chart show the 95 per cent confidence interval.
Source: DESE/ORIMA Parent Survey November 2018 to November 2019
Child care costs as a barrier
In June 2019, those parents who did not use child care were asked to rate their agreement with statements relating to possible reasons for their not using child care. One of these was 'I did not use paid child care since July 2018 because it was difficult to meet the cost of child care'. Overall, 62.2 per cent of those not using child care who gave a response to this question agreed that one of the reasons they were not using child care was that it was difficult to meet the cost of care. Another 15.2 per cent disagreed with the statement, and 22.5 per cent said they neither agreed nor disagreed.85 Some caution is required in interpreting these results, as many of the respondents gave multiple reasons, and it is not possible to identify from the survey the extent to which this can be seen as a barrier or just one of a number of factors that may limit their use of child care. More detailed analysis of the role of child care as a barrier to employment is undertaken in Chapter 8.
4.4.3 Parental perceptions of affordability - summary
On balance, parents have viewed affordability negatively, with this being more marked among those with younger children. While it is clear that many consider that they have benefited from the Package, others perceive a negative impact. Overall, the data collected from parents points again, on balance, to a positive outcome, with this being seen in terms of trends in the proportion of parents who consider child care is affordable; and in parents' perception of whether the introduction of the Child Care Package has resulted in them being better off. The data points to more positive outcomes for single parents, relative to couples, and for lower and middle income households, relative to those on higher incomes. For this latter group, the evidence points to declining affordability.
4.5 Modelled impact of changes to the child care system on affordability for families
The following sections report on the results of the microsimulation modelling of how the Child Care Package (CCS and ACCS) has impacted the amount of child care benefits received by families, relative to what would have been received under the former funding arrangements (CCB including Grandparent and Special, Child Care Rebate and JETCCFA) and the impact this had on net child care costs, and net child costs as a proportion of income, which are the key measures of affordability.
The modelling of affordability was undertaken on a financial year basis, given that income is required to be reconciled at the end of the financial year86 and that some of the key parameters of the CCB/CCR and CCS/ACCS systems are based on use of child care and/or amount of subsidy received over the full financial year. Additionally, the use of whole year data provides a better estimate of actual child care usage by a family.
4.5.1 Overview of microsimulation methodology
Microsimulation models allow the amount of government benefits received by individual families and households and the amount of tax paid to be modelled and for the impacts of changes to the rules of the government benefit and taxation system on the amounts of benefits received or paid by individual households to be calculated. Microsimulation models are based on administrative or survey data that represents the underlying population of interest (termed 'the base file') and allow population level results to be produced, as well as results for different population subgroups, by income or other characteristics.
Choice of base file
As described in Chapter 1 and Section 4.1.2, this evaluation uses microsimulation models that are based on 2 sources of population base files. The first source is the Department of Education, Skills and Employment administrative data from the child care system. The second base file is the Australian Bureau of Statistics Survey of Income and Housing. For the analysis of the child care system administrative database file a purpose built microsimulation model of the CCB/CCR system and the CCS/ACCS has been built. This model incorporates all of the key components of the child care payment system. The analysis of the Survey of Income and Housing population base file was undertaken using the ANU Centre for Social Research and Methods microsimulation model PolicyMod.
- There are 2 options of base file for the administrative data: the 2017-18 (old world base file); and 2018-19 (new world base file). The analysis of affordability presented here has been undertaken using the 2018-19 base file. The reasons for this choice are:
- The 2017-18 administrative database file does not include the detailed activity data required in order to model the amount of CCS that families would have been eligible for
- Analysis of the files suggests there are significant limitations in the reporting of family income, with many of the estimates relating to previous year information.87
- The 2018-19 administrative data allows, in principle, estimates of the impact of the changes on all families who were in the child care system in 2018-19. It does not include families who left the child care system between 2017-18 and 2018-19 due to the changes to the activity test88 and high income families who left the child care system due to the greater level of means testing of the CCS.89
- In order to test the robustness of the results to the choice of the 2018-19 base file, the impact of the Child Care Package has also been modelled using the 2017-18 base file, notwithstanding these known limitations. While there are differences in the modelled impact of the Child Care Package on affordability as modelled on the 2017-18 population base file relative to the 2018-19 population base file, the overall impact and the impacts according to income level are similar and the evaluation findings are robust to the choice of year population base file.
Use of reconciled income
The amount of child care payments made to families each fortnight is based on their estimated adjusted taxable income for the current financial year that they have provided to Centrelink. At the end of the financial year, once their taxable income is known and any adjustments made to arrive at their adjusted taxable income, then their actual child care payment entitlement for the year is assessed and any adjustment made, which can include an additional payment being made if they have received less than they are entitled to or a debt that must be repaid. In order to reduce the risk of families incurring debts and to limit the size of any child care payment debts that are incurred, under the CCS policy 5 per cent of their benefit is withheld and paid after the annual reconciliation process.
Because the process of submitting and assessing tax returns can take some time, reconciled income is available for about three-quarters of families. We used reconciled income when available and if not available the best available unreconciled income variable is used in the modelling.
The modelling task
As indicated in the introduction, the modelling task is that of a first round static comparison of the impact of the different subsidy arrangements that existed under the former CCB/CCR structure and that which applies under the Package. As such the modelling:
- does not take account of any changes in labour force participation and child care use as a result of the Package
- does not take account of any changes in child care costs.
The rationale for this approach is that the focus of the analysis is on the impact of the funding arrangements and that attempting to capture any of the dynamics associated with the above 2 effects is problematic. As explored in Chapter 8, not only are net changes in labour very small, but there are quite diverse changes, with some families increasing their reported level of participation and others decreasing. Attempting to ascribe these experiences to the base file brings with it a large risk of the results being as much a reflection of the adjustment process as the actual changes in the subsidy arrangements. Similarly, as seen in Chapter 6, not only does the immediate transition analysis not point to any major shift in participation but also there is a strong child age gradient to child care usage that makes the measurement of changes in usage in a longitudinal sense difficult to ascertain. Similarly, any attempt to take account of changing child care fees requires the construction of a counterfactual of how fees would have changed in the absence of the introduction of the Package. As discussed in Section 4.3, there is no clear pattern of change in fees associated with the Package, rather a diverse set of changes have been recorded across sectors, locations and types of providers.
Benchmarking expenditure
An important test of the performance of the modelling of the child care payments is to compare the total modelled expenditure with the actual expenditure reported on the child care administrative data file and with total expenditure as reported in the Portfolio Budget Statements.
The total modelled expenditure using reconciled income data is $7,682 million, which is 99.4 per cent of estimated actual expenditure of $7,725 million reported in the Departmental Portfolio Budget Statement. The expenditure on CCS/ACCS on the administrative data file, which reflects the actual pre-reconciliation entitlement, is $7,731 million (Table 36).
| Expenditure estimate source | 2018-19 expenditure estimate |
|---|---|
| 2018-19 Actual expenditure from administrative data file a | $7,731 million |
| 2018-19 Modelled expenditure (CCS/ACCS) from administrative data file, reconciled income a | $7,682 million |
| 2018-19 Estimated actual expenditure b | $7,725 million |
Sources: a DESE/Services Australia child care and payment system administrative data; b Portfolio Budget Statements 2019-20 Education and Training Portfolio. Commonwealth of Australia, Canberra.
Figure 54 reports the actual and modelled total amount of CCS received by each income vigintile. There are no systematic differences between actual and modelled amounts of benefits received by income vigintile suggesting that at an aggregate level the modelled amounts of CCS are not substantially upward or downward biased for any of the income groups.
Figure 54: Actual and modelled expenditure on the CCS, by income vigintile, 2018-19
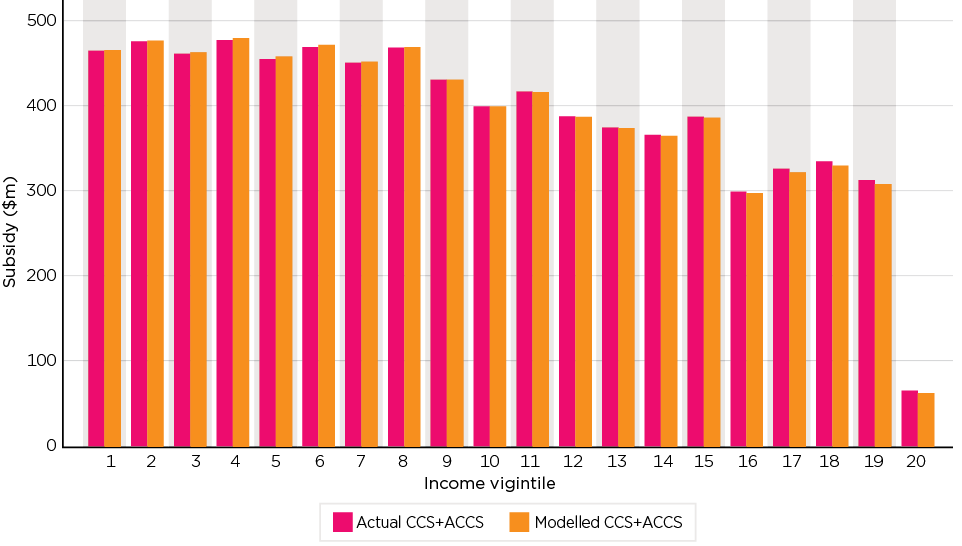
Notes: Modelled expenditure is based on the unreconciled income as reported to Centrelink. See Table 39 for the income ranges that apply to each income vigintile.
Source: Evaluation modelling using 2018-19 administrative database file
Figure 55: Families, distribution of absolute difference between modelled and actual annual CCS, 2018-19
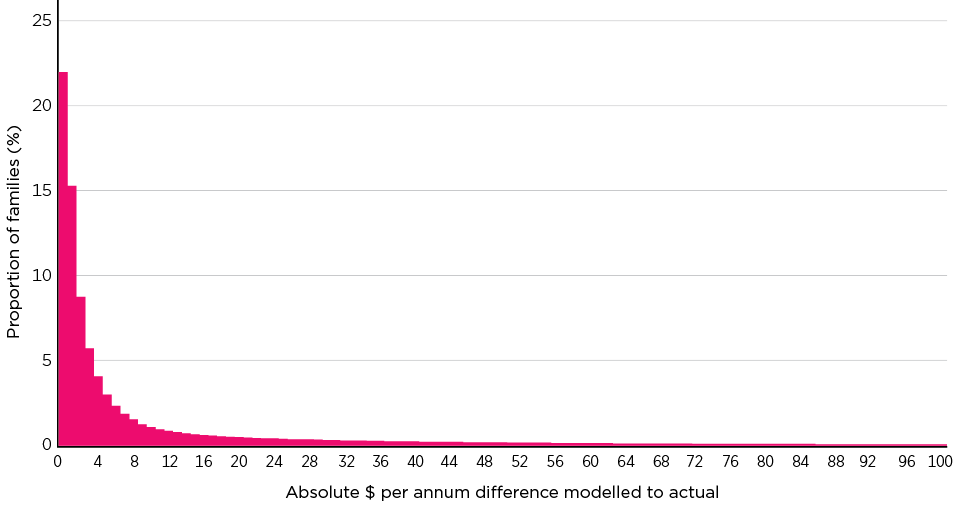
Notes: Modelled CSS is based on the unreconciled income as reported to Centrelink.
Source: Evaluation modelling using 2018-19 administrative database file
The absolute difference between modelled and actual annual CCS is shown in Figure 55. It is apparent that for the majority of families, the difference in dollar terms is very small with 66.9 per cent within $10 and 73.7 per cent within $20. Examination of the distribution of the absolute percentage difference between modelled and actual CCS shows that for 70.7 per cent of families the difference is zero or very close to zero, 90.2 per cent of modelled CCS is within 2 per cent of actual CCS and 95.3 per cent is within 5 per cent (Figure 56).
Figure 56: Families, distribution of percentage difference between modelled and actual annual CCS, 2018-19

Notes: Modelled CCS is based on the unreconciled income as reported to Centrelink.
Source: Evaluation modelling using 2018-19 administrative database file
4.5.2 How the changes impact families
Before considering the detailed modelling results, it is useful to examine how the patterns of differences between the subsidy outcomes under the old CCB/CCR and the new CCS/ACCS systems relate to changes in family circumstances. This is considered below through a number of cameos that have been selected to demonstrate some of the different relative outcomes that can be experienced.
Cameo examples
This section uses some cameo family examples to illustrate the impact of the Child Care Package on the amount of child care benefits received as the number of hours of care used varies, the family income increases and the hourly fee paid increases. All cameos are for Centre Based Day Care and assume hours per week are indicative of annual day care use.
Cameo families for hours of care used
Cameo 1
A single parent Sue who has 2 children aged under 5 years using Centre Based Day Care. Sue is not working and has no recognised activity. She receives Parenting Payment Single and has an income of $35,600 per annum.
Cameo 2
Priya and Deepak have one child under 5 years using Centre Based Day Care. Their family income is $140,000 per annum. Both Priya and Deepak are working full-time (activity hours 80 per fortnight).
Cameo 3
Marianne and Nandoor have 2 children under 5 years using Centre Based Day Care. Marianne works full-time and Nandoor works part-time (activity hours of 40 hours per fortnight). They have a family income of $110,000 per annum.
Cameo 4
Mohammed and Sofia are a couple with 2 children using Centre Based Day Care. Mohammed is working full-time and Sofia works part-time (activity hours 40 hours per fortnight). Their family income is $380,000 per annum.
For each scenario the difference in benefits is modelled for hours of care over the range of 1 to 45 hours per week (per child). For reasons of simplicity, it is assumed that in families with multiple children in child care, the pattern and numbers of hours of care used by each child is the same. The child care fee paid is $10 per hour.
Figure 57 shows the impact of the Child Care Package on the amount of benefit received by each cameo family as the hours of care paid for increases. It is clear that the relationship between the number of hours of care paid for and the impact of the child care changes on the amount of benefits received is complex and depends on family income and hours of approved activity.
Specifically, the cameos show:
- For the single parent with a low income from income support (Cameo 1), they obtain a gain under CCS that increases in a linear fashion as hours of care increase. At 20 hours of care per week they are $52.40 per week better off.
- For the couple with both working full-time and a little above average income (for child care using population) (Cameo 2), they obtain a gain under CCS that increases as number of hours of care increases and the gains increase at a faster rate from about 33 hours of care per week.
- For the couple with one working full-time and one part-time and an average income (Cameo 3), they gain under CCS for all hours of care up to 42 hours per week. The gain reaches a maximum at 36 hours of care per week and then starts to decline and they are worse off under CCS for 42 hours or more of care per week.
- For the very high income family with one parent working full-time and the other part-time, they are worse off under CCS compared to the previous CCB/CCR system and the amount they are worse off increases to reach a maximum of $298.38 per week at 30 hours of care per week and then they continue to be worse off by this amount up to 45 hours of care per week.
Figure 57: Modelled impact of Child Care Package on child care payments received, by hours of care paid for per week, cameo families 1 to 4, 2018-19
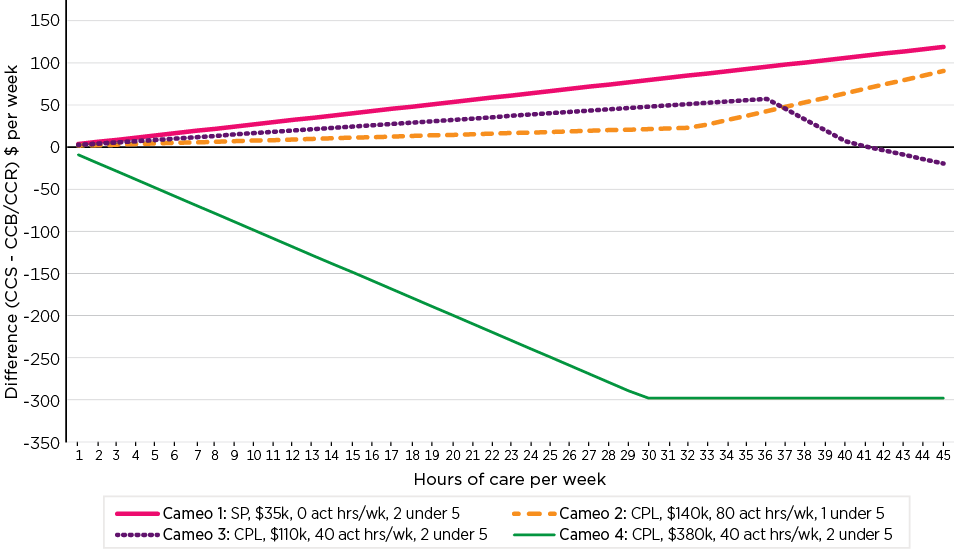
Notes: SP - Single parent; CPL - couple parent family; 'act hrs/wk' - activity hours per week; 1 under 5 - one child using care under 5 years of age; 2 under 5 - 2 children using care under 5 years of age.
Source: Derived using ANU developed microsimulation model of the child care system
Cameo families for family income
Cameo 5
A single parent Cecilia has 2 children aged under 5 years using Centre Based Day Care. Cecilia is a full-time student and has 100 hours of approved care per fortnight. She is using 15 hours of care per week and the child care fee is $10 per hour. This scenario represents income increasing as Cecilia moves into employment.
Cameo 6
Nathan and Amélie have one child under 5 years using Centre Based Day Care. They are both working full-time (activity hours 80 per fortnight). They use 40 hours of care per week and the child care fee is $10 per hour.
- For the single parent whose income increases as she transitions from full-time education into work (Cameo 5), she receives more under CCS, and the additional amount increases to reach a maximum at an income of around $70,000 (Figure 58). As her income increases beyond this the amount of additional child care subsidy received under CCS declines, and for incomes from around $180,000 to around $250,000 she receives the same amount under the new and old system. As her income increases beyond $250,000, she is worse off under CCS.
- For the couple both working full-time and using long hours of paid care (Cameo 6), they are better off under CCS for incomes up to about $280,000. The amount they are better off is similar for incomes up to about $250,000 and then it starts to fall very gradually. For incomes in excess of about $280,000 they are worse off under CCS, and the amount they are worse off increases until an income of about $360,000 is reached.
Figure 58: Modelled impact of Child Care Package on child care payments received, by family income, cameo families 5 and 6, 2018-19

Notes: SP -Single parent; CPL- couple parent family; 'act hrs/wk' - activity hours per week. 1 under 5 - one child using care under 5 years of age; 2 under 5 - 2 children using care under 5 years of age.
Source: Derived using ANU developed microsimulation model of the child care system
Cameo family for hourly fee
Cameo 7
Akamu and Ātaahua have one child under 5 using Centre Based Day Care. They both work full-time (activity hours 75 per fortnight) and have a family income of $110,000 per annum. They use 25 hours of care per week.
Cameo 7 illustrates how the net gain varies as the hourly fee varies. For the slightly above average income couple earning $110,000 per annum, their gain under CCS increases as the hourly fee increases to reach its maximum at the relevant hourly fee rate cap ($11.77) (Figure 59). The gain then decreases as the hourly fee increases, and for increases in the hourly fee in excess of $14 per hour, the gain under CCS remains constant.
Figure 59: Modelled impact of Child Care Package on child care payments received, by hourly fee paid, cameo family 7, 2018-19
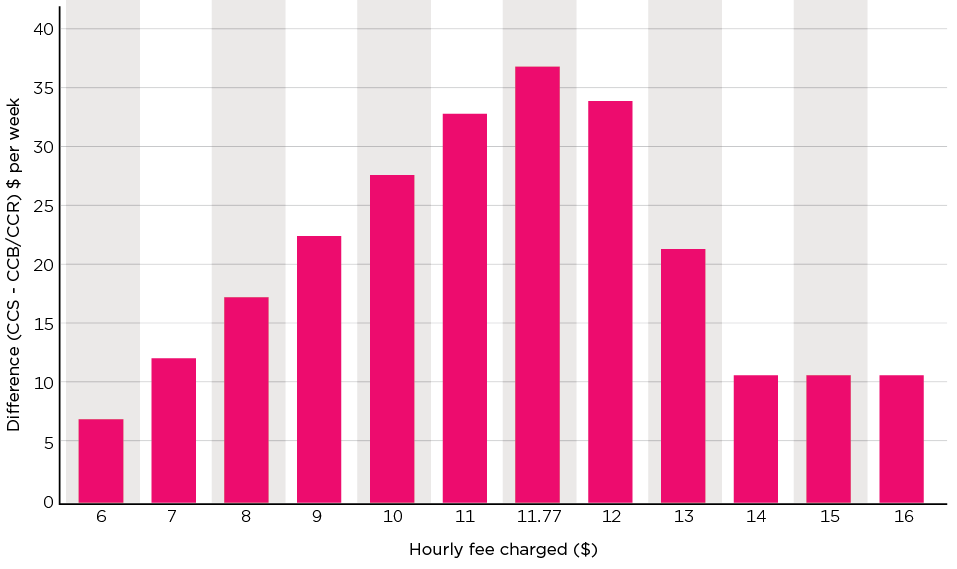
Source: Derived using ANU developed microsimulation model of the child care system
4.5.3 Overall impact of the Child Care Package on affordability
This section presents the results of the microsimulation modelling of the impact of the child care changes on affordability using the 2018-19 administrative data population base file.
4.5.4 Comparison of impacts on affordability using the 2017-18 and 2018-19 administrative data
For the reasons outlined above there are likely to be differences in the estimates of the impacts of the changes on affordability between the modelling based on the 2017-18 and 2018-19 administrative data. This section reports on the overall estimates of the impact of the changes on affordability and how the impacts differ by income level using the 2 administrative database files.
Table 37 shows the actual fees charged, adjusted taxable income, modelled benefits, net cost of child care and net cost of child care as a percentage of income under the CCB/CCR (2017-18) and CCS (2018-19) policies. Across all families using the child care system, the modelling estimates that average child care subsidies would have been $6,305 under the CCB/CCR policy and $6,786 per annum under the CCS policy, which is an increase of $481 or 7.6 per cent higher under CCS than under the CCB/CCR policy. This results in the net cost of child care falling from $4,875 to $4,394 per annum and the net child care costs as a percentage of gross family income falling from 5.2 per cent to 4.1 per cent.
The mean increase in benefits and reduction in child costs is greater than the median change. Given that the amount of child care subsidies were increased very substantially, the median arguably provides a better indication of the impact of the Child Care Package on the typical family. Median benefits under the CCB/CCR system would have been $4,892 per annum and under the CCS system were slightly lower at $4,807. While median benefits fell slightly, the median net cost is lower under the CCS system than it would have been under the CCB/CCR system (as the median total cost of child care is lower than the mean), falling from $2,957 per annum to $2,507 per annum and as a percentage of gross family income from 3.0 per cent to 2.7 per cent. The fall in net costs of child care is greater at the 75th percentile (reduction of $741 per annum) than at the 25th percentile (reduction of $103 per annum). This distribution is considered in more detail below.
| Fees ($pa) | Total child care benefits ($ pa) | Net cost ($ pa) | Net cost (% income) | Adjusted Taxable Income ($ pa) | ||||
|---|---|---|---|---|---|---|---|---|
| CCB/CCR policy | CCS policy | CCB/CCR policy | CCS policy | CCB/CCR policy | CCS policy | |||
| Mean | 11,180 | 6,305 | 6,786 | 4,875 | 4,394 | 5.2 | 4.1 | 131,267 |
| Median | 8,155 | 4,892 | 4,807 | 2,957 | 2,507 | 3.0 | 2.7 | 113,926 |
| 25th percentile | 2,794 | 1,614 | 1,368 | 973 | 870 | 1.0 | 1.0 | 60,986 |
| 75th percentile | 16,627 | 9,104 | 10,124 | 6,588 | 5,847 | 6.4 | 5.4 | 170,939 |
Source: Evaluation modelling using 2018-19 administrative database file assuming constant 2018-19 child care costs and usage
It is estimated that total government expenditure on child care payments would have been $7,229 million under the old CCB/CCR system, thus the modelled increase in expenditure due to the CCS changes is $453 million per annum, which is an increase of 6.3 per cent.
| Model | Estimated expenditure |
|---|---|
| 2018-19 modelled expenditure (CCS/ACCS) from administrative data file, reconciled income | $7,682 million |
| Estimate of what expenditure would have been had old system (CCB/CCR) applied in 2018-19 | $7,229 million |
| Estimated increase in expenditure due to CCS changes | $453 million |
Source: Evaluation modelling using 2018-19 administrative database file assuming constant 2018-19 child care costs and usage
Net impact across the population
In terms of the distribution of outcomes, the modelling suggests that 29.2 per cent of, or about 323,000, families receive a lower subsidy under the CCS than they would have received than under CCB/CCR, 8.6 per cent of, or about 95,000 families would have had the same net cost of child care under both policies,90 and 62.2 per cent of families, that is about 686,000 families, received more child care subsidy (Table 39).
For this majority of families who receive a higher subsidy under the Child Care Package, the mean net cost of child care falls from 6.7 to 4.5 per cent and the median net costs falls from 4.4 to 3.2 per cent. Those who received less subsidy have much higher incomes than those who receive more subsidy (mean income of $177,240 compared with $95,848 per annum). Those who were unaffected had a mean adjusted taxable income of $170,406 per annum.
For those who received less from CCS than they would have under CCB/CCR, the mean net cost of child care increases from 2.9 to 4.0 per cent of income and the median costs increase from 1.5 to 2.1 per cent (Table 39).
| Annual Fees ($ pa) | Total child care benefits ($ pa) | Net cost ($ pa) | Net cost (% income) | Adjusted Taxable Income ($ pa) | ||||
|---|---|---|---|---|---|---|---|---|
| CCB/CCR policy | CCS policy | CCB/CCR policy | CCS policy | CCB/CCR policy | CCS policy | |||
| Negative impact (322,672 families) | ||||||||
| Mean | 8,790 | 4,747 | 3,486 | 4,043 | 5,304 | 2.9 | 4.0 | 177,240 |
| Median | 5,160 | 2,974 | 1,714 | 1,941 | 2,727 | 1.5 | 2.1 | 161,844 |
| Unaffected (94,712 families) | ||||||||
| Mean | 9,607 | 5,260 | 5,256 | 4,348 | 4,351 | 2.8 | 2.8 | 170,406 |
| Median | 7,500 | 4,103 | 4,100 | 3,161 | 3,161 | 2.0 | 2.0 | 186,439 |
| Positive impact (686,305 families) | ||||||||
| Mean | 12,848 | 7,436 | 8,822 | 5,412 | 4,026 | 6.7 | 4.5 | 95,848 |
| Median | 10,176 | 6,382 | 7,229 | 3,472, | 2,436 | 4.4 | 3.2 | 94,000 |
Source: Evaluation modelling using 2018-19 administrative database file assuming constant 2018-19 child care costs and usage
4.5.5 Impacts of child care policy change by income level
This section provides a more detailed analysis of the impact of the child care policy changes on the amount of child payment received and the costs of child care to families by income level. The analysis is presented for each 5 per cent of the gross family income distribution (income vigintiles).
Figure 60 shows the median modelled amounts of child care subsidies received under CCB/CCR (old policy settings) and under CCS (new policy settings) by income level. The figures also show the modelled subsidy as a percentage of fees paid (subsidy rate). The higher the subsidy rate the lower the proportion of fees that families pay.
The median benefits are higher under CCS than CCB/CCR up to and including the 14th income vigintile (a gross family income of up to $157,335 per annum). For the 15th income vigintile there is very little difference in the amount received under CCS as compared to CCB/CCR, and for the 16th income vigintile upwards the amount received under CCS is lower than that received under CCB/CCR, and the difference increases with income. For the 20th income vigintile (an income of $308,189 or more), the median amount of CCS received is zero compared to the $1,365 that would have been received under CCB/CCR. The median subsidy expressed as a percentage of fees is higher under CCS than under CCB/CCR for incomes up to income vigintile 14. The subsidy percentage under CCS is fairly stable for income vigintiles 1-4 (around 83 per cent) and then starts to fall as income increases. For the highest income vigintile the median subsidy percentage under CCB/CCR is 50 per cent compared to zero under CCS.
Figure 61 shows the mean child care subsidies and subsidy percentages modelled under CCS and CCB/CCR. The mean benefits under CCS are higher further up the income distribution than median benefits, with the mean CCS being higher up to and including income vigintile 15. There is virtually no difference between the amount of subsidy received under CCS and CCB/CCR for income vigintiles 16, 17 and 18. The mean amount of CCS received is lower than CCB/CCR for income vigintile 19 and is substantially lower for income vigintile 20 ($790 compared to $3,698).
The conclusions that are drawn from consideration of the mean child care subsidies are similar to those drawn from consideration of the median child care subsidies, although the median subsidy percentages under CCS are substantially higher than the median subsidy percentages under CCB/CCR up to the 14th income vigintile.
Figure 60: Median child care subsidies and subsidy rate under CCB/CCR policy and CCS policy, by family gross income vigintile, 2018-19
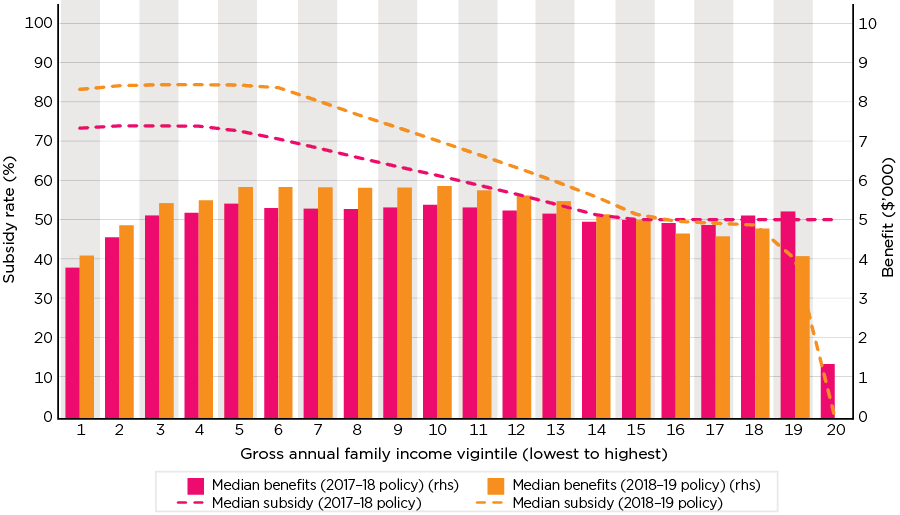
Notes: See Table 40 for the income ranges that apply to each income vigintile.
Source: Evaluation modelling using 2018-19 administrative database file assuming constant 2018-19 child care costs and usage
Figure 61: Mean child care subsidies and subsidy rate under CCB/CCR policy and CCS policy, by family gross income vigintile, 2018-19
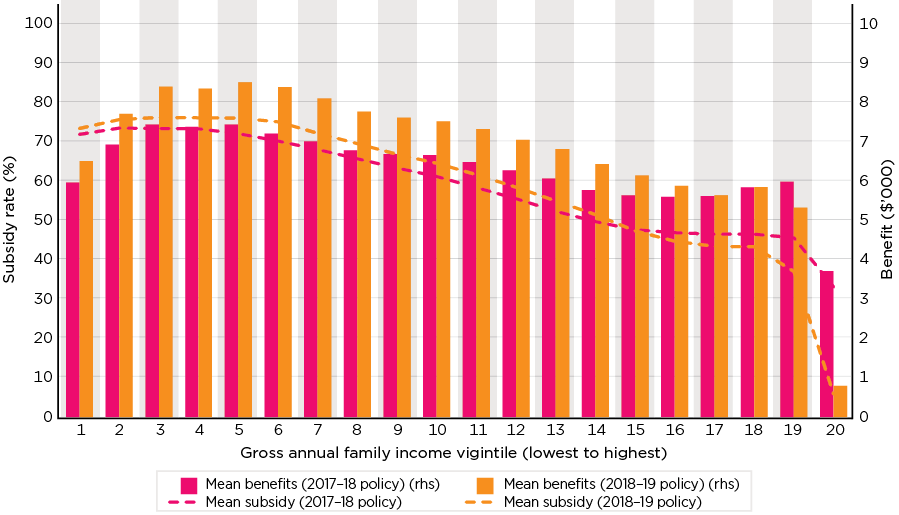
Notes: See Table 40 for the income ranges that apply to each income vigintile.
Source: Evaluation modelling using 2018-19 administrative database file assuming constant 2018-19 child care costs and usage
Figure 62 shows the difference in median child care subsidies and difference in subsidy percentage under CCS compared to under CCB/CCR by income vigintile and Figure 63 shows the mean values in order to highlight the impact of the Child Care Package. The difference in both the median and mean values shows that there are gains in the amount of child care subsidies received under CCS well up the income distribution and it is only for the highest 2 income vigintiles that the amount of CCS received is lower than what would have been received under CCB/CCR. This is reflected in the subsidy rate with higher subsidies well up the income distribution. The mean subsidy rate is affected by outliers and so on balance our judgement is that the median provides the best indication.
Figure 62: Difference in median child care subsidies and child care subsidy percentage under CCS and CCB/CCR policies, by family gross income vigintile, 2018-19
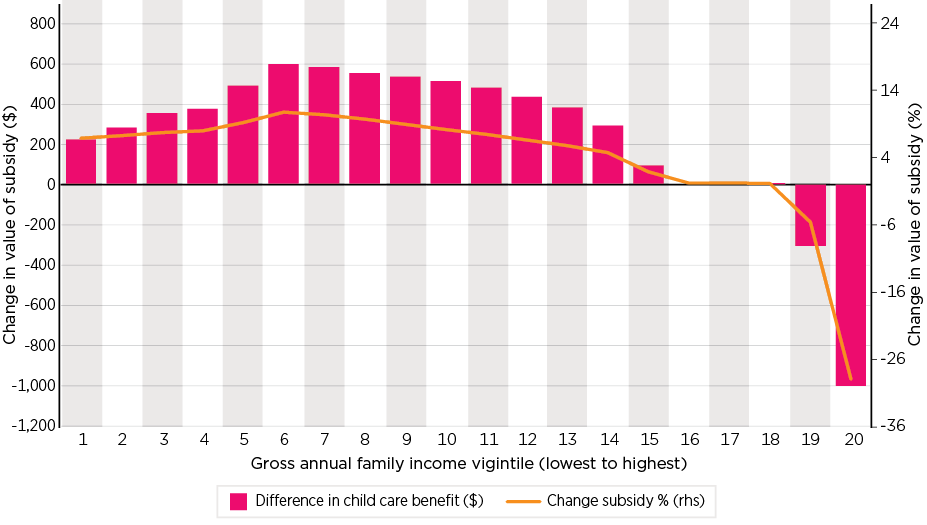
Notes: See Table 40 for the income ranges that apply to each income vigintile.
Source: Evaluation modelling using 2018-19 administrative database file assuming constant 2018-19 child care costs and usage
Figure 63: Difference in mean child care subsidies and child care subsidy percentage under CCS and CCB/CCR policies, by family gross income vigintile, 2018-19
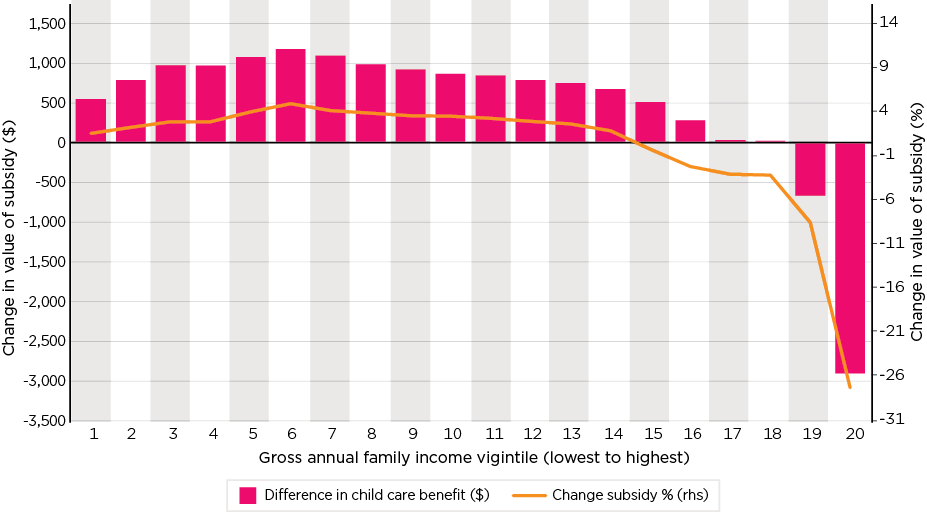
Notes: See Table 40 for the income ranges that apply to each income vigintile.
Source: Evaluation modelling using 2018-19 administrative database file assuming constant 2018-19 child care costs and usage
Figure 64 shows the ratio of mean and median modelled CCS compared to CCB/CCR by income vigintile. For the lowest income vigintile mean, benefits under CCS are 109.1 per cent of the benefit that would have been received under CCB/CCR. It reaches a maximum of 116.3 per cent for income vigintile 6 and then remains above 110 per cent up to and including income vigintile 14. The fall in benefits is very substantial for the highest income vigintile, with mean benefits under CCS being 21.4 per cent of the benefit that would have been received under the CCB/CCR policy settings.
Figure 64: Child care subsidies under CCS relative to child care subsidies under CCB/CCR, mean and median, by family gross income vigintile, 2018-19
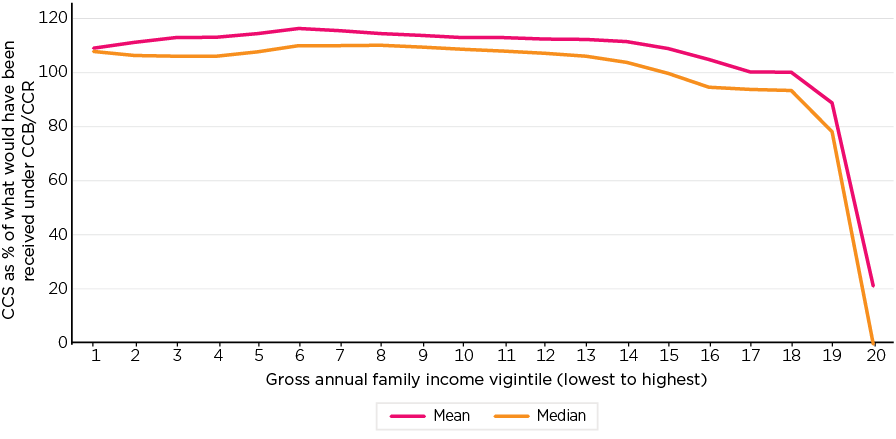
Notes: See Table 40 for the income ranges that apply to each income vigintile.
Source: Evaluation modelling using 2018-19 administrative database file assuming constant 2018-19 child care costs and usage
Child care costs as a proportion of gross family income
Reflecting the analysis presented in Figure 60, median net child care costs as a proportion of family gross income are lower under the new CCS policy relative to CCB/CCR policy for all income vigintiles up to and including income vigintile 14 ($145,226-<$157,335), with effectively no difference for vigintile 15. They are then higher under the new policy settings than they would have been under the old policy settings from vigintile 16 ($170,948-<$187,648) (Figure 65). The difference in median costs is largest for the lowest income vigintile (1.8 percentage points lower), is 1.4 percentage points lower for vigintile 2, and declined to be 0.1 percentage points lower for vigintile 14. The highest income vigintile ($308,189 plus) median cost increased from 0.6 per cent of income to 1.0 per cent of income under the new policy settings.
Figure 65: Median net child care costs as a proportion of gross family income under CCB/CCR and CCS and change in net costs as a percentage of gross family income, by family gross income vigintile, 2018-19
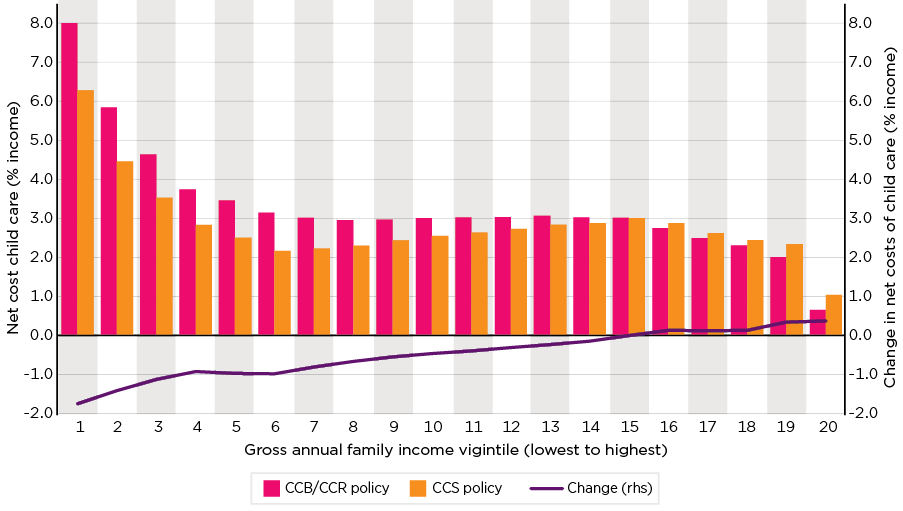
Notes: See Table 40 for the income ranges that apply to each income vigintile.
Source: Evaluation modelling using 2018-19 administrative database file assuming constant 2018-19 child care costs and usage
This focus on the median impact does, however, not fully reflect the range of outcomes across families using child care. The distribution of outcomes is presented in Figure 66, with some of the key moments shown in Table 37. Figure 66 plots the distribution of net child care costs as a percentage of gross family income by income vigintile. In the figure, the bars show the p25 to p75 interquartile range, along with the median, while the whiskers represent p5 and p95. Several points can be taken from the figure. First, consistent with the biggest fall in child care costs, is for families that experience higher net child care costs under the CCB/CCR policy. For example, for the fourth income vigintile the median net cost falls from 3.8 per cent to 2.8 per cent under CCS and for families at the 75th percentile the net cost falls from 8.6 per cent to 6.0 per cent and for the 95th percentile it falls from 22.7 per cent to 14.5 per cent.
Figure 66: Distribution of net child care costs as a proportion of gross family income, CCB/CCR and CCS policies, by family gross income vigintile, 2018-19
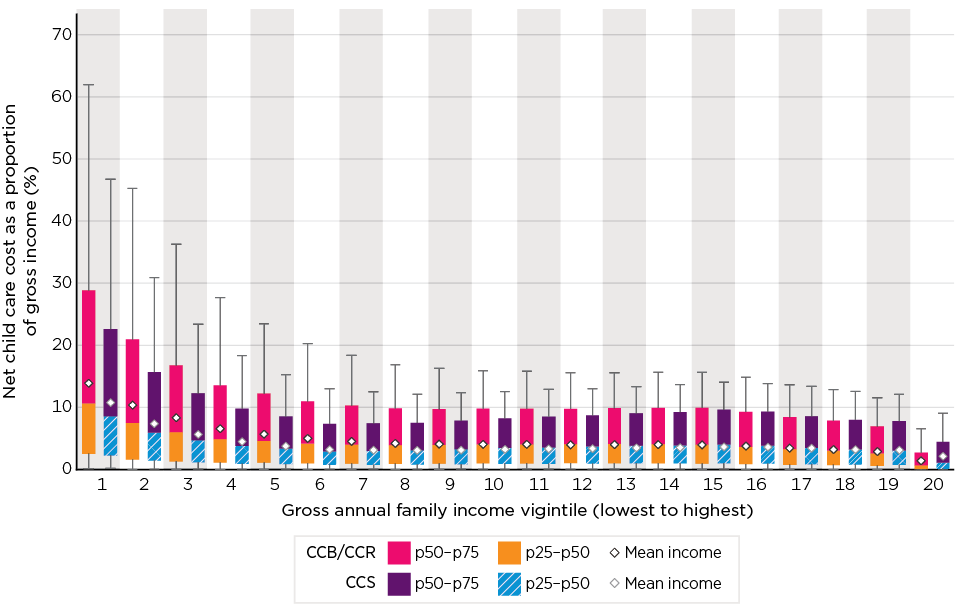
Notes: Whiskers show the net child care costs at the 5th and 95th percentiles. See Table 40 for the income ranges that apply to each income vigintile.
Source: Evaluation modelling using 2018-19 administrative database file assuming constant 2018-19 child care costs and usage
The table can also be viewed on pages 116 of the PDF.
| Income vigintile | CCB/CCR policies | CCS policy | Change (CCS-CCB/CCR) | |||||||||
|---|---|---|---|---|---|---|---|---|---|---|---|---|
| p(25) | p(50) | p(75) | Mean | p(25) | p(50) | p(75) | Mean | p(25) | p(50) | p(75) | Mean | |
| Proportion of family income (%) | Percentage point change | |||||||||||
| 1 (<$21,000) | 2.6 | 8.1 | 18.2 | 14.0 | 2.3 | 6.3 | 14.0 | 10.9 | -0.3 | -1.8 | -4.2 | -3.1 |
| 2 ($21,000-<$31,399) | 1.7 | 5.9 | 13.4 | 10.4 | 1.5 | 4.5 | 9.7 | 7.4 | -0.2 | -1.4 | -3.7 | -3.0 |
| 3 ($31,399-<$41,218) | 1.4 | 4.7 | 10.7 | 8.4 | 1.3 | 3.5 | 7.5 | 5.7 | -0.1 | -1.2 | -3.2 | -2.7 |
| 4 ($41,218-<$50,809) | 1.2 | 3.8 | 8.6 | 6.6 | 1.0 | 2.8 | 6.0 | 4.6 | -0.2 | -1.0 | -2.6 | -2.0 |
| 5 ($50,809-<$61,000) | 1.2 | 3.5 | 7.6 | 5.8 | 1.0 | 2.5 | 5.1 | 3.9 | -0.2 | -1.0 | -2.5 | -1.9 |
| 6 ($61,000-<$72,000) | 1.1 | 3.2 | 6.8 | 5.1 | 0.8 | 2.2 | 4.4 | 3.3 | -0.3 | -1.0 | -2.4 | -1.8 |
| 7 ($72,000-<$83,000) | 1.0 | 3.0 | 6.3 | 4.6 | 0.9 | 2.2 | 4.4 | 3.2 | -0.1 | -0.8 | -1.9 | -1.4 |
| 8 ($83,000-<$93,681) | 1.0 | 3.0 | 5.9 | 4.3 | 0.9 | 2.3 | 4.4 | 3.2 | -0.1 | -0.7 | -1.5 | -1.1 |
| 9 ($93,681-<$103,683) | 1.1 | 3.0 | 5.8 | 4.2 | 0.9 | 2.4 | 4.5 | 3.2 | -0.2 | -0.6 | -1.3 | -1.0 |
| 10 ($103,686-$113,942) | 1.1 | 3.0 | 5.7 | 4.1 | 1.0 | 2.6 | 4.8 | 3.3 | -0.1 | -0.4 | -0.9 | -0.8 |
| 11($113,942-<$124,000) | 1.1 | 3.0 | 5.7 | 4.1 | 1.0 | 2.6 | 4.9 | 3.4 | -0.1 | -0.4 | -0.8 | -0.7 |
| 12 ($124,000-<$134,513) | 1.1 | 3.0 | 5.7 | 4.1 | 1.1 | 2.7 | 5.0 | 3.5 | 0.0 | -0.3 | -0.7 | -0.6 |
| 13 ($134,513-<$145,226) | 1.1 | 3.1 | 5.7 | 4.1 | 1.1 | 2.8 | 5.2 | 3.6 | 0.0 | -0.3 | -0.5 | -0.5 |
| 14 ($145,226-<$157,335) | 1.1 | 3.0 | 5.8 | 4.1 | 1.1 | 2.9 | 5.3 | 3.6 | 0.0 | -0.1 | -0.5 | -0.5 |
| 15 ($157,355-<$170,948) | 1.1 | 3.0 | 5.9 | 4.1 | 1.1 | 3.0 | 5.6 | 3.8 | 0.0 | 0.0 | -0.3 | -0.3 |
| 16 ($170,948-<$187,648) | 1.0 | 2.8 | 5.6 | 3.8 | 1.0 | 2.9 | 5.5 | 3.7 | 0.0 | 0.1 | -0.1 | -0.1 |
| 17 ($187,648-<$209,368) | 0.9 | 2.5 | 5.2 | 3.5 | 0.9 | 2.6 | 5.1 | 3.5 | 0.0 | 0.1 | -0.1 | 0.0 |
| 18 ($209,368-<$240,818) | 0.8 | 2.3 | 4.8 | 3.3 | 0.9 | 2.5 | 4.8 | 3.3 | 0.1 | 0.2 | 0.0 | 0.0 |
| 19 ($240,818-<$308,189) | 0.7 | 2.0 | 4.3 | 3.0 | 0.8 | 2.4 | 4.7 | 3.2 | 0.1 | 0.4 | 0.4 | 0.2 |
| 20 ($308,189 plus) | 0.1 | 0.6 | 2.0 | 1.5 | 0.2 | 1.0 | 3.3 | 2.2 | 0.1 | 0.4 | 1.3 | 0.7 |
Source: Evaluation modelling using 2018-19 administrative database file assuming constant 2018-19 child care costs and usage
The differences in the impact of the policy at different points in the net cost distribution (conditional on income) are explored further in Figure 67, which shows the cumulative density function of change in net child care costs (measured as a percentage of income) by income quintile. The cumulative density function shows the proportion of families in the income quintile whose net child care costs are reduced by at least the particular reduction in net costs. For example, for income quintile one (lowest income quintile) 12.8 per cent had a reduction in net costs of 8 percentage points or greater and 43.7 per cent had a reduction of 2 percentage points or greater.
Almost one-quarter (73.3 per cent) of the lowest income quintile had lower net child care costs as a result of the Child Care Package, and 8 in 10 of the second and third income quintiles had lower net costs (80.7 and 81.3 per cent respectively). For the fourth income quintile 62.3 per cent had lower costs and for the fifth quintile only a minority had lower net costs (12.8 per cent). The number of families with lower net child care costs is highest for the second and third income quintiles.
Figure 67: Cumulative density function of change in net child care costs as a proportion of income, by family gross income quintile, 2018-19
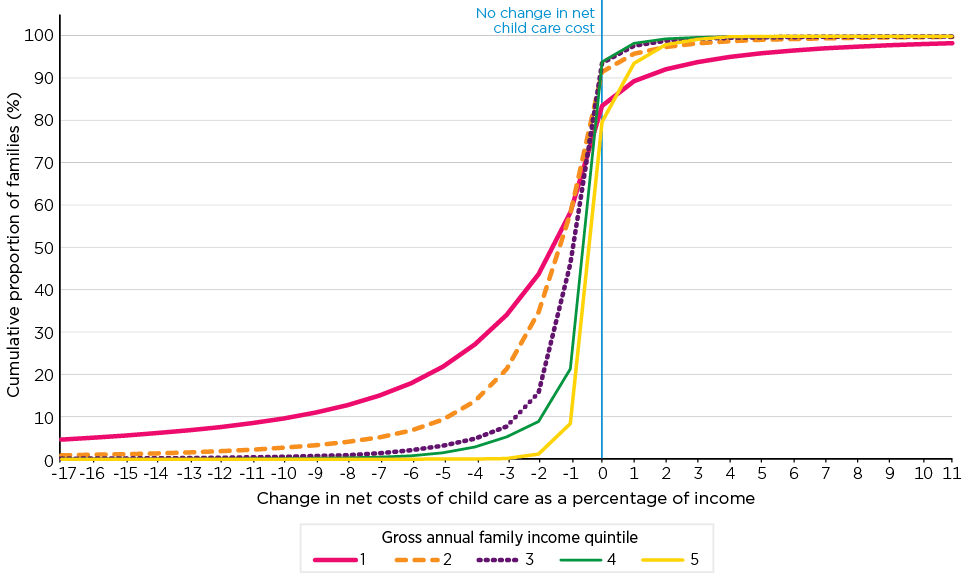
Source: Evaluation modelling using 2018-19 administrative database file assuming constant 2018-19 child care costs and usage
4.5.6 Impact of the Child Care Package by family characteristics
This section describes the impact of the change to the child care system on net costs by a range of family characteristics. The family characteristics considered are:
- family type (single parent, couple parent)
- total number of children using child care during 2018-19
- age of youngest child using child care during 2018-19
- family level approved activity level that is the activity used to assess eligibility for number of hours of subsidised care
- income support and family payment status of the family (whether received full rate income support payment, part rate income support payment, FTB but not income support, or received neither FTB nor income support).91
Regression modelling, reported in Section 4.5.10, is used to further explore the relationship between a range of these characteristics and the impact of the Child Care Package on affordability. The regression modelling allows an assessment of the independent contribution of these and other family characteristics and the nature of child care used to changes in affordability.
Table 41 shows the median and mean net costs of child care as a percentage of gross family income and the median and median change in child care subsidies according to family type. For single parents, the median costs of child care as a percentage of income falls from 4.1 per cent under the old system to 3.1 per cent under the new system due to an increase in annual child care benefit received of $297 (Table 40). For couple parents the median costs also fell but by a smaller amount from 2.8 to 2.6 per cent of income due to an increase in benefit of $133 per annum. The mean reduction in child care costs is greater for single parents, falling from 8.1 to 5.7 per cent.
While there is a decrease in the median and mean net cost of child care under the new system for all groups of families, when grouped by the number of children in care, there is a distinct pattern of the fall in costs increasing as the number of children increases. For families with one child using child care over the year, the median net cost of child care as a percentage of gross family income falls from 2.2 per cent under the old system to 2.0 per cent under the new system. For families with 5 or more children, the net median costs fall from 12.3 to 9.2 per cent of gross family income, and for these families the median increase in child care benefits is $1,464 and the average increase is $3,291 per annum. While there are only 4,261 families with 5 or more children using child care in the year 2018-19, for these families the increase in subsidies and reduction in child care cost is substantial.
The biggest increase in subsidies and reduction in net child care costs are for families with a youngest child aged under 2 years using child care (median cost falls from 4.9 to 4.2 per cent of gross family income), followed by a youngest child aged 2 to under 5 years using child care. There is little change in net costs for families with a youngest child using child care aged 5 to less than 6 years and a very slight increase for families with a youngest child using care aged 6 years or older. The net costs for families with a youngest child using child care aged 6 years or older is quite low (0.7 per cent of gross family income under CCS).
In terms of family activity, for single parent families the biggest increase in subsidies is for those with full-time activity (median increase of $438 per annum and a mean increase of $1,161 per annum), followed by those with part-time activity (median increase $370 and mean increase of $876 per annum). Single parents with low levels of activity, while still showing a gain, have much lower increases in subsidies (median increase of $100 and a mean increase of $268 per annum). The reduction in median net costs as a percentage of gross income for these single parents is largest for those with part-time activity, where it falls from 4.5 to 3.3 per cent of income followed by full-time activity which falls from 4.2 to 3.2 per cent.
For couple parent families, there is less difference in the impact of the child care changes on the net costs of child care as a percentage of income, with small improvements for all activity groups. While median and average costs fall as a percentage of income for all activity groups, mean benefits fall only slightly by $11 per annum for couple families with one parent having low activity and the other full-time activity. The biggest increase in benefits is for couple families in which both parents have full-time activity.
For both single parent and couple parent families, the biggest reduction in child care costs as a percentage of income is for those receiving full-rate income support. For single parents receiving no FTB (high income), the median cost of child care increases very slightly, and for couple families not in receipt of FTB, there is a very slight fall in the net costs of child care from 2.7 to 2.6 per cent of income under the new child care system.
| Median subsidy | Mean subsidy | Subsidy change | Population | |||||
|---|---|---|---|---|---|---|---|---|
| CCB/CCR policy | CCS policy | CCB/CCR policy | CCS policy | Median | Mean | |||
| Net costs as proportion of gross income (%) | ($) | ('000) | ||||||
| Family type | ||||||||
| Single parent | 4.1 | 3.1 | 8.1 | 5.7 | 297 | 841 | 224.0 | |
| Couple parent | 2.8 | 2.6 | 4.4 | 3.7 | 133 | 392 | 907.4 | |
| Number of children | ||||||||
| 1 | 2.2 | 2.0 | 3.9 | 3.2 | 154 | 437 | 619.8 | |
| 2 | 3.5 | 3.2 | 5.7 | 4.6 | 159 | 454 | 368.7 | |
| 3 | 5.2 | 4.8 | 8.1 | 6.3 | 286 | 569 | 117.4 | |
| 4 | 6.8 | 6.1 | 12.5 | 8.8 | 394 | 1,176 | 21.2 | |
| 5+ | 12.3 | 9.2 | 22.3 | 13.7 | 1,464 | 3,291 | 4.3 | |
| Age of youngest child using child care | ||||||||
| Under 2 years | 4.9 | 4.2 | 7.0 | 5.5 | 518 | 814 | 491.7 | |
| 2 to less than 5 | 3.8 | 3.4 | 5.7 | 4.7 | 300 | 390 | 298.2 | |
| 5 to less than 6 | 1.4 | 1.3 | 2.9 | 2.3 | 15 | 153 | 80.4 | |
| 6+ | 0.6 | 0.7 | 1.7 | 1.4 | - | 59 | 260.9 | |
| Family activity a | ||||||||
| Single parent | ||||||||
| Missing activity | 2.1 | 1.8 | 6.1 | 4.9 | - | 218 | 25.9 | |
| Low activity | 4.4 | 3.7 | 8.0 | 6.9 | 100 | 268 | 22.9 | |
| Part-time activity | 4.5 | 3.3 | 8.3 | 5.7 | 370 | 876 | 93.8 | |
| Full-time activity | 4.2 | 3.2 | 8.3 | 5.5 | 438 | 1,161 | 81.3 | |
| Couple parent family | ||||||||
| Missing activity | 1.1 | 1.2 | 3.4 | 3.3 | - | -103 | 93.9 | |
| Low activity | 2.4 | 2.2 | 5.9 | 5.4 | 12 | 64 | 2.5 | |
| Some part-time | 2.8 | 2.5 | 5.1 | 4.1 | 17 | 375 | 75.7 | |
| 1 low, 1 full-time | 1.9 | 1.8 | 3.6 | 3.2 | 24.2 | -11 | 37.1 | |
| 1 part-time, 1 full-time | 3.0 | 2.7 | 4.2 | 3.5 | 224.5 | 401 | 395.7 | |
| 2 full-time | 3.3 | 3.1 | 5.0 | 4.1 | 185.5 | 604 | 302.6 | |
| Income support / family payment status | ||||||||
| Single parent | ||||||||
| Full-rate income support | 5.9 | 4.4 | 10.4 | 7.4 | 318 | 780 | 92.7 | |
| Part-rate Income Support | 4.9 | 3.5 | 7.9 | 5.2 | 490 | 1,059 | 44.3 | |
| FTB only | 2.6 | 2.0 | 5.7 | 4.0 | 268 | 897 | 76.5 | |
| no FTB | 1.8 | 1.9 | 4.4 | 4.1 | - | 114 | 38.3 | |
| Couple family | ||||||||
| Both full-rate Income Support | 5.4 | 3.9 | 11.6 | 7.0 | 484 | 1,572 | 10.4 | |
| Part-rate Income Support | 4.3 | 3.4 | 8.6 | 6.1 | 373 | 948 | 26.4 | |
| FTB only | 3.6 | 2.7 | 5.9 | 4.2 | 573 | 1,034 | 174.0 | |
| no FTB | 2.7 | 2.6 | 3.9 | 3.5 | 48 | 213 | 653.5 | |
| Total | 3.0 | 2.7 | 5.2 | 4.1 | 167 | 481 | 1,131.4 | |
Notes: a Low includes zero and less than 10 hours per week; part-time is 10 to under 34 hours per week, full-time is 35 hours or more a week.
Source: Evaluation modelling using 2018-19 administrative database file assuming constant 2018-19 child care costs and usage
Table 42 shows the proportion of families that are worse off, unaffected or better off under CCS than CCB/CCR by family characteristics. Single parents are substantially more likely to be better off under CCS than CCB/CCR (72.6 per cent) than are couple parent families (59.6 per cent). There is relatively little difference in the proportion of families that are worse off or better off according to the number of children using child care, with the exception of the small proportion of families with 5 or more children using child care, who are somewhat more likely to be better off than families with one to 4 children using child care.
In terms of the age of the youngest child using child care, those with a child under 2 years of age have the highest proportion better off (69.9 per cent) and the lowest proportion worse off (23.0 per cent) under CCS. This compares to those with a youngest child using child care who is 6 years or older of whom 47.2 per cent are better off under CCS and 41.5 per cent are worse off. Considering the pattern of better off and worse off by family activity status, single parents with full-time activity are the most likely to be better off under CCS (76.5 per cent) and couple parent families with missing activity information are the least likely to be better off under CCS (41.5 per cent). The higher the level of family activity, the higher the proportion of families that are better off and the lower the proportion of families that are worse off following the Child Care Package.
| Worse off | Unaffected | Better off | |
|---|---|---|---|
| Distribution (%) | |||
| Family type | |||
| Single parent | 22.9 | 4.5 | 72.6 |
| Couple parent | 30.8 | 9.6 | 59.6 |
| Number of children | |||
| 1 | 28.3 | 7.4 | 64.4 |
| 2 | 30.4 | 9.8 | 59.8 |
| 3 | 30.5 | 10.9 | 58.6 |
| 4 | 30.9 | 9.8 | 59.3 |
| 5+ | 24.8 | 5.6 | 69.6 |
| Age of youngest child using child care | |||
| Under 2 years | 23.0 | 7.1 | 69.9 |
| 2 to less than 5 | 27.7 | 8.1 | 64.1 |
| 5 to less than 6 | 36.2 | 10.9 | 52.9 |
| 6+ | 41.5 | 11.3 | 47.2 |
| Family activity a | |||
| Single parent | |||
| Missing activity | 45.4 | 4.8 | 49.8 |
| Low activity | 32.7 | 5.6 | 61.8 |
| Part-time activity | 18.5 | 4.3 | 77.2 |
| Full-time activity | 19.1 | 4.4 | 76.5 |
| Couple parent family | |||
| Missing activity | 55.2 | 3.2 | 41.5 |
| Low activity | 45.2 | 4.4 | 50.4 |
| Some part-time | 30.9 | 7.0 | 62.1 |
| 1 low, 1 full-time | 42.9 | 5.0 | 52.1 |
| 1 part-time, 1 full-time | 26.1 | 10.3 | 63.5 |
| 2 full-time | 29.6 | 11.4 | 59.0 |
| Income support / family payment status | |||
| Single parent | |||
| Full-rate Income Support | 24.3 | 4.9 | 70.8 |
| Part-rate Income Support | 16.3 | 4.1 | 79.6 |
| FTB only | 22.0 | 4.1 | 73.9 |
| No FTB | 47.7 | 4.4 | 47.9 |
| Couple family | |||
| Both full-rate Income Support | 21.1 | 5.1 | 73.8 |
| Part-rate Income Support | 23.8 | 4.0 | 72.3 |
| FTB only | 17.3 | 2.1 | 80.6 |
| No FTB | 33.0 | 12.4 | 54.6 |
| Total | 29.2 | 8.6 | 62.2 |
Notes: a Low includes zero and less than 10 hours per week; part-time is 10 to under 34 hours per week, full-time is 35 hours or more a week.
Source: Evaluation modelling using 2018-19 administrative database file assuming constant 2018-19 child care costs and usage
4.5.7 Impact of the Child Care Package by type and amount of care used
An important dimension in which the impacts of the changes to the child care system on affordability may have varied is type of care used and whether the care is being provided by a for-profit or not-for-profit service.
Service type and sector
Figure 68 and Table 43 detail the impact of the child care changes on median affordability by the most common child care type used during the year.92 Again, it is noted here that, notwithstanding the earlier discussion on changes in the hourly fees charged by services, this modelling is based on the fees and patterns of child care use as recorded in 2018-19, and relate only to the relative subsidies under the CCS and the CCB/CCR.
For families for whom the most common type of child care used during the year is Centre Based Day Care, there were relatively small improvements in affordability for both for-profit and not-for-profit services. The median net cost for families whose main type of care was for-profit Centre Based Day Care fell from 4.5 to 4.0 per cent of gross family income as a result of the changes to the system, and for families using not-for-profit Centre Based Day Care the net costs are reduced from 4.1 to 3.6 per cent of income by the changes.
The changes to the child care system as modelled resulted in a substantial improvement in affordability for families whose main type of care was for-profit Family Day Care (5.7-4.3 per cent of gross family income), and a smaller improvement in affordability for families whose main type of care was not-for-profit Family Day Care (3.0-2.5 per cent of income).
There was a substantial fall in affordability for families whose main type of care was for-profit In Home Care (increased from 2.8 to 5.5 per cent of gross family income as a result of the changes).
Figure 68: Median net child care costs as a proportion of gross family income, CCB/CCR and CCS policies, by type of care used and whether for-profit or not-for-profit, 2018-19
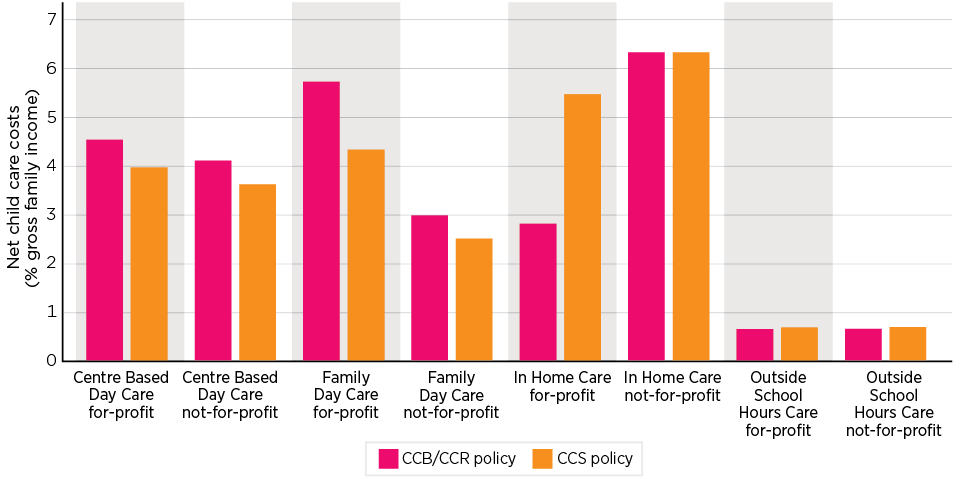
Source: Evaluation modelling using 2018-19 administrative database file assuming constant 2018-19 child care costs and usage
| Type of care and whether for profit/not for profit | CCB/CCR policy | CCS policy |
|---|---|---|
| Proportion of gross family income (%) | ||
| Centre Based Day Care | ||
| For-profit | 4.5 | 4.0 |
| Not-for-profit | 4.1 | 3.6 |
| Family Day Care | ||
| For-profit | 5.7 | 4.3 |
| Not-for-profit | 3.0 | 2.5 |
| Outside School Hours Care | ||
| For-profit | 0.6 | 0.7 |
| Not-for-profit | 0.6 | 0.7 |
| In Home Care | ||
| For-profit | 2.8 | 5.5 |
| Not-for-profit | 6.3 | 6.3 |
Source: Evaluation modelling using 2018-19 administrative database file assuming constant 2018-19 child care costs and usage
Hours of care used
Figure 69 shows the median net costs of child care and subsidy rate under the CCB/CCR and CCS policies by per child number of hours of care paid (expressed in weekly terms). As expected, the net cost of child care as a percentage of income increases as the number of hours of care increases. The net costs of child care are lower under CCS than CCB/CCR for per child hours of care 6-10 hours per week or higher, and the percentage point reduction in the net costs of child care increases as the number of hours of care paid for increases. For families paying for 46-50 hours of care per week, the median net cost falls from 10.9 per cent under CCB/CCR to 7.6 per cent under CCS. Correspondingly, the subsidy rate is lower for all hours from 6-10 hours up under CCS and the difference increases for care paid for of 41-45 hours per week and higher.
Figure 69: Median net child care costs as a proportion of gross family income and median subsidy rate, CCB/CCR and CCS policies, by per child hours of care paid for, 2018-19
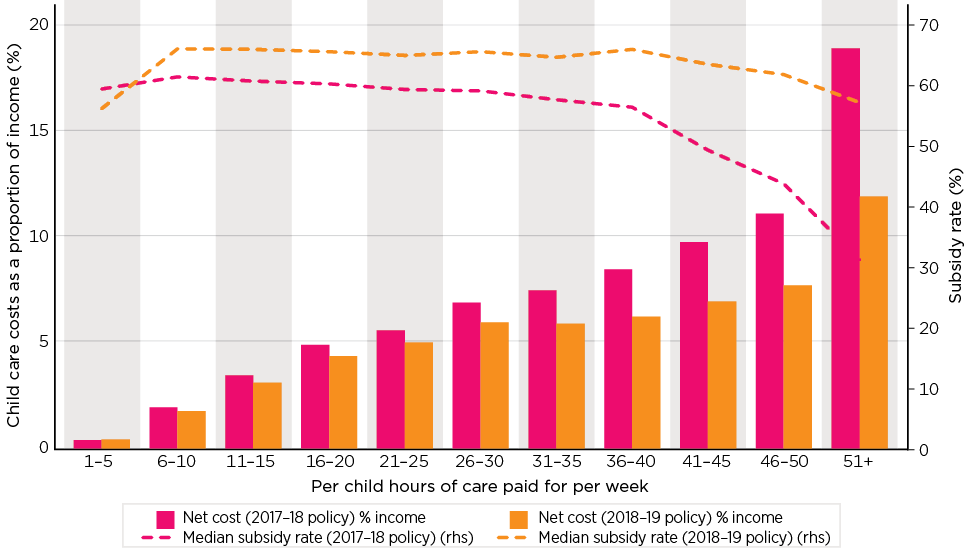
Source: Evaluation modelling using 2018-19 administrative database file assuming constant 2018-19 child care costs and usage
The proportion of families that the Child Care Package had a positive impact on increases as the per child hours of care paid for increases from 46.5 per cent for those paying for 1-5 hours per child per week to 92.1 per cent of families paying for 51 or more hours care per child per week (Table 44). There is little difference in the proportion of families positively impacted by the Child Care Package according to whether the most common type of care used by the family is for-profit or not-for-profit Centre Based Day Care. Families using Family Day Care as their most common form of care are somewhat more likely to be positively affected than families using other types of care, and the proportion of families positively affected is higher for those using for-profit Family Day Care (77.5 per cent) than those using not-for-profit Family Day Care (71.3 per cent) as their most common type of care. There is a big difference between for-profit and not-for-profit In Home care with over half of families using not-for-profit In Home Care experiencing a positive impact as compared to just 27.6 per cent of families using a for-profit service.
| Negative impact | Unaffected | Positive impact | |
|---|---|---|---|
| Distribution (%) | |||
| Average per child hours of care paid for (per week) | |||
| 1-5 | 45.3 | 8.1 | 46.5 |
| 6-10 | 29.7 | 10.1 | 60.2 |
| 11-15 | 26.8 | 10.6 | 62.6 |
| 16-20 | 25.1 | 10.2 | 64.7 |
| 21-25 | 24.1 | 9.8 | 66.1 |
| 26-30 | 20.0 | 8.1 | 71.9 |
| 31-35 | 15.3 | 4.5 | 80.2 |
| 36-40 | 10.5 | 2.5 | 86.9 |
| 41-45 | 9.5 | 1.5 | 89.0 |
| 46-50 | 8.1 | 1.3 | 90.5 |
| 51+ | 7.6 | 0.4 | 92.1 |
| Type of care and whether for-profit/not-for-profit | |||
| Centre Based Day Care | |||
| For-profit | 24.8 | 7.4 | 67.8 |
| Not-for-profit | 25.0 | 8.5 | 66.6 |
| Family Day Care | |||
| For-profit | 18.9 | 3.7 | 77.5 |
| Not-for-profit | 22.3 | 6.4 | 71.3 |
| Outside School Hours Care | |||
| For-profit | 45.9 | 10.9 | 43.2 |
| Not-for-profit | 41.7 | 13.3 | 45.0 |
| In Home Care | |||
| For-profit | 69.5 | 2.9 | 27.6 |
| Not-for-profit | 40.0 | 3.7 | 56.3 |
| Total | 29.2 | 8.6 | 62.2 |
Source: Evaluation modelling using 2018-19 administrative database file assuming constant 2018-19 child care costs and usage
4.5.8 Impact of the Child Care Package by geography
The impact of the Child Care Package differs between areas with different geographic characteristics. While there are differences in the median net costs of child care across states and territories, the impact of the child care changes on the median costs of child care are similar, ranging from a reduction of 0.3 per cent of income in Victoria and a reduction of 0.4 per cent in Queensland and Tasmania to no change in the Northern Territory (Table 45).
The reductions in median net child care costs are largest in geographic areas with the lowest socio-economic status (a reduction in median costs from 3.7 to 3.0 per cent of income) and then decrease as the level of socio-economic disadvantage of the areas decreases to be no change for the 9th decile and a fall of 0.3 per cent for the 10th decile (least socio-economically disadvantaged areas).
There are also relatively small differences in the impact of the child care changes between areas with different levels of the composite geographic remoteness/ population size measure, although it does appear affordability was slightly worsened in very remote areas, where it is estimated that the child care changes increased net child care costs by 0.3 per cent of gross family income.
| Median | Mean | Subsidy change | Families | ||||
|---|---|---|---|---|---|---|---|
| CCB/CCR policy | CCS policy | CCB/CCR policy | CCS policy | Median | Mean | ||
| Net costs as proportion of gross income (%) | ($) | ('000) | |||||
| Urban and regional location | |||||||
| Capital Cities | 3.0 | 2.8 | 5.3 | 4.3 | 120 | 427 | 785.5 |
| Urban 100k plus | 3.2 | 2.7 | 5.1 | 3.9 | 283 | 636 | 147.7 |
| Urban 50k-<100k | 3.2 | 2.6 | 5.0 | 3.8 | 319 | 688 | 48.1 |
| Urban 20k-<50k | 3.2 | 2.7 | 5.1 | 3.9 | 320 | 673 | 51.5 |
| Urban 10k-<20k | 2.9 | 2.5 | 4.7 | 3.7 | 249 | 551 | 24.3 |
| Inner Regional | 2.6 | 2.2 | 4.5 | 3.5 | 223 | 539 | 41.5 |
| Outer Regional | 2.4 | 2.1 | 4.1 | 3.3 | 174 | 411 | 26.3 |
| Remote | 1.9 | 1.9 | 3.6 | 3.1 | 45 | 235 | 3.0 |
| Very Remote | 2.1 | 2.4 | 3.7 | 3.5 | - | 19 | 3.3 |
| State/territory | |||||||
| New South Wales | 3.3 | 3.0 | 5.6 | 4.5 | 155 | 399 | 372.8 |
| Victoria | 3.1 | 2.8 | 5.5 | 4.3 | 188 | 584 | 279.5 |
| Queensland | 3.1 | 2.7 | 5.1 | 4.0 | 215 | 565 | 252.2 |
| South Australia | 2.0 | 1.8 | 3.8 | 3.0 | 127 | 450 | 74.6 |
| Western Australia | 2.5 | 2.2 | 4.3 | 3.5 | 110 | 354 | 96.3 |
| Tasmania | 2.4 | 2.0 | 3.8 | 2.9 | 257 | 462 | 20.0 |
| Northern Territory | 2.8 | 2.8 | 4.5 | 4.0 | 38 | 261 | 9.5 |
| Australian Capital Territory | 3.2 | 3.0 | 4.9 | 4.2 | 27 | 396 | 26.4 |
| SEIFA | |||||||
| 1 | 3.7 | 3.0 | 7.2 | 5.1 | 384 | 920 | 92.9 |
| 2 | 3.2 | 2.6 | 5.8 | 4.3 | 301 | 724 | 77.1 |
| 3 | 3.2 | 2.7 | 5.4 | 4.1 | 309 | 702 | 94.7 |
| 4 | 3.1 | 2.6 | 5.1 | 3.9 | 288 | 653 | 95.7 |
| 5 | 3.1 | 2.7 | 5.2 | 4.0 | 274 | 677 | 108.0 |
| 6 | 3.0 | 2.6 | 5.0 | 3.9 | 237 | 642 | 120.6 |
| 7 | 3.0 | 2.7 | 4.9 | 3.9 | 195 | 569 | 136.0 |
| 8 | 3.0 | 2.8 | 4.9 | 4.0 | 119 | 461 | 124.2 |
| 9 | 2.6 | 2.6 | 4.5 | 3.9 | 2 | 198 | 145.0 |
| 10 | 2.5 | 2.8 | 4.5 | 4.2 | -0 | -326 | 133.4 |
| Total | 3.0 | 2.7 | 5.2 | 4.1 | 167 | 481 | 1,131.4 |
Source: Evaluation modelling using 2018-19 administrative database file assuming constant 2018-19 child care costs and usage
Table 46 shows the percentage of families whose net child care costs are higher under CCS (negative impact), unaffected by the shift to CCS or better off under CCS (positive impact).
The areas in which the highest proportion of families are better off under CCS are outer regional, inner regional and towns ranging from populations of 10,000 to less than 20,000 up to 100,000 (ranging from 66.6 per cent positive to 71.5 per cent positive). The areas with the lowest proportion of the population who experience a positive impact are very remote (46.2 per cent), remote (55.2 per cent) and capital cities (59.2 per cent). There are some differences across states/territories with the highest proportion of families positively affected in Tasmania (72.4 per cent) and the lowest in the Australian Capital Territory (52.3 per cent) and the Northern Territory (52.8 per cent). There is a clear area level socio-economic gradient, with the proportion of families positively impacted by the changes decreasing from 73.8 per cent for the most socio-economically disadvantaged areas to 40.2 per cent for the most socio-economically advantaged areas (Table 46).
| Negative impact | Unaffected | Positive impact | ||
|---|---|---|---|---|
| Distribution (%) | ||||
| Urban and regional location | ||||
| Capital Cities | 32.1 | 8.8 | 59.2 | |
| Urban 100k plus | 22.8 | 8.8 | 68.4 | |
| Urban 50k-<100k | 20.6 | 8.0 | 71.5 | |
| Urban 20k-<50k | 21.3 | 7.4 | 71.4 | |
| Urban 10k-<20k | 23.2 | 8.2 | 68.6 | |
| Inner Regional | 23.0 | 7.4 | 69.6 | |
| Outer Regional | 25.9 | 7.5 | 66.6 | |
| Remote | 35.7 | 9.1 | 55.2 | |
| Very Remote | 45.6 | 8.2 | 46.2 | |
| State/territory | ||||
| New South Wales | 31.2 | 8.8 | 60.0 | |
| Victoria | 29.7 | 7.2 | 63.1 | |
| Queensland | 25.0 | 9.7 | 65.3 | |
| South Australia | 26.7 | 9.3 | 64.1 | |
| Western Australia | 32.1 | 8.1 | 59.8 | |
| Tasmania | 20.5 | 7.2 | 72.4 | |
| Northern Territory | 36.6 | 10.6 | 52.8 | |
| Australian Capital Territory | 38.1 | 9.6 | 52.3 | |
| SEIFA | ||||
| 1 | 20.4 | 5.8 | 73.8 | |
| 2 | 22.0 | 6.8 | 71.2 | |
| 3 | 22.0 | 7.1 | 70.9 | |
| 4 | 22.1 | 7.9 | 69.9 | |
| 5 | 23.2 | 8.1 | 68.7 | |
| 6 | 24.5 | 8.8 | 66.7 | |
| 7 | 27.0 | 9.5 | 63.6 | |
| 8 | 31.0 | 10.1 | 58.9 | |
| 9 | 38.7 | 10.5 | 50.8 | |
| 10 | 50.8 | 9.1 | 40.2 | |
| Total | 29.2 | 8.6 | 62.2 | |
Source: Evaluation modelling using 2018-19 administrative database file assuming constant 2018-19 child care costs and usage
4.5.9 Impact of the shift to ACCS
This section presents the modelled impacts of the Child Care Package on child care benefit received and net child care cost for families that received ACCS in 2018-19 under the new system (Table 47). The impact of the Child Care Package was to reduce the mean and median net child care cost for families that received ACCS for at least part of 2018-19. The reduction in the net costs of child care (as a percentage of income) is similar for those who received an ACCS payment compared to families that did not receive an ACCS payment in 2018-19.
Table 47 also shows the modelled impact of the Child Care Package for families that received SCCB, GCCB or JETCCFA in 2017-18 and were in the child care system in 2018-19. The reduction in child care costs was larger for these groups than for the entire group of families that received ACCS in 2018-19 and families that did not receive ACCS in 2018-19.
| Fees ($) | Total child care benefits ($) | Net cost ($) | Net cost (% income) | Adjusted taxable income ($) | ||||
|---|---|---|---|---|---|---|---|---|
| CCB/CCR | CCS | CCB/ CCR | CCS | CCB/ CCR | CCS | |||
| Does not receive ACCS (1,099,486 families) | ||||||||
| Mean | 11,067 | 6,136 | 6,612 | 4,931 | 4,454 | 5.1 | 4.1 | 133,706 |
| Median | 8,053 | 4,786 | 4,698 | 3,013 | 2,558 | 3.0 | 2.7 | 116,282 |
| Received ACCS in 2018-19 (31,869 families) | ||||||||
| Mean | 15,102 | 12,149 | 12,783 | 2,953 | 2,319 | 8.3 | 6.4 | 47,122 |
| Median | 11,612 | 9,645 | 9,637 | 1,379 | 1,215 | 3.7 | 3.3 | 32,624 |
| Received Special CCB in 2017-18 and in child care system in 2018-19 (18,202 families) | ||||||||
| Mean | 16,686 | 11,387 | 12,661 | 5,300 | 4,025 | 11.4 | 8.3 | 62,925 |
| Median | 13,831 | 9,453 | 10,179 | 3,501 | 2,610 | 7.2 | 5.6 | 43,846 |
| Received Grandparent CCB in 2017-18 and in child care system in 2018-19 (3,162 families) | ||||||||
| Mean | 14,192 | 12,584 | 13,126 | 1,609 | 1,066 | 5.6 | 3.9 | 34,397 |
| Median | 10,545 | 9,723 | 9,438 | 115 | 198 | 0.4 | 0.6 | 29,783 |
| Received JETCCFA in 2017-18 and in child care system in 2018-19 (8,037 families) | ||||||||
| Mean | 15,803 | 11,710 | 13,099 | 4,093 | 2,704 | 11.6 | 7.7 | 41,162 |
| Median | 13,783 | 10,422 | 11,251 | 2,866 | 1,986 | 7.8 | 5.5 | 35,418 |
Source: Evaluation modelling using 2018-19 administrative database file assuming constant 2018-19 child care costs and usage
4.5.10 Regression modelling of impacts of child care changes on affordability
In order to understand the extent to which the changes had an impact on different groups while holding constant income, hours of care used, type of care used and other family and geographic variables, a regression model is estimated. The dependent variable for the model is the change in net child care costs as a percentage of income due to the changes in the child care system. An OLS model is estimated and the explanatory variables included are gross family income (income vigintile), total hours of care paid for, number of children using child care, age of youngest child using child care, family activity status, care type used and whether it is for-profit or not-for-profit, socio-economic status of region in which family lives, state/territory of residence and urban and regional location.
The results are presented in Table 48. Given that the sample used to estimate the model includes the population of child care using families for 2018-19, the sample size is large and most variables are statistically significant, generally at the 99.9 per cent confidence level. The focus is therefore on whether there are economically significant differences in the impact of the various explanatory variables on the net child care costs as a percentage of gross family income.
The relationship between income vigintile and child care costs is clear and shows the biggest reductions in net child care costs at the bottom end of the income distribution and increases in child care costs at the top end of the income distribution. The predicted values using the regression model are entirely consistent with the unconditional impacts reported above. The conclusions about the relationship between income and net child care costs from the regression modelling are the same as the conclusions drawn from the unconditional analysis. There are only very small differences in change in net costs as a percentage of gross family income according to family activity status.
The finding that the gains under CCS increase with the number of children using care is confirmed by the regression modelling. The regression modelling shows relatively small differences in the change in net child care costs according to the age of youngest child using child care. The regression results for type of care used and whether the service is for-profit or not-for-profit are similar to the unconditional results (Figure 68), with substantial differences in the regression modelling only for for-profit Family Day Care and for-profit In Home Care where net costs to families are estimated to have increased by 2.5 and 4.3 per cent respectively.
| Coefficient a | Coefficient a | Coefficient a | |||||
|---|---|---|---|---|---|---|---|
| Vigintiles of gross family income | 15 X single parent | -0.59*** | FDC NFP | -0.23*** | |||
| 1 | -2.34*** | 16 X single parent | -0.71*** | IHC FP | 4.30*** | ||
| 2 | -2.24*** | 17 X single parent | -0.98*** | IHC NFP | -0.53 | ||
| 3 | -1.95*** | 18 X single parent | -0.95*** | OSHC FP | 0.36*** | ||
| 4 | -1.22*** | 19 X single parent | -1.11*** | OSHC NFP | 0.46*** | ||
| 5 | -1.15*** | 20 X single parent | -2.59*** | SEIFA | |||
| 6 | -1.08*** | Hours of care paid for (hrs/week) | 1 | -0.19*** | |||
| 7 | -0.76*** | 1-5 | 2.49*** | 2 | -0.09*** | ||
| 8 | -0.45*** | 6-10 | 2.22*** | 3 | 0.01 | ||
| 9 | -0.21*** | 11-15 | 1.78*** | 4 | 0.03* | ||
| 10 | base | 16-20 | 1.31*** | 5 | base | ||
| 11 | 0.12*** | 21-25 | 0.69*** | 6 | -0.04*** | ||
| 12 | 0.25*** | 26-30 | base | 7 | -0.05*** | ||
| 13 | 0.36*** | 31-35 | -0.72*** | 8 | -0.05*** | ||
| 14 | 0.47*** | 36-40 | -1.45*** | 9 | -0.04*** | ||
| 15 | 0.64*** | 41-45 | -2.25*** | 10 | 0.05*** | ||
| 16 | 0.83*** | 46-50 | -2.70*** | State/territory | |||
| 17 | 0.97*** | 51+ | -8.26*** | New South Wales | omitted | ||
| 18 | 1.03*** | Number of children using child care | Victoria | -0.13*** | |||
| 19 | 1.29*** | 1 | omitted | Queensland | 0.23*** | ||
| 20 | 1.23*** | 2 | -1.01*** | South Australia | -0.01 | ||
| Single parent family | 0.51*** | 3 | -1.88*** | Western Australia | -0.11*** | ||
| Vigintile of gross family income interacted with single parent indicator | 4 | -3.49*** | Tasmania | 0.07*** | |||
| 1 X single parent | -1.19*** | 5 | -7.47*** | Northern Territory | 0.44*** | ||
| 2 X single parent | -0.76*** | Age of youngest child using child care | Australian Capital Territory | -0.18*** | |||
| 3 X single parent | -0.35*** | Under 2 years | Population/remoteness | ||||
| 4 X single parent | -0.66*** | 2 to less than 5 | 0.25*** | Capital Cities | base | ||
| 5 X single parent | -0.47*** | 5 to less than 6 | -0.66*** | Urban 100k plus | -0.06*** | ||
| 6 X single parent | -0.32*** | 6+ | -0.96*** | Urban 50k-<100k | -0.05*** | ||
| 7 X single parent | -0.12** | Family activity status | Urban 20k-<50k | 0.05*** | |||
| 8 X single parent | -0.06 | 1 | Urban 10k-<20k | 0.00 | |||
| 9 X single parent | -0.03 | 2 | -0.64*** | Inner Regional | 0.11*** | ||
| 10 X single parent | base | 3 | -0.67*** | Outer Regional | 0.22*** | ||
| 11 X single parent | -0.24*** | Care type by whether for-profit | Remote | -0.02 | |||
| 12 X single parent | -0.11 | CBDC FP | base | Very Remote | 0.37*** | ||
| 13 X single parent | -0.30*** | CBDC NFP | 0.00 | Constant | -0.70*** | ||
| 14 X single parent | -0.45*** | FDC FP | -2.52*** | ||||
| Number of observations | 1,127,089 | ||||||
| r2 | 0.2321 | ||||||
Notes: a The coefficient represents the percentage point difference associated with each category relative to the base case.
*, **, *** indicate that the underlying coefficient is significant at the 90 per cent, 95 per cent and 99 per cent confidence levels respectively. See Table 40 for the income ranges that apply to each income vigintile.
Source: Evaluation modelling using 2018-19 administrative database file assuming constant 2018-19 child care costs and usage
There are only small differences in the net costs of care for the geographic variables once income (and other characteristics) are controlled for. This differs from the unconditional results and is because the geographic variation largely reflects differences in income (and other family level, type of care used characteristics) between geographic areas.
4.5.11 PolicyMod microsimulation model - Survey of Income and Housing base file
This section reports the results of the modelled impacts of the new Child Care Package on affordability using the ANU PolicyMod microsimulation model that uses as the population base file the 2017-18 Survey of Income and Housing.
As discussed in Section 4.1.2, the use of the ABS Survey of Income and Housing as a base file allows the impact of the changes to the child care system from July 2018 on household incomes to be estimated, and for household income to be adjusted to take into account differences in the costs of living between households of different sizes and demographic compositions. However, at the same time, it introduces some limitations. In particular, there is insufficient information on the survey to allow the activity test to be accurately modelled. This limitation arises as, while the survey provides data on hours of paid work, it does not include a measure of the various other forms of activity that count towards the CCS activity test.
The approach taken has been to use the administrative data on the application of the activity test to benchmark the modelling based on the Survey of Income and Housing (SIH). The benchmarking involves reweighting the survey data so that the 'correct' number of families have each level of approved hours. This benchmarking is necessary to avoid the modelling using the Survey of Income and Housing overestimating the positive impacts of the changes to the child care system on affordability and underestimating the negative impacts of the changes.
The modelling using the SIH is that, on average, child care subsidy payments are $261 per annum per family higher under the CCS policy than they would have been under the former CCB/CCR policy. This translates into an additional expenditure of just under $300 million in CCS subsidies as compared to what would have been received under the CCB/CCR policy settings. This compares to an estimate of an additional $455 million from the modelling using the administrative database file.
Figure 70 shows the mean change in the per annum amount of subsidy received under CCS as compared to CCB/CCR by income deciles. The income deciles in this figure are calculated using the distribution of equivalised disposable household income for families using child care. As discussed in Section 4.1.2, the use of equivalised income adjusts for differences in the cost of living for households of different sizes and demographic composition and this assists in making welfare comparisons. Figure 71 shows the mean change in the amount of subsidy received by income deciles calculated using the distribution of income of all households. A positive difference means that the families receive more under CCS than under CCB/CCR. Focusing on the pattern of impacts by income decile, calculated using the incomes of households using child care, the amount of subsidy received is higher under CCS than CCB/CCR up to and including income decile 9. Families in the highest income decile are modelled to experience a substantial reduction in the amount of benefits received due to the impact of the income test (Figure 70).
While there are some differences in the relative size of the difference in subsidy amount received between income deciles, when the deciles are calculated using income for all households the pattern of impacts remains essentially unchanged (Figure 71).
As discussed above, the main benefit of the microsimulation modelling using the SIH is that it is possible to model the impact of the Child Care Package on affordability as measured using the percentage change in disposable household income, rather than the cruder measure of the percentage of gross family income, which is the measure used for the microsimulation modelling based on the administrative data.
Figure 72 shows the median and mean change in effective disposable income under CCS compared to under CCB/CCR by equivalised disposable household income deciles (calculated using the income distribution for families using child care). The median change in income under CCS is 1.1 per cent for the lowest income decile and then is in the range 0.4-0.6 per cent higher under CCS for income deciles 2-6. For income deciles 7 and 8 there is a very small (0.1 per cent) median increase in income, no difference for decile 9 and a fall of 0.9 per cent for the highest income decile. The mean increase in income is generally larger than the median increase. For the lowest income decile, the mean change in household disposable income is 2.8 per cent and for income deciles 2 and 3 it is 0.7 and 0.6 per cent respectively. The increase in income (in percentage terms) then reduces to be 0.2 per cent for decile 9, and for decile 10 the fall in income is 1.1 per cent under CCS as compared to under CCB/CCR.
Figure 70: Mean difference in per annum child care subsidy received under CCS compared to CCB/CCR, by equivalised household disposable income (deciles based on income distribution of families using child care), 2018-19
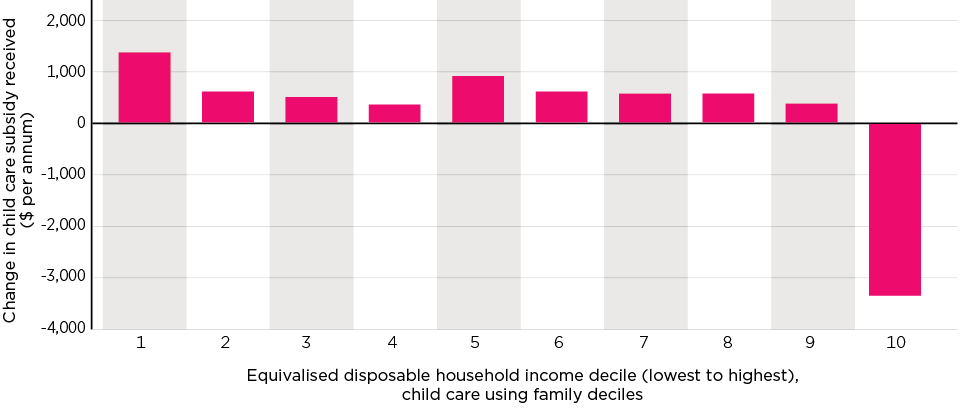
Source: Evaluation modelling using Survey of Income and Housing, ANU PolicyMod
Figure 71: Mean difference in per annum amount of child care subsidy received under CCS compared to CCB/CCR, by equivalised household disposable income (deciles based on income distribution of all households), 2018-19
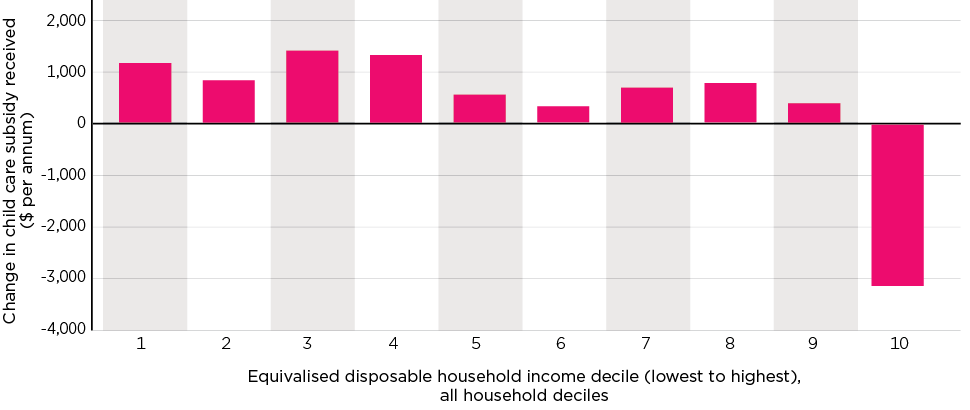
Source: Evaluation modelling using Survey of Income and Housing, ANU PolicyMod
Figure 72: Median and mean proportional effective change in disposable household income as a result of introduction of CSS, by equivalised household disposable income deciles (deciles based on income distribution of families using child care), 2018-19
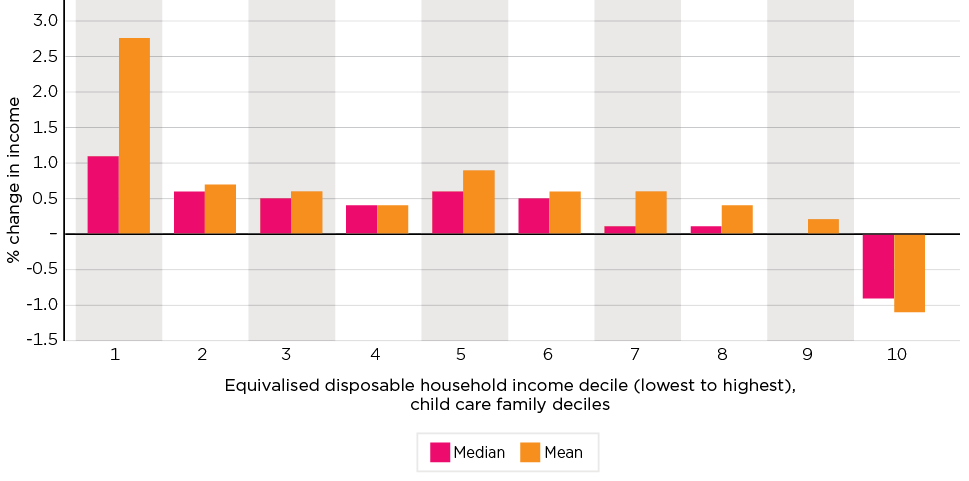
Source: Evaluation modelling using Survey of Income and Housing, ANU PolicyMod
Figure 73 shows net costs as a percentage of gross household income by income quintiles, with the quintiles constructed only using data for families that use child care. This shows that costs as a proportion of gross income are highest for the lowest income quintile, lowest for the second income quintile and similar for quintiles 3-5. The reduction in the net cost of child care is greatest in percentage terms for the lowest income quintile and there are smaller reductions for income quintiles 2, 3 and 4. Income quintile 5 experiences an increase in child care cost as a result of the Package. These patterns are broadly consistent with the modelling of net child care costs as a percentage of gross family income using the DESE administrative data.
The final part of this section considers the impact of the Child Care Package on the net costs (out-of-pocket costs) of child care relative to disposable household income. This income measure includes private income and government benefits including child care and deducts personal income tax including deductions. Furthermore, because of the progressive nature of the personal income taxation system, the difference between disposable and gross household income increases with income level. For these reasons, disposable household income provides a more accurate measure of the economic resources available to the household than the gross parental income available from the DESE administrative data.
Across child care families, the net costs of child care as a percentage of disposable household income is estimated to be 4.6 per cent under CCB/CCR and slightly lower at 4.4 per cent under CCS (Figure 74). For the lowest income quintile, net child care costs are estimated to be 5.7 per cent of disposable household income under CCB/CCR, which falls to 4.3 per cent under CCS. There are reductions in the net costs of child care costs as a percentage of disposable household income for income quintiles 2, 3 and 4 but these are smaller than the percentage reduction for the lowest income quintile. For the highest income quintile, net costs of child care increase from 4.2 per cent of disposable household income under CCB/CCR to 4.9 per cent under CCS.
Figure 73: Net costs of child care as a percentage of gross household income, by income quintiles (child care families only), 2018-19
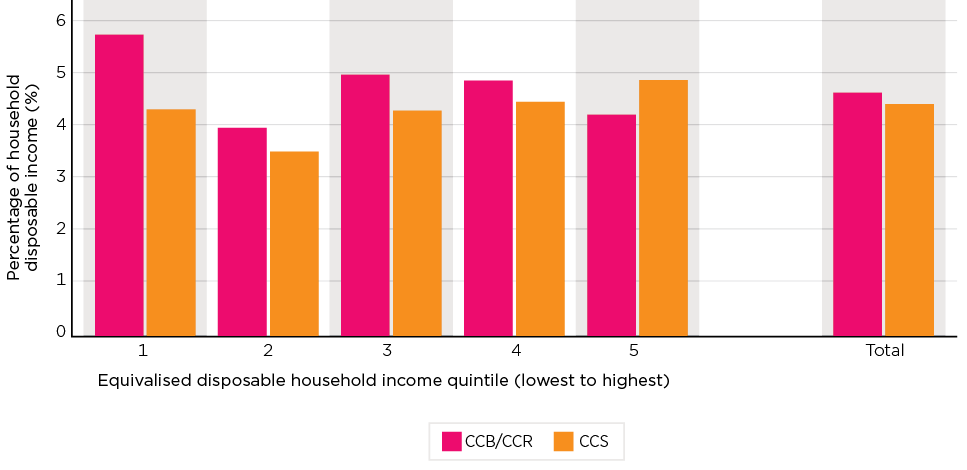
Notes: Income quintiles are based on child care using families only and use equivalised household income.
Source: Evaluation modelling using Survey of Income and Housing, ANU PolicyMod
Figure 74: Net costs of child care as a percentage of disposable household income, by income quintiles (child care families only), 2018-19
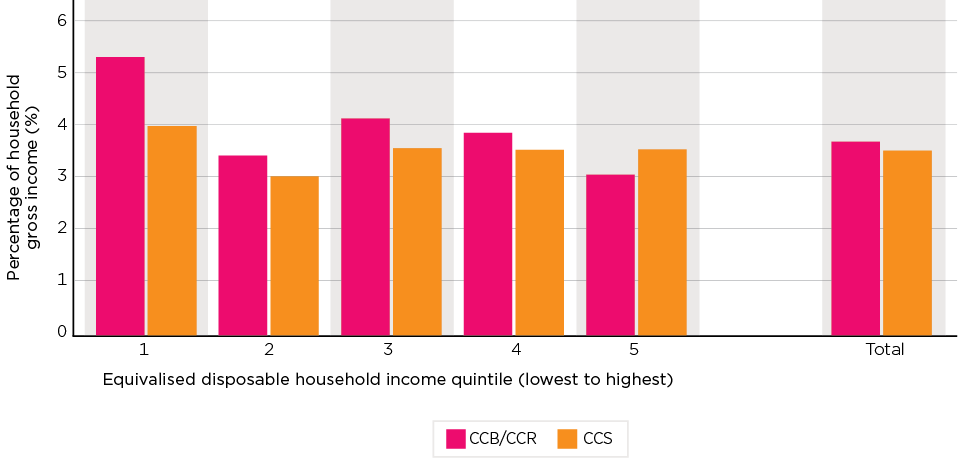
Notes: Income quintiles are based on child care using families only and use equivalised household income.
Source: Evaluation modelling using Survey of Income and Housing, ANU PolicyMod
4.5.12 Summary affordability
The modelling undertaken for the evaluation using the administrative data as the base file finds that the Child Care Package and the shift to the CCS has resulted in the net cost of child care being reduced from $4,875 under CCB/CCR to $4,364 per annum under CCS, and as a percentage of gross family income the Child Care Package is estimated to have reduced costs from 5.2 to 4.1 per cent. The median cost was reduced by the Child Care Package from $2,957 to $2,507 per annum, which translates into a reduction in cost from 3.0 to 2.7 per cent of gross family income. The fall in net costs of child care is greater for families that were facing higher costs under CCB/CCR than for families at the middle and lower end of the child care cost distribution.
Overall, almost two-thirds of families (62.2 per cent or about 686,000 families) had lower net costs under CCS, almost 1 in 10 families (8.6 per cent or about 95,000 families) had more or less the same net costs and 3-in-10 (29.2 per cent or about 323,000 families) had higher net costs under CCS than under CCB/CCR.
There has been a redistribution of subsidy from the top end of the income distribution (top 10 per cent of child care families). Families up to and including the 14th income vigintile (a gross family income of up to $157,335 per annum) have experienced a reduction in the median net costs of child care (measured as a percentage of gross family income). The reduction in median costs as a percentage of gross family income is largest for families in the lowest income vigintile, and then gradually becomes smaller up to the 15th income vigintile. Families in the 17th and 18th income vigintiles have a median change in net child care costs of zero, and families in the 19th and 20th income vigintiles (incomes in excess of $240,817 per annum) experienced substantial reductions in child care subsidies received and an increase in net costs.
Families with the following characteristics have relatively large reductions in net child care costs as a result of the Child Care Package:
- single parent families
- families with larger numbers of children, with the reduction in cost relatively increasing for families with 3 or more children using care
- families with the youngest child using child care being under 5 years of age
- families that use larger amounts of care
- single parent families in which the parent receives a part or full-rate income support payment and couple parent families in which both parents receive a full-rate income support payment or at least one parent receives a part-rate income support payment.
There are similar reductions in median net child care costs as a percentage of gross family income for families whose most common type of care used was for-profit and not-for-profit Centre Based Day Care. There is a very substantial reduction in net costs for families using for-profit Family Day Care and a smaller reduction for families using not-for-profit Family Day Care. There is little change in net costs for families whose main type of care is Outside School Hours Care and a very substantial increase for families whose most common type of care used is for-profit In Home Care.
The median net child care costs, as a percentage of gross family income, is lower for all hours of care used except for families paying for one to 5 hours of care per child per week, who experienced a slight increase in median costs. The reduction in median child care costs as a percentage of income is much larger for families paying for long hours of care than for families paying for shorter hours of care.
There are reductions in the median cost of care for families that receive ACCS, and the reduction is similar to the reduction (in terms of the percentage of gross family income) for families that did not receive ACCS during 2018-19.
The regression modelling shows that the changes in net costs by income level are not explained by other factors. It also shows that much of the differences in the impact of the Child Care Package on net costs between families with different characteristics is due to differences in income, hours of care used and other factors, rather than the characteristics itself. The main exceptions are some substantial differences that remain for hours of care paid for, and type of care, with increases in for-profit In Home Care and a reduction for families using for-profit Family Day Care.
The conclusion about the impact of the Child Care Package on affordability drawn from the modelling using the Survey of Income and Housing data is in broad terms consistent with the conclusions drawn from the more detailed modelling undertaken using the administrative data.
4.6 Debt
This section considers 3 forms of debt. First, debt related to income reconciliation, which is a debt owed to the government. Second, debt related to overstating activity levels, which is a debt owed to the government. Third, debts incurred by families to services.
4.6.1 Reconciliation debts to the government: over- and under-stating income
To determine the amount of CCS paid during the year, families are required to provide an estimate of their annual income to Services Australia and to update this if their income changes during the course of the year. If income is under-reported during the course of the year, then the family is potentially paid more CCS than they are actually entitled to and incurs a debt at the end, when their income as reported to the ATO is used in reconciliation. Small over-payments of CCS do not result in an actual debt payable to the Commonwealth because, in most cases, the actual subsidy paid to providers is 95 per cent of the CCS and 5 per cent of parents' actual entitlement is withheld.93 After annual reconciliation, the amount withheld is either paid to families or used to offset any debt they may have to the Commonwealth (e.g. because an underestimation of annual income has resulted in the subsidy being paid at an incorrect rate). Conversely, if income is over-reported during the course of the year and the family is paid less CCS over the course of the year than they are entitled to, they receive a higher reconciliation payment at the end of the year.
The CCS administrative data contains data on reported income over the course of the year and reconciled income data. Table 49 shows the ratio of reconciled annual adjusted taxable income to average reported income over the course of the year by income group. This provides a measure of the extent to which there is any significant systematic over or under-reporting of income. For the child care population, as a whole, the ratio of the median reconciled income to reported income is 100.3 per cent and the mean is 101.8 per cent, which suggests that there is no systemic under- or over-reporting of income. There is, however, a significant proportion of families that substantially under or overestimate their income. At the 5th percentile reconciled income is 62.7 per cent of reported income and for the 95th percentile it is 145.4 per cent.
For most income groups, the median ratio of reconciled to reported income is close to 100 per cent. For income categories less than $240,839 (up to and including decile 9) the ratio varies from 97.5 per cent to 105.6 per cent. The implication of this is that if CCS was overpaid by more than 5 per cent then the family would be expected to have incurred a debt to the government. For the highest income decile (income in excess of $240,839), the median ratio of reconciled income to reported income is 110.9 per cent and hence the families at the median would have incurred child care debts to the government. For all income groups, the ratio of reconciled to reported income for the 95th percentile is substantial, ranging from 130.0 per cent to 170.0 per cent and thus would have incurred significant child care debts to the government.
| Gross Income deciles | At percentile point a: | At mean | Number of families | ||||
|---|---|---|---|---|---|---|---|
| p5 | p25 | p50 | p75 | p95 | |||
| Ratio of reconciled to reported income (%) | (count) | ||||||
| <$31,432 | 35.4 | 70.6 | 100.0 | 106.7 | 150.8 | 92.4 | 75,586 |
| $31434-$50,838 | 49.1 | 80.0 | 97.4 | 115.1 | 170.0 | 100.3 | 79,627 |
| $50,839-$72,000 | 56.7 | 84.5 | 98.5 | 112.7 | 154.3 | 100.3 | 81,932 |
| $72,001-$93,703 | 62.8 | 86.4 | 97.5 | 108.7 | 145.0 | 99.2 | 82,528 |
| $93,704-$113,963 | 68.5 | 88.5 | 98.2 | 107.6 | 134.0 | 99.2 | 83,983 |
| $113,964-$134,534 | 74.2 | 90.6 | 99.0 | 107.8 | 131.1 | 100.3 | 84,085 |
| $134,534-$157,349 | 78.8 | 93.1 | 100.5 | 108.7 | 130.9 | 102.1 | 81,905 |
| $157,350-$187,658 | 82.3 | 95.5 | 102.4 | 110.5 | 132.6 | 104.2 | 82,375 |
| $187,659-$240,839 | 85.0 | 98.1 | 105.6 | 115.0 | 137.6 | 107.8 | 80,976 |
| $248,840+ | 88.2 | 101.1 | 110.9 | 125.4 | 160.0 | 115.4 | 58,844 |
| Total | 62.7 | 90.4 | 100.3 | 111.5 | 145.4 | 101.8 | 791,841 |
Notes: a Percentile points of the distribution of families by the ratio of reconciled to reported income within each income decile. Table population is restricted to the 75.2 per cent of families for whom reconciled income is available to the evaluation. Families for whom the ratio of reconciled to reported income is less than 0.2 or greater than 2 are excluded in order to reduce their undue influence on the mean. Income deciles based on reconciled gross family income.
Source: Evaluation modelling using 2018-19 administrative database
The microsimulation modelling of the 2018-19 administrative data can be used to estimate the extent to which families received more benefits than they were entitled to, due to underestimating the income reported to Services Australia. The approach is to compare the amount of CCS modelled over the year using the income reported to Services Australia to what they are entitled to when modelled using reconciled income. If they received more CCS over the course of the year than they were entitled to following the balancing of payments using the reconciled income, then their entitlement is adjusted. Because 5 per cent of CCS is withheld and paid at the end of the year, if the amount of over-calculation of CCS is less than 5 per cent of the amount of CCS that the family is assessed as being eligible to receive, then the family will not need to pay any money back to the government and the amount of withheld CCS that they receive will be reduced by this amount.
Of families for whom reconciled income was available, the process of reconciliation of income led to two-thirds (67.5 per cent) either having received the correct amount of benefit or less benefit than they were entitled to. A further 16.4 per cent received more benefits than they were entitled to, but this amount was less than 5 per cent of the benefit received over the year and hence they received a partial reconciliation payment and 16.1 per cent received more than 5 per cent additional subsidy and hence would have had to pay a refund.
Table 50 shows the amounts of child care debt due to under-reporting of income.94 Two measures of debt are provided. The first includes amounts that are less than 5 per cent of the amount of benefit received during the year, and the second includes only amounts that are greater than 5 per cent and hence the family would have been required to repay some of the CCS they received to the government.
Across all families in the child care system (for whom reconciled income data was available) and including debts that are less than 5 per cent of the amount of benefit received, the average debt is $208 per annum, which is 3.2 per cent of benefits or just 0.1 per cent of gross family income (Table 50). Restricting the analysis to the 32.5 per cent of families with a debt, the average debt is $638 per annum and the median $225. This is 9.8 per cent of benefits or 0.4 per cent of income.
Considering only debts greater than 5 per cent and the portion of the debt above 5 per cent of benefits received over the year, the average debt across all families is $171 and for families with a debt it is $1,059 per annum and the median is $580 per annum. For the 16.1 per cent of families with this type of debt the average amount in excess of 5 per cent of benefits and hence money that needs to be repaid is 16.7 per cent of benefits and the median amount is 10.1 per cent of benefits. While this is a substantial percentage, it is only a small percentage of income; the mean debt is 0.6 per cent of income and the median debt is 0.4 per cent of income.
| All debt | Debts greater than 5% of CCS - portion in excess of 5% of CCS | |||||
|---|---|---|---|---|---|---|
| Value of debt ($) | As proportion of subsidy (%) | As proportion of income (%) | Value of debt ($) | As proportion of subsidy (%) | As proportion of income (%) | |
| All families | ||||||
| mean | 208 | 3.2 | 0.1 | 171 | 2.7 | 0.1 |
| p25 | - | 0.0 | - | - | 0.0 | 0.0 |
| p50 | - | 0.0 | 0.0 | - | 0.0 | 0.0 |
| p75 | 53 | 1.8 | 0.04 | - | 0.0 | 0.0 |
| Families with a debt | ||||||
| mean | 638 | 9.8 | 0.4 | 1,059 | 16.7 | 0.6 |
| p25 | 60 | 2.0 | 0.05 | 205 | 6.9 | 0.1 |
| p50 | 225 | 4.9 | 0.2 | 580 | 10.1 | 0.4 |
| p75 | 671 | 10.5 | 0.5 | 1,261 | 16.7 | 0.8 |
Notes: Table population is restricted to the 75.2 per cent of families for whom reconciled income is available to the evaluation
Source: Evaluation modelling using 2018-19 administrative database file
In order to understand the impact of child care debt to government on families, it is important to understand how the prevalence and amount of debt varies with income. Figure 75 shows how the estimated child care debt varies by income level and as a percentage of income, using the amount of debt in excess of 5 per cent of CCS measure and restricting to families that have a child care debt. There are virtually no child care debts (due to under-reporting of income) for families up to and including the 6th income vigintile. The average value of the debt then gradually increases with income to be $944 for income vigintile 19 and jumps to $2,706 for the highest income vigintile.
While the value of the debt is quite large for the higher income groups, particularly income vigintile 20, as a proportion of gross family income, it is very small for all income groups and even for income vigintile 20 it is less than one per cent of income (0.7 per cent) (Figure 75).
Figure 75: Estimated child care debt due to under-reporting of income, and debt as a percentage of gross family reconciled income, families with a child care debt, by family gross income vigintile, 2018-19
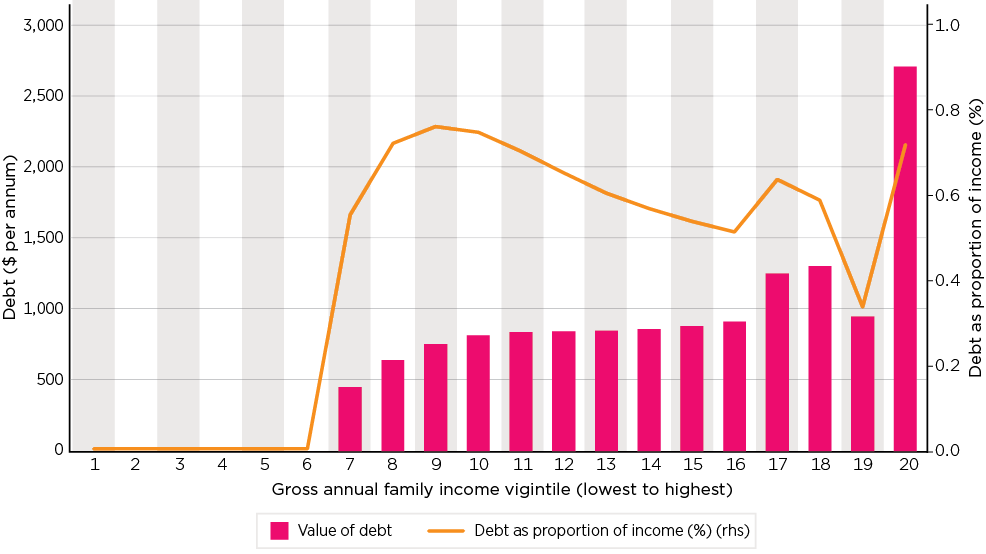
Notes: Table population is restricted to the 75.2 per cent of families for whom reconciled income is available to the evaluation. Debt in this figure refers to debts in excess of 5 per cent of CCS received during the year and are thus amounts in excess of the 5 per cent of CCS received. See Table 40 for the income ranges that apply to each income vigintile.
Source: Evaluation modelling using 2018-19 administrative database file
Parent perspectives on the end of year balancing
The Child Care Package Family Survey asked child care using parents about the extent to which they were concerned about ending up with a child care debt as the result of the end of year reconciliation of their income and having a debt due to not getting their activity details correct. They were also asked about how confident they were that if they report their income accurately, they would not have a debt at the end of the year, and if they end up with a debt that they will be treated fairly by Centrelink.
In September 2019, 44.0 per cent of respondents indicated they were concerned about the possibility of having a debt after balancing by Centrelink at the end of the year (Figure 76). There was further concern about how this would be dealt with by Centrelink, with 31.8 per cent not being confident that they would be treated fairly by Centrelink if they have a debt.
Most parents reported that they were confident that they would not have a debt if they reported their income accurately (73.4 per cent agreed or agreed strongly with this). Further, parents did seem to link their worries about getting their activity test details right to worries about debt, with half the parents saying they were worried they would have a debt if they did not get these details right. We note that previously we have reported that where parents have commented on lack of understanding of aspects of the CCS, such comments are often related to concerns they will be faced with a debt at the end of the year.
While the analysis of the administrative data shows that for the majority of families that under-reported their income to Centrelink, the 5 per cent withholding of CCS by Centrelink means that they do not have to repay any CCS. As reported in Chapter 3, survey data of families using child care reveals that the 5 per cent withholding was the least well understood aspect of the CCS.
Figure 76: Parent perspectives on end of year balancing and debts, September 2019
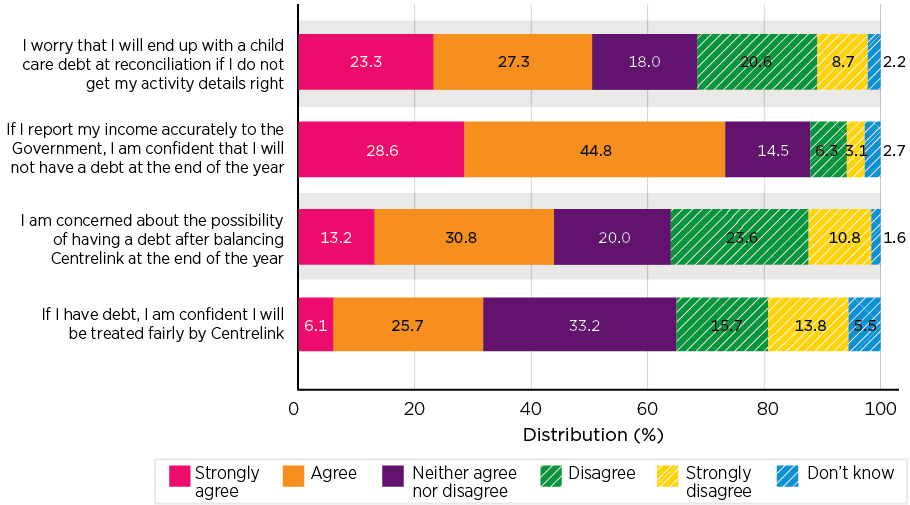
Source: Child Care Package Family Survey, Wave 2 (September 2019)
The September 2019 Child Care Package Family Survey also asked parents if they had taken any actions aimed at avoiding debt. A majority (out of 512 parents) indicated that they had taken some actions:
- 52 per cent reported that they overestimated family income.
- 43 per cent reported that they updated their details regularly to be accurate.
- 6 per cent reported that they underestimated their activity hours.
- 5 per cent reported that they increased their withholding percentage
- 24 per cent reported doing none of these.
The analysis of difference between reconciled and reported income using the administrative data reported above in Table 49 is broadly consistent with the survey data, with the median ratio of reconciled to reported income being very close to 100 per cent. Where families overestimate their income, the median ratio of reconciled to reported income is 0.894, and where they underestimate their income the median ratio is 1.122. Parents in higher income households (incomes >$173,000) were the most likely to report taking no actions to avoid debt. One possible reason for some discrepancy is that while they may tend to overestimate their recurrent income from employment, they may neglect other forms of income such as interest and capital gains that form part of reconciled income.
In interviews with low income parents, there was generally a low level of concern about the reconciliation process. Some parents in this sample explained that they were familiar with the annual reconciliation, likely because they had experienced similar processes as part of other Centrelink benefits, such as the Family Tax Benefit. However, generally low concern was apparent across this sample, irrespective of whether participants were familiar or unfamiliar with the reconciliation process.
4.6.2 Debts to services
The other type of child care debt that families may incur is to services. This was an issue that emerged in in-depth interviews with service providers and a range of stakeholders undertaken shortly after the transition to the new system in late 2018 and 2019. Most interviewees discussed debt or related issues with payments that they considered had had significant flow-on effects for services.
One recurrent theme was the creation of debt when services estimate the subsidy rate prior to this being established and charge the families what the service expects to be the net cost to them. While services are not supposed to estimate the child care benefit prior to the claim being approved, the reality is that many families do not have sufficient money to pay the unsubsidised fee prior to their claim for CCS being assessed by Centrelink. Lengthy processing times, reportedly due to third party software system errors and Centrelink processing backlogs, meant that individual debts accrued and, in some cases, became quite significant.
Other reasons services reported for families having debts to services are:
- third party software and Centrelink generating incorrect or inconsistent information
- families not understanding that enrolment happened in 2 stages and so failing to confirm their enrolment
- when backpay was made directly to families instead of services and families spent the back payment not understanding that it was CCS or ACCS backpay that should be passed on to services. It was reported that payments appeared in families' bank accounts as an unspecified Centrelink payment, without families being advised of the reason for the payment. In some of these cases, services were then unable to recoup these debts from families.
Debt issues were also reported as arising with ACCS when families had set their hours of care under one ACCS certificate and applied for and expected another determination, and so maintained those hours. If the second determination was not granted, the family owed full fees for the additional hours of care they had used and owed a debt to the service. Some services outlined specific cases where a family had accrued debt in relation to ACCS (Child Wellbeing) and noted that the 28-day backdating limit was particularly challenging for families who were in crisis. This backdating limit determines that CCS will only be paid for up to 28 days prior to an application being approved, so if there are significant delays in CCS or ACCS approval processes, parents will be liable for payment of full fees to their child care service for the period of time not within these 28 days. This has contributed to real affordability issues and debt for some families when the approval process has been protracted.
The other problem is, too, when a family joins up, and if you've got 28 days minimum, so it could be six to eight weeks before that CCS comes through and that person's got three children and they've just started a job because they need money, all of their money goes out in child care for the first six to eight weeks. How can they sustain that?
[CBDC provider, March 2019]
Some interviewees were specifically concerned that recalculations of CCS and retrospective corrections to payments that resulted in families owing fees to a service were making child care services into 'debt collectors for the government'. These services discussed balancing their need to be a viable business with wanting to support children and families. It was reported that this was especially difficult for services needing to recover unpaid fees from families for previously balanced accounts and retrospective corrections. This was compounded where families were vulnerable or disadvantaged and the service was concerned that pursuing debt or limiting services would impact the wellbeing and safety of the child. More detail about parent experiences of debt, and the reasons for that debt, are discussed below.
The July 2019 SELCS asked services about the extent to which parental debt at their service had changed since the July 2018 changes to the child care system. Specifically, services were asked whether the amount of debt (in dollar terms) incurred by families at their service had increased or decreased, the overall number of families at the service carrying a debt, the amount of debt (in dollar terms) the service carries because of unpaid fees, and the length of time it takes for families to pay off incurred debts.
About half the services who responded to the July 2019 SELCS reported that the experience of debt at their service was unchanged from prior to the introduction of the Child Care Package. Around 30 per cent reported some increase in debt-related experiences at the service and only about 10 per cent reported fewer debt related problems as compared to prior to the changes to the child care system.
This includes:
- 32.6 per cent with a moderate to large increase in the amount of debt (in dollar terms) incurred by the families at their service.
- 28.1 per cent with a moderate to large increase in the overall number of families carrying debts at the service.
- 31.1 per cent with a moderate to large increase in the amount of debt (in dollar terms) the service is carrying because of unpaid fees.
- 31.1 per cent with a moderate to large increase in the length of time it takes families to pay off incurred debts.
Figure 77: Service reports about changes in debt experiences at their service, July 2019
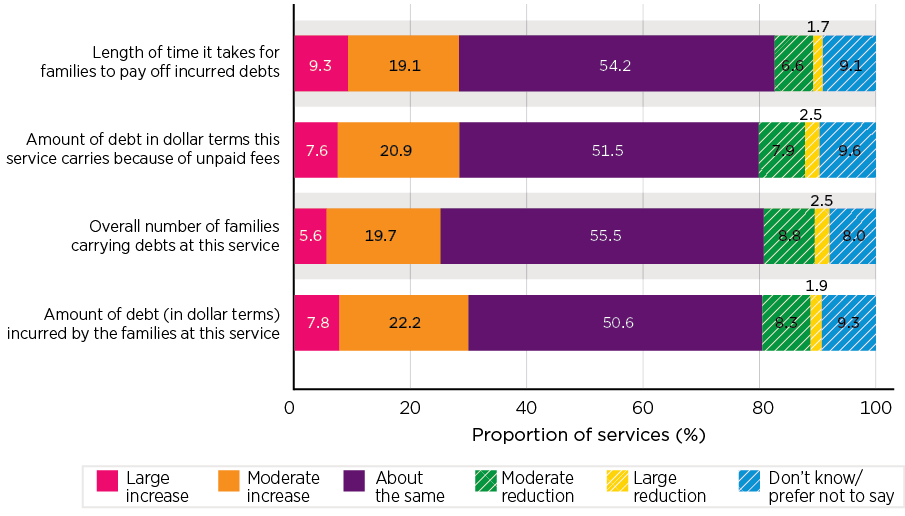
Source: SELCS Wave 2
By service type, those most likely to have reported moderate to large increases in any of these were the In Home Care services (Table 51). Services were markedly less likely to report that there had been a moderate to large reduction in the amount of debt, number of families carrying debt, the amount of debt carried by services and the length of time it takes for families to pay off incurred debts.
| Service type: | ||||
|---|---|---|---|---|
| CBDC | FDC | OSHC | IHC | |
| Proportion reporting (%) | ||||
| Moderate to large increase | ||||
| Amount of debt incurred by the families at this service | 36.1 | 36.1 | 27.0 | 67.3 |
| Overall number of families carrying debts at this service | 30.6 | 32.7 | 21.2 | 52.7 |
| Amount of debt this service carries because of unpaid fees | 34.5 | 31.9 | 25.7 | 58.3 |
| Length of time it takes for families to pay off incurred debts | 34.6 | 33.8 | 24.9 | 49.1 |
| Moderate to large reduction | ||||
| Amount of debt incurred by the families at this service | 10.7 | 6.3 | 12.5 | 2.1 |
| Overall number of families carrying debts at this service | 12.6 | 9.9 | 11.9 | 7.6 |
| Amount of debt this service carries because of unpaid fees | 10.5 | 9.1 | 13.7 | 0.0 |
| Length of time it takes for families to pay off incurred debts | 8.0 | 7.9 | 11.4 | 0.0 |
Note: 'Don't know' and 'Not applicable (Service not operational prior to July 2018)' excluded from analysis.
Source: SELCS Wave 2
4.6.3 Summary - debt
While there are a substantial number of families who under-report their income during the course of the year to Centrelink and hence many receive more benefits than they are entitled to, for most income groups the median ratio of reported to reconciled income is close to 100 per cent and it is only the highest income groups that have a substantial under-reporting of income. The withholding of 5 per cent of CCS means that about half the families that under-report their income end up with a debt to the government because they received more than 5 per cent CCS than they end up being entitled to. In total 16.1 per cent of families received more than 5 per cent additional subsidy.
The average value of the excess debt across all families is $171 per annum or 0.1 per cent of gross family income. Among families with a debt, the average value of the debt is $1,059 per annum. While this is substantial, it is largely owed by higher income families and the value of the debt is 0.6 per cent of gross family income on average. While, overall, it appears that debt to the government is not a major issue, the debts can be quite substantial. There are a minority of families that end up with substantial debts, although these are largely high or very high income families in this situation.
It appears that debts owed by families to services is a more problematic issue. These debts arise because of the fact that the delays in claims for CCS being processed by Centrelink combined with the reality that many families do not have the money to pay the full unsubsidised fees means that services end up estimating the subsidy rate and sometimes they overestimate the amount of CCS that the family will be eligible for and hence the family incurs a debt to the service. Speeding up the processing of claims for CCS and potentially improving the ability of families and services to accurately estimate CCS eligibility would reduce the extent of this problem.
4.7 Decomposing sources of change in affordability
This section provides a high-level summary of the contribution that the different elements of the Child Care Package make to the value of the subsidy paid to parents and the cost of this to government. The approach is to run the modelling of the amount of CCS received a number of times but in each case to 'switch off' one of the key affordability related components of the new system and replace it with an approximation of what it would have been under the former Child Care Benefit / Child Care Rebate system. The impact of each these scenarios on the total amount of child care expenditure is calculated and this is used as an indicator of the significance of the particular component of the system.
The alternative scenarios modelled:
- The 'no hourly rates cap' scenario estimates CCS paid using the actual hourly dollar rate for the weekly sessions (fees divided by hours).
- The 'CCB activity test' scenario estimates CCS paid using the simpler CCB activity test (for under 15 hours of activity per week, then maximum hours subsidised is 24. The maximum number of subsidised hours for activity over 15 hours per week is 48). The test has no reference to income, in contrast to the CCS activity test.
- The 'CCR subsidy percentage' scenario estimates CCS paid as if the subsidy percentage was a flat rate of 50 per cent (as was the case for CCR under the previous system) rather than the income tested tapered system operating under CCS. This isn't strictly comparable to CCR, however, as CCR was based on the difference between total fees and the child care benefit (CCB), rather than total fees as is the case under CCS.
- The 'no annual subsidy payments cap' estimates CCS paid with no reference to the annual cap in subsidy received ($10,190 in 2018-19).
The results are presented in Table 52. The key points are that the hourly fee rate cap and the more graduated activity test have a small but non-trivial impact on the amount of subsidy received. If there was no hourly rate cap, it is estimated that expenditure on CCS would have been $127 million (1.7 per cent) higher in 2018-19, and if the former activity test had applied then expenditure would have been $90 million (1.2 per cent higher). The tapering of the CCS rate reduces expenditure by $1,820 million if the CCB/CCR subsidy percentage had applied.
Given that net expenditure is estimated to be $455 million higher under the CCS system and the combined effect of the hourly rate cap, graduated activity test, annual subsidy payment cap and the tapering of the CCS percentage is to reduce expenditure by $1,647 million, then the effect of a higher subsidy payment rate is to increase expenditure by $2,102 million.
| Modelling scenario | Total expenditure (% million) | Impact on expenditure (% million) |
|---|---|---|
| 2018-19 modelled CCS/ACCS, reconciled income | $7,682 | - |
| 2018-19 modelled expenditure (CCS/ACCS) from administrative data file, reconciled income, no hourly rates cap | $7,809 | $127 |
| 2018-19 modelled expenditure (CCS/ACCS) from administrative data file, reconciled income, applying CCB activity test to weekly hours cap | $7,772 | $90 |
| 2018-19 modelled expenditure (CCS/ACCS) from administrative data file, reconciled income, applying CCR subsidy percentage (50 per cent) in place of CCS tapered percentage | $5,862 | -$1,820 |
| 2018-19 modelled expenditure (CCS/ACCS) from administrative data file, reconciled income, no annual subsidy payments cap for higher income ($10,190) | $7,705 | $24 |
Source: Evaluation modelling using 2018-19 administrative database file assuming constant 2018-19 child care costs and usage
4.8 Summary - affordability
A key objective of the Child Care Package was to improve affordability, especially for low and middle income families, and to reduce the extent of future increases in the costs of child care. This Chapter reports the analysis of the impact of the changes to the child care system on the costs of child care to families and its affordability.
The main approach used to estimating the impact of the Child Care Package on affordability is static microsimulation, which models what individual families would have received under the former CCB/CCR policy and compares to a modelling of what would be received under the current CCS policy. The results of modelling at the individual family level are then aggregated to produce a picture of the impact of the changes for the population as a whole or for different population subgroups. The modelling is static in the sense that any potential behaviour change as a result of the policy change is not taken into account. The microsimulation modelling has been undertaken using the population of families using child care prior to the changes (prior to July 2018) and the population of families using child care post the changes (post June 2018). The conclusions about the impact of the changes on affordability are the same based on the pre-policy change and post-policy change population. In the evaluation, the post-policy change population (families using formal child care in 2018-19) is used for the microsimulation, which also means that the 2018-19 levels and patterns of child care fees and usage are used for the modelling.
The changes were designed to increase affordability, increasing the overall generosity of the child care subsidy system by increasing the level of income testing of CCS as compared to the previous CCB/CCR system and paying a greater proportion of the child care subsidy to low income, middle and upper income families. It is estimated that the shift to the CCS has resulted in an additional expenditure of $453 million in 2018-19 as compared to what would have been spent under the previous CCB/CCR system. This is an increase in expenditure of 6.3 per cent.
Based on the microsimulation modelling using the administrative data, it is estimated that the Child Care Package has reduced the median annual net cost of child care from $2,957 to $2,507. Expressed as a percentage of gross family income, the median net cost of child care is modelled to fall from 3.0 per cent under CCB/CCR to 2.7 per cent under the replacement CCS. While this is a substantial decrease in the net cost of child care in percentage terms, it is relatively small in relation to gross family income. Overall, almost two-thirds of families had lower net costs under CCS, almost 1 in 10 families had more or less the same net costs and 3-in-10 had higher net costs under CCS than under CCB/CCR.
While there has been a reduction in the net cost of child care, the impacts across the income distribution are not uniform. The net costs of child care have been reduced as a result of the Child Care Package for families up to around the 14th income vigintile (gross family income of $145,226-$157,335 per annum), with the reduction in costs being largest for the lowest income families. For families in the 15th to the 18th income vigintile ($157,335-$240,818 per annum) there is little difference in net child care costs. For the highest income families (incomes in excess of $240,818) the net costs increase quite substantially, particularly for families with an income in excess of $308,189 per annum.
There have been larger gains for some groups, particularly: single parent families; with 3 or more children using care; with the youngest child using child care being under 5 years of age; using a large number of hours of care; and single and couple parent families receiving income support payments. However, once income and other factors are taken into account, substantial differences remain for: number of children using care; and very long hours of care.
There have also been differences between types of services families use95 and whether these are for-profit or not. The modelling results indicate that, keeping fees as a constant, the impact of the Package is most beneficial to families using for-profit Family Day Care Centres, and that those using for-profit In Home Care have the most substantial increases.
The reductions in median net child care costs are largest in geographic areas with the lowest socio-economic status, with increases in costs in the most advantaged areas. There were also increases in costs in very remote areas. However, the geographic differences appear to be explained by other factors such as differences in income and hours of care used.
Microsimulation modelling was also undertaken using the ABS Survey of Income and Housing as the population base file. While this survey has limitations for the purpose of modelling child care, including relatively small sample sizes and not having the necessary activity data, it does have the big advantage of providing a measure of disposable (after personal income tax) household income and it allows income to be adjusted for differences in household size and composition (i.e. equivalised), and this provides a better basis for comparing affordability for different families. As expected, the net child care costs to families are a higher proportion of disposable household income than gross family income. In addition, there are smaller differences in the net costs of child care as a percentage of income according to income level when disposable household income is used than when gross family income is used. The Child Care Package has reduced the income gradient in the net costs of child care as a percentage of disposable household income.
The Australian Bureau of Statistics CPI data shows that the introduction of the Child Care Package resulted in an 11.8 per cent decline in the costs of child care in September 2018 and that child care prices have been adjusted continuously since June 2018 at a faster rate than the overall CPI, which meant that by March 2020 almost three-quarters of the reduction in the child care CPI due to the Package had been lost. Child care costs as a proportion of average earnings are no higher now than they were in 1982. While the fall in the child care CPI following the introduction of the Child Care Package is smaller than the fall following other child care policy changes over the last 3 decades, the pattern of child care costs continuing their faster than CPI growth, following the initial policy change, has been associated with other changes to the child care subsidy.
Consistent with the CPI data, analysis of the fees charged by services shows that the change in the 12 months following the changes to the child care system were very similar to the increases in the 12 months prior to the changes to the child care system, with the exception of In Home Care, for which the hourly fee has increased dramatically. The elements of the Package that are designed to reduce the growth of child care fees - the hourly fee cap and the requirement for parents to make a co-payment to the cost of child care - do not appear to have been effective.
Data from surveys of parents shows, on balance, an increase in the proportion of parents who consider child care is affordable and in their perception of whether the introduction of the Child Care Package has resulted in them being better off. Consistent with the results of the modelling, the survey data points to more positive outcomes for single parents, relative to couples, and for lower and middle income households, relative to those on higher incomes. For high income families the survey data points to declining affordability.
The effects of the Child Care Package on affordability are related to the following components of the CCS:
- hourly fee rate caps
- percentage rate of CCS
- the annual cap
- approved hours as determined under the activity test.
Clearly the shift to income testing of the full amount of subsidy has had a substantial impact in reducing the amount of subsidy received by high income families. The hourly fee caps are having an impact in reducing the amount of subsidy received, with about 15-17 per cent of hours in the second half of 2019 charged above the hourly fee cap, with the modelling suggesting that if there was no hourly rate cap, an additional $127 million in subsidy would be paid to families. The effect of the hourly fee cap will almost certainly increase with the fact that the costs of providing child care rise faster than CPI due to wages increasing at a substantially faster rate than CPI.
The activity test and allowed hours also has a significant effect in reducing the amount of subsidy paid, with the modelling suggesting that if the old CCB activity test had applied, an additional $90 million in subsidy would be paid to families. It appears the activity test is not precluding many families from using child care, with 13.3 per cent of hours paid for in 2018-19 unsubsidised. While the proportion of hours that are unsubsidised increases with income, even among very low income families there are substantial numbers of unsubsidised hours of child care being used. The annual fee cap is having only a very small effect, with the modelling suggesting that if it did not apply, the amount of additional subsidy paid to families would be $24 million.
In summary, this analysis indicates that the introduction of the Child Care Subsidy and related changes has:
- increased Commonwealth expenditure on child care from what would have been about $7,229-$7,682 million for 2018-19
- reduced the net cost of child care for 62.1 per cent of Australian families using child care, had little if any impact on the costs of 8.6 per cent, and increased the net cost for 29.2 per cent.
- on average the largest gains were recorded by:
- low and middle income families
- families using long hours of child care
- families with a larger number of children using child care
- single parents
- families in which the parents received income support payments
- families using for-profit Family Day Care as their most common type of care.
- The groups adversely affected were:
- those with high incomes
- families using for-profit In Home Care as their most common type of care.
56 As has been noted in Chapter 2 ACECQA's assessment of the quality of ECEC services against the National Quality Standards reveals considerable variation in service quality ratings.
57 The objectives of the hourly fee rate cap are to limit the amount of subsidy paid to individuals and thus control expenditure, and restrain the level of fees charged by services.
58 In this Chapter all income amounts refer to annual amounts unless otherwise specified.
59 This requirement is not applied to some users who are eligible for some forms of safety net support through the Additional Child Care Subsidy.
60 To receive CCR, parents were required to have some work, training or study related commitments, although there was no minimum number of hours of such activity required.
61 The data used in this analysis is based on total fees charged to parents. This may include an amount for a late fee or some other additional charge. DESE advice is that this has little impact on the overall estimates, and this data is the same source used for their published information on fees.
62 It is noted that the Department does not publish data on the actual incidence of the cap in relation to individual child care users, but rather just publishes a high level indicator of the 'Number of services under/above the fee cap', which is based on the total fees charged by a service divided by the total hours charged for, in a quarter. They report, in December 2019, that 12.7 per cent of Centre Based Day Care services, 23.2 per cent of Family Day Care services and 15.7 per cent of Outside School Hours Care services charge above the cap (DESE, 2019a, Table 3.4). This data does not, however, actually provide a measure of the number of families for whom the cap restricts the amount of CCS they receive.
63 Prior to the changes to the child care system in July 2018, fees for In Home Care were calculated at the child level. Following the introduction of the Child Care Package fees for In Home Care shifted from being charged at the child to the family level. In order to present comparable data before and after the shift to family level fees, In Home Care fees before July 2018 have been converted to the family level.
64 It is noted that this treatment may tend to underestimate the proportion of children who are actually attending school and who are subject to a lower cap than that used in the calculation and hence underestimate the proportion in excess of the cap. It is not considered that this significantly impacts results.
65 See footnotes to Table 6.
66 Geographic location of families is derived from the location of the service that the family uses. For families that use services in more than one geographic location during the course of the year the location of the service to which they pay the largest amount of child care fees is used.
67 The results are very similar when actual CCS/ACCS received during year is used (and thus based on unreconciled reported income rather than reconciled income) and when the modelled amounts of CCS/ACCS based on reconciled income are used for all lower to middle income thresholds. They only differ for higher income thresholds due to the average underestimation of reported income compared to reconciled income for higher income groups (see Section 4.6.1).
68 In exceptional circumstances, ACCS individuals can apply to receive more than 100 hours of subsidised care per fortnight. There are a range of exceptional circumstances including domestic violence, serious illness or a medical condition or hospitalisation preventing an individual from working or caring for their child, participation in a treatment or rehabilitation program to address substance abuse issues and complying with a compulsory obligation imposed by a court.
69 That is the income bands where the rate of taper changes from the previous band.
70 In September 2019 the social security benefit entitlement of a single parent with one child aged 8 years receiving full-rate Newstart and not receiving Rent Assistance was $25,007. The entitlement for a single parent with one child aged 3 years, receiving full-rate Parenting Payment and not receiving Rent Assistance was $34,390 and a single parent with one child aged 3 years, receiving full-rate Parenting Payment Single and receiving Rent Assistance was $38,617.
71 In the Second Reading Speech for the Family Assistance Legislation Amendment (Jobs for Families Child Care Package) Bill 2016, the responsible Minister the Hon. Christian Porter noted that there were concerns '… that existing programs that support disadvantaged and vulnerable families are complex, inefficient, poorly targeted and open to abuse. This is particularly the case in relation to the Community Support Program, special childcare benefit and the jobs, education and training childcare fee assistance payment'. The Minister said that the child care safety net aspects of the package would '…. Comprise a more integrated and targeted set of funding programs that leverage the increased Commonwealth investment in child care to provide the best early learning outcomes, particularly for those who need it most' (Porter, 2016).
72 If school holiday weeks are excluded the range is 15.2-17.8 per cent.
73 Figures for Centre Based Day Care and Family Day care excluded school holiday weeks.
74 In the explanatory memorandum for the original Jobs for Families and Child Care Package this was described as 'a provision that obliges approved providers to ensure that they recover, from individuals, the difference between a fee reduction (made available through CCS or ACCS) and the actual fee charged to the individuals, where there is a difference. The CCS payment is designed with a concept of cocontribution to the cost of child care. This provision intends to address an issue that has arisen with CCB where some child care services did not actually pursue the difference between fee reductions and actual fee charged to the individual' (Porter, 2017b, p. 87). In the accompanying Regulation Impact Statement (Department of Education and Training, 2015a), the Department indicated 'A minimum cocontribution from all child care users was seen by stakeholders as acceptable, fair and necessary. A cocontribution can encourage parents to be conscious of the fees charged and help keep downward pressure on child care fees' (p. 43).
75 Overwhelmingly, Centre Based Day Care services and Outside School Hours Care services charge on a sessional basis, as do a third of Family Day Care Services. Most Family Day Care services and In Home Care services charge on an hourly basis. See Section 5.4.2 for more details.
76 Weighted by the number of children attending the service.
77 In undertaking this analysis, it is emphasised that only 3 years of administrative data was available to the evaluation and that data beyond Q4 2019 was impacted by the COVID-19 response.
78 This fall was as a result of a May 2007 change in the way in which the Child Care Tax Rebate (CCTR) was paid. Instead of being paid through the tax system the payment was to be made through the Family Assistance Office. This change was triggered by a change in the treatment of the CCTR in assessment of the cost of child care in the CPI. The ABS estimates that without the change in treatment the Child Care Expenditure Class Index would have fallen, due to the changes in indexation by just 4.9 per cent. From the perspective of families this change in treatment of the CCTR did not have an impact on household budgets per se. Rather it can be considered that the previous operation of CCTR should be seen as decreasing their effective costs in the preceding periods, rather than occurring at this point.
79 Figures are for the occupation category Child Carers (ANZSCO 3 digit code 421) and from ABS (various years). 'Employee Earnings and Hours, Australia', ABS Catalogue No. 6306.0, ABS, Canberra.
80 The increase in CPI is calculated as the change from June 2006 to June 2018.
81 See details of these surveys in Chapter 2.
82 As at November 2019.
83 As the parent surveys were cross-sectional and not longitudinal, it is not possible to track individuals over time.
84 One possible bias in this data is the exclusion of those who may have ceased to use formal child care as a consequence of the impact of the package. This may lead to an overstatement of the extent to which families have benefited from the new policy.
85 In contrast to most of the other questions that used a 5-point scale, this question was asked on a 3-point scale of: agreement; neither agreement nor disagreement; and disagreement.
86 Reconciliation of income refers to the use of annual income as reported to the Australian Taxation Office, relative to the cumulative estimated income that families report to Services Australia over the year.
87 Under the CCB/CCR policy, only CCB was income tested and for families who were income tested off CCB income was not required in order to determine eligibility for CCR. There are several indicators that strongly suggest that the 2018-19 income data is more accurate than the 2017-18 income data, including implausibly large increases in the reported incomes between 2017-18 and 2018-19.
88 It is not possible to determine the actual income levels of this group as it is not possible to differentiate these families from other families who moved out of child care as part of the usual volatility of use. It is possible that they were more likely to be low income families.
89 However, as is shown in Chapter 6 it is estimated that well fewer than 1 per cent of children left the system as a result of the Child Care Package and so this limitation of the 2018-19 base file is not significant.
90 Unaffected is defined as CCS being within plus or minus 1 per cent of CCB/CCR.
91 Ideally, we would have also considered how the impact of the Child Care Package on affordability differs according to family employment. This information is, however, not available from the child care system administrative data and, therefore, family activity is used as a proxy.
92 The most common care type is the care type with the highest child care fees paid during 2018-19.
93 Parents can apply to have this proportion increased.
94 The term 'under-reporting' is used here to denote a difference between the sum of reported income and reconciled income. It is noted that this does not imply any deliberate understating of income, but can arise from a range of factors including under-estimation of capital income and lumpy income.
95 Service type is based on the most common service type a family used in the year.
5. Flexibility
This Chapter addresses the second outcome, that 'Child care services are accessible and flexible relative to families' needs, including disadvantage', with a focus on the flexibility of services with regard to the structure of hours and sessions. Accessibility is addressed in Chapter 6.
In the evaluation framework, the role of flexibility was identified as being important to improve access to child care for families by better aligning care provision with their needs. In some cases, this was seen in terms of aligning hours of child care charged for with those used, in others, to meet the needs of irregular working patterns or working non-standard hours. For these families, flexible care is viewed as important to support parents' paid employment. Also noted in the evaluation framework were questions such as being able to change or add a session of care at short notice.
In addressing issues of flexibility, this Chapter is focused on:
- the extent to which rigidity in the structure of provision of child care impacts on parental satisfaction, and poses a barrier to their workforce and other participation
- the factors that may constrain the provision of flexible child care
- the degree to which the Child Care Package has resulted in increased flexibility in service provision, including the role of the In Home Care program.
5.1 Background
Improving flexibility in child care provision was central to the Package and in the policy debates leading to it. It is a dimension of service provision that has been seen as having increased importance, with trends towards more flexible employment arrangements for many Australian families.
5.1.1 The nature of child care provision
In discussing the concept of flexibility of provision, the 2 central parameters considered here are hours of operation and sessions of care. In addition, there is the capacity of parents to flexibly use child care, changing when they use it and for what periods.
Hours of operation concern the question of when services provide care: on what days of the week; and the starting and finishing times.
A significant proportion of child care is purchased on a sessional basis. In the case of Centre Based Day Care, this was traditionally a day of care with the length of the session defined by the opening and closing times, or in the case of Outside School Hours Care, a before school session - from the opening of the service until the commencement of school, or after school care, from the end of school to closing. Variations to this existed. These included Occasional Care Services that offered shorter sessions or charged by the hour, and some services that offered half-day sessions. While Family Day Care frequently also used a sessional approach, there has been a strong trend towards charging on an hourly basis. Notwithstanding this, the nature and structure of sessions remains a core element of provision and is a focus here; in particular, how the length of 'sessions' has been impacted by caps on hours of care eligible for subsidy linked to the operation of the activity test.
5.1.2 Flexibility and the Child Care Package
While the language of the Package refers to 'reform for a simpler, more affordable, more accessible and more flexible early education and child care system' (Porter, 2016), the only explicit policy change addressing this were changes to regulatory requirements. These were described in the Government's response to the Senate report on the proposed legislation as: 'The Bill removes regulatory requirements that currently apply to child care services, including the hours per day and days per week a service must open. This will allow providers and services to be able to consider flexible options that may better suit their children and families, as well as their business' (Australian Government, 2017, p. 11).
Other elements of the Package also potentially impacting flexibility included:
- the abolition of the priority of access (see Section 1.1.7). While this can be seen as providing greater flexibility to services in relation to who they provide care for, it also has potential impacts on access, including access for vulnerable families and children. This is addressed in Chapter 7.
- the absorption of occasional care services within the Centre Based Day Care sector
- the redevelopment of the In Home Care program, one element of which is to enable the provision of child care to 'parents or carers of the child who are unable to access other mainstream child care options such as those who work non-standard hours, are geographically isolated or have families with challenging and complex needs' (DESE, 2020c, p. 8). This is addressed in Section 5.7.
- the requirement, for most enrolments, for a Complying Written Arrangement (CWA), a formal agreement between a child care provider and an individual to provide child care in return for fees.96 As well as details of the child or children for which care is to be provided, and fee information, the CWA includes information on whether casual or flexible care is needed or if the care will be provided on a routine basis, and if so, when and for how long (typically, usual start and end times of sessions) (See Figure 80.)
- a more complex set of allowed hours, including the reduction in the base number of hours for groups not meeting the activity test from 24 hours per week to 24 hours a fortnight. Along with Departmental material on 6-hour sessions, this resulted in a strong perception within the sector that services were expected to change their business operations to ensure there were short sessions that permitted children with 24 allowed hours per fortnight to attend for 2 days a week, by introducing a 6-hour session. (This also applies in respect of children with 36 allowed hours per fortnight.)
It was anticipated that as a consequence of the Package, there would be growth in the number of services offering shorter sessions of care and in changed operating hours and days. The abolition of minimum operating hours was also seen to allow all services to offer sessions of care to meet demand for casual or short sessions, such as that which had been the primary focus of occasional care services.97
More broadly, the Productivity Commission saw flexibility as being associated with a move to charging child care on an actual hourly use basis, rather than per session.
The removal of caps on occasional care, and the removal of requirements around the hours of operation that differentiate occasional care from other care - as recommended by the Commission - will make it harder for providers to sustain charging models based on hours booked. As such, the Commission expects that short-term enrolment where parents are charged on the actual hours their children are in care will become increasingly common (Productivity Commission, 2014a, p. 434)
This sentiment was further elaborated on by the then Minister for Education Birmingham, who declared 'it is unacceptable that families who routinely need and use only four, 6 or 8 hours of care are charged for 10 or 12 hours' (Bita, 2015). This, in conjunction with the requirement that services report on children's actual attendance, resulted in concerns in the sector that the Package was a first step towards subsidies being paid on the basis of per hour of use instead of sessions.
In the period of transition to the Child Care Package, a Child Care Services Business Support Resource was made available to services and providers. This was intended to help services to review their business and operation ahead of the introduction of the Package. This proposed 'some options and ideas child care services may want to consider to take advantage of the greater flexibility that will be supported from 2 July 2018' (Department of Education and Training, 2018b, p. 6). It included, as examples, variations in operating hours, offering different sessions to cater for groups such as shift-working families, examining the service's fee structure, and staff rostering. Services are also encouraged to consider these issues in the Child Care Provider Handbook:
Child care providers should consider changes that deliver flexible, cost-effective care and learning services for families. For example, providers could choose to offer parents receiving 36 hours of subsidy under the preschool category six sessions of six hours or four sessions of nine hours per fortnight. (DESE, 2019b, p. 90)
The Package and tensions in the length of session
The structure of the Package has 2 elements that impose constraints on how sessions of care are structured by services:
- Allowed hours places a limit on session lengths. Effectively to maximise the opportunity for parents to claim Child Care Subsidy, session lengths need to be structured in a way that is compatible with allowed hours. So, for example, for parents with an allowable 100 hours and using care for 10 days a fortnight, any session length over 10 hours leaves a portion ineligible for subsidy. Similarly, the allowable 24 hours per fortnight only enables regular attendance for more than one day a week if session lengths are 6 hours or less.
- The fee cap works in the opposite direction. As most services operate on a sessional basis, the calculated hourly fee is the session cost divided by its length. A longer session length reduces the calculated hourly fee, and hence permits a higher sessional cost without parents having their Child Care Subsidy impacted by the cap. Conversely a notional reduction in the length of a session increases the calculated hourly fee, and the probability that the fee cap is breached.
These tensions and other constraints on provision are considered further in Section 5.3.
5.2 Parents, flexibility and child care
The impact of demand for flexible working arrangements is frequently cited as one of the drivers of a requirement for more flexible child care, including in the provisions of the In Home Care program. There is, however, a complex relationship between these working arrangements and child care use.
While for some parents, having flexible working arrangements, such as working non-standard hours, imposes a high demand for child care that can accommodate these working arrangements, for others, this form of non-standard hours is used as a device for sharing child care with a partner, family or others. For example, it may involve one of the members of a couple working during the day, often with an early start, while the other works in the evening, or one working in a regular job on normal work days, and the other taking shifts on the weekend. The evaluation of the Australian Government's Child Care Flexibility Trials identified that this was frequently the case, showing that even when flexible care options are available, parents often prefer family-based solutions to their care needs, especially when care is needed on weekends, early mornings, evening or overnight. (Baxter & Hand, 2016)
Flexibility has both micro and macro aspects to it, as even minor child care inflexibility can cause problems for families. For example, a 10-minute difference between opening hours and when a parent needs to be able to leave their child in order to get to their job can in some circumstances act as a total barrier. This example equally identifies also a complementary role of flexibility in employment to enable parents to effectively manage their use of child care and other family responsibilities.
For those with less regular hours of employment, as well as obviously the questions of cost, and whether they have sufficient approved hours, decisions on using child care in a flexible fashion can also be affected by questions such as whether the child has an entrenched peer group of friends within child care, and how the educational role of child care is conducted, and the perceptions of parents around the importance of this.
Consideration of these questions also needs to take account of the nature of the child care sector, and the extent, or otherwise, that parents have a choice of services that they can use. Where there is a competitive market with multiple services that can be accessed by a parent, there is clear room for product differentiation and the capacity of various of these services to adopt quite different structures and offerings, rather than each service having to do so.
Parents' experience and perspectives on flexibility are considered below, initially focusing on the more qualitative and descriptive experiences and then analysing the more detailed survey questions.
5.2.1 Parental experiences and preferences
In both waves of the CCPFamS, in addition to more specific questions about their use of, and satisfaction with, child care, parents were invited to provide free responses on how they thought their child care options could be improved. Of those who responded to this, some 20-30 per cent identified issues related to service flexibility.
- The most commonly cited issues related to flexibility were those around the desire for flexible session lengths, including only paying for hours of care actually used, and charging per hour or half days.
- The second most common was the desire for their service to provide care beyond their current operating hours, with the needs of working parents to be able to drop off and pick up their children earlier and later than currently available, being most frequently cited.
- The third most common issue was a desire by some parents to be able to casually book days when needed or swap days. This was particularly common among those working rotating rosters or casually.
Additionally, highlighting the relationship between flexibility, access and choice, it was also common for parents to answer this question in terms of improvements to access (e.g. vacancies, lack of child care centres in area) or affordability (costs, impact of activity test).
These findings were also reflected in the reports by parents who participated in the case studies. The sample of parents from 4 of the case studies included families who worked varying or non-standard work hours and/or shift work, particularly Case Study 6 (shift work) and Case Study 7 (shift work and fly in/fly out work). Families with these work arrangements spoke about being dependent either on one parent taking the responsibility for managing child care (by working standard hours and managing all drop-offs/pickups, or by not engaging in paid employment) or by making complex child care and work arrangements that included juggling shifts between both parents (which often included evening, night or weekend work) alongside having informal care arrangements (primarily grandparents or other parents).
For example, one family member who was interviewed spoke of working two 8-hour shifts a week. She had previously worked 12-hour shifts, but once her eldest child started school, she could no longer work 12-hour shifts as the Outside School Hours Care did not open until 7 am. Her workplace was supportive and flexible, allowing her to change the length of her shifts to accommodate the needs of her family, whereas her husband's workplace did not have this flexibility (he was also a shift worker). This family member felt that the current child care system was geared towards parents working standard hours.
There are lots of people that do 12-hour shifts […] mostly for them, their [partners] work Monday to Friday, and they drop the kids off before work and pick them up on the way home. So, their children spend the whole day at child care. Or, alternatively, they work night shifts during the week and then just work weekends when their [partners] are home. Centre Based Day Care is really targeted for Monday to Friday workers
[Family using CBDC, August 2019]
For single parents working non-standard hours and/or shift work, the juggle between work and child care was often reported as more challenging. Family Day Care educators who provided evening and weekend care were identified as one option for such families needing care outside of standard hours. However, the availability of Family Day Care, and Family Day Care educators offering extended hours, within the case study sites varied substantially.
A demand by some parents for greater flexibility was also reported by services. In the baseline May/June 2018 SELCS, just before the introduction of the Child Care Package, services were asked if there was a demand for more flexible care options than currently provided. Across all service types, 26.9 per cent of services reported a demand by parents for more flexible care options.
5.2.2 Barriers and satisfaction
Lack of flexible child care as a barrier to increasing employment
The DESE/ORIMA parent survey asked parents whether they wanted to work more hours and, if so, what would assist them to do so. In this, they were asked to identify how many hours they wanted to work and questions about workplace and child care barriers.
Overall, as discussed in Chapter 8, only a small proportion of parents indicated that they wanted more, rather than fewer hours. For those who wanted to work more hours, many cited multiple barriers. This and the specific role of flexibility in child care provision are considered in Table 53. As shown in the table, while these respondents represent an estimated 116,000 parents saying they wanted to work more hours, with 74,493 citing the flexibility of child care as one reason, only 8,052 cited only child care reasons as a barrier, with flexibility being one of these, and just 2,015 that flexibility was the only barrier. These parents wanted to work an average of an additional 12.8 hours per week.
This highlights the extent to which, while the flexibility of child care is an issue for some working parents, caution needs to be exercised in seeing it as the major, or even the most significant barrier that parents face in seeking to increase their workforce participation. It also suggests that the net labour force contribution from increasing flexibility alone may be modest.
| Wanting to work more hours a, b | Persons | Additional hours wanted | |||
|---|---|---|---|---|---|
| At 25th percentile | At 50th percentile | At 75th percentile | Average | ||
| (count) | (hours) | ||||
| Total respondents | 116,449 | 8.0 | 13.0 | 21.0 | 16.5 |
| Child care flexibility is an issue | 74,493 | 8.0 | 12.5 | 24.0 | 17.0 |
| Only child care barriers, of which flexibility is one | 8,052 | 5.0 | 12.0 | 20.0 | 14.8 |
| Only flexibility cited as a barrier | 2,015 | 9.8 | 12.0 | 12.0 | 12.8 |
Notes: a In this wave of the survey this question was only asked of the respondent and not about their partner. This may lead to an underestimate of the overall potential labour market impact of a lack of child care flexibility, although the relativities of the categories are less likely to be impacted. b Only includes persons who indicated they wanted to work more hours and for whom the difference between their current hours of work as either an employee or self-employed and their desired hours of work was positive.
Source: DESE/ORIMA Parent Survey, November 2019
Satisfaction with flexibility of child care
The CCPFamS also asked families about their level of satisfaction with the flexibility of child care. This was part of a series of questions about satisfaction with aspects of child care. As illustrated in Figure 78, on balance, families rated their satisfaction with flexibility negatively, but markedly less so than they rated either affordability or having sufficient options to choose from, although slightly less negatively than it being easy to get the care that they consider they need.98
Figure 78: Parent satisfaction with aspects of child care, CCPFamS, September 2019
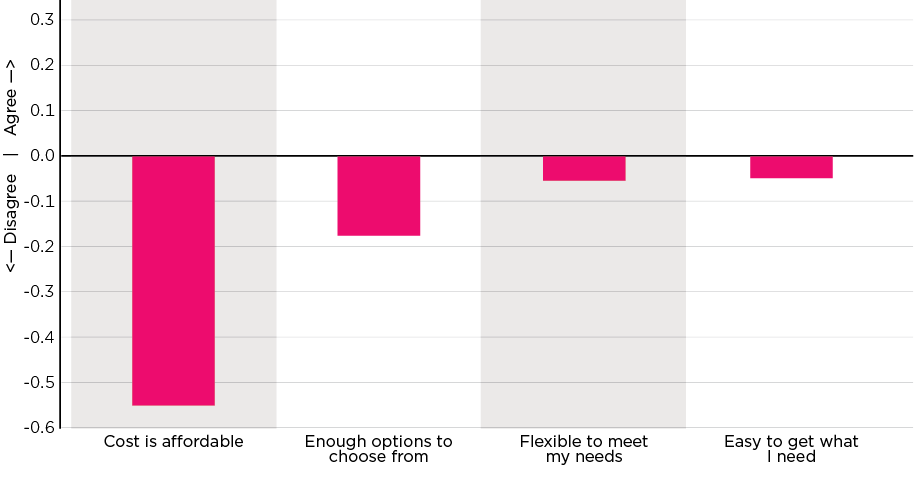
Notes: Questions were asked on a 5-point scale of strong agreement to strong disagreement. These have been coded to a single scale from +2 to -2, with positive values indicating agreement.
Source: CCPFamS Wave 2, September 2019
Multivariate analysis of the responses to the question on flexibility was undertaken to identify the family characteristics, including working arrangements that were associated with their experience. This is reported on in Table 54 and Table 55.
| Dependent variable: Satisfaction with child care flexibility (reverse coded - higher value is agreement) | Coefficient | P<|t| |
|---|---|---|
| Highest level of education | ||
| Secondary | base | |
| TAFE | -0.09 | 0.801 |
| University | 0.08 | 0.813 |
| Have youngest child under 4 | -0.13 | 0.505 |
| Family income | ||
| <$68,163 | base | |
| $68,163-$173,163 | -0.69 | 0.220 |
| $173,163-$252,453 | -0.91 | 0.118 |
| $252,435-$342,453 | -0.62 | 0.294 |
| $342,453-$352,453 | -2.36*** | 0.000 |
| $352,453 or more | -1.19* | 0.077 |
| Prefer not to say | -1.08 | 0.379 |
| Hours worked by respondent (weekly) | ||
| Under 15 | base | |
| 15-34 | 0.66* | 0.069 |
| 35-40 | 0.72** | 0.045 |
| Over 40 | 1.20** | 0.011 |
| Hours worked by partner (weekly) | ||
| Under 15 | base | |
| 15-34 | 0.05 | 0.931 |
| 35-40 | 0.24 | 0.691 |
| Over 40 | 0.15 | 0.790 |
| Respondent self-employed | 0.29 | 0.481 |
| Partner self-employed | 0.28 | 0.240 |
| Work hours vary week to week | ||
| Neither | base | |
| Partner only | -0.31 | 0.280 |
| Respondent only | -0.13 | 0.776 |
| Both | -1.01* | 0.071 |
| Works outside standard hours | ||
| Neither | base | |
| Partner only | 0.07 | 0.770 |
| Respondent only | 0.41 | 0.200 |
| Both | 0.04 | 0.898 |
| Works changing shifts | ||
| Neither | base | |
| Partner only | -0.58** | 0.016 |
| Respondent only | -0.49 | 0.266 |
| Both | -0.37 | 0.253 |
| Satisfaction with child care affordability | 0.30*** | 0.000 |
| Use CBDC | 0.23 | 0.334 |
| Use OSHC | 0.06 | 0.715 |
| Use FDC | 0.09 | 0.776 |
| Constant | 0.06 | 0.950 |
| n = | 239 | |
| r2 = | 0.222 | |
Notes: OLS regression with robust standard errors. *, **, *** indicate that the underlying coefficient is significant at the 90 per cent, 95 per cent and 99 per cent confidence levels respectively. Questions were asked on a 5-point scale of strong agreement to strong disagreement. These have been coded to a single scale from +2 to -2, with positive values indicating agreement.
Source: CCPFamS, September 2019
| Dependent variable: Satisfaction with child care flexibility (reverse coded - higher value is agreement) | Coefficient | P<|t| |
|---|---|---|
| Highest level of education | ||
| Secondary | base | |
| TAFE | -0.20 | 0.682 |
| University | -0.78* | 0.081 |
| Have youngest child under 4 | -0.22 | 0.583 |
| Family income | ||
| <$68,163 | base | |
| $68,163-$173,163 | 0.02 | 0.944 |
| $173,163-$252,453 | -0.86* | 0.067 |
| $252,435-$342,453 | - | - |
| $342,453-$352,453 | - | - |
| $352,453 or more | - | - |
| Prefer not to say | - | - |
| Hours worked by respondent (weekly) | ||
| under 15 | base | |
| 15-34 | -0.60 | 0.375 |
| 35-40 | -0.74 | 0.341 |
| Over 40 | 0.32 | 0.739 |
| Respondent self-employed | 2.39*** | 0.000 |
| Work hours vary week to week | -0.09 | 0.841 |
| Works outside standard hours | 0.12 | 0.733 |
| Works changing shifts | -1.37*** | 0.004 |
| Satisfaction with child care affordability | 0.29* | 0.069 |
| Use CBDC | -0.21 | 0.643 |
| Use OSHC | -0.39 | 0.316 |
| Use FDC | 0.37 | 0.620 |
| Constant | 1.62** | 0.010 |
| n = | 64 | |
| r2 = | 0.490 | |
Notes: OLS regression with robust standard errors. *, **, *** indicate that the underlying coefficient is significant at the 90 per cent, 95 per cent and 99 per cent confidence levels respectively. Questions were asked on a 5-point scale of strong agreement to strong disagreement. These have been coded to a single scale from +2 to -2, with positive values indicating agreement.
Source: CCPFamS, September 2019
While these models are not strong, particularly for couples in terms of wholly explaining the variation in satisfaction, they still provide some insight into the factors associated with satisfaction with child care flexibility. When interpreting the values of the coefficient, it is noted that a value of 1 equates to a step on the scale of agreement - that is, for example, the difference between 'satisfied' or 'very satisfied'. Key results were:
- A positive association with satisfaction with the affordability of child care and satisfaction with flexibility of child care. This may suggest that respondents have a generalised sentiment around child care, or that those who experience problems with flexibility have already been having to pay a premium for finding a workable arrangement, with this, in turn, being reflected in their affordability outcome.
- For both single parents, and more so for couples, those families with higher incomes are less satisfied with the flexibility of child care, with this being particularly marked, and statistically significant, for high income couples on incomes from $342,453 to $352,453.
- Self-employment is positively associated with satisfaction with flexibility, being more marked for single parents, where it is equal to 2 steps in the response categories. This may reflect the capacity of those who are self-employed to structure their employment around existing child care provision.
- There appears to no strong association between satisfaction with flexibility and the type of child care used.
- Turning to working arrangements:
- For couples there is a marked, and weakly significant, negative association where both the respondent and their partner work varying hours - equal to a step on the scale; a somewhat positive relationship, although not statistically significant, where the respondent works outside standard working hours but their partner does not; and a consistent negative association where one or both of them work changing shifts.
- For single parents, the only strong negative response is associated with working varying shifts, with this being equal to one and a third response categories.
This suggests, overall, that the key labour market groups who find child care not flexible to their needs are some higher income earners and those parents required to work changing shifts.
Satisfaction - capacity to change hours
One specific dimension of flexibility is the ability of parents to change their hours of care. Chapter 2 has presented this as part of the analysis of parental satisfaction with child care based on data collected in the DESE/ORIMA Parent Survey. Specifically, this found, using the aggregate score of responses:
- For parents with a reference child aged under 5 years, this aspect of child care provision was the second lowest in terms of importance to parents of the 6 aspects they were asked about, with all of the differences between this and the higher ranked dimensions being statistically significant. The only aspect ranked more highly was the cultural appropriateness of the service. For those parents with an older child, it was seen as being more important, but was still statistically significantly ranked below safety, and having trained educators, but above learning, and cultural appropriateness. Although children's socialising was also ranked more highly, the difference was not statistically significant.
- This dimension of child care provision had, however, the lowest level of satisfaction of the 7 aspects of provision considered, although, consistent with Table 53, the level of satisfaction was well above that related to affordability (see Chapter 4).
- Parents in November 2019 were statistically significantly less satisfied with this aspect than they were in June 2018.
- The level of satisfaction varied by type of care. In November 2019, the highest level of satisfaction with this aspect of flexibility was recorded in the Outside School Hours Care sector, with the level of satisfaction in this sector being statistically significantly higher than either of the other 2 sectors. While the difference between Family Day Care and Centre Based Day Care was not significant, the mean level of satisfaction with being able to change hours in Centre Based Day Care was much lower.
5.2.3 Summary - the parent perspective
There is clearly a demand from some parents for more flexible child care provision. One major driver of this is workplace demands, in particular shift work. Additionally, for those using Centre Based Day Care in particular, a significant group of parents wanted a capacity to use these services on a more casual basis, rather than being locked into rigid approaches.
Taking the responses to various questions together points to a mixed set of parental satisfaction with flexibility. While in the DESE/ORIMA survey, satisfaction with being able to change hours was the lowest aspect of the quality of service aspects they were asked about, and has declined over time; at the same time, parents rated the importance of this below other attributes of the care services provided. In the CCPFamS, the average parental stance was neutral - that of neither satisfaction nor dissatisfaction - and in both these surveys, satisfaction with flexibility rated much higher than satisfaction with affordability. While for some, lack of flexibility in child care was an issue for workforce participation; in particular, where parents work changing shifts, in itself, lack of flexibility does not appear to be a dominant barrier to this.
5.3 Child care services and flexibility
While it could be expected that, in a market, the suppliers of child care would respond to the demand identified above, such a response can be constrained, both by the economics of such provision, and by other institutional and related barriers. These are considered here, firstly in terms of how services see their capacity to respond to flexibility impacted by these, and then more specific discussion on the potential constraints.
5.3.1 Service perspectives on delivering more flexible service
As cited above, in the SELCS some services identified a demand that they could not meet for more flexible services. These services were asked to indicate what constraints they faced in responding to this demand. These responses were free text and covered diverse issues. Analysis indicates that the 2 most common themes were staffing and regulations.
In relation to staffing the main constraints identified were the costs and recruitment of qualified staff willing to work non-standard hours; in particular, in the In Home Care and Family Day Care sectors. With regard to staffing costs, services reported that the staffing costs of providing flexible arrangements were frequently prohibitive, citing the need to pay penalty rates or having to pay higher rates to attract staff.
Regulations and service licensing issues were more commonly reported by Centre Based Day Care and Outside School Hours Care services and covered issues such as external restrictions on the service hours of operations.
Some services that had changed their session times, or who were considering changing session times, raised concerns about the operational aspects of this, including the impact on their occupancy, and the challenges of managing staff ratios and resourcing. Services, particularly Centre Based Day Care services, identified the challenges of budgeting and administrating different session times.
These responses were corroborated and expanded on in wider qualitative data collections, with services and stakeholders reporting that the Child Care Package had not alleviated the concerns of services about providing flexible care. Rather, the experiences of services of modifying their session offerings had reinforced, for many, the extent to which there were very significant constraints on their ability to offer flexible care.
These issues emerged most strongly in discussions about financial viability. Most of the stakeholders interviewed reported that to keep disadvantaged and vulnerable children engaged in Centre Based Day Care, some providers had begun offering 6-hour sessions, so children could access 2 days of care a week. These stakeholders said that these sessions were costly to the services, particularly for those services with a high proportion of families accessing the lowest level of subsidised care, and services were concerned that they were not sustainable into the future. Others commented that providing flexible hours that met parents' demands was too difficult, given the unpredictability of the demand for that care.
Some services noted the challenge of changing their business model to offer a range of sessions that could meet the needs of families and ensure the service remained viable, while managing the administration of a more complex range of service offerings. These interviewees also expressed concern about staffing shorter session times and argued that increases in shorter session times would compromise the ongoing viability of the sector.
A number also mentioned the tension they saw between providing flexibility in terms of multiple and shorter sessions, but needing to have greater rigidity in enforcing these. This is considered further below.
5.3.2 Constraints on providing flexible child care
Regulatory and workforce constraints faced by services mean that providing flexibility is not always possible or comes at a significant cost. Flexibility is therefore a matter for a service's business operations, profitability and viability. Solutions need to fit with staff rostering and are constrained by regulations.
Workforce constraints
Workforce constraints, in addition to those addressed above in terms of recruitment, also arise from educator to child ratios and staffing qualification requirements. These constraints remain under the Child Care Package. With a service operating on one long session of care, this session tends to operate as an 'envelope', such that most children spend somewhat shorter times at the service and staffing is configured to meet demand, with lower tails at either end of the day. The provision of flexible care, including offering additional short sessions (e.g. at the start or end of the day, or to meet casual demand) requires modification to this, to ensure there is appropriate staffing across the service's operating hours.
Flexibility may come, as noted above, with additional costs to services, which are required to pay penalty rates to educators who are working extended or non-standard hours. For example, under the Children's Services Award 2010:
- Full-time employees are employed for 38 hours a week and can be rostered to work up to a maximum of 10 hours in any one day. Changes in roster arrangements need 7 days' warning.
- Ordinary hours of work are from 6.00 am to 6.30 pm, Monday to Friday. Any shift which extends beyond these involves a loading from 10 to 30 per cent depending on its nature.
- Overtime is to be paid at 150 per cent of the hourly rate for the first 2 hours and 200 per cent beyond this. This includes weekend work. (Children's Service Award 2010, Fair Work Ombudsman).
While, as noted in Chapter 9, the labour market is currently seen as being in balance overall, the above suggests that services experience some problems in recruiting qualified staff to work non-standard hours.
Regulatory constraints
While changes in the Child Care Package addressed some regulatory constraints, including minimum operating hours, other constraints exist under Family Assistance Law (that sets out the conditions of providing child care services), by licensing regulations imposed by state and local governments, and other requirements linked to measures of quality.
Central to these are staffing ratios. These for Centre Based Day Care services are shown in Table 56. Economic efficiency in terms of labour costs to fees is optimised when staffing levels match these ratios. To the extent flexibility varies the number of children who are attending the service at any one time, the number of children either hits the upper bound imposed by these staffing requirements, or drops below, impinging on efficiency. Additionally, the regulations require at least half of the educators to be diploma or higher qualified if there are preschool-aged children, and the balance with a Certificate III level qualification in an appropriate field.
These requirements, as is noted in some subsequent discussion, requires significant levels of workforce planning to ensure adequate coverage at all times of the day, particularly when the number of children vary over time, with this planning needing to be locked in some time ahead to meet workplace relations obligations as noted above.
| Age of children | Educator to child ratio | Applies |
|---|---|---|
| Birth to 24 months | 1:4 | All states and territories |
| Over 24 months and less than 36 months | 1:5 | All states and territories excluding Vic. |
| 1:4 | Vic. | |
| 36 months up to and including preschool age | 1:11 | ACT, NT, Qld, SA, Vic. |
| 1:10 | NSW, WA, Tas. (except preschool) | |
| 2:25 for children attending a preschool program | Tas. | |
| Over preschool age | 1:15 | NT, Qld, SA, Tas., Vic., NSW |
| 1:11 | ACT | |
| 1:13 (or 1:10 if kindergarten children are in attendance) | WA |
Source: ACECQA 2020a
The issue of local government land use planning instruments is discussed extensively in UTS:CLG (2013), which notes, for example, constraints such as:
Some councils' land use planning instruments may include locational criteria to ensure that centres are not situated in areas that could present health or safety risks to children and, at the same time, do not 'unreasonably affect residents with respect to noise, loss of privacy, traffic generation and on street parking'. (p. A14)
While issues such as noise complaints subsequent to approval generally do not cause a direct regulatory constraint, unless approval has only been given for limited operating hours because of this, good neighbour relationships also need to be managed.
Quality standards
The national quality standards, in addition to the question of staffing requirements, place another potential constraint on a service's capacity to move to highly flexible staffing arrangements. This concerns the impact of such staffing on their ability to achieve suitable standards ratings. Element 4.1.2 of the National Quality Framework 'Continuity of staff' seeks to ensure that in care 'Every effort is made for children to experience continuity of educators at the service.' The rationale for this is given as:
Continuity of staff on a day-to-day basis and over time assists educators to build secure relationships with children and plays a significant role in promoting their learning and development. Educators who work closely with children each time they attend the service, understand each child's interests, strengths and areas where support may be needed. They are able to provide continuity of experiences to extend children's learning. (ACECQA, 2019, p. 211)
Achieving this requires a stable workforce, most of whom are at the service for an extended period each day. It cannot be met by a service that uses a very flexible and highly casualised workforce with educators who come and go over the course of a day as demand fluctuates.
Service minimum operating periods
Minimum operating periods apply to each type of child care service in terms of weeks per year they are required to be open. For Centre Based Day Care, Family Day Care and In Home Care, the minimum operating time is 48 weeks per year. For Outside School Hours Care, the minimum is 7 weeks per year. Some services (e.g. the former BBF services and a small number of other specified services that were not previously approved for CCB) are not required to meet these minimum operating periods. A special circumstances provision allows exemptions to the minimum operating periods 'where it would be unfair or unreasonable for a service to provide care for the minimum period' (DESE, 2020d, p. 2).
Only a very small number of services have been granted the special circumstances provision since the introduction of the Child Care Package - a total of 17 Centre Based Day Care services between July 2018 and December 2019. There have not been applications for the special circumstances provision from other service types.
Service capacity
These factors come together in terms of service capacity, in particular with regard to some of the flexible care that parents often seek, such as allowing casual or more flexible bookings. A significant constraint of services' capacity to offer this is whether they are operating at full capacity across the day or across the week/fortnight, and whether or not they have unfilled places. Where services are full, they are less likely to have capacity to offer days or sessions for casual booking. While lifting restrictions around minimum operating hours was intended to free up service offerings around casual/short term bookings, this is likely to only make a difference where services have times in the day or days in the week that are under-utilised. According to the SELCS Wave 1, just before the introduction of the Child Care Package, 49.9 per cent of services had vacancies in all sessions, 38.1 per cent had vacancies on specific days and 10.0 per cent had no vacancies. (Others reported vacancies for specific educator or specific ages or groups of children.) Outside school hours care services were the most likely of the service types to have vacancies in all sessions (61.5 per cent of services). Also, former BBF services often had vacancies in all sessions (46.5 per cent).
5.3.3 Interaction with aspects of the Child Care Subsidy
Underlying a number of the constraints discussed above and, in particular, the staffing constraint, is the question of the profitability - or economic viability - of offering greater flexibility. Given the market driven supply of child care services, this has to be seen as potentially the greatest of the constraints. While it can be argued that there are some sectors of the industry that may be limited in their capacity or vision to alter their product mix to meet consumer demand, there are others that are keenly innovative and market driven that seek to identify demands to which they can respond.
In this regard, considering the central role of government subsidies in the funding of child care, there is the question of how well the funding system responds to more flexible, but potentially more costly, service provision.
The activity test
While changes in session offerings are commonly viewed as being primarily concerned with providing greater flexibility, as discussed below, it would appear that they have been predominantly concerned with aligning sessions of care to families' approved hours. This has had 2 motivations: one is so that families have fewer unsubsidised hours of child care to pay for, and the second is around the number of days of attendance that can be achieved.
While the implications of particular approved hours levels are presented elsewhere, analysis of session length, with a particular focus on 6 and 10-hour sessions, is discussed below.
The hourly rate cap
Two issues emerge with regard to the hourly rate cap and service flexibility. As discussed in Section 5.1.2, firstly is the relationship between the nominal session length and the cap. That is, if session lengths are reduced to enable a match with allowable hours without a corresponding reduction in the session charge, this produces a higher hourly fee that is then potentially subject to the hourly rate cap. This relationship between session length and hourly fee can be seen in Figure 79, which contains extracts from the material provided by some services to parents. To take one example, the service offering a 6-hour session for $95, a 9-hour session for $96, a 10-hour session for $97 and a 12-hour session for $97 generates hourly fees of $15.83, $10.67, $9.70 and $8.08 respectively. As can be seen in the third example in the figure, and common to much of the other material from services, is reference to the hours cap as the rationale for the session structure.
More detailed analysis of session lengths and fees using data from the operational administrative data, covering a much wider number of services, is undertaken in Section 5.6.2.
Figure 79: Examples of post-package service fee schedules
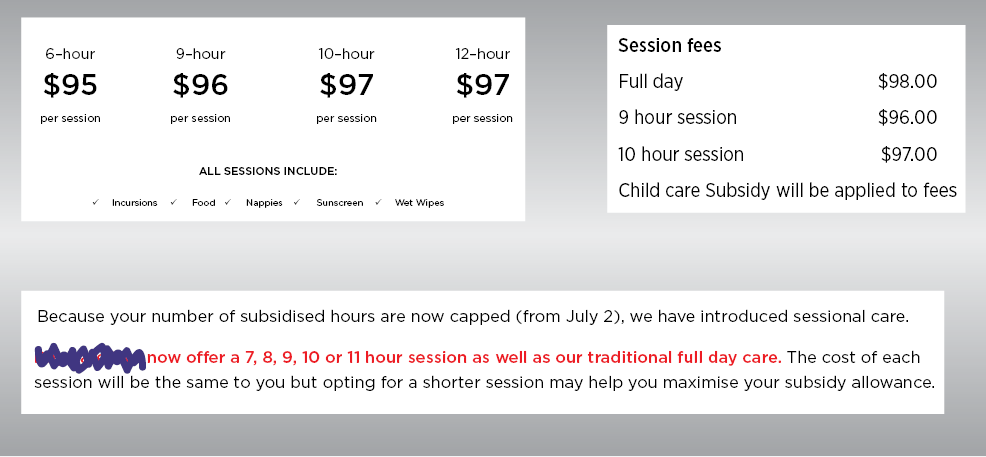
The second is the extent to which the hourly rate cap does not take account of variations in the hourly cost of services. This is an issue with respect to flexible care in that families needing child care outside of typical business hours may be charged at a higher rate to reflect educators' penalty rates for working these hours. The cap makes no provision for this. This has emerged as an issue in the evaluation of In Home Care, although a high proportion of families using In Home Care are receiving Additional Child Care Subsidy. It was addressed by the 'Sector Viability Brief' produced by Family Day Care Australia (2019), which argues that in that sector 'a loading of 20 per cent for non-standard hours care be adopted' (p. 6).
5.3.4 Rigidity in session offerings
While reducing the length of sessions is seen as a means of increasing flexibility for families, in some cases shorter sessions have significant rigidity. This is because sessions effectively operate as a window of time during which a child can receive child care services, with parents having flexibility within this window. A consequence of shorter sessions is to diminish the window within which they can drop off and pick up children. This was identified as a concern by both parents and stakeholders:
What that has done, is an added complexity around managing staffing at the beginning and end of the day. So parents are now required to book in for specific times, so my … nine hour day is only going to go from nine till five. If you arrive before nine or leave after five, even if the centre's open from seven till six, you're going to be charged the late fee.
[Child care stakeholder, January 2019]
This is a concern not just with short hours of care but also, for example, those working full-time and being entitled to a 10 hours session where minor additional work demands may delay a return, and be compounded by long commute times.
This type of rigidity also comes through in the set of options services offer. This can be seen in Figure 80, which contains 2 extracts from services' Complying Written Agreements. In the first case, the service offers 4 session lengths 12, 10, 9 and 6 hours. In each case, these have specific start and end times, and in the case of the 6-hour sessions, they run from 6.30 am to 12.30 pm, or 12.30 pm to 6.30 pm. In the second, there is more flexibility in the range of options for the 10 and 9 hours sessions, but the 6-hour session is only offered on a 9 am to 3 pm basis.
Figure 80: Examples of post-package booking options in a Complying Written Agreement
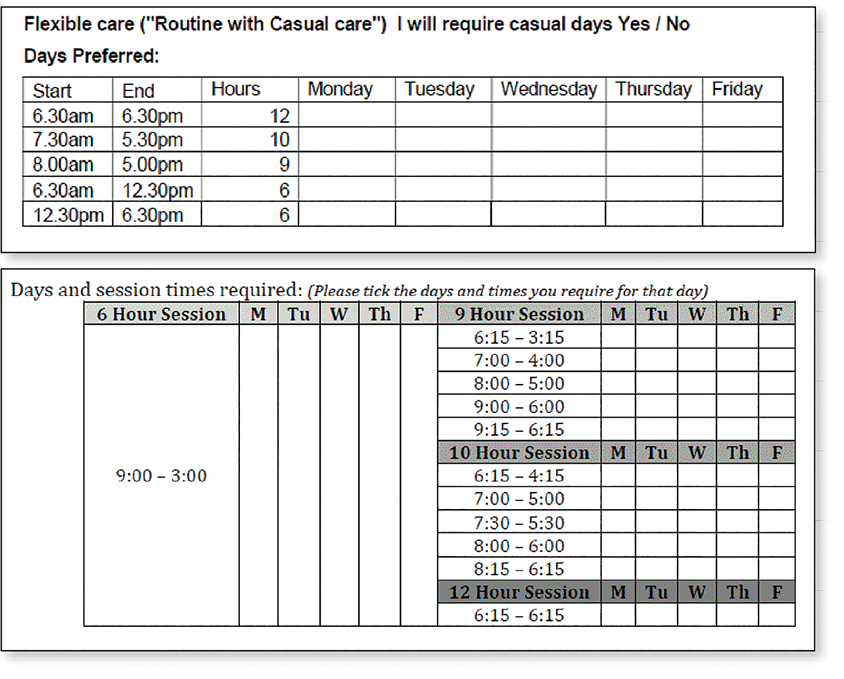
While, in some cases, a parent's employment activity may coincide with the rigid hours offered for some of these sessions, in many cases, it will not. Given that in many cases, as seen above, sessions of different lengths are charged at the same rate, or with relatively minor discounts for shorter periods, choosing a shorter session with rigid start and end times does not appear to represent enhanced flexibility.
A second aspect seen in these agreements is the use of a weekly schedule, which is seeking a regular pattern of service use over a week, rather than the fortnight used for the purposes of the CCS.
5.3.5 Summary constraints on flexibility
Providing flexibility in services in large part involves additional costs, or revenue uncertainty and risk. In a market driven system, providing flexibility has staffing and hence labour costs implications and this constrains how services can respond. Additionally, a range of external constraints may impact the capacity of services to provide more flexible offerings. Delivering more flexible session lengths has both potential cost impacts for child care users, and reduced flexibility of utilisation.
In contrast to the Centre Based Day Care sector, the Family Day Care sector can be considered to be less affected by a number of these constraints and be able to provide more flexible options.
5.4 Changes in service provision
In the context of these issues and the changes involved with the introduction of the Child Care Package, this section considers the extent to which there have been changes in service provision, in terms of service operating hours and session lengths, since the introduction of the Package. In the SELCS, in June-July 2019, services were asked whether the sessions they offered had changed since the introduction of the Child Care Package. Almost three-quarters, 74.9 per cent, reported they had made no changes to session offerings since July 2018. However, 20.0 per cent said that their session offerings had changed due to the changes to government child care fee assistance. Another 4.4 per cent said their session offerings had changed but not due to changes to child care fee assistance. Those most likely to have reported changing their session offerings were Centre Based Day Care services (32.0 per cent), In Home Care services (23.9 per cent) and former BBF services (40.4 per cent). Those least likely to report having changed their session offerings were Family Day Care services (13.1 per cent) and Outside School Hours Care services (14.1 per cent). Of those services reporting having increased flexibility, 44.7 per cent reported they had changed their session offerings.
In explaining the changes to sessions, the main factor cited related to the introduction of the activity test, and services described taking a range of actions to align session lengths with the eligible hours of subsidy from the test. This included introducing 6-hour sessions for low-income families with 24 allowed hours per fortnight, along with 10-hour sessions to align to the 100 hours allowed hours category99 and, in other cases, 9-hour sessions for families with 36 or 72 allowed hours. A smaller number reported introducing hourly sessions to allow parents to keep within their range of subsidised hours.
In the second wave of the SELCS, 27.8 per cent of services agreed or strongly agreed that the changes to the child care system introduced in July 2018 had led to increased flexibility in how their service offered care. This was highest for former BBF services (36.0 per cent) and Centre Based Day Care services (35.7 per cent), followed by Family Day Care services (29.0 per cent) and In Home Care services (26.3 per cent), but low amongst Outside School Hours Care services (14.1 per cent). Reports of increases in flexibility were related to services also reporting they had changed how fees were charged at their service, with 52.5 per cent of those saying there had been increased flexibility also saying there had been changes to how fees were charged. A smaller percentage of those who said there had been increasing flexibility also said there had been changes to the hours of operation of the service (23.2 per cent).
5.4.1 Service operating hours
Service opening hours
Centre Based Day Care and Outside School Hours Care services typically have fixed opening and closing times, while operating hours of Family Day Care tend to vary more, depending on individual educators' preferred work hours. In Home Care services deliver care by educators at non-standard and variable hours, as it is the nature of In Home Care to meet the demand that cannot be met by other services.
The focus here is on the extent to which services have adjusted their operating hours since the introduction of the Child Care Package. While data is not available on the actual opening or closing times of services or the times of day that Family Day Care and In Home Care services are offered by services, or particular educators, the child care administrative data can be used to ascertain the times of day that are covered by the submitted sessions of care reports within a service. This is treated as a proxy for the times the service is open. This data was only available since the introduction of the Child Care Package, so the focus is on changes from Q3 2018 to Q4 2019. While this data cannot inform fully on potential changes associated with the Package, it provides a useful insight, particularly as it is consistent with more qualitative information.
For this analysis detailed session reports were accessed for one specified fortnight at about the mid-point of each quarter, at which time there are no public holidays or school holidays in any jurisdiction. This data referred to the middle fortnight of August 2018, November 2018, February 2019, April 2019, August 2019 and November 2019.
Figure 81 shows the percentage of services 'open' at each time of day, calculated as a percentage of those providing care at some time that fortnight100 by care type, for August 2018 and November 2019. For Centre Based Day Care, Family Day Care and Outside School Hours Care the distributions are virtually identical, indicating very little change in the times of day that services are operating. While data is not available prior to the introduction of the Child Care Package, there is little evidence in the responses from services to suggest that they made any dramatic changes at the time of transition. The charts also show the variation between the 2 series on an amplified scale to see the changes more clearly.
There is more change apparent for In Home Care services. This, however, is based on a much smaller number of services (50 in August 2018 and 42 in November 2019).
The lack of change in Centre Based Day Care service opening times is apparent in comparing the proportion of services open at specific times:
- At 6.00 am, 7.5 per cent were open in August 2018 and 7.2 per cent were open in November 2019.
- At 6.30 am, 37.6 per cent were open in August 2018 and 37.9 per cent in November 2019.
- At 7.00 am, 67.8 per cent were open in August 2018 and 68.8 per cent in November 2019.
- At 7.30 am, 87.4 per cent were open in August 2018 and 87.98 per cent were open in November 2019.
At the end of the day, among Centre Based Day Care services:
- At 5.30 pm, 93.9 per cent were open in August 2018 and 93.6 per cent in November 2019.
- At 6.00 pm, 84.2 per cent were open in August 2018 and 83.8 per cent in November 2019.
- At 6.30 pm, 28.8 per cent were open in August 2018 and 28.8 per cent were open in November 2019.
- At 7.00 pm, 1.7 per cent were open in August 2018 and 1.1 per cent were open in November 2019.
For the Outside School Hours Care services, 83.9 per cent provided some child care in the before school period in August 2018, and 85.1 per cent in November 2019. In the after-school period 99.6 per cent provided some care in August 2018, and 99.7 per cent in November 2019.
Figure 81: Child care services, proportion of services open by time of day, by care type, August 2018 and November 2019
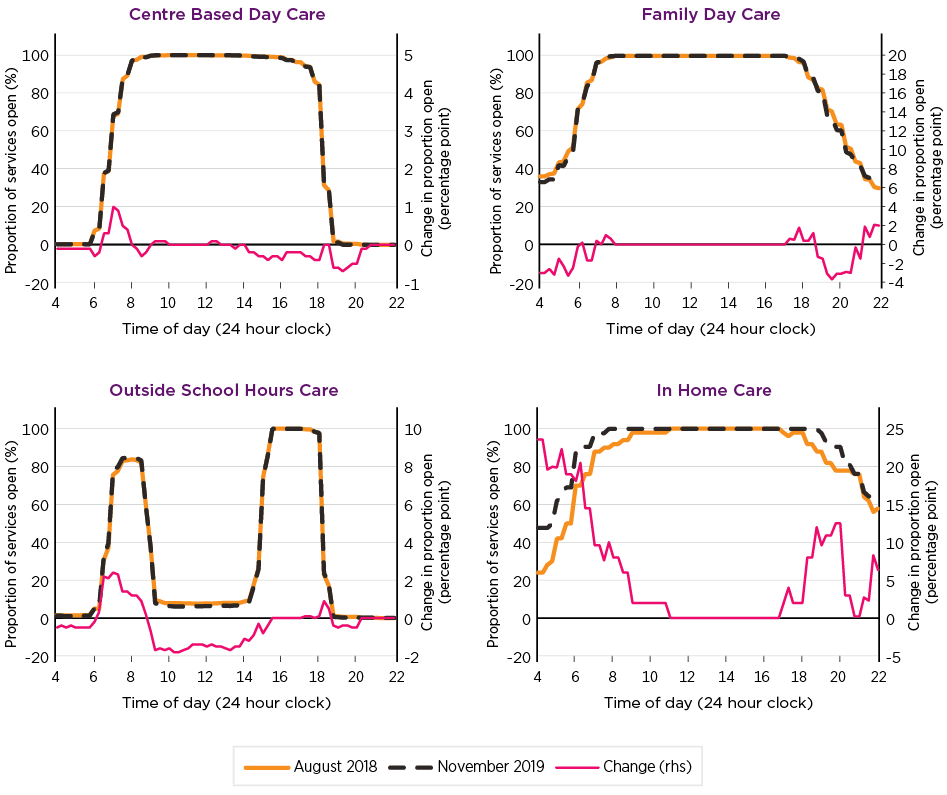
Notes: This is the percentage of services delivering child care at a particular time (the day divided into 15-minute intervals) at least once this fortnight, among those who delivered child care in this fortnight, by service care type. Data is taken from a specific fortnight in August 2018 and November 2019, to align with a 2-week period that does not include school holidays or public holidays.
Source: Child care administrative data analytical dataset (sessions of care data), Q3 2018 and Q4 2019
The patterns evident above are averages and may hide change at the individual service level; for example, if some services are shifting their opening or closing hours to a little earlier, and others are shifting them to a little later. Analysis of Centre Based Day Care services indicates that 90.8 per cent of services have the same earliest session start time in each of the quarters from Q3 2018 to Q4 2019. Just 5.3 per cent had their earliest session start time vary by under 45 minutes and 3.9 per cent by 45 minutes or more.101 Looking at session end times, 93.4 per cent of these Centre Based Day Care services reported the same latest session end time each quarter, 4.1 per cent had a latest session end time that varied by under 45 minutes and 2.5 per cent had a latest session end time that varied by 45 minutes or more. That is, the majority of services appear to have not changed their services' operating hours but some small changes are apparent across the sector.
The lack of significant change in operating times is consistent with services' reports of their expectations for, and experiences of, changes to their services' hours of operation. Just before the introduction of the Package, 18.0 per cent of services reported that they expected the change to the Child Care Package would mean changes to the hours of operation at their service. At July 2019, only 10.6 per cent reported that changes to the hours had occurred. Those most commonly reporting a change in their hours of operation were the former BBF services (43.5 per cent), the In Home Care services (31.4 per cent) and Family Day Care services (22.8 per cent), compared to 12.4 per cent for Centre Based Day Care and 5.3 per cent of Outside School Hours Care services.
5.4.2 Number of sessions reported by services
One restriction on services is that of a maximum service length of 12 hours, although in this regard the advice to services states:
While 12 hours is the maximum length for a session of care, this should in no way be interpreted as a standard session length. Rather, providers should determine session lengths that are appropriate to the needs and circumstances of families, their operating environment and business model.
(Australian Government, 2018)
Given the maximum session length of 12 hours, some services that have long opening hours must have at least 2 sessions, either with these overlapping, or possibly short sessions at the beginning or end of the day, to allow coverage of the whole day.
In the SELCS in June-July 2019, the specific session charging arrangements reported to be offered by services were:
- 39.1 per cent of services reported that they charge by the day or they only have one session length
- 42.8 per cent reported that families can choose from one of a number of sessions
- 11.0 per cent reported they have multiple sessions, with some only offered to particular families
- 3.8 per cent reported charging on an hourly basis
- 3.4 per cent reported having other charging arrangements.102
There are, however, marked differences by service type in the distribution of these arrangements, see Figure 82. Of particular note is the majority use of hourly rates in the Family Day Care and In Home Care sectors, with 56.0 per cent of Family Day Care and 79.1 per cent of In Home Care services reporting that they used this approach.
Figure 82: Session offerings by service type, July 2019
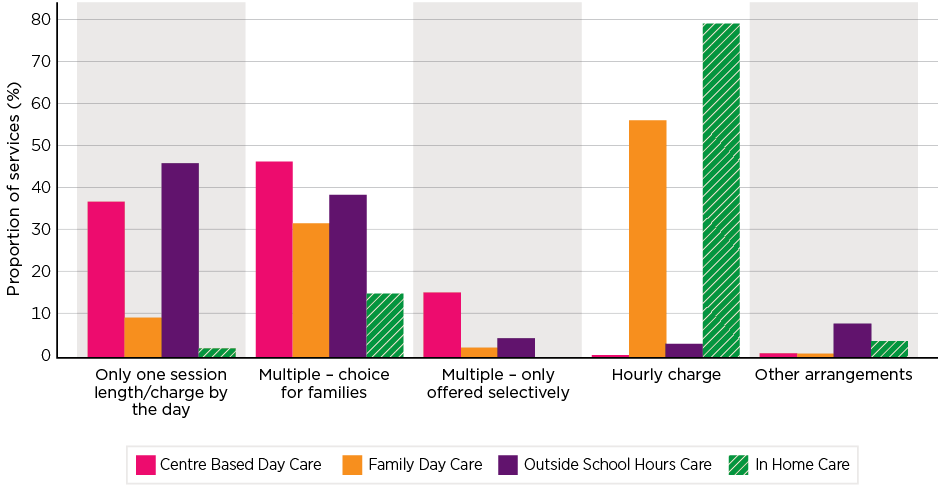
Notes: Cross-sectional weight. Excludes those who responded 'Don't know'.
Source: SELCS Wave 2 (June-July 2019)
5.4.3 Sessions and lengths in practice
More detailed data in the session reports to the Department enables these reported arrangements to be examined more closely. This has been done for the middle fortnight of August 2018, November 2018, February 2019, April 2019, August 2019 and November 2019. The primary focus of this analysis is the Centre Based Day Care sector. Again, while this data cannot provide a full tracking of changes associated with the introduction of the Package, it does inform about adaptations made by services in operating under the new arrangements.
Centre Based Day Care sessions
Figure 83 shows that for Centre Based Day Care there was a gradual shift from August 2018 to November 2019 in services only offering one session of care, with increases most apparent for offering 3 sessions of care. No changes were apparent comparing August and November 2019. One in 4 Centre Based Day Care services had only one session length reported in November 2019.103
- Among Centre Based Day Care services with one session of care, the most common length is 10 hours (49.3 per cent of those with one session length) followed by 11 hours (34.1 per cent).
- Among those with 2 sessions, this is most commonly 10 and 11 hours (32.2 per cent of those with 2 session lengths), 10 and 12 hours (20.2 per cent of those with 2 sessions) and 9 and 10 hours (9.3 per cent of those with 2 sessions).
- Those with 3 session lengths included those with a 9, 10 and 12-hour session (35.6 per cent of those with 3 session lengths) and those with 9, 10 and 11-hour sessions (28.2 per cent of those with 3 session lengths).
Figure 83: Number of session lengths reported in Centre Based Day Care services, August 2018 to November 2019
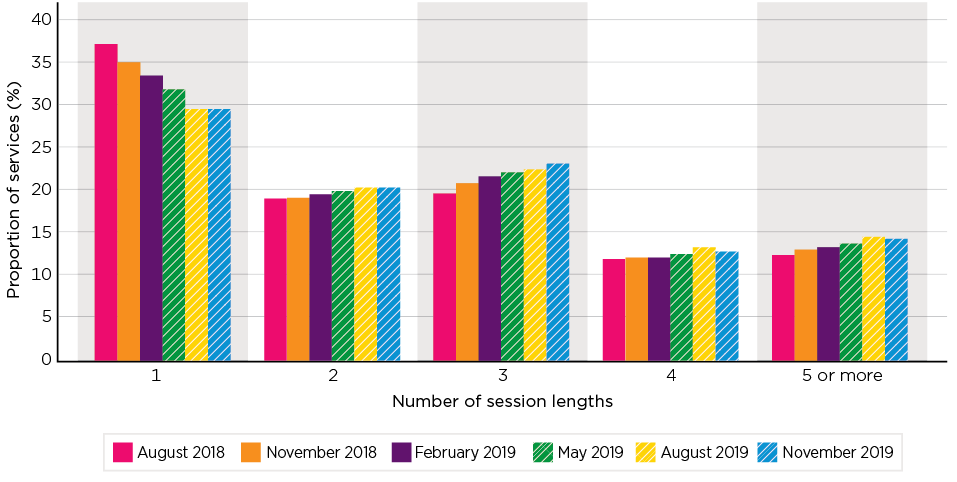
Notes: 'Sessions' were rounded down to the nearest hour. Analysis indicates that this does not significantly impact the results. The data presents sessions used at some time in the fortnight rather than sessions offered.
Source: Child care administrative data analytical dataset (daily sessions data for selected fortnights per quarter)
Analysis of the Centre Based Day Care focusing on those services offering only one session length of care shows:
- Since August 2018 there has been a decline in the number of services offering only one session length.
- Services in the higher socio-economic areas were considerably more likely to only have one session length, along with services located in capital cities.
- Services that are single service providers were more likely to have only one session length, relative to those that are part of a provider network, with services belonging to large providers significantly more likely to have more than one session length, compared to small or medium provider sizes.
- Services with fewer children are more likely to have only one session length.
- Services in which more than 5 per cent of the children are on the Additional Child Care Subsidy (ACCS) are less likely to have only one session length, while there were no significant differences according to whether the percentage of children with 24 allowed hours is greater than 10 per cent.
Figure 84 shows the most common session lengths that are reported by Centre Based Day Care services over time. Across the period there was little change in the percentage that reported sessions of less than 6 hours, 6 hours, 11 hours or 12 hours, but there was growth in the percentage that reported sessions of between 7 and 9 hours, and sessions of 10 hours.
Figure 84: Incidence of session lengths reported by Centre Based Day Care services, August 2018 to November 2019
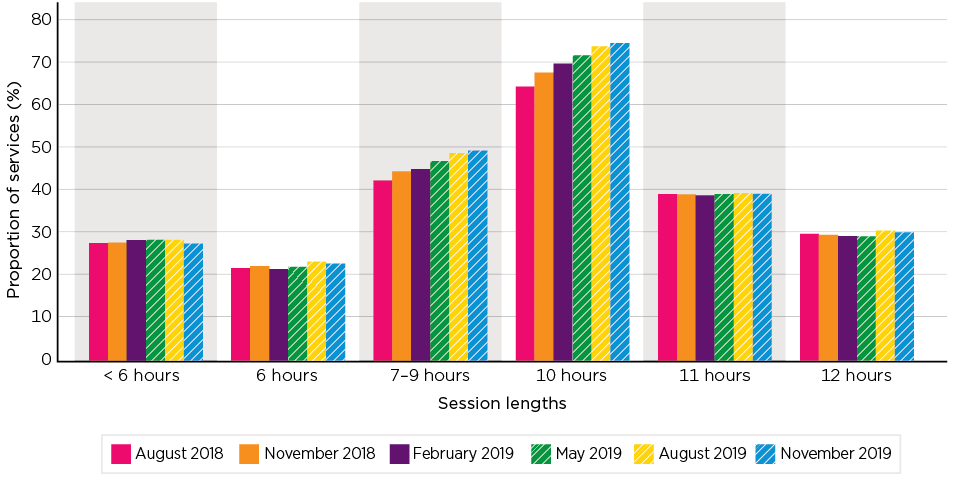
Notes: 'Sessions' were rounded down to the nearest hour. Analysis indicates that this does not significantly impact the results. The data presents sessions used at some time in the fortnight rather than sessions offered.
Source: Child care administrative data analytical dataset (daily sessions data for selected fortnights per quarter)
The session length of 10 hours remained the most prevalent session length across the period reported for about 3 in 4 Centre Based Day Care services at November 2019, and its prevalence has increased over time.
With regard to 6-hour sessions, the multivariate analysis of Centre Based Day Care service characteristics indicates:
- Over the period, there was not much change in the proportion with a 6-hour session until August 2019, when the proportion was somewhat higher than in August 2018.
- Services located in the lowest socio-economic quintile were significantly more likely to have a 6-hour session, compared to other services.
- Findings across locations as defined by population size and remoteness. Services were most likely to have a 6-hour session if located in large urban centres of 50,000-100,000 people or in inner regional areas.
- Services belonging to the largest providers were more likely to have a 6-hour session, with those part of medium-sized providers being the least likely, with single service and small providers in-between.
- Using child counts as a measure of size identified few differences in the likelihood of a service providing these sessions.
- Services were more likely to have a 6-hour session if more than 10 per cent of children at the service had 24 allowed hours of subsidy under the activity test, as were services with more than 5 per cent of their children on Additional Child Care Subsidy.
Looking at shorter sessions:
- About 6 per cent of Centre Based Day Care services reported a 1-hour session at least once in the fortnight. Over the selected periods, this varied between 5.5 per cent and 6.4 per cent but with no apparent trend.
- 16 per cent of Centre Based Day Care services reported a 2-hour session, varying from a low of 15.4 per cent to a high of 16.3 per cent over the period, but with no apparent trend.
- 18 per cent of Centre Based Day Care services reported a 3-hour session. There was a very slight gradual decline in the incidence of this session length from 18.0 per cent in August 2018 to 17.2 per cent in November 2019.
Sessions in other care types
While sessions data for other care types was not examined in the same detail as above, analysis indicates that for Outside School Hours Care services, some 69.2 per cent of services had 2 session lengths in November 2019, typically reporting a morning, before school, and afternoon, after school, session. Another 21.0 per cent of services had one session length. These percentages varied a little across the fortnight snapshots with no apparent trend.
The 2 most commonly recorded session lengths in the Outside School Hours Care sector were 2-hour (73.2 per cent of services) and 3-hour (76.5 per cent) sessions, followed by 1-hour sessions, which may reflect casual charging practices (30.8 per cent of services).104 There was little variation over time in the distribution of these session lengths.105
Almost all Family Day Care and In Home Care services recorded 5 or more different session lengths at each period, reflecting the more flexible delivery of child care for these services. Looking at the session lengths in detail, a majority of Family Day Care and In Home Care services reported very variable session lengths, with many including sessions recorded of one up to 10 hours within the fortnight. Fewer, though, had sessions of 11 or 12 hours.
Commonly used session lengths
The above findings are based on whether any children in the service were reported to use any of the session lengths. Analysed by a count of children using each session length the 10-hour session is the most commonly used session length at Centre Based Day Care services, and over time has become more common, with a diminution in the role of 11 and 12-hour sessions, although with some flattening of the rate of increase in November 2019. This distribution is shown in Figure 85.
Figure 85: Most commonly used session length at each Centre Based Day Care service, based on child numbers in each, August 2018 to November 2019
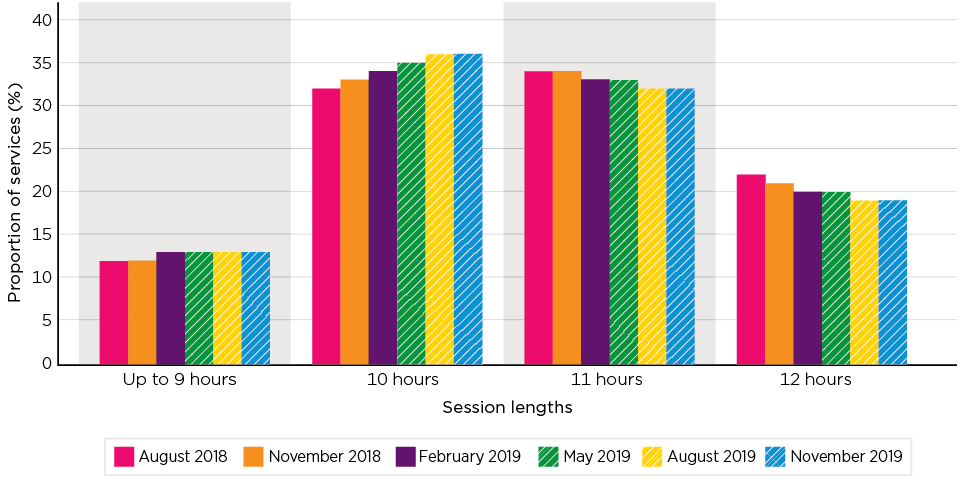
Notes: 'Sessions' were rounded down to the nearest hour. Analysis indicates that this does not significantly impact the results. The data presents sessions used at some time in the fortnight rather than sessions offered.
Source: Child care administrative data analytical dataset (daily sessions data for selected fortnights per quarter)
Session lengths vary for other care types. Table 57 shows the most commonly used session lengths as at November 2019 for each care type. For Outside School Hours Care services, the most commonly used session length was 3 hours (71.7 per cent of services), while for Family Day Care and In Home Care the most commonly used session length was one hour (71.8 per cent and 76.2 per cent respectively), reflecting the use of hourly charging regimes.
| Session length | Service type: | |||
|---|---|---|---|---|
| CBDC | OSHC | FDC | IHC | |
| Distribution of session lengths (%) | ||||
| 1 hour | 0.1 | 2.0 | 70.2 | 76.2 |
| 2 hours | 0.3 | 24.9 | 1.1 | 11.9 |
| 3 hours | 1.2 | 71.7 | 0.0 | 7.1 |
| 4 hours | 0.3 | 1.3 | 0.2 | 0.0 |
| 5 hours | 0.8 | 0.0 | 0.0 | 2.4 |
| 6 hours | 1.4 | 0.0 | 0.0 | 0.0 |
| 7 hours | 0.6 | 0.0 | 1.3 | 0.0 |
| 8 hours | 3.0 | 0.0 | 19.8 | 0.0 |
| 9 hours | 5.3 | 0.0 | 3.9 | 0.0 |
| 10 hours | 35.9 | 0.0 | 3.5 | 0.0 |
| 11 hours | 32.3 | 0.0 | 0.0 | 2.4 |
| 12 hours | 18.9 | 0.0 | 0.0 | 0.0 |
| Total | 100.0 | 100.0 | 100.0 | 100.0 |
| Number of services | 8,035 | 4,294 | 459 | 42 |
Notes: 'Sessions' were rounded down to the nearest hour for this analysis, rounding up to one hour for sessions less than one hour. This is sessions used at some time this fortnight rather than sessions offered. The most commonly used session length for each service was calculated as the one with the most children using it. This shows the mostly commonly used session length per service.
Source: Child care administrative data analytical dataset (daily sessions data for selected fortnights per quarter)
Six-hour sessions
Earlier analysis shows that 22.7 per cent of Centre Based Day Care services reported a 6-hour session at some time in the fortnight of sessions data in November 2019. This is based on at least one child at the service having been charged for a session length of (or about) 6 hours. Among all children using Centre Based Day Care that fortnight, only 2.3 per cent were recorded as being in a session of (or about) 6 hours at some time with another 5.5 per cent of children in a session shorter than this.
As has been noted, this data considers sessions 'used' rather than 'offered', with regard to access and flexibility this latter is important. It is also a question of demand, and while there are a range of reasons why parents may wish to use shorter, 6-hour sessions, as discussed, another important role for these sessions related to the limits of hours that are eligible for subsidy under the activity test. The proportion of children with these low hours is, however, small. For example, in the final week of Q2 2019, 31.8 per cent of Centre Based Day Care services had no children with 24 allowed hours enrolled, and only 31.3 per cent had 2 or more. This though, of course, records children with these hours who use care, not those who do not.
Further analysis of 6-hour sessions is reported in examining issues for vulnerable families in Chapter 7.
5.4.4 Summary changes in hours and sessions
Other than in the In Home Care sector where services are operating over a greater time span, there has been little change in the hours for which other forms of child care are open between Q3 2018 and Q4 2019. There is considerable variation across service types in how care is charged, with hourly fees most common in Family Day Care and In Home Care, and session-based structures in the other sectors.
Within the Centre Based Day Care sector there has been some shift towards offering multiple sessions. In terms of the range of sessions being offered, the main feature has been an increasing proportion of services offering session lengths between 7 and 9 hours and 10 hours. In terms of frequency of use, there has been a shift from sessions of 11 and 12 hours in favour of those of 10 hours.
There has only been a relatively minor increase in the number of services in this sector offering 6-hour sessions, and these are only used by 2.2 per cent of children, with 5.5 per cent using shorter sessions.
5.5 Sessions, attendance and charging
This section considers 2 additional dimensions of sessions of care. The first is the actual time children spend in care, relative to the duration of the session they are attending and is paid for. The second concerns how services charge for sessions of different lengths. Of interest here is the extent to which there was greater alignment between the session lengths that were charged and the time children spent in care, and whether or not the introduction of a greater range of sessions has reduced costs for those using these sessions.
5.5.1 Hours attended and hours charged for
From mid-January 2019, child care services were required to record actual attendance of children. However, there was some 'settling in' of this, such that early attendance data in the administrative records may not be reliable, instead reflecting the start and end time of a session. To be more confident of the data quality, the analysis here draws on attendance data from Q2 2019 (April-June 2019) to Q4 2019 (October-December 2019). While data on hours attended is provided through the administrative data, no information is available on whether these attendance patterns are normal, or if the child has an unexpected or unplanned absence. That is, the difference between hours charged and hours attended will be any usual gap between these measures plus any additional gaps because of absences from child care that fortnight that are nevertheless subject to charging. To avoid exaggeration of the gap between hours used and hours charged when children are away from child care all week, those with weekly attendance hours of zero are excluded, as are those with hours charged or fees charged of zero. Figure 86 shows the mean hours charged for and hours attended per fortnight by care type by quarter, along with the ratio of hours attended to hours charged.
Figure 86: Average hours attended and average hours charged per fortnight, by quarter and care type, Q2 2019 to Q4 2019

Source: DESE administrative data
For each of the sectors, the hours charged is markedly higher than the hours attended. In Q4 2019, the ratio of hours attended to hours charged was lowest in Outside School Hours Care (57.6 per cent of hours charged were attended) and Centre Based Day Care (64.7 per cent), compared to those sectors that more often have hourly charging practices - in Family Day Care and In Home Care hours attended represented 79.0 per cent and 85.7 per cent, respectively, of hours charged.
While there are some variations in this ratio over time, interpretation of this requires caution given the short time period for which the data is available, and the possibility that there may be seasonal factors that cannot yet be observed. Of note, however, is that to the extent there seems to be some increase in the ratio in the Outside School Hours Care and In Home Care sectors, this appears to have come from increased actual use, rather than any decrease in the average session lengths.
Data for just the Centre Based Day Care sector, with children grouped according to ranges of fortnightly hours charged for within each quarter is shown in Figure 87. Across the 5 hours groupings, while there is some variation in the proportion of charged hours for which children attend, there is no consistent pattern to these, and no obvious trend. This suggests that, on the evidence to date, having shorter periods of charged child care is not associated with using these more efficiently, as well as there being an absence of any change over time. This data does not provide any substantial evidence to suggest that the increased flexibility in session charging is leading Centre Based Day Care services to better align hours charged to hours attended, except perhaps at the margins.106
Figure 87: Centre Based Day Care average fortnightly hours charged and attended, by ranges of fortnightly hours attended and quarter, Q2 2019 to Q4 2019
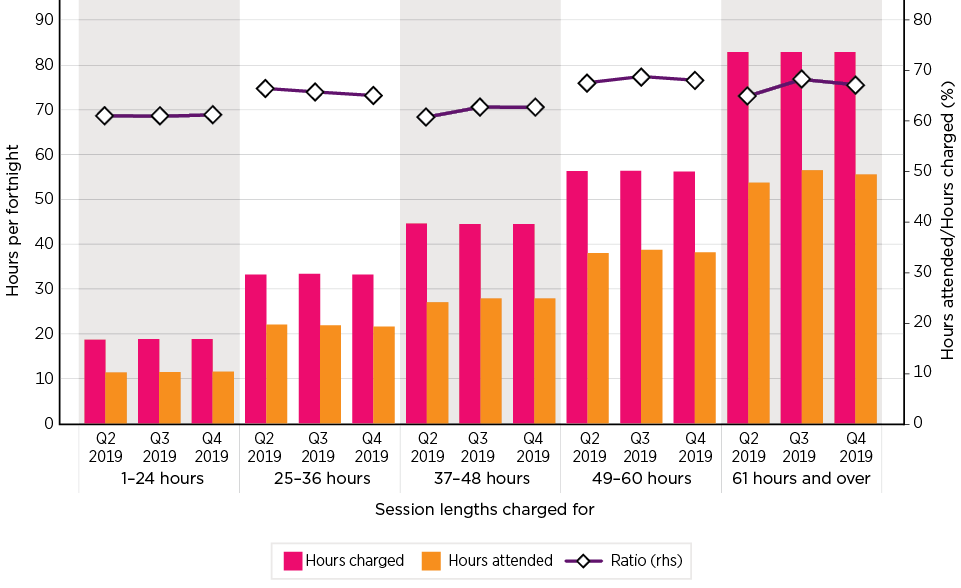
Source: DESE administrative data
5.6 Changes to service charging practices
The analysis above shows some adjustments have been made to how services are 'packaging' child care for families. This section considers the charging practices of services in relation to these sessions. It initially considers survey responses on this question and then analyses administrative data on actual practice in Centre Based Day Care services.
5.6.1 Services reported changes
In the SELCS Wave 2, in June-July 2019, services were asked if the changes introduced in July 2018 had led to changes in the way fees are charged at this service. Overall, 30.4 per cent of services agreed (strongly agreed or agreed) that changes had been made. Changes were least likely for Outside School Hours Care services (17.3 per cent agreed) and most likely for the former BBF services (80.5 per cent agreed) and In Home Care services (60.5 per cent agreed). Of the Centre Based Day Care services, 36.4 per cent reported the way fees were charged had changed, and of Family Day Care services 41.6 per cent agreed that the way fees were charged had changed. Changed charging practices were more likely to be reported among those who reported their session offerings had changed.
More specifically, services were asked how their charging worked where they provided more than one session length. Just over half (54.6 per cent) of services offering more than one session length reported that they charge the same rate per hour for all session lengths. This was notably higher for former BBF services (90.1 per cent), In Home Care services (69.8 per cent) and Family Day Care services (62.8 per cent). In contrast, a much lower 55.3 per cent of Centre Based Day Care services with multiple sessions reported they charged the same hourly rate, as did 51.2 per cent for Outside School Hours Care services.
Services that charged varying rates for different sessions were asked to describe how these charges vary. The more common themes emerging from responses included the following that relate to session lengths:
- Many Outside School Hours Care responses relate to varying fees for before school care, after school care and vacation care.
- Some services reported charging the same fee regardless of session length, although some noted there was a different fee for the 6-hour session.
- Some reported having a sliding scale they charged depending on session length.
- Some reported that shorter sessions are charged at a higher rate to cover casual staff costs and overheads, and similarly longer sessions have a discounted/reduced hourly rate.
Some explanations for the charging practices include:
We looked at our clientele and what their affordability would be, in the hopes that they can access our longer sessions. So we made our longer sessions cheaper per hour.
[CBDC provider, July 2019]
10 and 9 hour sessions have the same full fee - and due to the CCS calculation method - pay the same gap fee. Our service is not rigid on start/finish times so families are able to meet their work/study commitments. 6 hour sessions are charged at a higher rate and aim to provide a balance of affordability to families and viability for the service, given that some of these families also utilise our courtesy bus and therefore end up accessing extra hours of care.
[CBDC provider, July 2019]
The reference to charging practices for 10 and 9 hours sessions seen in the second of these responses is considered in more detail in Section 5.6.2.
Additional comments referred to varying fees for reasons such as: the age of the child; for some sessions that include meals or amenities that affect session costs; some sessions being offered at a reduced rate because of outside funding (for example, preschool funding); and in the case of Family Day Care and In Home Care, because fees are set by individual educators, with rates varying with educational qualifications and experience.
5.6.2 Session length and charging in Centre Based Day Care services
To analyse the charging practices for different session lengths across services, this section draws from the main dataset of service session data a series of subsets of services with similar session structures (based on the number and duration of sessions).107 Key results of the analysis are presented in Table 58.
In November 2019, 1,632 (35 per cent) of Centre Based Day Care services were recorded as having 2 session lengths. Restricted to those that had one session length of 10 hours and one of 11 hours (525 services):108
- The average fee charged for the 10-hour session was $114 and for the 11-hour session was $117.
- The derived hourly rate (the session fee charged divided by the number of hours charged) of $11.41 for the 10 hour session was markedly higher than the $10.50 per hour for the 11-hour session.
- The average 10-hour session fee was the same109 as the average 11-hour session fee in 19.0 per cent of the services.
Taking a second subset of those with 2 sessions, one of 10 hours and one of 12 hours (329 services):
- The average fee charged for the 10-hour session was $114 and for the 12-hour session was $111.
- The derived hourly fee for the 10-hour session of $11.43 is very much higher than the $9.23 for the 12-hour session.
- The same fee was effectively charged for both session lengths by 16.0 per cent of the services.
Of the 1,860 services with 3 identified session lengths, the most common combination was having session lengths of 9, 10 and 12 hours (662 services). These are considered here:
- On average, the fee charged for the 9-hour session was $110, for the 10-hour session $108 and for the 12-hour session $112. This pattern of fees is considered further below.
- The derived hourly fees were $12.24 for 9-hour sessions, $10.84 for the 10-hour sessions, and $9.36 for the 12-hour sessions, reflecting the same pattern of higher hourly fees for shorter sessions.
- The session fee was the same for the 9-hour session and the 12-hour session in 14.8 per cent of services.
| Session structure | Session cost | Hourly rate | Proportion charging same fee |
|---|---|---|---|
| ($) | (%) | ||
| 2 sessions (525 services) | 19.0 | ||
| 10 hour | 114.00 | 11.41 | |
| 11 hour | 117.00 | 10.50 | |
| 2 sessions (329 services) | 16.0 | ||
| 10 hour | 114.00 | 11.43 | |
| 12 hour | 111.00 | 9.23 | |
| 3 sessions (662 services) | 14.8 | ||
| 9 hour | 110.00 | 12.24 | |
| 10 hour | 108.00 | 10.84 | |
| 12 hour | 112.00 | 9.36 | |
Source: DESE administrative data
One distinctive feature of this analysis, as noted above and shown in the table, is the pattern of charging in the services that have 3 sessions where the actual fee for a 9-hour session is higher than that of a 10-hour session. This was examined in detail and it was found that this pattern, as shown in the table, of a 9-hour session being more costly than a 10-hour session holds true across service locations, business models and other service related variables. In some 62 per cent of the services with these 3 session offerings (9, 10 and 12 hours) the total cost of 9-hour sessions is higher than for 10-hour sessions.
The analysis of the administrative data indicates that in these services, overwhelmingly, these 9-hour sessions are being used by people with either 36 or 72 allowed hours of CCS subsidy. In contrast, 10-hour sessions are mostly used by children with 100 allowed hours attending 5 days per week. As outlined in the service survey response cited in Section 5.6.1, the apparent basis of this pattern relates to the interaction of allowed hours and session lengths. That is, for people with 36 allowed hours using 2 days of care per week, while the total fee charged for 9-hour sessions may be higher than that for 10 hours, it works out as a lower out-of-pocket cost for these families (as long as the hourly cap is not breached) as they do not have any unsubsidised hours. That is, if they attended a 10-hour session, they would only receive the subsidy for 9 of these hours with the subsidy based on the hourly rate calculated across the whole 10 hours, and have to pay the full cost for the 10th hour. By having a 9-hour session at a higher rate - which enables services to obtain the same revenue that they would if the session length was 10 hours, the parents effectively receive the same (or even potentially a higher) value of subsidy but without the obligation of paying the full cost of the 10th hour. A similar set of circumstances occurs for those with 72 allowed hours using 4 days of care.
While as noted above, these figures are estimates, based on averages, they nevertheless indicate that some services, while ostensibly offering flexibility through diverse session lengths, effectively have a fixed 'day' rate for Centre Based Day Care, with the session length varying between families (or children) depending on the number of subsidised hours families can access, and being charged at substantially the same rate.
5.6.3 Former Occasional Care services
One of the changes associated with the Package was the removal of some of the regulatory constraints on former Occasional Care services, and their integration within Centre Based Day Care. Of the 8,035 Centre Based Day Care services for which there were session reports in November 2019, 83 were formerly Occasional Care services, 6,761 were formerly Long Day Care services, and another 1,191 were not matched in the 2017-18 data. Those Centre Based Day Care services that were previously Occasional Care services were, as detailed in Table 59, considerably more likely than other services in this sector to be reporting short and varied sessions of care and much less likely to be reporting session lengths of 10, 11 or 12 hours.
| Previous care type | Session lengths reported: | |||||||||
|---|---|---|---|---|---|---|---|---|---|---|
| 1 hour | 2 hours | 3 hours | 4 hours | 5 hours | 6 hours | 7-9 hours | 10 hours | 11 hours | 12 hours | |
| Proportion reporting (%) | ||||||||||
| Long Day Care | 5.4 | 15.3 | 17.0 | 4.0 | 6.7 | 22.2 | 49.3 | 76.0 | 40.1 | 29.7 |
| Occasional Care | 22.9 | 36.1 | 48.2 | 51.8 | 59.0 | 39.8 | 56.6 | 12.0 | 3.6 | 1.2 |
| Unmatched to 2017-18 data | 7.1 | 15.1 | 16.5 | 8.6 | 11.1 | 23.9 | 47.3 | 68.3 | 35.6 | 33.9 |
| Total | 5.8 | 15.5 | 17.2 | 5.2 | 7.9 | 22.7 | 49.1 | 74.2 | 39.0 | 30.0 |
Notes: Row totals do not add to 100 per cent as services can have multiple sessions.
Source: DESE administrative data
Analysis of fee data indicates that in Q4 2019 former Occasional Care services were charging an average hourly rate of $11.14 compared to $10.33 for those Centre Based Day Care services that were either new or had been Long Day Care services. This is indicative of a premium for the shorter session lengths.
5.6.4 Insights from case studies
The findings from the case studies offer some additional insights into the provision of shorter session lengths by services and how different service providers chose to charge for and staff these sessions.
Whether or not a Centre Based Day Care service offered a reduced daily rate for the shorter session appeared to have some bearing on how services managed staffing arrangements and viewed the long-term financial viability of offering different session lengths. Most Centre Based Day Care services in the case study offering different session lengths charged families either the same daily rate for the session options, or a marginally lower rate for the shorter session (e.g. up to $5 per day difference). This tended to be the approach of Centre Based Day Care services who offered a long day session (11 or 12 hours) as well as a 10 and, or, 9-hours sessions. This meant, as discussed above, that while families accessing shorter sessions were paying a higher hourly rate for care, this approach benefited families financially if the family used more hours than their fortnightly allowable hours, as this was more affordable than paying for unsubsidised care.
Taking this approach also meant that these Centre Based Day Care services did not have to be rigid about specific start and finish times for the shorter sessions as income, and subsequently their staffing arrangements, remained largely unchanged. It was Centre Based Day Care services offering substantially lower daily rates for the shorter session options and, in particular, when services offered a 6-hour session, that spoke of services needing to carefully consider their staffing arrangements to ensure the long-term financial viability of this session offering. One aspect of this was needing to be more rigid as to what hours the shorter sessions were available. As one service director noted, families wanting a 6-hour session were most likely to want the 6 hours of care between the hours of 9 am and 3 pm, rather than from 6 am to 12 midday or 12 midday to 6 pm. This meant that Centre Based Day Care services offering a 6-hour session did so at the expense of maximising their occupancy levels, as the hours before 9 am and after 3 pm would not generally be able to be filled by another child.
Consistent with the administrative data analysis outlined in Section 5.4.3, Centre Based Day Care services in the case study were slightly more likely to offer a 6-hour session when the service had a higher percentage of children enrolled who were only entitled to 24 hours per fortnight of subsidised care. In Case Study 2, which was an area selected to enable a focus on child care use in a relatively high income central business district (CBD) environment, few of the participating Centre Based Day Care services offered any session options and none offered a 6-hour session (one service had initially offered a 6-hour session and then stopped due to viability concerns). Whereas, in Case Study 1, which was an area selected to enable a focus on child care use in a low-income area in an outer metropolitan location, most participating Centre Based Day Care services were offering session options to families. However, even here very few Centre Based Day Care services offered a 6-hour session despite service directors expressing concern that the most vulnerable children were not receiving sufficient early education in the years before school.
The services offering 6-hour sessions charged lower fees for this session option. One Centre Based Day Care service that was offering a 6-hour session noted that it was challenging to make this offering financially viable. Service directors spoke about needing to tightly manage their staff rostering, and associated staffing costs, within staff/child ratio requirements, and some services capped the number of families accessing this session offering.
There's a bit of complexity around managing [six hour sessions] in terms of service viability. We've had to cap it at a certain number of families who can access it at any given time, because it does require us to, I guess, as an organisation to make a bit of a financial commitment to those families. But it actually does cost us money to be able to provide those sessions for families.
[CBDC provider, August 2019]
Several Family Day Care educators within Case Study 1 had a minimum session length of 6 hours. For some, this had been longstanding and predated the introduction of the Package, and for others, they had subsequently adopted this business model. Offering a 6-hour session between 9 am and 3 pm for children of preschool age or under enabled Family Day Care educators to also provide outside of school hours care to school-aged children, thus ensuring that offering a 6-hour session could be financially viable. This was put by one director as:
So, we are lucky in a sense that our educators could see the purpose in that in retaining their families but also we went, well that gives you an option to take before and after school care as well. So we had to try and sell it in the sense of how that's going to work for them and their business, and how they'll still be able to maintain their income, even though they're doing something to help the family so the children could actually retain and maintain care.
[FDC provider, February 2020]
5.6.5 Impact on hours charged and charging
While, as noted in the previous section, there have been some changes in the structure of sessions offered by some services, this appears to have had little impact, over the time period for which data is available, on the extent to which hours attended tend to be significantly below the hours charged for. Where services have adopted a range of session choices, the cost of these sessions is usually close to the cost of longer sessions. It would appear that this has largely been done as a device for allowing parents to receive funding for all of their hours of care by bringing the charged hours into alignment with their allowable hours and so avoiding having unsubsidised hours of care.
5.7 In Home Care
As identified in Chapter 1, In Home Care is a program focused on providing flexible child care in the home for families in particular circumstances whose child care needs cannot be met by mainstream options. An evaluation of the In Home Care program has been conducted separately. The program commenced in July 2018 following a complex transition from the 2 previous programs, an earlier In Home Care program and Nanny Pilot Programme.110
In addition to having to meet Child Care Subsidy eligibility, the program eligibility requires that families do not have other child care options available or that are appropriate, and they meet one or more of 3 criteria, which can be seen as constituting streams of the program. These are:
- The parents or carers are working non-standard or variable hours, outside normal child care service hours.
- The family is geographically isolated from other types of approved child care, particularly in rural or remote locations.
- The family has challenging or complex needs, including where families are experiencing challenging situations, and other approved child care services are not able to meet the needs of the children or the family.
Each of these can be seen as having elements of flexibility in them. This is most apparent for the 'nonstandard or variable hours' eligibility criteria, in which parents require In Home Care where mainstream care options do not operate during the hours needed by parents. But flexibility is also relevant to those with challenging or complex family needs who need child care solutions that are sensitive to child and family needs. For those requiring In Home Care because they are geographically isolated, this is less about meeting a need for flexible child care, but more about meeting a need for accessible child care.
The program has a specific structure including a networked brokerage model for the delivery of In Home Care and distinct roles for the Australian Government, newly introduced In Home Care Support Agencies, In Home Care providers and services, and educators. The program has a cap on the level of provision, currently up to 3,200 places, providing up to 100 hours of subsidised care per child per fortnight. In Home Care Support Agencies data in December 2019 reports that there were 518 families (1,088 children) on an In Home Care waiting list.
Figure 88 presents the number of families accessing In Home Care according to families' main eligibility criteria. This data shows a diverse set of trends for these different subgroups over time, reflecting both some residual transition issues, as well as the implementation processes of the new program structure.
Figure 88: Number of families accessing In Home Care by eligibility criteria, Q3 2018 to Q4 2019
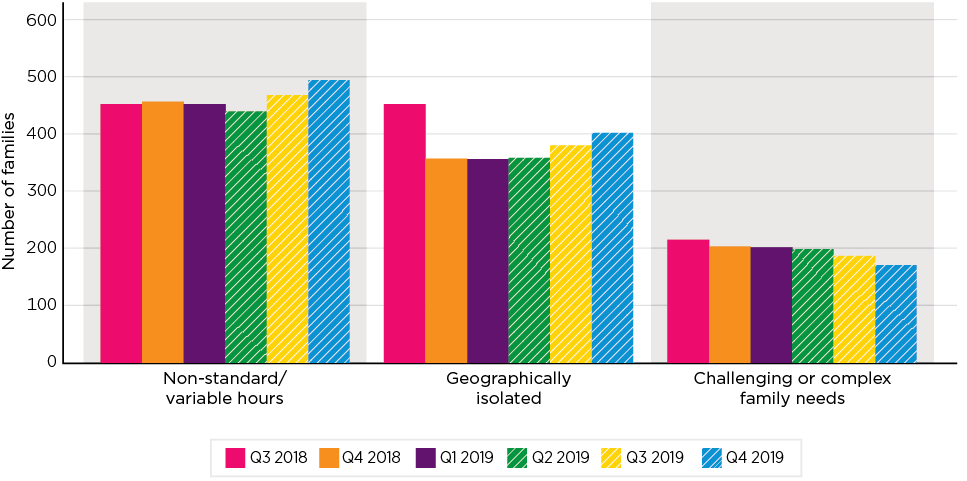
Notes: These program reports classify families according to the one most relevant eligibility criterion, even if more than one applies to them.
Source: In Home Care program data
Data collected for the In Home Care evaluation includes family reports of satisfaction with In Home Care. According to this survey data, families are mostly quite satisfied with the In Home Care received and with the quality of care provided by the educator. Most families are satisfied or very satisfied with the number of hours of In Home Care that can be accessed, the times of day the family has been able to access In Home Care and the flexibility of In Home Care. (Figure 89 shows the mean rating with the average in most cases being around a rating of 'satisfied'.)
The survey data, however, only shows that a minority of families have difficulties with these aspects of In Home Care, but with somewhat more dissatisfaction among those families using In Home Care for their complex and challenging needs. For example, 17.6 per cent of these families were dissatisfied with the flexibility of In Home Care if the hours of care needed to be changed. For those using In Home Care for their non-standard or variable hours, or because they were geographically isolated, about 12 per cent were dissatisfied. Interviews with the In Home Care Support Agencies also suggested that flexibility of In Home Care hours continued to be a problem for some families. In Home Care Support Agencies and In Home Care services attributed problems with flexibility to the challenges of recruiting educators for short periods of time. Other challenges were identified for families working shift work, with varying rosters, whereby the service was often unable to line up an educator to meet child care needs that varied from week to week, or roster to roster. For some families, this has meant being unable to access In Home Care altogether.
These challenges with flexibility experienced by some families amplify the wider challenge for the In Home Care program to recruit suitably qualified educators who are available to provide child care at variable or non-standard hours, or in geographically isolated locations. This is reflected in 2 in 3 families on the waiting list being there due to a suitable educator not being available. More detailed analysis has been presented in the In Home Care evaluation report.
Figure 89: Mean family satisfaction with aspects of In Home Care, by family category and suitability criteria, 2020
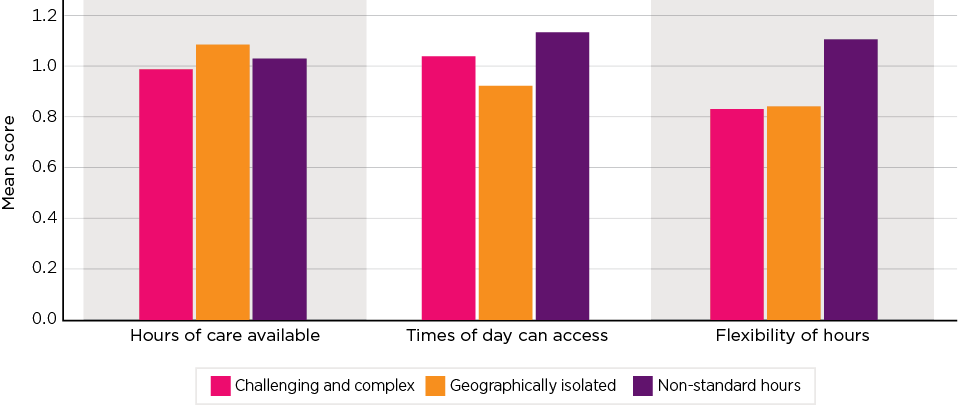
Notes: Questions were asked on a 5-point scale of strong agreement to strong disagreement. These have been coded to a single scale from +2 to -2, with positive values indicating agreement.
Source: In Home Care Family Survey Wave 2 (November 2019-February 2020)
5.8 Summary
Flexibility is a concern for parents, although it has several dimensions. These include, firstly, the actual times at which care is available, secondly, the extent to which parents can change their pattern of use of it, and thirdly, the relationship between actual use and charges. While a substantial group of parents expressed dissatisfaction with their ability to easily change their usage of child care, such as increasing or decreasing hours on short notice, on the whole, satisfaction with flexibility ranks well above that of satisfaction with affordability. There is no evidence of any increase in satisfaction with flexibility with the introduction of the Child Care Package. With regard to employment, there appears to be a specific issue for those parents who work changing shifts, although, more generally, a lack of flexibility does not appear to be a significant inhibitor of labour supply.
In large part, providing flexible child care comes at a cost. Extending operating hours incurs costs, in particular staff costs due to the payment of penalty rates, and in potentially providing incentives for staff to work at non-standard times. The nature of the CCS is that any additional costs in such circumstances need to be fully met by parents. Similarly, moving away from rigid patterns of attendance around which staffing rosters can be constructed to meet statutory staff to children ratios, continuity of staffing brings with it the potential for a gap between revenue and expenditures, or a breach of the ratios if there is a mismatch between the number of children attending and the rostered structure. As such, the failure of services, in particular Centre Based Day Care services, to respond to some demands for more flexible care is not a market failure, but rather a demand for services which are uneconomic to supply. It is noted that in contrast to this sector, the characteristics of Family Day Care make this sector more capable of providing flexible care. As has been discussed in Chapter 4, a substantial part of the Family Day Care provision has largely moved to an hourly fee basis.
For most services, other than In Home Care, there has been no substantive change in the operating hours since September 2018. In Centre Based Day Care there is evidence of changes in the structure of sessions of care, with more services offering sessions of more than one different length, including shorter sessions. In some cases, these are available for parents to choose, and in some cases, they are only offered to selected parents. While shorter sessions are often perceived as being a 'flexible' option, in many cases, they involve significant rigidity, because shorter sessions are typically only offered for predetermined periods of the day that may not meet the parents' needs.
It does appear that the development of shorter sessions has been largely driven by the operation of the activity test and the allowable hours of subsidy to which parents are entitled. In terms of charging, the available data does not provide evidence that sessions of care have been modified to better align use and charging. More so, the data clearly shows the emergence of a pattern of charging that is designed to minimise parental costs while maintaining service revenue, by structuring sessions and charges around the structure of allowable hours.
In Home Care does provide a form of flexible care to families, and there is a high degree of satisfaction with In Home Care among those who use it. But there have been challenges with the program, particularly related to the availability of suitably qualified educators.
96 There are other ways that children may be enrolled. In particular, 'relevant arrangements' may be used by services if children do not meet the full requirements for a CWA - no CCS can be paid in these cases. This is usually used when a provider is sure that the family does not wish to claim CCS, and services receiving CCCF Restricted grants have been encouraged to use 'relevant arrangements' to ensure vulnerable families engage with their service. There may also be a provider eligible arrangement for children receiving Additional Child Care Subsidy (Child Wellbeing) or an arrangement with a third-party organisation. The SELCS Wave 3 was to collect information on these different enrolment arrangements but, as discussed in Chapter 3, this survey was not undertaken.
97 The number of occasional care places available to parents was capped by state/territory governments and casual booking of child care was not offered at all services. In Q2 2018, the number of children using occasional care in a week peaked at 3,650 children (week ending 3 June 2018). In that week, 59.7 per cent had used up to 12 hours of care in the week, 29.7 per cent had used 13-24 hours and 10.6 per cent had used more than this.
98 The actual survey questions were 'Thinking about all the care your family uses, do you agree or disagree with the following: The cost of child care is affordable; There were enough child care options for me to choose from when selecting a child care provider; Child care is flexible to meet my family's needs; and It is easy for me to get the child care I need.'
99 While a 50 hours a week cap applied under the former CCB, no cap was applied to CCR, and to the extent excess fees arose due to exceeding the CCB cap, these were eligible expenditure for CCR claims.
100 For Family Day Care and In Home Care it shows the percentage of services that have educators providing child care by time of day, as a percentage of services providing some Family Day Care or In Home Care that fortnight.
101 Based on 8,485 Centre Based Day Care services which had session reports submitted for at least one of the fortnights covered by these quarters. Excludes a small number with session times that did not appear valid for Centre Based Day Care.
102 These 'other' arrangements typically covered services' reporting to have variation in fees for particular families (e.g. some reporting it is free for some families, multiple sibling discounts, different fees for not-working families), rates varying for permanent versus casual, and sometimes including an administrative or educator levy.
103 Data is derived from session reports. Start and end times of sessions were used to calculate a session length. For simplicity, these were rounded down to the nearest hour (with the exception of sessions calculated as under one hour, which were rounded up to one hour). Any session report submitted for a service was used, and this may include session lengths not typically offered, for example, if parents are charged for an additional hour or 2 before or after their usual session of care. This may explain why the administrative data results in more session lengths when compared to the survey data. In the SELCS Wave 2, 40.9 per cent of Centre Based Day Care services reported offering one session, 13.2 per cent reported offering 2 sessions and 45.9 per cent offering 3 or more sessions. This is different to the administrative data for around the same time (August 2019), which finds fewer had one session (29.5 per cent), more with 2 sessions (20.3 per cent), with about the same percentage 3 or more sessions (50.2 per cent). There is also a difference in the survey data with respect to reporting about session lengths, with survey data indicating a smaller percentage of Centre Based Day Care services offering a 6-hour session, for example.
104 These analyses are based on rounding sessions to the nearest full hour and so there will be more variation than this across the sector; for example, with some services having sessions that include part of an hour.
105 The sessions data was intentionally extracted to avoid school holiday periods, so data on the session lengths of Outside School Hours Care during school holidays (that is, vacation care) is not available.
106 Even to the extent there may be any change at the margins, this must be placed in the context of the earlier discussion, which is examined further in the next section, of services introducing shorter sessions but charging rates similar to that of longer sessions. While such shorter sessions would be expected to increase the alignment of hours and attendance, it has no material impact on the actual cost of care charged, but rather is designed to work around the activity test constraints and maximise subsidy flows, and hence the balance of the cost between families and government.
107 This analysis focuses on sessions data for 8,035 Centre Based Day Care services for November 2019. There is some variation in fees charged at services by factors other than session length, so these findings are not precise.
108 Session lengths are derived by rounding the difference between the end and start times of the session. The hours charged are more variable, as they allow fractions within those rounded session lengths. The exception is a 12-hour session, as 12 hours is the maximum session length.
109 The fees were rounded to the closest dollar value for the purposes of comparing fees for different session lengths.
110 The Nanny Pilot Programme was an early component of the Child Care Package that explored the use of nannies to support parents who needed flexible child care arrangements. The Nanny Pilot Programme (initially named the Interim Home-Based Carer Subsidy) was a pilot program of in home care that operated between 1 January 2016 and 1 July 2018. The Nanny Pilot Programme was implemented alongside the previous In Home Care program and was designed to increase the workforce participation of families working non-standard hours, or with other barriers to participation such as living in remote or rural areas or the unavailability of existing child care. The Nanny Pilot Programme subsidised services that used this subsidy to reduce the cost of using a nanny for families in the program. The cost for the subsidy was calculated per child per hour and nannies were required to have a Working with Children Check and First Aid training, (Department of Education and Training, 2016) but were not required to hold a formal qualification, such as the Certificate III that was required for other Commonwealth approved services for subsidies. A review of the Nanny Pilot Programme found that while it was successful in providing flexible care for many families, some families were unable to access the program due to costs or nanny availability. Recommendations from that review included the need to assist families in recruiting nannies and the requirement that nannies have a minimum Certificate III child care qualification as well as ongoing training and support. The review also recommended considerations to the cost of providing care in the home and suggested targeting the subsidy to those most in need, as well as revised subsidy arrangements for families with multiple children. The Nanny Pilot Programme was replaced by the new In Home Care program in July 2018.
6. Access
6.1 Child care and access
Access is part of the first of the outcomes identified in the evaluation framework: 'Child care services are accessible and flexible relative to families' needs, including disadvantaged.' The element of flexibility in this outcome has been addressed in the previous chapter, and the needs of the disadvantaged in the next, which addresses communities with vulnerabilities.
One element of the framework governing access is the legal requirements under the Racial Discrimination Act and the Disability Discrimination Act, although this latter does have an exemption where providing a service to the person would 'impose an unjustifiable hardship' to the provider. While the Disability Standards for Education (DESE, 2020e) place a higher responsibility on educational service providers, child care services are explicitly excluded.
In addition, as noted in Chapter 1, prior to the introduction of the Child Care Package, services were expected to operate in the framework of the priority placement guidelines that stipulated that services had to give priority in access to particular groups of children including those at risk and single parents who were engaged in employment and other activities, along with children from low income families, families with people with disability and other criteria relating to potential vulnerability.
Under the Package, the Child Care Handbook indicates:
There are no requirements for filling vacancies. Providers can set their own rules for deciding who receives a place.
Providers are asked to (but are not legally obliged to) prioritise children who are: at risk of serious abuse or neglect, a child of a sole parent who satisfies, or parents who both satisfy, the activity test through paid employment. (DESE, 2019b, p. 51)
6.1.1 Child care access and ECEC goals
The concept of access to child care has many dimensions. From one perspective, it can be seen in terms of whether parents can obtain child care when they require it to enable them to participate in the workforce. It can also be seen in terms of whether those children for whom early childhood education and care services are important for their development can obtain it. Baxter and Hand (2013) suggest 3 components to this: 'creating opportunities for children to participate in ECE [early childhood education] programs; providing enough time within the programs for children to learn; and allowing children to experience the program (and its potential benefits) fully' (p. xiv).
While the primary focus of the Australian Government Child Care Package is on workforce participation, as reflected in the 'jobs for families' language of the Child Care Package legislation and the priorities identified in the evaluation framework, the second is also important, and is indeed the primary focus of policy in many countries. The OECD, for example, report that:
Early childhood education and care has experienced a surge of policy attention in OECD countries in recent decades, at the national as well as international level. However, this increasing attention is not the only change; the nature of the public debate has also significantly evolved over this period. Policy makers have recognised that equitable access to quality ECEC can strengthen the foundations of lifelong learning for all children and support the broad educational and social needs of families, and they have therefore increased the resources allocated to this sector over the last decade. With this trend, governments have taken recent initiatives that aim to enhance the quality of ECEC services and improve the equity of access to ECEC settings. This is in contrast to the public debates of the past, which were limited to quantitative issues, and public spending was mainly concentrated on measures to expand access to affordable ECEC. (OECD, 2017, p. 16)
The European Agency for Special Needs and Inclusive Education, a cross national organisation that works with the education departments of some 31 European countries, reports on an evolution in the European focus as:
The focus of European education policies has, however, shifted. Initially, they focused on increasing the quantity of childcare and pre-primary places to enable more parents to join the labour market. Now, they focus on the educative and formative effects of ECEC for young children in their development. (Bellour et al., 2017, p. 20)
Importantly, also, access to child care is usually expressed in terms of 'access to affordable, high quality child care' (Hockey, Abbott & Ley, 2013). This emphasises that access should not be viewed, or measured, in terms simply of physical access and capacity, but also whether the care is affordable, and whether it is of high quality. Affordability has been discussed in detail in Chapter 4 and parental satisfaction with their ability to access quality care is considered here in Section 6.6.
The adequacy of access also needs to be addressed. This is whether or not the volume of child care that can be accessed, and the times at which it is available, is sufficient to meet the needs of the child or the family. That is access is more than just a question of whether a child has attended or not attended. Critical also are issues of choice. Do parents have a choice of services, of different types, available to them? Do they have choice, for example, as to whether they can access child care close to their home, or their work location, and whether they have choice over accessing child care that reflects their values and aspirations for the care of their child?
6.1.2 Conceptual approaches to measurement
The ways in which child care is used, as seen in Chapter 2, varies considerably. Some children use it for extensive periods on a daily basis, others regularly use short periods; for example, in after-school care, while the use by others is intermittent. This, along with the question of adequacy of volume, poses a number of challenges to the measurement of access. Questions include:
- Should the focus be on individual children, or on families? While child level counts provide information on the access of children to the development and other opportunities of care, a family or parent approach provides responses in the context of capacity to participate in the workforce and other activities.
- Whether a focus should be placed on the volume of care used, or a headcount of access. For example, in Q4 2019, due to varying patterns of attendance and use, and the different roles played by types of care, the 24.5 per cent of children using the most hours of care accounted for half the volume of care, as measured by charged hours. Conversely the 50 per cent of children using the least amount of care only accounted for 19.4 per cent of the volume of care.
- What is the time period over which access is considered. As there are marked differences in the count of children using child care between the use of annual, quarterly and weekly data.
These types of differences, as discussed in Chapter 2 with regard to service counts and the relative size of the different sectors, can significantly influence results. Here, however, the primary focus will be on the headcount, usually over a quarter, but varying with the nature of the data and the question being responded to, with this being complemented by separate analysis regarding the quantum of care accessed. While it is recognised that this approach has limitations, it is far less complex than attempting to use a hybrid approach.
6.2 Levels of access
In Q4 2019 there were 1,331,903 children who used child care at least once in the quarter. On average, in each month of the quarter, there were 1,239,565 who accessed child care, and on average in each week, 1,069,938 - some 80.3 per cent of the number at some time in the quarter. While some of this can be explained by inflows and outflows, much more is explained by intermittent usage, including the role of Outside School Hours Care, where children may attend before and/or after school sessions during term time, and they, or other children, may attend vacation care at other times.
On average in Q4 2019 those children identified in the child care administrative system attended child care for 170.6 hours (out of a total paid session length of 259.6 hours), on an average of 34.4 days, spread over 10.4 weeks, attending care on an average of 3.2 days a week and spending 4.8 hours in care (out of a paid session length of 7.4 hours) on these days. These averages, however, belie, as shown in Table 60, a wide diversity of experiences across the population. The data presented shows the levels of participation at the 5th, 25th, 50th, 75th and 95th percentile points. (In each case these are calculated independently; that is, a child may be in the lowest vigintile (that is, below the 5th percentile point) of attendance on the number of days attended in the quarter, but not in the calculation of average hours on the day.) As shown, while 5 per cent of children identified in the system had less than 9 hours actual attendance across the quarter, another 5 per cent had 441 hours or more.
| Point in distribution | Days in quarter attended | Hours in quarter | Weeks in quarter | Days in weeks attended | Hours on days attended | ||
|---|---|---|---|---|---|---|---|
| Charged | Attended | Charged | Attended | ||||
| (days) | (hours) | (weeks) | (days) | (hours) | |||
| 5th percentile | 4 | 18 | 9 | 2 | 1 | 2.0 | 1.0 |
| 25th percentile | 22 | 95 | 53 | 10 | 2 | 3.8 | 2.2 |
| 50th percentile | 36 | 235 | 143 | 12 | 3 | 8.3 | 5.2 |
| 75th percentile | 50 | 396 | 262 | 13 | 4 | 10.5 | 6.9 |
| 95th percentile | 65 | 624 | 441 | 13 | 5 | 12.0 | 8.5 |
| Mean | 34.4 | 259.6 | 170.6 | 10.4 | 3.2 | 7.4 | 4.8 |
Notes: All children with an identified record in the quarter.
Source: DESE administrative data
6.2.1 Trends in the use of child care
Trends in the number of children using child care by type of care, and whether it is provided by a for-profit or not-for-profit provider, are shown in Figure 90, along with year-on-year growth rates (based on the last 6 months of the year) in Table 61.
The table reports, on the basis of the matched 6 monthly periods,111 an overall growth in provision, by 0.8 per cent in 2017-18, and a stronger 1.7 per cent in 2018-19. While this growth mainly represents additional provision, it also includes, from July 2019, over 4,300 children who had previously attended a service that had received Budget Based Funding or related support and who had been outside of the scope of the CCB/CCR funding regime and hence the administrative data.112 Across sectors, however, quite different trajectories have occurred, with this being particularly marked with declines in both periods in the Family Day Care and In Home Care sectors. The circumstances of these 2 sectors are considered in Chapter 9.
Figure 90: Children in child care by service type and sector, January 2017 to December 2019
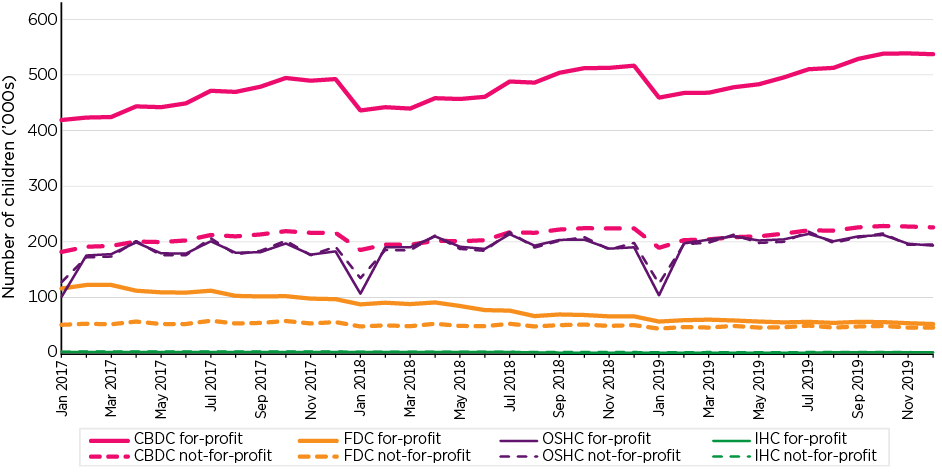
Notes: Count of all children with a child record in the month.
Source: DESE administrative data
Excluding these 2 sectors to focus on Centre Based Day Care and Outside School Hours Care - the 2 sectors that account for some 90 per cent of child care provision - sees higher growth rates. The rate of growth in 2017-18 is 4.7 per cent, and in 2018-19, 3.4 per cent. This, though, suggests growth was higher in the first period, a reverse of the pattern seen if all services are included. These growth rates also need to be compared with longer term trends. Between 2004 and 2017 the number of children in child care increased at an annualised rate of 4.2 per cent, and between 2010 and 2017 by 5.4 per cent.113
| Average July to December | Annual growth | ||||
|---|---|---|---|---|---|
| 2017 | 2018 | 2019 | 2017-18 | 2018-19 | |
| (children) | (%) | ||||
| CBDC For-profit | 482,142 | 502,723 | 527,153 | 4.3 | 4.9 |
| CBDC Not-for-profit | 213,082 | 219,893 | 223,379 | 3.2 | 1.6 |
| FDC For-profit | 100,390 | 66,824 | 52,756 | -33.4 | -21.1 |
| FDC Not-for-profit | 53,378 | 48,202 | 45,264 | -9.7 | -6.1 |
| OSHC For-profit | 184,963 | 197,160 | 202,964 | 6.6 | 2.9 |
| OSHC Not-for-profit | 187,873 | 198,840 | 203,328 | 5.8 | 2.3 |
| IHC For-profit | 1,654 | 864 | 826 | -47.8 | -4.4 |
| IHC Not-for-profit | 2,395 | 1,470 | 1,276 | -38.6 | -13.2 |
| Total | 1,225,877 | 1,235,975 | 1,256,946 | 0.8 | 1.7 |
Notes: Based on monthly data as per Figure 90.
Source: DESE administrative data
While across all forms of care the not-for-profit sector grew more quickly in the 2017-18 period at 2.6 per cent, relative to a decline of -0.2 per cent in the for-profit sector, the reverse occurred in 2018-19, with the not-for-profit sector growing by 1.0 per cent, and the for-profit sector by 2.1 per cent. Again, critical to this were the experiences of the Family Day Care sector where for-profit provision has fallen by 33.4 per cent and 21.1 per cent over the 2 years, with a milder fall of 9.7 per cent and 6.1 per cent in the not-for-profit sector, and the In Home Care sector where the level of provision in the private sector fell by 47.8 per cent between July to December 2017 and the corresponding period in 2018, and a further 4.4 per cent to 2019. In this sector, while the not-for-profit sector has a smaller fall between 2017 and 2018 of 38.6 per cent, the fall of 13.2 per cent in the 2018 to 2019 period was larger than that for these services in the for-profit sector.
6.2.2 Time spent in child care
Data on actual time spent in child care by children is only available since the introduction of the Package, and has been discussed in Section 2.2.2, Figure 91 shows the trends in average weekly hours charged by service type since Q1 2017. The data shows diverse trends across the sectors. In the Centre Based Day Care sector there has been a slight ongoing increase, it is not possible to determine whether this has been driven by increases in the number of days of care used, or longer charged sessions. There does not appear, however, to be any marked change in the trend with the introduction of the Package. The Family Day Care sector shows a quite strong decline in the average hours charged, which is associated with the shift, discussed in Section 4.3.2, towards charging on an hourly basis. The decline in average hours in the In Home Sector is relatively small but does appear to be related to the introduction of the Package, as does the marked increase in average hours recorded in the Outside School Hours Care sector.
Figure 91: Average hours of child care charged per child per week, by service type, Q1 2017 to Q4 2019
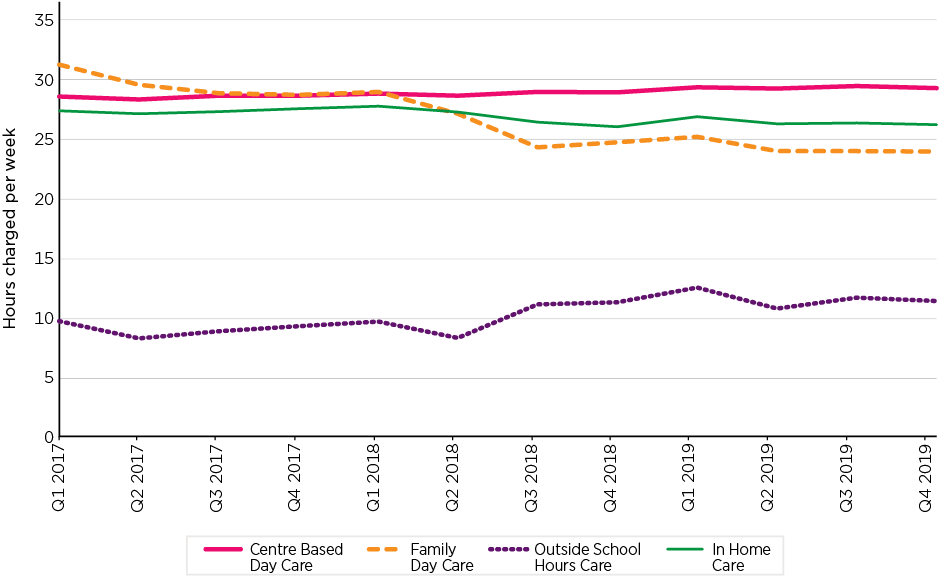
Source: DESE administrative data
6.2.3 Identification of children using child care
With the introduction of the Child Care Package, there have been changes that impact on recording the number of children in child care. In particular, all children regardless of their CCS entitlement are included in the administrative data from July 2018, while before this, children who received no subsidies were not necessarily in the administrative data. In exploring potential changes in access to child care, it is important to understand to what extent these changes might impact on the numbers of children recorded as using child care, and this is explored in this section.
One potential group that may have been impacted by this are children who attend care but without a subsidy claim. While previously there were some children within the child care database for whom no subsidy was payable, measurement of this group is difficult as, as illustrated in Figure 92, the actual count in the earlier period reflects 2 groups. The first are those continually in this situation. This was very small, potentially around one per cent. Secondly, over each financial year the number of children recorded as not being in receipt of assistance increased as more families reached their CCR cap and hence became identified in the data as having no subsidy payment. In contrast, since the Package has been introduced, the rate has been around 5-6 per cent, although potentially lower in 2019-20 than in 2018-19.
Figure 92: Proportion of children identified in child care data with fees but no subsidy, January 2017 to December 2019
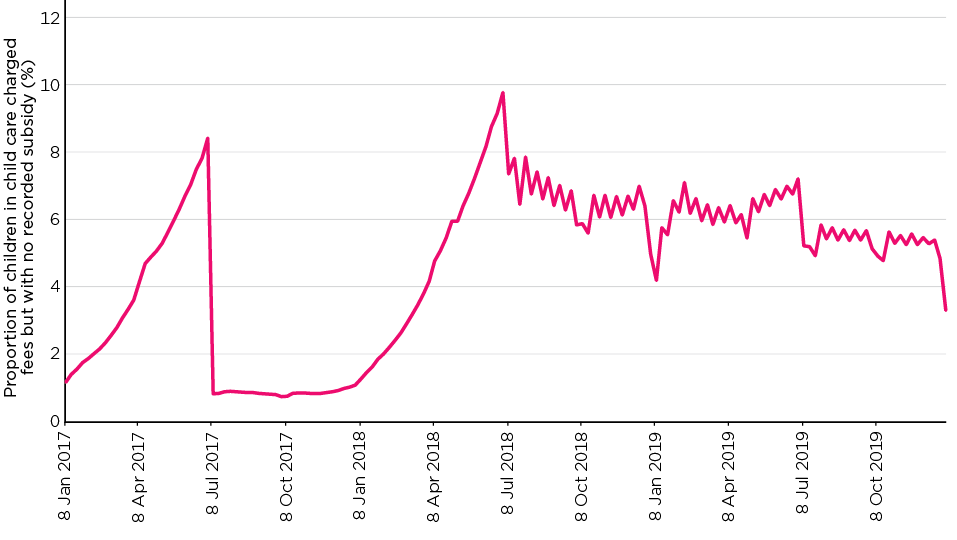
Source: DESE administrative data
There are a number of reasons why this group of 'non-subsidy' children occur, some of these include:
- those families that exceed the eligibility cap for CCS because their incomes exceed $351,247
- families who do not meet residency and other requirements for eligibility, or where the person making the claim does not have sufficient care of the child
- families who do not wish to engage with the subsidy system or are unwilling to make an application and interact with Centrelink
- where parents have not immunised a child, or where a child is older than 13, or in high school, without having been approved to attend child care.
As noted, it is not possible to apportion the rise shown in the figure between the above factors but, nevertheless, it is probable that some of the apparent increase in provision does not reflect additional access.
6.3 Snapshot of access
The existence of an age profile of child care use has been seen in Chapter 2. Figure 93 presents this in terms of the proportion of the population of a specific age who use child care, by state. This chart points to very marked state differences in levels, and to a lesser degree patterns, of participation.
Figure 93: Child care, rate of use, by single year of age and state, Q4 2019
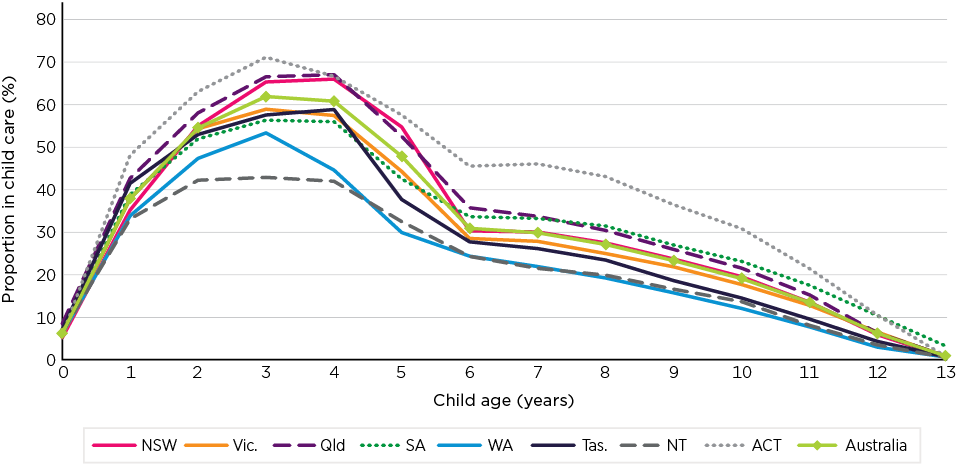
Source: DESE administrative data (Q4 2019) and ABS National, State and Territory Population Cat No 3101.0 (June 2019)
For all ages, except for children aged 0 and aged 13 years, the ACT has the highest rate of child care use, with rates up to 10 percentage points higher than the national average in the preschool group, and over 15 percentage points higher at ages 7 and 8. In contrast, the rate of access to child care in the Northern Territory and Western Australia sits well below the national average. In the Northern Territory the deficit is particularly marked from age 2, where the gap is 12.4 percentage points, and age 3, where the gap is 19.1 percentage points. While there are also large gaps for those aged 4 and 5 years, some caution needs to be exercised around these ages, given the complex interactions between child care and preschool education in different states.
A further insight into relative access is provided in Table 62, which decomposes participation rates by geographic locations within states. Here even more stark disparities can be seen. Access rates to child care for children aged under 5 years in remote and very remote locations are well under half of the rates in capitals and in major towns and cities, and are just under a third of that which exists in towns of 20,000-50,000 people.114 Indeed, for children of this age group, the highest levels of provision appear to be in the larger non-capital city urban locations. In contrast, the level of provision in regional areas without any larger urban settlement tends to be low. Notwithstanding these features, the overall picture is one of much inconsistency. For example, while towns of 10,000-20,000 people in Victoria have higher rates of access by these young children relative to larger urban areas in the state, this is reversed in Queensland, and in Tasmania.
A similar set of disparities exists for children in the 5-9 years age group, although here there appears to be a more consistent pattern of higher provision in the capitals, with the rate of access then declining as these urban locations have smaller populations, and then again for non-urban locations by remoteness.
While it is not possible to determine whether these results reflect supply or demand side factors, they do, however, point to inconsistent levels of access to child care across the country. For the younger age group, this has particular implications with respect to the role of this sector in early learning and child development.
| Urban and regional location | State | Australia | |||||||
|---|---|---|---|---|---|---|---|---|---|
| NSW | Vic. | Qld | SA | WA | Tas. | NT | ACT | ||
| Children aged 0-4 years in child care as proportion of children aged 0-4 years a (%) | |||||||||
| Capital Cities | 48.3 | 47.9 | 56.8 | 46.3 | 42.0 | 60.3 | 52.7 | 63.0 | 49.0 |
| Urban 100k plus | 55.2 | 58.9 | 59.2 | - | - | - | - | - | 57.5 |
| Urban 50k-<100k | 64.2 | 50.6 | 57.4 | - | 36.9 | 57.1 | - | - | 54.3 |
| Urban 20k-<50k | 63.1 | 52.7 | 54.2 | 58.2 | 71.8 | 69.8 | 38.2 | - | 60.4 |
| Urban 10k-<20k | 49.1 | 61.7 | 40.5 | 45.9 | 34.2 | 45.0 | - | - | 47.8 |
| Inner Regional | 35.0 | 36.3 | 28.6 | 30.5 | 22.0 | 21.3 | - | b | 33.0 |
| Outer Regional | 32.1 | 27.1 | 33.1 | 29.9 | 28.4 | 23.8 | 17.4 | - | 30.6 |
| Remote | 35.3 | - | 16.8 | 31.4 | 19.9 | 6.8 | 22.9 | - | 23.2 |
| Very Remote | 13.8 | - | 23.6 | 28.7 | 20.0 | 55.1 | 13.8 | - | 19.7 |
| Total | 49.1 | 47.9 | 53.1 | 44.5 | 40.9 | 50.9 | 37.3 | 63.1 | 48.5 |
| Children aged 5-9 years in child care as proportion of children aged 5-9 years a (%) | |||||||||
| Capital Cities | 39.4 | 36.4 | 45.9 | 40.8 | 26.4 | 39.3 | 42.2 | 57.9 | 38.5 |
| Urban 100k plus | 38.7 | 35.5 | 40.8 | - | - | - | - | - | 39.4 |
| Urban 50k-<100k | 37.4 | 27.2 | 35.6 | - | 20.3 | 31.5 | - | - | 31.3 |
| Urban 20k-<50k | 33.3 | 23.3 | 29.3 | 26.7 | 28.9 | 39.0 | 17.0 | - | 29.9 |
| Urban 10k-<20k | 25.9 | 27.4 | 26.7 | 17.8 | 16.7 | 28.6 | - | - | 24.2 |
| Inner Regional | 19.0 | 19.8 | 17.7 | 23.5 | 10.5 | 10.9 | - | 50.0 | 18.6 |
| Outer Regional | 13.8 | 8.8 | 17.0 | 17.4 | 7.3 | 11.3 | 22.9 | - | 14.1 |
| Remote | 12.4 | - | 5.1 | 15.3 | 4.4 | 2.9 | 16.4 | - | 8.9 |
| Very Remote | 9.4 | - | 11.2 | 10.7 | 4.8 | 29.8 | 4.7 | - | 7.3 |
| Total | 35.7 | 33.2 | 38.6 | 36.2 | 23.9 | 29.9 | 26.1 | 57.9 | 34.6 |
Notes: a Based on children attending services in Q4 2019, and 2016 census population at the SA2 level. The estimated proportion of children in child care using this older population base of 48.5 per cent for the 0-4 year old age group, and 34.6 per cent for the 5-9 age group, compares with estimates based on the current population in June 2019 of 44.6 per cent and 31.5 per cent. b Jervis Bay not shown.
Source: DESE administrative data and ABS Census 2016, Census TableBuilder
6.4 Changes in access (changes in utilisation)
Changes in access, expressed in terms of the proportion of children who attend child care, by single age of child are shown in Figure 94. This shows the proportion of children in each age group who were in child care in the 4th quarter of 2017, 2018 and 2019.115 The chart shows a number of different shifts in participation. In particular:
- In 2019 relative utilisation by children at each single age between one and 5 years, and those aged 7, was above that in either of the previous 2 years.
- In contrast, it was lower than both prior years for those aged zero, 6, and 9-13 years, while for those aged 8, it was higher than in 2018 but lower than in 2017.
While generalising from this is difficult, it suggests that there may have been some slight gains in access at the younger ages of the distribution and some reductions for older children.
Figure 94: Proportion of children who attended child care, single years of age, Q4 2017, 2018, 2019
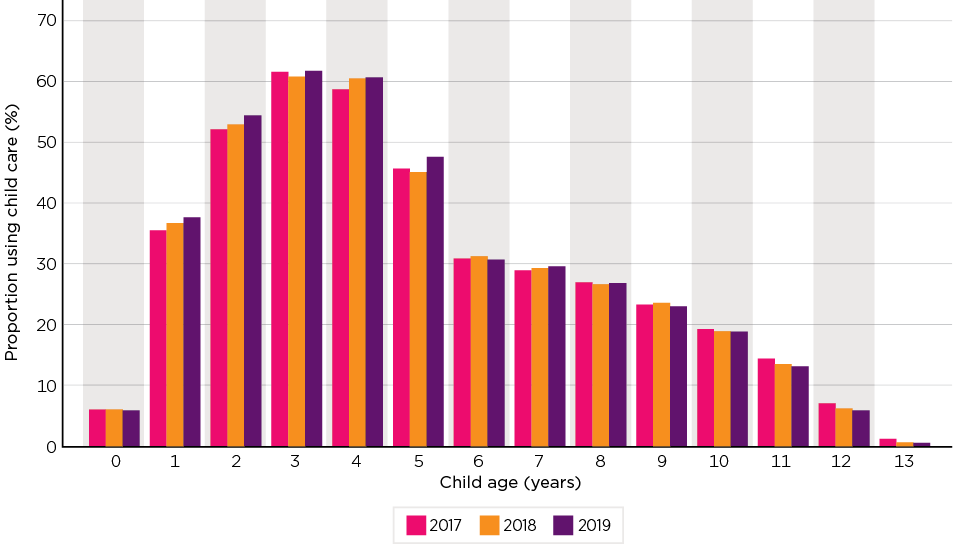
Notes: Based on children attending services in Q4 of each calendar year.
Source: DESE administrative data, and ABS National, State and Territory Population Cat No 3101.0 (June 2017, June 2018, June 2019)
6.4.1 Regional changes in child care provision
This analysis is undertaken on change over a 2-year period from Q4 2017 to Q4 2019. The choice of this period was a compromise. The level of change over the one-year period from the introduction of the Package was not sufficient to provide any effective overview at this level of detail, while to extend this to an 18-month period confuses actual change with the annual pattern that comprises increases over the calendar year followed by falls with the commencement of school. The extended period is also not necessarily inappropriate. Given that the introduction of the policy was well publicised over an extended period prior to its commencement, to the extent the policy was perceived of as improving (or potentially adversely affecting) demand for child care, it can be argued that some services would have sought to make pre-emptive changes - some of which might be picked up in this wider time span.
Table 63 presents this data, firstly on the basis of all services, and then for Centre Based Day Care and Outside School Hours Care only so as to minimise the more specific circumstances of Family Day Care and In Home Care sectors. While this approach removes the more volatile movements in the data, caution needs to be exercised as to whether some of the growth in the other sectors is as a result of displaced demand, rather than reflecting a real increase in access to child care.
While both NSW and Victoria show relatively systematic growth across all locations in the data excluding In Home Care and Family Day Care Services, this is not the case for other states and territories. These, with the exception of Tasmania and the ACT, have disparate patterns of increases in some locations and decreases in others. In Tasmania, while no locations show a decline, a number show an absence of growth (and the ACT only has services identified as being in the capital in this table). Across states, while some locations such as the capital cities consistently show growth, the magnitude of this varies considerably. Further, once the data for child care as a whole is considered, any systematic pattern of change dissipates.
| Urban and regional location | State | Australia | |||||||
|---|---|---|---|---|---|---|---|---|---|
| NSW | Vic. | Qld | SA | WA | Tas. | NT | ACT a | ||
| Change in number of children attending Q4 2017 to Q4 2019 (%) | |||||||||
| All child care services | |||||||||
| Capital Cities | -1.7 | -1.0 | 3.4 | 3.7 | 7.1 | 1.5 | 9.6 | 9.6 | 1.2 |
| Urban 100k plus | 6.9 | 17.8 | 3.3 | - | - | - | - | - | 5.9 |
| Urban 50k-<100k | 3.3 | 5.9 | 5.8 | - | 7.4 | 3.1 | - | - | 5.2 |
| Urban 20k-<50k | -0.6 | 11.9 | -4.4 | 1.5 | 7.1 | -0.1 | 16.2 | - | 2.2 |
| Urban 10k-<20k | 2.8 | 11.5 | 18.6 | -15.9 | 11.8 | 12.4 | - | - | 6.3 |
| Inner Regional | 3.7 | 7.3 | -2.6 | 2.7 | 2.0 | -9.8 | - | - | 3.5 |
| Outer Regional | -4.3 | 13.8 | 0.0 | 5.9 | 9.2 | 1.3 | -0.2 | - | 0.7 |
| Remote | -1.9 | - | -26.2 | -5.9 | -18.3 | 0.0 | 1.5 | - | -11.3 |
| Very Remote | -9.5 | - | -6.8 | 13.5 | 4.1 | 0.0 | -10.1 | - | -1.6 |
| Total | 0.1 | 1.3 | 3.1 | 2.9 | 6.9 | 1.5 | 8.1 | 9.7 | 2.1 |
| CBDC and OSHC only | |||||||||
| Capital Cities | 6.3 | 10.6 | 6.3 | 6.1 | 11.4 | 5.1 | 10.0 | 11.4 | 8.1 |
| Urban 100k plus | 8.0 | 14.9 | 5.1 | - | - | - | - | - | 7.1 |
| Urban 50k-<100k | 4.8 | 14.0 | 5.1 | - | 4.7 | 5.5 | - | - | 8.0 |
| Urban 20k-<50k | 4.4 | 14.1 | 0.9 | 7.6 | 13.2 | 0.1 | 21.6 | - | 6.7 |
| Urban 10k-<20k | 4.9 | 17.6 | 22.0 | -9.0 | 16.4 | 12.4 | - | - | 11.1 |
| Inner Regional | 6.4 | 12.8 | -5.5 | 2.7 | -1.7 | 23.7 | - | - | 5.7 |
| Outer Regional | 3.6 | 22.9 | -0.7 | 11.1 | 18.7 | 1.6 | -12.8 | - | 4.3 |
| Remote | 5.3 | - | -35.2 | 4.6 | -6.9 | 0.0 | 1.5 | - | -8.0 |
| Very Remote | 75.7 | - | 29.9 | -26.3 | 3.2 | 0.0 | 37.1 | - | 16.3 |
| Total | 6.3 | 11.5 | 5.3 | 5.7 | 11.1 | 4.8 | 10.8 | 11.3 | 7.7 |
Notes: a Excludes non-capital locations.
Source: DESE administrative data
Given this, it does not appear possible to draw any substantive conclusion as to the extent to which access has changed at this level of geography, other than noting that there is no systematic evidence of a comprehensive shift in provision.
6.4.2 Families in receipt of FTB
Another perspective on the relative rate of usage of child care, albeit for a more limited population, can be obtained by looking at the participation of children whose parents were in receipt of FTB payments, either in combination with receiving income support or not. This is considered here firstly as a snapshot of current usage and then trends over time.
Child care use by parental transfer payment receipt and child age
Data in Figure 95 presents the age profiles of child care use for 7 groups of families classified by the level of transfer payment they receive (full-rate of pension or benefit, part-rate (including in couples where only one receives a full-rate payment, and FTB only), single parent or couple status, and a residual category of those who do not receive any transfers) in June 2019.
The chart plots some very marked differences in the propensity to use child care by child age and parental income support usage. Overall, it shows that single parents in receipt of transfer payments use child care at much higher rates than couples in similar circumstances. Highlighting the critical role child care provides in enabling these parents to participate in employment, a dominating feature of the chart is the exceptionally high rates of use by single parents with a part-rate of benefit and young children. In contrast, couples in receipt of transfers have quite low rates, with this being particularly marked for children of school age.
Overall, the chart also suggests that those single parents either in receipt of FTB only, or on a part-rate of benefit, show a pattern of child care usage more aligned with that of parents not in receipt of any transfers.
Figure 95: Utilisation of child care, by child age and FTB/Income support receipt by parents, Q2 2019
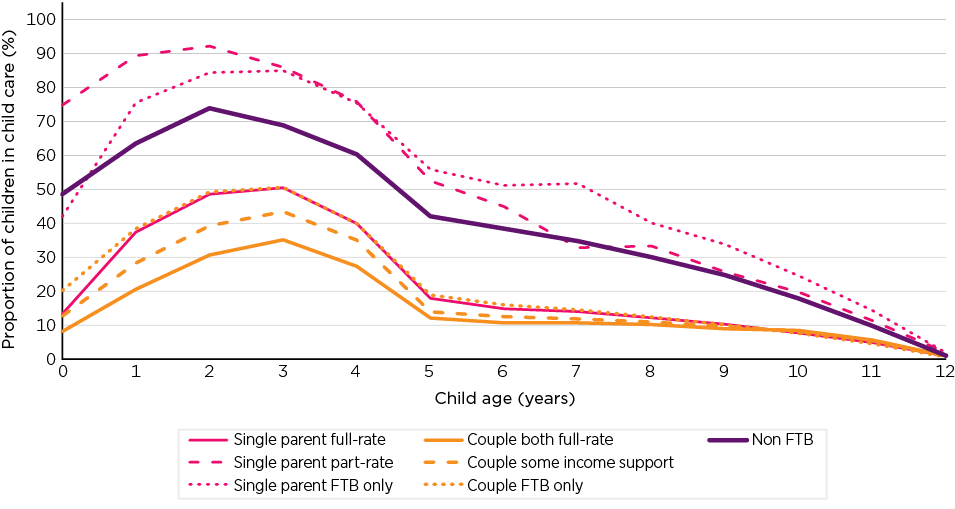
Notes: Non FTB cannot be split by family type as population data is not available on this basis by single year of age.
Source: DESE and DSS administrative data, ABS National, State and Territory Population Cat No 3101.0 (June 2019)
Changes since the introduction of the Child Care Package
Table 64 considers trends in child care participation of children of these parents, by broad child age group on a quarterly basis since 2017. In considering this data, care needs to be taken in accounting for seasonality as a number of series; for example, single parents on part-rate payments, show a marked pattern. For example, in the 3 calendar years for this group of parents with children aged under 6 years, the Q4 rate of participation is 2.8, 3.4 and 3.4 percentage points respectively higher than it was in Q2 of each of these years.
Overall, the data shows diverse patterns.
- Single parents on full-rate income support payments generally show a decline for children of both age groups with this being more marked in the earlier period. For those on a part-rate benefit there has been a general increase in the rate of use by younger children and a decline for older children in their use of child care. This pattern is repeated for those children of a single parent who is in receipt of FTB only.
- There was generally declining use - or access by couples where they received either full or partial income support, with this being particularly marked by those on full-rates of support and more apparent in the earlier period. However, as will be considered in Chapter 8, these groups have declined as a share of parents, leaving this change open to being a reflection of compositional change.
- For couples in receipt of FTB only there is no consistent trend in the participation of children under 6 years in child care, although there is a decline in participation by older children.
Hence, again, while some of these groups of parents appear to be showing increased levels of access to child care, this is not a uniform trend - either for different age groups of children or parents in different circumstances. More so, the patterns seen since the introduction of the Package do not appear to be inconsistent with those seen prior to this, suggesting the main factors are longer standing trends.
| Single Parent | Couple | |||||
|---|---|---|---|---|---|---|
| Full-rate | Part-rate | FTB only | Full-rate | Part-rate | FTB only | |
| Proportion of children using child care (%) | ||||||
| Children aged under 6 years | ||||||
| Q1 2017 | 36.6 | 72.0 | 58.6 | 27.3 | 34.3 | 38.1 |
| Q2 2017 | 35.5 | 70.7 | 58.2 | 26.7 | 32.9 | 37.9 |
| Q3 2017 | 37.0 | 72.8 | 59.0 | 27.2 | 33.6 | 37.6 |
| Q4 2017 | 36.6 | 73.5 | 59.8 | 25.7 | 32.8 | 37.1 |
| Q1 2018 | 35.7 | 72.4 | 58.6 | 25.7 | 32.5 | 37.6 |
| Q2 2018 | 34.2 | 71.1 | 58.6 | 24.0 | 30.9 | 37.1 |
| Q3 2018 | 34.7 | 73.0 | 58.2 | 22.7 | 30.3 | 36.5 |
| Q4 2018 | 34.4 | 74.5 | 60.1 | 21.7 | 30.2 | 36.6 |
| Q1 2019 | 34.4 | 73.2 | 57.8 | 22.3 | 30.0 | 37.5 |
| Q2 2019 | 33.3 | 71.4 | 56.7 | 20.6 | 28.6 | 36.9 |
| Q3 2019 | 35.1 | 73.8 | 58.0 | 21.2 | 29.4 | 37.2 |
| Q4 2019 | 35.1 | 74.8 | 60.6 | 20.5 | 29.7 | 37.2 |
| Children aged 6-12 years | ||||||
| Q1 2017 | 14.5 | 30.2 | 26.3 | 19.3 | 17.2 | 14.0 |
| Q2 2017 | 13.7 | 29.4 | 26.2 | 17.7 | 16.2 | 14.0 |
| Q3 2017 | 14.4 | 30.5 | 27.3 | 17.8 | 16.7 | 14.2 |
| Q4 2017 | 13.7 | 30.4 | 27.5 | 16.2 | 16.0 | 13.8 |
| Q1 2018 | 13.0 | 29.3 | 25.8 | 15.9 | 15.0 | 13.2 |
| Q2 2018 | 11.9 | 28.4 | 25.7 | 14.1 | 13.7 | 12.8 |
| Q3 2018 | 11.5 | 29.0 | 26.0 | 11.5 | 11.9 | 12.3 |
| Q4 2018 | 11.1 | 29.2 | 26.7 | 11.0 | 11.7 | 12.4 |
| Q1 2019 | 10.5 | 28.0 | 24.8 | 10.8 | 11.1 | 11.9 |
| Q2 2019 | 10.0 | 27.3 | 24.7 | 9.5 | 10.0 | 11.7 |
| Q3 2019 | 10.5 | 28.6 | 25.9 | 8.7 | 10.0 | 12.1 |
| Q4 2019 | 10.0 | 28.5 | 26.4 | 8.2 | 9.8 | 11.9 |
Notes: Proportion of non-FTB children using child care cannot be calculated, as population of non-FTB children cannot be derived on a parental relationship basis or accurately on a quarterly basis.
Source: DESE and DSS administrative data
6.4.3 Days per week attendance
The diversity of daily attendance has been seen in Table 60. One issue which was raised in qualitative research, as discussed further below, and by services in the SELCS, was the extent to which the new funding arrangements, including the operation of the activity test, may have led to a reduction in the number of days a week of attendance, with a particular focus on young children in Centre Based Day Care services. Low income families who do not meet the activity test requirements are either entitled to 24 hours of subsidised care per fortnight for each child, or 36 hours if the child is preschool-aged and attends a preschool program at a Centre Based Day Care service, as part of the Child Care Safety Net. However, these hours can be quickly absorbed by long session times and weekly booking routines,116 with the 24 or 36 hours typically translating to one day a week in a service that has 10, 11 or 12 hour daily sessions. There was a strong view that attendance of only one day a week was insufficient for children's early learning opportunities, including for the preparation of school-readiness. There were also views that one day a week was not sufficient for effective attachment bonds to be formed between a carer and a child, and as children aged, effective building of friendship networks.
The length of time spent in quality early childhood programs is considered critical for child outcomes. There is strong evidence that more time spent in centre based early learning, or in instruction in specific content areas, predicts larger gains among preschoolers (Burchinal et al., 2016). Across all the case studies, numerous service directors and key stakeholders argued that the fortnightly entitlements of children in low income families who did not meet the activity test were insufficient to meet the learning needs of children. This was of particular concern as participants felt these children were often the ones who needed this experience the most.
We have to get around to asking 'Why are we providing funding? What is being effective? And what is the purpose of it?' I think also when you've got that wraparound of where it's accessibility for our most vulnerable and targeted, to simply support, and this isn't about education, it's about, you know, when you look at children in poverty and when you look at children who are vulnerable, targeted and subjected to harm, that's where we also used to function highly, in that long day care space […] Countless numbers of evidence-based research and papers say they need to be in early childhood and having that education and care experience prior to [school] and this was a source, and I think that that's just been lost.
[CBDC and OSHC stakeholder, April 2020]
Prior to the introduction of the Package, children whose parents were entitled117 to the base level of approved hours of care of 24 hours per fortnight had been able to access more than one day of subsidised child care each week.118 In some of the case study sites, particularly Case Study 1, which was an area selected to enable a focus on child care use in a low income area in an outer metropolitan location, there was evidence that a small number of Centre Based Day Care and Family Day Care services were responding by offering a 6-hour daily session, meaning that children could attend 2 or 3 days per week. However, this session offering remained uncommon despite the significant concern raised about meeting the education and care needs of children from economically disadvantaged families. This is discussed further in Chapter 7.
The incidence of such limited attendance was analysed through identifying the number of children who only attended Centre Based Day Care Services, and only attended this on a one day a week basis in all weeks of a quarter in which they attended care. This analysis could only be conducted from Q3 2018 onwards as earlier data on days or sessions attended was not available.119 As shown in Figure 96, by single year of age, and over time, some 8-16 per cent of children show this pattern of attendance, with the highest rate being recorded by children aged under one year, with other ages sitting in a narrower band. While only a relatively short time series is possible, this points to a decline in the use of this type of care arrangement between the last 2 quarters of 2018 and the last 2 of 2019. On average over the 2 quarters for which year-on-year estimates are possible:
- The rate had dropped by 1.2 percentage points for children aged under 2 years.
- It has fallen by 1.0 percentage point for those aged 2 and 3 years.
- It has fallen by 0.4 of a percentage point for children aged 4 years.
The occurrence of this type of child care use is, however, concentrated in some groups. For example, while children of parents who have an entitlement to a subsidy for 24 or 36 hours care per fortnight only account for some 6.6 per cent of children aged 4 years and under who only attend a Centre Based Day Care service, these children account for 24.7 per cent of this single day a week pattern of attendance.
Figure 96: Proportion of children attending Centre Based Day Care for a single day only per week, by age, Children aged 4 years and under, Q3 2018 to Q4 2019
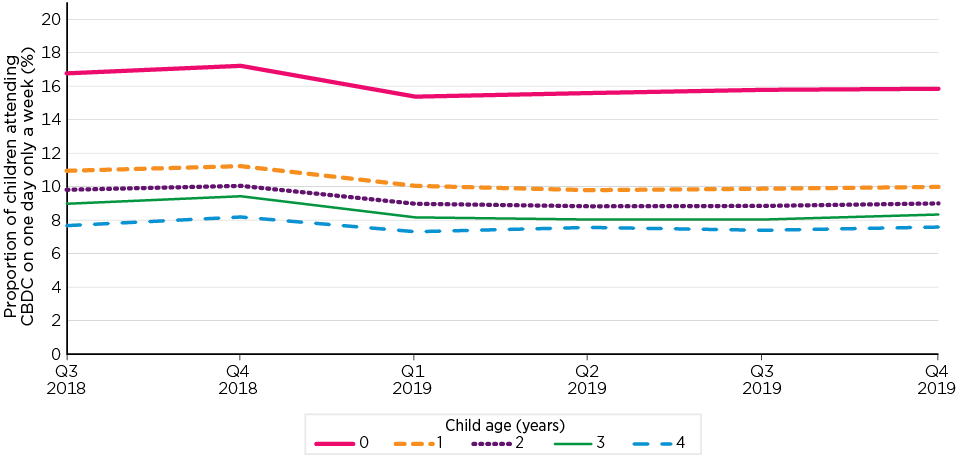
Notes: Children who only attended Centre Based Day Care and only attend child care on one day a week in all weeks they attended child care in the quarter.
Source: DESE administrative data
6.4.4 Recent changes in provision and access
The relatively short time since the adoption of the Package limits the extent to which changes in access can be observed. As noted, however, given that the main parameters were well known beforehand, this did provide scope for services to anticipate the pattern of future demand and build capacity to meet this. On the basis of the data considered here, the evidence suggests a small increase in access, although this was far from consistent across states and across locations within states, and appears to have been largely for younger children in certain family circumstances.
There has been a concern that some aspects of the new arrangements (in particular, for families with access to 24 allowed hours) might lead to families increasingly using only one day a week of child care. The trend, however, appears to generally show a decline in single day a week usage since the introduction of the Package.
6.5 Impact of the introduction of the Package
This section is concerned with the immediate impact of the introduction of the Package; in particular, the extent to which the new funding arrangements may have acted to exclude some children and families, or encouraged the entry of others who were previously outside the sector.
Initial consideration, Table 65 to Table 70, addresses the transition experience overall and by sector. Specifically, these tables focus on the population of children who were in child care in either Q2 2018; that is, immediately prior to the introduction of the CCS and associated measures, and in Q3 2018, the initial 3 months of operation of the new arrangements. It divides the population into those continuing; that is, who appear in the data at some point in the 3 months either before or after 2 July 2018, those who exited prior to this date, and those who entered after. In turn, these are broken down into 3 groups, the first based on being in one of these states in the 2 fortnights on either side of the introduction, the second, while not in this group, being in one of these states in the balance of the month on either side, and the third, any other time in the quarter. The same calculations have been undertaken using data from 2017 and 2019 and classified in the same manner to provide a reference as to what the usual pattern of change is.
Table 65 presents data for all child care sectors. This suggests that the rate of exits in 2018 of 13.0 per cent of children was above that of either 2017, 12.1 per cent, and that of 2019, 11.2 per cent - indicating potentially that some 1 per cent of children attending child care before the introduction of the new arrangements may have been withdrawn from care coincident with this - somewhere in the order of 13,000 children. Of particular note in this data are the 1.5 per cent of the children who were in child care in the 3 months prior to the introduction of the policy who, despite being in child care in the fortnight before, were not seen again in the following 3 months. This is higher than the 0.9 per cent in 2017 and 0.8 per cent in 2019.
| Transition status a | As share of Q2 population | As share of Q3 population | ||||
|---|---|---|---|---|---|---|
| 2017 | 2018 | 2019 | 2017 | 2018 | 2019 | |
| Composition (%) | ||||||
| Continuing - fortnight | 65.6 | 66.9 | 71.2 | 65.4 | 66.3 | 70.7 |
| Continuing - month | 12.8 | 9.5 | 8.6 | 12.8 | 9.4 | 8.5 |
| Continuing - quarter | 9.5 | 10.6 | 9.1 | 9.4 | 10.5 | 9.0 |
| Subtotal continuing | 87.9 | 87.0 | 88.8 | 87.6 | 86.2 | 88.2 |
| Before - last fortnight | 0.9 | 1.5 | 0.8 | - | - | - |
| Before - last month | 0.7 | 0.7 | 0.5 | - | - | - |
| Before - in quarter | 10.5 | 10.7 | 9.8 | - | - | - |
| Subtotal exit | 12.1 | 13.0 | 11.2 | - | - | - |
| After - first fortnight | - | - | - | 2.2 | 2.9 | 1.9 |
| After - first month | - | - | - | 1.4 | 1.8 | 1.4 |
| After - in quarter | - | - | - | 8.8 | 9.1 | 8.4 |
| Subtotal entering | - | - | - | 12.4 | 13.8 | 11.8 |
| Total | 100.0 | 100.0 | 100.0 | 100.0 | 100.0 | 100.0 |
Notes: a Persons are firstly classified as continuing, exits or entries, based on whether they are present in the quarter before and after the commencement of the first full fortnight in July. They are then classified on the basis of whether, in the case of continuing, they were present in the fortnight before and after, or in the case of exits, the fortnight before, or entries, the fortnight after the data. This process is then repeated for the balance of the month, and then the balance of the quarter to form the other groups.
Source: DESE administrative data
New entrants, as a proportion of all children in child care in the third quarter, were higher in 2018 at 13.8 per cent, than the 12.4 per cent recorded in 2017, and 11.8 per cent in 2019, with this again being most marked in the fortnight following the introduction of the new arrangements.
As has been noted in Section 6.2, this may be partially affected by the inclusion in the reporting of attendance of all children, including those whose parents may not have been eligible for receipt of assistance, as well as inflows from former BBF services.
6.5.1 Impact by service type
As observed in Table 61, however, the patterns of change in children attending child care has varied considerably by sector. This is considered here. In the data used in these sector based tables, the entry and exit status has been derived as the child's experience in child care as a whole, and their sector of child care is based on their final record over the 2 quarters.
Centre Based Day Care
The transition pattern for Centre Based Day Care, Table 66, in large part reflects the changes seen for the sector overall, although suggesting a much lower rate of additional exits - some 0.3-0.6 percentage points. The existence of possible additional exits, however, remains particularly marked, although quite small, for the population of those attending the fortnight before, and suggests additional exits in the range of 0.2-0.3 percentage points. There is also a higher level of entries, with these in 2018 being some 1.4-1.9 percentage points higher than the preceding or succeeding years.
| Transition status a | As share of Q2 population | As share of Q3 population | ||||
|---|---|---|---|---|---|---|
| 2017 | 2018 | 2019 | 2017 | 2018 | 2019 | |
| Composition (%) | ||||||
| Continuing - fortnight | 84.9 | 84.4 | 86.3 | 80.8 | 79.4 | 82.4 |
| Continuing - month | 3.0 | 2.5 | 2.2 | 2.9 | 2.4 | 2.1 |
| Continuing - quarter | 3.7 | 4.4 | 3.5 | 3.5 | 4.1 | 3.3 |
| Subtotal continuing | 91.6 | 91.3 | 91.9 | 87.3 | 85.9 | 87.8 |
| Before - last fortnight | 0.6 | 0.8 | 0.5 | - | - | - |
| Before - last month | 0.4 | 0.4 | 0.3 | - | - | - |
| Before - in quarter | 7.4 | 7.5 | 7.3 | - | - | - |
| Subtotal exit | 8.4 | 8.7 | 8.1 | - | - | - |
| After - first fortnight | - | - | - | 2.1 | 2.8 | 1.8 |
| After - first month | - | - | - | 1.3 | 1.5 | 1.3 |
| After - in quarter | - | - | - | 9.3 | 9.8 | 9.1 |
| Subtotal entering | - | - | - | 12.7 | 14.1 | 12.2 |
| Total | 100.0 | 100.0 | 100.0 | 100.0 | 100.0 | 100.0 |
Note: a See notes Table 65.
Source: DESE administrative data
Family Day Care
In the Family Day Care sector over a quarter, 26.9 per cent, of children who were in child care in the 3 months prior to 2 July 2018 exited child care by the beginning of the next quarter, see Table 67. This is over double the proportion for child care as a whole of 13.0 per cent. One contribution to this very high rate, however, is the impact of compliance measures against some fraudulent providers. To exclude the effects of this, Table 68 presents data on transitions in the Family Day Care Sector excluding all services that have had compliance action taken against them.
| Transition status a | As share of Q2 population | As share of Q3 population | ||||
|---|---|---|---|---|---|---|
| 2017 | 2018 | 2019 | 2017 | 2018 | 2019 | |
| Composition (%) | ||||||
| Continuing - fortnight | 65.0 | 55.2 | 68.3 | 73.1 | 65.4 | 72.9 |
| Continuing - month | 5.9 | 6.0 | 4.5 | 6.6 | 7.1 | 4.8 |
| Continuing - quarter | 7.2 | 12.0 | 9.0 | 8.0 | 14.2 | 9.6 |
| Subtotal continuing | 78.1 | 73.1 | 81.7 | 87.8 | 86.6 | 87.3 |
| Before - last fortnight | 1.4 | 5.1 | 1.0 | - | - | - |
| Before - last month | 0.9 | 1.6 | 0.8 | - | - | - |
| Before - in quarter | 19.6 | 20.2 | 16.5 | - | - | - |
| Subtotal exit | 21.9 | 26.9 | 18.3 | - | - | - |
| After - first fortnight | - | - | - | 1.9 | 2.4 | 1.9 |
| After - first month | - | - | - | 1.4 | 1.4 | 1.4 |
| After - in quarter | - | - | - | 9.0 | 9.5 | 9.5 |
| Subtotal entering | - | - | - | 12.2 | 13.4 | 12.7 |
| Total | 100.0 | 100.0 | 100.0 | 100.0 | 100.0 | 100.0 |
Note: a See notes Table 65.
Source: DESE administrative data
Even after the exclusion of these services, while the rate of exits in this sector declines, it remains high at 19.1 per cent in 2018, compared with 15.6 per cent in 2017 and 17.9 per cent in 2019. This again indicates a likelihood of the introduction of the new arrangements having an impact on some families, which resulted in them removing children from care. The magnitude is though only in the region of some 1.2-3.5 percentage points if the other 2 years are taken as bounds on the estimate. This data does though very clearly highlight the apparent existence of a group who remained in care up to the point of the introduction of the new policy but then exited. This was comprised of 4.5 per cent of all children in the sector in Q2 2018 who, while attending child care in the last fortnight of the quarter, failed to attend at any time in the following 3 months - a rate that contrasts with the more usual 1.0 per cent seen in the other years.
Consideration of the role of new entrants associated with the transition is less clear, in part because of the contrast between 2019 and the more consistent pattern seen in 2017 and 2018.
Taken as a whole, while there is some data which supports there having been an impact, it can be suggested that the direct effect of the introduction of the new funding model was small compared to the broader changes faced by the sector.
| Transition status a | As share of Q2 population | As share of Q3 population | ||||
|---|---|---|---|---|---|---|
| 2017 | 2018 | 2019 | 2017 | 2018 | 2019 | |
| Composition (%) | ||||||
| Continuing - fortnight | 69.1 | 61.5 | 68.6 | 70.8 | 65.7 | 72.9 |
| Continuing - month | 7.2 | 6.5 | 4.5 | 7.4 | 6.9 | 4.8 |
| Continuing - quarter | 8.1 | 13.0 | 9.0 | 8.3 | 13.9 | 9.6 |
| Subtotal continuing | 84.4 | 80.9 | 82.1 | 86.5 | 86.4 | 87.3 |
| Before - last fortnight | 1.0 | 4.5 | 1.0 | - | - | - |
| Before - last month | 0.7 | 1.2 | 0.8 | - | - | - |
| Before - in quarter | 13.9 | 13.5 | 16.1 | - | - | - |
| Subtotal exit | 15.6 | 19.1 | 17.9 | - | - | - |
| After - first fortnight | - | - | - | 2.1 | 2.5 | 1.9 |
| After - first month | - | - | - | 1.5 | 1.4 | 1.4 |
| After - in quarter | - | - | - | 9.9 | 9.6 | 9.5 |
| Subtotal entering | - | - | - | 13.5 | 13.6 | 12.7 |
| Total | 100.0 | 100.0 | 100.0 | 100.0 | 100.0 | 100.0 |
Note: a See notes Table 65.
Source: DESE administrative data
Outside School Hours Care
This sector is one that has somewhat higher levels of entries and exits. This reflects the nature of the provision that includes both before and after school care during terms and vacation care, which, while in some cases are provided to the same children are, in other cases, not. The 6 month window shown in the table encompasses both forms of care.120
Transition changes in this sector are somewhat more marked in terms of entries rather than exits. While the rate of exits in 2018 of 14.9 per cent was higher than the 13.7 per cent in 2017 and 14.1 in 2019, the contrast between the 13.6 per cent of the Q3 population being entries in 2018 and the 11.9 per cent in 2017 and 10.8 per cent in 2019, is somewhat larger, see Table 69.
To the extent exits are elevated, the magnitude is relatively small when measured against the 2019 transition rate, suggesting an increase of 0.8 of a percentage point, and it is somewhat larger at 1.2 percentage points when compared with 2017. Further, while there is some sign of an increase in exits immediately before the introduction of the Package, much of the impact appears to be on the group with less immediate contact - those who, while in this form of care in Q2 2018, were not in care in the month prior to 2 July 2018.
| Transition status a | As share of Q2 population | As share of Q3 population | ||||
|---|---|---|---|---|---|---|
| 2017 | 2018 | 2019 | 2017 | 2018 | 2019 | |
| Composition (%) | ||||||
| Continuing - fortnight | 37.1 | 45.1 | 49.5 | 37.9 | 45.8 | 51.4 |
| Continuing - month | 30.2 | 20.6 | 19.0 | 30.9 | 21.0 | 19.7 |
| Continuing - quarter | 19.0 | 19.4 | 17.4 | 19.3 | 19.7 | 18.1 |
| Subtotal continuing | 86.3 | 85.1 | 85.9 | 88.1 | 86.4 | 89.2 |
| Before - last fortnight | 1.1 | 1.5 | 1.2 | - | - | - |
| Before - last month | 1.1 | 0.8 | 0.8 | - | - | - |
| Before - in quarter | 11.5 | 12.6 | 12.1 | - | - | - |
| Subtotal exit | 13.7 | 14.9 | 14.1 | - | - | - |
| After - first fortnight | - | - | - | 2.5 | 3.2 | 2.2 |
| After - first month | - | - | - | 1.6 | 2.2 | 1.5 |
| After - in quarter | - | - | - | 7.8 | 8.1 | 7.1 |
| Subtotal entering | - | - | - | 11.9 | 13.6 | 10.8 |
| Total | 100.0 | 100.0 | 100.0 | 100.0 | 100.0 | 100.0 |
Note: a See notes Table 65.
Source: DESE administrative data
In Home Care
As discussed in Chapter 10, transition in the In Home Care program was a managed and extended process as a consequence of the significant changes in the program structure, and underlying policy, including restrictions on eligibility. These were expected by the Department to reduce the number of children in receipt of this form of care. This is reflected below in the massive transition effect observed in the data with 40.1 per cent of the children using this form of assistance in Q2 2018 exiting at the end of the quarter. This compares with the more usual levels seen in the 2 comparison years of 16-18 per cent. Particularly marked are the 18.0 per cent of children who had still been receiving care in the last fortnight before the introduction of the new package who then exited - with this proportion contrasting with just 1 or 2 per cent in the other years. Also notable in this sector is a low level of entries in 2018.
| Transition status a | As share of Q2 population | As share of Q3 population | ||||
|---|---|---|---|---|---|---|
| 2017 | 2018 | 2019 | 2017 | 2018 | 2019 | |
| Composition (%) | ||||||
| Continuing - fortnight | 66.7 | 43.0 | 65.6 | 66.4 | 62.2 | 64.7 |
| Continuing - month | 8.5 | 5.9 | 7.1 | 8.5 | 8.5 | 7.0 |
| Continuing - quarter | 8.5 | 11.0 | 9.7 | 8.5 | 15.9 | 9.5 |
| Subtotal continuing | 83.8 | 59.9 | 82.4 | 83.3 | 86.6 | 81.2 |
| Before - last fortnight | 2.3 | 18.0 | 1.2 | - | - | - |
| Before - last month | 1.0 | 2.5 | 1.1 | - | - | - |
| Before - in quarter | 12.9 | 19.7 | 15.4 | - | - | - |
| Subtotal exit | 16.2 | 40.1 | 17.6 | - | - | - |
| After - first fortnight | - | - | - | 2.4 | 3.3 | 2.9 |
| After - first month | - | - | - | 1.7 | 1.7 | 2.0 |
| After - in quarter | - | - | - | 12.6 | 8.5 | 13.9 |
| Subtotal entering | - | - | - | 16.7 | 13.4 | 18.8 |
| Total | 100.0 | 100.0 | 100.0 | 100.0 | 100.0 | 100.0 |
Note: a See notes Table 65.
Source: DESE administrative data
Overall sectoral impact
This sectoral analysis primarily highlights the quite dramatic changes in the In Home Care and Family Day Care sectors. Outside of this, the Centre Based Day Care sector shows elevated exits coincident with the introduction of the Child Care Package, although the magnitude is small, around 0.3-0.6 of a percentage point, with a slightly stronger increase in exits in the Outside School Hours Care sector. Looking at entries, there is some evidence of an increase in entries in 2018, relative to 2017 and 2019, in both Centre Based Day Care and Outside School Hours Care, most prominent in the first fortnight of the quarter, suggesting an increase of 1.4-1.9 percentage points in the number of children recorded as attending over the quarter.
Hours of care and the transition
Another potential area of impact from the introduction of the Package measures was on hours of care. This is considered, again in the short term only, in Table 71. Unlike the above table, it aggregates all of the 3 sub-categories of entrants and exits to consider just 3 groups: those continuing; those exiting ('Before only'); and those entering ('After only').
By sector, the data suggests that there has been little substantive change for Centre Based Day Care services, other than new entrants in 2018 having a marginally greater propensity to use slightly longer charged hours.121
The average hours reported by children attending Family Day Care Services suggest that, while there was a transition effect, this was combined with a shift to a new equilibrium, which as discussed in previous chapters appears to be based on services moving from sessional charges to charging by the hour. That is, while the average hours of continuing children dropped markedly between May and August 2018, this seems to be a drop from the levels that were reported for both May and August 2017 to the levels reported in May and August 2019.
| Continuing | Before only | After only | ||||||||
|---|---|---|---|---|---|---|---|---|---|---|
| 2017 | 2018 | 2019 | 2017 | 2018 | 2019 | 2017 | 2018 | 2019 | ||
| Average hours of care charged in month | ||||||||||
| CBDC | May hours | 114 | 115 | 117 | 67 | 68 | 64 | - | - | - |
| August hours | 116 | 118 | 120 | - | - | - | 74 | 76 | 73 | |
| FDC | May hours | 115 | 102 | 94 | 97 | 103 | 70 | - | - | - |
| August hours | 112 | 95 | 96 | - | - | - | 75 | 63 | 62 | |
| OSHC | May hours | 36 | 36 | 37 | 19 | 17 | 17 | - | - | - |
| August hours | 36 | 36 | 36 | - | - | - | 20 | 21 | 19 | |
| IHC | May hours | 108 | 114 | 106 | 76 | 92 | 63 | - | - | - |
| August hours | 109 | 101 | 108 | - | - | - | 76 | 61 | 65 | |
Source: DESE administrative data
In contrast, there is almost no impact on the hours in Outside School Hours Care. While there does not seem to be a wholly consistent pattern with respect to In Home Care, one feature is that the hours of care charged for those who exited in 2018 were very much higher than those of the entrants, a pattern not seen in either of the other years. 122
6.5.2 Impact by child and family characteristics
Seeking to identify the small group who may have been affected in the transition is difficult, in large part because of the problem of identifying the incremental population relative to 'background' entries and exits seen in the other years. Table 72 to Table 76 seek to address this by trying to identify whether the transition patterns seen above have had particular deviations across population subgroups. It considers 2 aggregates; the first is the proportion of children in Q2 of each of the 3 years who continue to be in child care in Q3, as a share of those children in child care in Q2; the second is the proportion of children in Q3 who are new entrants. As discussed, however, with respect to these tables relatively little emerges from this analysis.
The population subgroups considered are those based on geographic location, both using the urban structure and SEIFA, family utilisation of government transfer payments, income and child age.
By location, see Table 72, there is little difference in the patterns of exits in 2018, although all years show a pattern of lower levels of retention in more remote relative to more urbanised locations. There is, however, a strong tendency for higher rates of entry in 2018 in outer regional, remote and very remote locations. One potential factor here is the movement of the former BBF services into mainstream CCS funding. The role of these services with regard to estimating changes in access for Indigenous children is discussed in Section 6.5.3, and the services more generally in Chapter 7.
| Proportion continuing from Q2 a (%) | Proportion entering Q3 b (%) | |||||
|---|---|---|---|---|---|---|
| 2017 | 2018 | 2019 | 2017 | 2018 | 2019 | |
| Capital Cities | 88.1 | 87.0 | 89.1 | 12.0 | 13.4 | 11.5 |
| Urban 100k plus | 89.6 | 88.9 | 89.8 | 12.2 | 12.9 | 11.1 |
| Urban 50k-<100k | 87.0 | 86.5 | 87.7 | 14.1 | 14.8 | 13.1 |
| Urban 20k-<50k | 86.8 | 86.3 | 87.1 | 13.9 | 15.2 | 12.5 |
| Urban 10k-<20k | 86.1 | 84.9 | 86.9 | 15.0 | 16.5 | 13.4 |
| Inner Regional | 87.3 | 85.7 | 87.4 | 14.1 | 15.9 | 13.1 |
| Outer Regional | 85.8 | 85.2 | 86.3 | 15.6 | 18.3 | 14.2 |
| Remote | 86.4 | 84.9 | 84.9 | 17.4 | 26.3 | 16.3 |
| Very Remote | 85.7 | 84.3 | 84.4 | 17.6 | 32.5 | 16.9 |
Notes: a As a proportion of those in Q2. b As a proportion of those in Q3.
Source: DESE administrative data
Some systematic differences by location are seen when this is analysed on the basis of the socio-economic advantage and disadvantage of the location. As seen in Table 73, there is a very distinct pattern across all years for much higher levels of entries and exits in the more disadvantaged locations. In 2018, while the retention is much lower than in previous years, there is no consistent pattern across the spectrum of levels of disadvantage relative to the other 2 series, which would suggest a different experience in the transition for those in locations with either a higher or lower SEIFA ranking. For example, while a comparison with 2019 alone would suggest lower retention in 2018 at the lower end of the SEIFA ranking, this does not hold in comparison to 2017. There is also no consistent pattern with respect to entries in Q3.
| SEIFA decile | Proportion continuing from Q2 a (%) | Proportion entering Q3 b (%) | ||||
|---|---|---|---|---|---|---|
| 2017 | 2018 | 2019 | 2017 | 2018 | 2019 | |
| 1 (Lowest) | 81.9 | 80.6 | 84.3 | 13.9 | 15.7 | 14.3 |
| 2 | 85.1 | 83.4 | 86.2 | 14.1 | 15.8 | 13.7 |
| 3 | 86.7 | 84.9 | 87.4 | 13.5 | 14.7 | 12.9 |
| 4 | 87.4 | 87.0 | 88.4 | 13.3 | 14.9 | 12.8 |
| 5 | 87.5 | 85.8 | 88.4 | 13.1 | 14.7 | 12.7 |
| 6 | 88.8 | 87.6 | 88.9 | 12.7 | 14.0 | 11.9 |
| 7 | 88.9 | 88.1 | 90.0 | 12.2 | 13.3 | 11.2 |
| 8 | 90.0 | 88.8 | 90.2 | 11.7 | 13.2 | 10.9 |
| 9 | 90.6 | 89.9 | 90.6 | 10.8 | 12.3 | 10.2 |
| 10 (Highest) | 91.6 | 90.4 | 90.6 | 10.4 | 12.0 | 9.6 |
Notes: a As a proportion of those in Q2. b As a proportion of those in Q3.
Source: DESE administrative data
Patterns of entry and exit by parental transfer payment receipt are complex, and are not consistent over time. As shown in Table 74, there are also large differences in the patterns for some of the subgroups that tend to overshadow the question of change. For example, couples in receipt of full-rate payments (although a relatively small group) have rates of retention some 15-18 percentage points below those who receive no transfers.
Turning to the inter-year comparisons, all of these groups show elevated rates of entries compared with 2017, and with the exception of couples in receipt of some income support, relative to 2019, suggesting that, to the extent entries into child care increased, they did so relatively uniformly across these groups. There is also a uniform pattern of higher exits, that is lower retention, for all these groups in 2018. While for most of the subgroups this was only a matter of a few percentage points, it was higher for single parents wholly reliant upon income support, and particularly marked for those couples with some income support. For this group, their exit rate in 2018 of 24.1 per cent compares with 20.4 per cent in 2017 and 18.3 per cent in 2019. While this is a shift that needs to be noted, given that children from these families only account for some 3.6 per cent of all children in child care, this is likely to only have a small impact on the population as a whole.
| Proportion continuing from Q2 a (%) | Proportion entering Q3 b (%) | |||||
|---|---|---|---|---|---|---|
| 2017 | 2018 | 2019 | 2017 | 2018 | 2019 | |
| SP full-rate | 81.1 | 78.5 | 82.2 | 16.8 | 18.2 | 17.6 |
| SP part-rate | 88.0 | 87.0 | 89.6 | 12.7 | 13.1 | 11.0 |
| SP FTB only | 86.6 | 86.1 | 88.2 | 10.4 | 11.1 | 8.6 |
| Cpl both full-rate | 73.5 | 72.0 | 75.6 | 12.8 | 14.7 | 16.6 |
| Cpl some IS | 79.6 | 75.9 | 81.7 | 14.2 | 16.0 | 16.3 |
| Cpl FTB only | 84.6 | 83.1 | 87.3 | 15.6 | 17.8 | 16.4 |
| No FTB | 90.6 | 90.0 | 90.6 | 11.2 | 12.6 | 9.9 |
Notes: a As proportion of those in Q2. b As a proportion of those in Q3.
Source: DESE administrative data
Looking at the experience of children by parental income, other than a range of divergent movements among those with reported zero income, and those with missing data, the only anomaly in the 2018 exit transition data is for the very low income group - below $25,000, who have a much higher rate of exits in 2018, with a retention rate of just 73.0 per cent in that year compared with 79.7 per cent in 2017 and 81.0 per cent in 2019, see Table 75. The magnitude, however, of this difference falls when Family Day Care services are excluded, with rates to 82.2 per cent in 2017, 76.8 per cent in 2018 and 82.3 per cent in 2019. This suggests that this group, which represent some 10 per cent of all records, may have had a particular adverse outcome in the transition, although a proportion of this relates to the changes in the Family Day Care sector to which they appear to be particularly exposed. Looking at the pattern of entries, other than at the extremes of the income distribution, there is a generalised incidence of higher than usual entries of around 1.2 percentage points.
| Proportion continuing from Q2 a (%) | Proportion entering Q3 b (%) | |||||
|---|---|---|---|---|---|---|
| 2017 | 2018 | 2019 | 2017 | 2018 | 2019 | |
| Zero | 80.9 | 88.9 | 62.4 | 16.6 | 10.8 | 13.7 |
| $1-<25k | 79.7 | 73.0 | 81.0 | 17.2 | 19.6 | 18.9 |
| $25-<50k | 81.2 | 80.0 | 83.8 | 14.4 | 15.3 | 14.6 |
| $50-<100k | 85.8 | 85.2 | 87.6 | 14.1 | 15.7 | 13.7 |
| $100-<150k | 89.8 | 89.0 | 90.3 | 12.3 | 13.1 | 11.7 |
| $150-<250k | 92.4 | 92.4 | 92.5 | 9.4 | 9.6 | 8.5 |
| $250-<500k | 93.3 | 93.7 | 92.7 | 8.5 | 7.6 | 6.9 |
| $500+k | 91.3 | 89.6 | 89.5 | 9.9 | 6.2 | 7.3 |
| Missing | 90.5 | 78.4 | 72.4 | 12.0 | 41.1 | 25.3 |
Notes: a As a proportion of those in Q2. b As a proportion of those in Q3.
Source: DESE administrative data
Table 76 presents the transition by the age of children. In the populations classified in this manner there are again very marked differences in the underlying patterns. Retention for the youngest age group is relatively low, but then becomes very high for ages 1-3, in particular. After a decline from these high rates, it then remains relatively stable in the first years of school education before again declining as children age. This has echoes in the entry data, with very high entry rates in the under one year age group, with the rate of entry then declining up to the 3 years age group, after which there is high stability in both entries and exits.
While the under one year category shows a very marked fall in retention in 2018, this appears to be impacted by changes in the Family Day Care sector. Excluding Family Day Care produces retention rates for this youngest age group of 64.0 per cent, 62.8 per cent and 68.0 per cent respectively for 2017, 2018 and 2019. With respect to entries, the data suggests that while 2018 entries were higher across all age groups, this was most marked for those aged 8 years and over.
| Child age (years) | Proportion continuing from Q2 a (%) | Proportion entering Q3 b (%) | ||||
|---|---|---|---|---|---|---|
| 2017 | 2018 | 2019 | 2017 | 2018 | 2019 | |
| 0 | 65.1 | 57.5 | 65.6 | 86.5 | 89.0 | 88.7 |
| 1 | 93.0 | 92.0 | 94.4 | 33.8 | 36.4 | 34.0 |
| 2 | 95.0 | 94.5 | 95.9 | 12.8 | 13.8 | 11.8 |
| 3 | 93.5 | 92.7 | 94.4 | 7.3 | 8.5 | 6.8 |
| 4 | 89.5 | 88.8 | 89.8 | 4.4 | 5.5 | 4.2 |
| 5 | 87.0 | 84.9 | 85.7 | 6.6 | 7.6 | 5.8 |
| 6 | 88.8 | 86.6 | 87.9 | 12.6 | 13.6 | 11.7 |
| 7 | 88.3 | 86.1 | 87.9 | 11.9 | 13.1 | 11.0 |
| 8 | 87.7 | 84.8 | 86.7 | 11.3 | 13.2 | 10.7 |
| 9 | 86.2 | 83.3 | 84.9 | 11.1 | 13.4 | 10.3 |
| 10 | 84.3 | 80.7 | 82.6 | 10.9 | 12.9 | 10.3 |
| 11 | 79.7 | 75.1 | 77.8 | 10.2 | 12.6 | 9.8 |
| 12 | 68.9 | 68.9 | 75.6 | 9.3 | 11.4 | 9.1 |
| 13+ | 28.0 | 47.4 | 63.0 | 9.9 | 18.3 | 16.2 |
Notes: a As a proportion of those in Q2. b As a proportion of those in Q3.
Source: DESE administrative data
This analysis has identified some persistent traits in both entries to and exits from child care, including some groups who would appear to have quite high levels of volatility. As to the extent to which the transition may have had a negative impact, the overall effect of this is low. The analysis does suggest that some low income households, and some families such as couples on income support, appear to have left child care at a disproportionate rate prior to the implementation of the Package, with the magnitude being in the order of some 4-5 percentage points. Relative to other years, the overall magnitude of this higher inflow was 1.5-1.8 percentage points. This increase was more marked for older children. Interpretation of this though is complicated by the issue of the extent to which some of this was due to better recording rather than substantive change.
6.5.3 Transition and access by Indigenous Australians
More detailed analysis of the provision of child care to Indigenous Australians is presented in Chapter 7. The focus here is on seeking to identify quantitatively the actual change in Indigenous children's use of child care at the point of transition as the 'headline data' is significantly affected by 2 factors:
- changes in the recording of Indigeneity in the child care data
- the shift, under the Package, of a number of services from being supported by grants through Budget Based Funding to funding based on user charges offset by subsidies through the CCS.
In the 3 months prior to July 2018 there were 34,039 children in child care who were identified as Indigenous or as members of an Indigenous family. In the following 3 months this figure was 43,307. While notionally indicating a 27.2 per cent increase, these figures, as seen in Table 77, comprise a series of elements, including the effects of re-classification,123 and the entry into the data of those attending the former BBF services.124 A consequence of this is that the net number of additional Indigenous children in child care between Q2 and Q3 of 2018 is substantially less than the 9,269 difference in the total numbers recorded. Using the detail of flows shown in the table, the number would be 1,728, that is the turnover, 5,647 new, less the 3,919 ceasing.
However, this number still overstates the extent of change as there are 2 additional elements of change that need to be accounted for. The first is the extent to which, with changes to the BBF services, some Indigenous children, who had attended these services up to transition and under the old funding arrangements where fees were not generally charged, may have shifted to mainstream services. This group cannot be identified within the available data, but rather simply appear as being 'new' entrants. The second is that to calculate growth relative to the number of children previously identified, it is necessary to adjust the number of 'additional' Indigenous children to reflect the previous understating of this group in the population. Applying the ratio of previous to new identification would suggest that the actual increase is around 1,130.
Taking all of this into account suggests that, while there was an increase quarter to quarter in the number of Indigenous children in child care, this was in the range of 3.3-5.1 per cent, rather than the headline 27.2 per cent. This increase is not inconsistent with, and is indeed a little below, the rate of increase for this population between Q2 and Q3 in the previous year of 6.0 per cent. This, in turn, is likely to reflect both the usual pattern of increase over the calendar year seen across the population and growth in the Indigenous population, and suggests relatively little actual change in access occurred with the introduction of the Package. More specific analysis of the impact of the Package on the participation of Aboriginal and Torres Strait Islander children is presented in Chapter 7.
| Indigenous children in child care | |
|---|---|
| Q2 2018 | |
| Continuing to Q3 2018 classified as Indigenous | 26,932 |
| Continuing to Q3 2018 but reclassified as non-Indigenous in Q3 2018 | 3,188 |
| Ceased child care | 3,919 |
| Total Q2 2018 | 34,039 |
| Q3 2018 | |
| Continuing previously identified as Indigenous | 26,932 |
| Continuing - previously classified as non-Indigenous now reclassified as Indigenous | 9,101 |
| New: Attending a former BBF service | 1,626 |
| New: Indigenous in quarter | 5,647 |
| Total Q3 2018 | 43,307 |
Source: DESE administrative data
6.6 Parental experience of access
The DESE/ORIMA survey included a set of questions related to ease of finding appropriate care. These are considered here; however, some caution needs to be exercised in the interpretation of these results, particularly, over time. Two key issues are:
- The retrospective nature of the questions. In many cases a child may have been in their child care service for a considerable period of time and hence the date of the survey is not aligned with their experience of 'ease of finding', which could be some years prior. The survey design does not allow the separate analysis of those who have only recently sought to find care.125
- There may be a selection effect in that those who have had more difficult experiences in finding care may have failed to access it, and hence not be part of the population under study.
The specific questions involved respondents indicating their degree of agreement, or disagreement, with 6 statements:
- It was easy to find good quality child care for my child.
- It was easy to find a child care service in a convenient area.
- It was easy to get the hours of child care needed.
- It was easy to get child care during school holidays (for reference children aged 4 years and over, except November 2018, when it was limited to those aged 5 years and over).
- It was easy to find culturally appropriate care for my child.
- If they have a child with additional needs: It was easy to find a child care service that caters for my child's additional needs.
As with similar questions in the survey, these were specifically focused on the experiences of a 'reference child' and their 'reference care'. In analysis here, the responses to these questions have been recoded to a scale of -2 to +2, where +2 represents strong agreement.
6.6.1 Access over time
Analysis of the time series has been undertaken separately for children aged 5 years and under and those aged 6-13 years. Considering the younger age group, Figure 97, there is little evidence of any consistent pattern of change across the 6 questions over time. Specifically:
- Reported ease of finding quality care fluctuated over the period with no consistent trend and none of the movements, either between surveys, or over time, were statistically significant at the 95 per cent confidence level.
- Parents initially reported an improvement in ease of finding care in a convenient location, with the June 2019 rating being statistically higher than that in June 2018. It, however, then declined in November 2019 to a level not statistically different to that in June 2018.
- There was no significant change, and indeed very little change, in the reported ease of finding care for the hours needed by parents of children in this age group.
- Ease in finding care during school holidays was initially significantly higher than satisfaction with the other elements about which parents were questioned. This then declined over the period with a statistically significantly lower rating in November 2019 than in either June 2018 or June 2019.
- Reported ease of finding culturally appropriate child care was significantly lower in June 2018 than in any of the subsequent surveys. It is unclear what factors related to the more positive rating of this dimension of access and, as discussed in Chapter 2, this element was rated as relatively unimportant by parents.
- While only a subset of parents reported on ease of finding care for children with additional needs, the overall reporting of this dimension of accessibility was low, and, in general, statistically significantly lower, than other dimensions, remaining as such over time.
Figure 97: Parents, 'It was easy to find child care', reference child aged 0-4 years, mean response value, DESE/ORIMA Parent Survey, June 2018-November 2019
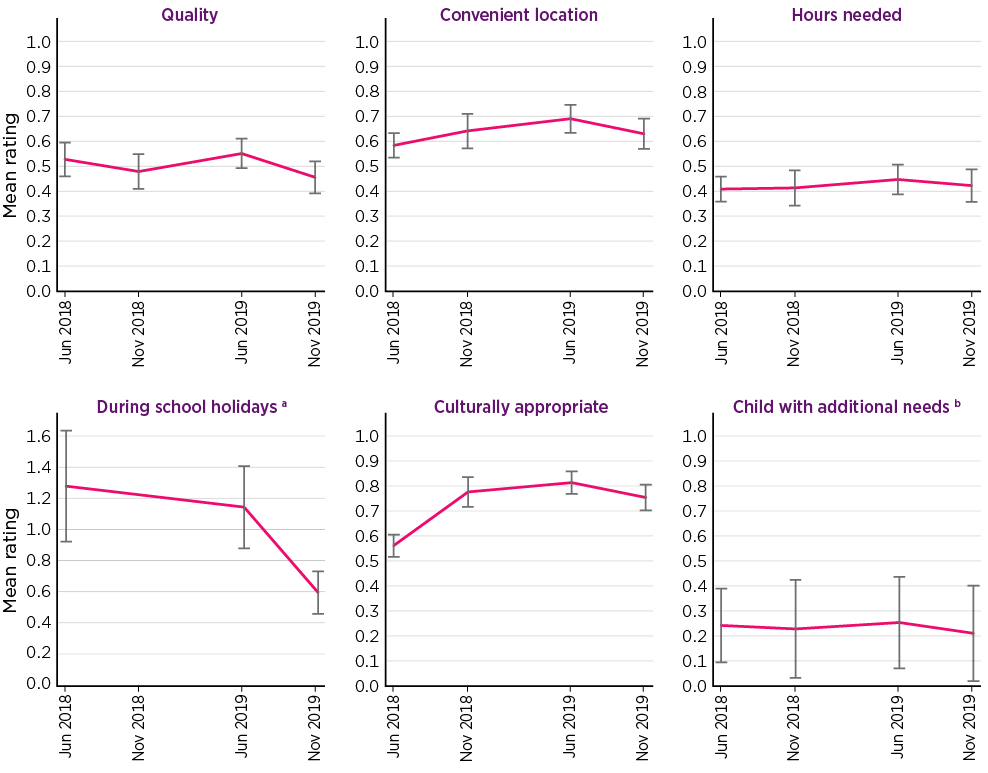
Notes: Relates to reference care of the reference child. Mean rating is average of recoded responses: Strongly disagree: -2; Disagree: -1; Neither agree nor disagree: 0; Agree: +1; Strongly agree: +2. Error bars on the chart show the 95 per cent confidence interval. a Note different scale. Question not asked of 4-year-olds in November 2018. b Question asked of parents with a child with additional needs only.
Source: DESE/ORIMA Parent Survey, June 2018, November 2018, June 2019, and November 2019
Turning to parents with an older reference child, see Figure 98, a number of more distinct patterns of more positive ease are reported. Specifically:
- Parents report a statistically significant greater ease in finding quality child care, and child care in a convenient location, in November 2019 than they did in June 2018, with a relatively consistent upward trend over the period, although none of the individual shifts, or those up to June 2019, were statistically significant.
- While there was also an upward trend in ease of finding hours of care needed, this was not significant over any time period.
- After an initial, but statistically insignificant, increase in reported ease of finding care during school holidays between June 2018 and November 2018, this has remained flat.
- Reported ease of finding culturally appropriate care increased significantly between June 2018 and November 2018 and has increased in subsequent surveys, although none of the latter movements are statistically significant.
- There has been, as with parents of younger children with an additional need, no significant shift in the average level of ease of finding appropriate care for an older child with additional needs, with this aspect of satisfaction remaining well below, and in most cases statistically significantly lower, than ease of access relative to the other dimensions.
Figure 98: Parents, 'It was easy to find child care', reference child aged 5-12 years, mean response value, DESE/ORIMA Parent Survey, June 2018-November 2019
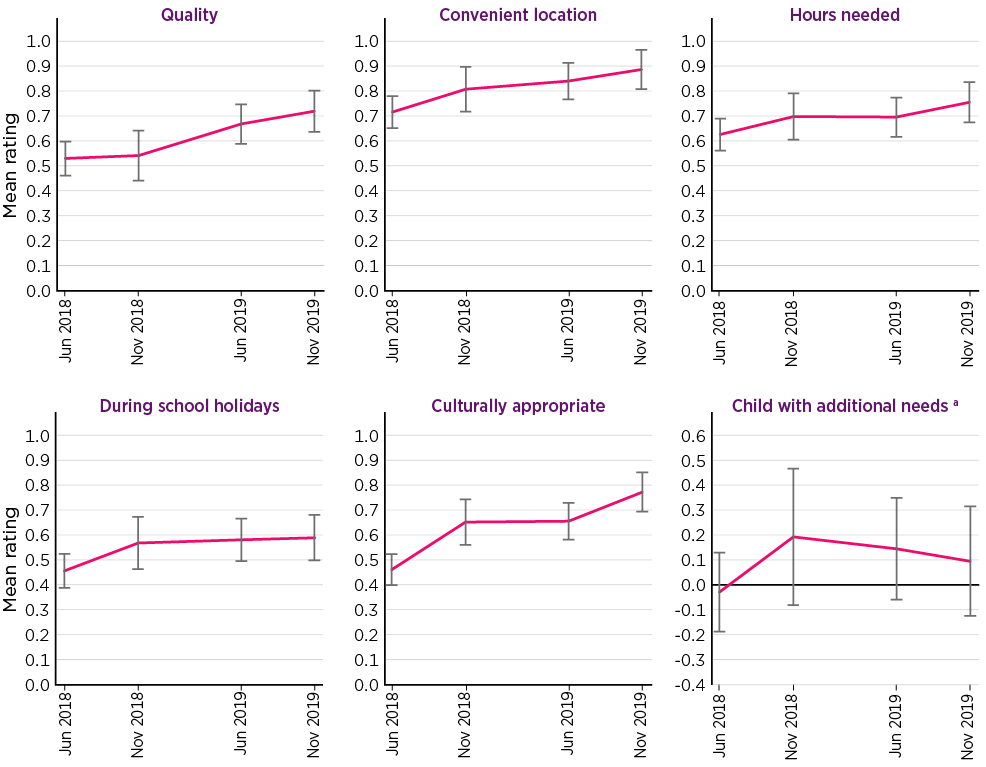
Notes: Relates to reference care of the reference child. Mean rating is average of recoded responses: Strongly disagree: -2; Disagree: -1; Neither agree nor disagree: 0; Agree: +1; Strongly agree: +2. Error bars on the chart show the 95 per cent confidence interval. a Question asked of parents with a child with additional needs only. Note different axis.
Source: DESE/ORIMA Parent Survey, June 2018, November 2018, June 2019, and November 2019
Access by type of service
The mean ratings of parents on these questions, by type of service, in November 2019, are shown in Figure 99. This data shows 3 significant differences in levels of reported ease between the child care sectors considered here. These related to ease in finding quality care, care in a convenient location, and care for the hours needed. In all of these, parents rate access to Outside School Hours Care more positively than Centre Based Day Care, or Family Day Care.
While not significant relative to Centre Based Day Care, the chart does suggest that satisfaction with Family Day Care is consistently lower with respect to all dimensions, other than meeting the needs of children with additional needs relative to these other sectors.
Figure 99: Parents, ease of finding appropriate care, by type of child care, mean response value, DESE/ORIMA Parent Survey, November 2019
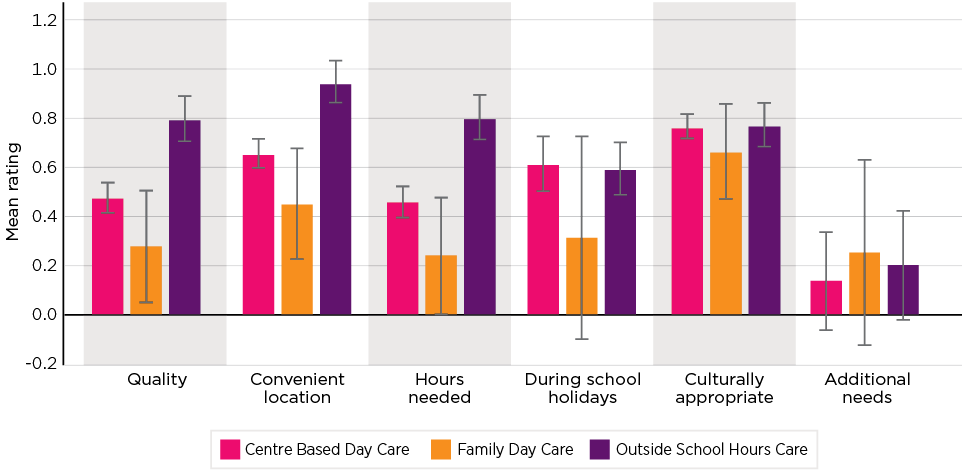
Notes: Relates to reference care of the reference child. Mean rating is average of recoded responses: Strongly disagree: -2; Disagree: -1; Neither agree nor disagree: 0; Agree: +1; Strongly agree: +2. Error bars on the chart show the 95 per cent confidence interval. In Home Care excluded due to small sample size.
Source: DESE/ORIMA Parent Survey, November 2019
Parent characteristics and access
Analysis of parental reporting in November 2019 of ease of access to quality care, in a convenient location, and for the hours needed, on the basis of state, family labour force status, gross family income and whether or not people lived in capital cities or other locations, identified no statistically significant differences, other than those living in Queensland reporting greater ease of accessing care in a convenient location, relative to those in New South Wales.
Summary - Parents' experience of access
Overall, there has been little change in parents' reported perception of the ease of accessing child care for children under the age of 5 years. For those with older children, there has been a reported increase in the ease of obtaining access to quality care, along with some upward, although not statistically robust, trends in some of the other dimensions of access. It is, though, noted that these results do not necessarily reflect a contemporaneous assessment of ease of access but may reflect earlier experiences.
6.6.2 Exclusion and access
The above analysis highlights, on average, the greater difficulty reported by parents in accessing child care for children with additional needs. A related issue is the capacity of parents to then maintain this access. This is considered here in terms of parental reports of having to change services because of the exclusion of their child, and the extent to which services report having denied access to some children. These issues are considered further in Chapter 7 with respect to some of the specific implications for children from communities with vulnerabilities. See also Section 7.3.2 in relation to the role of the Inclusion Support Program in supporting the inclusion of children in child care.
Parental experience of exclusion
The 2019 DESE/ORIMA June survey asked parents 'Have you ever changed your child care service you have been using for your [reference] child because … Your child was asked to leave or excluded from a service'. Across the population, an estimated 9,707 parents (1.4 per cent), see Table 78, reported that a change in service because of such an exclusion had occurred. While the question did not specifically address the question of whether the exclusion was related to the additional needs or some other factor, the results clearly show that exclusion was much more frequent (6.1 per cent) for those parents whose 'reference child' was identified as having additional needs. It was also elevated (4.5 per cent) for those parents where, while the reference child was not identified as having additional needs, another of their children was.126
| Family type by whether reference child or another child had additional needs | Proportion reporting that a child was asked to leave or excluded from a service (%) | Distribution of all families (%) |
|---|---|---|
| Additional needs, reference child | 6.1 | 10.1 |
| Additional needs, other child | 4.5 | 4.1 |
| No child with additional needs | 0.7 | 85.8 |
| All children | 1.4 | 100.0 |
| Families (Count) | 9,707 |
Note: Excludes persons responding Don't know/Not applicable.
Source: DESE/ORIMA Parent Survey, June 2019
Other analysis indicates that:
- The incidence of this form of exclusion is somewhat higher for those families where the child is identified as Aboriginal or Torres Strait Islander (2.9 per cent, relative to 1.4 per cent where the child does not identify).
- The rate was slightly lower (1.3 per cent) for those families that speak a language other than English at home, compared to 1.4 per cent for those that speak English.
- While the current 'reference care' the child is currently in may not necessarily relate to the form they were in when they were asked to leave or were excluded, the data indicates the rate was most frequently reported with respect to children in Family Day Care (2.1 per cent), followed by Outside School Hours Care (1.5 per cent). In Centre Based Day Care it was 1.3 per cent, close to the overall average.
- There does not appear to be a strong relationship between the incidence of exclusion and age, although boys were more likely to be excluded (1.8 per cent) than girls (1.0 per cent).
Another factor associated with the rate of exclusion is the financial wellbeing of the family. As illustrated in Table 79, the rate of exclusionary activity reported increases with declining self-reported financial wellbeing. Again, as the question did not ask about the basis of exclusion, this leaves open the possibility that some exclusion was related to capacity to pay. On the other hand, as shown in the final column of the table, the incidence of having a reference or other child with additional needs is higher in more financially constrained families. This leads also to the possibility that this financial constraint may be associated with, for example, a lower ability to engage in employment because of caring demands or costs associated with the needs of the child.
| Self-reported financial wellbeing of the family | Proportion reporting a child was asked to leave or excluded from a service (%) | Proportion with child with additional needs a (%) | Distribution of all families (%) |
|---|---|---|---|
| Wealthy | 0.0 | 8.2 | 0.4 |
| Very comfortable | 0.0 | 9.6 | 4.0 |
| Reasonably comfortable | 0.7 | 10.8 | 35.2 |
| Just getting by | 1.5 | 17.8 | 44.0 |
| Struggling to make ends meet | 2.1 | 24.2 | 13.7 |
| Under considerable financial strain | 7.6 | 28.4 | 2.7 |
| Total | 1.4 | 15.7 | 100.0 |
Notes: a Either reference child or other child. Excludes persons responding Don't know/Not applicable.
Source: DESE/ORIMA Parent Survey, June 2019
Other questions in the DESE/ORIMA survey provide additional insight into the extent to which access may be limited. The survey indicates that 20.0 per cent of parents with a reference child with additional needs (and 16.2 per cent of those with a child, other than the reference child, with additional needs) reported that they had to change services because the service 'could not meet the additional needs of your child associated with a disability or medical condition'.
Parents with a reference child with additional needs were also more likely to be very dissatisfied or dissatisfied with the quality of care at the service (10.7 per cent) than either those with another child with additional needs (10.1 per cent) and those with children with no additional needs (3.7 per cent). There was though somewhat less difference in terms of their reporting of being able to find good quality care. Parents with a reference child with additional needs, and those with a non-reference child with additional needs were only a little more likely (23.7 per cent and 27.0 per cent) to disagree, or strongly disagree, with a statement that it was easy to find 'good quality care for their child', than those without children with additional needs (22.6 per cent).
The adverse experiences of parents with children with additional needs in accessing child care was identified in responses to the DESE/ORIMA June 2018 Parent Survey. Respondents' reports included: 'seven child care services turned us down saying he was too much work'; 'I was turned down by a centre due to special needs'; and 'a lot of service providers weren't willing to take on children with additional needs'. Another parent in this survey reported they had encountered a 'quota system in place that limits [the] number of places available for children with additional needs per session'.
Inclusion in child care is addressed through the Inclusion Support Program, with a key role in this program being the state-based Inclusion Agencies. Each Agency has a network of Inclusion Professionals operating out of hubs, usually responsible for services in a set geographic zone, who provide advice and support to services on effective inclusive practice so as to build their capacity and capability to provide and embed inclusive practice and address barriers to inclusion experienced by children with additional needs. These Inclusion Professionals have contact with virtually all services and intensive engagement with many, with services tending to rate the support by Inclusion Professionals relatively highly. A broader perspective on the extent of exclusion in child care can therefore be gained from the observations of these Inclusion Professionals.127 Reporting in the ISP case study conducted in 2019, one summarised their experience as:
There's still an issue with discrimination just overall, and so we've had quite a few parents who have either experienced discrimination, or are in need of some kind of advocacy support. And it's often hard to work out where to send them and you know … services don't really understand their legal obligations and what discrimination looks like.
[Inclusion Professional, 2019]
This type of observation also was frequently made in the 2020 Inclusion Professionals Survey that was undertaken as part of the Inclusion Support Program component of the Child Care Package evaluation. Responses included:
There are many occasions where they say something like 'he needs specialist care'; 'they should not be here in our service'; 'the parents won't accept their child's issues and are the problem'; 'we can't cater for their needs here'; 'it's not fair on other children'.
[Inclusion Professional, Tasmania]
There are some very inclusive services however there are also a lot of services who exclude children outright or are gate keepers and validate reasons why they can't include children.
[Inclusion Professional, NSW]
I've worked in this support role since 2006 … there are a relatively small number of services that do inclusion really well …. Unfortunately, there are still some services that outright refuse to take children with additional needs, or set them up to fail at fitting in so their family withdraws them. These services get away with it because it is currently up to the family to seek redress/submit a formal complaint and be willing to see it through. Many families in this situation have experienced rejection of their child so often, that they just keep looking until they find a place for them.
[Inclusion Professional, NSW]
Quantifying the actual extent of these types of exclusionary and discriminatory practices is difficult. However, in this survey 85.4 per cent of the Inclusion Professionals surveyed agreed with the proposition that 'Some services avoid accepting children with additional needs', with just 3.4 per cent disagreeing. These exclusionary practices warrant further investigation to better understand the extent of them, as well as their cause and impact.
Services declining enrolments
Data on services' perspective on this subject was collected in the second wave of the SELCS in mid-2019. This asked services to respond to the question: 'In the last year, has this service had to decline the enrolment of a child because it was unable to accommodate their needs?' Overall, see Table 80, 11.7 per cent of services responded that they had. This rose to 29.5 per cent among Family Day Care services and 55.9 per cent of In Home Care services.
Open text responses from SELCS Wave 3 allowed services to explain their experiences of declining an enrolment. Often these comments referred to already having additional needs children attending the service, and the additional child would either put too much strain on the educators or had needs that were incompatible with those of children already in attendance.
The high level of support required and the service already was caring for a large number of children with additional support needs. The staff felt they were at the limit of their capability to care for all children appropriately.
[OSHC service, November-December 2020]
Where specific needs were mentioned, they related either to violent or aggressive behaviours that were a danger to staff and other children, or severe medical issues or allergies that staff did not have the skills or capacity to adequately meet. Several services mention referring to other services or supports when they can't accommodate a child, particularly if they declined due to being at capacity or the child having a higher level of medical needs.
It was an autistic child, but this child was in need of support that we couldn't provide so we suggested somewhere else.
[CBDC service, November-December 2020]
| Type | Yes | No | Don't know | Total |
|---|---|---|---|---|
| Distribution (%) | ||||
| CBDC | 10.4 | 88.0 | 1.6 | 100.0 |
| FDC | 29.5 | 68.3 | 2.2 | 100.0 |
| OSHC | 11.7 | 84.9 | 3.4 | 100.0 |
| IHC | 55.9 | 42.0 | 2.1 | 100.0 |
| Total | 11.7 | 86.0 | 2.3 | 100.0 |
Source: AIFS Survey of Early Learning and Care Services, Wave 2, June/July 2019
A separate question in the survey asked whether 'there are some children that you find it difficult to accommodate because of their behaviour, health or other circumstances'. Some 70 per cent of services that reported declining an enrolment gave examples of the types of children where difficulties may arise. Among Centre Based Day Care services, reasons included the additional burden of children with high care needs or, in some cases, while the service has been able to include some children with such needs, they considered that taking on an additional child was not possible. In the Family Day Care sector issues were frequently expressed in terms of the inability of individual educators to accommodate specific needs such as wheelchair access or lacking the skills to care for children with high needs.
Further analysis indicates:
- The rate of services declining the enrolment of a child was higher in NSW (15.6 per cent), the Northern Territory (15.9 per cent) and South Australia (13.7 per cent) than in other states.
- The rate was highest in the small number of services in very remote locations but, more markedly, was around 12 per cent in both 'Major Cities' and 'Inner Regional' locations, in contrast to under 8 per cent in 'Outer Regional' and 'Remote' locations.
- There was an almost monotonic relationship between the self-reported financial viability of the service and the incidence of declining enrolments. The rate of reported declining of an enrolment because of an inability to accommodate a child's needs rose from 9.7 per cent for those that strongly agree they are financially viable to 32.2 per cent for those that strongly disagree.
Access and exclusion
There is clear evidence that for some groups access to child care is more difficult than it is for others, with one factor being where children have additional needs. This is seen both in the experience of parents and in services' responses.
6.6.3 Barriers to access for those not using child care
A further insight into limitations on access can be gained from the reasons given by families with children who are not using paid child care as to why they are not using this form of care. Overwhelmingly, the strongest motivation expressed was a preference for them or their partner to provide care to their children. On a simple 3-point scale of agreement, neither agreement nor disagreement, and disagreement, of those for whom the question was applicable, 81.0 per cent voiced agreement, and just 5.7 per cent disagreement, with this proposition. While this motivation was at times associated with more direct barriers, the survey does not allow for the relative priority of these reasons to be identified.
Of the other questions asked of this group, again recognising that multiple reasons could be given, the factor with the highest level of agreement by respondents was the cost of child care, see Figure 100. This was most frequently cited by single parents with a child under the age of 5, but for all groups was the most frequently given reason, with this dominance being statistically significant across all groups.
Turning to the other questions, this same group of single parents were the only population group of those identified in the table, who indicated, using a 95 per cent confidence interval, that finding quality care was a difficulty. Single parents with older children reported a statistically significant difficulty in finding the hours they need. Interestingly, the responses to the question concerning finding culturally appropriate care were answered by all groups in terms of this not being a difficulty.
More detailed analysis found no statistically significant difference between capital cities and other locations with regard to finding quality care and care in a convenient location, while the respondents in the Northern Territory reported, at the 95th confidence level, the quality of care as being a greater barrier than those in New South Wales, Victoria and Queensland, and those in Tasmania as being greater than these 3 locations as well as South Australia. With respect to care in a suitable location, the only significant differences were that those parents not using child care in Queensland and Western Australia reported finding care in a suitable location was a significantly higher barrier than those in New South Wales.
Figure 100: Persons who had not used paid child care since 2 July 2018, reasons not using paid child, DESE/ORIMA Parent Survey, June 2019
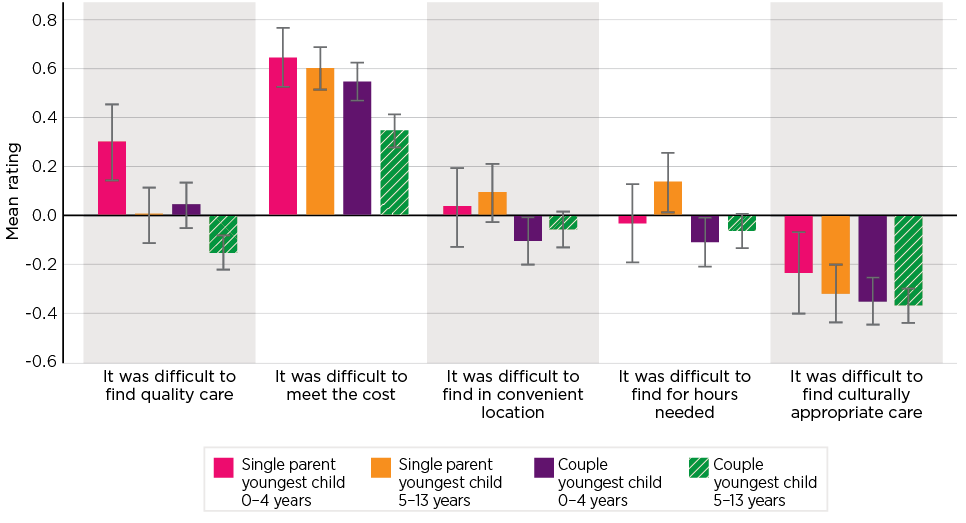
Notes: These questions, unlike similar questions in the survey were asked on a 3-point scale of Disagreement/Neither agree nor disagree/Agree. These were weighted 1/0/+1 for the derivation of the above scores. SP = Single Parent; Cpl = Couple. 0-4 = Youngest child aged under 5 years; 5-13 = Youngest child aged 5-13 years. Error bars on the chart show the 95 per cent confidence interval.
Source: DESE/ORIMA Parent Survey, June 2019
6.7 Access and allowed hours
One of the more significant changes introduced in the Package was that of a graduation of allowed hours; that is, the maximum number of hours of care that a parent could use and obtain a subsidy for, linked to a more rigorous activity test. While an activity test had previously been in place under the former CCB, this only had 2 levels, a universal 24 hours of care per week - 48 hours per fortnight, and up to 50 hours per week - 100 hours per fortnight, for those with more than 24 hours of activity per week, with only limited review of claimed activity. The new activity test, as described in Chapter 1 and further detailed in Chapter 8, introduced a tiered approach, with universal access of 24 hours per fortnight (12 hours per week) for low income households who did not meet the activity test, and then tiers of 26, 72 and 100 hours per fortnight above this.
The activity test was complemented by a range of exemptions. In addition to the 24 hours per fortnight noted above, these include, for those families who do not meet the activity test sufficiently, 36 hours per fortnight for children to attend preschool where this is delivered through a Centre Based Day Care service, and up to 100 hours per fortnight for those who receive Additional Child Care subsidy. Other exemptions to the activity test cover situations in which individuals may not be able to meet the activity test requirements, as described in Chapter 1.128
This section focuses on the question of the extent to which access may be constrained by the operation of the activity test restriction on allowed hours.
In addressing this, it needs to be noted that allowed hours in themselves do not necessarily constitute access. The number of allowed hours works together with the subsidy percentage to determine the actual amount of subsidy received by parents, and therefore the actual amount parents pay for child care. So even among those being subsidised for all the hours of care they use, the higher income families, for example, will still have out-of-pocket costs reflecting the lower rate of subsidy the Income Test determines. This, in itself, may impact access (or use) if costs are seen by parents to be excessive, or explain the incidence of the use of hours of care in excess of the allowed hours. In this latter case, where a parent only has a very low subsidy rate, the effective cost of care above the allowed hours may not be much different to the rate for the allowed hours.
6.7.1 Parents' perspective on adequacy of hours
Most parents, Figure 101, consider that their allowed hours of care are adequate, although over a quarter disagree. This group comprises 10.1 per cent who strongly disagree and 16.5 per cent who disagree.
Figure 101: Parents using child care, agreement with statement that allowed hours are adequate, DESE/ORIMA Parent Survey, November 2019
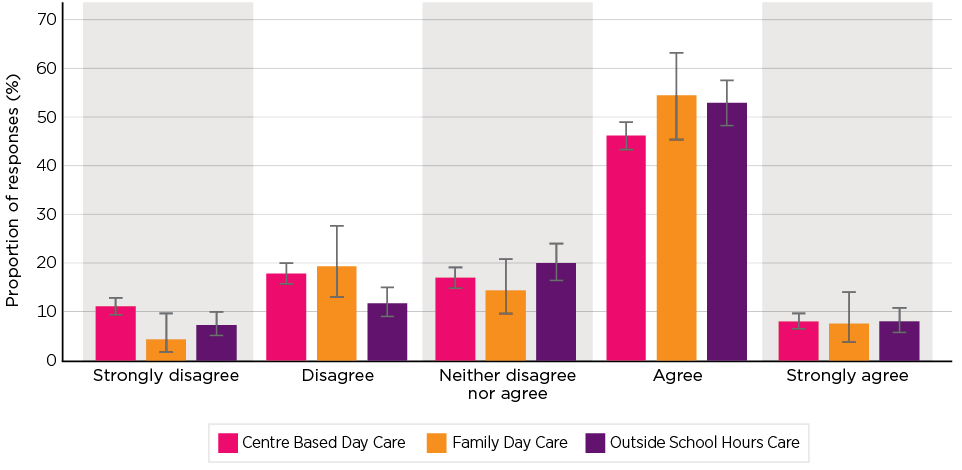
Notes: Child care user defined as a parent who has a reference child in an identified formal child care reference care. Error bars on the chart show the 95 per cent confidence interval.
Source: DESE/ORIMA Parent Survey
The strongest levels of disagreement with the statement on the adequacy of allowed hours came from couples with one member undertaking 'full-time' activity (31.4 per cent) and couples where both members reported this level of activity (31.3 per cent). The mean scores by family activity and gross family income are shown in Figure 102. The only statistically significant difference between families by activity were between couples where both had full-time activity, who also had the lowest rating of any of the groups, and single parents who were engaged on a part-time basis and who were the most positive about the adequacy of hours. The distribution by gross family income shows a distinct pattern of lower satisfaction by those with higher income.
Figure 102: Parents using child care, mean level of agreement with statement that allowed hours are adequate, by activity level and gross income, DESE/ORIMA Parent Survey, November 2019
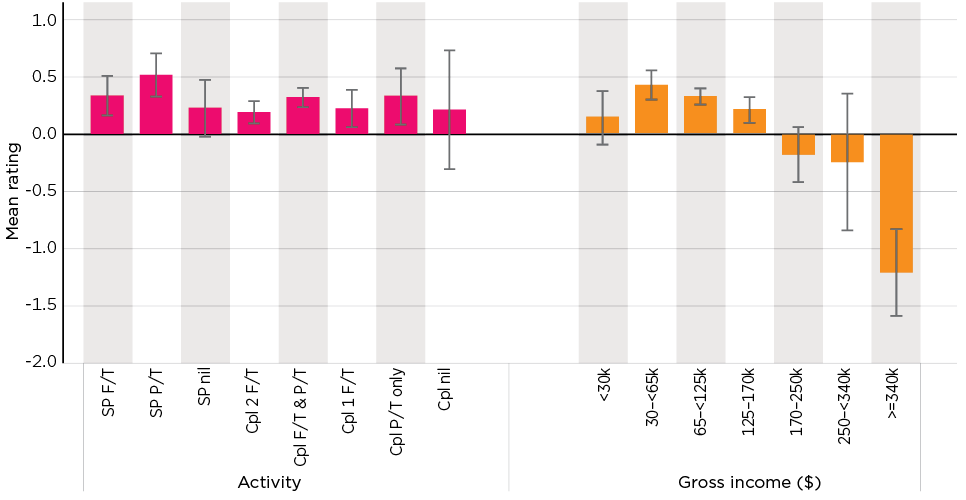
Notes: Mean rating is average of recoded responses: Strongly disagree: -2; Disagree: -1; Neither agree nor disagree: 0; Agree: +1; Strongly agree: +2. Error bars on the chart show the 95 per cent confidence interval.
Source: DESE/ORIMA Parent Survey, November 2019
6.7.2 Activity test and usage
The operation of the activity test and the maximum number of hours of subsidy that families are entitled to has been described in Chapter 1. This section initially considers the distribution of these entitlements and then the extent to which families utilise additional hours of unsubsidised care. The implications of this for affordability has been discussed in Chapter 4.
Entitled hours of subsidy
In Q4 2019 the majority (66.3 per cent) of parents with approved hours of subsidy are entitled to 100 hours care per fortnight, followed by 26.9 per cent entitled to 72 hours, 4.1 per cent to 36 hours, and 1.9 per cent to 24 hours, with 0.7 per cent being recorded as having a zero entitlement.
Table 81 shows the distribution of maximum hours entitlements across a range of population classifications. Key features are:
- Couple parents are entitled to fewer hours of care than single parents. This is associated with the large group of couples with activity levels consistent with one full-time and one part-time worker where only 52.0 per cent are entitled to 100 hours, and 47.7 per cent to 72 hours of subsidy. While these proportions are not dissimilar to those of single parents reporting part-time activity (54.9 per cent and 44.7 per cent respectively), the proportion of single parents who have activity equivalent to full-time work is much higher.
- The levels of entitled hours is higher for those parents with an older youngest child, although those with a very young child - aged under 2 years - have a slightly higher entitlement than those with one aged 2-4 years.
- Indigenous families, while having a similar proportion with an entitlement to 100 hours of subsidy, have overall a lower entitlement due to the higher proportions entitled to 24 hours only, 5.3 per cent, and 36 hours, 7.2 per cent, relative to non-Indigenous families, 1.8 per cent and 4.0 per cent.
| Hours of Child Care Subsidy per fortnight entitled to: | Families | ||||||
|---|---|---|---|---|---|---|---|
| 0 | 24 | 36 | 72 | 100 | Total | ||
| Distribution (%) | (count) | ||||||
| Family type | |||||||
| Single parent | 0.1 | 4.3 | 5.5 | 20.1 | 70.0 | 100.0 | 193,135 |
| Couple parent | 0.8 | 1.3 | 3.8 | 28.8 | 65.4 | 100.0 | 720,102 |
| Age of youngest child attending child care | |||||||
| 0-1 | 0.4 | 1.7 | 3.3 | 29.8 | 64.8 | 100.0 | 157,615 |
| 2-4 | 0.6 | 2.5 | 5.1 | 28.8 | 63.0 | 100.0 | 461,197 |
| 5-6 | 0.7 | 1.1 | 4.1 | 24.0 | 70.1 | 100.0 | 137,983 |
| 7+ | 1.2 | 1.1 | 2.2 | 21.2 | 74.3 | 100.0 | 156,442 |
| Whether family is Aboriginal and or Torres Strait Islander | |||||||
| Indigenous | 0.5 | 5.3 | 7.2 | 21.9 | 65.2 | 100.0 | 31,382 |
| Non-Indigenous | 0.7 | 1.8 | 4.0 | 27.1 | 66.4 | 100.0 | 881,855 |
| Whether parents speak language other than English at home | |||||||
| Yes | 0.6 | 7.8 | 8.2 | 27.7 | 55.6 | 100.0 | 32,377 |
| No | 0.7 | 1.7 | 4.0 | 26.9 | 66.7 | 100.0 | 880,860 |
| Family income | |||||||
| Missing/Nil | 0.5 | 6.7 | 8.8 | 23.9 | 60.1 | 100.0 | 7,214 |
| <$50k | 0.0 | 8.3 | 9.7 | 26.8 | 55.2 | 100.0 | 145,915 |
| $50-<100k | 0.7 | 2.3 | 5.6 | 27.1 | 64.4 | 100.0 | 197,689 |
| $100-<150k | 0.7 | 0.1 | 2.8 | 30.2 | 66.2 | 100.0 | 219,685 |
| $150-<200k | 0.7 | 0.1 | 1.7 | 27.1 | 70.4 | 100.0 | 176,763 |
| $200k and over | 1.2 | 0.1 | 1.7 | 22.5 | 74.6 | 100.0 | 165,971 |
| Family activity | |||||||
| SP low or missing | 0.4 | 25.5 | 32.4 | 9.7 | 32.0 | 100.0 | 31,934 |
| SP P/T | 0.0 | 0.2 | 0.2 | 44.7 | 54.9 | 100.0 | 79,314 |
| SP F/T | 0.0 | 0.1 | 0.1 | 0.4 | 99.4 | 100.0 | 81,887 |
| Cpl low or missing | 13.8 | 35.4 | 25.0 | 3.2 | 22.5 | 100.0 | 7,928 |
| Cpl some P/T | 1.4 | 3.8 | 8.3 | 58.2 | 28.3 | 100.0 | 62,827 |
| Cpl 1 low/miss & 1 F/T | 8.0 | 9.6 | 47.8 | 13.0 | 21.6 | 100.0 | 40,582 |
| Cpl 1 P/T & 1 F/T | 0.1 | 0.0 | 0.1 | 47.7 | 52.0 | 100.0 | 343,889 |
| Cpl 2 F/T | 0.1 | 0.0 | 0.1 | 0.3 | 99.5 | 100.0 | 264,876 |
| Service type | |||||||
| CBDC | 0.5 | 2.2 | 4.7 | 28.4 | 64.2 | 100.0 | 621,863 |
| FDC | 0.5 | 3.1 | 5.5 | 30.1 | 60.8 | 100.0 | 64,200 |
| OSHC | 1.1 | 0.9 | 2.3 | 22.1 | 73.6 | 100.0 | 226,311 |
| IHC | 0.5 | 0.5 | 0.6 | 12.5 | 86.0 | 100.0 | 863 |
| Whether attend a former BBF service | |||||||
| Not | 0.7 | 1.9 | 4.1 | 26.9 | 66.4 | 100.0 | 910,062 |
| Attend former BBF | 1.0 | 8.6 | 10.2 | 27.2 | 53.0 | 100.0 | 3,175 |
| State | |||||||
| New South Wales | 0.7 | 2.0 | 4.3 | 26.9 | 66.1 | 100.0 | 300,324 |
| Victoria | 0.7 | 1.9 | 3.8 | 28.8 | 64.7 | 100.0 | 225,650 |
| Queensland | 0.5 | 2.0 | 4.4 | 23.0 | 70.1 | 100.0 | 205,439 |
| South Australia | 0.7 | 1.9 | 3.8 | 30.5 | 63.1 | 100.0 | 59,434 |
| Western Australia | 0.8 | 1.7 | 4.7 | 30.2 | 62.6 | 100.0 | 77,174 |
| Tasmania | 0.6 | 2.6 | 4.3 | 34.9 | 57.6 | 100.0 | 15,985 |
| Northern Territory | 0.7 | 1.2 | 2.7 | 15.3 | 80.1 | 100.0 | 7,496 |
| Australian Captial Territory | 0.7 | 0.5 | 1.7 | 21.8 | 75.3 | 100.0 | 21,735 |
| SEIFA decile | |||||||
| Least advantaged | 0.4 | 4.7 | 6.4 | 25.1 | 63.3 | 100.0 | 71,485 |
| 2 | 0.5 | 3.8 | 5.9 | 26.5 | 63.4 | 100.0 | 60,459 |
| 3 | 0.5 | 3.0 | 5.2 | 27.7 | 63.7 | 100.0 | 76,020 |
| 4 | 0.6 | 2.4 | 5.0 | 28.6 | 63.5 | 100.0 | 78,372 |
| 5 | 0.5 | 2.1 | 4.3 | 27.1 | 66.0 | 100.0 | 88,165 |
| 6 | 0.6 | 1.6 | 4.1 | 26.9 | 66.7 | 100.0 | 99,539 |
| 7 | 0.6 | 1.4 | 3.7 | 27.3 | 67.0 | 100.0 | 112,366 |
| 8 | 0.7 | 1.0 | 3.2 | 27.2 | 67.8 | 100.0 | 101,794 |
| 9 | 0.8 | 0.9 | 3.0 | 27.1 | 68.2 | 100.0 | 117,162 |
| Most advantaged | 1.2 | 0.7 | 2.8 | 25.6 | 69.8 | 100.0 | 104,845 |
| Urban and regional location | |||||||
| Capital Cities | 0.7 | 1.7 | 3.9 | 25.7 | 67.9 | 100.0 | 633,115 |
| Urban 100k plus | 0.5 | 1.8 | 4.2 | 28.4 | 65.1 | 100.0 | 122,273 |
| Urban 50k-<100k | 0.5 | 2.6 | 4.4 | 29.0 | 63.4 | 100.0 | 39,146 |
| Urban 20k-<50k | 0.5 | 2.8 | 5.0 | 30.5 | 61.2 | 100.0 | 41,558 |
| Urban 10k-<20k | 0.6 | 3.0 | 5.5 | 30.9 | 60.1 | 100.0 | 19,335 |
| Inner Regional | 0.6 | 2.9 | 5.5 | 32.1 | 58.8 | 100.0 | 32,900 |
| Outer Regional | 0.8 | 3.2 | 6.4 | 31.5 | 58.0 | 100.0 | 20,191 |
| Remote | 0.6 | 2.3 | 5.0 | 30.7 | 61.4 | 100.0 | 2,205 |
| Very Remote | 1.0 | 4.1 | 4.7 | 22.3 | 67.9 | 100.0 | 2,514 |
| Total | 0.7 | 1.9 | 4.1 | 26.9 | 66.3 | 100.0 | 913,237 |
Notes: Table based on maximum entitlement of the customer in the quarter. Omits 304 records where hours were not at the standard thresholds. Excludes records with missing entitled hours and missing hours of care attended. Service type based on service with maximum attended hours at time of maximum entitlement.
Source: DESE administrative data
- This is even more marked among families recorded as speaking a language other than English at home, a group for which only 55.6 per cent have an entitlement to 100 hours.
- By gross family income there is a marked gradient in the proportion entitled to 100 hours - from 55.2 per cent for those with incomes under $50,000 per annum, rising monotonically to 74.6 per cent for those with incomes over $200,000. Those families with incomes under $50,000 also have a disproportionately high proportion entitled to 24 hours 8.3 per cent, and 36 hours 9.7 per cent.
- The lowest entitlement to hours of subsidy were recorded by parents using Family Day Care, followed by those using Centre Based Day Care and Outside School Hours Care; however, 86.0 per cent of those using In Home Care were entitled to 100 hours of subsidy. The small number of families whose children are attending a service that was previously funded under Budget Based Funding generally had much lower levels of entitlement, with just 53.0 per cent being entitled to 100 hours, 8.6 per cent to 24 hours, and 10.2 per cent to 36 hours.
- Families in the Northern Territory, the Australian Capital Territory and Queensland had much higher rates of entitlement to 100 hours of care, of 80.1 per cent, 75.3 per cent and 70.1 per cent, respectively, than those in other states, and in Tasmania, in particular, where just 57.6 per cent were entitled to this level of support. As with income, there was a strong gradient across locations based on their socio-economic status, with 63.3 per cent of those in the least advantaged areas having an entitlement to 100 hours, along with 4.7 per cent with an entitlement to 24 hours and 6.4-36 hours, in contrast to the most highly ranked locations, which recorded 69.8 per cent, 0.7 per cent and 2.8 per cent respectively.
- By the urban regional classification there was less dispersion but, nevertheless, the rate of entitlement to 100 hours varied from 67.9 per cent in both the capital cities and in very remote locations to 58.8 per cent and 58.0 per cent, respectively, in inner and outer non-urban regional locations. While, as noted, very remote locations had the equal highest proportion entitled to 100 hours care, they also had the highest proportion of any location of those entitled to just 24 hours, 4.1 per cent.
Allowed hours and hours of child care used
The distribution of children, by the proportion of their allowed hours that they have used (in terms of hours charged for) is shown for the full child care population in Figure 103, and for those in Centre Based Day Care services only in Figure 104. This data is for the first fortnight of October 2019, although similar results are present in other time periods. These charts clearly show that for most children their allowed hours are sufficient to cover the hours of child care for which they are charged. Indeed, for a substantial number, less than 50 per cent of their allowed hours are used. This is seen, in particular, for those eligible for 100 hours a fortnight, a category into which 66.6 per cent of families fall, where across all care types 46.1 per cent use less than half their allowed hours, although this proportion drops to 32.2 per cent for those in Centre Based Day Care.
The group most consistently exceeding their allowed hours are those with 24 allowed hours. Across all care types just 11.9 per cent only use half their allowed hours, with 39.6 per cent using 90-100 per cent of their allowed hours and 31.9 per cent more than their allowed hours. This latter includes 21.0 per cent who use more than 150 per cent of their allowed hours. The group, however, with this 24 hour limit is small, accounting for a little less than 2.0 per cent of families using child care. There was also a relatively high level of high excess use by the 4.2 per cent of families who were eligible for a subsidy for 36 hours of care, where 9.5 per cent used more than 150 per cent of their allowable hours.
Figure 103: Children in child care, hours charged as a proportion of allowed hours, by allowed hours category, fortnight ending 13 October 2019
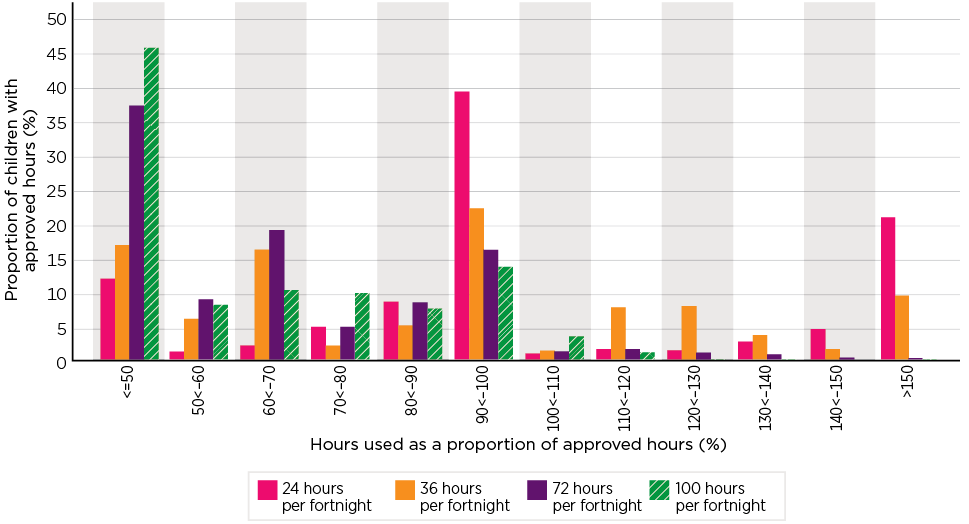
Note: Excludes children with zero approved hours, and a small number of records where allowed hours were other than at the main steps of the activity test.
Source: DESE administrative data
Figure 104: Children in Centre Based Day Care, hours charged as a proportion of allowed hours, by allowed hours category, fortnight ending 13 October 2019
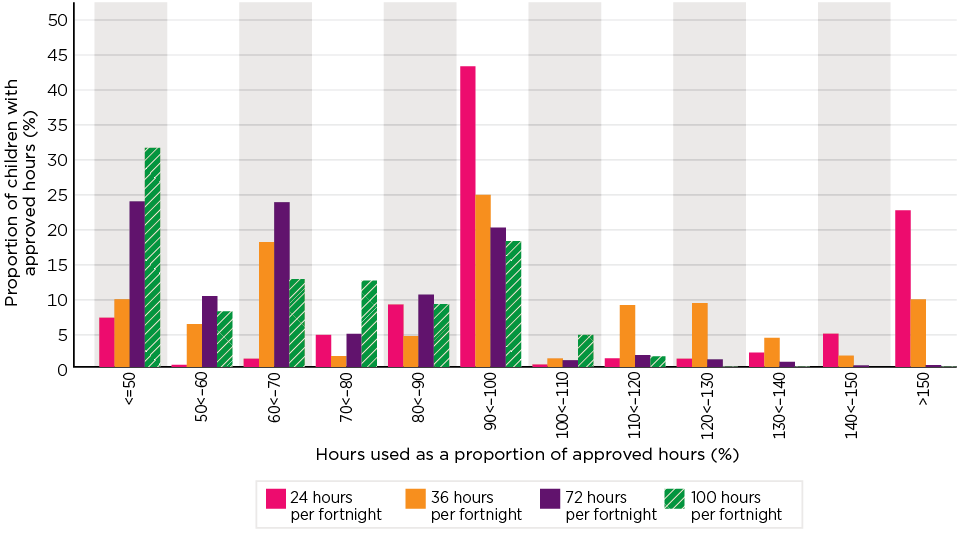
Note: Excludes children with zero approved hours, and a small number of records where allowed hours were other than at the main steps of the activity test.
Source: DESE administrative data
A more detailed analysis is provided in Table 82, which reports on the extent to which families exceeded their allowable hours in the first 10 weeks of Q4 2019. The table shows the proportion of child fortnights (i.e. those fortnights in which a child used care, and including all children who use care) in which the family exceeded their allowable hours, along with information on the degree to which they exceeded. Data is presented by the ranges of allowable hours. It is, though, emphasised that the population of these subgroups varies considerably. As noted above, those families with only 24 hours of approved care represent only a very small proportion of families, 2.0 per cent in the period under consideration. A larger, but still quite small 4.2 per cent of families identified as being eligible to receive up to 36 hours of subsidised care, and 27.2 per cent 72 hours of care. Most, 66.6 per cent of families, were eligible for subsidised care of up to 100 hours per fortnight.
Overall, the analysis suggests that 9.5 per cent of families exceeded their allowed hours in at least one fortnight of the 10 weeks considered. Half of these exceeded the hours for which they could gain a subsidy in more than half of these fortnights.
The incidence and extent of having such excess hours varies considerably by the range of hours parents were eligible to obtain a subsidy for. For those with either 24 or 36 hours, around one in 3 families exceeded their allowed subsidy hours, mainly on a regular basis. The extent to which many of these exceed their subsidised hours is large. The median family, which is eligible for a subsidy for 24 hours per fortnight, exceeded their subsidised hours by 13.4 hours in the fortnight - with excess hours being around a quarter of the time that such families spend in child care.
Among the 2 larger groups, it is estimated that 8.6 per cent of those approved for 72 hours of care exceed this level, as do 7.7 per cent of those with 100 hours. The extent to which they exceed their approved hours, while somewhat smaller, still accounts, at the median, for some 5.6 per cent of all hours in child care for the 72 hour group, and 4.8 per cent for those with 100 hours. In both cases, the higher average figure relative to the median indicates a skewed result, with some having a much higher proportion.
| Approved hours | No excess | Exceed approved a | Total | Hours per fortnight excess b | Excess hours as proportion of time in child care b | ||||
|---|---|---|---|---|---|---|---|---|---|
| <50% of time | 50+% of time | Subtotal exceed | Average | Median | Average | Median | |||
| Distribution (%) | Hours per fortnight | (%) | |||||||
| 24 | 69.0 | 9.8 | 21.2 | 31.0 | 100.0 | 17.7 | 13.4 | 28.2 | 27.3 |
| 36 | 66.9 | 9.2 | 23.9 | 33.1 | 100.0 | 12.8 | 8.3 | 18.1 | 15.6 |
| 72 | 91.4 | 5.3 | 3.3 | 8.6 | 100.0 | 12.5 | 10.5 | 8.7 | 5.6 |
| 100 | 92.3 | 3.8 | 3.9 | 7.7 | 100.0 | 9.6 | 8.8 | 6.0 | 4.8 |
| Total | 90.5 | 4.5 | 5.0 | 9.5 | 100.0 | 11.3 | 10.0 | 9.9 | 6.3 |
Notes: Excludes families with zero approved hours. a Proportion of fortnights in which child care was used where excess hours were recorded. b Of population with excess hours.
Source: DESE administrative data
By income group, there was a higher incidence of excess hours among those with incomes under $100,000 and, in particular, those under $50,000, although the rate also rose just above the average to 9.6 per cent for those with household incomes of between $250,000 and $500,000. Single parents had a higher incidence of excess hours, 10.6 per cent compared with 9.2 per cent for couples. There were also some marked differences between states, with 18.3 per cent of families in the Northern Territory having excess hours, along with 11.8 per cent of those in NSW, and 11.5 per cent of those in the ACT. In contrast only 6.5 per cent of families in Tasmania were reported in this situation, along with 6.8 per cent of those in South Australia.
There were also marked variations across households by their activity classification, with a particularly high rate for those couples with one member working full-time and the other with low reported activity (29.1 per cent). The rate of incidence of excess use for single parents working full-time of 10.5 per cent was just above average across the population, and a little below the 11.2 per cent for couples where both members work full-time.
Outcomes by location are detailed in Table 83. Of particular note is the substantially higher rate of excess hours in very remote locations, where 14.2 per cent of families use more child care than they are subsidised for. They also tend to use this excess time relatively frequently, with 9.0 per cent doing so in half or more of the fortnights under study. Compared with other locations, there is also an elevated incidence in the capital cities.
| Urban and regional location | No excess | Exceed approved a | Total | Hours per fortnight excess b | Excess hours as proportion of time in child care b | ||||
|---|---|---|---|---|---|---|---|---|---|
| <50% of time | 50+% of time | Subtotal exceed | Average | Median | Average | Median | |||
| Distribution (%) | Hours per fortnight | (%) | |||||||
| Capital Cities | 89.6 | 4.7 | 5.7 | 10.4 | 100.0 | 11.4 | 10.0 | 9.9 | 6.6 |
| Urban 100k plus | 92.7 | 4.2 | 3.1 | 7.3 | 100.0 | 11.0 | 9.0 | 9.5 | 5.5 |
| Urban 50k-<100k | 93.6 | 3.6 | 2.8 | 6.4 | 100.0 | 11.4 | 8.0 | 10.1 | 5.2 |
| Urban 20k-<50k | 92.1 | 4.4 | 3.5 | 7.9 | 100.0 | 10.8 | 8.0 | 9.7 | 5.6 |
| Urban 10k-<20k | 92.0 | 4.1 | 3.9 | 8.0 | 100.0 | 11.1 | 8.0 | 10.4 | 5.6 |
| Inner Regional | 92.4 | 4.2 | 3.4 | 7.6 | 100.0 | 11.6 | 10.0 | 10.2 | 6.0 |
| Outer Regional | 91.5 | 4.2 | 4.3 | 8.5 | 100.0 | 10.9 | 9.0 | 10.5 | 7.0 |
| Remote | 90.8 | 4.3 | 4.9 | 9.2 | 100.0 | 9.4 | 5.0 | 8.2 | 4.8 |
| Very Remote | 85.8 | 5.1 | 9.0 | 14.2 | 100.0 | 11.8 | 10.0 | 10.7 | 8.2 |
| Total | 90.5 | 4.5 | 5.0 | 9.5 | 100.0 | 11.3 | 10.0 | 9.9 | 6.3 |
Notes: Excludes families with zero approved hours. a Proportion of fortnights in which child care was used where excess hours were recorded. b Of population with excess hours.
Source: DESE administrative data
6.7.3 Impact of the activity test
For the majority of parents, the activity test does not impose a significant limitation on access, nor do they feel constrained by it, and their levels of use of child care is substantially below that for which they could claim a subsidy. However, for some it does have an impact.
While, as discussed in Chapter 3, a majority of parents reported it was easy to update their activity details, there is evidence of some gaps in understanding. In CCPFamS (Wave 2), one in 4 parents did not know their activity level, and one in 3 did not know how many subsidised hours they had access to. This was in part related to the nature of care they used, with those with younger children - who were more likely to have longer sessions - being more aware than those with older children whose Outside School Hours Care hours represented only a small fraction of their probable allowable hours.
At the same time, a quarter of parents disagreed that the hours were sufficient. While in some cases, this is likely to lead them to use less care than they would prefer, data on this is not available. For another group - somewhere around 10 per cent of parents - the consequence of the activity test is manifest in terms of affordability in that they consume an amount of unsubsidised care. This appears to be concentrated at the bottom and, to a lesser degree, the top of the income distribution. A particular feature is the high incidence in remote locations and the Northern Territory.
6.8 Services
Another measure of access concerns the extent to which services have vacancies or waiting lists. The case studies undertaken as part of the evaluation addressed this question and identified a variety of different states of the balance of demand and supply for places but noted that the drivers for these were overwhelmingly local in nature. That is, there was little evidence of entire markets being over or undersupplied with child care, but rather particular locations had imbalances, and these tended to be shaped by local demographic and economic circumstances.
Across the case study sites, typically, participants spoke of an oversupply in Centre Based Day Care services, with many services reporting operating at less than optimal capacity levels (typically between 65-80 per cent capacity). Even the small number of Centre Based Day Care services at each site who were operating close to, or at, capacity were cognisant of changes in the local market. These tended to be services with a long-standing presence in the area who consistently maintained a good reputation (they were 'exceeding' as per the ACECQA rating).
The wait list has pretty much always been up to two years but, as of the last 12 months, I must say it has dropped. I'm assuming that is just because of the amount of competition around us now. They just seem to be popping up everywhere. Within 100 metres, within a four-kilometre square area, you've got anywhere between five and six different services. They're huge. We're not talking about small services. We're quite small, there's only 50 places. They're bumping up at 80, 100, 120.
[CBDC provider, August 2019]
This Centre Based Day Care service, located in the Case Study 6 area, was operating at capacity and still had a waiting list in the 0-3 age bracket but not in the 4-5 age bracket. In this case study site, there had been a noticeable increase in Centre Based Day Care services as the area was marked as a growth corridor, although the corresponding increase in young families was yet to occur.
An oversupply of Centre Based Day Care services is of benefit to families in terms of access, as it potentially allows families greater choice in services and leads to a highly competitive market. Centre Based Day Care service directors in the case studies spoke of being mindful of offering competitive daily rates and providing points of differentiation to stand out in the market. This could include providing unique elements to the educational program offered, providing flexibility with varying session times offered, the size of the service, or how in keeping the service was with the culture or needs of the local community.
The Outside School Hours Care service market within the case study sites tended to be similar to the Centre Based Day Care market, in that there had reportedly been a steady increase in the number of services (schools within the case study sites increasingly had an Outside School Hours Care service located onsite) and services tended not to have waiting lists. Most participating Outside School Hours Care service directors spoke of experiencing a steady increase in demand for their services, particularly for after school hours care, and subsequently applying to have their licence increased as required to meet local demand.
Almost five years ago, we were an 80-place service. We then grew to 120 place service and beginning of this year I could see that we were going to be … we actually put in to increase our licence again, went up to 200. So, this is just continuous. It just shows the growth in our community. Our families need these services.
[OSHC Provider, November 19]
The exception to this was in Case Study 2, where both participating Outside School Hours Care services were oversubscribed. One was in the process of increasing their licence but the other was unable to increase the number of licensed places because there was not sufficient physical space to support the increase. In this instance, the lack of physical space was an issue for the school more broadly and the school was in the process of expanding with the purchase of adjacent land. Case Study 2 was an area that had experienced rapid population growth following an increase in housing density within the inner metro area. The local state high school was academically selective, and families were also known to move into the area to be in the catchment area for this school. The result of oversubscription to the Outside School Hours Care services for families unable to gain access was that alternative arrangements needed to be made. This included parents shifting their work hours so they could access before school hours care (where there were no waiting lists) rather than after school hours care, involving extended family, namely grandparents, in weekly care arrangements, or the use of privately funded after school care arrangements such au pairs or babysitters.
The Family Day Care service market varied across case study sites, ranging from there being a very limited number of Family Day Care educators operating in the Case Study 2 area despite a demand (largely due to the high cost of owning or renting a suitable property making it not viable for educators), growing supply and demand in the Case Study 7 area, and a recovering Family Day Care market in Case Study 1 (which had contracted considerably following both the regulatory changes with Family Day Care and the introduction of the Package). The availability of Family Day Care is important from an access perspective as there is the potential for Family Day Care to better respond to the child care needs of families working variable or non-standard hours compared to Centre Based Day Care or Outside School Hours Care. Certainly, there were Family Day Care educators within the case studies who were providing evening, weekend and overnight care.
With the curtailment of the next wave of the services survey, contemporary data on vacancies is not available. However, in the June 2018 survey, the data collected reflects this diversity. It reports that at that time, while half of the services surveyed had no waiting list, others did, including 18.0 per cent who reported having a waiting list for all sessions. There were also, see Table 84, marked differences across service types. Waiting lists were most common in the Family Day Care and In Home Care sectors, but relatively infrequent in Outside School Hours Care.
| Waiting list for: | Service type: | Total | |||
|---|---|---|---|---|---|
| CBDC | FDC | OSHC | IHC | ||
| Proportion with a waiting list (%) | |||||
| All sessions | 27.0 | 33.1 | 3.5 | 34.0 | 18.0 |
| Some sessions & ages | 8.7 | 7.7 | 1.1 | 0.0 | 5.6 |
| Some age groups | 18.9 | 7.9 | 0.9 | 8.6 | 11.1 |
| Some sessions | 10.4 | 8.7 | 21.2 | 22.4 | 14.7 |
| Some educators | 0.0 | 23.9 | 0.0 | 6.4 | 1.2 |
| No waiting list | 35.0 | 18.8 | 73.3 | 28.7 | 49.4 |
| Total | 100.0 | 100.0 | 100.0 | 100.0 | 100.0 |
Source: SELCS Wave 1
6.9 Summary
Access to child care has a number of dimensions; these include the quality and cost of care, but also increasingly, broader questions about the role of the sector in providing early learning support to more vulnerable groups.
There is evidence of considerable diversity in achieved access across Australia, by state, by location within state, and by different groups within the community. The extent to which this is a consequence of limited access by some, or simply reflects differing demand, cannot be wholly determined from the data available to the evaluation, although a few consistent patterns were identified in consideration of parental assessment of ease of access.
Parents' perspectives on access were generally positive across the different aspects that were asked about, with average scores in the upper part of the neutral to agreement band of responses. While the nature of the data makes measuring change over time difficult, it suggests that there had been little change for younger children, but some improvements for children aged 6 years and over. Although some child care barriers are cited by those not using child care, the main reason given was that these parents preferred to look after their children themselves, and to the extent child care was raised, the chief issue was that of cost.
There are also some significant issues around access for children with additional needs. This encompasses both problems in finding suitable care and children being asked to leave care.
Overall, the implementation of the Child Care Package appears to have had only a limited impact on changing access. While there may have been a very small impact with the program's introduction, with some children ceasing to use care, this was very small, in all probability a fraction of a percentage point, but did appear to impact particularly on some low income families and some groups who were in receipt of transfer payments. Analysis of the impact of the program introduction is, however, confounded by ongoing compliance activity and changes to the In Home Care program. While there is evidence of a number of additional children being identified as being in child care, much of this appears to be associated with changes in the recording system and the inclusion of some who are not eligible for subsidies.
Although nominal data suggests an increase in access by Indigenous children, this is primarily a result of data recoding and no substantive change has occurred.
While the allowable subsidised hours appear to be adequate for most families, for some it poses a difficulty. A particular set of problems appear to be around the 24 hour approved care group, in the Northern Territory and remote locations, but also for some other groups, and the adequacy of the scope of exemptions. The sufficiency of allowed hours relative to actual use also appears to be an issue for a bit over 10 per cent of families with full-time participation.
111 This approach has been adopted due to the introduction of the Package as of 2 July 2018. If whole calendar year data is used then the 2018 figure is a mix of both pre- and post-introduction activity. Conversely if financial year data is used, while avoiding this problem, it only enables a comparison between 2 one-year periods.
112 There were 130 BBF services, 8 Indigenous Advancement Strategy (IAS) services, and 10 Non Formula Funded Occasional Child Care (NFF-OCC) services with child records in the data. On a quarterly basis, this group of services had a record of some 480 children prior to July 2018 and 4,861 in Q3 2019, with some increase past that date as the transition process was slow for some services.
113 3 rd quarter of each year.
114 This classification, for example, includes Bowral and Nowra in NSW, Shepparton and Traralgon in Victoria, Gladstone and Maryborough in Queensland, Mount Gambier and Victor Harbor in South Australia, Albany and Kalgoorlie in Western Australia, Devonport and Burnie in Tasmania and Alice Springs in the Northern Territory.
115 It is noted that this level of disaggregation of participation is also sensitive to the population estimates, and hence to the ability of the ABS population modelling to accurately generate counts at this single year of age level.
116 While the maximum allowed hours of subsidy is determined on a fortnightly basis, most services operate bookings and patterns of regular attendance on a weekly basis.
117 This applied to all eligible families with eligibility being related to criteria such as residency, immunisation of child, proportion of child caring responsibility, and so forth.
118 That is on the basis of weekly scheduling of days of care, which is the normal pattern in most services, and session lengths typically of 8 hours and above, a child for whom 24 hours' care is approved is only able to attend one day of care per week. Where they had an eligibility for 48 hours they could attend 2.
119 This restriction also reflected the extent to which session level data for this service type clearly reflected day usage, whereas in some other sectors the concept was linked back to funding arrangements such as hourly charges.
120 For example, in NSW in 2019, school holidays that fell in the 6 month window included: 13 April to 28 April; and 6 July to 21 July; while in Victoria they were 6 April to 22 April, 29 June to 14 July, and 21 September to 6 October.
121 In this analysis, the focus is on the comparative circumstances of groups. Caution is needed in comparing the hours before and after the transition. Changes in hours charged will reflect changes in usage but also changes in session length. Increases in the use of 10-hour sessions (rather than longer sessions) will, for example, result in an apparent reduction in care used. However, in the immediate transition period, any major shift in this does not appear to be the case. At the same time, in the old system, hours charged were frequently capped at 50 hours a week as the maximum number of hours which could be subsidised was 50 hours, so hours used or charged above this were not necessarily recorded.
122 The alignment of In Home Care to the Child Care Package was intended to address inappropriate practices by some services that included some charging for very long hours of In Home Care. The program changes also refocused the In Home Care program to be used for early childhood education and care. Some families were previously using In Home Care to meet broader family needs (more akin to those covered under the NDIS, for example).
123 The Department reports this as: 'Previously, children associated with an Indigenous customer were counted as Indigenous; however, children are now also counted as Indigenous if the customer's partner is Indigenous. Similarly, Indigenous families are now counted when either the customer or the customer's partner is Indigenous. Previously, only customers who were Indigenous were counted as Indigenous families' (DESE, 2019e).
124 As noted earlier, there were over 4,300 children who attended these services who had not previously been recorded in the child care system, fewer than half of these are, however, identified in the data as being Indigenous.
125 While, on the one hand, this effect reduces the direct relevance of change in the measures, it also introduces the possibility that when there is some change in results from the surveys that collect a mix of current and past experiences, the actual strength of current responses are watered down by the 'past' results. Again, though without any additional information on when parents had the experience, it is not possible to determine whether this is the case.
126 The incidence among this group, those with a child, other than the reference child, with additional needs, may potentially reflect several factors. It may be parents simply wishing to report the occurrence of such exclusion, without limiting their response to the actual question with respect to the reference child only, or the coexistence of other factors that are associated with a risk of exclusion.
127 This analysis draws on data collections undertaken for the evaluation of the Inclusion Support Program. Key data collections were surveys done in 2020 to early 2021 and included a survey of Inclusion Professionals, the Inclusion Professionals Survey (October-November 2020), a survey of services that had engaged with the Inclusion Support Program in the past year (December 2020-February 2021), and the SELCS Wave 3 (November-December 2020), which was focused on inclusion in child care. An in-depth case study analysis of the Inclusion Support Program, involving interviews with the Inclusion Agencies, supplemented these surveys (November 2018-January 2019 and March 2020).
128 While the activity test exemptions are an important part of the policy design, we are unable to report on to what extent these exemptions are being taken up or understood. In survey data, there are too few parents reporting to be exempt from the activity test to undertake analysis. Administrative data on activity test exemptions was not available for the evaluation. We are therefore unable to explore to what extent exemptions were being accessed, or whether instead some families in these more vulnerable circumstances were withdrawing from child care, believing themselves unable to meet the activity test. Many stakeholders interviewed across the evaluation noted a need for an exemption that could cover Aboriginal and Torres Strait Islander families living in areas of low employment opportunities. Other cohorts that some stakeholders considered were not adequately covered by the exemptions were all families living in remote areas (i.e. not just Aboriginal and Torres Strait Islander families) and also mothers with infants who have left work but are not on maternity/parental leave. This latter was identified in a number of case studies and involved cases of families in which a partner is at home with an infant who has older siblings, but they are not on leave from employment. Their activity test results mean the family has no access to subsidised care unless the family income is below about $70,000. This means this single income family will need to pay full fees for any child care used by older children (not covered by the preschool exemption) in the family. This then becomes an affordability issue that has impacts on access for those children. Comments by parents indicate a wish for this situation to also be exempt from the activity test.
7. Vulnerable
This chapter addresses Impact 2 of the evaluation framework - that vulnerable and disadvantaged children are engaged and supported. In addition, a cross cutting issue for the evaluation is a focus on families with high or non-mainstream needs.
There are 3 important reasons for considering these children. The first is that their, and their families', circumstances may limit their access to child care. The second is that, even if they access child care, this may not respond to their needs. The third is that these children, or some subgroups of them, may have a higher need for care, either to address their current circumstances or to enable them to participate more fully and equitably in society and over their lifetimes.
This chapter initially considers the policy changes within the Child Care Package and the extent to which these may have impacted children who are vulnerable, along with the measures put in place by services to address the needs of these groups. It then looks at the impact of the Package on the participation of vulnerable children in child care before examining the range of policies introduced in the Package as the 'Child Care Safety Net'. It concludes by considering the outcomes for some of the most frequently identified groups as being vulnerable: Aboriginal and Torres Strait Islander children; children from non-English speaking backgrounds and with parents born in other countries; children with health conditions; and children living in regional and remote Australia.
While identifying these and other groups of children in this analysis, it needs to be recognised that questions of vulnerability and disadvantage are complex, and while some identifiable communities have a higher likelihood of a child being vulnerable, or having adverse outcomes, being a member of such a community or group, in itself, does not necessarily mean they are vulnerable. Conversely, many vulnerable children may be part of groups that show overall low rates of vulnerability.
7.1 Policy changes and service responses table
Outcomes for children can be seen as being a product, firstly, of the policy settings of the program and the implementation of these and, secondly, the behaviour of services, reflecting both their own perceptions of their role as early childhood education and care services and in response to the policy settings.
7.1.1 Policy changes
A range of the policies introduced with the Child Care Package can be considered as having potential impacts on vulnerable children and families. These include:
- introduction of the CCS to replace CCB/CCR. The distributional aspects of this have been considered in Chapter 4. While this has reduced the cost of care to a significant group of vulnerable families, for some they have increased.
- reconstruction of programs to provide the Child Care Safety Net. This is considered further in Section 7.3.
- tighter activity testing of the program, in particular, reducing the number of allowed hours for those on low incomes and not meeting the activity test from 24 hours per week to 24 hours per fortnight (or 36 hours in Centre Based Day Care if the child is in a preschool program and in the year before full-time school129).
- removal of the 'Priority of Access Guidelines' that services were required to use to allocate available places, see Section 1.1.7130
- changing the support arrangements for some services that were focused on providing care to Aboriginal and Torres Strait Islander communities from Budget Based Funding under which services were funded on a block grant basis to a fees and subsidy based regime. This is addressed in Section 7.4.2.
- changes to the In Home Care program that were intended to provide a stronger focus on early childhood education and care, changes in cohorts who could apply, linking to CCS (including co-payments) and changes to the administrative processes (see Section 1.1.7 and Section 10.8).
7.1.2 Service responses
As well as the programmatic aspects of the child care system, individual child care services also provide support to families they see as being vulnerable. Such service provisions in July 2019 are illustrated in Table 85. As shown:
- The most common form of assistance is alternative payment plans - these are offered by around 60 per cent of Centre Based Day Care, Outside School Hours Care and Former BBF services. They are, though, much less common in In Home Care and Family Day Care Services. While making this concession to parents with potential financial strain, offering such parents lower fees was considerably less common, with just 12.0 per cent of services doing so.
- Assistance with Centrelink applications is the second most frequently reported activity, with some 40 per cent of services reporting providing this support to parents. The role of services in this regard is discussed in relation to the simplicity of the child care system in Chapter 3, and specifically in the transition in Chapter 10.
- Notwithstanding the abolition of the requirement on services to provide priority access to high needs and vulnerable groups, well over a third of services report that they do provide some form of priority access. This was more commonly provided by Centre Based Day Care (41.3 per cent) and Family Day Care (39.9 per cent).
- A quarter of all services and over a third of Centre Based Day Care services report providing different session lengths. These are considered further in Section 5.4.
Before the introduction of the Child Care Package, one way that services were able to support vulnerable families was to reduce their fees such that they were not paying anything for child care. This is no longer an option, with the requirement that parents make a co-contribution to the cost of care. Several services commented that this has impeded access for vulnerable families that are not supported by ACCS under the Child Care Package, with the co-contribution seen to be a barrier to participation in child care for some families.131
| Assistance offered to low income and vulnerable families | Service type: | All services | ||||
|---|---|---|---|---|---|---|
| CBDC | FDC | OSHC | IHC | Former BBF | ||
| Proportion offering (%) | ||||||
| Different session lengths | 34.8 | 30.8 | 6.6 | 27.2 | 12.5 | 24.5 |
| Lower fees | 12.4 | 12.4 | 10.8 | 12.6 | 26.4 | 12.0 |
| Alternative payment plans | 57.2 | 35.2 | 60.6 | 16.9 | 58.7 | 57.5 |
| Assistance with Centrelink applications | 44.7 | 36.5 | 34.5 | 53.6 | 65.9 | 41.0 |
| Priority access | 41.3 | 39.9 | 27.8 | 32.0 | 32.1 | 36.4 |
| Transportation Assistance | 6.0 | 19.8 | 6.2 | 13.3 | 36.4 | 6.9 |
| Other | 10.4 | 9.5 | 9.1 | 10.3 | 11.4 | 9.9 |
| None of the above | 12.8 | 24.2 | 19.2 | 26.7 | 20.0 | 15.6 |
Notes: Former BBF services were identified as a unique service type for survey sampling to allow for the evaluation to track this group's experiences of the Child Care Package.
Source: SELCS Wave 2, July 2019
Alternative arrangements can avoid this requirement. One is that rather than enrolment via a CWA (the usual mechanism to trigger access to the CSS, see Section 5.1.2), children may instead be enrolled by services through 'relevant arrangements' and utilise other funding (such as CCCF) without charging parents. Another form of enrolment is the provider eligible arrangement, for children receiving Additional Child Care Subsidy (Child Wellbeing) or an arrangement with a third party organisation. Information on how services used these enrolment arrangements to support vulnerable children was to be collected in the 2020 data collections that did not proceed, and information on children's enrolment type was not available in the administrative data.
7.2 Participation of vulnerable and disadvantaged in child care
This section considers the extent to which potentially vulnerable and disadvantaged children access child care. It firstly analyses the overall impact of the Package on the rate at which these children participate in child care, and then the degree of participation these children experience in terms of the hours of care for which they can obtain CCS.
7.2.1 Access to child care and the impact of the Child Care Package
Section 6.4.1 has presented some analysis of the participation of children whose parents are in receipt of FTB. This data is again considered here with a focus on whether or not the introduction of the Package has impacted the participation of potentially vulnerable children. Specifically this data is used because:
- It enables population-based estimates of participation to be derived.
- The FTB population is considered likely to contain a very high proportion of the population of children who may be vulnerable or disadvantaged.132
The analysis here is based on modelling of the rate of participation of children by personal and parental characteristics prior to the introduction of the package and following its introduction, and is presented as 'predicted' participation rates for the post implementation population.133 Results are detailed in Table 86. Specifically, the model identifies the overall impact of the package on the FTB population as:
- A positive increase in the use of child care for children aged zero to 4 years of 0.2 percentage points from 39.4 per cent to 39.7 per cent.
- A decline in the rate of use of child care of 0.6 percentage points for children aged 5-12 years whose parents are in receipt of FTB from 17.6 per cent to 17.0 per cent.
The data also highlights large differences in the level of access to child care across the identified subpopulations, although these are frequently inconsistent across the 2 age groups:
- Consistent patterns of lower utilisation in both age groups are seen for Indigenous Australians; those living in Outer Regional, Remote and Very Remote locations, and in the Northern Territory overall; and single parents and couples on full-rate income support and couples who receive some income support. It is also seen in larger families.
- These groups, however, show different patterns of change. There was a marked increase in participation of young Aboriginal and Torres Strait children, although use of child care dropped among the older group of these children, and the decline was less than the overall decline. There were gains for the younger children in Outer Regional, Remote and Very Remote locations. The pattern by income support and FTB status was more complex and is considered further below, with the circumstances of Indigenous children considered in Section 7.4.1 and regional outcomes in Section 7.4.5.
- Conversely, while children whose parents are on Humanitarian visas have a much lower rate of use of child care than that of the population of FTB recipients overall when young, they have higher rates when older, with this also being seen in a much more muted fashion among parents from non-English speaking backgrounds as a whole. Section 7.4.3 considers outcomes for children with migration backgrounds further.
| Age 0-4 | Age 5-12 | |||||||
|---|---|---|---|---|---|---|---|---|
| Pop. Distrib.a | Child Care use b,c | Pop. Distrib.a | Child Care use b,c | |||||
| Pre-Package | Post-package | Change | Pre-Package | Post-package | Change | |||
| (%) | Proportion in child care (%) | (%) | Proportion in child care (%) | |||||
| Age group | ||||||||
| Age 0-2 | 59.7 | 31.1 | 31.3 | 0.2 | ||||
| Age 3-4 | 40.3 | 51.6 | 51.8 | 0.2 | ||||
| Age 5-9 | 63.1 | 22.3 | 21.8 | -0.5 | ||||
| Age 10-12 | 36.9 | 9.7 | 8.9 | -0.8 | ||||
| Non-English speaking background d | ||||||||
| No | 72.4 | 40.2 | 40.3 | 0.2 | 76.0 | 17.2 | 16.7 | -0.5 |
| Yes | 27.6 | 37.6 | 38.0 | 0.3 | 24.0 | 18.7 | 18.1 | -0.6 |
| Aboriginal or Torres Strait Islander e | ||||||||
| No | 92.1 | 40.7 | 40.8 | 0.1 | 92.8 | 18.3 | 17.7 | -0.6 |
| Yes | 7.9 | 25.3 | 26.5 | 1.2 | 7.2 | 9.3 | 8.9 | -0.4 |
| Child medical condition f | ||||||||
| No | 98.2 | 39.3 | 39.5 | 0.2 | 92.9 | 17.5 | 17.0 | -0.5 |
| Yes | 1.8 | 47.9 | 48.5 | 0.6 | 7.1 | 18.4 | 17.4 | -1.0 |
| Visa type | ||||||||
| No visa | 84.5 | 40.0 | 40.3 | 0.2 | 88.2 | 17.4 | 16.8 | -0.6 |
| Humanitarian | 1.6 | 25.0 | 23.3 | -1.7 | 1.5 | 25.8 | 22.6 | -3.2 |
| Other visa | 13.9 | 37.6 | 38.0 | 0.4 | 10.3 | 18.4 | 17.8 | -0.6 |
| Parental income support and income | ||||||||
| SP full-rate | 24.6 | 36.6 | 36.4 | -0.2 | 22.4 | 13.4 | 12.7 | -0.7 |
| SP part-rate | 4.0 | 75.5 | 76.9 | 1.4 | 7.4 | 32.3 | 31.7 | -0.6 |
| SP FTB only < 60K private income | 2.6 | 56.5 | 54.3 | -2.2 | 7.9 | 25.6 | 24.3 | -1.3 |
| SP FTB only >= 60K private income | 1.7 | 82.2 | 83.5 | 1.3 | 5.5 | 38.8 | 39.1 | 0.3 |
| Cpl both full-rate | 1.7 | 30.8 | 30.0 | -0.8 | 2.5 | 12.3 | 11.8 | -0.5 |
| Cpl some IS | 12.2 | 29.0 | 28.4 | -0.6 | 10.0 | 12.7 | 11.5 | -1.2 |
| Cpl FTB only < 80K private income | 27.0 | 33.8 | 34.4 | 0.6 | 19.9 | 12.8 | 12.5 | -0.3 |
| Cpl FTB only >= 80K private income | 26.2 | 42.7 | 43.4 | 0.7 | 24.5 | 15.6 | 15.1 | -0.5 |
| State | ||||||||
| NSW | 30.4 | 42.7 | 42.5 | -0.3 | 30.5 | 17.3 | 16.4 | -0.9 |
| Vic. | 24.9 | 37.8 | 38.5 | 0.7 | 24.0 | 17.4 | 17.1 | -0.3 |
| Qld | 22.5 | 45.2 | 44.9 | -0.2 | 23.4 | 20.5 | 19.8 | -0.7 |
| SA | 7.3 | 34.4 | 35.3 | 0.9 | 7.4 | 20.6 | 20.0 | -0.6 |
| WA | 10.2 | 28.7 | 29.2 | 0.6 | 9.8 | 12.2 | 12.0 | -0.2 |
| Tas. | 2.4 | 35.8 | 35.9 | 0.1 | 2.6 | 13.8 | 13.5 | -0.3 |
| NT | 1.3 | 16.8 | 19.0 | 2.2 | 1.2 | 7.9 | 7.8 | -0.1 |
| ACT | 1.1 | 36.2 | 38.3 | 2.1 | 1.0 | 19.0 | 20.1 | 1.1 |
| Urban and regional location | ||||||||
| Capital Cities | 59.7 | 39.5 | 39.6 | 0.1 | 56.8 | 20.1 | 19.6 | -0.5 |
| Urban 100k plus | 11.9 | 48.9 | 49.2 | 0.3 | 12.6 | 20.7 | 19.9 | -0.8 |
| Urban 50k-<100k | 5.2 | 40.3 | 40.5 | 0.2 | 5.3 | 15.5 | 15.0 | -0.5 |
| Urban 20k-<50k | 5.5 | 39.9 | 40.4 | 0.5 | 5.6 | 13.5 | 12.7 | -0.8 |
| Urban 10k-<20k | 2.9 | 34.6 | 34.5 | -0.1 | 2.9 | 10.9 | 10.3 | -0.6 |
| Inner Regional | 7.1 | 38.2 | 38.5 | 0.3 | 8.4 | 12.2 | 11.7 | -0.5 |
| Outer Regional | 5.6 | 31.6 | 31.9 | 0.3 | 6.3 | 8.6 | 8.1 | -0.5 |
| Remote | 0.7 | 18.4 | 20.3 | 1.9 | 0.7 | 5.1 | 5.1 | 0.0 |
| Very Remote | 1.3 | 8.4 | 11.8 | 3.4 | 1.3 | 2.4 | 2.8 | 0.4 |
| Carer-child relationship | 0.0 | |||||||
| Parent (including step and adoptive) | 98.3 | 39.2 | 39.4 | 0.2 | 90.8 | 18.0 | 17.4 | -0.6 |
| Foster carer | 0.6 | 62.1 | 64.0 | 2.0 | 0.9 | 24.4 | 24.8 | 0.4 |
| Grandparent | 0.7 | 58.7 | 58.3 | -0.4 | 1.3 | 20.9 | 19.1 | -1.8 |
| Other and unknown | 0.4 | 43.2 | 46.1 | 2.9 | 6.9 | 9.1 | 8.1 | -1.0 |
| Parent receives Carer Allowance | ||||||||
| No | 92.6 | 39.3 | 39.4 | 0.2 | 85.0 | 17.8 | 17.3 | -0.5 |
| Yes | 7.4 | 41.8 | 42.3 | 0.4 | 15.0 | 16.5 | 15.7 | -0.8 |
| Parent disability | ||||||||
| No | 98.1 | 39.5 | 39.7 | 0.2 | 95.7 | 17.9 | 17.3 | -0.6 |
| Yes | 1.9 | 38.6 | 38.8 | 0.2 | 4.3 | 11.1 | 10.5 | -0.6 |
| Age of youngest child | ||||||||
| 0 | 24.3 | 19.7 | 19.7 | -0.1 | 4.6 | 13.7 | 12.6 | -1.1 |
| 1 | 26.0 | 35.0 | 35.1 | 0.1 | 6.2 | 15.5 | 14.7 | -0.8 |
| 2 | 20.2 | 47.6 | 48.0 | 0.4 | 6.6 | 17.8 | 17.3 | -0.5 |
| 3 | 14.9 | 55.8 | 56.0 | 0.2 | 7.2 | 19.9 | 19.3 | -0.6 |
| 4 | 14.6 | 51.5 | 54.1 | 2.6 | 7.0 | 19.1 | 18.6 | -0.5 |
| 5-12 | 68.3 | 17.7 | 17.1 | -0.6 | ||||
| Number of children 0-12 | ||||||||
| 1 | 28.1 | 41.3 | 41.5 | 0.2 | 25.8 | 17.5 | 17.2 | -0.3 |
| 2 | 40.3 | 42.6 | 43.0 | 0.5 | 38.5 | 20.0 | 19.4 | -0.6 |
| 3 | 20.7 | 36.2 | 36.3 | 0.1 | 23.3 | 16.0 | 15.2 | -0.8 |
| 4 | 7.6 | 30.7 | 30.3 | -0.4 | 8.7 | 13.6 | 12.7 | -0.9 |
| 5+ | 3.3 | 27.1 | 26.6 | -0.5 | 3.7 | 14.1 | 13.0 | -1.1 |
| Total | 100.0 | 39.4 | 39.7 | 0.2 | 100.0 | 17.6 | 17.0 | -0.6 |
| N (full model) | 6,362,380 | 10,033,798 | ||||||
| N (post package) | 3,093,123 | 4,982,800 | ||||||
| pseudo-r2 | 0.122 | 0.107 | ||||||
Notes: Modelled probability of being in child care on average in the 4 quarters prior to and following the introduction of the Child Care Package, based on post-package population characteristics. FTB population accounts for 42.5 per cent of families using child care in 2018-19. a Proportion of children whose parents receive Family Tax Benefit. b Whether the child attended any child care service. c Excludes population of children who attended a Family Day Care Service that has been subject to compliance action. d Non-English speaking background represents customer country of birth other than Australia, Canada, Ireland, NZ, South Africa, UK, US and Zimbabwe. e DSS Indigenous flag f Indicator of whether the child has a medical condition is based on the first listed medical condition of a child that qualifies their carer for Carer Payment and/or Carer Allowance (excluding those care receivers who only qualify for a Carer Allowance Health Care Card).
Source: DSS and DESE administrative data
Income support status
As seen in Table 86, there are diverse levels of participation and patterns of change associated with the introduction of the Child Care Package for children by the income support status of their parents. The pattern of change is detailed in Figure 105. For children with parents wholly reliant on income support, a population that is particularly vulnerable to adverse outcomes, either associated with low household income or the factors that have led to their parent's reliance upon these payments, there has been a small fall in participation in child care for both younger and older children and for both those in couple and single parent families.
Figure 105: Modelled change in probability of a child being in child care pre- and post-Package, by income support status, FTB population
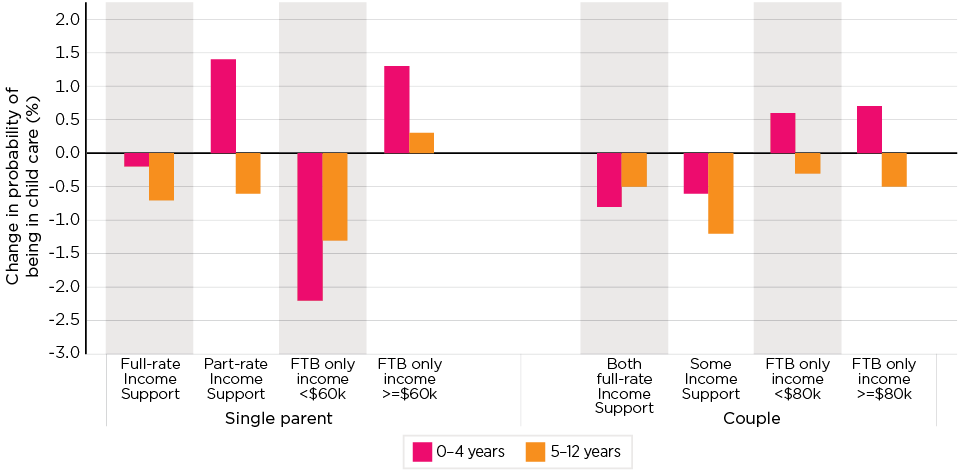
Notes and Source: As per Table 86.
This decline was particularly marked for younger children of couple families. A similar decline is seen for these younger children of couples where the families are in receipt of some income support but are not on full rates of support. In contrast, those sole parents on part-rates of income support show a strong gain in participation - from their already high 75.5 per cent to 76.9 per cent.
The most marked decline shown in the chart is for children of single parents who are not in receipt of any income support payments but have an annual income of under $60,000. The factors behind this are not clear, although it is noted that this group of children already had lower rates of participation in child care than those whose parents either received higher earnings or who received some income support, with this being apparent for both younger and older children.
While this data is difficult to generalise, it can be concluded that while there may have been a slight negative impact of the package on the rate of participation of children from families who were wholly reliant upon income support, the magnitude of this is small. The broader picture is that of increasing participation by younger children and a decline for older children - however, the magnitude of these changes is also small.
7.2.2 Participation - hours of care
Allowed hours
One factor in the volume of care used by children is the hours of subsidy that are available to families.134 This has been considered in previous chapters with respect to child care affordability (Section 4.5.2) and access (Section 6.7.2). Of particular relevance in relation to many vulnerable families is the extent to which children have access to 100 hours per fortnight through ACCS, or to 24 hours through the exemption to the activity test for low-income families. Further, under the Child Care Package, there are a number of specific situations in which parents who are not able to undertake any of the approved activities can apply for an exemption (see footnote 11).135 Exemptions cover, for example, parents on Disability Support Pension or Carer Payment, and grandparent carers who are not on income support payments (so not eligible for ACCS). If exempt from the activity test, children have access to 100 hours of subsidised care a fortnight. While exemptions cannot be identified in the administrative data, we note some indication of these being applied in at least some of the cohorts. For Q4 2019, for children in some child care.136
- In families in which a parent is on a Disability Support Pension (9,403 children), 92.3 per cent of children were recorded as having 100 allowed hours.
- In families in which a parent is in receipt of Carer Payment (22,379 children), 88.4 per cent of children were recorded as having 100 allowed hours.
- In families in which grandparents are caring for grandchildren, and the family is not on an income support payment (5,944 children), 92.2 per cent of children were recorded as having 100 allowed hours.
These findings are reflected in the distribution of allowed hours for some of the risk groups below.
As noted in these discussions, one central concern that has been raised about the impact of the package on vulnerable groups is that of a reduction of the minimum level of subsidised care from 24 hours per week to 24 hours per fortnight. With regard to Aboriginal and Torres Strait Islander children, as well as other children from vulnerable backgrounds, this was often articulated in very strong terms, such as from this stakeholder:
The introduction of the Package has had devastating impacts on services for Aboriginal and Torres Strait Islander children as the Package equates early years education with workforce participation, instead of a fundamental right for all children. The introduction of the activity test and halving of the minimum subsidised hours of child care to just 12 hours per week for [Indigenous] low income families means that our children who are experiencing vulnerability and stand to benefit the most from vital early learning have reduced access to it.
[Child care stakeholder, August 2019]
There were likewise concerns about the reduction to 24 hours per fortnight for children from non-English speaking backgrounds. For example:
We prefer not to have a child start one day a week, because it takes forever to settle these children in, where English is a new language to them. We're all strangers here. The building's strange. The educators, the faces. Mum's not here, Dad's not here, Nan's not here. Taking these children one day a week,137 they're extremely upset because they're confused. We settle them down by the end of the day and we have them nice and calm, but then they go away for a whole week, and the process starts all over again.
[FDC provider, October 2019]
Table 87 shows the distribution of approved hours in Q4 2019. The key features of this are:
- While, overall, just 1.6 per cent of children are entitled to a maximum of 24 hours of care per fortnight, this increases to around 9 per cent for a range of families - in particular, both single parents and couples who received full-rate income support payments, couples who are in receipt of some income support, and families who are on Humanitarian visas.
- It is also high at 6.9 per cent for Aboriginal and Torres Strait Islander children.
- While not all children in receipt of ACCS would have only been eligible for the 24 hours per fortnight subsidy, the role of this program in reducing the number in receipt of 24 hours is very large, although varying:
- For children whose families are reliant on income support, and Indigenous children, the proportion on an ACCS entitlement to 100 hours is greater than those without ACCS and with 24 hours.
- The ACCS 100 hour effect is very significant for children with a medical condition - where just 0.5 per cent have 24 hours and 6.8 per cent have an ACCS entitlement to 100 hours. In contrast, it plays a very much smaller relative role for children with a non-English speaking background and on Humanitarian visas.
| Maximum subsidy hours (per fortnight) | ||||||
|---|---|---|---|---|---|---|
| 24 hours | 36 hours | 72 hours | 100 hours | Total | ||
| Activity test | ACCS | |||||
| Distribution (%) | ||||||
| Parents in receipt of FTB | ||||||
| Parental income support | ||||||
| SP full-rate | 8.5 | 9.5 | 19.7 | 52.0 | 10.3 | 100.0 |
| SP part-rate | 0.5 | 2.5 | 30.8 | 61.7 | 4.5 | 100.0 |
| SP FTB only | 1.0 | 1.2 | 12.8 | 83.7 | 1.2 | 100.0 |
| Cpl both full-rate | 8.4 | 10.0 | 17.2 | 53.4 | 10.9 | 100.0 |
| Cpl some income support | 9.6 | 10.4 | 26.1 | 48.7 | 5.0 | 100.0 |
| Cpl FTB only | 3.0 | 6.5 | 33.1 | 56.0 | 0.8 | 100.0 |
| Family Indigenous status | ||||||
| Indigenous | 6.9 | 8.0 | 18.4 | 56.8 | 9.7 | 100.0 |
| Not Indigenous | 3.9 | 6.0 | 26.3 | 60.1 | 3.4 | 100.0 |
| Non-English speaking background | ||||||
| No | 3.7 | 6.0 | 26.2 | 59.3 | 4.5 | 100.0 |
| Yes | 4.9 | 6.5 | 25.1 | 61.5 | 1.7 | 100.0 |
| Visa status | ||||||
| Humanitarian visa | 8.5 | 8.2 | 34.4 | 46.1 | 2.7 | 100.0 |
| Other visa | 3.9 | 6.5 | 23.0 | 64.5 | 1.8 | 100.0 |
| No visa | 4.0 | 6.0 | 26.2 | 59.5 | 4.0 | 100.0 |
| Child medical condition | ||||||
| No | 4.2 | 6.4 | 26.3 | 59.2 | 3.6 | 100.0 |
| Yes | 0.5 | 0.7 | 17.3 | 74.5 | 6.8 | 100.0 |
| Non - FTB | 0.2 | 1.7 | 25.9 | 71.3 | 0.2 | 100.0 |
| Total a | 1.6 | 3.4 | 25.9 | 67.0 | 1.5 | 100.0 |
Notes: Table excludes those with missing or negative income, or zero allowed hours. a Includes 0.6 per cent who had zero allowed hours.
Source: DESE and DSS administrative data
Cost and use according to allowed hours and ACCS access
The Child Care Safety Net provides access to heavily subsidised child care to eligible children through ACCS. Children who are supported by ACCS have access to the maximum number of subsidised allowed hours, and their subsidy percentage is also very high (depending on type of ACCS, see Section 7.5.1), such that for children supported by ACCS, they may make use of quite long hours of child care at very little cost. As such, ACCS supports eligible children to maximise their use of child care. For example, in Q4 2019, the average fortnightly cost of care for children on ACCS was $13.37 (excluding In Home Care, which charges by family rather than by child). Considering fortnightly child care costs for children on ACCS at some time in Q4 2019, but excluding those on In Home Care, for 67.4 per cent their average net child care cost while on ACCS was zero. For those with a non-zero cost, the average was $40.98 per fortnight. This, however, varied by type of ACCS.
Those not eligible for ACCS but being subsidised through CCS and 24 allowed hours, on the other hand, have access to a lesser amount of subsidised care, and while this amount of child care is well subsidised, any care that is used above the 24 hours per fortnight will be subject to full payment of fees by the parents.
As has been seen in previous chapters, in many cases, children with a 24 hour limit on the number of subsidised hours of care, utilise greater levels of care. On average in Q4 2019 the 1.6 per cent of children attending child care who were entitled to a maximum of 24 hours of subsidy per fortnight were charged for 14.9 hours of care per week, see Table 88. Three-quarters of these children were in Centre Based Day Care and attended an average of 1.7 days. The only sector where average hours of care charged for was less than the maximum approved hours of CCS was Outside School Hours Care.
| Distribution | Mean number days per week charged | Average weekly hours charged | Average weekly net cost of care | |
|---|---|---|---|---|
| (%) | (days) | (hours/week) | ($) | |
| CBDC | 76.9 | 1.7 | 15.9 | 55.0 |
| FDC | 13.7 | 2.1 | 13.0 | 40.5 |
| OSHC | 9.5 | 2.4 | 9.7 | 23.0 |
| IHC | 0.0 | 3.8 | 27.3 | a |
| Total | 100.0 | 1.8 | 14.9 | 50.0 |
Note: a Cost is not included in calculations for IHC.
Source: DESE administrative data
Looking at the children attending Centre Based Day Care with a maximum entitlement to 24 hours of CCS per fortnight:
- 49.3 per cent only attended for one day a week, with a further 37.9 per cent attending 2 days a week.
- While the net cost of child care for those attending just one day a week was $19.07, this increased rapidly with longer days of attendance, rising to $68.67 for those attending 2 days, and around $164 per week for the 5.2 per cent who used care on 4 or 5 days a week.
- In most cases, the session lengths for these children were substantial. While 28.0 per cent of sessions were for 6 hours or less, the majority, 57.7 per cent, were for 10 hours or more.
Approved hours
The proportion of children who are entitled to only the safety net minimum of 24 hours of subsidised care per fortnight is small, some 1.6 per cent of child care users. In large part this reflects the significant role of ACCS and exemptions. Those with a 24 hours entitlement are concentrated among a number of vulnerable and marginalised groups. For many children in these groups, child care plays an important child development role. While some have access to shorter sessions, most in Centre Based Day Care do not, and around half of the children in this sector only attend one day a week. On average, children with this level of entitlement use additional unsubsidised hours, which results in high child care costs.
ACCS, and also the exemptions to the activity test, provides more substantial levels of access to subsidised care for vulnerable children, which results in very low costs of child care, and hence provides supports for these children to engage in child care at significant levels.
7.3 Child Care Safety Net
The Child Care Safety Net comprises 3 elements: Additional Child Care Subsidy (ACCS), the Inclusion Support Program and the Community Child Care Fund. The first 2 of these are discussed here with a focus on the ACCS, while the CCCF is considered in Chapter 9.
7.3.1 ACCS
Program structure
The Additional Child Care Subsidy is a top-up payment to the Child Care Subsidy, targeted at families facing specific barriers to accessing care. As detailed in Chapter 1, there are 4 different types of ACCS:
- ACCS (Child Wellbeing) supports access to approved child care for children who are at risk of serious abuse or neglect. Detailed information is available to providers on what may constitute 'serious abuse or neglect'. Two important points are that (1) a child may be considered eligible if they are at risk of experiencing harm due to current or past events relating to serious physical, emotional or psychological abuse, sexual abuse, domestic or family violence or neglect, or if such experiences in the future are considered likely. And (2) children identified as being at risk under state or territory child protection law meet the definition of 'at risk'.
- ACCS (Grandparent) supports grandparent primary carers, providing support for grandparents who receive an income support payment and care for their grandchild/ren for 65 per cent or more of the time and have substantial autonomy for day-to-day decisions about the child's care, welfare and development.
- ACCS (Temporary Financial Hardship) provides short-term increased child care fee assistance to families who, due to exceptional circumstances, are experiencing significant financial stress with the cost of child care.
- ACCS (Transition to Work) supports parents who are transitioning from income support to work by engaging in work, study or training activities.
ACCS (Child Wellbeing) is applied for by providers, whereas the other 3 payment types need to be applied for by individuals directly via Centrelink.
With the exception of ACCS (Transition to Work), the subsidy provided by ACCS is equal to the actual fee charged (up to 120 per cent of the hourly rate cap) and is provided for up to 100 hours per fortnight without an activity test. For ACCS (Transition to Work), the subsidy is equal to 95 per cent of the actual fee charged (up to a rate equal to 95 per cent of the hourly rate cap), with the number of hours of subsidised care being determined by the individual's activity test result.
Parents or carers (or services, in the case of ACCS (Child Wellbeing)) may apply for a higher subsidy percentage or a higher number of hours of subsidised care in exceptional circumstances.
The duration of ACCS payments varies.
- Assistance under the ACCS (Child Wellbeing) provision can be initially granted for 6 weeks on the basis of a certificate issued by the service provider, and for renewable periods of 13 weeks on the basis of a determination by the Department of Human Services.
- ACCS (Grandparents) is not subject to any time limits.
- For ACCS (Temporary Financial Hardship), the activity exemption applies for a maximum of 13 weeks per financial hardship event. In addition, the subsidy can continue for a further 12 weeks if parents gain employment and their income support payments cease.
- ACCS (Transition to Work) is dependent on the activity undertaken, ranging from up to 26 weeks for job search to more than 3 years if studying for a Bachelor's degree.
Since its introduction, the Department has provided ongoing information and updates to the sector about how to issue ACCS certificates and apply for a determination. The Department has also worked with Centrelink to streamline the claims process and resolve initial problems with the assessment of claims and communications with applicants.
Also since its introduction, a number of legislative amendments have sought to address issues that have arisen with the package, some related to ACCS. This includes the removal of the 50 per cent limit on the number of children a child care provider can self-certify as eligible for ACCS (Child Wellbeing).138 More recently (August 2020), amendments were passed by Parliament aimed at simplifying processes related to children in out-of-home care accessing ACCS (Child Wellbeing).139
Former programs and the development of ACCS
While the ACCS is a new program introduced as part of the Child Care Package, it can be seen as largely a modification of a suite of payments that were available under previous child care arrangements: Special Child Care Benefit (SCCB), which was available for children at risk and families facing Temporary financial hardship; Grandparent Child Care Benefit (GCCB); and Jobs, Education and Training Child Care Fee Assistance (JETCCFA). The program of assistance provided by ACCS was designed, in part, to address issues around payment integrity and program sustainability, as described in the Regulation Impact Statement.
There have been a range of issues with the current programs in terms of payment integrity and program sustainability, particularly in relation to assistance to support children at risk of serious abuse or neglect and families experiencing temporary financial hardship. There are instances of services using this assistance as a mechanism for retrospectively recovering unpaid fees, or charging rates that far exceed the average fees charged in each care type. While the current assistance is intended to facilitate access to or maintain engagement with mainstream child care, there are also instances where it is being utilised to fund non-mainstream services, including those that are more health-related or respite care in nature. (Department of Education and Training, 2015a)
Among the changes introduced with the ACCS, key differences with predecessor arrangements included:
- Eligibility for ACCS (Child Wellbeing) is defined more broadly than SCCB 'at risk' and available to all children in out-of-home care. The initial period of approval by services has been reduced from 13 to 6 weeks and is reviewable by DHS. While previously, assessments of eligibility relied on the advice submitted by a child care service and services were just encouraged to supply documentary evidence from a third party (e.g. child protection, medical professional), under ACCS (Child Wellbeing) evidence to substantiate applications is mandatory. Whereas previously, services could apply for SCCB on behalf of a family under ACCS (Child Wellbeing), services are required to have family involvement in the application process, including a conversation with the family and their agreement to the application, as well as referring the family to an appropriate support service.
- There are stricter definitions for primary caregiving under ACCS (Grandparent) and evidentiary requirements to prove grandparent relationship and the percentage of care, as well as excluding own children from also being eligible.
- The period for which ACCS (Temporary Financial Hardship) can be approved at any one time has been reduced, relative to SCCB, from 52 to 13 weeks, and a requirement to demonstrate a reduction in ability to pay child care fees, rather than just demonstrating financial hardship. Additionally, application is now by parents/carers directly to DHS, rather than by the service. One consequence of this is that services are unable to access information from DHS on a family's behalf.
- ACCS (Transition to Work). In addition to changes to the co-contribution to be paid by parents, and the alignment of the activity test with CCS, the scope of the program has been extended to include a wider range of income support payments and parents may be entitled to a further 12 weeks of support if they gain employment and their income support payments cease.
Operation of ACCS
Trends in the number of children supported by these programs are shown in Figure 106. This shows 3 main impacts:
- an immediate fall in all components other than ACCS (Child Wellbeing) with the initial introduction of the program
- a ramping up of some elements, especially Transition to Work and, to a lesser extent, Temporary Financial Hardship, in the quarters following the introduction of ACCS
- very strong and continuing growth in the Child Wellbeing component. Indeed, between Q2 2018 and Q4 2019 the number of children on this element has more than doubled, increasing from 7,854 to 18,395.
Figure 106: Children supported by Child Care Safety Net, by type of assistance, Q1 2017 to Q4 2019
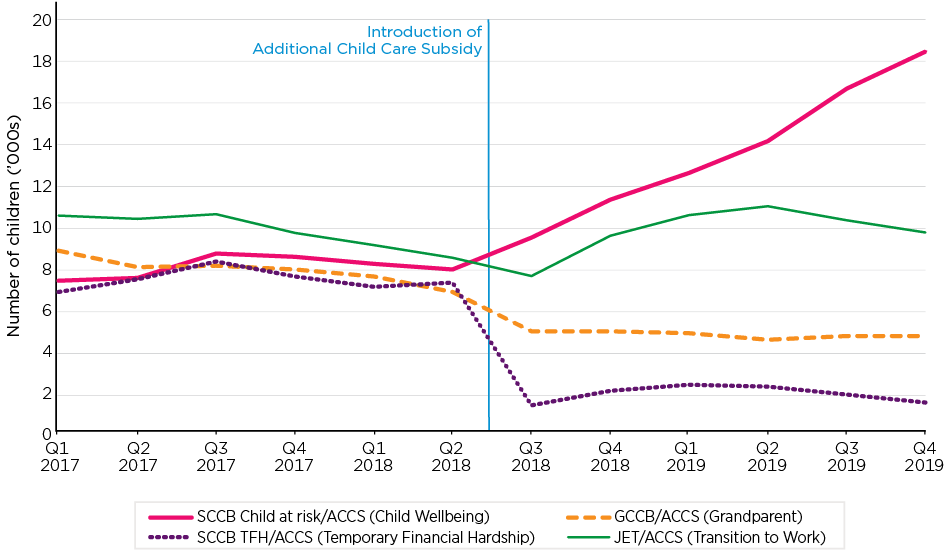
Source: DESE administrative data
The new program elements of ACCS have meant some changes in access to types of support for children in different family circumstances Table 89 presents this for those children whose parents or other carer is in receipt of Family Tax Benefit. For such children living with a foster parent, the proportion of children in child care supported by one of the safety net measures increased dramatically under the Child Care Package from 9.9 per cent to 62.1 per cent. This reflected a very large increase in the proportion accessing ACCS (Child Wellbeing) relative to the proportion that had been supported by SCCB (at risk).140 There was a similar increase for children with a relationship classified as 'other' or 'unknown' and this may include children with informal out-of-home care arrangements with a family member. Changes for children living with a grandparent resulted in a similar proportions (79.3 per cent compared to 78.0 per cent) supported by at least one of these programs (SCCB/JETCCFA pre-Package and ACCS post-Package), comparing Q4 2017 to Q4 2019.
| Program | Parent (including adoptive and step) | Foster parent | Grandparent | Other and unknown | |
|---|---|---|---|---|---|
| Proportion of children in child care (%) | |||||
| Proportion of children in child care supported by types of SCCB/JETCCFA, Q4 2017 | |||||
| SCCB Child at risk | 1.3 | 2.2 | 1.7 | 1.1 | |
| Grandparent CCB | 0.2 | 6.3 | 77.2 | 2.4 | |
| JETCCFA | 1.7 | 0.3 | 0.0 | 0.7 | |
| SCCB TFH | 1.1 | 1.2 | 1.2 | 0.7 | |
| Any of above | 4.2 | 9.9 | 79.3 | 4.8 | |
| Proportion of children in child care supported by types of ACCS, Q4 2019 | |||||
| ACCS (Child Wellbeing) | 2.1 | 58.8 | 15.0 | 21.5 | |
| ACCS (Grandparent) | 0.0 | 3.2 | 65.1 | 1.2 | |
| ACCS (TTW) | 1.9 | 0.4 | 0.1 | 1.4 | |
| ACCS (TFH) | 0.2 | 0.0 | 0.1 | 0.1 | |
| Any of above | 4.2 | 62.1 | 78.0 | 24.1 | |
Source: DESE and DSS administrative data
Of the 13,776 child care services across Australia, 5,953 (43.2 per cent) had at least one child on ACCS (Child Wellbeing) at some time in the 2018-19 financial year. The growth in the number of children on ACCS (Child Wellbeing) (Figure 106) was apparent across the sector. Specifically, the growth was driven by the number of services with a child in receipt of this assistance, not just particular services having more children on ACCS (Child Wellbeing).
Overall, services agreed that vulnerable children were accessing care through ACCS at their service, see Figure 107, with 69.7 per cent agreeing or strongly agreeing that this was the case. Agreement was strongest in responses from In Home Care Services where 88.7 per cent were positive, and in no sector was the level of agreement below 60 per cent. With respect to the question of whether vulnerable children were better off under ACCS relative to the previous arrangements, opinion was more divided. While the largest group were positive, with 38.9 per cent agreeing or strongly agreeing, just over a third, 35.1 per cent, neither agreed nor disagreed and 26.0 per cent disagreed. Sentiment was particularly adverse among In Home Care Services. Services' perspectives on more operational aspects of the program are considered further below.
Figure 107: Service perceptions of impact of ACCS, June 2019
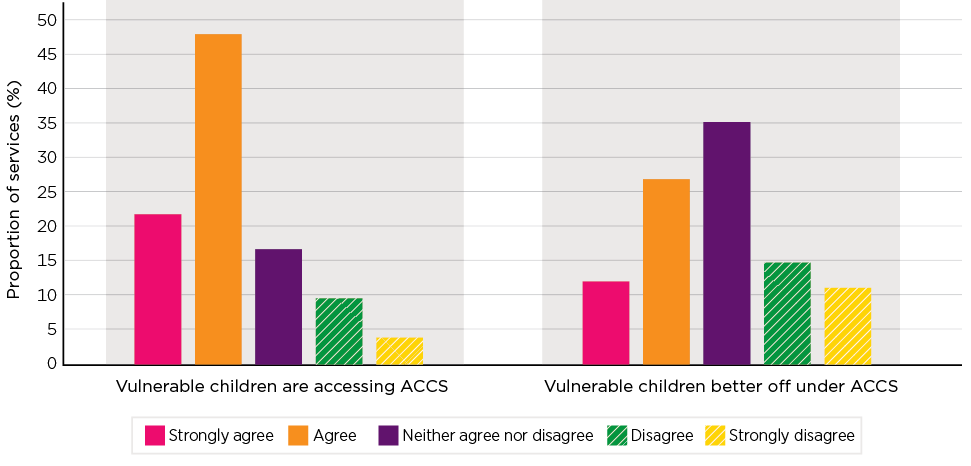
Notes: Excludes Not Applicable/Don't know/Prefer not to say.
Source: SELCS Wave 2
The incidence of receipt of ACCS varies across the population. As seen in Table 90, the rate is particularly high for some groups including Aboriginal and Torres Strait Islander children (10.8 per cent), children of single parents (9.8 per cent) and for children of low income households - under $66,958 per annum, 8.8 per cent. Indeed, across the program as a whole, some 70.1 per cent of children who used ACCS in 2018-19 had a single parent, compared with 19.5 per cent of those who did not. It also varied geographically; 5.6 per cent of children in the bottom 20 per cent of locations classified by socio-economic advantage used the program at some time in 2018-19, compared with just 1.1 per cent of those in the most advantaged locations, and by the geographic classification of locations there was a pattern of increasing use in smaller urbanised areas, relative to capital cities, and then a decline for non-urbanised locations based on remoteness.
Patterns of usage also varied by the particular ACCS subprogram. ACCS (Child Wellbeing) was used disproportionately by younger children, and within Centre Based Day Care services. It was also used to a lesser degree by single parents relative to the program as a whole. ACCS (Grandparent) was more likely to be claimed for the support of older children, and in Outside School Hours Care. Along with ACCS (Child Wellbeing), ACCS (Grandparent) was also used disproportionately by Aboriginal and Torres Strait Islander children. ACCS (Transition to Work) was used very heavily by single parents with low incomes. ACCS (Temporary Financial Hardship) was sought by more couples than single parents who usually had young children and who reported higher incomes. It was disproportionately sought by people in large non-capital cities, and the incidence was much more even across locations by their socio-economic status.
| Characteristics | Children in receipt of ACCS | No ACCS | All child care | Proportion of children with ACCS | ||||
|---|---|---|---|---|---|---|---|---|
| Child Wellbeing | Grandparent Care | Transition to Work | Temporary Financial Hardship | Any ACCS | ||||
| Distribution of children who used ACCS (%) | (%) | |||||||
| LOTE - Yes a | 2.6 | 6.6 | 4.1 | 2.0 | 3.7 | 3.9 | 3.9 | 2.7 |
| Indigenous b | 16.1 | 15.9 | 11.0 | 7.6 | 13.4 | 3.3 | 3.6 | 10.8 |
| Single Parent | 63.6 | 72.5 | 85.2 | 43.8 | 70.1 | 19.5 | 20.9 | 9.8 |
| Age of child c | ||||||||
| 0-2 | 46.1 | 23.2 | 40.3 | 48.0 | 41.1 | 32.3 | 32.6 | 3.7 |
| 3-5 | 39.9 | 40.9 | 33.7 | 36.2 | 37.4 | 34.0 | 34.1 | 3.2 |
| 6-12 | 13.9 | 35.6 | 26.0 | 15.8 | 21.4 | 33.5 | 33.2 | 1.9 |
| Remoteness | ||||||||
| Capital Cities | 57.5 | 53.1 | 55.6 | 60.5 | 56.5 | 69.3 | 68.9 | 2.4 |
| 100K plus | 14.3 | 14.7 | 18.1 | 18.8 | 16.0 | 13.2 | 13.2 | 3.5 |
| 50K-<100K | 7.4 | 7.2 | 8.5 | 5.6 | 7.5 | 4.2 | 4.3 | 5.1 |
| 20K-<50K | 8.4 | 9.7 | 7.4 | 5.5 | 8.0 | 4.5 | 4.6 | 5.0 |
| 10K-<20K | 3.4 | 3.7 | 3.2 | 2.3 | 3.3 | 2.1 | 2.2 | 4.4 |
| Inner Regional | 5.7 | 6.8 | 4.1 | 4.2 | 5.2 | 3.7 | 3.8 | 4.0 |
| Outer Regional | 3.0 | 4.3 | 2.7 | 2.2 | 3.0 | 2.4 | 2.4 | 3.7 |
| Remote | 0.2 | 0.4 | 0.3 | 0.3 | 0.3 | 0.3 | 0.3 | 2.8 |
| Very Remote | 0.3 | 0.3 | 0.2 | 0.4 | 0.2 | 0.3 | 0.3 | 2.2 |
| SEIFA Quintile d | ||||||||
| 1st (Lowest 20%) | 30.9 | 34.1 | 29.0 | 20.0 | 29.6 | 15.1 | 15.5 | 5.6 |
| 2nd | 23.9 | 27.7 | 24.5 | 20.1 | 24.3 | 16.6 | 16.9 | 4.2 |
| 3rd | 20.6 | 19.0 | 22.3 | 23.1 | 21.2 | 20.1 | 20.1 | 3.1 |
| 4th | 15.6 | 13.4 | 15.9 | 20.5 | 15.9 | 23.0 | 22.8 | 2.0 |
| 5th (Highest 20%) | 8.8 | 5.6 | 8.0 | 16.0 | 8.8 | 24.9 | 24.4 | 1.1 |
| Income e | ||||||||
| <$66,958 | 71.7 | 90.4 | 95.3 | 54.0 | 80.3 | 25.1 | 26.7 | 8.8 |
| $66,958 or more | 24.9 | 5.2 | 2.9 | 45.2 | 17.0 | 71.4 | 69.8 | 0.7 |
| Missing | 3.4 | 4.4 | 1.8 | 0.8 | 2.7 | 3.5 | 3.5 | 2.3 |
| Service type f | ||||||||
| CBDC | 79.2 | 57.3 | 64.2 | 74.8 | 70.1 | 53.7 | 54.2 | 3.7 |
| FDC | 4.6 | 10.9 | 10.4 | 7.8 | 8.0 | 9.8 | 9.8 | 2.3 |
| OSHC | 13.3 | 30.5 | 25.3 | 16.7 | 20.5 | 36.3 | 35.9 | 1.6 |
| IHC | 2.9 | 1.2 | 0.1 | 0.6 | 1.5 | 0.2 | 0.2 | 20.5 |
| Total | 100.0 | 100.0 | 100.0 | 100.0 | 100.0 | 100.0 | 100.0 | 2.9 |
Notes: Table refers to the percentage of children who accessed ACCS at any time during the 2018-19 financial year. Values for ACCS types do not sum to the 'Any ACCS' values, as some children accessed more than one ACCS type during the 12 month period. a Customer or Partner speak a language other than English. b DESE Indigenous flag. c 2,626 children aged 13 or older using CCS not included in analysis. d SEIFA 2016 Index of Relative Socio-economic Advantage and Disadvantage based on service location (5,219 missing SEIFA). e Negative incomes are included in the <$66,958 category. f Children using multiple care types are included once per care type. ACCS numbers for children using IHC may not capture all children supported by ACCS where multiple children in the family use IHC, as ACCS data is only provided for reference child.
Source: DESE administrative data
There was also a very marked difference in the distribution of ACCS support across service types. For example, 20.5 per cent of children using In Home Care utilised ACCS in 2018-19. This is not surprising given that one of the grounds of access to this care is the child being in a family with challenging or complex needs (a segment that has accounted for some 46 per cent of In Home Care program participants). Within Centre Based Day Care, 3.7 per cent of children had accessed ACCS. The proportions in Family Day Care (2.3 per cent) and in Outside School Hours Care (1.6 per cent) were much lower. Notwithstanding this lower rate, Outside School Hours Care was the main form of care used by 20.5 per cent of children who had accessed the program.
Operational aspects of ACCS (Child Wellbeing)
This final subsection considers some of the operational aspects of ACCS, and the more qualitative reporting of services and stakeholders.
One issue reported to the evaluation was that services have experienced difficulties providing uninterrupted access to ACCS to children, in part due to the requirement to apply for a determination for ACCS (Child Wellbeing) beyond the first 6-week period that can be granted by services.
Using the administrative data for July 2018 to December 2019, Figure 108 tracks children's use of ACCS (Child Wellbeing). As seen each week, a proportion of children on ACCS drop out of ACCS, and in most cases out of child care. This will include, for example, children dropping out of child care because of reasons unrelated to ACCS, such as when children start school. By week 6, 83.0 per cent were still on ACCS (Child Wellbeing) while 11.9 per cent were no longer in the child care dataset, with the other 5.2 per cent on no ACCS or other types of ACCS.
Following week 6 there is a sudden drop in the proportion on ACCS (Child Wellbeing), from 83.0 per cent at week 6 to 55.2 per cent at week 7. While this might indicate that ACCS (Child Wellbeing) was only needed for the initial period, the data suggests this is not the case, as there is a gradual transition of children who stopped using ACCS back onto ACCS over subsequent weeks, reaching 61.3 per cent of the original cohort on ACCS (Child Wellbeing) by week 13. By week 19, few of the original cohort were using child care but not on ACCS (Child Wellbeing), but due to the ongoing gradual decline in that original cohort from the child care data, at this time 35.0 per cent of the original cohort were not using child care. Week 20 is where there are potential impacts of the determination ending if an approval for a subsequent determination is not already in place. Of course, as with the first determination, it may be that ACCS is no longer required or applicable, so some drop-off at this point could be expected. This data does indicate a drop-off from 58.4 per cent of the original cohort to 48.0 per cent of the original cohort being on ACCS (Child Wellbeing). The data for the weeks that follow suggests there is not a gradual transition back to ACCS (Child Wellbeing) in subsequent weeks, so the drop-off here may be more legitimately reflecting changed need for ACCS compared to the drop-off that occurred at week 6.
This pattern also has financial implications. For those who went from ACCS (Child Wellbeing) in week 6 to no ACCS in week 7, the average weekly cost of care went from $12.87 in week 6 to $99.30 in week 7. Qualitative data collected from services and stakeholders has reported on the debts accumulated because of gaps in ACCS payment, and this data shows how easily this can occur, and also highlight its scale.
Figure 108: Children who commenced on ACCS (Child Wellbeing), use of child care and ACCS, by weeks since commenced, 2018-19
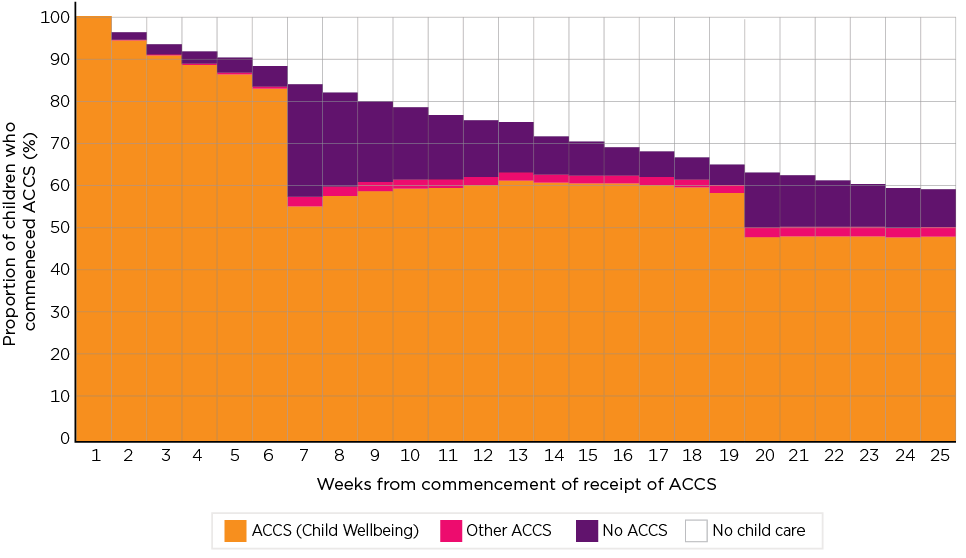
Notes: Based on the total number of 21,575 who commenced ACCS (Child Wellbeing) at some time in 2018-19. They are tracked each week following their first week, until the 25th week after starting, or until December 2019. 'Other ACCS' means children are recorded as receiving ACCS other than ACCS (Child Wellbeing) that week. 'No ACCS' means children are enrolled in child care that week but without ACCS. 'No child care' means children are not apparent in the child care administrative data that week.
Source: DESE administrative data
In general, services report that staff were confident in talking to families about ACCS (Child Wellbeing) applications and in referring families to appropriate services, Figure 109. However, in both cases a little over a quarter said that they were not. Across service types there was variation. In Home Care services reported the highest levels of agreement to both statements, while former BBF services expressed the lowest level of confidence in having conversations with families, and the second lowest level of confidence in making referrals. The lowest level of knowledge in making referrals was reported by Outside School Hours Care services, which also reported the second lowest confidence in talking with families.
Figure 109: Services, confidence in aspects of ACCS (Child Wellbeing) operation, June 2019
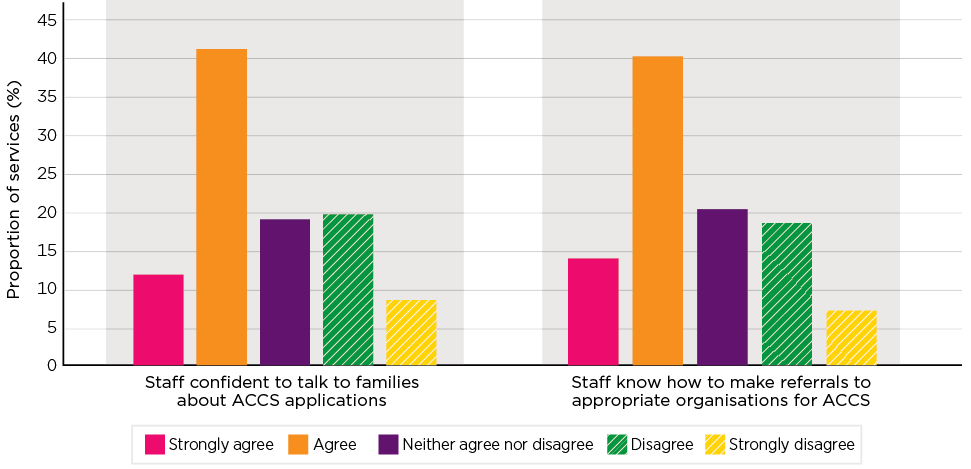
Note: Excludes Not Applicable/Don't know/Prefer not to say.
Source: SELCS Wave 2
Service responses to questions about the ease of various ACCS processes were more divided, while on balance positive with regard to issuing certificates (48.8 per cent very or mostly easy, relative to 37.4 per cent somewhat difficult or very difficult), the balance was negative with regard to collecting evidence (39.5 per cent positive and 45.6 per cent negative), and in applying for determinations (39.9 per cent positive and 43.3 per cent negative). When all of the responses are considered together, only a minority of services that had made an ACCS application, some 43.4 per cent, did not report finding one or more of these 3 activities difficult.
There were also marked differences across sectors. On balance, Centre Based Day Care Services were positive about issuing certificates and neutral with regard to the other operations. While Outside School Hours Care services were positive about the ease of issuing certificates, they were negative about the other aspects, while the other sectors: Family Day Care; In Home Care; and Former BBF services, were on balance negative across all 3 areas.
Figure 110: Services, ease of ACCS (Child Wellbeing) operations, June 2019
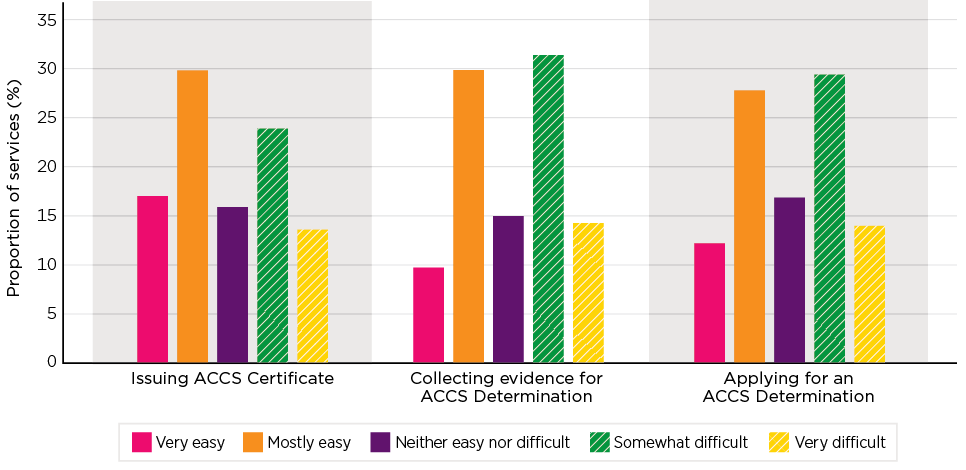
Note: Excludes Not Applicable/Don't know/Prefer not to say.
Source: SELCS Wave 2
Services that had positive experiences of ACCS rarely provided a comment about their experience. An example of a positive experience is articulated here, as being related to a reduction in IT issues and improved information.
If everything goes as it should, the process is easy. There have been system 'glitches', which do seem to be becoming fewer with time. The recent evidence guide has been very helpful to provide information to third-parties about what is required.
[FDC provider, July 2019]
This is consistent with other reports, from the SELCS and from interviews, that access to, and information about, ACCS improved over the months following implementation. A few services, in commenting about ACCS, also acknowledged that providing access to ACCS to all children in out-of-home care was a positive change (although this was not without some difficulties, as noted in some of the issues arising below).
I think it's great that children in foster care are now getting more under the ACCS scheme.
[CBDC provider, July 2019]
As noted, about one year after the introduction of the Child Care Package, a little over half of services reported having difficulty with one or more of the aspects of the ACCS application process. In the qualitative data collection, a number articulated the reasons as to why they provided this response. Examples included:
We have difficulty obtaining the required evidence to apply for ACCS. When we do receive this, it is often not meeting the criteria of ACCS (Wellbeing).
[CBDC provider, July 2019]
Family needs one on one support with the ACCS process, there is a lot of follow up required. Letters not signed, not in correct format. A lot of going back and forth and the parents are stressed enough so become angry.
[CBDC provider, July 2019]
Difficulties reported by services included:
- Some external organisations were slow to respond to requests for evidence.
- This included child protection agencies being at times unwilling to provide letters in relation to children who were no longer in out-of-home care but, in the view of child care services, still at risk and vulnerable, or being unwilling to provide letters for subsequent determinations to say the child was still under the protection of the state.
- It was difficult to resolve issues if an application was rejected as there is no contact point within Centrelink to discuss applications.
- Problems of applying for ACCS for Aboriginal and Torres Strait Islander children who are informally in the care of a relative.
This latter was cited in feedback from a number of services, including those that were former BBF services:
… made it a really complicated situation for some families, where grandma might have the kids, but the mother might have been in a different community and still receiving those benefits, there's a resistance to actually going to Centrelink and saying I've got these kids, you need to give me the money.
[CBDC provider (former BBF), October 2019]
Our families that are kinship carers, the system's failed them, because if they're not the grandparent or come under that category - for example, this auntie has taken two little kids; she doesn't work, so her days, her hours, everything's reduced, so five days a week is now one day a week. So it's failed our children, when they need it five days a week.
[CBDC provider (former BBF), October 2019]
Additional challenges to the implementation of ACCS (Child Wellbeing) included the need for services to identify that a child might meet the eligibility criteria for at risk of abuse or neglect, and to fully understand the range of situations where this may occur. This was problematic in a number of ways.
- Some services reported that the threshold for risk in the guidelines was too high and meant children from families that they considered to be highly disadvantaged and vulnerable were unable to access adequate amounts of care. They expressed a concern that this meant a loss of opportunity for crucial early intervention support for families to avoid an escalation of risk for these children.
- Many services reported that using the language 'at risk' raised fears for Indigenous families, in particular, about their children being removed, often raising past traumas surrounding the Stolen Generations and other welfare practices. These services told us that many families were unwilling to agree to the service applying for ACCS on their behalf because they were reluctant to define their children as 'at risk', fearing that this would lead to their children being removed by child protection.
- Further, services and stakeholders also reported that discussions about ACCS between child care staff and parents could be fraught in that, for some communities, family difficulties were not seen as 'child care business'.
- Finally, a small number of services participating in the evaluation in 2019 demonstrated continued confusion about the requirements for ACCS (Child Wellbeing), mistakenly believing that families needed to apply for it, or that a child protection notification was required to access this support.
As noted in Section 3.3.3, services often expressed having experienced delays in the CCS application process for a small number of families. In some cases, this also had implications for families' access to ACCS, as eligibility for CCS was required for ACCS access. Many services further reported delays in the processing of the ACCS application, sometimes linked to the various issues described above. This was linked to the dilemma they faced with enrolment, charging, and debt.
We have a women's shelter up the road… the problem for us is that they're not linked in the system at all for being assessed for child care. So they don't have hours or percentages and we need to place them in care. So I can't actually apply an ACCS claim unless I've got a current enrolment to book it to. And so then there's like this period where either I decide to take this family on board at a full fee cost to me or I make them pay it - but they can't pay it
[CBDC provider, March 2019]
The alternative is to decline the enrolment until all of the processes are in place:
Children having to wait for Centrelink to process applications so they get CCS before applying for ACCS means we are unable to provide care for these children at risk until all approved, this can take months at the moment. The support for children at risk is very poor with ACCS.
[CBDC provider, July 2019]
Other ACCS types
As noted above, while ACCS (Child Wellbeing) is accessed via a service applying on behalf of families, all other forms of ACCS require parents or carers to make an application to Centrelink.
After ACCS (Child Wellbeing), the ACCS type discussed most by services in interviews and in comments in the SELCS was ACCS (Temporary Financial Hardship). In contrast to previous arrangements, application for this type of assistance could be made by services on behalf of families, whereas under ACCS it is based on a family application to Centrelink. Divergent perspectives were given by services on this change. A few services reported they saw the value of families applying through Centrelink, as this removed the responsibility for assessment from services. However, other services reported that it reduced accessibility. There were several reasons services cited for this: Centrelink staff were poorly informed about ACCS types and provided families with incorrect information; generally, Centrelink was seen as being inaccessible for families, particularly families for whom English is an additional language (see Section 3.2.4). A number of services further commented that placing the onus on families to do additional paperwork in a time of crisis was unrealistic, while under the previous system, services were able to undertake this on their behalf. As expressed by these 2 Centre Based Day Care services:
I think the new system of parents having to apply for ACCS (temporary financial hardship) and other things is problematic. We have a family whose father was diagnosed with terminal cancer and could really have done with ACCS but having to apply and be on hold with Centrelink for hours is really the last thing they needed to be worrying about. I know of another centre who had a parent pass away suddenly and again this is the last thing they needed to deal with. I think in cases like this that the centres should still be able to apply for that assistance for them.
[CBDC provider, July 2019]
The temporary financial hardship is a big issue. It's now something that the families have to apply for, and they don't understand how to do that.
[CBDC provider, October 2019]
Findings from the Case Studies, in particular, suggest that parents and carers are often unaware of the options available to them through ACCS. However, it was valued by those that had been able to access it. For example, some ACCS (Grandparent) recipients commented in parent surveys (including in In Home Care surveys) and case studies their appreciation of receiving free child care through ACCS. Reflecting perhaps, the very small numbers of families on ACCS (Transition to Work) (Figure 106) we did not find any parents or carers in our surveys and qualitative research who had accessed this measure.
Assessment of ACCS
The analysis indicates that the ACCS can be seen as being broadly effective and targeted at children who may be vulnerable. At the same time several issues emerge:
- The administrative requirements of the program can be significant, and require services to extend their role beyond being child care providers into areas such as making referrals to appropriate organisations and having to engage in discussions with families.
- The discontinuities of ACCS, particularly in the period between the coverage of the initial certificate and the subsequent determination, can have significant implications for families, and may be indicative of services having difficulties with the current administrative requirements of the program.
- There is scope for further consideration of recognising the role of informal kinship carers (for ACCS (Grandparent)).
- In respect to Aboriginal and Torres Strait Islander families there is scope to further consider issues raised, particularly in the language of 'at risk'.
- Concerns have been raised about challenges for families who need to negotiate access to ACCS when they are already in a vulnerable position. This was particularly a concern for Temporary Financial Hardship.
In addressing these questions, it is noted that ACCS does not, in itself, provide a substantive benefit for a child care service relative to the provision and charging of care to a non-ACCS child, and in the case of kinship and other carers, there is no financial gain for them. Rather the benefit of ACCS flows to the child who can access care that they may not otherwise be able to obtain.
7.3.2 ISP
The Inclusion Support Program (ISP) commenced in July 2016, preceding the main changes to Commonwealth child care support that commenced in July 2018. The program's objective, as part of the Child Care Safety Net, is to 'provide parents or carers of children with additional needs access to appropriate and inclusive services that assist those parents to participate in the workforce' (DESE, 2020h). More specifically, the mechanism of the program is to enable services 'to include children with additional needs in mainstream services; providing them with an opportunity to learn and develop alongside their typically developing peers' (Department of Education and Training, 2017a, p. 6).
The program has 2 key dimensions. The first is the provision of support to services by the Inclusion Agencies, which are funded under the program to assist services build their capacity to be inclusive, including with the development of Inclusion Support Programs to assist services identify barriers to inclusive practice and develop strategies and actions to address these, as well as specific support and advice on the inclusion of particular children. The second are a series of programs that provide financial support, through the Inclusion Development Fund (IDF), to services to employ (in Centre Based Day Care and Outside School Hours Care) an additional educator, or to reduce child numbers in Family Day Care (FDC Top up), to support inclusive practice. While the funding is triggered on the basis of a child having particular additional needs, it is not for the purpose of direct support for that child but rather inclusive practice in the care environment.
The program is subject to a separate evaluation. The September 2019 interim evaluation found that Inclusion Agencies have a high level of contact with child care services. Administrative data reports that 94.1 per cent of services were contacted by an Inclusion Agency in the 6 months to December 2018, while 88.6 per cent of services reported contact in the 12 months to May/June 2018, with 57.1 per cent of these reporting regular contact. Also, 47.1 per cent of services reported being very satisfied with the service provided by the Inclusion Agency and 31.7 per cent mostly satisfied; 49.9 per cent of services had a current Strategic Inclusion Plan; and, in 2018, 4.3 per cent of Family Day Care Services has received a FDC Top Up, and 34.2 per cent of Centre Based Day Care and 20.6 per cent of Outside School Hours Care services received an IDF subsidy for an additional educator, with 6.0 per cent and 2.4 per cent respectively receiving an IDF subsidy for Immediate/Time Limited Support.
More detailed analysis used a measure of the value of IDF funding per hour of child care reported by services. This averaged $0.05 per child hour, although there was considerable variation by state from $0.11 in Tasmania to $0.02 in the ACT and NT. By service type, the figure varied from $0.001 in Family Day Care to $0.05 in Centre Based Day Care and $0.06 in Outside School Hours Care. Modelling suggested that relative to other locations, taking into account the composition of services and some child characteristics, there was higher funding for services in 'Inner Regional' locations relative to both 'Major Cities', and the more remote localities.
Overall, the evaluation found that there was a large underspend of program funds. In 2017-18, spending on the support programs through the Inclusion Development Fund Manager (IDFM) was only 64.3 per cent of the budget. A particularly marked underspend occurred in the Innovative Solutions Support program, in which just 3.9 per cent of the 2017-18 budget was spent ($0.43 million from $11.0 million). The evaluation noted that while an underspend is, in itself, not a major issue if a program is not required, the evidence available to the evaluation did not suggest a lack of demand. Additionally, it was noted that there appeared to be wide and unexplained variation in spending across sectors and locations.
Additionally, the evaluation highlighted significant problems with the IT environment, and with regard to some specific aspects of the program. Following consultation with the sector, the ISP guidelines were refreshed in March 2020. Key changes included the expansion of ongoing additional educator support for children with additional needs under the age of 6 years without a diagnosed disability, increasing both the time frame and number of hours for immediate or short term additional educator support and the expansion of eligibility to align with CCS settings in services providing preschool education programs. These changes were in response to feedback that younger children face delays seeking and obtaining diagnoses. Changes were also made to the IDF Innovative Solutions Support program to make the program more accessible and allowing relevant organisations to develop projects (DESE, 2020h).
The evaluation also noted that there were also tensions in both the framing and operation of the ISP around how to balance building inclusive environments, in which children with additional needs can participate without requiring additional resources, and cases where additional support is needed, and raised questions about the extent to which discrimination limits access to child care, and the relationship between anti-discrimination and pro-inclusion strategies. This recognised that, while through the ISP the Department had a strong focus on supporting inclusion, Commonwealth anti-discrimination legislation also encompassed key aspects of disability and racial discrimination, but little attention appeared to be placed on asserting the need for services to comply.
7.4 At risk groups
There are many factors that place children at risk, both in the short term and across their lifetimes. Here, 5 are considered that have particular bearing on participation in child care and with respect to the contribution that child care can make in increasing their future engagement in education, work and society more generally.
7.4.1 Indigenous children
The transition experience of Aboriginal and Torres Strait Islander children has been considered in Section 6.5.3. This concluded that while there had been an increase in participation in child care, the level of this increase was not inconsistent with longer term trends, but that there were significant data issues including the reclassification of Indigenous status in the DESE data at the time of the introduction of the package. Section 6.7.2 had identified that these children were disproportionately represented among those who only had eligibility for 24 hours of subsidy per fortnight. Table 86 has previously highlighted the much lower rates of participation in child care for Aboriginal and Torres Strait Islander children whose parents are in receipt of FTB. Specifically, the table shows that:
- Rates of child care use by Aboriginal and Torres Strait Islander children in this population are very substantially below those of non-Indigenous children (less than two-thirds for below school age and only half for school age).
- Although the impact of the package is a little more positive for Aboriginal and Torres Strait Islander children than for children overall, in both of the age groups considered, this only very marginally reduces the imbalance in participation.
Table 91 addresses a range of aspects of the participation of Aboriginal and Torres Strait Islander children in child care, relative to non-Indigenous children:
- In broad terms, the pattern of child care use by service type is little different for younger children, but for those aged 5 years and over, there is a tendency to use Centre Based Day Care more frequently and to be under-represented in Outside School Hours Care.
- The data indicates that only 4.1 per cent of Aboriginal and Torres Strait Islander children using child care in Q4 2019 did so at a service that was previously Budget Based Funded. (The estimate of only 40.7 per cent of the children attending these services identifying as Aboriginal or Torres Strait Islander is likely to reflect the inclusion of some categories of services that were not primarily targeted at Indigenous children; under-identification of Indigeneity in the data, and the extent to which a number of these services are targeting more broadly, as discussed in Chapter 9.)
- Aboriginal and Torres Strait Islander children are much less likely to attend a child care service that has been highly rated under the National Quality Standards.
- They are much more likely to be attending services in smaller urban and in non-urban locations and are more highly concentrated in those services in more disadvantaged areas as measured by the SES of the service location.
- Overall, there is little difference in the hours or weeks of care used by Indigenous and non-Indigenous children.
| Aboriginal and Torres Strait Islander Children | Non-Indigenous | Proportion who are Aboriginal and Torres Strait Islander Children | |
|---|---|---|---|
| Distribution (%) | Proportion (%) | ||
| Under 5 years | |||
| CBDC | 92.1 | 91.9 | 4.0 |
| FDC | 7.7 | 7.6 | 4.1 |
| OSHC | 0.2 | 0.4 | 2.1 |
| IHC | 0.1 | 0.1 | 2.8 |
| 100.0 | 100.0 | 4.0 | |
| 5 years and over | |||
| CBDC | 33.6 | 22.2 | 4.2 |
| FDC | 5.1 | 6.8 | 2.1 |
| OSHC | 61.0 | 70.8 | 2.4 |
| IHC | 0.2 | 0.2 | 3.7 |
| 100.0 | 100.0 | 2.8 | |
| Former BBF a | 4.1 | 0.2 | 40.7 |
| Not | 95.9 | 99.8 | 3.3 |
| Total | 100.0 | 100.0 | 3.5 |
| ACECQA rating (excludes pending) | |||
| Significant Improvement | 0.2 | 0.1 | 7.9 |
| Working Towards NQS | 22.9 | 21.2 | 3.6 |
| Meeting NQS | 55.7 | 52.6 | 3.5 |
| Exceeding NQS /Excellent | 21.2 | 26.1 | 2.7 |
| Total | 100.0 | 100.0 | 3.4 |
| Urban and regional location | |||
| Capital Cities | 40.7 | 70.3 | 2.0 |
| Urban 100k plus | 20.7 | 13.2 | 5.3 |
| Urban 50k-<100k | 7.4 | 4.2 | 6.0 |
| Urban 20k-<50k | 11.3 | 4.2 | 8.8 |
| Urban 10k-<20k | 5.0 | 2.0 | 8.3 |
| Inner Regional | 5.3 | 3.7 | 4.9 |
| Outer Regional | 6.4 | 2.1 | 10.0 |
| Remote | 1.0 | 0.2 | 13.9 |
| Very Remote | 2.2 | 0.2 | 26.7 |
| Total | 100.0 | 100.0 | 3.5 |
| Service locational SES | |||
| Lowest | 18.6 | 7.4 | 8.3 |
| 2 | 12.8 | 6.4 | 6.8 |
| 3 | 14.2 | 8.0 | 6.0 |
| 4 | 12.0 | 8.3 | 4.9 |
| 5 | 10.8 | 9.5 | 3.9 |
| 6 | 10.6 | 10.9 | 3.4 |
| 7 | 7.8 | 12.4 | 2.2 |
| 8 | 6.4 | 11.3 | 2.0 |
| 9 | 4.3 | 13.4 | 1.2 |
| Highest | 2.4 | 12.3 | 0.7 |
| Total | 100.0 | 100.0 | 3.5 |
| Hours per quarter | 259.1 | 274.2 | |
| Weeks in quarter | 10.7 | 10.7 | |
Note: a Includes Non-formula Funded, Occasional Care and Indigenous Advancement Strategy Services.
Source: DESE administrative data
Figure 111 illustrates the rate of participation in child care of Aboriginal and Torres Strait Islander children whose parents are in receipt of FTB by location in the fourth quarter of 2017, 2018 and 2019. In addition to illustrating that there are very wide variations by location, this suggests some, although not wholly consistent, trends to increasing participation among these children. It should be noted though that these results and, in particular, those for more remote areas, are impacted by the inclusion of former BBF services in the data from July 2018.
Figure 111: Child care use by Aboriginal and Torres Strait Islander children, children in families in receipt of FTB, by urban and regional location, Q4 2017, 2018 and 2019
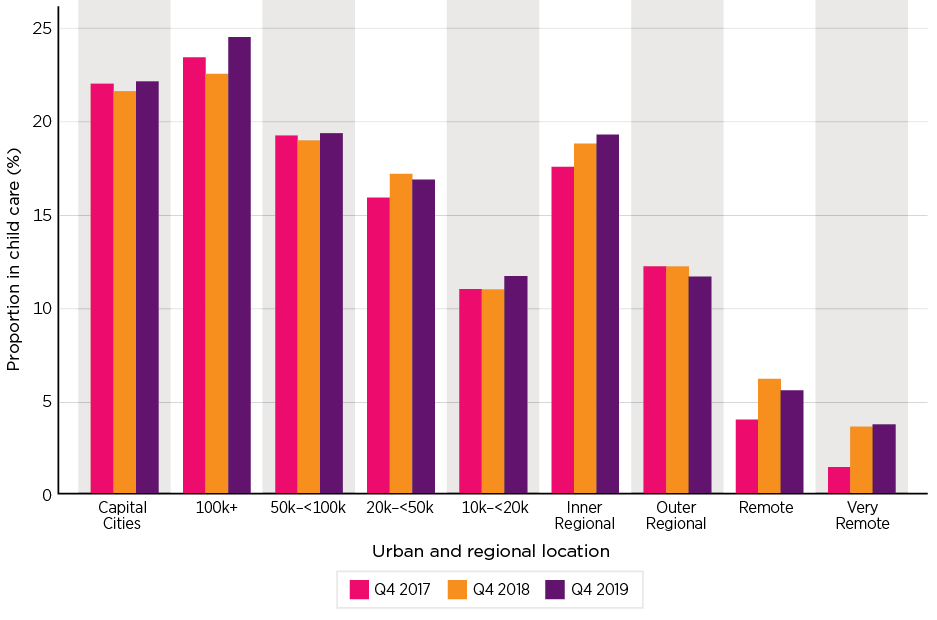
Note: See note on Table 6 for a description of the urban and regional location variable.
Source: DESE and DSS administrative data
7.4.2 Former BBF Services
The role of former BBF services in providing child care to Aboriginal and Torres Strait Islander children has been identified above in the discussion of the ACCS, and these services, as well as the role of the CCCF, are discussed in Chapter 9. As noted, while these services play a relatively small role in total provision of care to Indigenous children, in some locations, they are the only service available and, in many cases, they have been developed to specifically meet the needs of Indigenous communities and the children who live in them. As shown later in Table 95, these services play a particularly significant role in remote and very remote locations.
The qualitative feedback received by the evaluation was dominated by concerns about the impact of the policy changes on this model of care:
This has multiple negative implications for services to Aboriginal and Torres Strait Islander children including: excluding many of the most vulnerable children from receiving a service; services becoming less safe and comfortable to access for Aboriginal and Torres Strait Islander families; and services losing their unique focus on supporting children to grow up strong knowing and valuing their cultural identity. It can therefore be said that the Package is jeopardising the integrated early education and care and family support model that characterises Aboriginal and Torres Strait Islander early years education and care services, to address family support and maternal and child health needs. This is extremely concerning because it is vital that Aboriginal and Torres Strait Islander services continue to be in a financial position to deliver the holistic services that set them apart, and that is fundamental to meet the needs of our most vulnerable families.
[Child care stakeholder, August 2019]
This sentiment was equally echoed by services that had sought to refocus their business model:
I've been working to support Aboriginal early childhood programs for the last 15 years; it has completely turned the whole notion of the close the gap agreement on its head. [The new policy says] … early childhood programs are not for all children. They are for working families. And in a context like this, that means the wealthy families. [I think] all families are entitled to access services. I think all families should. It's great that we've been able to boost up our numbers. But it still remains that the disengaged families, the families who could use more support, are really taking a back seat. Because the whole funding stream prioritises the working families.
[CBDC provider (former BBF), September 2019]
These fairly negative perspectives are consistent with reporting in SELCS in which, of the former BBF services, 35.9 per cent thought the changes to child care assistance had had a large negative impact on their service and 29.1 per cent a small negative impact. Another 4.1 per cent reported the changes had had no impact, while 23.6 per cent reported they had a small positive impact and 5.6 per cent reported they had a large positive impact. By way of example of 2 services that had reported a positive impact, the following quotes show some of the complexities for these services and the families that use them.
It's working well for us as an organisation, just need the parents to catch up to the new system so they're not so stressed. Could be a great system if people knew how to work it properly.
[CBDC provider (former BBF), July 2019]
Overall, having one subsidy paid to the services is a positive but the activity test is really harsh, particularly for families in rural and isolated communities where there is low employment - makes it really difficult. It has given this service the opportunity to expand but because the administration time is so large, it has also been difficult and cost money in terms of hours spent adhering to administrative requirements.
[CBDC provider (former BBF), July 2019]
7.4.3 Children with parents born outside of Australia
While children whose parents are born outside of Australia are not necessarily vulnerable, some subgroups within this population are. Defining these is, however, difficult and across this evaluation several approaches have been used including children from non-English speaking and CALD (Culturally and Linguistically Diverse) backgrounds, and children whose parents' visas have been issued on humanitarian grounds.
As seen in Section 7.2.1, while the package is associated with an increase in the rate of use of child care by children aged under 5 years from a non-English speaking background, it was equally associated with a fall for those children whose parents held a humanitarian visa. At the same time, however, the analysis highlights the extent to which child care appears to be used at a lower rate for younger children and a higher rate for older children relative to the population as a whole. Section 3.3.3 had discussed the problems of parents who do not speak English in dealing with administrative processes and Centrelink, and Section 6.7.2 has noted how children of parents who speak a language other than English at home have markedly fewer approved hours of subsidised care than those who use English.
Issues raised relating to child care access by CALD families in the evaluation centred on 2 key themes. One related to difficulties understanding, and therefore accessing, child care assistance due to literacy challenges. For example, in terms of access to child care assistance, many services interviewed in 2019 reported particular difficulties faced by CALD families accessing myGov, and this included experiences beyond the initial transition period. The other related to perceived limitations of the 6-hour sessions, or the amount of subsidised care families had access to via the low income exemption to the activity tests. Issues raised about the perceived inadequacy of subsidised care for those that do not meet the activity test were considered even more critical for children from a non-English speaking background. Some services reported that it was more common in some migrant families for the mother to stay home while the father worked, and that these families hence only had access to the base 24 hours of care per fortnight. Service providers were concerned that this had implications for children's English language acquisition as well as making their transition to school more difficult.
This is important given the identified role of child care as providing opportunities for children from newly arrived families or those with limited English language proficiency to improve English proficiency and school readiness (Park et al., 2018, p. 11). It also can provide a means for families to connect with the community, and the availability of child care is also important so that parents/carers can access English language programs, which are considered essential to the successful settlement process in Australia (Refugee Council of Australia, 2019).141
This section considers some of the issues with a focus on the patterns of participation of children in child care on the basis of their parents' country of birth. Table 92 presents, for children whose parents are in receipt of FTB, the rate of use of child care by the region of birth of the claimant parent. It shows a very wide divergence in use. For children aged under 5 years, the rate of child care use, which is 40.2 per cent for Australian born parents, ranges from 14.6 per cent for those children with a parent born in Polynesia to 55.1 per cent for those with a parent born in Eastern Asia.142 For those with older children, the rate of usage varies from 8.0 per cent for those parents born in Polynesia to 29.4 per cent for those born in Northern America, again compared with the Australian-born rate of 17.6 per cent.
| Region of birth of claimant parent: | Under 5 years | 5-12 years | ||
|---|---|---|---|---|
| Population ('000) | In child care (%) | Population ('000) | In child care (%) | |
| Australia | 482.2 | 40.2 | 809.9 | 17.6 |
| New Zealand | 26.2 | 35.4 | 46.8 | 17.0 |
| Melanesia | 4.9 | 36.8 | 9.7 | 17.3 |
| Polynesia | 5.5 | 14.6 | 12.6 | 8.0 |
| Northern Africa | 8.6 | 44.7 | 14.5 | 24.2 |
| Western Africa | 2.9 | 50.1 | 3.7 | 27.8 |
| Eastern Africa | 10.7 | 40.6 | 15.4 | 26.8 |
| Middle Africa | 2.3 | 28.9 | 3.2 | 22.4 |
| Southern Africa | 3.4 | 46.4 | 5.5 | 24.4 |
| Northern America | 1.0 | 47.7 | 1.6 | 29.4 |
| South America | 3.2 | 49.3 | 4.9 | 25.2 |
| Central America & Caribbean | 0.8 | 36.5 | 1.6 | 18.0 |
| Eastern Asia | 33.1 | 55.1 | 41.2 | 24.2 |
| Southern Asia | 67.5 | 32.3 | 72.6 | 17.7 |
| South-eastern Asia | 35.3 | 34.4 | 60.9 | 13.5 |
| Central Asia | 1.9 | 17.1 | 3.6 | 12.1 |
| Western Asia | 22.1 | 33.7 | 43.4 | 18.3 |
| Southern Europe | 4.6 | 35.2 | 7.7 | 14.0 |
| Eastern Europe | 3.7 | 42.1 | 7.0 | 21.8 |
| Northern Europe | 13.8 | 49.8 | 28.3 | 23.9 |
| Western Europe | 2.7 | 47.0 | 5.0 | 23.5 |
| Total | 736.5 | 39.5 | 1199.0 | 18.0 |
Note: Excludes children whose parents' country of birth is missing.
Source: DESE and DSS administrative data
While these participation rates may reflect a wide range of factors, including cultural values and traditions as well as different labour force experiences, from the wider early childhood education perspective it raises a number of different questions concerning the extent to which child care is being accessed by vulnerable children, and how these children are effectively engaged.
A second perspective on child care use by these children is given in Table 93, which shows the types of child care used by them when they do use it.
| Region of birth of claimant parent: | Under 5 years | 5-12 years | ||||||||
|---|---|---|---|---|---|---|---|---|---|---|
| CBDC | FDC | OSHC | IHC | Total | CBDC | FDC | OSHC | IHC | Total | |
| Distribution (%) | ||||||||||
| Australia | 91.9 | 7.6 | 0.3 | 0.2 | 100.0 | 23.6 | 6.1 | 69.9 | 0.4 | 100.0 |
| New Zealand | 89.6 | 10.0 | 0.4 | 0.1 | 100.0 | 22.1 | 11.8 | 65.9 | 0.3 | 100.0 |
| Melanesia | 91.9 | 7.6 | 0.2 | 0.3 | 100.0 | 24.6 | 9.2 | 66.1 | 0.1 | 100.0 |
| Polynesia | 73.1 | 26.9 | 0.0 | 0.0 | 100.0 | 12.4 | 63.4 | 24.2 | 0.0 | 100.0 |
| Northern Africa | 75.5 | 24.4 | 0.1 | 0.1 | 100.0 | 10.3 | 69.5 | 20.0 | 0.2 | 100.0 |
| Western Africa | 75.3 | 24.3 | 0.1 | 0.3 | 100.0 | 13.5 | 55.2 | 31.3 | 0.1 | 100.0 |
| Eastern Africa | 62.8 | 36.9 | 0.2 | 0.1 | 100.0 | 7.6 | 69.4 | 22.9 | 0.1 | 100.0 |
| Middle Africa | 51.5 | 48.4 | 0.0 | 0.2 | 100.0 | 6.9 | 83.6 | 9.3 | 0.3 | 100.0 |
| Southern Africa | 91.5 | 7.7 | 0.7 | 0.1 | 100.0 | 17.6 | 3.2 | 79.0 | 0.2 | 100.0 |
| Northern America | 92.8 | 6.5 | 0.4 | 0.2 | 100.0 | 14.1 | 2.6 | 82.7 | 0.7 | 100.0 |
| South America | 95.3 | 4.0 | 0.7 | 0.0 | 100.0 | 16.8 | 2.8 | 80.5 | 0.0 | 100.0 |
| Central America & Caribbean | 93.2 | 5.7 | 1.1 | 0.0 | 100.0 | 13.3 | 10.0 | 75.6 | 1.1 | 100.0 |
| Eastern Asia | 92.0 | 7.6 | 0.4 | 0.0 | 100.0 | 22.9 | 10.5 | 66.5 | 0.1 | 100.0 |
| Southern Asia | 83.9 | 15.8 | 0.2 | 0.1 | 100.0 | 16.6 | 37.3 | 46.0 | 0.1 | 100.0 |
| South-eastern Asia | 88.5 | 11.1 | 0.4 | 0.1 | 100.0 | 19.0 | 18.8 | 62.2 | 0.0 | 100.0 |
| Central Asia | 70.9 | 28.8 | 0.3 | 0.0 | 100.0 | 9.5 | 62.7 | 27.8 | 0.0 | 100.0 |
| Western Asia | 84.1 | 15.7 | 0.1 | 0.1 | 100.0 | 10.8 | 70.6 | 18.5 | 0.1 | 100.0 |
| Southern Europe | 96.2 | 3.3 | 0.3 | 0.3 | 100.0 | 20.6 | 6.1 | 73.1 | 0.2 | 100.0 |
| Eastern Europe | 94.0 | 5.6 | 0.4 | 0.0 | 100.0 | 19.1 | 3.0 | 78.0 | 0.0 | 100.0 |
| Northern Europe | 92.4 | 6.4 | 0.9 | 0.3 | 100.0 | 16.9 | 3.0 | 79.7 | 0.4 | 100.0 |
| Western Europe | 91.1 | 8.4 | 0.6 | 0.0 | 100.0 | 19.0 | 4.1 | 76.5 | 0.4 | 100.0 |
| Total | 90.1 | 9.5 | 0.3 | 0.1 | 100.0 | 21.3 | 14.2 | 64.1 | 0.3 | 100.0 |
Note: Type of child care is the main care type used by child within the quarter. Excludes children whose parents' country of birth is missing.
Source: DESE and DSS administrative data
A key feature in this data is the variation in the use of Family Day Care. While, on average, this was used by 9.5 per cent of all children aged under 5 years who used child care, the proportion varied across countries of birth from 3.3 per cent to 48.4 per cent. For the older group of children, this sector accounted for 14.2 per cent of care, varying, however, from 2.6 per cent to 83.6 per cent.
While these results again may reflect cultural practices, consideration of the full role of child care in child development, in preparation for ongoing learning, and in achieving social engagement raises some significant questions. A further question is the extent to which the language issues, seen more generally with regard to navigating child care systems, may also play a role in terms of the level of support that can be provided by the different care sectors to parents in working through these processes.
7.4.4 Children with health and related conditions
As detailed in Table 86, 1.8 per cent of children aged 0-4 years, and 7.2 per cent of those aged 5-12 years, whose parents are in receipt of FTB, have an identified medical condition on their DSS FTB record.143 For both age groups, the rate of participation in child care reported for these children is above that of other children, with this being particularly marked in the 0-4 year age group where, using the post-package modelling, 48.5 per cent of these children are in child care, compared with 39.5 per cent of those without a medical condition. Some caution, however, is needed in interpreting this data in that, as identified in evaluation work on the Inclusion Support Program, there is some evidence to suggest that the identification of child medical and related conditions in some cases occurs in the first instance in the child care setting by educators who can observe the child and their activities relative to other children and with the benefit of their professional training. The data shows that the relative post-package participation of younger children with an identified condition was 0.6 percentage points higher than the pre-package rate - a stronger increase than the 0.2 per cent for those without an identified condition, but the fall in the rate of participation for older children with a condition of 1.0 percentage points, was higher than that for those with no condition.144
Table 94 presents the child care participation rates for these children in Q4 2019 by specific health condition. It presents them for 3 age groups to reflect both the differential level of diagnosis and incidence of medical conditions by age and variation in the rate of use of child care. For each of the 3 age groups the rate of engagement with child care by those with a diagnosed condition was a little higher than for those without. The data also shows quite large variations in participation by various conditions. This can be ascribed to a range of factors:
- the extent to which conditions may only be identified when the child participates in child care
- the degree to which some conditions may limit a child's capacity to participate in child care, notwithstanding the objective of inclusive care in ensuring that barriers to participation are addressed
- the degree to which the identification of a medical condition in this data is for the purposes of the determination of support through programs such as Carer Payment that, in turn, has conditions related to the provision of care by the person in receipt of the payment.
It may also reflect differences in the need for child care by these groups. In particular, it is noted that the levels of care used by older children with a range of behavioural and related conditions is somewhat above that of other children. This may be as a result of parents viewing child care - typically in this age group - outside school hours care as being more important for these children.
| Identified medical condition a | Under 5 years | 5-9 years | 10-12 years | |||
|---|---|---|---|---|---|---|
| Population ('000) | In child care (%) | Population ('000) | In child care (%) | Population ('000) | In child care (%) | |
| Ment/behav. - ADD | 0.1 | 64.8 | 4.5 | 25.3 | 4.8 | 10.7 |
| Ment/behav. - Autism | 4.6 | 58.9 | 25.6 | 23.3 | 19.1 | 12.2 |
| Ment/behav. - Intellect/Low IQ | 0.2 | 58.7 | 1.3 | 18.7 | 1.5 | 10.3 |
| Ment/behav. - Learning difficulty | 0.9 | 60.1 | 3.2 | 23.9 | 1.2 | 11.0 |
| Ment/behav. - Anxiety/Depress | 0.0 | 50.0 | 0.7 | 25.0 | 0.9 | 10.5 |
| Ment/behav. - Other | 0.2 | 62.8 | 1.2 | 26.7 | 0.8 | 10.7 |
| Musculo-skeletal | 0.3 | 45.1 | 0.5 | 22.3 | 0.3 | 10.8 |
| Nervous system - Cerebral Palsy | 0.5 | 41.4 | 1.0 | 17.0 | 0.6 | 7.2 |
| Nervous system - Epilepsy | 0.4 | 40.0 | 1.1 | 18.8 | 0.9 | 10.2 |
| Nervous system - Other | 0.4 | 31.2 | 0.8 | 16.7 | 0.6 | 6.8 |
| Circulatory | 0.1 | 35.0 | 0.1 | 15.8 | 0.0 | 9.8 |
| Respiratory - Asthma | 0.1 | 65.8 | 0.6 | 21.6 | 0.5 | 10.9 |
| Respiratory - Other | 0.7 | 36.4 | 0.6 | 25.9 | 0.3 | 12.0 |
| Neoplasms | 0.3 | 28.5 | 0.6 | 18.1 | 0.4 | 7.1 |
| Endocrine, Digest, etc. - Diabetes | 0.2 | 41.6 | 0.8 | 15.8 | 1.0 | 8.1 |
| Endocrine, Digest, etc. - Other | 0.6 | 42.0 | 0.8 | 19.0 | 0.6 | 9.6 |
| Ear/Eye - Vision | 0.2 | 41.5 | 0.4 | 22.0 | 0.3 | 11.7 |
| Ear/Eye - Hearing | 0.6 | 49.0 | 1.1 | 22.5 | 0.8 | 11.5 |
| Congenital and perinatal | 1.6 | 37.4 | 2.5 | 18.9 | 1.6 | 9.7 |
| Injury/External causes | 0.0 | 43.2 | 0.1 | 19.8 | 0.1 | 12.5 |
| NEC - Speech disorder | 0.3 | 59.0 | 1.3 | 23.1 | 0.5 | 10.7 |
| NEC - Other | 0.6 | 38.7 | 1.1 | 18.4 | 0.9 | 8.8 |
| Any medical condition | 13.0 | 49.0 | 49.9 | 22.5 | 37.7 | 11.2 |
| No Medical condition | 723.6 | 39.4 | 703.0 | 23.1 | 408.6 | 9.3 |
| Total | 736.7 | 39.5 | 752.9 | 23.0 | 446.3 | 9.4 |
Notes: a The detailed medical and disability codes recorded on the FTB file have been recoded into a classification structure derived from the ICD-10.145
Source: DESE and DSS administrative data
7.4.5 Locational disadvantaged
Participation by location
Data in this evaluation has identified considerable variation in the provision and use of child care across Australia. To what degree this represents advantage or disadvantage in the provision of care relative to other factors, including different preferences, or reflects common roots such as economic inequality is challenging. These issues cannot be resolved here; however, the findings do suggest a need for greater consideration of these questions.
In other sections of the report it has been noted that participation in child care varies significantly across locations (Section 6.3); there is a concentration of the highest quality services in the major urban areas relative to regional locations and, in particular, remote and very remote areas (Section 2.2.1); there are marked differences in the use of unsubsidised hours of care (Section 4.2.5); and the pattern of volatility across services at the point of transition suggested more stable outcomes in the capitals and major urban areas (Section 6.5.2). A similarly wide range of findings have been found by the socio-economic advantage or disadvantage of locations.
In Section 7.2.1 it was seen that the impact of the package on participation varied by regions, with more positive impacts in remote and very remote locations, and for younger children a small adverse impact for those living in towns and cities with a population of 10,000-20,000 people.
Table 95 and Table 96 present some of the key characteristics of service provision by location, firstly on the basis of the regional classification and then by the socio-economic status of the location. In both cases, the data is based on the location of the service. As, however, has been noted previously, while this is a good basis for classification for most services, it has limitations for some Family Day Care and In Home Care services where these are delivered to a range of locations from a service that is centrally based in another location.
By geographic location it can be seen that:
- Most children who utilise child care are in the capital cities and 83.1 per cent live either in the capitals or in other urban centres with a population of over 100,000 people.
- The composition of service type varies by location. Notable is the much stronger role for Centre Based Day Care in remote and very remote locations. The size of services also varies by location. In particular, services in regional areas are smaller than those in urbanised locations.
- There is a gradient in the extent to which services are provided by for-profit providers - while these provide 68.3 per cent of care in the capitals, this share falls to just 9.2 per cent in very remote locations.
- There is a similar, although less consistent, gradient in terms of the proportion of services rated as 'Exceeding the NQS', with the proportion being higher in the more urbanised locations.
- Former BBF and similarly funded services are much more prevalent in remote and very remote locations.
| Urban and regional locationa | Proportion of children | Service type | Proportion For-profit | Proportion ACECQA 'Exceeding' | Former BBF b | Average size | |||
|---|---|---|---|---|---|---|---|---|---|
| CBDC | FDC | OSHC | IHC | ||||||
| (%) | Distribution (%) | (%) | (%) | (%) | Children | ||||
| Capital Cities | 69.6 | 60.4 | 3.6 | 35.8 | 0.3 | 68.3 | 23.7 | 0.3 | 91.0 |
| Urban 100k plus | 13.5 | 65.3 | 2.3 | 32.3 | 0.1 | 62.0 | 23.8 | 0.1 | 97.6 |
| Urban 50k-<100k | 4.2 | 58.6 | 3.9 | 36.9 | 0.5 | 52.4 | 21.4 | 0.4 | 90.1 |
| Urban 20k-<50k | 4.4 | 61.8 | 5.3 | 32.0 | 0.9 | 51.8 | 21.5 | 2.0 | 90.8 |
| Urban 10k-<20k | 2.1 | 61.5 | 6.9 | 30.9 | 0.7 | 50.3 | 16.9 | 3.8 | 86.2 |
| Inner Regional | 3.6 | 55.5 | 3.9 | 40.5 | 0.1 | 50.0 | 15.8 | 1.7 | 63.3 |
| Outer Regional | 2.1 | 63.6 | 5.4 | 30.4 | 0.7 | 34.7 | 18.6 | 3.4 | 55.6 |
| Remote | 0.2 | 76.1 | 4.2 | 18.3 | 1.4 | 16.9 | 17.5 | 11.3 | 39.5 |
| Very Remote | 0.3 | 76.7 | 1.7 | 20.0 | 1.7 | 9.2 | 6.8 | 45.0 | 26.4 |
| Total | 100.0 | 61.1 | 3.6 | 35.0 | 0.4 | 63.0 | 22.7 | 1.1 | 88.2 |
Notes: a Geographic location of service, regional classification as per Table 6. b Includes IAS and NFF-OCC.
Source: DESE administrative data, ACECQA overall rating Q4 2019
The distribution of child care provision by the socio-economic advantage and disadvantage of locations shows that:
- Notwithstanding the overall equal total population sizes of the deciles of locations, lower ranked locations, in particular the first and second deciles, account for a much smaller proportion of children attending child care.
- Centre Based Day Care services represent a greater share of provision in lower ranked locations, with Outside School Hours Care services being more likely to be in the upper half of the ranking of locations.
- The not-for-profit sector plays a more important role in lower ranked locations, although across all deciles, the majority of services are in the for-profit sector.
- There is a very distinct quality gradient. In the lowest ranked decile of locations just 17.6 per cent of services are rated as 'Exceeding'. This contrasts with the 30.4 per cent of services in the most advantaged locations.
- Reflecting the relationship between socio-economic advantage and regional locations, former BBF services are highly concentrated in the bottom decile of locations.
| Socio-economic decile a | Proportion of children | Service type | Proportion For-profit | Proportion ACECQA 'Exceeding' | Former BBF b | Average size | |||
|---|---|---|---|---|---|---|---|---|---|
| CBDC | FDC | OSHC | IHC | ||||||
| (%) | Distribution (%) | (%) | (%) | (%) | Children | ||||
| Lowest | 7.7 | 64.6 | 8.4 | 26.4 | 0.6 | 56.1 | 17.6 | 5.8 | 77.2 |
| 2 | 6.4 | 62.1 | 5.3 | 32.3 | 0.3 | 57.1 | 17.7 | 1.1 | 74.3 |
| 3 | 8.2 | 64.2 | 5.0 | 30.6 | 0.3 | 54.5 | 19.0 | 1.3 | 81.1 |
| 4 | 8.5 | 62.8 | 4.5 | 32.4 | 0.3 | 59.6 | 18.7 | 1.4 | 85.4 |
| 5 | 9.4 | 60.1 | 4.2 | 35.1 | 0.6 | 60.1 | 21.6 | 0.9 | 87.2 |
| 6 | 10.8 | 58.4 | 3.4 | 38.1 | 0.1 | 66.0 | 21.1 | 0.4 | 91.8 |
| 7 | 12.3 | 60.7 | 3.0 | 36.1 | 0.3 | 64.6 | 23.6 | 0.1 | 94.4 |
| 8 | 11.2 | 61.6 | 2.1 | 36.2 | 0.1 | 67.6 | 23.8 | 0.4 | 92.5 |
| 9 | 13.2 | 58.5 | 1.2 | 39.7 | 0.6 | 68.2 | 27.8 | 0.4 | 96.9 |
| Highest | 12.3 | 59.7 | 1.4 | 38.6 | 0.3 | 69.4 | 30.4 | 0.1 | 91.4 |
| Total | 100.0 | 61.1 | 3.6 | 35.0 | 0.4 | 63.0 | 22.7 | 1.1 | 88.2 |
Notes: a ABS SEIFA Advantage/Disadvantage 2016, based on location of service. b Includes IAS and NFF-OCC.
Source: DESE administrative data, ACECQA overall rating Q4 2019
The variation in participation by location has been noted above and is illustrated in Figure 112. For younger children, the rate is highest across the more urbanised locations, peaking for those non-capital cities with populations of 20,000-50,000 people. Particularly marked is the decline across non-urban locations, with the rate of participation in very remote locations, of 19.7 per cent, being under one third of that in towns of 20,000-50,000 people. The pattern for older children is somewhat different and shows the highest levels of participation in the capitals and other cities with populations of over 100,000 people but, in this case, a decline across smaller urban locations, and then across non-urbanised regional locations.
Chapter 4 has presented modelling of the impact of the introduction of the CCS on the affordability of child care for families. One simple measure from this is the distribution of families by whether the policy had a positive, negative or neutral impact on their costs. The distribution of these by geographic location is shown in Figure 113. This shows a very distinct pattern:
- Families in non-capital city urban locations and in inner and outer regional locations had a higher than average likelihood of a gain and lower than average chance of negative impacts.
- Families in capital cities were a little less likely than average to have gains and a little more likely to have a negative outcome.
Relatively higher levels of negative outcomes were estimated for families in 'Remote' and, in particular, 'Very remote' locations with, in these latter locations, just 46.2 per cent recording a positive outcome from the impact of the introduction of the CCS.
Figure 112: Proportion of children aged 0-4 years and 5-9 years attending child care by urban and regional location, Q4 2019
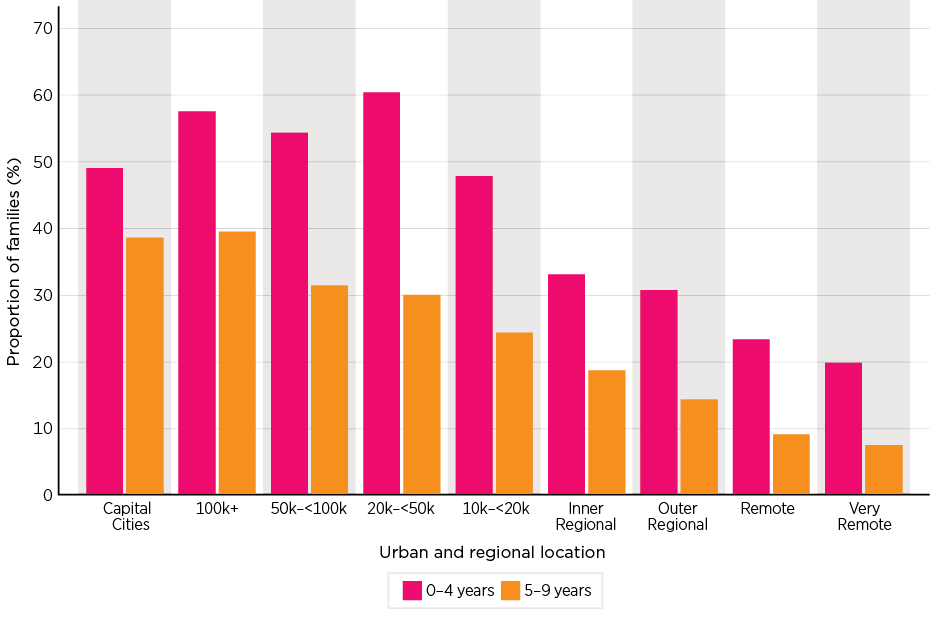
Notes and source: As per Figure 65. See note on Table 6 for a description of the urban and regional location variable.
Figure 113: Financial impact of child care package, by urban and regional location, 2018-19
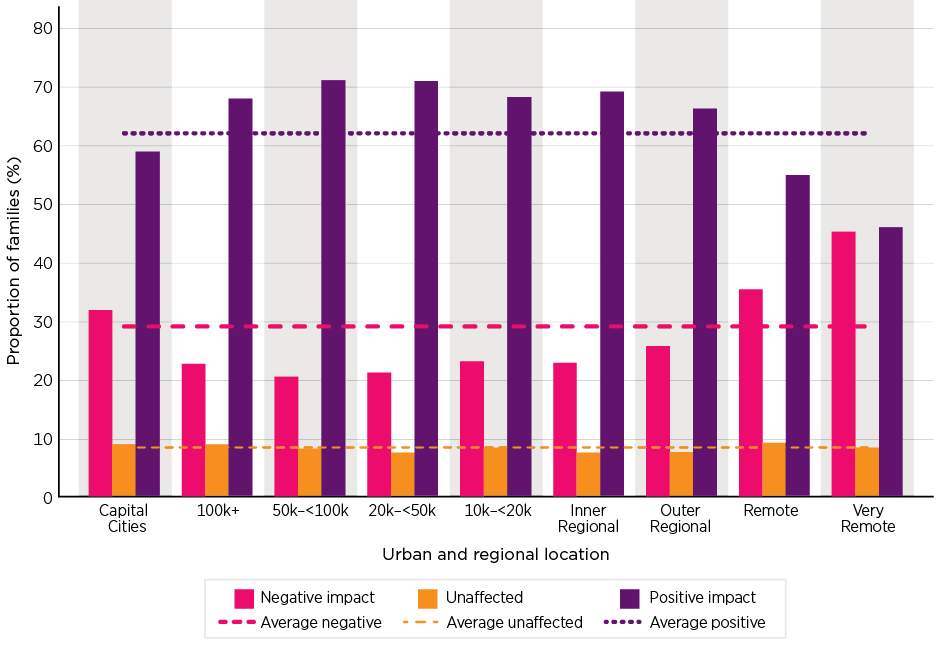
Notes and Source: As per Figure 48. See note on Table 6 for a description of the urban and regional location variable.
7.5 In Home Care cohorts
7.5.1 In Home Care: Children with complex or challenging needs
Families with complex or challenging needs are the most common cohort of families using In Home Care (494 of the 1,067 families, or 46.3 per cent of families, in December 2019). Children covered by this eligibility for In Home Care may include: children with additional needs that cannot be catered to in other child care settings; families where a parent or other family member has a serious health condition where other types of approved child care are not appropriate (e.g. a family member is immuno-compromised); or the family is experiencing challenging circumstances such as displacement due to a natural disaster.
With the alignment of In Home Care to the broader Child Care Package, educators are required to have a minimum Certificate III level qualification in a relevant early childhood education course or to be working towards this qualification. In general, the introduction of these qualification requirements to In Home Care was seen as a positive step for the sector in terms of helping to address the quality of In Home Care (Baxter et al., 2020). Before the introduction of the Child Care Package, some In Home Care educators providing child care to families with complex or challenging needs were not qualified with an early childhood education qualification, but instead had qualifications in areas such as nursing, social work or disability and sometimes had years of experience providing care to these families. Some of these educators were not willing or able to undertake further training to gain the required early childhood education qualifications and so stopped working as educators when the new program was introduced. This left some of these families without an In Home Care educator, so contributing to one of the key challenges of the In Home Care program, that of there being sufficient suitably qualified educators available to deliver the program.
The introduction of the revised In Home Care program saw a renewed focus on In Home Care being for early childhood education and care, rather than other forms of parenting or family support. Across the In Home Care evaluation data collections with services, stakeholders and families, there were concerns that this renewed focus on early childhood education and care had led to gaps in service provision for families with challenging and complex needs, and such gaps would not always be met by the NDIS. However, a role of the IHC Support Agencies, which were introduced with the revised program, is to develop links with other services and supports, to enable referrals to be made for families whose needs cannot be met at all, or only partially, through the In Home Care program.
This includes establishing referrals from other organisations to In Home Care, and connecting those who have sought In Home Care to other resources as appropriate. Although families using In Home Care often use services other than In Home Care, many report still having a continuing need for services. This is especially so for families with complex and challenging circumstances who require a range of services sometimes not only for the child but also to support the parents themselves.
Overall, the case management of families with complex needs is a gap in service provision for these families, with the In Home Care Support Agencies having a role in referring and connecting families to services but not having an ongoing case management role. In particular, there is still some lack of clarity about how the NDIS and IHC complement each other, such that families as well as IHC services and IHC Support Agencies have found the intersection between NDIS and IHC to be unclear and difficult to navigate. With the revised IHC program having been introduced at the same time as the progressive rollout of the NDIS across Australia, it is perhaps not surprising that there has been some lack of clarity in the roles of IHC versus the NDIS and how they complement each other.
7.5.2 In Home Care: Children in geographically isolated areas
Also relevant to rural and remote families is the provision of In Home Care, with one of the cohorts supported through this program being families living in geographically isolated areas, where children do not have access to other mainstream care options. In December 2019, 171 families/463 children were using In Home Care for this reason. As was the case for the In Home Care program in general, for this cohort there were challenges for families and for services in recruiting appropriately qualified educators, leaving some families on the waiting list for In Home Care as they and their service had not been able to locate an educator.
7.6 Impact of the Child Care Package on vulnerable children and families
Overall, the introduction of the Child Care Package has had little impact on access to child care across Australia, with the analysis suggesting an increase of 0.2 percentage points for children aged 0-4 years, and a fall of 0.6 of a percentage point for children aged 5-12 years. There are few consistent trends by population subgroups but some data suggests more negative outcomes for single parents on full-rate income support and for couples with full- or part-rate income support. Relatively poorer outcomes were recorded by children of parents on Humanitarian visa classes, while a more positive outcome was recorded by Aboriginal and Torres Strait Islander children. These groups also all had a higher propensity to have only 24 hours of approved care per fortnight.
Although the ACCS can be seen as being broadly effective, fewer than 4 in 10 services reported that they considered vulnerable families were better off under ACCS than the previous support. A number of issues are identified with the program. From a service perspective for ACCS (Child Wellbeing) this includes some significant concerns about administrative processes related to preparing, then regularly updating, the applications. Many services were quite confident in their ability to talk to families and make appropriate referrals, but more than half of the services who had processed ACCS applications reported that at least one element of the process (collecting evidence for a determination, applying for a determination or issuing a certificate) was difficult. There are also concerns about lack of flexibility when urgent demands for ACCS-supported child care arise, the timeliness of the process, and some specific issues in using ACCS (Child Wellbeing) processes to support Aboriginal and Torres Strait Islander families. For other ACCS types, there are some concerns about the capacity of parents or carers to be able to navigate access to ACCS when they are experiencing vulnerabilities or hardships. With regard to the scope of the program, a particular issue arises for informal kinship care.
More generally, while access levels close to overall community rates are achieved by some vulnerable groups, including for children with identified health conditions, for others there are significant gaps. This includes:
- Aboriginal and Torres Strait Islander children
- low income families, especially those reliant upon income support
- some groups of children with non-English speaking or CALD backgrounds, including children of humanitarian visa holders
- children living in some regional locations and in remote and very remote locations, in particular, and those living in more socio-economic disadvantaged locations.
In considering this, a central issue is the extent to which these groups do not just require 'equal access' and are not obtaining this but also, for many of these children, early childhood education can play a critical role in addressing their disadvantage and in preparing them for education, as well as in ensuring that these potentially vulnerable children are engaged more widely with their peers and the community. In this regard, the specific focus of the package on parental employment has tended to displace this goal.
One specific feature of the package was the reduction in the minimum hours of subsidised care from 24 hours a week to 24 hours per fortnight. Analysis of the data indicates that only a very small proportion of children, just 1.6 per cent, are subject to this - but where they are, they are from groups at most disadvantage. While this limitation was seen as a means of promoting shorter session lengths, as discussed elsewhere, this has not been successful, in large part due to the economic cost of provision. Further, given the very small size of this group, it is unlikely that they are sufficient to provide any leverage for systemwide change. Given this, there would appear to be strong grounds for a review of the 24 hour limit.
129 This is a provision related to Universal Access to Early Childhood Education. The exemption applies to all families entitled to less than 36 hours care regardless of whether they are low income. Within the data available to the evaluation, it is not possible to differentiate access to this exemption relative to those with an entitlement to 36 hours under the activity test, that is working between 8 and 16 hours per fortnight and, as a consequence, the evaluation was not able to fully assess the impact of this provision. It is noted that some of the issues related to the adequacy of the 24 hours approved care were also raised by some stakeholders with respect to this provision, again, however, this could not be examined with the available materials.
130 The Child Care Provider Handbook (2019b, p. 51) states that there are no mandatory requirements for filling vacancies, and providers can set their own policies for prioritising who receives a place. However, as vacancies in a service arise, providers are asked to consider prioritising children who are at risk of serious abuse or neglect or a child of a sole parent who satisfies, or parents who both satisfy, the activity test through paid employment. This reflects the Australian Government's intention to help families who are most in need and support the safety and wellbeing of children at risk in accordance with the Framework for Protecting Australia's Children 2009-2020 (COAG, 2009).
131 In contrast to this previous arrangement, the introduction of the co-contribution means that even if a service reduced the cost of child care for a family by reducing the fee that they charge (unless this involves reducing the fee from a rate above the hourly fees cap to below), the parent is still required to pay a co-contribution, with this amount depending on their eligibility for CCS (according to the income and activity test). In the case of families with an income below $66,958, a group likely to be targeted by such a reduced fee, some 85 per cent of the benefit of the service's reduced fee flows to the government through a reduced subsidy payable. That is, the parents would, in such a situation, only gain 15 per cent of the discount provided by the service through the reduced fee.
132 The FTB dataset in 2018-19 included 42.5 per cent of families that used child care over the year.
133 This modelling approach, rather than the direct reporting of participation as presented in Section 6.4.1, has been adopted to account for changes in the composition of the FTB population over time. The modelling is based on a logistic regression utilising the 4 quarterly datasets before and again after the introduction of the Package. The coefficients of the logistic regression model were then used to estimate the probability of accessing child care pre-package and also post-package for the post-package population for each record using the full set of child and family characteristics as shown in Table 86. The model robustness was tested using a number of quarter on quarter analyses, which produced very similar estimates but were potentially impacted by representing only one seasonal experience, and for this reason the full 4 quarter model was used. The analysis also excluded from scope data on child care attendance at Family Day Care Services against which compliance action has been taken. This reflects some uncertainty as to whether or not the data on attendance at these services is wholly reliable.
134 While participation, as analysed above, is one measure of access, it is also important to consider how much child care children are using, as measures of hours or days per week or weeks per quarter may reveal different patterns for children from vulnerable families. More detailed analyses of this data revealed some differences for some cohorts of families but, overall, the participation of children from vulnerable families was not very different to that of all families.
135 In addition to the listed exemptions, parents may also apply for recognition of exceptional circumstances, which is meant to cover if families have an emergency or family crisis, such that it would be unreasonable for them to satisfy the activity test. It was reported by the Department that of 439 applications for exceptional circumstances received by Services Australia between 1 July 2019 and 31 December 2019, 15 per cent were approved. During the 2018-19 financial year, 29 per cent of the 751 applications for exceptional circumstances were approved. No information is available on the family circumstances covered by these applications. The majority of applications (73 per cent in 2018-19 and 82 per cent July to December 2019) were to access more than 100 hours of subsidised child care.
136 These do not provide exact statistics on use of exemptions, as for couples, if only one is eligible for an exemption, the other parent/carer's activity levels are used to determine allowed hours. Those recorded as having 100 allowed hours will therefore include those in which a partner's activity test results in 100 allowed hours. It may also be that those able to apply for exemption are nevertheless meeting the activity test through unpaid activities such as volunteering or studying, rather than through an exemption.
137 The minimum of 24 hours a fortnight does not necessarily equate to one day a week. However, where services operate on the basis of weekly schedules, as most do, unless they have a session length of 6 hours or less, this results in the situation referred to by this service. Most Centre Based Day Care services do not have 6-hour sessions, as detailed in Chapter 5. See also footnote 118.
138 Prior to July 2020, if a service had 50 per cent of the children attending in receipt of ACCS, they were unable to issue further certificates and would need to apply to DHS for determinations for any additional children that are eligible for ACCS, and/or apply to the Department for an increased percentage limit. This requirement was removed as part of amendments to legislation in December 2019.
139 These more recent changes were beyond the time frame covered by the evaluation data collections and available administrative data.
140 This may not necessarily reflect an increase in child care assistance to these families, who were previously supported through the payment of child care fees by child protection agencies.
141 The Adult Migrant English Program (AMEP) provides free English language classes to migrants with low English levels to help settle and participate in the Australian community. The program is available to migrants over 18 years old from the family, skilled and humanitarian visa streams, which includes holders of permanent visas as well some temporary visas. The program provides free child care for children who are under school age with the care being organised through the AMEP provider. The government has recently announced significant changes to the program (Tudge, 2020). This program is outside the scope of this evaluation. The Evaluation report for the program recommended a review of the child care provisions for the AMEP noting that 'misalignment between current funding arrangements and the broader child care sector is resulting in financial losses and administrative burdens for many service providers' (Social Compass, 2019, p. xvi).
142 China, Japan, Korea, Hong Kong, Macau, Mongolia
143 This indicator is based on the first listed medical condition of a child that qualifies their carer for Carer Payment and/or Carer Allowance (excluding those care receivers who only qualify for a Carer Allowance Health Care Card). It will not capture medical conditions of children who are ineligible due to family income above the threshold or less severe medical conditions that do not attract carer payments.
144 As noted in Section 1.2.3, the NDIS Early Childhood Early Intervention (ECEI) roll out was underway during this time, and changes in access to child care for this cohort may not be related to the Child Care Package.
145 The ICD is the World Health Organization's 'International Statistical Classification of Diseases and Related Health Problems'. It is the diagnostic classification standard for all clinical and research purposes. ICD-10 refers to the 10th version that was endorsed by the 1990 World Health Assembly. ICD-11, the next version of the classification, is to come into effect from 1 January 2022.
8. Employment participation impacts
Participation was one of the 3 core impacts identified as foci for the evaluation. Specifically, as detailed in Chapter 1, this was that: 'Parents of children can engage in work, education and the community.'
A focus on employment was central to the child care changes being considered here, with the Package being introduced as the 'Jobs for Families Child Care Package', this language also featuring in the title of the legislation for the changes: Family Assistance Legislation Amendment (Jobs for Families Child Care Package) Act 2017. More specifically, the joint announcement of the Package stated it was designed to: 'increase workforce involvement for 230,000 families' (Turnbull, Morrison, Birmingham & Porter, 2017).
Notwithstanding these announcements, there were no specific targets identified for the program with respect to employment and participation outcomes.
This Chapter considers the question of the potential impact of the Child Care Package on workforce engagement by examining:
- trends in employment participation by parents, both in the long term and more immediately over the period associated with the introduction of the Package
- levels of activity and workforce engagement reported by parents using child care services since the introduction of the Package
- parental reports of the changes they have made to working arrangements as a result of the introduction of the Child Care Package
- analysis of the factors, including child care access and costs that parents report as barriers to their ability to increasing their participation in employment
- analysis of the impact of the introduction of the Child Care Package on the effective marginal tax rates parents face in entering and increasing employment.
Labour supply and the cost of child care
The framing of an understanding of the labour supply response to the impact of changes in child care subsidies is complex. Central to this are 2 economic effects that can operate in opposite directions. These are: an income effect and a substitution effect. The income effect can be viewed as the subsidy operating to reduce the cost to the individual of supplying their labour and hence increasing the effective net income they obtain from employment. In this regard, the higher effective net income makes work more valuable relative to other activities - collectively referred to as leisure in economic terms146 - and people will respond by working more as they can gain greater welfare from what they can consume from these additional earnings, relative to the welfare loss from reduced leisure. At the same time, a second effect also operates - the substitution effect. That is, if a person has a higher effective income from working the same number of hours, their demand for leisure increases and hence they may reduce their level of work and consume greater leisure.
The degree to which people respond to these 2 effects, their labour supply elasticity, is shaped by their individual preferences. These include their attitudes towards using child care and preferences around looking after their own children. Research (Dandie & Mercante, 2007) highlights the considerable variations in labour supply elasticities across population subgroups; in particular, partnered women and single parents. They note more broadly, 'Given the variation in the estimates, and their sensitivity to modelling, data and methods of calculation, it is difficult to draw definitive conclusions about the responsiveness of various population groups to policy stimuli' (p. 38). The question of attitudes is considered further in Section 8.4.1.
Additionally, as has been detailed in Chapter 4, the actual change in the pattern of subsidies associated with the introduction of the Child Care Package is complex, with some people gaining higher levels of assistance, while others have had reductions, effectively reducing their returns to work. These, in turn, result in a diverse range of interactions between these changes in the effective returns from employment and the labour market response, shaped by the income and substitution effects.
Given this, it can be expected that there will be diverse labour market outcomes from the Package, and to the extent there may be an overall impact, this will not represent the experience of all families affected. Rather, it needs to be seen as a balance of positive and negative experiences and responses across parents and families.
Furthermore, it is noted that while the program's goal of increasing participation is at times expressed in terms such as 'to increase their participation in work, training, study or volunteering' (Porter, 2016), in the same speech the Minister articulated '3 important goals', these were: to continue to support early learning; to simplify child care payments and the social security system; and 'to enable and encourage greater workforce participation'. This duality is reflected in this chapter. While some of the analysis will be on the broader forms of participation, the primary focus is on participation in employment.
Identifying the impact of the Package is further complicated by 2 factors. The first is the existence of strong long term trends that need to be accounted for. As detailed below, for example, the proportion of couple families with dependent children with 2 earners has grown, on average, by 0.7 of a percentage point annually since 1981. The second is a more micro-analysis factor, and relates to the overall upward slope of participation in child age. That is, parents tend to increase their level of workforce engagement as their child ages. As such, simple longitudinal trends in participation for an individual or family confounds this along with any other factors.
Participation and the scope of child care
Additionally, while the focus here is on the evaluation of the Child Care Package that directs financial support to parents who use particular forms of formal child care, it is emphasised that the potential labour market outcomes from the Package needs to be considered across the population of parents with children, not just those who are in the sector supported through the CCS.
This is because of the potential substitutability of different forms of care within the family, in the formal child care sector and the informal sector, and the relative prices of these, and how these prices are changed by changes in the subsidy. Hence, for example, a change in subsidies that make formal child care more affordable for some workers may result in these moving from using child care in the informal sector to using it in the formal, subsidised, sector. In contrast, a reduction in subsidies for others - such as those on higher incomes - may lead them to exit the formal sector and use alternative sources of care such as nannies or au pairs. At the same time, policies that seek to ensure that those at disadvantage access child care for child development and related purposes, may result in a dilution of the proportion of child care users in employment.
Balanced against this is the reasonably persistent use of formal child care, as can be seen in terms of the proportion of parents who remain in the child care sector over multiple years, as identified in Chapter 2. This would suggest that while relatively marginal changes within the population of formal child care users may be influenced by compositional change, a change which is seen in a relatively large proportion of the population of users can be interpreted more significantly.
Notwithstanding this, some of the analysis in this Chapter is restricted to those in the formal sector alone. This reflects both data limitations and that understanding the experience of this subpopulation of parents is valuable.
8.1 Workforce participation of parents with children
This first section initially utilises data from the ABS Labour Force Survey to analyse trends in the workforce participation of parents with children, and complements this with an analysis of trends in the number of parents in receipt of income support payments.
In undertaking this analysis, it is noted that formal ABS labour force statistics to inform this analysis are unfortunately only collected on an annual basis and, as highlighted in discussion, were not collected in 2018, significantly reducing the utility of this in assessing the impact of the Package on employment.
8.1.1 ABS Changing family workforce participation
The pattern of parental employment has shifted dramatically in Australia over recent decades. While in 1981 most (51.7 per cent) couple families with dependent children took the form of a full-time, male breadwinner with a dependent partner, by 2019 this proportion had dropped to just 22.0 per cent.
This decline has been accompanied by strong growth in dual earner households, either those with both parents working full-time, or with one working full-time and the other part-time. While growth in dual full-time earners, see Figure 114, has been steady over the period since 1981, it has been particularly marked since 2013. In contrast, the growth in these couple families with dependent children aged under 15 years, and one person working full-time, and the other part-time, was particularly sharp in the 1980s, before showing more moderate growth to the early 2000s and broad stability since. Between 1981 and 2019 the proportion of couple families with dependent children with a single full-time breadwinner (of any gender) has fallen from 52.4 per cent to 24.5 per cent, while those with 2 full-time earners has increased from 16.5 per cent to 27.8 per cent, and those with one full-time and one part-time worker from 23.9 per cent to 36.8 per cent, making this the most common form of workforce engagement among these couples.
Workforce engagement by single parents has also risen. It has increased from 43.2 per cent in 1981 (and falling well below this in subsequent years) to 58.3 per cent in 2019. This trend, though, contains quite different experiences for male single parents and for female single parents. Among male single parents, who accounted for 15.1 per cent of these parents in 1981, and 13.7 in 2019, the full-time employment to population ratio has fallen from 77.0 per cent to 61.0 per cent over the period, while the part-time ratio has increased from 3.6 per cent to 8.7 per cent. For female single parents, there have been increases in both full- and part-time participation, with the full-time employment to population ratio increasing from 20.9 per cent to 28.6 per cent, and the part-time rate from 15.6 per cent to 27.6 per cent. As shown in the chart, the strong growth in part-time employment for these single parents, as a whole, occurred in the period up to 2006, with the rate declining since then, whereas the full-time rate, after an initial decline, remained flat up to 2006 and has increased since.
Figure 114: Long-term trends in the workforce participation of parents with a dependent child aged under 15 years, 1981-2019
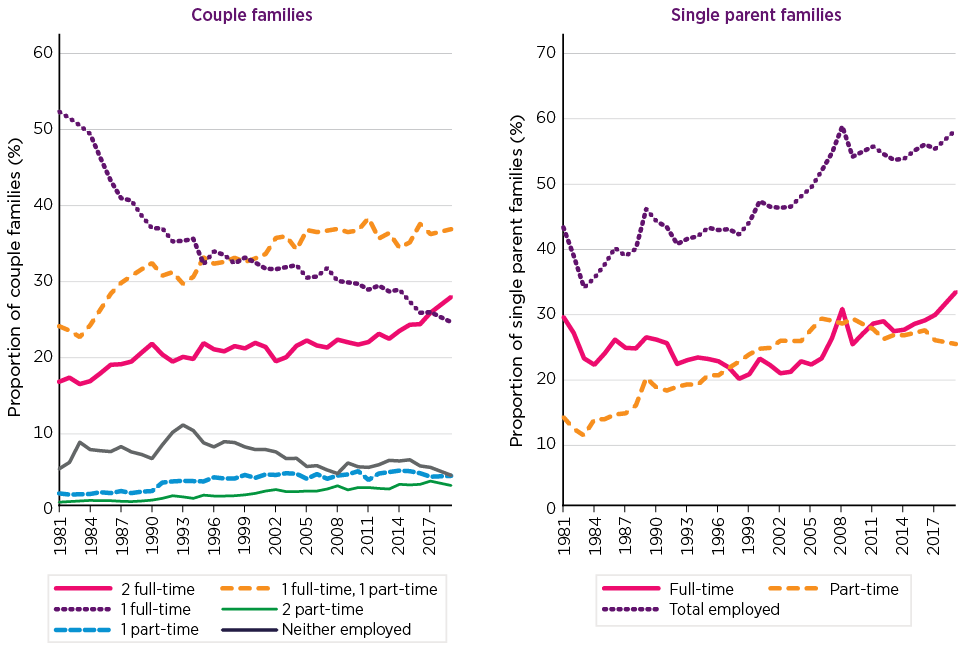
Source: ABS, Labour Force Status of Families, Cat no 6224.0, various
8.1.2 The workforce participation of mothers with dependent children
Figure 115 details, separately for single parents and couples, the full- and part-time employment to population ratios of mothers by the age of their youngest child. Unfortunately, as has been noted earlier, this data is not available for 2018. From these charts, however, 3 points emerge:
- The employment to population ratio of mothers increases with the age of the youngest child.
- The rate of employment is lower for single mothers relative to those mothers in couples in each of the age groups.
- The pattern of change is not consistent over time, nor across these groups of mothers by the age of their youngest child.
- However, all groups, except for these female single parents with a child aged 10-14 years, show growth between 2017 and 2019, with this being particularly strong for some groups, especially those who are single parents with a youngest child aged 5-9 years.
The most consistent pattern of growing participation is shown by mothers in couples with a youngest child aged under 5. For mothers in couples with a youngest child aged 5-9 years, while there was relatively little change in the first decade shown on the chart, in the 5 years to 2019 there has been a steady progression.
Figure 115: Employment to population ratios, mothers by age group of youngest child, 2005-2019
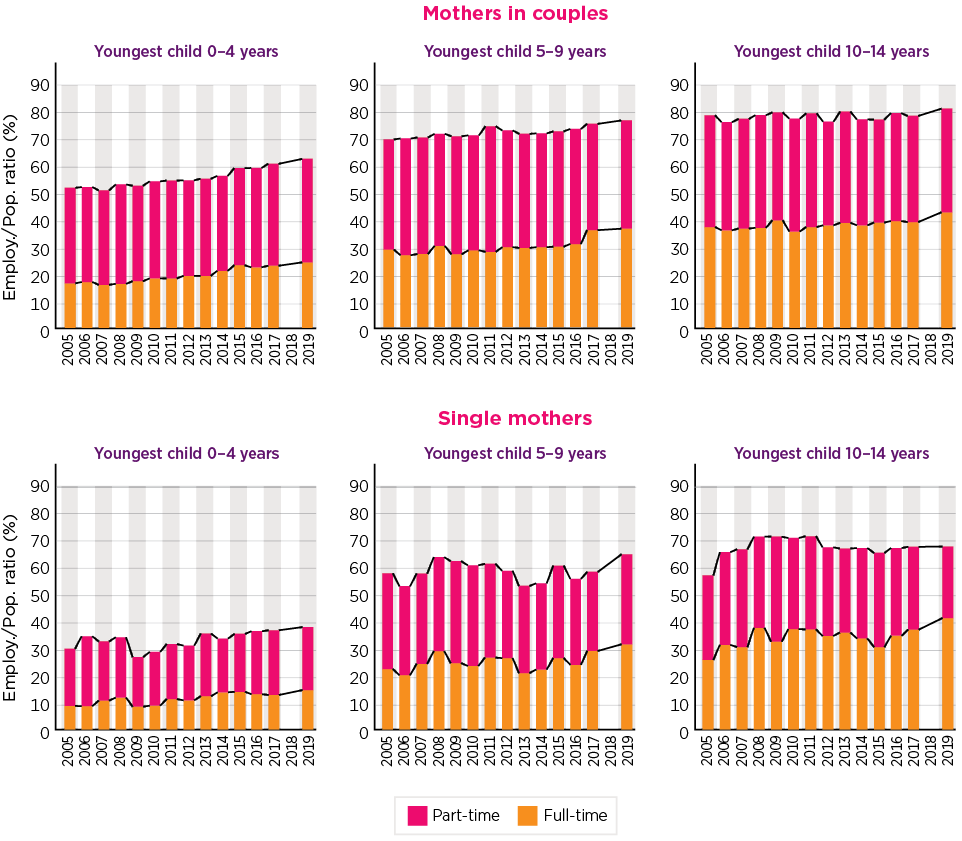
Source: ABS, Labour Force Status of Families, various
Analysis of recent changes
As noted, the absence of data for 2018, and the existence of underlying time trends, limit the usefulness of this data for drawing any strong conclusions as to the possible impact of the Child Care Package on changes in labour force participation. Notwithstanding this, there remains some value in considering the 2017-2019 change. This is illustrated in Figure 116. For partnered women, the strongest growth in employment was in full-time employment among mothers with a youngest child aged 10-14 years, a group which, as seen in Chapter 2, has a relatively low level of child care use. In the other 2 age groups the gains both in full-time employment and in employment overall, while still present, were more muted. Compared with partnered women overall, these mothers with a youngest child under 15 years showed stronger growth in terms of the change in the total employment to population ratio. This though was not the case for full-time employment.
Single parents showed a more diverse pattern of change, with no net gain, although a shift from part-time to full-time employment for those with a youngest child aged 10-14 years, and a similar pattern with some total gain for those with a youngest child aged 4 years and under. Those with a youngest child aged 5-9 years showed very strong growth; in particular, in part-time employment.
Figure 116: Change in women's employment to population ratios, 2017-19
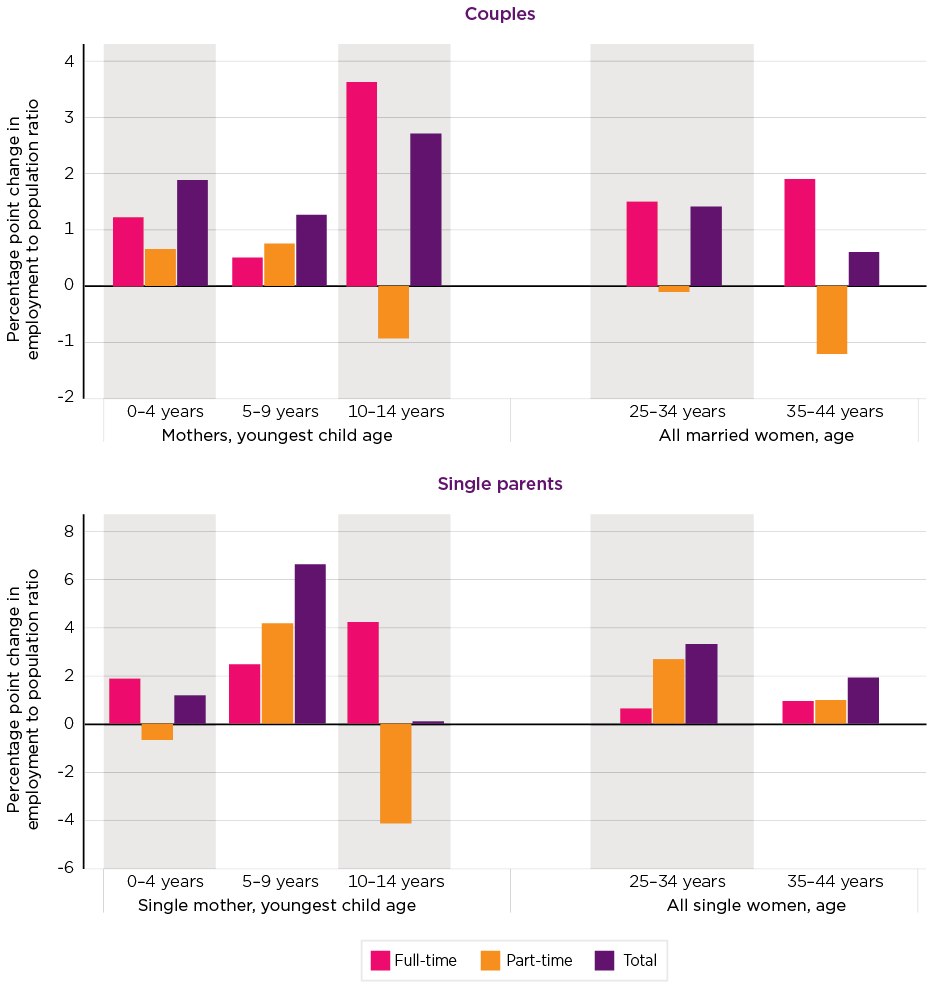
Source: ABS, Labour Force Status of Families, various
Taken as a whole, over the 2-year period between the 2017 and 2019 surveys, mothers, both in couples and single parents, with children under the age of 10 years - the age group most impacted by child care - increased their employment by an estimated 84,300 jobs. This growth can be compared with growth of 72,900 over the previous 2 years. However, at the same time, the population of these mothers over the 2017-19 period grew by 74,500, compared with 56,500 in the earlier period. This is reflected in the relative growth in the employment to population ratio for these mothers over the two 2-year time periods. While in the 2017-19 period it increased by 1.9 percentage points, from 63.4 per cent to 65.3 per cent, this compares with an increase of 2.1 percentage points from 61.3 per cent to 63.4 per cent over the 2015-2017 period.
Hence, while the ABS data does show a gain over the 2-year period to 2019 for those mothers most likely to have been affected by the Child Care Package, this is not out of step with that which was recorded in the previous 2 years. It is also to be stressed that as this data is derived from surveys, they are subject to sampling variability.147
8.1.3 Trends in income support receipt
One significant outcome of increased parental workforce participation is a reduction in reliance on the receipt of income support. Figure 117 details, for single parents, and couples, by their income support status, including whether they are on full-rate or a part-rate (a benefit reduced due to private income - usually as a result of workforce activity). As the magnitude of these groups varies considerably (in Q4 2019 there were 262,410 single parents with a youngest child aged under 13 years on a full-rate payment and 78,615 on a part-rate,148 and 43,808 couples where both members were on a full-rate payment and 79,465 where one or both of them was on a part-rate benefit or not in receipt), this is presented as index numbers, with a base of 100 in Q1 2017.
The data shows a pattern of strong and consistent decline in the numbers of parents in receipt of income support. There is, however, no evidence of an inflection point or change in the trend pattern coincident with or following the introduction of the Child Care Package. This would suggest that while the decline in receipt has occurred, and is probably associated with improved workforce engagement, the Package appears to have had no direct impact on this.
Figure 117: Trends in number of parents with children aged under 13 years in receipt of income support payments, Q1 2017 to Q4 2019, index numbers
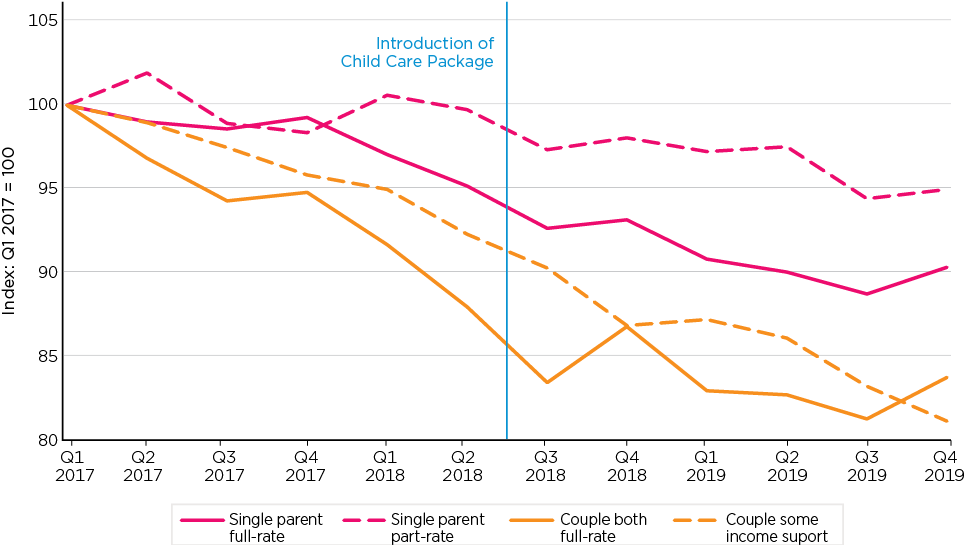
Source: Derived from Department of Social Services administrative data as provided by DESE
8.2 Reported activity
This section reviews both reported activity undertaken by parents who use formal child care and those who do not. As discussed, while the activity of those using child care informs about this population, it does not, however, directly address the question of the employment impact of the Package. This broader question is addressed by the DESE/ORIMA parent survey, although only the first 3 waves of this, up to June 2019, include a sample of parents outside the formal child care sector.
8.2.1 Activity hours of parents using child care as reported in the child care system
As noted in Chapter 1, the activity test, which determines the maximum number of hours of approved care that will be subsidised, defines activity broadly to include paid and unpaid work of a range of types, along with study, volunteering and job search. Parents are required to update the information they provide to Centrelink on activity as this varies. This data is considered here.
While the data available to the evaluation contains, in each weekly record, the current level of activity reported by parents, for themselves, and a partner if they have one, it also has some limitations. Firstly, this data is not available for all families using child care, as a number of records have missing values. While for most of 2019 this proportion was at or around 5.5 per cent, it was somewhat higher in the first months of implementation of the new funding arrangements. There are several reasons for this missing data. One is that the dataset reflects the entire population of children attending care who in some cases have parents who are ineligible for, or do not make a claim for, Child Care Subsidy. Secondly, a number of families have an exemption from the activity test. While in some cases activity continues to be reported under these circumstances, in other cases this does not occur.149 Additionally, it is noted that a number of the reported hours appear to be questionably high; for example, some one per cent of primary customers who reported fortnightly hours of 288 or more.150 For analysis data has been topcoded at 100 hours per fortnight, with this impacting on around 5 per cent of records. While some of these factors may affect point in time estimates, they are considered unlikely to have introduced any particular bias in the data over time.
This data is considered here in 2 ways. The first considers trends in the average hours of activity reported. The second uses a recoding of the data to classify families into an activity-based family type structure that is more akin to labour market approaches. Because of the child age-participation relationship the analysis focuses on comparative cross-sectional analysis rather than longitudinal analysis of individual families.
Some caution needs to be given to the question of how well the activity data tracks changes in activity. The 2019 CCPFamS found that some 73.5 per cent of parents agreed or agreed strongly that they update activity details as soon as they experience a change in activity. However, when the data is examined there is limited evidence of the data being changed on a regular basis. Across the population of families in 2019 who used child care for 3 months or more, 84.3 per cent did not change their activity hours, 10.6 per cent changed their hours of reported activity once and 5.1 per cent more than once. This though varied by the level of activity. Of those who had a minimum activity of less than 8 hours at some point in the year, 40.9 per cent reported a change in activity. Of those with a minimum of 8-16 hours activity, 52.1 per cent reported a change in hours. This reduced to 21.4 per cent for the group who had a minimum of more than 16 hours but less than 48, and just 7.2 per cent for those with a minimum of more than 48 hours. 151
While the evaluation sought to use more detailed activity data to look specifically at employment activity relative to other activity, this was not possible for the full period under consideration and there are some significant problems with missing data, especially for some population cohorts. In particular, there was significant missing information on the detailed activities of single parents that could not be resolved by the Department. Notwithstanding this, some examination of the nature of participation is presented later in this Chapter based on survey data.
It is also noted that there is significant heaping in the data. Figure 118 shows the distribution of activity test hours (i.e. the hours based on those of a single parent and the lower activity in a couple). Because of the coincidence of the cut-offs and the conventional use of 8 hours to describe a day of work,152 it is difficult to attempt to analyse this in terms of people seeking to category shift. However, it does highlight the extent to which the reported activity appears to be an approximation, rather than any rigorous accounting, for example, of actual work and travel time.
Figure 118: Distribution of activity test hours, 13 October 2019
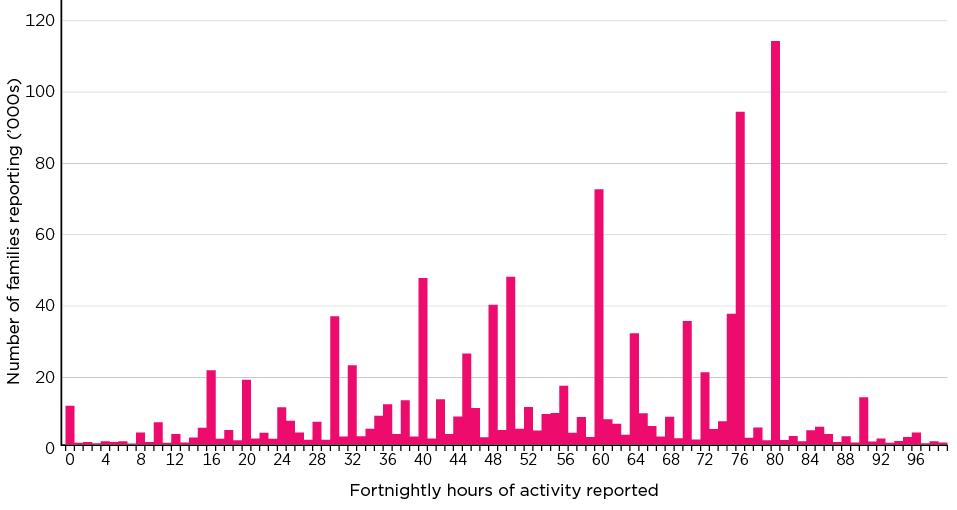
Source: DESE administrative data
Hours of activity reported
Table 97 presents the average fortnightly hours of activity reported by families for each month since the introduction of the Package, along with the year-on-year change in activity for the 6 months for which this is possible. As cross-sectional data, it combines both the effect of changed hours for those that remain in the dataset as well as the compositional changes due to entries and exits. It shows over the period an increase in the level of activity for single parents, and individually and combined for members of couples. The magnitude of these increases is, however, relatively low. It ranges from an average annual increase of 0.1 hour per fortnight for the principal claimant in a couple to an annual gain of 0.8 of an hour per fortnight for single parents. In percentage terms, the growth rate in activity was 1.4 per cent for single parents, and using the measure that combines both claimant and partner activity, 0.3 per cent for couples.
While the short overlapping period limits these findings, the data does not indicate any evidence of a pattern of accelerating increases in activity. Rather, the largest increase occurred at the earliest period; that is, the July 2018 to July 2019 period. There are grounds to consider that this may, however, have been affected by there having been some initial misreporting as parents sought to understand the new system, but that this was quickly resolved.153
| Single parent | Couple | |||
|---|---|---|---|---|
| Claimant | Partner | Combined | ||
| (hours per fortnight) | ||||
| July 2018 | 58.6 | 61.0 | 76.0 | 137.2 |
| August 2018 | 58.9 | 61.0 | 76.1 | 137.3 |
| September 2018 | 58.9 | 61.1 | 76.1 | 137.4 |
| October 2018 | 59.1 | 61.1 | 76.1 | 137.4 |
| November 2018 | 59.2 | 61.1 | 76.2 | 137.5 |
| December 2018 | 59.2 | 61.1 | 76.2 | 137.5 |
| January 2019 | 58.7 | 60.6 | 76.4 | 137.2 |
| February 2019 | 59.4 | 60.9 | 76.3 | 137.4 |
| March 2019 | 59.5 | 61.0 | 76.2 | 137.4 |
| April 2019 | 59.6 | 61.1 | 76.3 | 137.5 |
| May 2019 | 59.6 | 61.0 | 76.3 | 137.5 |
| June 2019 | 59.5 | 61.0 | 76.3 | 137.5 |
| July 2019 | 59.7 | 61.2 | 76.4 | 137.7 |
| August 2019 | 59.7 | 61.1 | 76.4 | 137.7 |
| September 2019 | 59.7 | 61.1 | 76.4 | 137.7 |
| October 2019 | 59.9 | 61.3 | 76.5 | 137.9 |
| November 2019 | 60.0 | 61.2 | 76.5 | 137.9 |
| December 2019 | 60.0 | 61.2 | 76.5 | 137.9 |
| Year-on-year changes, 12 months to: | Percentage point change | |||
| July 2019 | 1.0 | 0.2 | 0.3 | 0.5 |
| August 2019 | 0.8 | 0.1 | 0.3 | 0.4 |
| September 2019 | 0.8 | 0.1 | 0.3 | 0.3 |
| October 2019 | 0.8 | 0.1 | 0.3 | 0.4 |
| November 2019 | 0.7 | 0.1 | 0.3 | 0.4 |
| December 2019 | 0.7 | 0.1 | 0.3 | 0.4 |
| Average of year-on-year changes | ||||
| Average | 0.8 | 0.1 | 0.3 | 0.4 |
| (%) | ||||
| Per cent a | 1.4 | 0.2 | 0.4 | 0.3 |
Notes: Activity hours have been capped at 100 hours a fortnight. a Percentage of average July 2018 to December 2018 reported activity.
Source: DESE administrative data
As such, this reported activity suggests that, while there has been an increase in the level of parental activity of those parents in the formal child care sector since the introduction of the Package, with this being more marked among single parents rather than in couples, the magnitude of this, however, is small.
Classification of families
The data on activity can also be used to generate estimates of family activity more akin to labour market concepts of full- and part-time employment (again noting though that it is activity that is being considered and not employment). This is presented in Table 98. Among single parents, this shows an increase in the proportion engaged full-time, an annual increase of 0.9 of a percentage point, offset by declines in those reporting low levels of activity (less than 10 hours per week), and those engaged part-time (10 to less than 35 hours per week).154 Among couple families there has also been an increase in more intensive activity, although, again, this is small. The proportion of these families having both persons in full-time activity shows an average annual increase of 0.4 of a percentage point, with a similar gain for those with one person in full-time and one in part-time activity. The main decrease has occurred in those reporting just some part-time activity.
| Single parent | Couple | |||||||
|---|---|---|---|---|---|---|---|---|
| Low activity a | Part-time | Full-time | Both low | Some part-time | One low, one full-time | One full-time, one part-time | Both full-time | |
| Within family type distribution of activity (%) | ||||||||
| July 2018 | 10.0 | 45.0 | 45.0 | 0.2 | 9.0 | 4.4 | 49.1 | 37.3 |
| August 2018 | 9.9 | 44.9 | 45.2 | 0.2 | 9.0 | 4.4 | 49.1 | 37.4 |
| September 2018 | 9.8 | 45.0 | 45.2 | 0.2 | 8.9 | 4.3 | 49.1 | 37.5 |
| October 2018 | 9.6 | 45.0 | 45.3 | 0.2 | 8.9 | 4.3 | 49.1 | 37.5 |
| November 2018 | 9.6 | 44.8 | 45.6 | 0.2 | 8.8 | 4.3 | 49.1 | 37.6 |
| December 2018 | 9.6 | 44.8 | 45.6 | 0.2 | 8.8 | 4.2 | 49.1 | 37.6 |
| January 2019 | 10.1 | 45.6 | 44.4 | 0.2 | 8.5 | 4.3 | 50.1 | 36.8 |
| February 2019 | 9.1 | 44.9 | 46.0 | 0.2 | 8.6 | 4.2 | 49.4 | 37.5 |
| March 2019 | 9.2 | 44.8 | 46.0 | 0.2 | 8.6 | 4.2 | 49.4 | 37.6 |
| April 2019 | 9.1 | 45.1 | 45.8 | 0.2 | 8.6 | 4.2 | 49.4 | 37.6 |
| May 2019 | 9.2 | 44.9 | 45.9 | 0.2 | 8.5 | 4.2 | 49.5 | 37.6 |
| June 2019 | 9.3 | 44.9 | 45.9 | 0.2 | 8.5 | 4.2 | 49.4 | 37.6 |
| July 2019 | 9.1 | 44.9 | 46.1 | 0.2 | 8.4 | 4.1 | 49.4 | 37.9 |
| August 2019 | 9.1 | 44.7 | 46.2 | 0.2 | 8.4 | 4.2 | 49.5 | 37.8 |
| September 2019 | 9.1 | 44.8 | 46.0 | 0.2 | 8.4 | 4.2 | 49.4 | 37.8 |
| October 2019 | 9.0 | 44.7 | 46.3 | 0.2 | 8.2 | 4.2 | 49.4 | 38.0 |
| November 2019 | 9.0 | 44.5 | 46.5 | 0.2 | 8.2 | 4.2 | 49.5 | 38.0 |
| December 2019 | 8.9 | 44.6 | 46.5 | 0.2 | 8.1 | 4.1 | 49.6 | 37.9 |
| Year-on-year changes, 12 months to: | Percentage point change | |||||||
| July 2019 | -0.9 | -0.2 | 1.1 | 0.0 | -0.6 | -0.2 | 0.3 | 0.5 |
| August 2019 | -0.7 | -0.2 | 0.9 | 0.0 | -0.6 | -0.2 | 0.4 | 0.4 |
| September 2019 | -0.7 | -0.2 | 0.8 | 0.0 | -0.5 | -0.1 | 0.4 | 0.3 |
| October 2019 | -0.7 | -0.3 | 0.9 | 0.0 | -0.7 | -0.1 | 0.3 | 0.5 |
| November 2019 | -0.6 | -0.3 | 0.9 | 0.0 | -0.7 | -0.1 | 0.4 | 0.4 |
| December 2019 | -0.6 | -0.3 | 0.9 | 0.0 | -0.7 | -0.1 | 0.5 | 0.3 |
| Average | -0.7 | -0.2 | 0.9 | 0.0 | -0.6 | -0.2 | 0.4 | 0.4 |
Notes: a Low includes zero and less than 10 hours per week; Part-time is 10 to under 34 hours per week, Full-time is 35 hours or more a week.
Source: DESE administrative data
When the average level of hours of activity undertaken within these subgroups is considered, the data indicates that for single parent families there was a slight increase in the number of reported hours of activity. Again, using the average of the 6 year-on-year movements, these were 0.2 of an hour per fortnight for the low activity group, 0.4 of an hour for the part-time group, and 0.1 of an hour for the full time group. For couples, the shifts were more complex. There was an increase of 1.2 hours for the low activity group, and 1.3 hours for those with some part-time activity. As, however, shown in Table 2, only some 12 per cent of couples are in these 2 classifications. For the 2 larger groups, there were decreases in the reported hours of activity. The classification of families with one person classified as full-time and one as part-time experienced a modest decline of 0.1 of an hour per fortnight, for families with both members of the couple engaged full-time, the decrease was 0.4 of an hour per fortnight.
Overall impact
Bringing these trends together, the data, if accurately reflecting changes in participation, suggests that for single parents who are using child care, there has been a gain in participation that suggests a 0.9 percentage point increase in the proportion, with participation levels commensurate with full-time engagement, while the relative size of the other 2 segments of this population, those with low and part-time engagement, reduced. This reduction was more marked among those with low participation, but with each of these groups showing small gains in actual hours worked.
For couples, there was similarly a small but somewhat lesser gain in higher levels of participation - with the proportion that had 2 full-time participants increasing by 0.4 percentage points, with a similar increase in the proportion with one full-time and one part-time participant. In both cases these were accompanied by a slight fall in the hours worked by persons in these groups.
As discussed earlier, these changes within the population in receipt of subsidies do not though necessarily reflect the broader labour market outcomes associated with the Package.
8.2.2 Activity recorded in family surveys
Data was collected on the amount of activity undertaken by families with children in the DESE/ORIMA parent surveys. Specifically, the surveys collected data separately on time spent in paid employment; as self-employed; studying; undertaking training courses; participating in employment programs such as Work for the Dole; undertaking unpaid work (which in an earlier question in the survey was described to include voluntary work and work experience); and time spent looking for work.155 These broadly represent the activities encompassed by the activity test. In all surveys other than November 2019, where this was only collected for those families using child care, this was collected for both users and non-users of child care. In the June 2019 survey, single parent families using child care reported an average of 26.3 hours of activity, and those not using child care 18.2 hours. Among couple families where data was collected on the activity undertaken by both the respondent and their partner, these figures were a combined 55.5 hours and 70.0 hours respectively.
Figure 119 and Figure 120 present the total hours of activity, and total hours of employment activity (total hours worked as an employee or as self-employed). All couples (i.e. those both using and not using child care) reported a non-statistically significant increase in activity from 59.1 hours in June 2018 to 60.3 in June 2019. For single parents, total average hours of activity remained flat at 20.5 in both periods. With regard to employment, couples reported an increase over this 12 month period encompassing the introduction of the Child Care Package from 54.0 to 54.6 hours, and single parents reported a fall from 16.5 to 15.7 hours. Neither of these shifts are statistically significant.
While the chart shows a statistically significant increase in hours of activity and employment for single parents using child care between June 2018 and November 2019, from 19.7 hours to 23.1 hours for employment and 24.9 hours to 28.7 hours for activity, for couples both these aggregates show a minor, although not statistically significant, fall. These results, however, also need to take account of seasonality in the data. As seen in the charts, a number of the measures show a distinct pattern of increase between the June and November estimates, followed by a fall to the following June. While the full extent of seasonality cannot be estimated for this data, there is a clear need to avoid any strong conclusions from June to November comparisons.156
Figure 119: Families, weekly hours of activity recorded in the DESE/ORIMA parent survey, by family type and child care use, June 2018 to November 2019
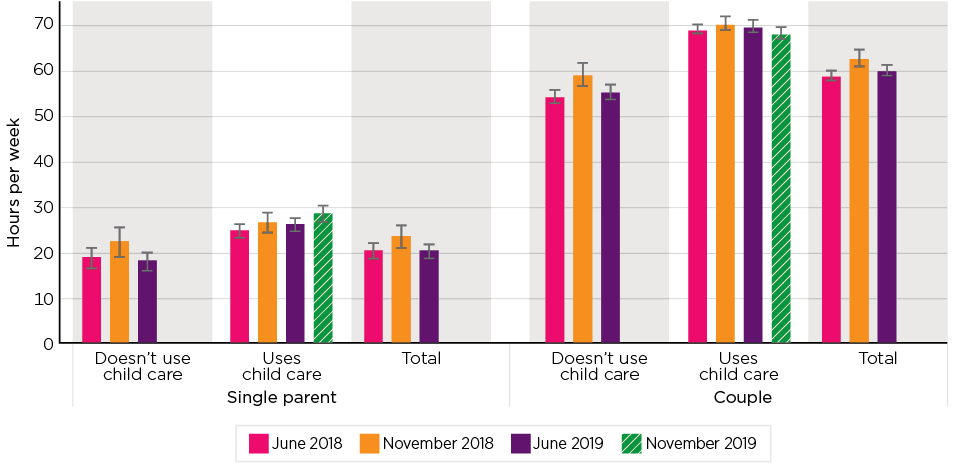
Notes: Child care user defined as a parent who has a reference child in an identified formal child care reference care. Error bars on the chart show the 95 per cent confidence interval.
Source: DESE/ORIMA Parent Survey. June 2018, November 2018, June 2019, November 2019
Figure 120: Families, weekly hours of employment recorded in the DESE/ORIMA parent survey, by family type and child care use, June 2018 to November 2019
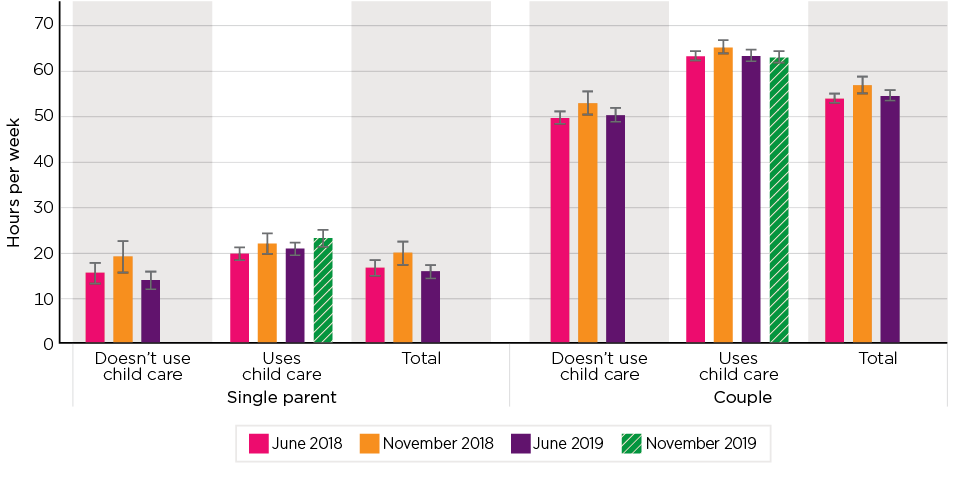
Notes: Child care user defined as a parent who has a reference child in an identified formal child care reference care. Error bars on the chart show the 95 per cent confidence interval.
Source: DESE/ORIMA Parent Survey. June 2018, November 2018, June 2019, November 2019
The levels and composition of activity across all 4 survey waves are illustrated in Figure 121. Key features of this distribution are:
- The main form of activity reported by parents overall is employment. In June 2019, for example, it accounts for between 75.9 per cent of the activity of single parents not using child care and 90.6 per cent of that of couple families, both using and not using child care.
- Single parents using child care had, on average, 76.3 per cent of their activity as paid employment; 2.6 per cent as self-employment, 13.4 per cent as study; 1.7 per cent as training; 0.2 per cent as time spent on employment programs; 3.5 per cent in unpaid work, including volunteering; and 2.3 per cent job search.
- For couples using child care, an average of 78.1 per cent of combined activity (i.e. both the respondent to the survey and their partner) was engagement in paid employment. This was followed by 12.5 per cent as self-employment, 4.2 per cent in study; 1.1 per cent in training; 0.2 per cent on employment programs; 2.6 per cent in unpaid work, including volunteering; and 1.3 per cent in job search.
Figure 121: Weekly hours of activity recorded in the DESE/ORIMA parent survey, by family type and whether used child care, June 2018 to November 2019
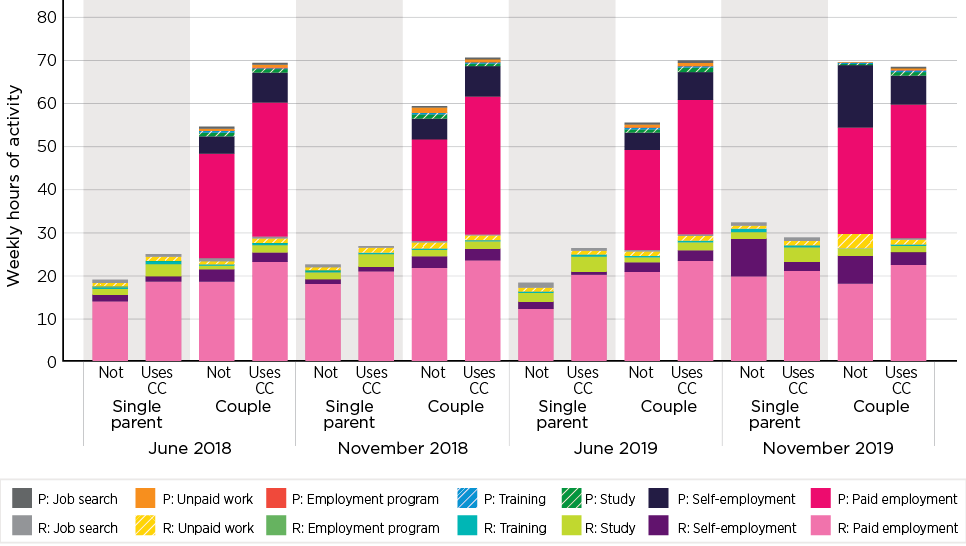
Notes: P = Partner. R = Respondent. Child care user defined as a parent who has a reference child in an identified formal child care reference care.
Source: DESE/ORIMA Parent Survey. June 2018, November 2018, June 2019, November 2019
As seen in Chapter 2, it is also possible to develop from the DESE/ORIMA data a labour market type classification of households. This is again done here. In contrast with the activity-based measures, this is primarily based on the information provided in the survey on the employment arrangements of individuals and their partners, complemented in some cases with the use of the information on employment hours. While not as broad a measure as that based on activity, in other respects it is valuable in being able to include groups such as those on paid maternity leave.
Figure 122 presents this data for those families that are identified as using formal child care across all 4 surveys. Again, caution needs to be exercised, given the question of seasonality that particularly seems to be impacting some of the full-time employment categories. In aggregate this data suggests no significant shifts in the level of employment among these families over the period of the introduction of the new child care arrangements, although there was an apparent, but not statistically significant, decline in the proportion of single parents classified as not having employment.
Figure 122: Families using child care, by family type and family employment status, DESE/ORIMA parent survey, June 2018 to November 2019
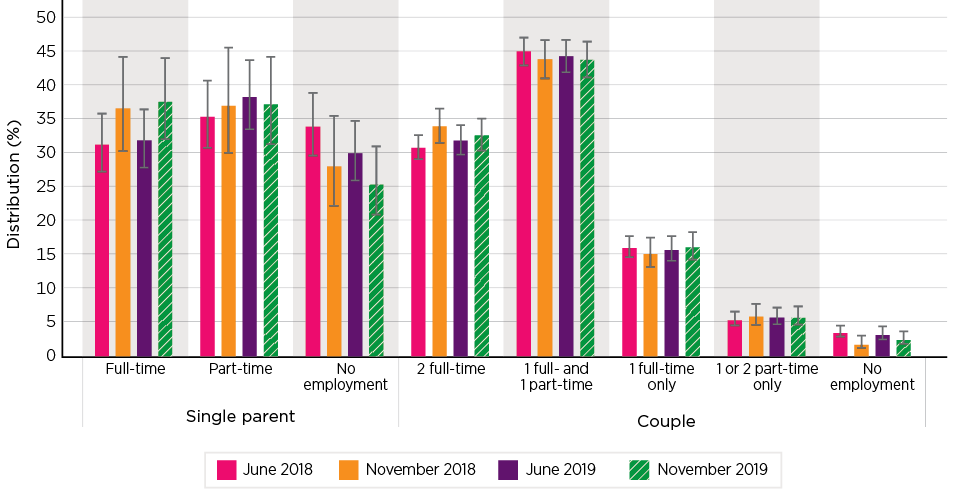
Notes: Family labour force distribution is within family type; that is. each of the types within single parents sums to 100 per cent, as does each within couple families. Child care user defined as a parent who has a reference child in an identified formal child care reference care. Error bars on the chart show the 95 per cent confidence interval.
Source: DESE/ORIMA Parent Survey. June 2018, November 2018, June 2019, November 2019
Activity test
The operation of the activity test has been described in Chapter 1, and the implications for affordability in Chapter 4. This section considers changes in the participation of families within the different bands of the activity test using data collected on activity in the DESE/ORIMA surveys, with a particular focus on women. This approach complements the analysis of activity using administrative data, allows for comparisons with activity prior to the implementation of the Package, and also permits a closer focus on the activity undertaken by women, including some comparisons with those not using formal child care.
While being described as activity test type analysis, it is to be noted that this treatment is conceptual. In particular, the DESE/ORIMA data provided to the evaluation does not permit the modelling of exemptions, other than a broad approximation in the June 2018 survey. Additionally, the more specific wording of the specification of activity for parents' reporting in the administrative process may impact the measure. In contrast with the above discussion, this analysis considers all activity, not just employment.
As illustrated in Figure 123, using this approach, most child care using families were in the top activity band, with either the single parent, or the member of a couple with the lower activity, undertaking over 24 hours of activity per week. This group was followed by those with more than 8 and up to 24 hours of activity, and then those with fewer than 4 hours of activity.
While none of the differences for couple families were statistically significant, 2 of those for single parents were. These were a fall from 21.0 per cent to 13.0 per cent in the proportion who reported less than 4 hours activity between June 2018 and November 2019 and an increase in the proportion of those classified in the top grouping from 50.8-64.3 per cent over the same period. Turning to the whole population of parents, data (which is only available for the period to June 2018), identifies a statistically significant fall in the proportion of single parents who report less than 4 hours of activity between June 2018 and November 2018, but no statistically significant change between June 2018 and June 2019, although the increase in those with 4 to less than 8 hours was significant.
Figure 123: Proportion of families using child care in activity test bands, DESE/ORIMA parent surveys, June 2018 to November 2019
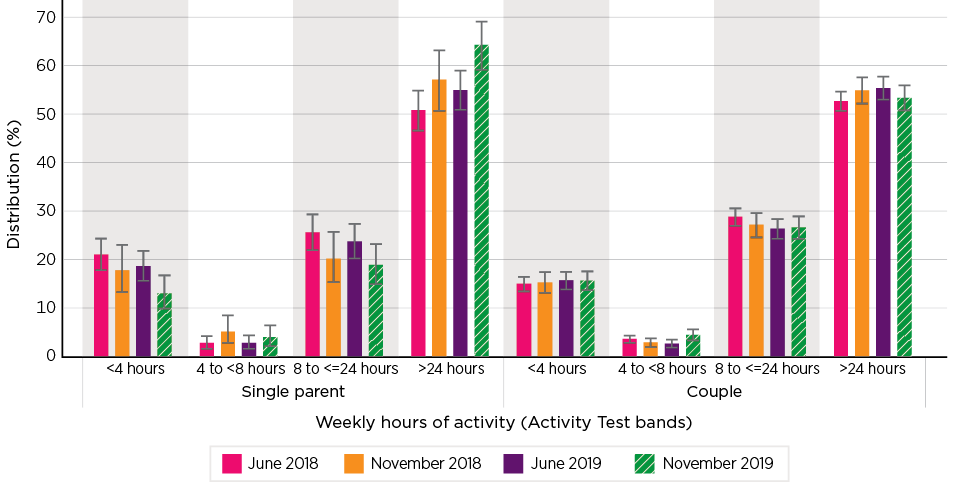
Notes: Activity distribution is within family type; that is, each of the bands of activity for single parents sums to 100 per cent, as does each within couple families. Child care user defined as a parent who has a reference child in an identified formal child care reference care. Error bars on the chart show the 95 per cent confidence interval.
Source: DESE/ORIMA Parent Survey. June 2018, November 2018, June 2019, November 2019
These results tend towards suggesting an increase in reported level of activity among single parents who use child care, with this being more marked in terms of category changes, but no change among couple families.
Women's activity
While the activity test applies in couples to the person with the lower level of activity, there is also merit in considering more specifically the experience of women. One dimension of this can be seen in Figure 124, which shows the average weekly hours of activity by women in families by the age of youngest child. The pattern shows 2 strong traits. The first is higher activity by those women who use formal child care in comparison with those who do not. The second is the child age-participation profile, with participation increasing with the age of the youngest child. (The decline in activity among child care users with older children tends to reflect the particular circumstances of this small group of child care users, including the incidence of children with additional needs.)
Figure 124: Women average hours of activity by age of youngest child, DESE/ORIMA Parent Survey, June 2019
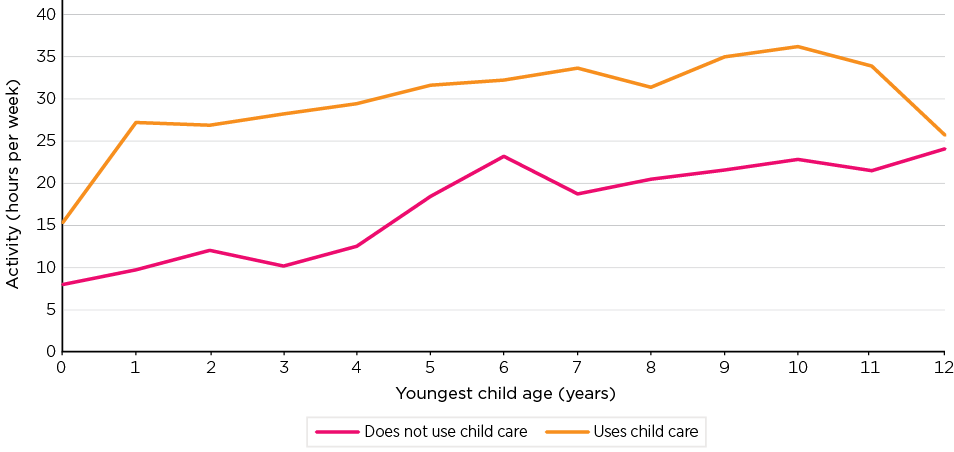
Notes: Child care user defined as a parent who has a reference child in an identified formal child care reference care.
Source: DESE/ORIMA Parent Survey, June 2019
The distribution of women in families by activity level and whether they use child care, using the activity classification of the activity test, is shown in Figure 125. None of the changes between surveys, or across the time periods shown, are statistically significant. This suggests that there has been no major change in the composition of engagement by women either among those using child care, or those not using, following the introduction of the Child Care Package.
Figure 125: Distribution of women in families, by whether using child care and activity, classified by activity test ranges, DESE/ORIMA parent surveys, June 2018 to November 2019
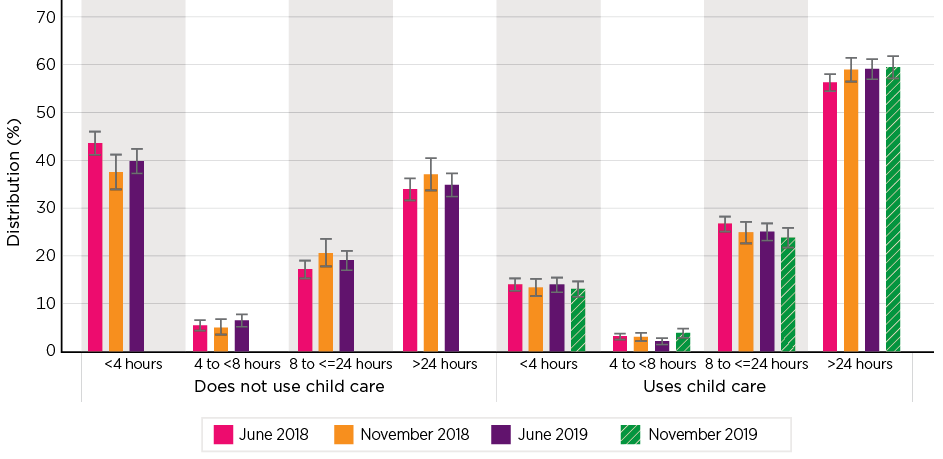
Notes: Activity distribution is within users and non-users; that is, each of the bands of activity for users sums to 100 per cent, as does each within non-users. Child care user defined as a parent who has a reference child in an identified formal child care reference care. Error bars on the chart show the 95 per cent confidence interval.
Source: DESE/ORIMA Parent Survey. June 2018, November 2018, June 2019, November 2019
Early analysis identified that most reported activity is employment - either as paid employee or as self-employed. As shown in Figure 126, this is, however, not consistent for women using child care across activity levels. While employment accounted for almost 90 per cent of the activity of women who reported 24 hours or more activity per week, this proportion falls across the identified activity groups to below 30 per cent, and in some surveys below 20 per cent, for those who report less than 4 hours activity. Again, over the 4 waves of the survey, there is no significant change in the proportion of activity represented by employment in any of the groups.
Figure 126: Women in families using child care, employment as a proportion of reported activity, by activity category, DESE/ORIMA parent surveys, June 2018 to November 2019
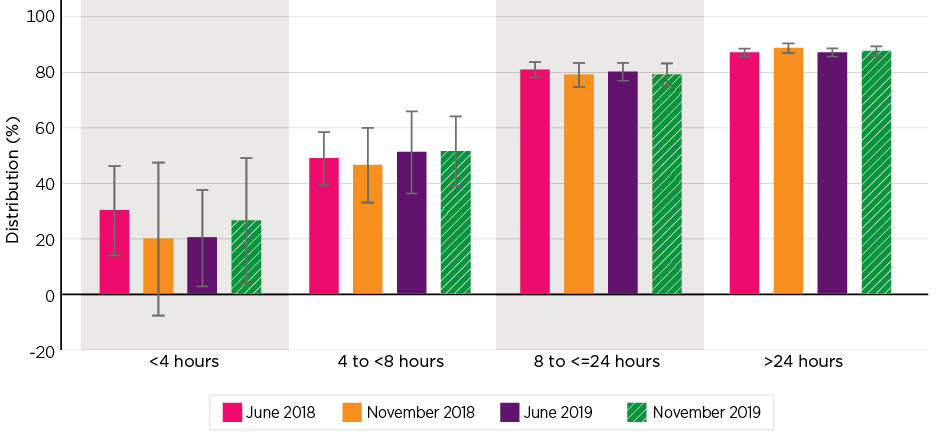
Notes: Child care user defined as a parent who has a reference child in an identified formal child care reference care. Error bars on the chart show the 95 per cent confidence interval.
Source: DESE/ORIMA Parent survey. June 2018, November 2018, June 2019, November 2019
8.2.3 Summary trends in activity
Parental activity has been considered with regard to both the administrative data and that collected from the DESE/ORIMA parent survey. In understanding this data it is emphasised that it represents a series of cross-sectional snapshots of the population and not longitudinal change by individuals. The administrative data suggests, on average, a slight increase in reported activity, but this is modest, just an annual rate of 1.4 per cent for single parents, and 0.3 per cent for couples. This increase, when analysed in terms of families, shows a stronger pattern of change in participation at the extensive margin, but a fall at the intensive margin. Even here, however, the effect is modest. Analysis of the DESE/ORIMA parent survey suggests some increase among single parents who used child care over the period to November 2019, but caution needs to be exercised, given potential seasonal impacts on this trend, with trends for single parents both using child care and not using child care not showing a significant change over the one year period from June 2018 to June 2019. For couples, there were no statistically significant changes. For single parents using child care, analysis of some of the categorical shifts associated with the Child Care Package were more marked than actual changes in total activity levels.
8.3 Reported parental labour market responses to Child Care Package
A more direct attempt to measure the impact of the Child Care Package on workforce participation was undertaken in the DESE/ORIMA parent survey. In each of the waves since November 2018, this survey has asked those parents using paid child care whether they, and their partner, if they had one, had 'made any changes to their work arrangements as a result of the Government's new child care fee assistance'. Response categories allowed them to respond that they had increased, or decreased, their hours of work, had made no change, or whether they were unsure either as to how their employment has changed or whether this could be attributed to the program changes. There was also some variation between surveys in the scope of the population asked these questions. In the November 2018 and June 2019 surveys it was asked of those who had used child care157 at some stage since 2 July 2018. In November 2019 it was asked of those who had used child care at some point after July 2019.
As shown in Table 99, there is a wide range of responses to the question, although for both parents in couples and single parents the dominant response was that of no change.
| Respondent | Partner | Total | |||
|---|---|---|---|---|---|
| Increase | Decrease | No change | Unsure | ||
| Proportion of families (%) | |||||
| Couple | |||||
| Increase | 3.6 | 0.2 | 5.5 | 0.6 | 9.8 |
| Decrease | 0.5 | 1.3 | 4.8 | 0.5 | 7.1 |
| No change | 1.1 | 1.6 | 67.9 | 1.2 | 71.8 |
| Unsure | 0.1 | 0.2 | 4.0 | 7.0 | 11.3 |
| Total | 5.3 | 3.2 | 82.2 | 9.3 | 100.0 |
| Single parent | |||||
| Increase | 9.9 | ||||
| Decrease | 7.7 | ||||
| No change | 68.6 | ||||
| Unsure | 13.8 | ||||
| Total | 100.0 | ||||
Source: DESE/ORIMA Parent Survey, November 2019
The existence of both positive and negative labour market responses is consistent with the theoretical framework identified at the beginning of the chapter, and with the differential impact of the Package on the cost of child care for different families.
To facilitate interpretation of these results, they have been condensed into 3 categories - 'no change' where this, or unsure, is the response of both partners, or where one reports increasing and one reports decreasing activity, and 'increase' and 'decrease' when either both members report the same movement, or one reports this movement, and the other has no change, or is uncertain.
The pattern of responses by the current labour market participation of families is shown in Table 100. While providing some insight, it needs to be recognised that these labour market states may in fact reflect the consequence of the change the respondents report. For example, couples with no employment may be in that state because of the decreased labour market activity they report, and similarly would not remain in that state if they increased their activity. (Although regard needs to also be given to potential temporal effects, with them having had some employment since the Package was introduced, but not currently).
Overall, the table indicates that the proportion of families increasing their activity, 10.8 per cent, is higher than the 8.3 per cent that decreased activity. This proportion was virtually the same for couple and single parent families. The net balance is slightly higher at +2.5 percentage points for couples, compared to +2.2 percentage points for single parents.
| Work activity response | Proportion of families | |||||
|---|---|---|---|---|---|---|
| Increase | No change a | Decrease | Total | Net change | ||
| Distribution of labour market response (%) | (percentage points) | (%) | ||||
| Single parent | ||||||
| Full-time | 11.1 | 87.5 | 1.4 | 100.0 | 9.7 | 5.8 |
| Part-time | 13.9 | 76.1 | 10.0 | 100.0 | 3.9 | 5.6 |
| No employment | 2.4 | 83.9 | 13.7 | 100.0 | -11.3 | 3.9 |
| Single parents - Total | 9.9 | 82.4 | 7.7 | 100.0 | 2.2 | 15.3 |
| Couple b | ||||||
| 2 Full-time | 11.6 | 80.2 | 8.3 | 100.0 | 3.3 | 27.4 |
| 1 Full- & 1 Part-time | 11.4 | 80.0 | 8.6 | 100.0 | 2.7 | 37.0 |
| 1 Full-time only | 9.7 | 82.3 | 8.0 | 100.0 | 1.7 | 13.7 |
| 1 or 2 Part-time only | 11.6 | 81.1 | 7.3 | 100.0 | 4.3 | 4.6 |
| No employment | 0.0 | 88.9 | 11.1 | 100.0 | -11.1 | 2.0 |
| Couples - Total | 10.9 | 80.7 | 8.4 | 100.0 | 2.5 | 84.7 |
| All families | 10.8 | 80.9 | 8.3 | 100.0 | 2.5 | 100.0 |
Notes: a Includes those who state they are uncertain. b Couples have been coded as follows: 'no change' where this, or unsure, is the response of both partners, or where one reports increasing and one reports decreasing activity. 'Increase' and 'Decrease' when either both members report the same movement, or one reports this movement, and the other has no change, or is uncertain.
Source: DESE/ORIMA Parent Survey, November 2019
While this slight balance towards an increase, relative to a decrease, is seen consistently across the surveys, for both couples and for single parents, as shown in Figure 127, none of these differences in any of the surveys are significant at the 95 per cent confidence level.158 Notwithstanding this lack of significance, these results suggest that, on balance, the response is more likely to be positive; that is, towards increasing employment, rather than negative. However, in all cases the difference is quite small - with the overall effect being some 2.5 percentage points in favour of higher employment - an order of magnitude not inconsistent with any of the other shifts in activity seen above. While this data reports on whether or not there has been a change in activity, data is not available on the magnitude of this. As detailed in Section 8.4.2, when parents express a desire to work more or fewer hours there is considerable variation in the change that is sought.
More detailed analysis of these responses suggests that among couples the effect of a positive shift was more frequently observed among those with a child under the age of 5 years, with a negative shift for those with children aged 5-13 years. Again, however, these were non-significant, and the magnitude only a few percentage points. There was no consistent pattern among single parents.
Additional analysis to identify whether any of these patterns could be associated with parental attitudes with regard to the importance of a parent staying at home, and the importance they attach to a career,159 showed no significant differences. Nor were any differences found when the data was analysed on the basis of whether families lived in the capital cities or other regions.
Figure 127: Families using child care, whether or not have changed work arrangements as a result of the Child Care Package, DESE/ORIMA parent survey, November 2018 to November 2019
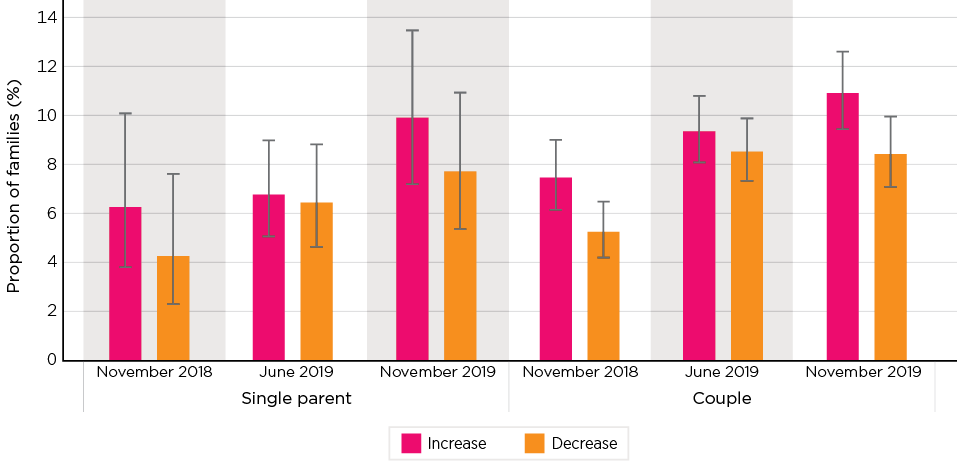
Notes: Refer to Table 100 notes on classification of responses. Child care user based on whether they reported use of child care over a defined period. Error bars on the chart show the 95 per cent confidence interval.
Source: DESE/ORIMA Parent Survey, November 2018, June 2019, and November 2019
In summary, these reported parental labour market responses to the impact of the Child Care Package are consistent with the underlying economic expectation that there would be both positive and negative effects. For most families no adjustments were made to their working arrangements. Where change occurred, this was in both directions, with a tendency towards an increased level of engagement. This, while not statistically significant, was however consistent. On average, across the 3 surveys, the net difference was for a gain of 1.5 percentage points for single parents and 1.9 percentage points for couples.
8.4 Parents' preferences and barriers
Employment outcomes are also dependent on parents' preferences and the barriers they may face in seeking or holding employment. Chapter 2 has identified a spread of parental responses to how they see the value of early childhood education and care for their children.
This section considers the impact of attitudes with respect to labour market engagement, firstly with regard to broad attitudes relating to a parent having a career, and a parent staying at home, then their preferences to work more or less, and thirdly what they see as some of the barriers to their capacity to obtain the employment outcome they seek.
8.4.1 Attitudes to work and caring for children
The DESE/ORIMA parent survey asked respondents about their level of agreement with the statement 'Having a career is important to me'.160 Across all parents, in June 2019,161 3.6 per cent of parents strongly disagreed with this proposition, 6.6 per cent disagreed, 18.0 per cent said they neither agreed nor disagreed, 42.8 per cent said they agreed and 29.0 per cent that they agreed strongly. These results are similar to those recorded in other survey waves. As shown in Figure 14, these attitudes varied across the population. Using mean recoded scores, as with Chapter 2, the figure shows a stark contrast between those respondents who use child care and those who do not. For those who do use child care, the mean score sits above one - indicating an average between agreement, and strong agreement, on the importance of a career. In contrast, non-users had scores that pointed to an average between neither agreeing nor disagreeing and agreeing. These differences were highly statistically significant. The chart indicates there was no significant differences in the attitudes of single parents and those in couples, where the family used child care. While there were no significant differences among those who did not use child care, for both single parents, and for couples, there was a slight tendency towards greater support for the proposition among those with an older youngest child.
Figure 128: Parents, level of agreement with statement 'Having a career is important to me', DESE/ORIMA parent survey, June 2019
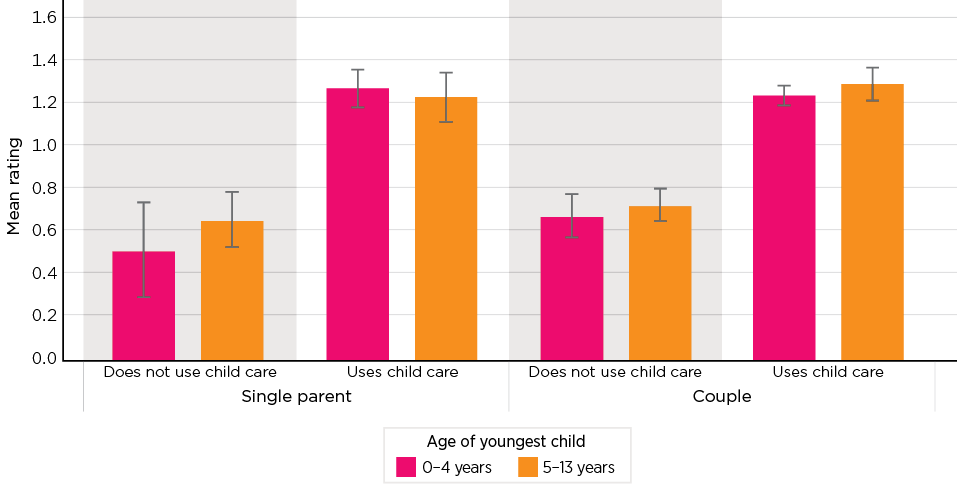
Notes: This question asked a respondent parent to state their level of agreement with the statement. The charts show the mean score on a 5-point scale centred on those who neither agree nor disagree. The weights attached were 'Strongly disagree': -2; 'Disagree': -1; 'Neither agree nor disagree': 0; 'Agree': +1; and 'Strongly agree': +2. Error bars on the chart show the 95 per cent confidence interval on the estimate.
Source: DESE/ORIMA Parent Survey June 2019
A second question in these surveys asked parents about their level of agreement with the statement: 'At least one parent should stay at home/not work while children are young'. Relative to the question on the importance of a career, this proposition, on average, received less support, although a majority of people did agree with it, with 20.0 per cent agreeing strongly and 32.1 per cent agreeing. Another large group, 30.6 per cent, said they neither agreed nor disagreed, with 13.2 per cent disagreeing, and 4.1 per cent strongly disagreeing.
There was again a stark difference in the attitudes of those who were using child care and those who were not, for both single parents and couples, and by the age group of the youngest child. These differences, within each of the 4 cross classifications of these 2 variables were significant. Considering non-users, one difference that does emerge was that, for both single parents and couples, those with a youngest child in the older age range were less likely to support this proposition than those with a younger youngest child. This difference was, however, only significant among couples.
Figure 129: Parents, level of agreement with statement 'At least one parent should stay at home/not work while children are young', DESE/ORIMA parent survey, June 2019
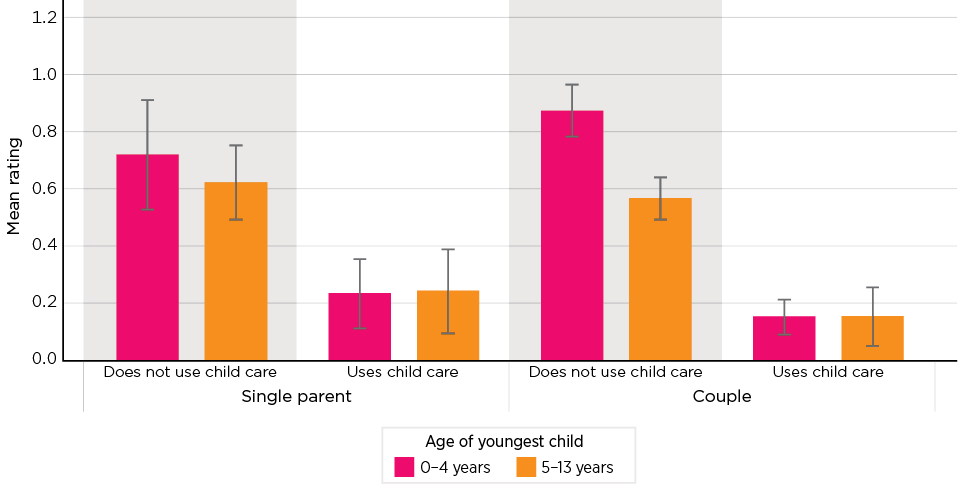
Notes: This question asked a respondent parent to state their level of agreement with the statement. The charts show the mean score on a 5-point scale centred on those who neither agree nor disagree. The weights attached were 'Strongly disagree': -2; 'Disagree': -1; 'Neither agree nor disagree': 0; 'Agree': +1; and 'Strongly agree': +2. Child care user defined as a parent who has a reference child in an identified formal child care reference care. Error bars on the chart show the 95 per cent confidence interval on the estimate.
Source: DESE/ORIMA Parent Survey June 2019
8.4.2 Preferences to work more or less
The DESE/ORIMA survey also asked parents about their preference to work more or fewer hours 'taking into account how it would affect your family income'. Across the first 3 waves of the survey162 in which responses were obtained from both child care users and non-users, between 20 and 24 per cent of respondents said they wanted to work fewer hours, 39-44 per cent that they wanted to work the same hours, and 17-20 per cent that they wanted to work more hours. Some 15-22 per cent said they did not know what their preference was.
Figure 130 presents these results for the June 2019 survey, for the population of parents divided into formal child care users and non-users. Although, for each of these, the main response was that they wished to maintain their current working arrangements, there was a difference in the balance between those wanting to increase and those wanting to decrease their hours. For those parents currently not using child care, these 2 groups were essentially the same size, 19.7 per cent wanting to work fewer hours, and 20.0 per cent wanting to work more hours - with there being no statistical difference between these estimates. In contrast, among child care users, 24.7 per cent said they wanted to work fewer hours, even taking into account the impact this would have on family income, a statistically significantly higher proportion than the 17.2 per cent wanting to work more hours.
Figure 130: Parents, preference to work more or fewer hours, by use of child care, DESE/ORIMA parent survey, June 2019
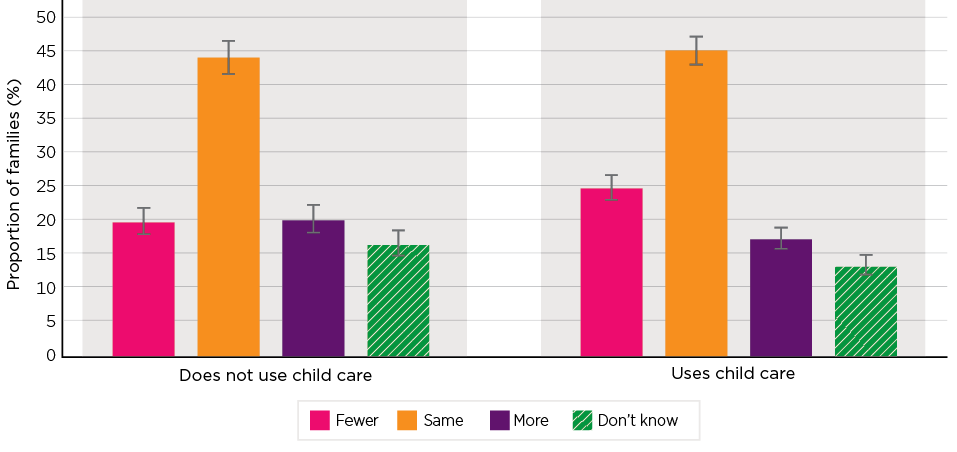
Notes: Distribution is within users and non-users; that is, each of the set of responses for users sums to 100 per cent, as does each within non-users. Error bars on the chart show the 95 per cent confidence interval on the estimate. Child care user defined as a parent who has a reference child in an identified formal child care reference care.
Source: DESE/ORIMA Parent Survey June 2019.
These results are further considered in Figure 131 with the population restricted to those using child care, but split between couples and single parents. While for couple parents the proportion wishing to work fewer hours (26.0 per cent) significantly outweighed the proportion who wanted to work more hours (15.9 per cent), this situation was reversed for single parents. Among these parents, not only was the proportion who wished to work the same hours significantly lower than for couples (in part because of a much higher group who responded that they did not know), but the proportion wanting more work (24.3 per cent) was significantly higher than the 17.6 per cent who wanted to work fewer hours.
Figure 131: Parents using child care, preference to work more or fewer hours, by family type, DESE/ORIMA parent survey, June 2019
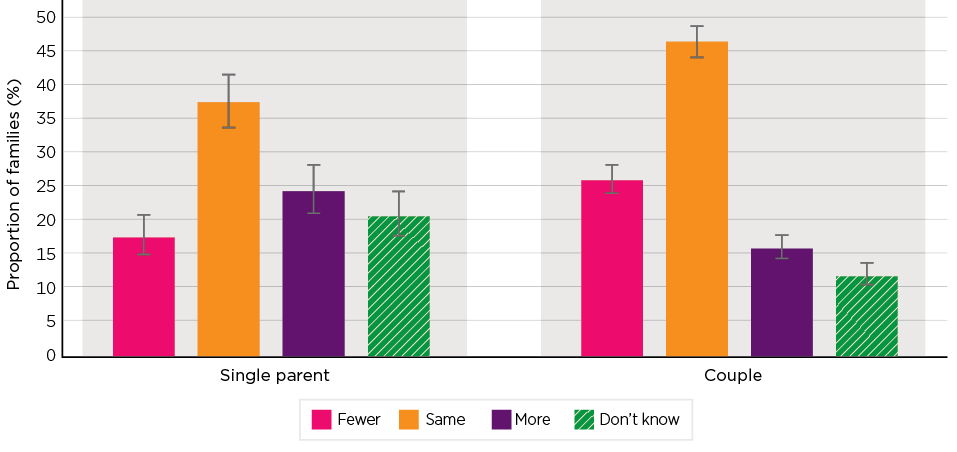
Notes: Error bars on the chart show the 95 per cent confidence interval on the estimate. Child care user defined as a parent who has a reference child in an identified formal child care reference care.
Source: DESE/ORIMA Parent Survey June 2019
Preferences to work more, or fewer, hours were also closely associated with household income. As shown in Table 101, low income households expressed, on balance, a very strong preference to work more (but also reporting much more uncertainty), with the proportion preferring to work fewer hours then increasing most of the way up the income distribution.
| Gross family income: | Respondent preference to work | Total | Share of families | |||
|---|---|---|---|---|---|---|
| Fewer | Same | More | Do not know | |||
| Proportion of respondents (%) | (%) | |||||
| <$30k | 6.0 | 22.5 | 35.2 | 36.2 | 100.0 | 9.9 |
| $30-<65k | 12.5 | 38.7 | 26.8 | 22.0 | 100.0 | 22.7 |
| $65-<125k | 24.4 | 51.3 | 16.3 | 7.9 | 100.0 | 52.0 |
| $125-<170k | 30.6 | 54.9 | 8.6 | 5.9 | 100.0 | 9.6 |
| $170-250k | 43.5 | 42.4 | 8.5 | 5.6 | 100.0 | 3.3 |
| $250-<340k | 49.4 | 42.3 | 4.8 | 3.5 | 100.0 | 0.6 |
| >=$340k | 35.2 | 53.4 | 10.1 | 1.3 | 100.0 | 2.0 |
| Total | 21.5 | 45.6 | 19.4 | 13.5 | 100.0 | 100.0 |
Source: DESE/ORIMA Parent Survey June 2019
In addition to the respondents' preferences, the survey also allows estimates of the extent of adjustment in working time sought. This is illustrated in Figure 132. For the categories of families shown, the average hours of reduced work sought ranged from -11.8 hours per week for single parents who use child care to -16.0 hours per week for those who do not use child care. However, it needs to be recalled that these groups were relatively small. In contrast, where respondents said that they wanted to work more, the additional hours sought ranged from 15.3 hours for single parents who were using child care to 20.7 hours by members of couples who did not use child care. For both single parents and members of couples wanting to increase hours, the level of additional hours sought by those using child care was significantly lower than those who currently were not using child care.
Figure 132: Level of change in work hours per week sought by those wishing to work more or fewer hours, by family status and use of child care, DESE/ORIMA parent survey, June 2019
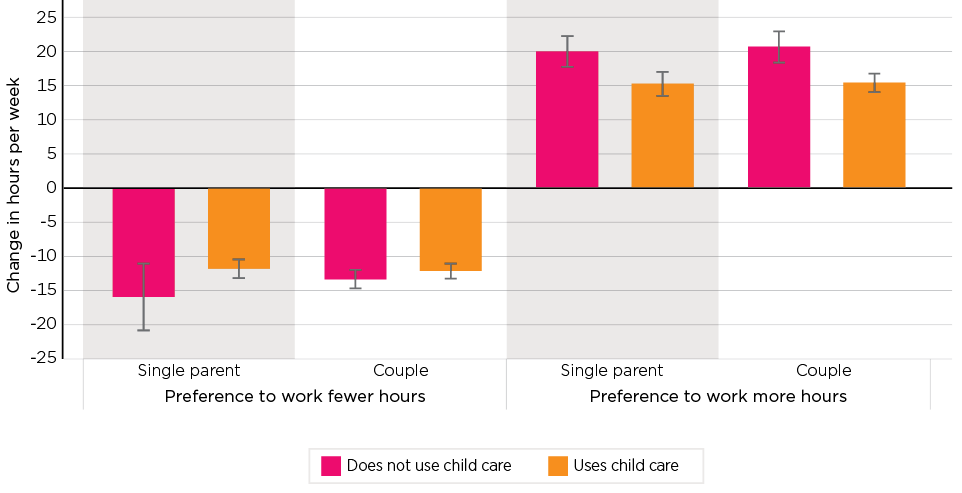
Notes: Estimated change in hours based on difference between stated preferred hours of employment and sum of current hours as a paid employee and hours as self-employed. Excludes some records with anomalous results such as those stating a preference to work more, but where their existing hours of work exceed their preferred hours. Error bars on the chart show the 95 per cent confidence interval on the estimate. Child care user defined as a parent who has a reference child in an identified formal child care reference care.
Source: DESE/ORIMA Parent Survey June 2019
8.4.3 Perceived barriers to employment
Those respondents who said that they wanted to do more paid work were asked also about what might enable them to do so, and what barriers they faced. Two of the questions related to labour market aspects: whether being able to work more flexible hours would assist; or whether they would be assisted if 'there was more suitable work available', with the remaining 3 concerning child care. These were whether they could do more paid work: if 'child care was more flexible in the hours it offered'; if 'child care was more affordable'; and if 'I could get more hours of child care'.
Concern about the availability of suitable work was the most frequently cited reason by non-child care users (78.9 per cent), see Figure 133, followed by more flexibility in work hours (73.1 per cent), child care affordability (51.8 per cent), flexibility in child care provision (41.8 per cent), and the hours of child care they could obtain (37.4 per cent). In contrast, the most frequently cited barrier for those already using child care who wanted to increase their hours of care was that of affordability of child care (77.6 per cent), followed by flexibility in work hours (67.3 per cent), availability of suitable work (61.7 per cent), the flexibility of child care (58.9 per cent), and their ability to obtain more hours of care (53.0 per cent). In all cases, other than more flexible working arrangements, the differences between users and non-users of child care were statistically significant - suggesting the experience, or possibly knowledge, of barriers between the 2 groups differed. While, as evidenced, child care related reasons were cited by many of these respondents, the proportion of these parents wanting more work who responded that they might be helped by child care related measures only, was small. Just 4.3 per cent of non-child care users cited only child care related barriers, as did 13.8 per cent of child care users, with these proportions, in turn, relating to just the 20.0 per cent of non-child care users and 17.2 per cent of child care users indicating that they wanted to work more.
As such, while child care related factors are a barrier to some parents seeking to increase their paid work, it is the sole barrier for a relatively small proportion, and is more significant for those already using child care, with cost being the most frequently cited problem.
Figure 133: Persons wanting to work more hours, what would help them, DESE/ORIMA parent survey, June 2019
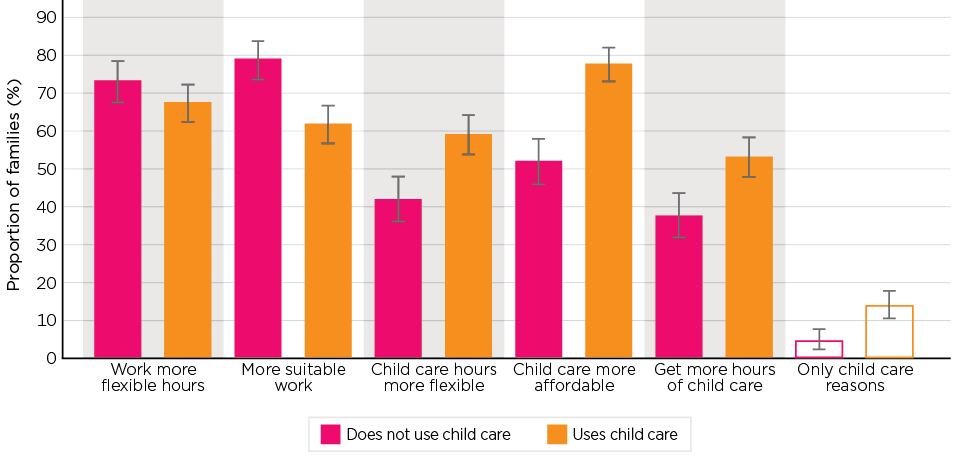
Notes: Identification of items based on the number of respondents reporting that they agreed, or agreed strongly, that this might help them do more paid work. Respondents could give more than one reason. Error bars on the chart show the 95 per cent confidence interval on the estimate. Child care user defined as a parent who has a reference child in an identified formal child care reference care.
Source: DESE/ORIMA Parent Survey June 2019
8.4.4 Case study analysis
Consistent with the DESE/ORIMA parent survey findings, in each of the case studies most families reported no change to their working arrangements following the introduction of the Child Care Package. Most low and middle income working families involved in the studies spoke of either being slightly better off financially or much the same under the new subsidy structure. However, they reported that any financial improvement was not substantial enough to influence their decisions relating to their work arrangements.
Low and middle income working families in the case studies still spoke of the significant financial burden that child care fees placed on the family budget. This was particularly true if their children were aged under 5 years and required Centre Based Day Care or Family Day Care, whereas Outside School Hours Care, as well as state funded preschool programs, were considered more affordable. Low and middle income working families in the case studies instead spoke about needing to weigh up the financial and personal benefits of work with the cost of child care and make decisions that best suited their family situation, particularly if they had more than one child under the age of 5 years.
As previously noted, many higher income families saw a reduction in financial assistance with the introduction of the Child Care Package. Most high income working families engaged through the case studies spoke of absorbing the additional cost of child care without making changes to their child care or work arrangements. However, some reported that they felt forced to make changes, which included: working fewer days thereby reducing their use of child care, relying on informal care, utilising private child care services (such as a nanny or au pair) and/or accessing state-funded preschool programs.
Several participating family members noted that the cost of child care presented a disincentive to either return to full-time employment following a period of parental leave or to increase their level of workforce engagement as their child or children age. This was explained, by one high income parent, who worked 3 days a week, as:
I knew when the subsidy was coming through that there would be a drop [in subsidy] for us […] I was always concerned, and I think I do feel that the impact for those in our higher wage bracket is that there's not the motivation for me to work more hours. So, I had previously, with [my eldest son], gone quite quickly to 0.7 FTE [full-time equivalent] and then to 0.8 FTE but it would not be to my financial advantage anymore, because our child care out-of-pocket is so great.
[Family using CBDC and OSHC, April 2020]
Many working women in the case studies reported that for them career decisions needed to be balanced against affordability. Some spoke of returning to their substantive, pre-parental leave, work arrangements for reasons of career progression despite a perception that there was either no or very little immediate financial benefit from doing so. Some women from dual income families in which one, or both, parents worked shift work spoke of juggling child rearing responsibilities between both parents to enable engagement in paid employment without the cost of child care services. An example of this was a shift worker who had one child at school and was accessing Outside School Hours Care and 2 children in Centre Based Day Care, who explained:
I can work one of my husband's days off and then I can work another day, but if I wanted to work more, I'd have to get another day of child care. The more days of child care we get the less beneficial it is for me to work. So, for me to work when my husband is at home, we can save that money from child care […] I have to do at least two days a week to do anything in my job. But any more than that, then we start - it's not really beneficial running around all the time and picking everybody up and dropping everybody off, doing all the things that would need to be done. [Family using CBDC and OSHC, August 2019]
While only a small number of family members not using child care were able to be engaged in the case studies, those who did take part often spoke of working in casual positions in the retail or hospitality sectors. For these respondents, both issues of the affordability and flexibility of child care were given as barriers to employment. As noted by one woman, who had considered returning to work after the birth of her children but reported that she had discovered that it would not be financially beneficial to do so, particularly as she would only be able to work during the standard operating hours of most Centre Based Day Care services:
I would not be going back full-time; I'd only be going back on a casual basis and sort of work around the kids. My husband works away interstate a lot, so I need to be here as much as I can. Basically, the hours that I would be working would basically just be paying for child care. You know what I mean? I just didn't see a benefit in paying child care fees
[Family not using child care, August 2019]
This perspective suggests that without the added incentive of potential long-term career progression, which was cited by some of the other respondents who are using care, there was significantly less incentive for this parent to juggle work hours around child rearing responsibilities when there was limited immediate financial gain.
8.5 Financial incentive to be in paid employment: Effective Marginal Tax Rates (EMTRs)
The primary purpose of employment for families is generally to obtain income that can be spent on meeting the family's needs. This section considers this from the perspective of how much of a person's earnings they actually have available to them after taking account of any reduced transfer payments as a result of income testing, the imposition of income tax, and the net cost of child care. In welfare analytics, this is considered to be an extended version of the 'effective tax rate' these families face. As this analysis considers this with regard to decisions by the parent to undertake an additional day of employment, and the rate describes the additional effective tax rate on these earnings, they are described as 'effective marginal tax rates'; that is, the reduction imposed on the additional earnings.
The modelling of these as discussed below is theoretical. It assumes that for each additional day of employment, the person requires an additional day of paid child care. In considering this it is recognised that many parents do not use formal child care for the whole of the time they are in employment, frequently combining some days of formal child care with some days of alternative care provided by a partner, their family or others. It is reasonable, however, to assume that to the extent these options are available to them, and are judged to be equal or better in terms of quality to that which a parent can obtain in child care, they will already utilise these to the extent possible, and hence any incremental increase in employment will be matched by a demand for formal care.163
It is also noted that the approach does not take account of the other costs of work, such as travel to work, additional costs for work appropriate clothing, and so forth. For some, these are significant and also need to be deducted from the actual income derived from employment to understand the actual gain individuals have to use. Additionally, many individuals will have HECS or other student debt repayments that will be triggered as they gain income.164 Similarly, the model does not take account of the potential for families to also be eligible for rent assistance as part of their FTB payments.165 As a result, for some individuals the EMTR can be substantially higher than what is indicated.
The modelling is undertaken for parents with younger children who require full-day care and, in the case of older children who only require care outside school hours, the impact of child care costs will be lower.
8.5.1 Overview of methodology for estimating EMTRs
The modelling here is undertaken using PolicyMod. It uses the values of transfer payments and tax scales as at Q4 2018. Two family types are modelled, a single parent and a couple, with each of these being modelled in a scenario where they have one child, and where they have 2 children. In both cases the children are assumed to be aged under 5 years. The single parent is assumed to be in receipt of Parenting Payment Single when this is not precluded by their earnings, and the partner in the couple family to be eligible for Parenting Payment Partnered.
The modelling is based on 3 levels of annual earnings, $40,000, $60,000 and $100,000. These can be seen as low income, low-middle income, and low-upper income but are simply described here as low, medium and high earners. ABS data on the distribution of earnings of full-time non-managerial employees paid at the adult rate in May 2018 indicates that 3.1 per cent of employees are paid under $41,600 per annum, 31.5 per cent below $62,400 and 75.0 per cent below $104,000 (ABS Cat No 6306.0, May 2018).
In the couple scenario it is assumed that one member of the couple is already earning a full-time wage at the rate of the scenario, with the partner earning the same annual rate with their income incrementing proportionally with the number of days they work. For the single parent, their income increments on the same basis.
It is assumed that for each additional day of employment the person will require a full day of child care at a cost of $100 - an hourly cost of $10 for a 10-hour session. This cost is a little below the median hourly cost of Centre Based Day Care of $10.20 an hour and Family Day Care of $10.55 in Q4 2019.
In each case the EMTR is calculated on an increment of a single day; that is, for example, of moving from no employment to one day of employment, or moving from 3 days employment to 4 days employment per week.
In the results of the model, as detailed below, components of the EMTR are shown. These are the deductions, as a proportion of gross earnings from the additional day of employment, accounted for by:
- Pension: The amount of Parenting Payment Single that is income tested away as a consequence of the earnings.
- Allowance: The amount of Parenting Payment Partnered or Newstart that is income tested away due to earnings.
- FTB: The reduction in the amount of Family Tax Benefit payable to the family due to income testing.
- Tax: The amount of income tax payable on the person's additional income, including the Medicare Levy, assuming that they have no other income.
- Child Care: This is the net cost of child care to the family; that is, the amount which they are required to pay after taking account of government subsidies for the additional day of care.
8.5.2 EMTRs for families with children using child care
Figure 134 and Figure 135 show the EMTRs experienced by families under both the old CCB/CCR funding model and the CCS by component. As detailed above, the charts are based on one day per week increments in employment and show the EMTR on that day's additional earnings.
As illustrated, the range of EMTRs faced by parents on these increments vary:
- Under the CCB/CCR they ranged from a low of 31.8 per cent for a single parent with one child and earning at a rate of $40,000 who moves from no employment to one day of employment a week to a high of 122.5 per cent for a single parent with 2 children moving from 4 to 5 days employment on an earnings rate of $100,000 per annum.
- Indeed, in 8 of the scenarios the family would face an EMTR of over 100 per cent.
- Under the CCS the EMTRs range from 24.7 per cent for a single parent (1 child, $40,000) moving from zero to one day's employment to 111.3 per cent for the single parent above who previously had an EMTR of 122.5 per cent (2 children, $100,000, 4 to 5 days). This is the sole scenario of those modelled here with an EMTR of over 100 per cent under the CCS, although a further 3 face EMTRs of over 90 per cent.
- Even under the CCS a third of the scenarios have EMTRs of over 75 per cent.
- In general, families face higher EMTRs as they add additional days of employment to an already higher base. The average EMTRs across the models under the CCS is 39.9 per cent for those moving from zero to one day, 63.4 per cent for 1 to 2 days, 70.0 per cent moving from 2 to 3 days, 73.9 per cent moving from 3 to 4 days and 78.7 per cent moving from 4 to 5 days. These are all lower than those under CCB/CCR.
- Across the 60 scenarios modelled under CCB/CCR, the median EMTR in these examples is 78.7 per cent, with an interquartile range from 59.7 per cent to 90.9 per cent. Under CCS the median reduces to 67.5 per cent and the interquartile range to 52.3 per cent to 78.3 per cent. The median reduction in EMTRS as a result of the CCS is 8.5 percentage points, and the interquartile range of reductions from 4.9 percentage points to 12.8 percentage points.
- While the relative EMTRs faced by single parents and couples vary across individual scenarios, on average, across all scenarios, the EMTR for single parents under the CCS of 67.1 per cent is higher than the 63.3 per cent of the second member of a couple. Both of these are, however, reductions on the 76.6 per cent and 74.1 per cent under CCB/CCR.
As shown in the charts, the contribution of different components of the EMTRs vary significantly. Averaging across all scenarios, the FTB component of the EMTR is an average rate of 11.3 per cent, net child care costs 16.3 per cent under the CCS, pensions and benefits 16.7 per cent, and taxation 20.8 per cent. The child care EMTR under the CCS represents a fall of 10.2 percentage point from the 26.5 per cent under the former CCB/CCR subsidy.
Figure 134: Modelled EMTR on incremental day of employment assuming additional day of employment involves additional day of child care at $100 per day, family with one child, Q4 2018
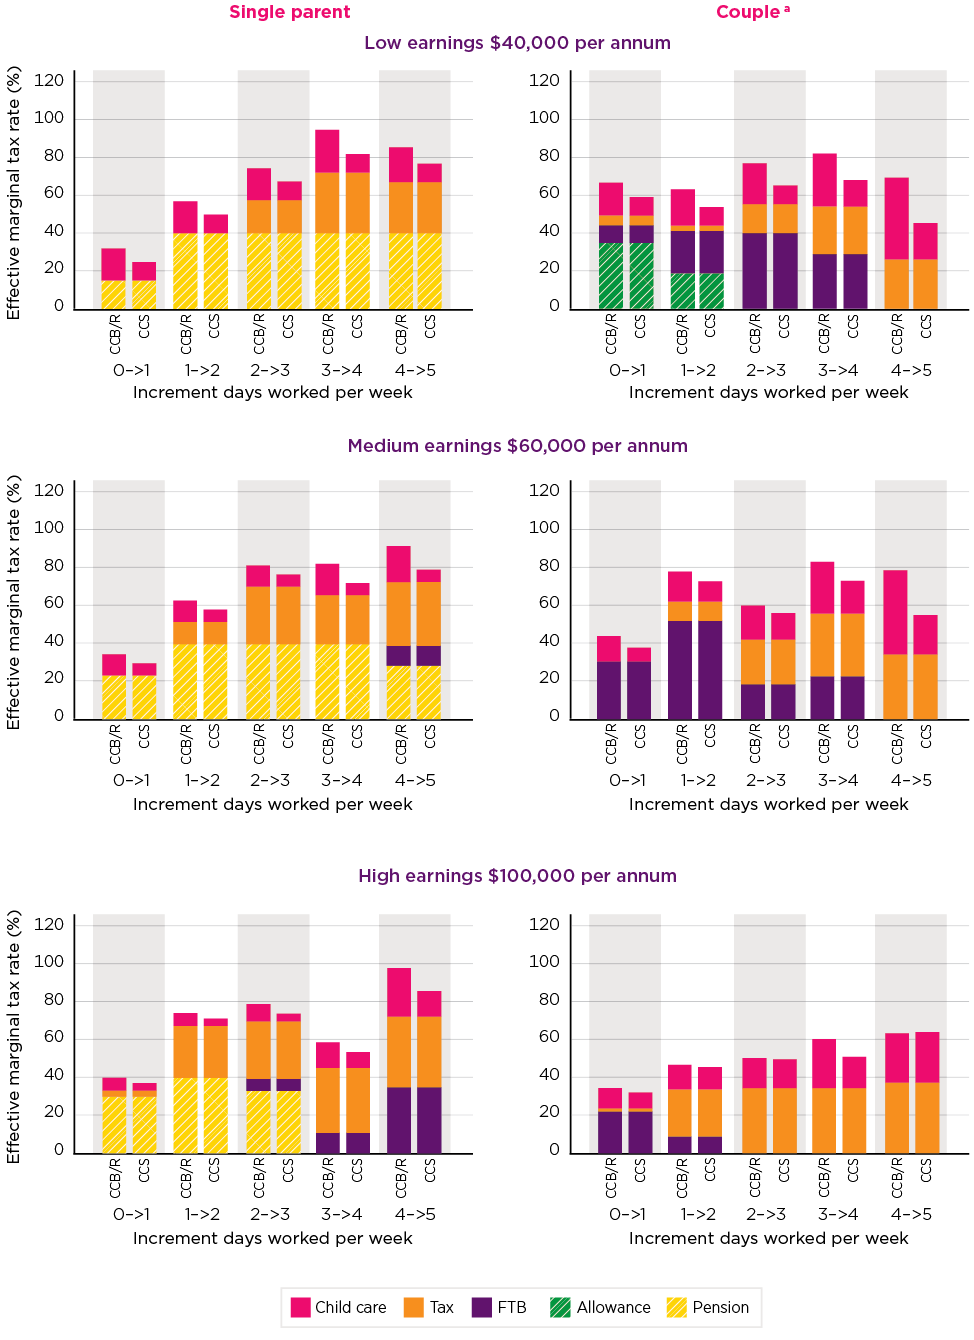
Note: a Assumes first member already earning at income indicated, and second earns at same rate.
Source: PolicyMod
Figure 135: Modelled EMTR on incremental day of employment assuming additional day of employment involves additional day of child care at $100 per day, family with 2 children, Q4 2018
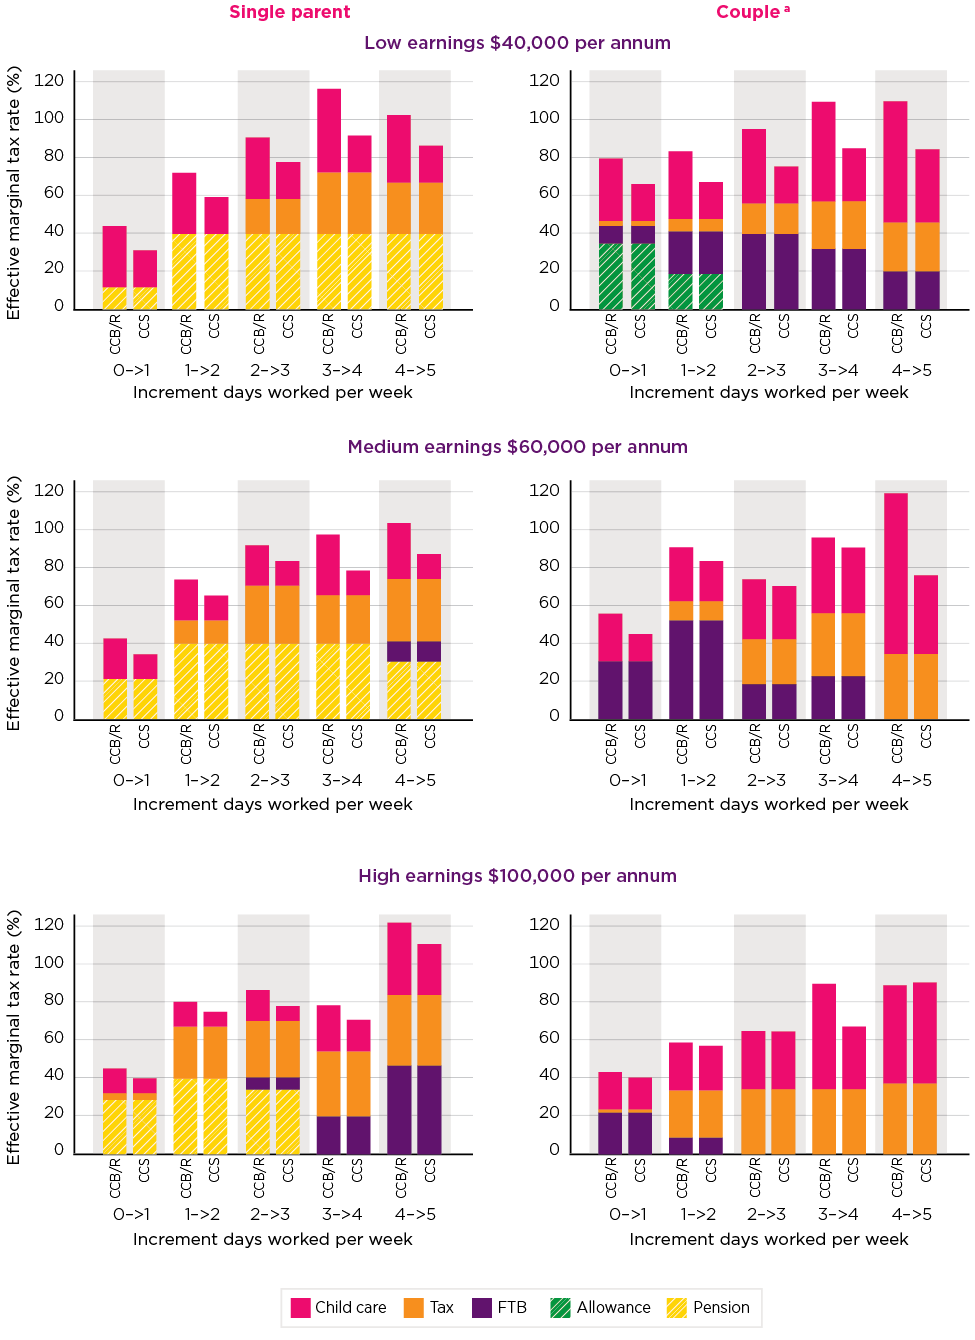
Note: a Assumes first member already earning at income indicated, and second earns at same rate.
Source: PolicyMod
Table 102 reports, in summary form, the average of the 5 single-day increment EMTRs for each of the scenarios. It again clearly shows large drops in EMTRs associated with the Package, with a slightly larger fall for couples relative to single parents. Moreover, it shows that these tend to remain higher for single parents than for couples. They are, however, on average, highest for low income couple families with 2 children (75.9 per cent) and for single parents with 2 children on relatively high incomes (75.3 per cent). The table points to higher EMTRs for those with 2 children rather than one. There is, however, little consistency across the 4 population groupings across income, while the EMTRs are lower for some of the low earning families than they are for the higher earning ones with the same characteristic, they are in other cases higher. This is also the case with the child care EMTR alone.
The table can also be viewed on page 279 of the PDF.
| Scenario | Total EMTR | Child Care EMTR | Child care share of EMTR | Effective child care EMTR | ||||||
|---|---|---|---|---|---|---|---|---|---|---|
| Family type | Earning level (pa) | CCB/CCR | CCS | Reduction | CCB/CCR | CCS | CCB/CCR | CCS | CCB/CCR | CCS |
| Proportion of gross earnings (%) | Proportion of total EMTR (%) | Proportion of earnings after tax and transfers (%) | ||||||||
| Single parent | ||||||||||
| 1 child | $40K | 68.6 | 60.1 | 8.6 | 18.3 | 9.8 | 26.7 | 16.2 | 44.9 | 23.0 |
| 1 child | $60k | 70.8 | 63.4 | 7.4 | 13.9 | 6.5 | 19.7 | 10.3 | 35.7 | 19.0 |
| 1 child | $100k | 70.0 | 64.3 | 5.6 | 12.3 | 6.7 | 17.6 | 10.4 | 39.1 | 17.4 |
| 2 children | $40K | 85.3 | 69.5 | 15.9 | 35.4 | 19.5 | 41.4 | 28.1 | 87.6 | 46.4 |
| 2 children | $60k | 82.1 | 69.9 | 12.3 | 25.3 | 13.0 | 30.8 | 18.6 | 71.0 | 35.4 |
| 2 children | $100k | 82.8 | 75.3 | 7.6 | 21.0 | 13.4 | 25.3 | 17.8 | 82.3 | 54.1 |
| Couple | ||||||||||
| 1 child | $40K | 71.7 | 58.3 | 13.4 | 25.9 | 12.5 | 36.1 | 21.5 | 47.3 | 23.0 |
| 1 child | $60k | 69.2 | 59.3 | 9.9 | 23.9 | 14.0 | 34.6 | 23.6 | 44.8 | 26.9 |
| 1 child | $100k | 51.1 | 48.5 | 2.6 | 18.3 | 15.8 | 35.9 | 32.4 | 27.9 | 24.0 |
| 2 children | $40K | 95.8 | 75.9 | 19.9 | 44.9 | 25.0 | 46.9 | 33.0 | 92.4 | 51.1 |
| 2 children | $60k | 87.3 | 73.3 | 14.1 | 42.1 | 28.0 | 48.2 | 38.3 | 77.7 | 53.8 |
| 2 children | $100k | 69.5 | 64.3 | 5.2 | 36.7 | 31.5 | 52.8 | 49.0 | 55.8 | 48.1 |
Source: PolicyMod
In terms of the comparison between the EMTRs faced under CCB/CCR and those under the CCS, the table shows that, in addition to the larger gain for couples relative to single parents, stronger gains have been recorded by those family types with 2 children relative to those with one, along with stronger gains for lower income households.
The contribution of the child care EMTR to the total EMTR faced by these households varies. It accounts for as low as 10.3 per cent, up to 49.0 per cent. As a consequence, while in some cases it represents only a small share of the EMTR, in others it is quite significant.
The final 2 columns present a reconceptualisation of the child care EMTR to consider the role of child care costs after the impact of transfer payment reductions and the deduction of tax are taken into account. This in many ways can be seen as the comparisons households make when considering how much of their disposable income from an increase in work activity is spent on child care. The data clearly shows a marked improvement under the CCS relative to CCB/CCR; however, it shows that after taking account of transfer reductions and income tax, some households spend more than half, and indeed in one scenario over 100 per cent, of their remaining earnings on child care. Across all of the scenarios, the average proportion is 35.2 per cent.
Implications
The introduction of the CCS has markedly reduced the EMTRs for many families, and increased the potential returns from increasing workforce participation. Notwithstanding this, many single parents, or a second earner in a couple, with young children, contemplating increasing their work activity, who require full-time child care on the days they work to enable this, face on average losing some 60-75 per cent of the gross earnings through reductions in transfer payments, income tax and the costs of child care. While much of this is due to the withdrawal of transfers, as they are deemed no longer necessary to support a family, and accepting the tax burden of income earners, the cost of child care, even after the introduction of the Child Care Package, accounts for some 10 to almost 50 per cent of the impact. In many cases, the disincentive effect increases as people intensify their employment from 1 or 2 days a week to higher levels of participation.
The magnitude of these EMTRs effectively gives credence to the reports of some parents that, in some circumstances, they have little monetary gain from increasing their level of employment. While the cost of child care, even taking account of subsidies, is not wholly responsible for this, it plays a role. This remains the case under the CCS, notwithstanding that this has substantially reduced the EMTRs.
8.6 Summary
ABS labour market data suggests an increase in employment for parents with young children between 2017 and 2019, although the magnitude of this is not inconsistent with trends over previous years. This pattern was similarly reflected in trends in the receipt of income support by parents with children where there is no evidence of any inflection point related to the introduction of the Package with respect to the longer-term pattern of decline. Administrative data suggests an annual increase in hours of activity of some 1.4 per cent for single parents and 0.3 per cent for couples. This increase is reflected in changes in the pattern of family participation, with around a 0.8-0.9 percentage point increase in the proportion engaged at the highest levels, although balanced by less intensive participation by some families.
DESE/ORIMA parent surveys do not identify any significant levels of increased activity or employment, overall, for either single parents or couples in the year from June 2018 to June 2019. There were some statistically significant increases for single parents who were using child care in the period from June 2018 to November 2019; however, the data also shows evidence of seasonality, consistent with other labour market data that sees higher employment outcomes in November compared to June, and the impact of this needs to be taken into account. Shifts in participation by single parents also appear to be more marked when activity is grouped into the activity test categories.
The direct questioning of families who used child care about changes in employment activity as a consequence of the Package in the DESE/ORIMA survey, as highlighted, resulted in a diverse set of responses, although most families reported no change. While the proportions reporting either increasing or decreasing employment varied considerably across the population, the overall balance was some 1.5-1.9 percentage points in favour of higher engagement - although this varied across surveys and was not statistically significant. Data was not collected on the magnitude of the change that had occurred.
Overall, a slightly greater proportion of parents expressed a preference to reduce, rather than increase, their hours of employment. While aspects of child care were seen as a barrier by those who wanted to increase their hours, in most cases people reported multiple barriers to their ability to increase hours and only a small proportion identified solely child care related barriers. The most frequently cited child care barrier was that of cost. One potential barrier to higher workforce engagement is parental attitudes, with very clear distinctions in attitudes towards the importance of a career and on whether it was important for a parent to stay at home to look after children being expressed by those who were child care users and those parents who were not.
The Package has acted to reduce the EMTRs of families with children as they enter employment or increase the intensity of engagement, with the median of the scenarios modelled falling from 78.7 per cent to 67.5 per cent. That the EMTRs remain high is largely as a result of reductions in transfer payments, and the impact of income tax. In some cases, though, the contribution of the cost of child care remains very significant. In the modelled scenarios, even with the reduction in EMTRs brought by the CCS, the EMTR is over 75 per cent in a third of cases.
Taken as a whole, these results suggest that while employment and other activity of parents may have increased since the introduction, the impact is small, and cannot necessarily be attributed to the Package, as opposed to ongoing trends towards greater participation. With regard to the Package itself, it would appear that it did have labour market effects but that these flowed in both directions, something identified by respondents to the DESE/ORIMA parent survey, and is a shift that is consistent with both economic expectations and with the differential impact of the Package on affordability across households.
146 While the terminology of 'leisure' is used, this encompasses a wide range of activities, in particular domestic production - covering issues such as child care and development, cooking, household maintenance and so forth.
147 For example, in 2019 the estimate of 252,600 partnered women with a child aged under 5 years as being full-time employed has a relative standard error of 4.6 per cent - placing a 95 per cent confidence interval of +/- 22,800 around the estimate.
148 In the analysis here a person is deemed to be on the full-rate of income support if they receive 90 per cent or more of the maximum rate of the payment they are eligible for. This contrasts with the more formal definition of full-rate only applying to those who have 100 per cent of the payment. Due to this, the estimates of part-rate receipt will be an underestimate relative to official statistics.
149 In the case of children who are in receipt of ACCS and exempt from the activity test, the Family Assistance Guide states that 'Individuals will still be required to provide information on their activity' (Australian Government, 2020a, 3.5.2.10). Similarly, where one parent in a couple has an exemption from the activity test, the test is applied to the other, unless they also have an exemption. 'In two parent families, both the individual and their partner must either meet the activity test or have an exemption. The hours of subsidised care the family is entitled to will be determined by the person with the lowest number of hours of activity per fortnight' (DESE, 2020f).
150 Reported hours of activity are subject to checking by the Department through their random spot checks, a process that may also involve parents being asked to provide documentary evidence of their claimed activity.
151 It is also noted that the Family Assistance Guide indicates a more nuanced priority on reporting changes in activity, with a focus on where the activity change may impact on the entitlement: 'When an individual (or their partner) experiences a change in activity that would affect their entitlement, for example, that would mean they move from one step of the activity test to the next, they are required to notify Centrelink as soon as possible' (Australian Government, 2020a, 3.5.2.10).
152 Australia has had a 38 hour working week since 1983.
153 For example, as cited in 3.2.4 the case of a person reporting weekly rather than fortnightly.
154 While mimicking more standard labour market classifications, it should be noted that even when the reported activity relates to employment, it includes travel time, hence in labour market terms, it can be expected that this will overstate the number of persons who are 'full-time'. In contrast, the separation of 'low' from 'part-time' activity may result in some under-estimation of the part-time group when compared with standard labour market measures. ABS report that in August 2019 some 5.0 per cent of employed persons usually work 1-9 hours per week across all jobs. (ABS, 2020, TableBuilder Dataset: Characteristics of Employment, 2014-2019).
155 The surveys included a category for 'other activity'. This field was zero for all records in the June 2018 and November 2018 files and, while recorded on the later surveys, it has been excluded from analysis for 2 reasons. The first is that of comparability across the surveys, in that to include the additional time in the analysis of the June 2019 and November 2019 surveys would introduce a significant distortion into the analysis. The second is that from a review of the information collected in the survey on what constituted this 'other' activity, while in some cases it could be considered to reflect 'in scope' activity, in others it related to activity that was clearly out of scope. For example, in the November 2019 survey it contained descriptions such as 'housework', 'looking after my child', and indeed 'looking after the dog'. The November 2019 survey also asked about time spent travelling to work. This has not been included here, again so as to maintain comparability across the survey waves. In November 2019 this was reported as an average of 0.8 hours a week by single parents using child care, and 0.3 of an hour for both the respondent and their partner in couple families using child care.
156 An insight into this seasonal pattern can be seen in the employment to population ratio of married women as collected in the ABS labour force survey. On average, the total employment to population ratio for all married women aged 35-44 years, over the 5 calendar years to 2019, was an average of 0.8 percentage points higher in November than it was in June.
157 The classification of child care used here is marginally wider than that used elsewhere as it includes some records with a reference care type that cannot be aligned with those services eligible for subsidies. The additional proportion of records varies across surveys from 2.2 to 6.2 per cent.
158 Further testing of the November 2019 survey indicates that this lack of significance continues even at the less stringent 90 per cent level.
159 These attitudes are considered further in the next section.
160 It is noted that in this survey 2,882 of the 3,749 couple responses were completed by a female. There was little difference in the proportion of males and female respondents agreeing - 75.3 per cent of males and 71.0 per cent of females.
161 The June 2019 survey is again used in preference to the November 2019 survey due to its coverage of parents not using child care.
162 Again, the November 2019 survey is not used in this comparison as it only surveyed the population of child care users. Notwithstanding this, the results it produced for this subpopulation were broadly consistent with the results for the same group in the previous waves.
163 Additionally the focus here is on government interventions.
164 HECS and related student loans repayments are income contingent. The current repayment schedule commences at a repayment rate of 1 per cent at an income of $46,620, with the rate ramping up to 10 per cent for incomes above $136,740.
165 Inclusion of rent assistance in the modelling in some cases increases the modelled EMTR of a specific scenario by 20.2 percentage points, although on average its impact is lower.
9. Viability and robustness of the industry sector
This chapter addresses Outcome 4, that 'Child care services are viable and the sector is robust'. In this regard, the evaluation question is whether the Child Care Package has had a systematic impact on the financial viability of child care services, or on the viability of particular types of service, and on the range of diverse service offerings.
Some dimensions of robustness include the mix of services, by provider and provider type, and type of care, market concentration and patterns of market entry and exit.
Additionally, it is recognised that the viability of the sector is impacted, not just by the operation of the CCS and ACCS provisions of the Package, but also other funding including the CCCF and the ISP. The role of the CCCF, with its particular focus on sustainability and in addressing the circumstances of former BBF services, is considered here. To the extent the ISP provides additional support for services, this is related to additional costs associated with the inclusion of children with additional needs and has been addressed in Chapter 7 as well as more specifically in the separate evaluation of the program that is being undertaken.
The analysis of viability is one of the aspects of the evaluation that has been restricted by the COVID-19 pandemic and related responses. In particular, financial viability was one of the key subjects for the proposed third wave of the SELCS that was not able to be undertaken.
9.1 The sector and child care subsidies
The main funding stream under the Child Care Package is the Child Care Subsidy, complemented by the Additional Child Care Subsidy. The implication of changes to this support for the viability and robustness of the sector is the initial focus of this chapter.
9.1.1 The nature of the sector
The broad structure of the child care sector has been outlined in Chapter 2. With respect to the consideration of the viability and robustness of the sector, some of the key elements are:
- In Q4 2019 there are 13,118 services providing child care. This comprises 61.8 per cent who provide Centre Based Day Care, 34.4 per cent Outside School Hours Care, 3.5 per cent Family Day Care and 0.3 per cent In Home Care.
- When weighted by the number of hours of care that is charged for, the Centre Based Day Care sector accounts for 79.5 per cent of the industry, Outside School Hours Care 11.2 per cent, Family Day Care 9.1 per cent and In Home Care 0.2 per cent.166
- 62.8 per cent of services are for-profit. This proportion varies from 50.0 per cent in the In Home Care sector to 68.8 per cent for Centre Based Day Care.
- There is, however, considerable variation in the role of the for-profit and not-for-profit sectors by location, both at the state level and with respect to the level of urbanisation and remoteness. This is illustrated in Table 103, which shows the proportion of services that operated in the 2018-19 financial year that were in the for-profit sector. Notable is a very strong gradient by location, with a decreasing proportion of services being provided by the for-profit sector in less urbanised and more remote locations, as well as very strong differences across states in the role of these sectors.
| State | Total | ||||||||
|---|---|---|---|---|---|---|---|---|---|
| NSW | Vic. | Qld | SA | WA | Tas. | NT | ACT | ||
| Proportion for-profit (%) | |||||||||
| Capital Cities | 75.0 | 75.3 | 58.2 | 40.7 | 75.5 | 32.3 | 48.7 | 44.6 | 68.5 |
| Urban 100k plus | 65.6 | 75.2 | 56.7 | - | - | - | - | - | 62.3 |
| Urban 50k-<100k | 58.9 | 58.8 | 42.8 | - | 65.7 | 21.7 | - | - | 51.7 |
| Urban 20k-<50k | 54.6 | 47.4 | 44.9 | 30.0 | 64.7 | 53.1 | 57.1 | - | 52.3 |
| Urban 10k-<20k | 56.1 | 46.5 | 41.0 | 42.3 | 56.8 | 62.5 | - | - | 50.7 |
| Inner Regional | 54.7 | 43.9 | 55.0 | 40.8 | 64.5 | 36.4 | - | 33.3 | 50.0 |
| Outer Regional | 45.2 | 17.6 | 44.2 | 25.0 | 26.5 | 24.1 | 14.3 | - | 35.5 |
| Remote | 25.0 | - | 14.3 | 7.7 | 29.4 | 0.0 | 36.4 | - | 21.7 |
| Very Remote | 25.0 | - | 8.9 | 0.0 | 20.0 | 0.0 | 3.1 | - | 9.4 |
| Total | 69.5 | 69.5 | 54.3 | 38.5 | 71.0 | 31.9 | 39.8 | 44.5 | 63.2 |
Note: Services included in table are all services that provided care at some point in 2018-19.
Source: DESE administrative data
- The 13,118 services operate under the umbrella of 6,152 provider organisations.
- 37.5 per cent of services are individual services - that is, they are both a service and a provider; 18.1 per cent are members of small providers, those with 2 to 4 services; 26.3 per cent are part of a provider that has 5 to 99 services; and 18.1 per cent are operated by a provider with 100 or more services.
- While most providers operate within a single sector of child care (i.e. just providing, for example, Outside School Hours Care), 35.6 per cent of those with 2 or more services operate in 2 or more sectors.
9.1.2 Subsidies
On average, subsidies to child care services (excluding ISP and CCF), as recorded in the child care administrative system in 2018-19, were equal to 60.7 per cent of the fees charged by services. This compares with 59.5 per cent in 2017-18.167,168 While this comparison may be impacted by the inclusion of a larger group of children with no subsidies post-July 2018, as discussed in Section 6.2, it is not possible to wholly determine to what extent these are children who previously attended but were not recorded or are children of families who are now outside CCS eligibility.
Figure 136 shows the distribution of the subsidy to fee ratio by service type and for-profit status for 2017-18 and 2018-19. As illustrated, the proportion of the fee accounted for by subsidies varies considerably between the groups of services, and there have been quite diverse changes over the period. By sector:
- Centre Based Day Care services have the second to lowest ratio of subsidies to fees, with these being broadly similar in both the for-profit and not-for-profit sectors. Each of these sectors shows an increase in the ratio between 2017-18 and 2018-19 of just under 4 percentage points.
- Family Day Care services have the second highest ratio of subsidies to fees, with this being much higher in the for-profit sector. While the for-profit sector shows a fall in the relative value of subsidies between the 2 years, the not-for-profit sector shows a gain. One factor in this sector's outcome is the impact of compositional change following compliance activity. The effect of changing composition can be seen in Table 104, which shows that, while the average proportion of fees covered by subsidies in 2017-18 was 79.9 per cent, for those for-profit Family Day Care services that operated in 2017-18 but not in 2018-19, it was 75.6 per cent for those who continued to operate. In 2018-19, while the ratio for continuing services fell slightly to 73.4 per cent, it was 73.2 per cent for those that entered over this period.
- The Outside School Hours Care sector has the lowest ratio of subsidies to fees, with this being more marked in the for-profit sector. Both sectors show a fall in the subsidy to cost ratio between 2017-18 and 2018-19.
- In Home Care had the highest ratio of subsidy to fees in both 2017-18 and 2018-19, notwithstanding a fall in the ratio between the 2 years. This fall was particularly large for the for-profit providers in the sector - with this sector recording a 13.6 percentage point fall, relative to a fall of just 2.7 percentage points for not-for-profit providers.
- Across all sectors there was a tendency for new entry services to have a higher ratio of subsidy to fees in the Centre Based Day Care and In Home Care sectors, and very marginally in the not-for-profit Family Day Care sector. The opposite was the case, as noted above, for for-profit Family Day Care and Outside School Hours Care services.
Figure 136: Child care subsidies as a proportion of total fees charged, by service type and for-profit, not-for-profit status, 2017-18 and 2018-19
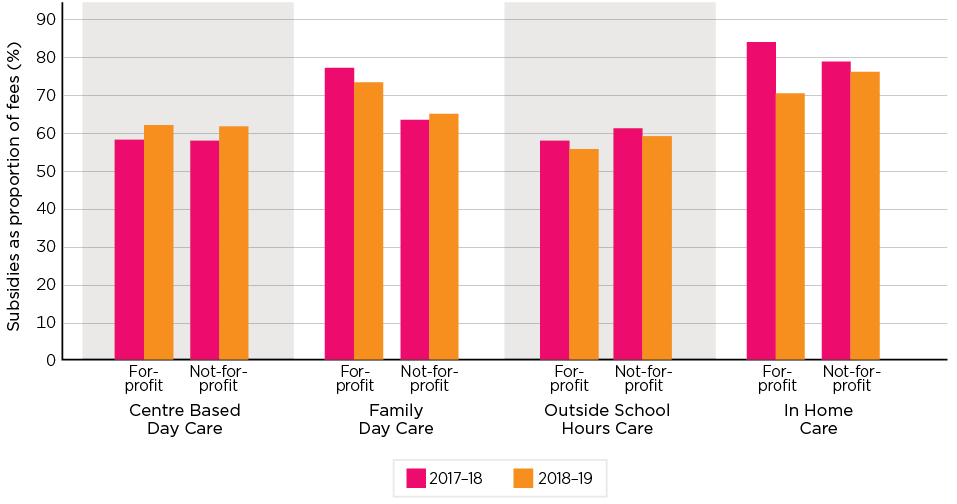
Note: See footnote 167.
Source: DESE administrative data
| Year | Whether service is continuing | CBDC | FDC | OSHC | IHC | ||||
|---|---|---|---|---|---|---|---|---|---|
| For-profit | Not-for- profit | For-profit | Not-for- profit | For-profit | Not-for- profit | For-profit | Not-for- profit | ||
| Child care subsidies as a proportion of fees (%) | |||||||||
| 2017-18 | Continuing | 58.0 | 57.9 | 75.6 | 63.0 | 57.6 | 61.2 | 84.5 | 80.7 |
| 2018-19 | Continuing | 62.0 | 62.0 | 73.4 | 65.1 | 55.5 | 59.3 | 68.6 | 75.8 |
| 2017-18 | Exits | 60.1 | 58.0 | 79.9 | 70.6 | 59.9 | 62.2 | 74.5 | 73.3 |
| 2018-19 | Entry | 62.6 | 59.2 | 73.2 | 70.9 | 56.8 | 56.9 | 78.4 | 82.1 |
| 2017-18 | Total | 58.2 | 57.9 | 77.3 | 63.5 | 57.9 | 61.2 | 84.1 | 78.9 |
| 2018-19 | Total | 62.1 | 61.7 | 73.4 | 65.1 | 55.7 | 59.1 | 70.5 | 76.2 |
Notes: See footnote 167. Continuing services are services for which there is a record of children attending and being charged in both 2017-18 and 2018-19. Exits are services only recorded in 2017-18 and entries those only recorded in 2018-19.
Source: DESE administrative data
The ratio of subsidies to fees also varies by location, see Table 105. In the 2 main sectors, Centre Based Day Care and Outside School Hours Care, the lowest ratios are recorded in the very remote locations, followed by the capital cities. While the capital city results are likely to be as a result of a number of factors, such as higher income households having lower entitlements to subsidies, the outcome in very remote areas is likely to be associated with the incidence of excess hours, discussed in Section 6.7.2, and the role of additional support through the CCCF, as discussed in Section 9.7. While these remote areas also had the lowest ratio in Family Day Care, more marked in this sector is the very high ratio of subsidy to fees in the capital cities. This reflects the very high ratio of for-profit relative to not-for-profit services in these locations with 74.9 per cent of Family Day Care services in the capitals being for-profit, compared with just 24.5 per cent of those in other locations.
| Urban and regional location | Service type: | Total | |||
|---|---|---|---|---|---|
| CBDC | FDC | OSHC | IHC | ||
| Subsidies as a proportion of fees (%) | |||||
| Capital Cities | 59.5 | 71.6 | 54.8 | 72.8 | 58.3 |
| Urban 100k plus | 66.2 | 66.5 | 62.4 | 74.6 | 65.0 |
| Urban 50k-<100k | 68.5 | 69.5 | 63.0 | 70.8 | 66.5 |
| Urban 20k-<50k | 68.3 | 67.1 | 63.3 | 75.6 | 66.7 |
| Urban 10k-<20k | 67.4 | 67.7 | 62.3 | 76.7 | 65.9 |
| Inner Regional | 68.1 | 67.7 | 63.6 | 76.6 | 66.2 |
| Outer Regional | 67.5 | 67.6 | 65.1 | 65.2 | 66.7 |
| Remote | 62.5 | 61.1 | 57.7 | 77.1 | 61.7 |
| Very Remote | 55.7 | 56.4 | 43.2 | 76.7 | 53.2 |
| Total | 62.0 | 70.2 | 57.3 | 73.2 | 60.7 |
Note: See footnote 167.
Source: DESE administrative data
The distribution of the ratio of subsidies to fees across services within the sectors is shown in Table 106. In all sectors there is a considerable range of outcomes with the interquartile range (the difference between p25 and p75) ranging from 12.6 percentage points for Centre Based Day Care and Family Day Care to 15.5 percentage points across Outside School Hours Care services.
| Percentile point | Service type: | Total | |||
|---|---|---|---|---|---|
| CBDC | FDC | OSHC | IHC | ||
| Subsidies as a proportion of fees (%) | |||||
| 10th percentile | 48.2 | 59.2 | 41.7 | 60.6 | 45.8 |
| 25th percentile | 56.6 | 65.1 | 50.4 | 66.9 | 54.5 |
| 50th percentile | 63.8 | 70.3 | 58.7 | 76.3 | 62.5 |
| 75th percentile | 69.2 | 77.7 | 65.9 | 82.1 | 68.6 |
| 90th percentile | 73.2 | 80.8 | 70.9 | 87.4 | 73.1 |
| Average | 62.0 | 70.2 | 57.3 | 73.2 | 60.7 |
Note: See footnote 167.
Source: DESE administrative data
The role of other subsidies, in particular funding under the Community Child Care Fund, is considered further in Section 9.7.
9.2 Changes in structure
This section is concerned with the structure of the sector. It considers patterns of change including entry and exits, and the degree of concentration, and the extent to which these have changed with the introduction of the Package. While changes in these provide insight into the robustness of the industry, it is also noted that the time scale of this analysis may be insufficient to allow the flow-through of business decisions to either expand or contract involvement in the provision of early childhood education and care services.
9.2.1 Structure of the sector
Since the introduction of the Child Care Package, the number of child care services increased by 338 to end 2019, a 3.0 per cent growth. This growth, however, reflects a diverse pattern of increases and decreases by sector, as illustrated in Table 107. While the number of for-profit Centre Based Day Care services has increased by 331, and not-for-profit Centre Based Day Care services by 192, there were falls in other sectors, in particular Family Day Care and In Home Care. The structure of these changes is considered further in Section 9.2.2 with respect to the entry and exit of services.
| Centre Based Day Care | Family Day Care | Outside School Hours Care | In Home Care | Total | |||||
|---|---|---|---|---|---|---|---|---|---|
| For- profit | Not- for- profit | For- profit | Not- for- profit | For- profit | Not- for- profit | For- profit | Not- for- profit | ||
| Number of services | |||||||||
| 2017 Q1 | 4,978 | 2,270 | 577 | 217 | 2,333 | 2,122 | 27 | 37 | 12,561 |
| 2017 Q2 | 5,005 | 2,283 | 543 | 214 | 2,330 | 2,136 | 27 | 34 | 12,572 |
| 2017 Q3 | 5,074 | 2,286 | 501 | 211 | 2,348 | 2,118 | 27 | 34 | 12,599 |
| 2017 Q4 | 5,159 | 2,294 | 457 | 211 | 2,336 | 2,108 | 27 | 33 | 12,625 |
| 2018 Q1 | 5,231 | 2,338 | 433 | 209 | 2,384 | 2,117 | 26 | 33 | 12,771 |
| 2018 Q2 | 5,238 | 2,344 | 405 | 207 | 2,381 | 2,114 | 26 | 32 | 12,747 |
| 2018 Q3 | 5,318 | 2,446 | 315 | 200 | 2,389 | 2,130 | 30 | 26 | 12,854 |
| 2018 Q4 | 5,367 | 2,457 | 299 | 200 | 2,378 | 2,136 | 24 | 25 | 12,886 |
| 2019 Q1 | 5,421 | 2,511 | 284 | 200 | 2,404 | 2,146 | 22 | 21 | 13,009 |
| 2019 Q2 | 5,465 | 2,511 | 279 | 198 | 2,416 | 2,161 | 21 | 23 | 13,074 |
| 2019 Q3 | 5,526 | 2,529 | 268 | 194 | 2,413 | 2,139 | 20 | 21 | 13,110 |
| 2019 Q4 | 5,569 | 2,536 | 266 | 196 | 2,391 | 2,134 | 22 | 21 | 13,135 |
| Change in number of services | |||||||||
| Q2 2018 to Q4 2019 | 331 | 192 | -139 | -11 | 10 | 20 | -4 | -11 | 388 |
| Percentage (%) | 6.3 | 8.2 | -34.3 | -5.3 | 0.4 | 0.9 | -15.4 | -34.4 | 3.0 |
| Average number of children in quarter a | |||||||||
| 2017 Q4 | 91 | 89 | 190 | 205 | 67 | 75 | - | - | - |
| 2018 Q4 | 92 | 86 | 193 | 195 | 69 | 77 | - | - | - |
| 2019 Q4 | 93 | 84 | 168 | 186 | 71 | 80 | - | - | - |
Note: a Average number of children not given for In Home Care as there was a shift from this funding being child based to family based.
Source: DESE administrative data
There were also changes in the size of services as measured by the average number of children attending. As seen in Table 107, there was a marginal increase in the for-profit Centre Based Day Care sector and both the for-profit and not-for-profit Outside School Hours Care sectors, but substantial falls in the Family Day Care sector, especially in for-profit services. These changes do not necessarily represent changes in the actual average number of children attending any one service, but rather a combination of this and changes in the composition of services within the sector.
The diversity of services by size is illustrated in Table 108, which shows the distribution of services by sector and provider size by the number of children who attended at some point in Q4 2019. There are few consistent patterns in the relative size of the services other than by type. Overall, Family Day Care services are the largest when measured by the number of children attending. This reflects their structure as usually effectively coordinating the activities of a large number of individual educators who offer care to a small number of children, rather than being involved in direct service provision. While in some ways the In Home Care services provide a similar role, the nature of the population they serve is quite different, with more complex needs, a role that is reflected in their relatively smaller size. Within the Centre Based Day Care sector there is a relatively consistent pattern of service sizes being higher where care is delivered by a service that is part of a large provider network. Of particular note is that these larger providers have relatively few very small services - with the service size at the 10th percentile being almost double that of either medium or single providers.
| Sector and Provider size | Percentile point: | ||||
|---|---|---|---|---|---|
| 10th | 25th | 50th | 75th | 90th | |
| Average number of children | |||||
| Centre Based Day Care | |||||
| Single | 32 | 48 | 73 | 107 | 148 |
| Medium | 36 | 56 | 82 | 115 | 159 |
| Large | 61 | 80 | 106 | 132 | 167 |
| Total | 36 | 55 | 83 | 116 | 156 |
| Family Day Care | |||||
| Single | 51 | 100 | 164 | 248 | 380 |
| Medium | 46 | 87 | 152 | 262 | 387 |
| Large | - | - | - | - | - |
| Total | 48 | 94 | 164 | 249 | 387 |
| Outside School Hours Care | |||||
| Single | 19 | 35 | 71 | 128 | 189 |
| Medium | 18 | 33 | 56 | 88 | 129 |
| Large | 17 | 29 | 49 | 78 | 115 |
| Total | 18 | 32 | 56 | 94 | 143 |
| In Home Care | |||||
| Single | 17 | 17 | 54 | 76 | 100 |
| Medium | 3 | 11 | 40 | 64 | 106 |
| Large | - | - | - | - | - |
| Total | 5 | 17 | 41 | 68 | 106 |
Notes: Single provider is a service that is also its own provider, medium providers are providers with between 2 and 99 services and larger providers are providers with 100 services and greater.
Source: DESE administrative data
9.2.2 Changes in service numbers
The pattern of change in the number of services over time by type of service is shown in Figure 137. This shows quite different trajectories for the service types, with the Centre Based Day Care sector having increasing numbers of services over most quarterly periods (although showing a flattening of numbers in the fourth quarter of each calendar year). In common with the other service types, this sector does not show any major change in its growth pattern from the point of the introduction of the Child Care Package. In marked contrast, the Family Day Care sector shows a relatively consistent pattern of declining numbers of services, although the rate of decline is more marked over the first half of the period. The role of compliance activity in this is discussed in Section 9.6.
The Outside School Hours Care sector is more difficult to track as it is more marked by the seasonal pattern seen in the Centre Based Day Care sector. Abstracting from this, there would appear to have been, as shown in the chart and previously in Table 107, a slight increase in the number of these services over time, potentially more marked throughout 2018 and into Q1 2019. While not perceptible on the scale of the chart, and impacted by the changes in the program, there was a strong decline in the In Home Care sector. This fell from 64 services in Q1 2017 to 58 in Q2 2018, and then to 43 in Q4 2018.
Figure 137: Net additional child care services by sector, Q2 2017 to Q3 2019
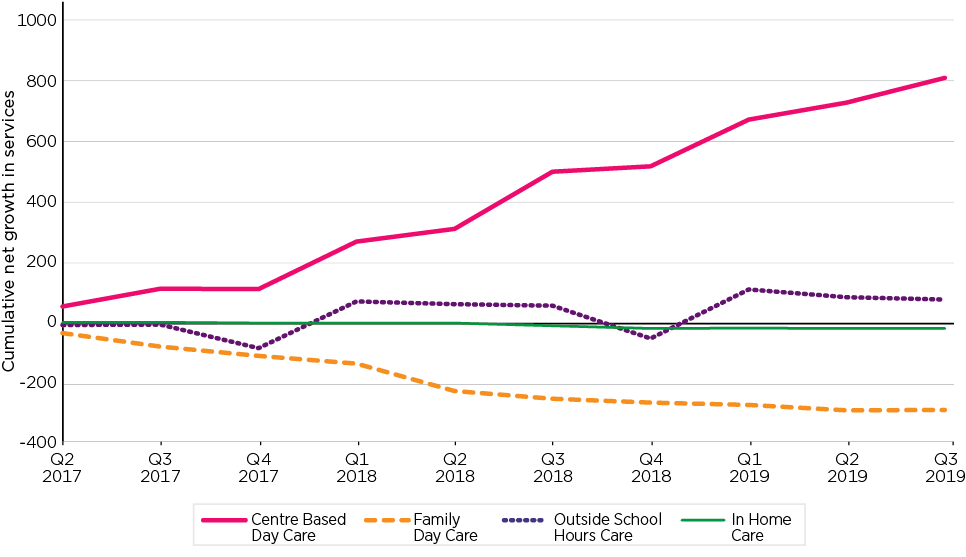
Notes: Based on sum of services exiting and entering, these movements cannot be calculated for Q1 2017 and Q4 2019.
Source: DESE administrative data
The pattern of change by state shows some marked volatility in Victoria and, to a lesser degree, New South Wales. This largely reflects Family Day Care compliance activity, see Figure 138. Other than this, these states both show strong growth; in particular, since Q4 2018, with total net increases of 218 services in New South Wales and 151 in Victoria. The next largest net increase in services, 105, is recorded in Queensland, followed by almost equal numbers of additional services, 67 and 66 respectively, in South Australia and Western Australia, despite their relative sizes. This is reflected in South Australia having a 9.5 per cent growth in service numbers between Q1 2017 and Q4 2019, compared with 6.6 per cent in Western Australia. Both the Northern Territory and Australian Capital Territory show sustained growth, although it is noted that the upward kink in service numbers in the Northern Territory in Q3 2018 reflects the inclusion in the data of 23 former Budget Based Funding (BBF) funded services, with a further 13 former BBF and related program services being included in subsequent periods.
In contrast to all other states, there was a decline in the number of services in Tasmania. In this state, the number of services has fallen from 274 in Q1 2017 to 262 in Q4 2019. The main contributor to this decline was a decline of 7 for-profit Outside School Hours Care services, although there was also a small decline of 3 in the number of not-for-profit services in this sector, along with the for-profit Family Day Care services falling from 5 to 2 and a reduction from 2 not-for-profit In Home Care services to one.
Figure 138: Changes in the number of child care services by state, Q2 2017 to Q3 2019
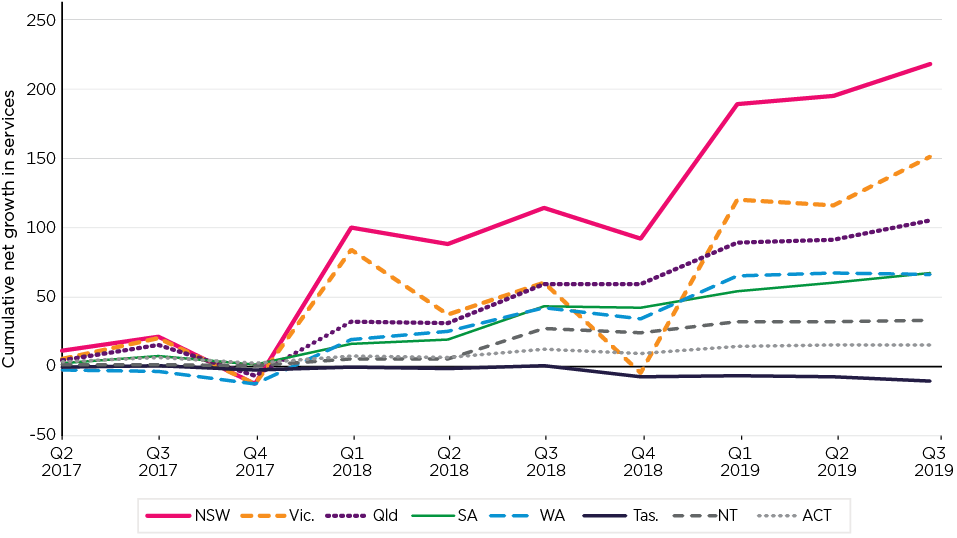
Notes: Based on sum of services exiting and entering, these movements cannot be calculated for Q1 2017 and Q4 2019.
Source: DESE administrative data
The volatility of growth is seen more markedly in Figure 139, which shows both the cumulative and quarterly changes in service numbers by whether they are for-profit or not-for-profit. Particularly marked are the strong increases in Q1 2018 and 2019 in the for-profit sector, and more steady gains across the not-for-profit sector. Notwithstanding these gains, both the not-for-profit and for-profit sectors have quarters with a net loss in services, with an apparent seasonal pattern being stronger in the fourth quarter of each year. While across the period as a whole, the cumulative growth has been stronger in the for-profit sector, this has not been consistent over time. This has resulted in little change in the relative roles of the 2 sectors - with the proportion of services in the for-profit sector being 63.2 per cent, 62.6 per cent, and 62.8 per cent in Q4 2017, 2018 and 2019 respectively.
Figure 139: Quarterly and cumulative change in the number of child care services by for-profit status, Q2 2017 to Q3 2019
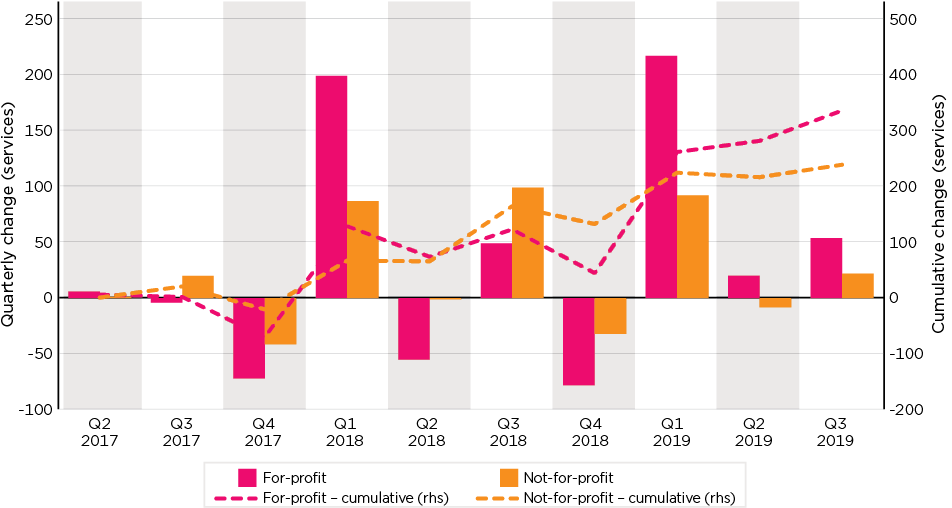
Note: Based on sum of services exiting and entering, these movements cannot be calculated for Q1 2017 and Q4 2019.
Source: DESE administrative data
This dimension of sectoral balance is reported in Figure 140 that shows the child weighted proportion of services that are provided by the for-profit sector by location. There is a clear gradient in the proportion of services provided by the for-profit sector across this measure of geography. While for-profit services provide 66.7 per cent of services in the capital cities, this falls to just 13.7 per cent in very remote areas.
Figure 140: Proportion of services (child weighted) that are for-profit by urban and regional location, Q4 2019
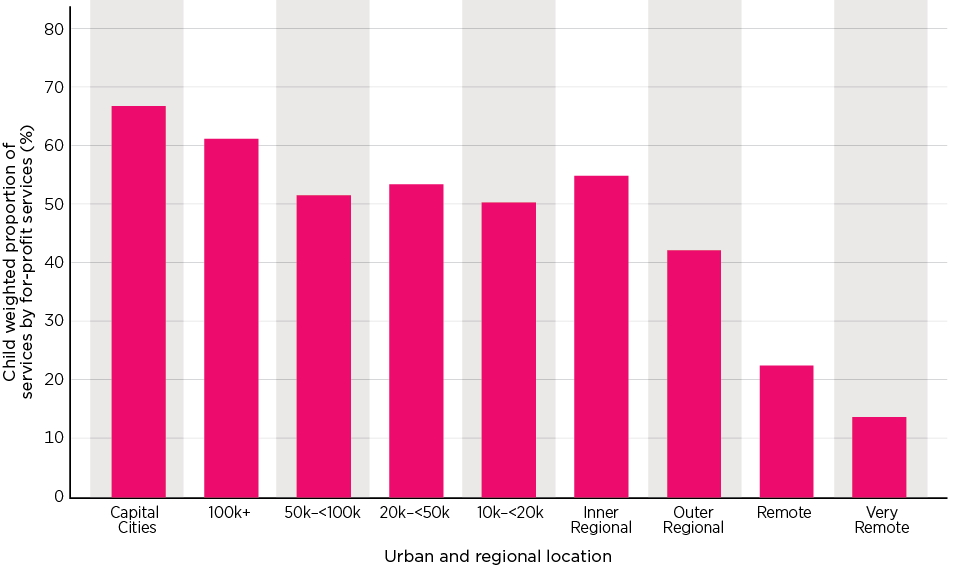
Note: See note on Table 6 for a description of the urban and regional location variable.
Source: DESE administrative data
9.2.3 Entries and exits
The above discussion has focused on net changes in the stock of services. This reflects both new services entering the sector and pre-existing services exiting. As, however, identified in Appendix 1, the measurement of this is difficult from the data available to the evaluation, as apparent exits and entries may reflect factors such as change in ownership. Notwithstanding this, Figure 141 shows the pattern of entries and exits over the 3 years to end 2019.169 Key features include:
- In the 12 months to end June 2019 there were 1,530 entries and 1,171 exits recorded. This is an increase on the 1,170 entries and 1,037 exits recorded in the 12 months to June 2018.
- Excluding the Family Day Care sector, the movements were 1,517 entries and 1,094 exits in 2018-19, and 1,150 entries and 826 exits in 2017-18, with the ratio of exits to entries in each of the 12 month periods being the same at 72:100.
- In terms of volatility for each 100 services in June 2018, over the following 12 months there was a total of 21 entries or exits. This varies by sector, with a rate of 17.5 per 100 in the Family Day Care sector; 20.0 for Centre Based Day Care; 22.7 for Outside School Hours Care; and 58.9 for In Home Care.
- As shown in Figure 142, other than the spike in Q3 2019, the level of quarterly volatility since the introduction of the Child Care Package would appear to have been consistent with previous levels, although potentially showing some downward trend.
- There was a spike in entries in Q3 2018. This, in part, reflects some holding off of entries into the system pending the introduction of the Child Care Subsidy.
- A disproportionate number of exits of Family Day Care services has occurred, in part due to compliance activity; in particular, in the period up to and including Q2 2018.
Figure 141: Services, quarterly entries and exits by service type, Q1 2017 to Q4 2019
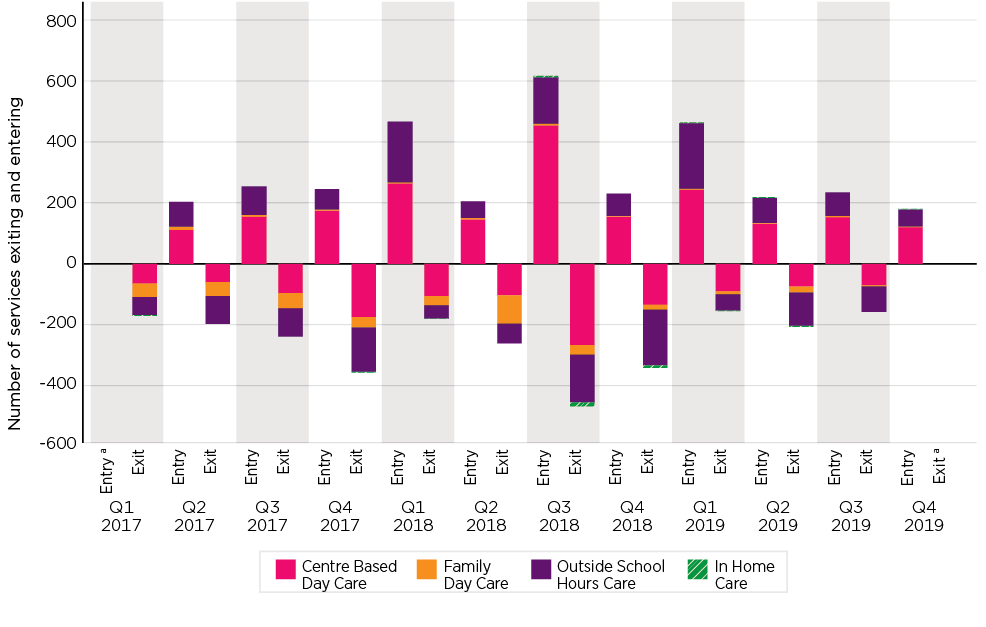
Notes: a Entries for Q1 2017 and exits for Q4 2019 cannot be calculated from the data available.
Source: DESE administrative data
Figure 142: Services volatility (sum of entries and exits over stock), Q2 2017 to Q3 2019
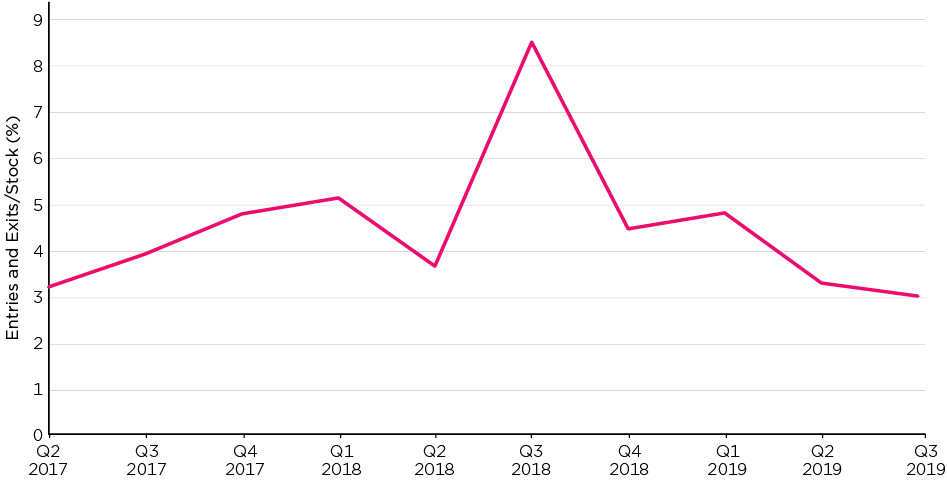
Notes: Volatility cannot be calculated for Q1 2017 and Q4 2019 from the data available.
Source: DESE administrative data
Occasional Care Services
One of the changes associated with the introduction of the Child Care Package, as noted in Chapter 1, was the absorption of Occasional Care Services into the Centre Based Day Care Sector. Just prior to the introduction of the Child Care Package there were 103 of these services, with just on half of them in Victoria. Including those services that had a last child attendance in the week before the introduction, 21 of these services have closed. This 20.4 per cent level of closure is double the 9.1 per cent recorded over this period for other Centre Based Day Care services.
Overview of service growth
While the number of child care services has grown, the pattern of growth has been far from consistent across service types, by state, by location, or whether they are provided by the for-profit or not-for-profit sector. Other than the spike in entries and exits in Q3 2018, which did include the direct impact of the changes in program structure of In Home Care and the inclusion of the former Budget Based Funding services, there is little evidence of there having been any major shift in the patterns of entry or exit, or in the mix of services, since the introduction of the Child Care Package.
9.2.4 Concentration
Another aspect of the structure of the sector is that of concentration. Here 2 dimensions of concentration are considered. The first is the extent to which children receiving care are concentrated across services - that is, are there a small number of services that have a large number of children, and others who have relatively few, and secondly, the extent to which this concentration occurs at the provider level.
In regard to this second form of concentration, it can be argued that, while there are some benefits that can be derived from having larger providers who can gain efficiencies of scale in their operation, and potentially improve consumer capacity to choose by having uniform quality standards across their services and hence reducing the search time parents might need to invest in understanding the options available to them, at the same time, an over-concentration can lead to a reduction in consumer choice and the dangers associated with monopoly power, including a less competitive market.
Reflecting the diversity of ways in which the volume of care provision can be measured, this analysis variously considers concentration in terms of the number of children, in hours of care provided and in services by provider. As has been seen above, there is considerable variation in the number of children attending different services, in the hours of care they receive, and in the number of services each provider has.
The Lorenz curve, illustrated in Figure 143, provides one way of considering concentration. It shows, for services ranked by their size, the cumulative proportion of services and the cumulative proportion of children they provide care to. If all services had an equal number of children, then the Lorenz curve would follow the 45-degree line shown on the chart. The less equally the number of children are distributed, the further away from the diagonal line the plotted distribution will be. The plotted lines show the distribution for Centre Based Day Care, Family Day Care, and Outside School Hours Care services. As shown, there is considerable inequality in the share of children services have. This is least marked in the Centre Based Day Care sector, but more so in the Family Day Care and Outside School Hours Care sector. While the difference between these 2 sectors is not large, as shown, Outside School Hours Care is however a little bit more concentrated - that is, less equal.
A commonly used summary measure of inequality in distribution is the Gini coefficient.170 Reflecting the distributions seen in Figure 143, Figure 144 plots the Gini coefficients for the 4 child care sectors, initially child weighted, and then by hours, for the fourth quarter of each of the 3 calendar years for which information is available. Reflecting the pattern of the Lorenz curve, the child-weighted Gini for Centre Based Day Care services of 0.307 in 2019 is the lowest of the 3 sectors, followed by that for Family Day Care services of 0.392, and that of Outside School Hours Care of 0.398. The level of concentration is most marked in the In Home Care sector, with a Gini of 0.498.
Figure 143: Concentration of children in services by type of care, Lorenz curve, Q4 2019
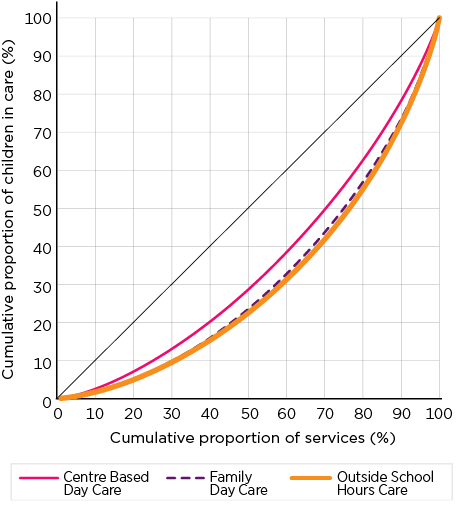
Notes: Number of children used in weighting is the average number of children attending the service in the quarter. There are insufficient In Home Care Services to derive a percentile level distribution.
Source: DESE administrative data
The second set of coefficients - the hours-based measure - shows an even higher degree of concentration. Of interest here is not so much the absolute levels, but rather the extent to which the degree of concentration has changed over time, and the extent to which, if a change has occurred, this is a result of the introduction of the Child Care Package. In all cases, except for the hours-based measure for the Family Day Care sector and for Outside School Hours Care, there has been an increase in the extent of concentration between 2017 and 2019. This is most marked in the child-based measure for Centre Based Day Care services, where the Gini has increased from 0.296 to 0.307. However, the hours-based measure shows a much milder increase from 0.330 to 0.335. For the Family Day Care sector, while the degree of concentration has increased in terms of the child-weighted measure, it has decreased on the hours-weighted measure.
Figure 144: Concentration of children and hours of care across services, Gini coefficient, Q4 2017, Q4 2018, Q4 2019
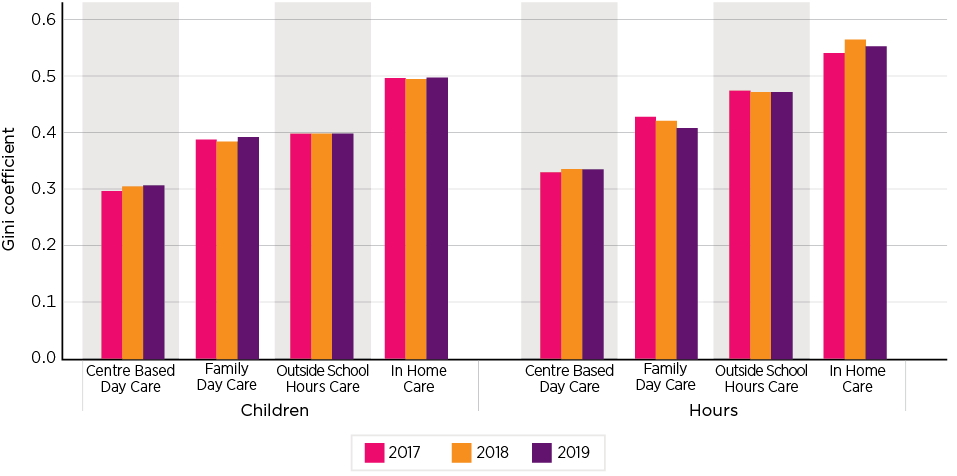
Notes: Number of children used in weighting is the average number of children attending the service in the quarter; hours weighting is based on total hours of care charged for.
Source: DESE administrative data
The second level of concentration, as discussed above, is at the provider level. This is initially considered across all service types in Figure 145, replicating the 2 measures used above, along with the Gini coefficient for the distribution of services across providers. In the first instance, the chart shows that the concentration of hours and children is much higher at the provider level, when compared to the service level. This is to be expected, given that the industry includes some large providers. Secondly, the relative Gini of services to these measures suggests that the services concentrated in the larger providers have a larger share of the service provision. This reflects, in particular, the pattern seen in Table 107 with regard to Centre Based Day Care services, where services who are part of large providers have greater numbers of children.
Looking at trends over time, there has been a slight fall in the Gini for hours weighted service provision, from 0.642 to 0.634, an increase in concentration using the child weighted measure from 0.614 to 0.621, and an increase in the concentration of services from 0.489 to 0.502.
Figure 145: Concentration of children and hours of care across providers, Gini coefficient, Q4 2017, Q4 2018, Q4 2019
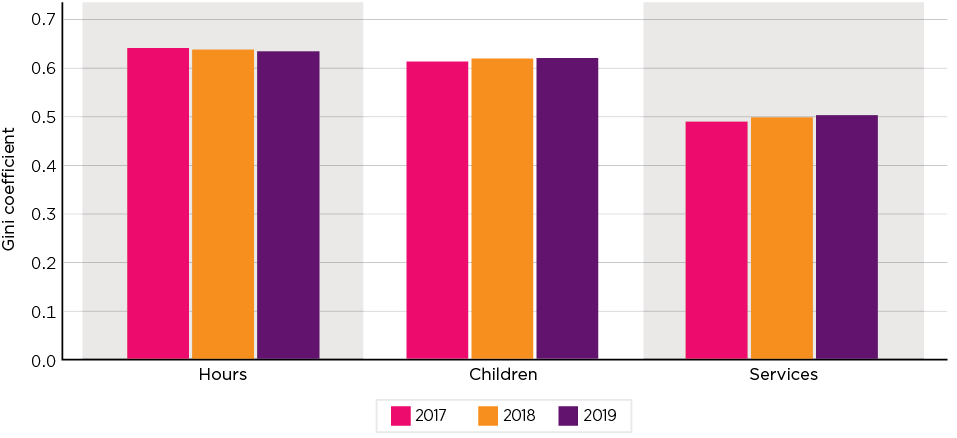
Notes: Number of children used in weighting is the average number of children attending the service in the quarter; hours weighting is based on total hours of care charged for.
Source: DESE administrative data
Figure 146 considers this provider level concentration at the sector level. In considering this, it needs to be noted that while 92.9 per cent of providers only operate in a single sector, the remaining operate in multiple sectors (most frequently operating both Centre Based Day Care services and Outside School Hours Care services). In the following analysis the role of such providers is considered independently within each sector.
The chart illustrates quite a diversity of outcomes:
- There is generally little change in the level of concentration at the provider level for Centre Based Day Care services, whether measured at the service level, or volume weighted by children or hours.
- The Family Day Care sector is firstly marked by very low levels of concentration of services at the provider level, although this has increased a little over time. Reflecting this low level of concentration, the child-weighted and hours-weighted measures at the provider level effectively replicate what was seen at the service level.
- Outside School Hours Care services are the most concentrated at the provider level, and this has increased over time, with the Gini for services increasing from 0.588 to 0.613. While this direction to greater concentration is reflected in both the child- and hours-weighted measures, the magnitude of the increase is much less.
- At the provider level, while there has been some increase in concentration of In Home Care services, this is not reflected in changes of concentration in the hours- or child-weighted measures. It should though be noted that this sector is the one that is most impacted by providers that are also engaged in other sectors, with only a minority of these services being provided by a provider that is not elsewhere engaged in the provision of child care.
Figure 146: Concentration of children and hours of care across care type and providers, Gini coefficient, Q4 2017, Q4 2018, Q4 2019
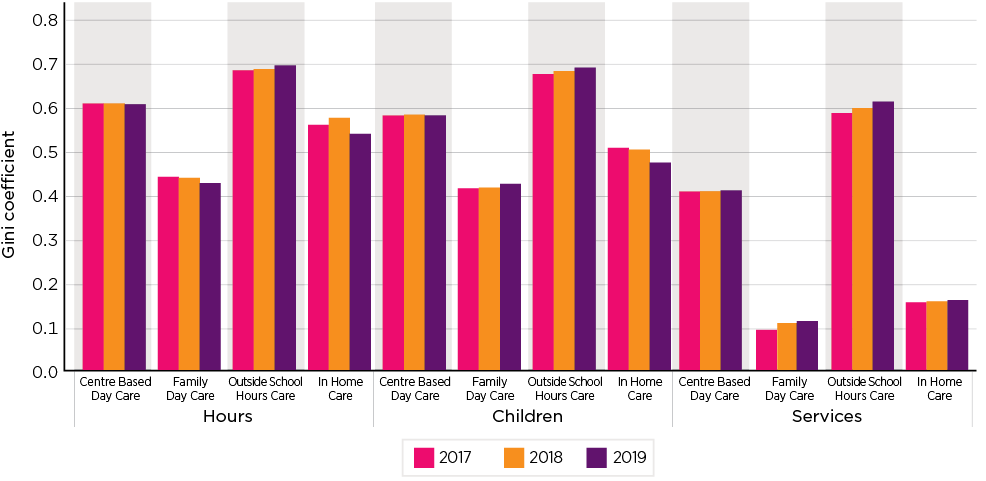
Notes: Number of children used in weighting is the average number of children attending the service in the quarter; hours weighting is based on total hours of care charged for. Where a provider operates across multiple sectors they have been treated independently within each sector.
Source: DESE administrative data
9.2.5 Summary of trends in growth and concentration
While the child care sector has grown since the introduction of the Child Care Package, the pattern of growth, other than some perturbation at the time of introduction, appears to be broadly consistent with the pattern of a longer period. There are some distinct sectoral impacts, in part related to compliance activity.
Overall, there is little change in the extent of concentration within the industry, other than potentially in the Outside School Hours Care sector, which was already the most concentrated, and where, at the services level, the degree of concentration has increased.
9.3 State of the industry
The viability of the child care sector reflects not just short term impacts but also longer term expectations. There are several ways in which these can be identified. One, obviously, is the willingness of the sector to provide services, and in this regard the data on the number of services, and the volume of care provided, as considered above, is an indicator of this.
The perspective of the private sector on the investment climate is another. This is considered here, initially through professional judgements as embodied in assessments of the state of the sector and, secondly, via stock prices for listed companies involved in various roles in the provision of child care.
9.3.1 Industry reports
IBISWorld provides regular industry reports aimed at informing potential investors of the state of particular industries. The child care industry is one that they describe as being in a 'quality growth' phase - but moving towards 'maturity' - suggesting that while there may be a future reduction in the number of establishments, the sector will grow as a share of the economy. In describing this process, they note that the entry of new corporate players has had a significant impact in the second half of the decade. Looking forward, they cite the potential for small independent providers to exit the industry and for larger players to place a lesser emphasis on acquisitions and focus more on leveraging their existing scale. In the more immediate term, in March 2019, they reported that, 'However, the industry's operating conditions are growing more challenging as growth in new child care facilities outpaces demand in several key geographic markets' (IBISWorld, 2019, p. 5). As discussed at 9.5.5, the question of excess capacity is complex and is highly market and, at times, time specific.
Profitability
IBISWorld report the overall environment for the sector with regard to profitability as:
Small-scale operators dominate the industry, with non-profit or community based centres having a significant presence, which constrains industry profitability. The regulatory NQF changes recently implemented by the government have placed downward pressure on industry profit margins over the past five years. Rising wage costs have also constrained margins over the period. Low occupancy rates in key geographic markets have also contributed to this downward trend. (p. 8)
More generally they report that while profit as a share of revenues in the sector increased marginally between 2016 and 2017 to reach a level of a little below 15 per cent, in 2018 it dropped to around 10 per cent, remaining at that level in 2019 (IBISWorld, 2020, p. 23).
9.3.2 Trends in listed companies
There are 5 major listed companies involved in the provision of child care. Three of these are involved in the direct provision of child care: G8 Education Limited; Mayfield Childcare Limited; and Think Childcare Limited; while the other 2 are real estate investment trusts: Charter Hall Social Infrastructure REIT; and Arena REIT. These latter 2 have portfolios of child care centres that they lease to child care services in both the for-profit and not-for-profit sectors.
Trends in the share prices, along with the All Ordinaries Index, are shown in Figure 147. This shows a diverse set of outcomes since the introduction of the Child Care Package, with no indication of any single trend or shock that might be seen as being associated with the introduction of the Package.
Figure 147: Main listed companies with engagement in child care provision, stock prices, Index numbers, July 2018 to December 2019
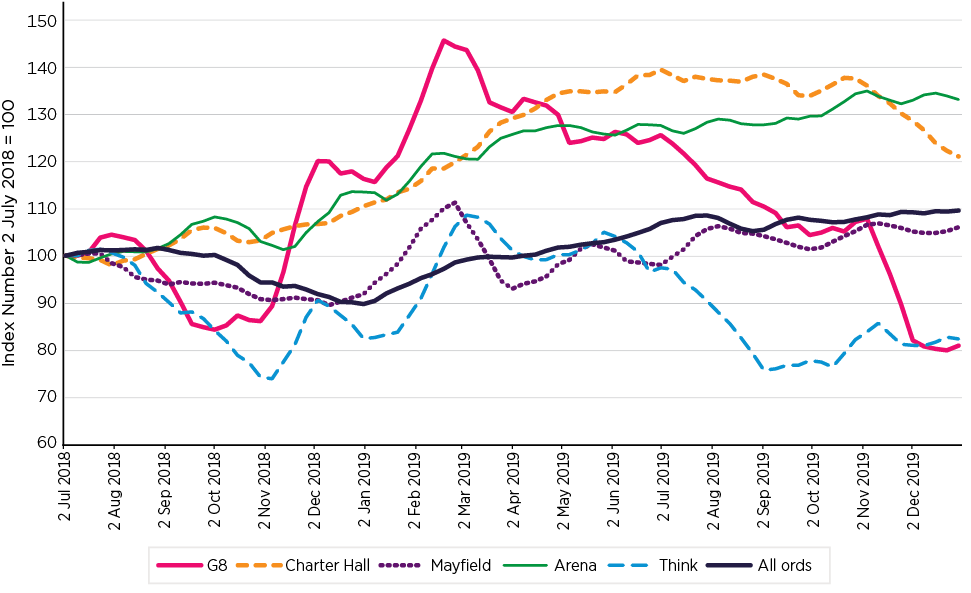
Note: Four week moving average closing price.
Source: Share prices downloaded from yahoo! Finance.
Looking at the companies primarily engaged in the direct provision of child care services, there was generally a reflection of the market in 2019 being an improvement on previous years. G8 Education, for example, reported having 'Positive occupancy growth - the first in 4 years' (G8 Education, 2020, p. 6) while Mayfield reported that 'the sector's challenges over the last 2 years have moderated and the new CCS system has been implemented' (Mayfield Childcare Limited, 2020, p. 4). While not commenting on the overall environment, the Think Childcare Group Annual Report 2019 emphasised the balance of demand and supply in the sector as being one of local factors and reported, 'Demographics are determined at a localised trade area of 2-3 kilometres and our outlook for the Think Childcare Group in the short to medium term remains positive. This is the result of our disciplined site selection criteria and our management capability' (Think Childcare Group, 2020, p. 8).
Analysis of insolvency appointments indicates very little activity in the field of child care. Search in the 10,696 records (some of which are duplicates of multiple appointments) for 2018-19 (ASIC, 2019) identifies just 13 cases where child care is clearly the business activity. In 2017-18, this was 7 out of 10,749. This, however, should only be seen as indicative as it does not reflect the range of possible corporate structures that services could use, nor the extent to which the corporate names in the file do not reflect the actual activity undertaken.
9.4 Services' perceptions of financial viability
Services were asked to self-assess their financial viability in the baseline SELCS conducted in May-June 2018, just prior to the introduction of the Package, and again in June-July 2019. In both surveys, while there was a spread of responses, they were, overall, positive. In June-July 2019, of those services that reported on their viability,171 23.9 per cent 'strongly agreed' that their service was financially viable, and 41.0 per cent 'agreed'. A further 23.2 per cent said that they 'neither agreed nor disagreed', with just 7.7 per cent reporting that they 'disagreed', and 4.2 per cent that they 'disagreed strongly'. As shown in Figure 148, while the responses in 2019 were marginally less positive than those in 2018, the extent of shift was not great.
Figure 148: Services' self-assessed financial viability, SELCS, May-June 2018 and June-July 2019
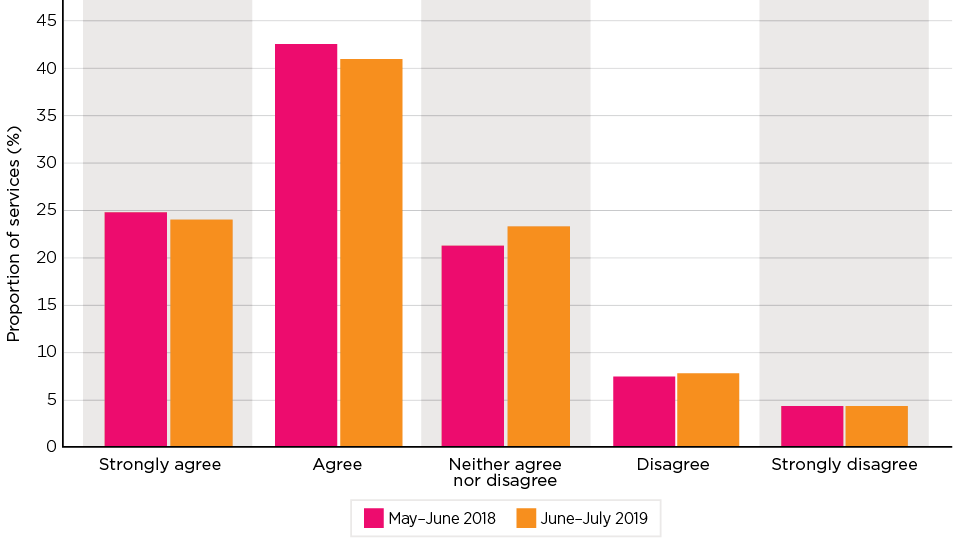
Source: SELCS, Wave 1 and 2
Analysis of this variation is reported in Table 109, which presents the results of multivariate analysis that has sought to identify the factors associated with the assessment of financial viability across services. For this analysis, the reported perceptions of viability have been scored with strong agreement as 5, and strong disagreement as 1. Hence, in the table a positive coefficient is associated with a stronger level of agreement with the service being financially viable, and a value of 1 in the coefficient representing a shift between the classification levels shown in the above chart (reverse scored). The table indicates:
- Relative to Centre Based Day Care, Family Day Care and In Home Care services were significantly less likely to report that they were financially viable. This was particularly strongly reported by In Home Care Services where the coefficient value of -1.2 indicates they were over a full classification less positive. In contrast, Outside School Hours Care services were more positive relative to Centre Based Day Care and the other sectors as to their financial viability.
- While there were less marked differences between states, services in Queensland, controlling for other factors, were somewhat more likely to report they were financially viable, with this also being the case in a weakly significant result for South Australia. The table also reports a highly significant and strongly positive coefficient for the Northern Territory - indicating that once the other characteristics of the services in that state were accounted for (noting that some of these characteristics such as remoteness are concentrated in that territory) - the services were more confident about their financial circumstances.
- The negative value for all remoteness classifications, relative to the base of the capital cities, indicates that services in the capitals were more positive about their financial viability than those in other locations. However, while the more negative outlooks of services in inner regional locations and in remote and very remote locations were all statistically significant, it was only those in the 2 remote classifications, and in very remote locations in particular, that the magnitude of the difference was that great.
- The third geographic characteristic, that of the service's location in terms of the ABS SEIFA index of advantage and disadvantage, shows a profile of results of greater confidence in the service's financial viability in more highly ranked areas, and lower in those areas of lesser advantage. However, the only statistically significant difference relative to the base middle quintile of the index, was for those services in locations at the more disadvantaged end of the scale.
- There was also a gradient with regard to the size of services, as measured by the number of staff. Relative to the base, a service with 10-14 staff, the most common service size, smaller services were statistically significantly less likely to report being financially viable, while larger ones reported higher levels of viability.
- Turning to the provider size; that is, whether the service was a standalone service or part of a broader provider network and, if so, how large this network was. Relative to a standalone service, services that were part of a provider with just 2 services were significantly, although only slightly, less likely to report being financially viable. While services part of medium (6-99 services) or large (100 plus services) providers were somewhat more likely to report positively on their financial viability. The relative size of the effect, while statistically significant, was relatively small.
- Compared to the base case of a for-profit service, all other service types were less likely to view their financial viability positively. While all of these differences were significant, the one that strongly stands out is that of government services. The coefficient indicates that these services viewed their viability as half a classification lower than their equivalent in the private sector.
- A similarly lower rating of financial viability was given by services who had previously been funded under the Budget Based Funding model.
- Finally, the table indicates that the change in perception of financial viability between the baseline survey and that in late 2018, seen in the above chart, was significant, with the Wave 2 results being less optimistic than those in Wave 1. Again, although statistically significant, the actual magnitude - at just one ninth of a ranking difference - is quite small.
| Variable | Coefficient | |
|---|---|---|
| Service Type | CBDC | base |
| FDC | -0.306*** | |
| OSHC | 0.327*** | |
| IHC | -1.211*** | |
| State | New South Wales | base |
| Victoria | 0.047 | |
| Queensland | 0.108** | |
| South Australia | 0.124* | |
| Western Australia | -0.012 | |
| Tasmania | 0.186 | |
| Australian Capital Territory | 0.090 | |
| Northern Territory | 0.414*** | |
| Remoteness (ABS) | Major cities | base |
| Inner regional | -0.062*** | |
| Outer regional | -0.066 | |
| Remote | -0.158*** | |
| Very remote | -0.310*** | |
| Socio-economic quintile | Lowest | -0.233*** |
| 2 | -0.061 | |
| 3 | base | |
| 4 | -0.014 | |
| Top | 0.089 | |
| Service staff | Base | |
| 6-9 | -0.191*** | |
| 10-14 | base | |
| 15-19 | 0.168*** | |
| 20-29 | 0.167*** | |
| 30+ | 0.277*** | |
| Provider size | Single | base |
| 2 Services | -0.015*** | |
| 3-5 | 0.011 | |
| 6-99 | 0.060*** | |
| 100+ | 0.135*** | |
| Organisation type | For Profit | base |
| NFP Community | -0.059*** | |
| Government | -0.427*** | |
| Other/missing/NS | -0.131** | |
| If former BBF service | Not | base |
| Former-BBF service | -0.524** | |
| Survey wave | Wave 2 | -0.106*** |
| Constant | 3.792*** | |
| n (groups = 2) | 3,876 | |
| r2 (overall) | 0.116 |
Notes: Combined Wave 1 and Wave 2 SELCS. Unbalanced panel regression using Random Effects and Robust Standard Errors. *, **, *** indicate that the underlying coefficient is significant at the 90 per cent, 95 per cent and 99 per cent confidence levels respectively.
Source: SELCS Wave 1 and 2
Summary - perceptions of viability
Overall, the majority of services view themselves as being financially viable, with only a small group expressing strong doubts about this. Being an Outside School Hours Care service, being for-profit, in capitals, being larger, and being part of a larger provider network were all positively associated with perceived financial viability. In contrast, being an In Home Care or Family Day Care service, in remote or very remote locations, and in areas of low socio-economic advantage, as well as being smaller and, in particular, being a government service were negatives.
9.5 Factors impinging on business models
Across the research underpinning this evaluation, a number of aspects of the child care system were cited as being particular risks for the viability of services. Some of these have been discussed more specifically in other chapters but are appropriately identified here because of their potential impact on services, while others reflect findings of the range of qualitative and other research undertaken including the detailed case studies.
9.5.1 Session length, approved hours and long-term concerns about charging model
Services raised concerns about these issues, not just because of some of the short-term consequences, but more so because of their concern about the directions of policies within the Package or what they saw as being signalled through elements of the Package.
Central were issues addressed in the discussion on flexibility relating to the most appropriate model for Centre Based Day Care, and a concern that rather than a focus on providing structured sessions of education and care for children, the policy direction was towards a casualisation of the use of care, and of the underlying staffing model. Very specifically, many of the services were concerned that the structure and rhetoric associated with the Child Care Package was a precursor to the government moving to a funding model where charging was based on the actual time spent in care, rather than the session length, and that, in turn, the government would seek to apply the rate cap to the cost of this. The broad concern was that, beyond the direct financial implications, the policy environment was seen to diminish the role of the sector in providing early childhood education and child development, including to those most in need, towards the provision of care tightly linked to parents' employment and other activities encapsulated in the activity test.
Linked with this, but in other ways a broader concern, focusing more on the operational model of services, and especially Centre Based Day Care services, was the implications for delivering early childhood education. This concern was exacerbated by a view, from a pedagogical perspective, that the level of approved hours and, in particular, the 24 hour per fortnight base level, did not provide sufficiently for child development needs. This is discussed further in Chapter 7. In the case studies, there was evidence that a small number of Centre Based Day Care and Family Day Care services were responding by offering a 6-hour daily session, enabling families entitled to 24 hours of subsidised care with the opportunity to attend 2 days a week. However, this is not a standard session length offered by child care services, largely due to the associated viability and workforce concerns.
80 per cent of our staff are full-time. We have a commitment to retention, to quality, to consistency and also we need to empower a workforce that's recognised as professionals, enable them to be able to get house loans and get car loans and get all of those things on full-time wages rather than promised only 24 hours a week as your numbers slide, you know, decrease your staffing and meet your ratios. So that's why we don't [offer a six hour session]. It's our commitment to quality because we also have a full-time staff.
[CBDC and OSHC stakeholder, April 2020]
Several service providers who participated in the case studies spoke of their concerns about the loss of income associated with offering a 6-hour session, which was typically charged at a reduced rate. Services reported having capped the number of families offered a 6-hour session or only offering those sessions to particular cohorts of families.
As outlined in Chapter 5, services were sometimes charging a similar or only marginally lower rate for slightly shorter sessions, such as for 9-hour compared to 10-hour sessions. Charging the same daily rate meant that while being able to meet the restrictions on hours of subsidised care generated by the activity test, services did not need to consider viability implications of the slightly shorter sessions.
9.5.2 The rate cap, indexation and costs
This had several elements. At a general level, services saw operational costs increasing, in particular with respect to staffing costs, but without any clear response to this in the Package or the broader policy directions. Additionally, there were a range of specific issues around the cost of provision of some services and how these aligned with the funding model. These included:
- the costs of care of babies and young children where there are requirements for higher staffing to child ratios that need to be funded, with this not being reflected in the rate cap or subsidy
- the costs of providing care out of usual hours that could incur penalty rates for staff
- the costs of provision in high-cost locations.
9.5.3 Debt
Concern about managing debt was a recurrent matter raised by services. In the second wave of the SELCS 33.1 per cent of services reported an increase in the amount of debt families owed to the service since the introduction of the Package, while only 11.1 per cent reported a reduction (see also Section 4.6.2). Problems of debts were more frequently cited by In Home Care services, where 67.3 per cent reported an increase in debt, as did 36.1 per cent of services in both the Centre Based Day Care and Family Day Care sectors. Where services identified a problem of increasing debt, they referred both to an increase in the value of debts and an increase in the number of families with debt.
Findings from the case studies indicate that debt accrued by families to child care services was often a result of a discrepancy between a family's anticipated and actual CCS entitlements. This included delays in CCS being processed when a child initially commenced at an early learning service or CCS payments ceasing abruptly for a variety of reasons (e.g. issues with a child's immunisation history). This is discussed further below.
More broadly, the research, including that in Case Study 1 (an area selected to enable a focus on child care use in a low-income outer metropolitan area), suggests that issues of debt for some were closely related to ongoing affordability of child care for families. One element of this was the requirement under the new funding model of parents to pay a co-payment to services. This meant that effectively all parents had a potential to build debt and the services could not rely on the 'subsidy only' funding approach that had at times been used in the past.
Under the Child Care Package, families on the lowest income are entitled to have 85 per cent of the cost of care subsidised, although with the 5 per cent withholding fee, this is reduced to 80 per cent. Several case study participants argued that even paying 20 per cent of the cost of fees was a struggle for some low income or vulnerable families.
I think some families think that child care is towards the bottom of the priorities. They need to pay food, groceries, gas, electricity, rent, and child care will get sorted out eventually.
[CBDC and OSHC provider, February 2020]
I came from a centre that didn't have any debt at all and when I started at this centre there was a lot. I think families that are obviously not working full-time or have casual work, that probably that plays a lot in to why fees get behind.
[CBDC provider, February 2020]
As mentioned, another factor contributing to the accrual of debt related to charging practices by services when families first commence using a service, prior to determination of CCS eligibility and the rate of subsidy. This is addressed in the Handbook, which states:
The department does not recommend that providers invoice families using estimates of fee reduction before Child Care Subsidy eligibility and entitlement is confirmed. This is because the actual amount of Child Care Subsidy paid (if any) may vary for a range of reasons.
Where care is provided before the parent has had their eligibility and entitlement assessed, any backdated Child Care Subsidy amounts are paid directly to the parent once Centrelink confirms their eligibility. This is because it is expected they will have already paid full child care fees to their provider for this period. Subsequent subsidy amounts will be paid to the provider.
If the service decides to not charge the family full fees while the family's entitlement to Child Care Subsidy is being assessed, the service is responsible for recovering any unpaid amounts from the family. (DESE, 2019b, p. 68)
This policy was seen by many services as impractical since it was often at the time of initially seeking child care - for example, in preparation for a return to work - that the family was most financially strained and least able to pay full fees. Also, it was not uncommon for early learning services to require families to pay a bond, often equivalent to 2 weeks of care, plus pay child care fees in advance. These policies therefore require families to pay 4 weeks of care upfront before their child/children commence. As a result, many services saw no option but to estimate the subsidy and charge families accordingly rather than expecting parents to pay full fees. This came from a position of understanding the difficulties some families face paying full fees but also a commitment to service the local community and ensuring that children can access education and care:
We've just had to draw up the new template that asks new families who start with us to pay at least half their child care fees until their child care subsidy commences. Families have commented that there are a lot of services out there requiring that they pay full fee until then - which is not financially manageable for them.
[CBDC provider, August 2019]
However, this leaves the service vulnerable to accruing debt, as once a family's CCS eligibility and entitlements are assessed and any backdated CCS amount paid, it is paid to the family rather than the service. It is then incumbent on the service to request these funds from the family, a repayment that services reported was mostly, but not always, forthcoming.
I had one [mother], Centrelink would not approve the Child Care Subsidy. [Eventually, when CCS was approved and the back payment came through] she was paid in one lot, but she's done a runner on me. I can't get that money. That back payment went to her and not me. And I've got a $9,000 debt from her.
[CBDC provider, February 2020]
Service directors noted that it was only on very rare occasions that they had needed to cease providing care to a child due to an ongoing issue with outstanding debt. Setting up a payment plan with a family tended to be effective. However, several services who participated in the case studies spoke of writing off debts accrued by disadvantaged or vulnerable families.
We've done more of it probably in the last 12 months than we ever had in terms of writing off some accounts that, from a social justice perspective, are not kind to pursue really […] We're up to nearly $5,000 that we've written from the accounts.
[CBDC provider, August 2019]
A further issue related to debt was the impact of decisions by Centrelink to reduce current CCS payments to services on behalf of parents, without advice to the service, to recover a historic debt accrued by a parent.172
9.5.4 Administrative burden
A recurrent theme of administrative burden was cited by many services as a threat to their financial sustainability. Some of the issues related to the administration of the CCS and other elements of Commonwealth policy, while others concerned other levels of government. In the work of the evaluation with respect to this aspect it was at times difficult to be able to fully identify the extent to which services' concerns reflected ongoing issues or were still reflecting the many issues, addressed in Chapter 10, concerning the transition, and the extent to which services felt this had imposed a major cost on them.
Notwithstanding the difficulty of separating out the transitional from ongoing factors, as discussed in Chapter 3, services report a significant ongoing role of providing support to parents with their interaction with the CCS and, for a much smaller group, having to resolve problems.
Underlying many of the concerns about the administrative burden was a larger challenge for many services, especially smaller ones, of the level of sophistication they required to effectively manage their operations and deliver services as small businesses when they were frequently motivated more by a desire to provide good care services rather than as a profit-maximising venture.
9.5.5 Oversupply and the state of the market
As discussed in Chapter 6, the state of the child care market varies significantly by location. While some services have waiting lists - a sign of excess demand - others report low occupancy rates, reflecting an oversupply of services. It was clear from the case study analysis that factors within the local market, over and above any changes introduced through the Package, were important in determining long-term service viability. Markets were often shaped more by local demographic and economic circumstances.
The diversity of factors at play can be seen, for example, in the contrast between the areas studied for Case Study 7, which had experienced a drop in the population of young families living in the area, and Case Study 6, which was in an area marked for high residential growth. In this latter case, this had led to an increase in the number of early learning services operating in the area, although the corresponding increase in young families was yet to occur. In both case studies, despite the different causes, similar concerns were raised by Centre Based Day Care service directors of the longer-term impacts of lower than optimal occupancy rates. Indeed, across all case study sites there were concerns raised by Centre Based Day Care services about lower than optimal occupancy rates and the effects of this on long-term viability. Participating services in Case Study 2, selected to enable a focus on child care use in a relatively high income central business district (CBD) environment, spoke of a highly competitive child care market that had seen a substantial increase in the number of services operating in the area. Given the inner city location, it was considered by service providers to be a lucrative market.
We've been here for six years, and at the time we were maybe one of four centres, in the CBD. I think now, there's about 10, and that's all kind of just happened in the last five years […] They are quite big services. So, one of them is 200 places, one of them is 150. So, there's a lot more choice for families now, and even though we do have a waiting list, sometimes when I contact people, they've found a position elsewhere. Demand is not as great as it was even two or three years ago.
[CBDC provider, April 2020]
Centre Based Day Care services in both Case Studies 2 and 6 spoke of needing to ensure their daily fee rates remained competitive and to consider points of differentiation from other services as a way of promoting their service. This could include specific facilities such as having fresh meals cooked onsite each day or having a barista available during the morning drop-off period, promoting unique elements to the educational program offered, flexibility with varying session options, or how in keeping the service was with the culture of the local community.
Operating in areas of oversupply, and the persistence of this state, was clearly a threat to service viability, especially for small businesses when the oversupply is from the entry of larger providers who have the capacity to wait out the collapse of smaller and/or standalone services. Several case study participants expressed concern about the lack of oversight of the Centre Based Day Care service market that meant that oversupply can become an issue. They argued that a short-term effect of oversupply was a reduction in quality of care and, in the long term, certain Centre Based Day Care services would likely no longer be viable. Maintaining quality requires a healthy budget. If services are not receiving the required income, they are likely not to be able to invest in professional development opportunities for their staff or provide other incentives aimed at retaining staff (such as providing permanent positions or paying above the award wage). Alternatively, services may be forced to increase fees to cover the shortfall in income.
There's no planned approach to [centre based] day care. How many services can open? So now we've got workforce shortages. They are just opening on every corner and it's a real estate game now […] So the difficulty we have is, you know, there's five relatively new in [our area], another brand new one opening. What happens to the other services? What happens to the staff? […] So, we have got a workforce shortage and our utilisations are lower so we're having to increase our fees to offset our low utilisation. So, no-one is winning.
[CBDC and OSHC provider, April 2020]
Family Day Care service directors who participated in the case studies spoke of the flow-on effect of a highly competitive Centre Based Day Care child care market to the Family Day Care market. Directors noted that the increased scrutiny of the Family Day Care sector that had taken place over recent years, accompanied by negative coverage of the sector within the media, was impacting Family Day Care services at a local level, particularly when the Centre Based Day Care sector was not at capacity and so families had alternative options.
So, there has been quite a few reports and media coverage and things like that around Family Day Care and not in a good light. It has tarnished - we are at the back end of it now and starting to build back up again, which is good. But it's like anything. If something happens within that sector or that industry or within that business, then they get the bad media and then it slumps and tarnishes everybody who's affiliated with that for a little while. Then it starts to build back up as people realise that that's not who you are or how you operate.
[FDC provider, February 2020]
As noted in Chapter 6, it was only in the Outside School Hours Care sector that the majority of services (73.3 per cent) reported not having a waiting list in June 2018. In the Centre Based Day Care sector, while 35.0 per cent of services reported not having a waiting list, 27.0 per cent reported a waiting list for all sessions, and the remainder for some ages, sessions or days.
9.6 Compliance and the Family Day Care sector
Initially commencing with the establishment of a dedicated payment compliance taskforce in October 2014 (Ley, 2014a), the Department, along with state authorities, has been actively addressing issues of compliance across the child care sector, but with a particular focus on the Family Day Care sector. One element of this at the national level was legislative change directed at 'decisive action to tighten child care payment laws to stop dodgy family day care services exploiting 'legislative loopholes' that are costing taxpayers millions … as existing laws had failed to keep pace with the rapid growth of the family day care sector, which had almost doubled in size since 2012' (Ley, 2014b).
In February 2017 the Minister for Education and Training announced an expansion of these measures 'to prevent $250 million being paid to dodgy Family Day Care providers … to protect taxpayers, families and most importantly children in child care' (Birmingham, 2017). In 2018 the Government announced a further strengthening of these policies: 'targeted activity will build on the success of the first wave of the Government's Family Day Care integrity crackdown' (Tehan, 2018).
One dimension of these policies involves the imposition of sanctions against providers identified as breaching or being non-compliant with program requirements.173 These sanctions can involve the cancellation, or suspension, of services, or the imposition of conditions. While clearly cancellations involve the termination of a service, equally the imposition of lesser restrictions can also result in a provider terminating their operation. Additionally, in some cases, by the time a formal sanction had been imposed a service had already terminated its operations. For this reason, in consideration here, interest is only in whether or not a sanction has been imposed, rather than its nature.174 Table 110 shows the number of services that have exited the provision of child care with a recorded sanction, and this as a proportion of all service exits, by sector. There are 3 key features:
- Overwhelmingly sanctions have been imposed on Family Day Care services.
- Most exits of a Family Day Care service from providing care can be seen as a consequence of the imposition of a sanction, with this reaching a peak of 92.6 per cent in Q2 2018. In contrast, sanctions have played a very minor role in exits in other sectors.
- Sanction action against Family Day Care services increased across 2017 and the first half of 2018, and while still disproportionately impacting this sector, it has reduced to comparatively low rates in 2019.
| Quarter | Service type: | Total | Service type: | Total | ||||||
|---|---|---|---|---|---|---|---|---|---|---|
| CBDC | FDC | OSHC | IHC | CBDC | FDC | OSHC | IHC | |||
| Sanctions a | Proportion of service exits with a sanction (%) | |||||||||
| Q1 2017 | 0 | 22 | 0 | 0 | 22 | 0.0 | 77.3 | 0.0 | 0.0 | 19.8 |
| Q2 2017 | 0 | 33 | 1 | 0 | 34 | 0.0 | 78.3 | 2.2 | 0.0 | 19.3 |
| Q3 2017 | 0 | 33 | 1 | 0 | 34 | 1.0 | 78.4 | 0.0 | 0.0 | 17.2 |
| Q4 2017 | 1 | 41 | 1 | 1 | 44 | 0.0 | 88.6 | 0.7 | 0.0 | 9.0 |
| Q1 2018 | 0 | 36 | 0 | 0 | 36 | 0.0 | 87.1 | 0.0 | 0.0 | 15.0 |
| Q2 2018 | 1 | 88 | 1 | 0 | 90 | 1.0 | 92.6 | 1.6 | 0.0 | 34.1 |
| Q3 2018 | 0 | 12 | 0 | 0 | 12 | 0.0 | 54.8 | 0.0 | 7.7 | 3.8 |
| Q4 2018 | 0 | 21 | 0 | 0 | 21 | 0.0 | 81.3 | 0.0 | 0.0 | 3.8 |
| Q1 2019 | 1 | 8 | 0 | 0 | 9 | 1.1 | 80.0 | 0.0 | 0.0 | 5.8 |
| Q2 2019 | 2 | 7 | 0 | 0 | 9 | 2.7 | 40.0 | 0.0 | 0.0 | 4.8 |
| Q3 2019 | 2 | 6 | 0 | 0 | 8 | 2.8 | 75.0 | 0.0 | 0.0 | 3.2 |
Note: a Last recorded sanction.
Source: DESE administrative data and DESE Child Care Enforcement Action Register
9.6.1 Family Day Care Sanctions
The role of compliance measures varies significantly by state. Table 111 shows for the periods prior to, and following, the introduction of the Child Care Package, the number of services that have ceased to provide care by state, and the proportion of these that are associated with a sanction.
As illustrated, the largest number of exits by Family Day Care services in the first period, and equal highest in the second period, were recorded in Victoria. In this state 90.1 per cent of the exits in the period between January 2017 and June 2018 were for a service that had a sanction recorded against it, as were 79.3 per cent in the following period. This was followed by New South Wales, where the proportions were 89.5 per cent and 65.5 per cent respectively.
As further detailed in the table, both exits and the proportion of exits associated with a sanction were overwhelmingly in the for-profit sector. The aggregate impact on this sector has been high. In Victoria the number of for-profit Family Day Care services has fallen from 255 at the beginning of 2017 to 92 at end 2019. In South Australia it had fallen from 10 to zero, in Tasmania from 6 to 2 and in the ACT from 9 to 4.
| Jan. 2017 - June 2018 | July 2018 - Sept. 2019 | Total | ||||
|---|---|---|---|---|---|---|
| Exits | With sanction action (%) | Exits | With sanction action (%) | Exits | With sanction action (%) | |
| New South Wales | 86 | 89.5 | 29 | 65.5 | 115 | 83.5 |
| Victoria | 152 | 90.1 | 29 | 79.3 | 181 | 88.4 |
| Queensland | 33 | 57.6 | 14 | 28.6 | 47 | 48.9 |
| South Australia | 9 | 100.0 | 0 | - | 9 | 100.0 |
| Western Australia | 13 | 61.5 | 4 | 50.0 | 17 | 58.8 |
| Tasmania | 3 | 33.3 | 3 | 0.0 | 6 | 16.7 |
| Northern Territory | 1 | 100.0 | 0 | - | 1 | 100.0 |
| Australian Capital Territory | 4 | 75.0 | 2 | 50.0 | 6 | 66.7 |
| For-profit | 283 | 88.0 | 69 | 69.6 | 352 | 84.4 |
| Not-for-profit | 17 | 35.3 | 12 | 8.3 | 29 | 24.1 |
| Total | 301 | 84.7 | 81 | 60.5 | 382 | 79.6 |
Source: DESE administrative data and DESE Child Care Enforcement Action Register
9.6.2 Impact on the provision of care
These service exits have resulted, as shown in Figure 149, in a marked reduction in the quantity of care provided by the Family Day Care sector; in particular, in the for-profit sector. Here the number of children has fallen from over 100,000 in early 2017, to some 60,000 in the second half of 2018, and to some 48,000 in the second half of 2019. While less marked, there has also been a fall in the number of children cared for in the not-for-profit sector. In this sector, the average has fallen from some 45,000 in 2017, and 41,000 in 2018, to under 39,000 in 2019. Unlike the for-profit sector, the decline in the not-for-profit sector appears to be a year-on-year phenomenon, with each successive year failing to reach the same number as the previous year in the first few months of the year, but then remaining stable at this level over the year.
Figure 149: Children attending Family Day Care, by for-profit status, January 2017 to December 2019
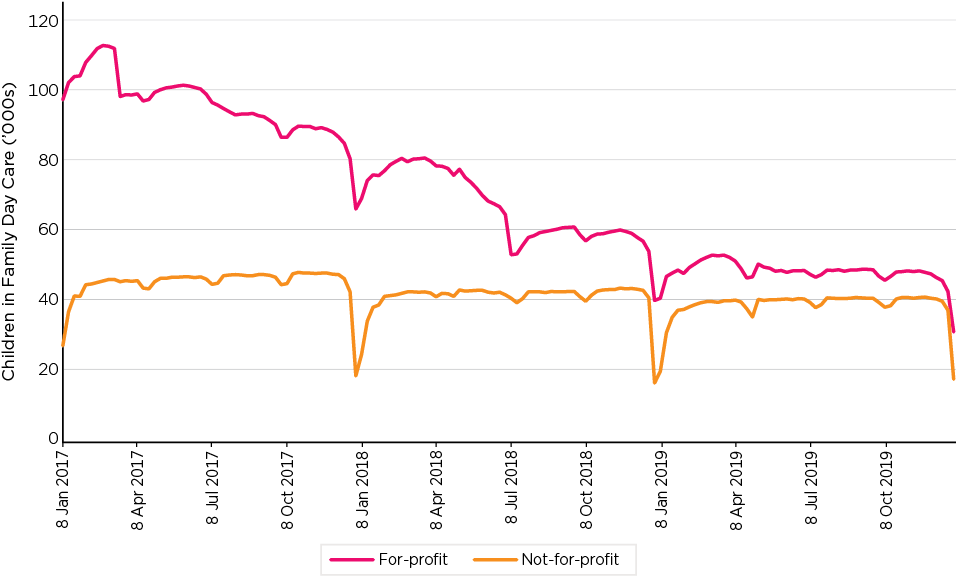
Source: DESE administrative data
The pattern of exits; in particular, the major declines in the number of for-profit Family Day Care services in New South Wales and Victoria, is also reflected in the number of children attending services in this sector, as shown in Figure 150. While these are the dominant declines in the chart, declines are also evident in other states, including the disappearance of the sector in South Australia. In Queensland not only is the relative decline quite small, but it shows a similar pattern of decline to that of the not-for-profit sector nationally. It is also notable that in this state a much smaller number of exits from the sector were associated with compliance action. While the level of attendance in Western Australia shows a similar pattern as Queensland for much of the period, the sector in Western Australia has shown a slight recovery in the second half of 2019.
Figure 150: Children attending for-profit Family Day Care, by state, January 2017 to December 2019
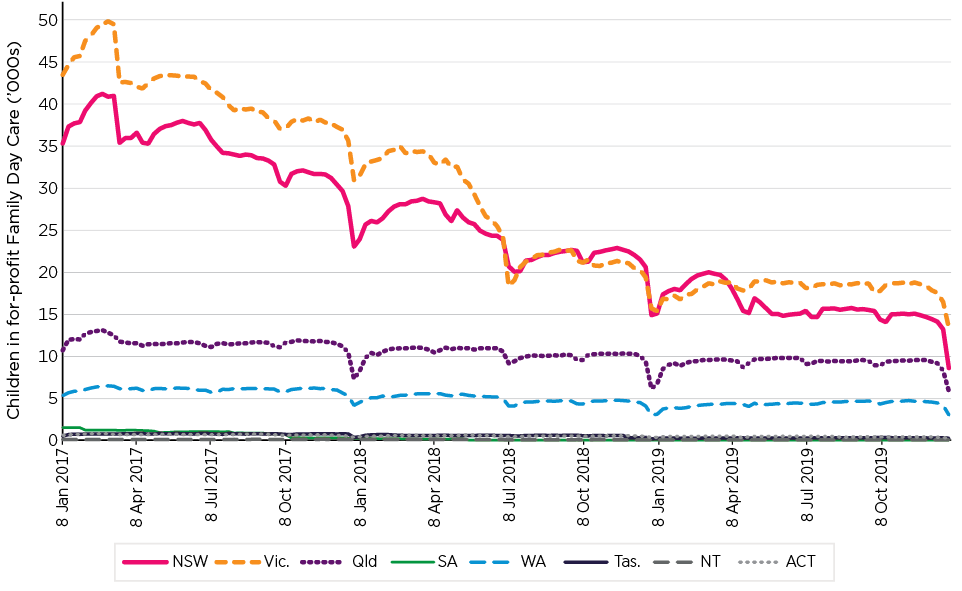
Source: DESE administrative data
While in some cases the compliance action involved fraudulent claims for children who did not attend care, this was not always the case. Analysis of closures up to mid July 2019 indicated that some 53.9 per cent of children who attended a service subject to sanction activity just prior to it ceasing were in child care a month later. This level compares with a usual retention rate in for-profit Family Day Care Services of some 70 per cent over this period. Most of these children continued to receive care from Family Day Care services.
9.7 Community Child Care Fund
The Community Child Care Fund, as outlined in Chapter 1, provides grants to child care services with the objective of reducing barriers to child care, especially in disadvantaged, regional and remote communities. It has 2 main components, 'Open Competitive' grants and 'Restricted Non-competitive' grants, along with 'Connected Beginnings' and 'Special Circumstances' grants. Examples of these latter given by the Department are where a service is: at risk of closure due to an unforeseen event or circumstance, for example natural disasters; at risk of permanent closure where this would result in a lack of suitable child care for the community; or seeking to open a new service in a community where there is no suitable child care.
Given the nature of the program, it is not necessarily a program that is relevant to all services at all times. This was reflected in the findings of the first wave of the SELCS, where in June 2018, just prior to the introduction of the Package but after the call had been made for applications for the first round, 13.7 per cent of services reported making an application, with this rising to 23.9 per cent of Family Day Care Services. Of significance was that 26.3 per cent of respondents who in providing an answer to this question chose the response 'I don't know what a Community Child Care Fund grant is'. When asked for their reason for not applying, the main reason given by those who knew of the program but did not apply was that they considered their service was not eligible.
9.7.1 Competitive Grants
Table 112 summarises the grants that had been made under the Competitive Grants component of the program to end 2019. As detailed, the overwhelming component of the first round of grants was the provision of sustainability support. While this was also the main element in the second round, it accounted for a much lesser share of the total grants. Over the period, the average size of grants under the Capital Support, Community Support and Sustainability elements of the program ranged from $147,000 to $164,000. In contrast, it was $29,200 for Special Circumstances grants which, as can be seen from the table, were mostly short-term grants and, indeed, the median value of grants under this element was just $11,000. The longest duration grants were those provided through Sustainability Support, where over three-quarters of the grants were for a period of 2 to 3 years.
| Type of grant | Total | ||||
|---|---|---|---|---|---|
| Capital Support | Community Support | Special Circumstances | Sustainability Support | ||
| Total value of grants ($) | |||||
| 2018-19 Financial Year | 1,259,500 | 20,679,113 | 858,013 | 101,414,959 | 124,211,585 |
| June - December 2019 | 873,250 | 3,150,918 | 746,640 | 4,187,634 | 8,958,442 |
| Number of grants | |||||
| 2018-19 Financial Year | 6 | 116 | 27 | 682 | 831 |
| June - December 2019 | 7 | 41 | 28 | 35 | 111 |
| Grant value ($) | |||||
| Average | 164,058 | 151,784 | 29,175 | 147,284 | |
| Median | 149,000 | 108,900 | 11,000 | 96,591 | |
| Distribution of grants by duration (number of grants) | |||||
| <1 year | 2 | 6 | 35 | 35 | |
| 1 year | 3 | 12 | 16 | 14 | |
| 1>-2 years | 7 | 48 | 4 | 44 | |
| 2>-3 years | 1 | 60 | 0 | 551 | |
| Over 3 years | 0 | 31 | 0 | 73 | |
| Total grants | 13 | 157 | 55 | 717 | |
Source: DESE operational reports
The focus in subsequent analysis will be on those grants that were in effect in 2018-19 and on the proportion of the grant, on a pro rata basis, that is relevant to this period.
Priority areas and targeting
The CCCF Competitive Grants have been targeted at geographically defined priority areas, although with some variation over time in both the areas identified, and the actual eligibility criteria. In round 1 eligibility was restricted to services located in the priority areas or which had been in receipt of funding under the former Community Support Program. In the second round, eligibility was extended to include services where more than half the children came from a priority area, or in the case of Family Day Care services, half the educators were delivering care in these areas or, if the service was an In Home Care Service, that had previously received Community Support Program funding. In round 3, which was to close in early 2021, the criteria further widened to include services servicing regional, remote or very remote areas and providing specialised child care services to a vulnerable or disadvantaged sector of its community, as well as those that had received an earlier CCCF grant. In each of the 3 rounds, while the selection of priority areas used similar criteria to determine disadvantage, the actual locations varied where more recent data showed changes in the relative needs of locations.
Using the round 2 priority areas, some 8.3 per cent of services operating in 2018-19 were in a priority location. This varied from 2.9 per cent of services in capital cities to 87.0 per cent of those in remote locations, and 87.2 per cent of those in very remote areas.
9.7.2 CCCF Restricted Non-competitive Grants
The structure of the restricted grants is somewhat different to the application-based open grants. Rather, they are calculated on a formula basis reflecting previous service funding levels with adjustments for factors such as expected fees income and subsidies from the CCS, with further adjustments being made over the grant period if these expected levels vary. Additionally, it is noted that while most of the services receiving these grants are child care services within the scope of this evaluation, a certain number are not. Overall, it is estimated that 90.3 per cent of the funding identified in 2018-19 flowed to the child care sector as identified here.
This formula base for the program, as shown in Table 112, was based on a 5-year timetable with some tapering of the grant value over time.
| Value of grants | Number of grants | ||||
|---|---|---|---|---|---|
| Sustainability | Capital | Sustainability and capital | Sustainability only | Capital only | |
| ($) | (grants) | ||||
| 2018-19 | 41,490,329 | 3,953,235 | 69 | 91 | 0 |
| 2019-20 | 44,468,889 | 1,667,144 | 48 | 108 | 1 |
| 2020-21 | 37,766,792 | 515,141 | 26 | 125 | 0 |
| 2021-22 | 35,620,861 | 448,135 | 25 | 120 | 0 |
| 2022-23 | 34,524,440 | 256,038 | 19 | 122 | 1 |
Source: DESE operational reports
Table 114 shows the programs under which the services now in receipt of CCCF restricted grants previously received funding, and documents the relationship between the level of sustainability funding provided under the CCCF grant, and the level of funding the service obtained under the old program arrangements in 2017-18. Overall, CCCF funding equals 99.0 per cent of the previous funding.
This proportion is, however, not uniform and, in some cases, services are receiving higher assistance through CCCF grants than they did under their previous funding. This, as shown in the table, includes some 46.7 per cent of the former BBF services, which form the main group of services in the table and the main former program type primarily involved in delivering child care services. At the same time, however, 17.5 per cent of these services received less than half the funding they previously did.
| 2018-19 CCCF Restricted Grant as a proportion of 2017-18 funding | Previous funding basis: | Total | ||
|---|---|---|---|---|
| Budget Based Funding | Indigenous Advancement Strategy | Non-Formula Funded Occasional Child Care | ||
| Distribution (%) | ||||
| Zero | 0.0 | 0.0 | 8.3 | 0.6 |
| <25% | 4.4 | 0.0 | 16.7 | 5.0 |
| 25-<50% | 13.1 | 8.3 | 8.3 | 12.4 |
| 50-<75% | 19.7 | 25.0 | 25.0 | 20.5 |
| 75-<100% | 16.1 | 41.7 | 16.7 | 18.0 |
| 100-<125% | 21.2 | 16.7 | 8.3 | 19.9 |
| 125-<200% | 18.2 | 8.3 | 0.0 | 16.1 |
| over 200% | 7.3 | 0.0 | 16.7 | 7.5 |
| 100.0 | 100.0 | 100.0 | 100.0 | |
| Services (count) | 137 | 12 | 12 | 161 |
Source: DESE operational reports
9.7.3 CCCF grants and the child care sector
As noted above, not all of these grants flow to services that can be identified as child care services in the DESE administrative database.175 However, the overwhelming proportion were, and are considered here. Table 115 shows the proportion of services receiving a grant in 2018-19 and the value of the grant in that financial year.
The chart shows some very marked differences in the distribution of grants. Of particular note is that one third of all not-for-profit Family Day Care services have received CCCF funding, as have 31.7 per cent of not-for-profit In Home Care Services, although where these services received a grant, it is for only half the amount of the grant going to Family Day Care Services in receipt of such assistance.
More generally, for-profit services were only one tenth as likely to receive a grant, and where they did, the average value of the grant they received is only two-thirds of the amount of that of not-for-profit services. One reason for this difference is the previously seen concentration of for-profit services in urban locations, relative to regional and other locations, which are the focus of the CCCF.
| Proportion with CCCF grants: | Average grant | |||||
|---|---|---|---|---|---|---|
| For-profit | Not-for-profit | Total | For-profit | Not-for-profit | Total | |
| (%) | ($) | |||||
| CBDC | 1.0 | 6.4 | 2.6 | 73,143 | 129,760 | 114,612 |
| FDC | 1.8 | 33.8 | 17.7 | 47,425 | 123,622 | 119,696 |
| OSHC | 0.5 | 6.9 | 3.7 | 23,457 | 28,670 | 28,348 |
| IHC | - | 31.7 | 18.6 | - | 53,532 | 53,532 |
| Total | 0.9 | 9.2 | 4.0 | 65,179 | 99,366 | 94,305 |
Notes: Only includes grants made for 2018-19. Includes both capital and recurrent grants. Restricted grants take account of adjustments made to the grant level. Open grants have been allocated to the financial year on a pro rata basis, taking into account the total period for which the grant was made and the proportion of this period which was within 2018-19.
Source: DESE administrative data and operational reports
Table 116 shows the distribution of services that received a CCCF grant by whether these are located in the second round priority areas, while as noted these priority areas varied for each round, and that grants, including the restricted grants, were not necessarily solely targeted to these areas. The table demonstrates the extent of targeting with 30.7 per cent of services in the priority areas receiving a grant.
| Round 2 priority areas | 2018-19 CCCF grant | Total | |||
|---|---|---|---|---|---|
| Nil | Restricted and open | Restricted | Open | ||
| Services | |||||
| Priority area | 791 | 0 | 83 | 268 | 1,142 |
| Not | 12,103 | 2 | 57 | 472 | 12,634 |
| Total | 12,894 | 2 | 140 | 740 | 13,776 |
Notes: Only includes grants made for 2018-19. Includes both capital and recurrent grants.
Source: DESE administrative data and operational reports
The regional dimension of grants is considered further in Table 117, which shows the proportion of services by state and region that receive CCCF funding, and the average value of the grants. In this table some very clear differences by state can be identified. While in the 2 largest states, New South Wales and Victoria, just 3.1 per cent and 2.9 per cent of services receive a CCCF grant, 8.9 per cent of those in the Northern Territory, and 24.1 per cent of those in Tasmania do. The chart also shows a strong regional gradient with 68.3 per cent of services in very remote locations receiving a grant, compared with just 0.9 per cent of those in capital cities. This reflects the importance of geographic targeting to the program.
The table also shows considerable variation in the average value of grants by state and location, other than the generally (but not necessarily always) lower average size of grants in capital city and major urban locations. The other key feature is the higher average value of the grants provided in the Northern Territory.
| NSW | VIc. | Qld | SA | WA | Tas. | NT | ACT | Total | |
|---|---|---|---|---|---|---|---|---|---|
| Proportion of services receiving a CCCF grant (%) | |||||||||
| Capital Cities | 0.5 | 0.7 | 1.5 | 0.4 | 0.6 | 16.2 | 1.3 | 0.0 | 0.9 |
| Urban 100k plus | 0.9 | 0.6 | 2.9 | - | - | - | - | - | 1.9 |
| Urban 50k-<100k | 3.7 | 5.6 | 14.2 | - | 1.3 | 8.3 | - | - | 7.8 |
| Urban 20k-<50k | 11.4 | 7.7 | 11.7 | 10.9 | 17.2 | 43.5 | 14.9 | - | 13.3 |
| Urban 10k-<20k | 13.8 | 12.2 | 10.2 | 36.3 | 8.4 | 55.3 | - | - | 15.1 |
| Inner Regional | 14.5 | 22.5 | 7.9 | 31.9 | 34.9 | 44.8 | - | 53.3 | 18.2 |
| Outer Regional | 31.6 | 46.3 | 26.7 | 53.9 | 79.0 | 60.5 | 10.5 | - | 37.1 |
| Remote | 68.7 | - | 36.4 | 64.1 | 87.6 | 100.0 | 16.8 | - | 56.0 |
| Very Remote | 69.8 | - | 64.6 | 100.0 | 57.5 | 100.0 | 72.3 | - | 68.3 |
| Total | 3.1 | 2.9 | 4.4 | 5.6 | 4.4 | 24.1 | 8.9 | 0.1 | 4.0 |
| Average annual value of grant in 2018-19 ($) | |||||||||
| Capital Cities | 87,840 | 51,366 | 64,193 | 100,445 | 262,439 | 86,009 | 94,001 | 11,132 | 84,589 |
| Urban 100k plus | 79,402 | 45,818 | 76,666 | - | - | - | - | - | 76,360 |
| Urban 50k-<100k | 79,294 | 95,438 | 35,999 | - | 25,390 | 92,411 | - | - | 60,211 |
| Urban 20k-<50k | 133,940 | 80,349 | 48,078 | 116,483 | 155,990 | 175,743 | 371,302 | - | 136,542 |
| Urban 10k-<20k | 112,484 | 167,440 | 49,005 | 151,191 | 159,502 | 34,714 | - | - | 123,875 |
| Inner Regional | 78,299 | 51,467 | 47,013 | 38,101 | 87,281 | 159,245 | - | 344,679 | 64,255 |
| Outer Regional | 96,101 | 83,999 | 87,962 | 76,773 | 67,860 | 54,684 | 15,760 | - | 82,152 |
| Remote | 87,863 | - | 231,114 | 74,244 | 74,084 | 65,715 | 216,242 | - | 106,011 |
| Very Remote | 95,486 | - | 224,118 | 132,036 | 85,179 | 97,545 | 239,004 | - | 172,512 |
| Total | 101,191 | 74,518 | 78,210 | 90,934 | 121,213 | 103,017 | 232,787 | 331,337 | 94,305 |
Notes: Only includes grants made for 2018-19. Includes both capital and recurrent grants. Restricted grants take account of adjustments made to the grant level. Open grants have been allocated to the financial year on a pro rata basis taking into account the total period for which the grant was made and the proportion of this period that was within 2018-19.
Source: DESE administrative data and operational reports
| Dependent variable | Marginal effects a | |
|---|---|---|
| If service has received CCCF funding in 2018-19 | ||
| Service demographic characteristics | Proportion ATSI b | 0.116*** |
| Proportion Single Parent c | 0.037*** | |
| Number of children d | 0.000*** | |
| Care type | CBDC | base |
| FDC | 0.154*** | |
| OSHC | 0.010*** | |
| IHC | -0.013 | |
| State | New South Wales | base |
| Victoria | 0.027*** | |
| Queensland | 0.015*** | |
| South Australia | 0.022*** | |
| Western Australia | 0.037*** | |
| Tasmania | 0.059*** | |
| Northern Territory | -0.001 | |
| Australian Capital Territory | -0.016 | |
| For profit | For-profit service | base |
| Not-for-profit service | 0.070*** | |
| Service start date | Prior to July 2017 e | base |
| 2017-18 | -0.031*** | |
| 2018-19 | -0.054*** | |
| Urban and regional location | Capital Cities | base |
| Urban 100k plus | 0.010** | |
| Urban 50k-<100k | 0.039*** | |
| Urban 20k-<50k | 0.042*** | |
| Urban 10k-<20k | 0.075*** | |
| Inner Regional | 0.172*** | |
| Outer Regional | 0.220*** | |
| Remote | 0.278*** | |
| Very Remote | 0.303*** | |
| SEIFA decile | 1 (Bottom) | base |
| 2 | -0.028*** | |
| 3 | -0.027*** | |
| 4 | -0.020** | |
| 5 | -0.027*** | |
| 6 | -0.038*** | |
| 7 | -0.036*** | |
| 8 | -0.029*** | |
| 9 | -0.045*** | |
| 10 (Highest) | -0.034*** | |
| Model | n | 13,705 |
| pseudo-r2 | 0.476 |
Notes: The table is for the probability of a service having received some CCCF funding in 2017-18. As seen in Table 117 the overall probability is 4.0 per cent, that is 0.04. a Average marginal effects. These can, for categorical variables, be seen as the difference in probability of a service in a particular category receiving a grant relative to the base category. b This marginal effect can be treated as being the difference in probability between a service with no Aboriginal or Torres Strait Islander children, effectively the base, and one where all children are Aboriginal or Torres Strait Islanders. c as per b but with respect to whether children's parents are Single Parents. d This variable has in fact a very small negative marginal effect -0.00019, suggesting that larger services were less likely to receive funding from a CCCF grant. e While services receiving Restricted grants did not have an actual start date prior to 1 July 2019 on the administrative data, as they previously did not receive child care benefit subsidies, as they were all pre-existing services, they have been coded as having a start date of prior to July 2017. *, **, *** indicate that the underlying coefficient is significant at the 90 per cent, 95 per cent and 99 per cent confidence levels respectively.
Source: DESE administrative data and operational reports
These differences are further considered in Table 118, which provides a multivariate analysis of the probability of a service receiving a CCCF grant. The table shows the marginal probability associated with the different values of variables of a service, relative to the identified base case, of a service obtaining a CCF grant.
- The probability of a service obtaining a grant increases with the proportion of children who are Aboriginal or Torres Strait Islanders, and to a lesser extent the proportion who have a single parent. It diminishes with service size as measured by the number of children attending.
- Relative to Centre Based Day Care, Family Day Care services have a very strong higher probability of gaining a grant. Effectively, they are some 15 percentage points more likely to obtain a grant, all other factors being held constant. While Outside School Hours Care Services also have a higher likelihood, the magnitude of this is small. Although the model identifies a slight negative marginal probability for In Home Care services, indicating that they are relatively less likely to obtain a grant, this was not statistically significant.
- Services in Tasmania176 were 5.9 percentage points more likely to obtain a grant than those in NSW, and those in Western Australia were 3.7 percentage points more likely. While, relative to NSW, services in Victoria, Queensland and South Australia also had a higher probability of gaining a grant, the magnitude of this is smaller. Services in the Northern Territory and the ACT had a probability little different to that of NSW services. This result would suggest that while the very high rate seen in Table 117 in Tasmania partially reflects some state specific advantage from the program, the high rate in the Northern Territory simply reflected the other characteristics of services in the Territory.
- Not-for-profit services had a 7 per cent higher probability of obtaining a grant than those in the for-profit sector, suggesting that the difference seen in Table 115 between the sectors can mainly be ascribed to this factor, and not differences in the composition of the services within the sectors.
- More recently, started services were less likely to be in receipt of a CCCF grant than those that were operating as of the first half of 2017. While in part this reflects the role of the restricted grants going to established BBF and other funded services, the differential between those commencing in 2017-18 and those in 2018-19 is also quite marked.
- Reflecting the targeting of the program, there is a very large and distinct increase in the probability of a service receiving funding under the CCCF as the degree of urbanisation falls and remoteness increases. This effect outweighs all others identified in the table in terms of magnitude, with a service in very remote locations having a 30 percentage point higher likelihood of obtaining a grant than one in a capital city.
- In contrast, the degree of socio-economic advantage or disadvantage of a location made only a minor contribution, with all locations relative to the most disadvantaged, bringing a 2 to 4.5 percentage point probability penalty.
Earlier tables have looked at the magnitude of grants, and in the case of the restricted grants, their value relative to the previous funding services received. Table 119 provides a different insight into this, comparing the value of CCCF funding to subsidy payments (CCS and ACCS) received by services - a measure of the relative weight of CCCF subsidies to mainstream subsidy payments to services. In capital cities and in urban agglomerations with a size of 20,000 persons or more, the median value of CCCF grants for those services in receipt of a grant was less than 20 per cent of the value of other child care subsidies. This proportion rose rapidly for smaller and remote locations, rising to around 40 per cent in non-urbanised inner and outer regional locations and to half in remote locations, and representing 2.3 times the value of these other subsidies in very remote locations. At higher points of the distribution these proportions increased in most cases very strongly and across all locations. The top quarter of recipients of CCCF grants received grants equal to 85.8 per cent or more of the more usual child care subsidies.
| Percentile points of the distribution: | |||||
|---|---|---|---|---|---|
| 10th | 25th | 50th | 75th | 90th | |
| Value of grants as a proportion of CCS subsidies a (%) | |||||
| Capital Cities | 3.2 | 9.5 | 19.3 | 52.8 | 177.1 |
| Urban 100k plus | 2.0 | 6.4 | 11.7 | 25.7 | 37.1 |
| Urban 50k-<100k | 4.0 | 8.5 | 16.2 | 40.7 | 79.1 |
| Urban 20k-<50k | 4.6 | 8.7 | 18.0 | 61.7 | 139.3 |
| Urban 10k-<20k | 8.4 | 10.9 | 23.4 | 65.8 | 164.1 |
| Inner Regional | 10.6 | 18.8 | 41.8 | 95.0 | 223.2 |
| Outer Regional | 9.8 | 16.7 | 40.8 | 81.1 | 218.9 |
| Remote | 19.6 | 26.4 | 52.9 | 96.3 | 257.7 |
| Very Remote | 20.0 | 42.6 | 227.4 | 1,803.8 | 10,740.9 |
| Total | 6.9 | 13.7 | 32.9 | 85.8 | 314.7 |
Notes: a This includes CCS and ACCS subsidies, but not funding under ISP. Only includes grants made for 2018-19. Includes only recurrent grants. Restricted grants take account of adjustments made to the grant level. Open grants have been allocated to the financial year on a pro rata basis, taking into account the total period for which the grant was made and the proportion of this period that was within 2018-19.
Source: DESE administrative data and operational reports
9.7.4 Connected Beginnings
This program was subject to a separate evaluation that was published in June 2019 (Australian Healthcare Associates, 2019). The specific purpose of the program is described to:
support the integration of early childhood, maternal and child health, and family support services with schools in a number of Indigenous communities. (p. 2)
The report, while finding a number of good practices, also highlighted some challenges. Two central questions related to community engagement and emphasised the need for the program to be 'community driven' (p. 6); and that there was a need for:
strong leadership and the ability to work across multiple service sectors in often challenging and complex service environments. This proved challenging for some sites, especially where pre-existing relationships between providers were fractious. At other sites, pre-existing relationships were strong, and less work was required to ensure service engagement and readiness. (p. 12)
The report made extensive recommendations, including:
- strengthening the guidelines and core funding to focus on effective collective impact approaches, along with clarity of expectations relating to case management and coordination
- improved approaches to project development focusing on community engagement and co-design
- an extended funding time frame
- unified operational guidelines at the interdepartmental level and clarification of relationships between jurisdictions including state government and Commonwealth agencies.
9.7.5 The overall impact of CCCF funding
While only a minority of services received CCCF funding, for many of those who did receive these grants, the magnitude of the grants was large, in absolute terms, relative to former funding for those transferring from sources such as BBF funding, and relative to what they received through standard child care subsidies.
The targeting of the program towards regional areas clearly was reflected in the allocation of grants, although there were some less than wholly explained aspects of the distribution, including the large flow of funds to Tasmania. As the evaluation did not have access to grant applications or assessment, it cannot be determined what the factors behind this were, although it is noted that there is evidence of services in Tasmania being more likely to be aware of the program and to make an application.
A key question that emerges from the analysis, including the time scale of continuing substantial grants under the restricted grants, and the time scale of many of the open grants, is the extent to which CCCF funding is short- to medium-term support to place services onto a path of sustainability, or whether it is effectively a second stream of ongoing funding that complements, or indeed dominates, the Child Care Subsidy on the basis of it being insufficient, in association with parental payments, to provide for economically viable child care in some locations.
9.8 The child care workforce
A key element of a robust child care sector is an adequate and well-trained workforce. This is considered here in terms of the balance of labour demand and supply, and levels of training, along with perspectives of services as collected in the evaluation case studies.
The most recent National Workforce Census of the ECEC sector, conducted in 2016, identified 194,994 staff of whom 89.2 per cent were engaged in a contact role with children. Some 11.9 per cent of contact staff had a Bachelor degree or higher, 34.1 per cent a Diploma or Advanced Diploma and 38.0 per cent either a Certificate III or Certificate IV qualification (SRC, 2017).
ABS report that in May 2018 the average weekly earnings of a full-time non-managerial child carer paid at the adult rate was $953.30. This placed these employees in the second decile of earnings for such female employees, but within the equivalent bottom decile for males.
9.8.1 State of the labour market
The Department of Education, Skills and Employment undertakes research to identify skill shortages in the Australian labour market. The analysis is provided at the state and territory level with some reference to regional circumstances, and a national rating.
In the most recent report, the Department indicates that nationally there was no shortage in the 3 child care occupations on which they report, see Table 120. It did note, however, some shortages at the state level. This included shortages of child care centre managers in South Australia and Western Australia, and a shortage of child care workers with Certificate III qualifications in New South Wales and Victoria, as well as regional Northern Territory.
| Carers and Aides Occupation | NSW | Vic. | Qld | SA | WA | Tas. | NT | ACT | Aus. |
|---|---|---|---|---|---|---|---|---|---|
| 134111 Child Care Centre Manager | NS | NS | NS | S | S | CNR | NS | NS | NS |
| 421111a Child Care Worker (certificate III) | S | S | NS | NS | NS | NS | R | NS | N |
| 421111b Child Care Worker (diploma) | S | NS | NS | NS | NS | NS | NS | S | NS |
Notes: Rating abbreviations: NS - No shortage; S - Shortage; R - Shortage in regional areas; CNR - Cannot rate.
Source: 'Ratings Summary - Labour Market Analysis of Skilled Occupations' (DESE, 2019c)
Notwithstanding this broadly benign state of the labour market, the national report indicated that 'overall, surveyed employers found it more difficult to recruit for child care occupations in 2018, compared with the previous 4 years' (Department of Jobs and Small Business, 2018a). Illustrating this, the ACT report noted that while there were applicants for positions, there were significant problems with the quality:
… around three quarters of the qualified applicants were considered unsuitable. The main reasons included poor quality applications, inexperience, lack of understanding of the occupation (which employers attributed to poor quality training), or unsatisfactory communication skills. (Department of Jobs and Small Business, 2018b)
The state of labour demand can also be identified in data on reported vacancies. A key source of this is the 'Internet Vacancy Report' published by the Australian Government (Australian Government, 2020b) that draws on a range of internet job boards. This, Figure 151, would initially suggest some weakening of labour demand for Child Care workers in 2019 when compared with previous years. However, the extent to which there was a corresponding increase in the classification 'Early Childhood (Pre-primary School) Teachers', leaves open the potential that there has been some change in the way vacancies have been classified. This is also reflected in documentation such as the South Australian DESE occupational report on this teacher classification 'ANZSCO 2411-11', which refers to demand from employers in 'kindergartens, child care and early learning centres'.
Figure 151: Child care educators, Internet Vacancy Report, 2017-2020
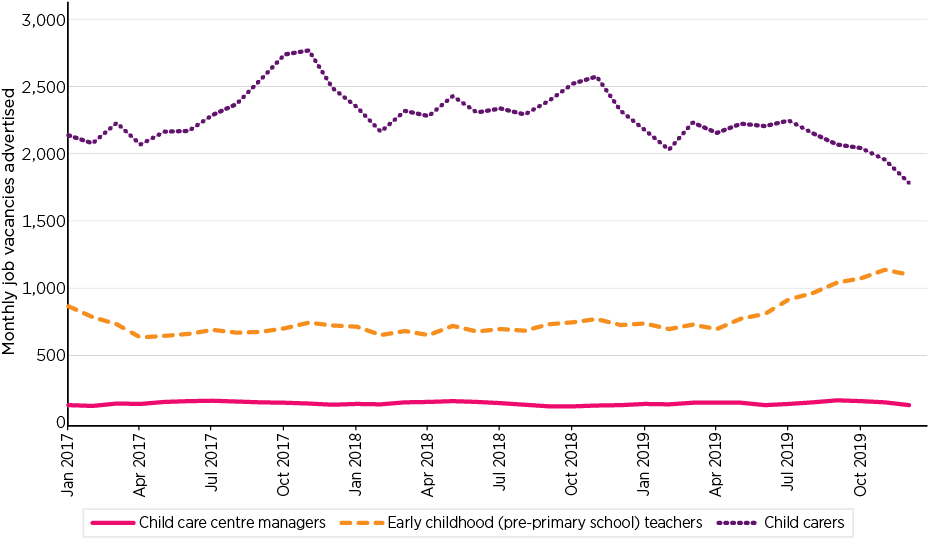
Source: Vacancy Report (Australian Government 2020)
9.8.2 Training
As noted in the introduction to this section, the main qualifications of child care educators are Diplomas and Certificate III qualifications. Table 121 shows commencements and completions in these.
As illustrated, currently approximately equal numbers of students commence at each program level. While the numbers enrolling in Certificate III courses have remained relatively stable between 2015 and 2019, the numbers enrolling in Diploma level courses, after rising rapidly to high rates of some 44,000 in 2016 and 2017, have since slumped to around 33,000.
Also notable in this data is the large gap between commencements and completions, with annual completions being around one quarter of commencements in Diploma courses, and one third for the Certificate III level courses. While there is clearly a lag between the commencement and completion, it is noted that the Diploma is described as a course that takes 12-18 months of full-time study, or 18-36 months part-time study, while the duration of a Certificate III course is variously described as being between 20 and 36 weeks full-time, or some 36-40 weeks part-time. On this basis, it would appear that non-completion is a driving force in the gap, rather than there being a time lag between the 2 series of statistics.
| Program name | 2015 | 2016 | 2017 | 2018 | 2019 |
|---|---|---|---|---|---|
| Commencements | |||||
| CHC50113 - Diploma of Early Childhood Education and Care | 40,060 | 44,840 | 43,310 | 33,810 | 32,615 |
| CHC30113 - Certificate III in Early Childhood Education and Care | 32,885 | 33,735 | 34,710 | 32,800 | 33,640 |
| Completions | |||||
| CHC50113 - Diploma of Early Childhood Education and Care | 6,230 | 9,710 | 9,325 | 9,125 | 7,750 |
| CHC30113 - Certificate III in Early Childhood Education and Care | 10,725 | 10,380 | 11,065 | 11,080 | 10,375 |
Source: NCVER Government Funded Courses DataBuilder 2021
This discrepancy may also reflect the extent to which a number of the qualification requirements in the national standards are specified in terms such as, 'All other educators who are required to meet ratio requirements must have (or be actively working towards) at least an approved certificate III level education and care qualification' (ACECQA, 2020b, p. 418).
9.8.3 Service perspectives on the child care workforce
Just as findings from the case studies indicated that the state of the child care market varied significantly by location (see Section 10.5.5), discussion about the child care workforce also varied by location. Although not raised in all studies, concerns about attracting and retaining quality educators were highlighted in 2 studies. These were in quite different locations. One was in a relatively high-income central business district (CBD) environment, where labour supply was an issue as reportedly few educators were in a financial position to live within the inner city, due to high rental and home ownership costs, and hence needed to commute. Services spoke of paying above award wages as an incentive to attract educators. The second was on the outskirts of a major capital city with a high proportion of Aboriginal and Torres Strait Islander people, the city itself was not located in one of Australia's eastern mainland states, and hence labour supply was an issue more broadly across the city.
The participants who raised concern about attracting and retaining educators in the context of reduced labour supply were particularly concerned about the quality of their workforce. A couple of participants spoke of needing to prioritise investment in professional development of staff, taking a 'grow your own' approach, as they felt there was a lack of consistency in the quality of training that educators were receiving.
Yes, [we pay above award wages] and we have over the 50 per cent diploma requirement […] That's really important to us. Also, you know, we are therefore investing in the training of the workforce because the workforce training has probably decreased over the past five to seven years so we're now seeing the result of that, of poorly trained staff, a result of poor registered training organisations, with ticks and flicks and so that's evident. So, we do have a workforce shortage in quality, as well as, you know, obviously early childhood teachers. So, you know, it's very much supporting a grow your own, having to ensure that quality and professionalism is part of it.
[CBDC and OSHC stakeholder, April 2020]
We try and be innovative in how we do things but we certainly don't compromise with the quality and we also enact a very intense probationary period, which is then followed by a performance management process. That enables us to hold staff with clear expectations from the outset, greater accountability but, in turn, we invest so, we pay for their professional development, we pay for their time if they are attending professional development outside of work time. Our expectations are then mirrored by the remuneration which we pay, well above award rates, that helps with retention as well, so for us it's recognising the professionalism of the workforce […] we will not compromise, this is actually the better improvement for children, so the other thing is that we don't shy away from moving staff on. During that probationary period, we don't wait for the time to lapse, we actually constructively work within that time frame and if it's clear that they're not the right fit in lots of different ways then we don't retain them.
[CBDC and OSHC provider, September 2019]
The services reported that providing professional development programs worked both in terms of ensuring quality in their workforce as well as providing an incentive to attract and retain high quality staff.
9.9 Viability in selected child care sectors
The evaluation, as noted in the introduction, was specifically charged with reporting on a number of sectoral dimensions of viability. The focus here is on 3 sectors:
- Former Budget Based Funding services
- Family Day Care services
- In Home Care services.
9.9.1 Former BBF services
In the short to medium term the viability of these services is effectively underpinned by CCCF funding. As has been seen in Section 9.7.2, around half of these services were receiving higher levels of funding through the CCCF alone in 2018-19 than they had from their previous BBF funding in 2017-18, although others were receiving considerably less. While the quantity of restricted funding is scheduled to reduce over time, to the limit of the currently proposed funding, the rate of reduction is relatively low.
In consultations with the sector several key themes emerged. One of these was that the transition impacted the sector much more negatively than child care services overall, and that the transition process was much more protracted and difficult than had been expected. This included the large effort required to assist parents to gather the documentation needed for claims, and to effectively utilise the Centrelink system. The drawn-out nature of the transition was clear in the stakeholder interviews in late 2018, where it was reported that despite almost 6 months elapsing from the introduction, some former BBF services had yet to have one family transition to CCS. More recently, in the interviews conducted in this sector in late 2019, there was still a strong sentiment that these services were very much still in a transition phase to the new arrangements.
The other 2 central concerns related to viability in this sector - concern around the high locational and other costs faced by many of these services, and how these were not provided for in the funding model and, perhaps most centrally, a concern relating to the implicit model of child care that the Package embodied, and how this related to the needs of Indigenous communities. These are discussed below.
Sector specific issues - cost base
A recurrent theme in many of the former BBF interviews was that the costs of running their services were higher than mainstream services. Many services paid above award wages or had a higher staff-child ratio than mainstream services, explaining that they needed highly skilled and experienced staff to work with their significant cohorts of vulnerable and disadvantaged children and families.
Those in remote locations also emphasised the range of additional costs incurred in providing services in these locations; for example, having to subsidise staff accommodation, and having to meet much higher costs for day to day items and services.
The price of food - this package doesn't account that we pay freight - like our freight bill is $20,000 a year to get stuff to our services.
[CBDC provider (former BBF), September 2019]
Especially when in a remote place, got to provide subsidised accommodation … we have to get nappies, consumables for health and hygiene side, coming on a barge … freight costs are quite high.
[CBDC provider (former BBF), December 2019]
Sector specific issues - child care model
Central to the concerns of many of these services was that few, if any, saw that their services had been established primarily as a means of providing child care to allow for parental labour market participation. Rather, the services had been established to focus on child wellbeing and development, and to meet the needs of local Aboriginal and Torres Strait Islander communities. These services felt that their positioning within the mainstream of child care services, with the specific focus on parental workforce participation, reinforced in both the rhetoric of the program and in mechanisms such as approved hours, was inimical to this, and that services could not be viable if they followed this model:
I just think you have set us up to shut the doors … I talked to the Elders about how they had this idea and how it's transformed to 40 years, like 40 years this Centre's been going, with the two other establishments, for this system to probably shut the doors it will be heart-breaking for our community.
[CBDC provider (former BBF), September 2019]
Others spoke more generally of how they felt under pressure to prioritise working families to make their services more viable, rather than addressing the priorities and needs of children in their communities, and how this worked counter to other priorities such as Closing the Gap. One service reported on how it had begun to enrol non-Aboriginal children to improve their viability but felt this negatively affected the cultural safety of their service.
Services were set up for Aboriginal children; they were all culturally safe places for our children and our families. And our families are confident walking through the door, and they're comfortable because they know that the service is safe for them. They know that the staff working within the service are safe and that their children are safe, and that they can open up to us and tell us what's really happening in their lives.
[CBDC provider (former BBF), December 2019]
This question of the role of services was expressed in an even more visceral way by one respondent who emphasised that the service was designed to meet the needs of the local Aboriginal community, yet the policies were driving it to be quite a different service that no longer could respond to the community's circumstances and needs:
Our centre is primarily Aboriginal, but we have now had to change that, because of the new CCS. We are no longer Aboriginal-focused and I hate that. We are now having to become working parent orientated, and a lot of our Aboriginal parents don't work. So I resent that, absolutely resent that, because our children aren't accessing what they should be accessing.
[CBDC provider (former BBF), September 2019]
The ongoing viability of former BBF services
As noted above, the effective viability of most of these services is underpinned by CCCF funding. Consultations suggest that for a significant proportion of these services viability under the CCS arrangements would be non-existent, except potentially for a small number who would be in the position to change their service model to become a universal service, rather than one that responded to the needs of their Indigenous communities.
9.9.2 Family Day Care and service viability
The Family Day Care sector, as documented in Section 9.6, has undergone a significant decline in large part due to compliance measures. While most of the decline has occurred in the for-profit sector, there has also been attrition in the not-for-profit sector. As detailed in Section 9.4, this sector has reported a significantly lower level of self-assessed financial viability and draws on a disproportionate level of financial support through the CCCF, see Section 9.7. Additionally, as noted in Chapter 2, this sector has poorer quality rating outcomes than other parts of the child care system.
It is also a sector that relative to other sectors has, as detailed in Section 9.1.2, a higher reliance on subsidies as a proportion of total fees (even before taking CCCF funding into account), and where, for private providers, this proportion has fallen with the introduction of the new funding arrangements.
In consultations with the sector and stakeholder surveys, a number of more specific issues were reported as posing specific challenges for the sector. These included:
- the lower hourly cap relative to that in the Centre Based Day Care sector.
- ongoing compliance activity. While services generally supported crackdowns on unscrupulous providers, who in some cases posed unfair competition for their own activities, many reported a degree of compliance fatigue or stress, as they were concerned that any minor lapse in process or other errors could see them subject to compliance action.
- a series of concerns about debt; in particular, where CCS was recouped by Centrelink.177
The vulnerability of this sector was also demonstrated in the release of a 'Sector Viability Brief' by the peak organisation of the private for-profit providers, Family Day Care Australia, in October 2019. This contained a series of proposed policies that the sector considered would enhance its viability. Most of these related to state and territory regulations and processes, but also included a call for a change in subsidy arrangements to include a resetting of the cap, effectively bringing the rates close to those of Centre Based Day Care and introducing a loading for non-standard hours of care (Family Day Care Association, 2019).
In this document the association asserts that, 'When combined with the overheads of the service itself, the costs of running a quality family day care service in its entirety are certainly comparable to those of running a centre-based service' (p. 6).
Ongoing viability of Family Day Care
On balance, significant indicators point to quite deep issues related to the ongoing viability of this sector. It is less clear as to what extent this can be addressed and to what extent it relates to this sector providing a model that is not competitive, either in quality or cost terms, with that provided in the Long Day Care sector, or the degree to which the sector has been tainted by the degree of unscrupulous activity that has been uncovered.
One aspect of the sector, where it does have an apparent comparative advantage, is in terms of flexibility, as noted in Chapter 5. The lower level of reliance of this sector on having to manage staffing profiles across environments and over an extended operating period has enabled it to have less reliance on sessions of care, and more flexibility around hours of operation.
9.9.3 In Home Care services and viability
In addressing the viability of this sector, it is to be noted that the structure of the program was substantially changed with the introduction of the Child Care Package. The sector has seen a marked fall in the number of services providing care and in families receiving it. As seen in Section 9.4, it had the lowest level of self-assessed financial viability of any sector in the data collected in the SELCS. This was further reflected in the In Home Care service data collection for the In Home Care evaluation. In the November 2019-February 2020 survey, while 22 per cent agreed that their service was financially viable, along with 26 per cent who answered 'neither agree nor disagree', the majority, 52 per cent, disagreed or strongly disagreed that their service was financially viable.
While the initial SELCS was conducted prior to the December 2018 decision to increase the hourly rate cap from $25.48 to $32.00 per hour, and the Additional Child Care Subsidy rate from $30.58 to $38.40 per hour, along with an expansion of the number of places, these other surveys have been conducted subsequently and hence responses take account of these higher rates. While In Home Care services were not eligible for the first round of CCCF grants (which along with the restricted payments in 2018-19 were the main focus of the analysis of the CCCF), they disproportionately gained assistance under the grants made between June and December 2019, with 11 grants.
Specific challenges for viability
A number of issues have been identified as challenging the viability of this sector. Central are problems with recruiting suitable educators. Three aspects of this have been identified. The first is the extent to which in some circumstances it has been left to families to attempt to find suitable educators, and issues related to their ability to both find an educator and assess their suitability. The second is the emergence, in part driven by costs and limitations on hours of care, of demand for educators to work split shifts or part-time hours, a demand for which there is not an adequate supply of labour. The nature of the program frequently involving working with children in complex and challenging families, in remote locations and providing care at non-standard hours also makes educator recruitment difficult.178
- This has been exacerbated by the alignment of In Home Care to the Child Care Package, which included the requirement for educators to be Certificate III qualified in the ECEC field, or to be working toward this qualification. It was reported that where these educators held a qualification in other fields, such as nursing, they were frequently reluctant to gain further ECEC qualifications and hence had left the sector. The objective of introducing the educator qualification requirement was to address issues of consistency in quality standards.
- More generally, there are issues with the program model and the nature of services. This has 2 elements. The first is the extent to which it is an early education and care service in cases, such as evening and overnight care, where the pedagogical content is very low. The second concerns the extent to which the program is seen as being transitional, with children moving towards attending mainstream services. This is not always seen as a feasible approach for some remote provision, those working non-standard hours, and provision to some families with high and complex needs that are unlikely to resolve.
Ongoing viability of In Home Care services
The sector continues to face challenges - exacerbated by a business model that effectively has to meet 3 quite distinct forms of demand that in general have little commonality of need or circumstance other than being different to what mainstream child care can provide.
While the large increases in the hourly rate cap for the payment of subsidies in early 2019 improved the viability of the program, whether it did so sufficiently is still somewhat uncertain.
As with mainstream care provision, while the objective of flexibility is emphasised, this does have implications for staffing and the willingness of skilled educators to work on this basis.
9.10 Summary
In broad terms, the main elements of the child care sector, Centre Based Day Care and Outside School Hours Care are robust and viable. However, it is noted:
- It can be expected that costs in the sector will continue to rise, and there is no evidence of any factors that will constrain this.
- In part the viability of these services reflects the underlying sessional structure of care, and charging regimes based on this. This means that the apparent hourly rate of a session is not an accurate reflection of the actual hourly cost of the provision of care to a child.179
- The sector has been evolving, including consolidation by large providers in both the for-profit and not-for-profit sectors. While this has not changed significantly with the introduction of the Package, it remains a trend that offers both some gains in economies of scale and a capacity to achieve consistent quality; it brings with it also some dangers of locational monopolies, and potentially predatory behaviour.
While in general the perspective of the Outside School Hours Care sector was positive, it is noted that this part of the industry is highly concentrated and has become more concentrated over recent periods.
Across the other sectors some greater challenges emerge:
- Former BBF services are effectively viable in the short term due to the level of CCCF funding they receive. In the absence of this funding, it is probable that most would not be viable. While a small number of services may become viable by effectively becoming mainstream child care services, this frequently threatens their underlying purpose and rationale. Most, however, are not in a circumstance to make such a change.
- The Family Day Care sector has been severely impacted by the incidence of fraud and other misconduct, and the actions taken to eliminate this. In the light of the growing sophistication of the Centre Based Day Care industry, the sector is also facing challenges. This can be seen in the not-for-profit part of the sector where one third of services accessed CCCF funds in 2018-19. Its model is, however, more suited than the Centre Based Day Care sector's to providing flexible care. This provides both an opportunity for the sector and a means of achieving greater flexibility without the potential downsides of attempting to achieve this primarily through the Centre Based Day Care sector.
- The In Home Care model is still bedding in and faces many challenges. Policy changes to the original program settings have been beneficial to the sector's sustainability, but there remains a tension between the specific demands that this sector seeks to respond to and some policy settings.
Across all sectors there are tensions in terms of the viability of services as providers of early childhood education, and support for child development, and their viability in providing child care to enable parents to engage in the labour market. This tension is not well addressed in policy terms, with the Child Care Package primarily focusing just on the second. Answering this question also requires attention to the child care workforce, both in terms of training and remuneration.
166 The estimate for In Home Care is based on hours provided to a family not an individual child.
167 In 2017-18 subsidies included CCB (including SCCB and GCCB), CCR, and JETCCFA, but may not have included some CCB lump sums, while those services in receipt of BBF were out of scope. Community Support Program funding is also excluded. In 2018-19 the value of subsidies includes CCS and ACCS, but not CCCF funding. Both years exclude ISP funding. In calculating the funding in 2018-19, no adjustment has been made for the amount withheld by the Government pending annual balancing. No account has been taken of adjustments to the value of subsidies as a consequence of reconciliation.
168 In considering this ratio it is noted that, while the concept of changes in the value of subsidies to fees has a relationship with the net cost examined in Chapter 4 as part of the modelling of affordability, results may not be wholly consistent. Central to this is that a substantial element of the modelling is based on fixed costs of child care for families, and has not included changes in fees, both because of actual fee changes and changes in the composition of services that have impacted the average level of fees charged.
169 The calculation of entries and exits is based on identifying services that, while having provided services in one quarter, did not provide them in any preceding quarter (entry) or in any succeeding quarter (exit). A consequence of this methodology is that entries cannot be identified for the first quarter of the data series, nor exits for the final quarter. While there is also a risk of overstating entries and exits at the beginning and end of the series, in that a service needs only to be absent for a single quarter to be treated as an entry or exit, analysis suggests this is not material.
170 This can be conceived of, in the context of the Lorenz curve, as the area between the plotted line and the diagonal line as a proportion of the area under the diagonal line. Again, if children were equally distributed then the plotted line would follow the diagonal line and hence there would be no area above and the Gini would have a value of zero. If, however, children were totally concentrated into services with just one service having all children, then the plotted line would effectively follow the x-axis as a cumulative proportion of services accounted for no children, and then leap up the y-axis for the final record. This would effectively leave all the area in the lower triangle above the plotted line - which as a ratio of the area under the line would give a result of one.
171 Some 8.9 per cent of respondents to the survey said that they either did not know, or would prefer not to comment on, the state of viability of the service. These have been excluded. It is noted in some cases this response may be because the person who was completing the survey may be primarily involved in a specific aspect of the service's operation and not be aware of this type of matter.
172 Centrelink can recoup CCS overpayments from families by reducing future CCS payments. Services are not notified of such changes but rather simply that, 'Providers and services may notice a change to the amount of CCS received on behalf of a family.' The rationale for this is that 'recovery of overpayments by Centrelink is a matter between the family and Centrelink …Centrelink may recover overpayments of CCS from a family's ongoing CCS payments. Details of the particulars of a repayment plan is confidential information shared between the family and Centrelink' (DESE, 2020f).
173 In addition, and outside the scope of this report, are criminal prosecutions.
174 Overwhelmingly, the most recent sanction recorded associated with the exit of a service is a cancellation, with these accounting for 229 of 333 sanctions recorded. Of these, 319 have been able to be linked to services as detailed in this section.
175 This includes 11 former BBF services, 6 IAS services and 2 NFF-OCC services. Many of these services are recorded as crèches. In order for a service to be matched, it was necessary for the service to have lodged session reports, which were recorded in the Child Care System. In the case of the Open Competitive grants, 5 out of the 747 records were unable to be matched.
176 The May-June 2018 SELCS indicated Tasmanian services were more likely to have responded that they had made an application for CCCF funding (22.7 per cent) compared with 13.7 per cent of services overall. They were also less likely (21.0 per cent) to report that they did not know about the program than services overall (26.2 per cent).
177 In the case of Family Day Care, where this occurs, it can have a disproportionate impact on the individual educator who is directly affected by the subsidy reduction, in contrast to other service types where the effect is spread out over a much larger child and family population.
178 Transitional arrangement apply for remote areas, see Section 10.8.6. Also, with approval by the Department, in certain circumstances families that live in very remote areas who are unable to find a suitably qualified educator may engage a relative as an IHC educator.
179 That is, because most children do not attend for the whole length of a session and because staffing is rostered around attendance, to the degree this is possible, the actual cost per hour of attendance is higher than the average cost across the whole of the session duration.
10. The transition to the Child Care Package
10.1 Introduction
This chapter addresses the transition to the Child Care Package - summarising and building on the findings from the evaluation's first Early Monitoring Report (Baxter et al., 2019). It draws on data from parents, services, providers and other stakeholders gathered through surveys and interviews as well as DESE administrative data. This chapter is largely concerned with the implementation of the Child Care Package, rather than the outcomes or impacts of the Child Care Package that are the central focus of the evaluation. However, given the scale of change brought in with the Child Care Package, the transition experiences are important to reflect on, as they may impact later perceptions and experiences of the Child Care Package, and may be valuable for informing later child care policy and program development, as well as the implementation of other significant policy reform processes by government.
The ANAO (2019) report on the Child Care Package concluded that effective arrangements were established and implemented to assist key stakeholders, including families and child care providers, to transition to the new package arrangements in a timely manner. According to the Department, 88.1 per cent (1,024,359 of 1,162,908) of the families who had been invited to transition and 99.9 per cent of child care providers had transitioned by the 2 July 2018 deadline (ANAO, 2019, p. 9). The more detailed analysis of family and service transitions presented in Chapter 6, based on the actual population of users before and after transition, results in somewhat different percentages and some variation in transition percentages across different cohorts of families and services. Nevertheless, the high transition percentages support the findings of the ANAO report and the evaluation that services and parents largely reported successfully transitioning to the new system in July 2018.
The transition to the Child Care Package was extensive, including the launch of the new IT infrastructure to support the Package, new requirements of parents to submit information for enrolment assessment of eligibility for CCS and new administrative requirements for services. In addition, there were further changes to operating models for some child care service types - namely those who transitioned from Budget Based Funding arrangements and In Home Care. These changes impacted both services and families, and the experiences and outcomes of the transition for these services specifically are also detailed in this chapter.
10.2 Transition of families
10.2.1 Introduction
The transition to the Child Care Package involved significant changes for families, including the operation of the new subsidy, increased means testing, and a more graduated activity test and number of hours to which CCS applies (see Chapters 1, 2 and 5). In order to transition to the new child care system, families were required to take a series of actions. Many families were required to undertake only a relatively small number of actions, largely related to the determination of their CCS eligibility and entitlement. For others, including those without myGov registration, new entrants to the system and those attending some Budget Based Funded services, the process was more complex. For these families, the steps usually included setting up a myGov account, and/or entering other child and family information with the then Department of Human Services, completing the child care enrolment process, and applying for and accessing CCS.
This section explores the transition to the Child Care Package for families. Significant changes to the In Home Care program and the withdrawal of Budget Based Funding have meant specific changes for families previously engaged in the In Home Care program or a Budget Based Funded service, but these issues are raised in separate sections below.
10.2.2 Numbers of children and families
While the transition process for families began earlier in 2018, they had until 23 September 2018 to complete their assessment and transition to the new package for payments to be backdated to 2 July 2018 if they were eligible. As reported above, 1,024,359 families had transitioned by 2 July 2018, which comprises 88.1 per cent of families invited by the then Department of Human Services to make the transition. The number of families reported as having made the transition by the Department is slightly higher than the figure of 87.0 per cent derived from the administrative data made available for the evaluation (Chapter 6).
The administrative data reported in Chapter 6 shows:
- There were higher transition rates for children in Centre Based Day Care (91.3 per cent), than Outside School Hours Care (85.1 per cent), Family Day Care (73.1 per cent) and In Home Care (80.9 per cent). The higher transition rate for Centre Based Day Care is consistent with the longer-term more stable use of this form of care.
- Transitions were a little less likely in remote areas (84.3 per cent transitioning in very remote compared to 87.0 per cent in capital city areas), and in more disadvantaged areas (80.6 transitioning out in the lowest SEIFA decile compared to 90.4 per cent in the highest SEIFA decile).
- Transitions were less likely among the lowest income families (those on incomes below $25,000). There were also some lower rates of transition for families on income support payments, although this was not apparent for single parents on part-rate income support.
- By age of child, there was a lower transition to the new system for children under one year old, with this explained particularly by a lower rate of transitions for Family Day Care. Transitions were more likely for children aged 1 to 3 years.
Chapter 6 also presents analysis of transition into child care following the introduction of the Child Care Package. As previously noted, there is some imprecision in these estimates of transitions around the introduction of the Child Care Package, due to changes in which children and services are included in the data before and/or after 2 July 2018.
10.2.3 Information and support activities for parents preparing for the transition
The then Department of Education and Training (now DESE) undertook a range of communications and stakeholder engagement activities to enhance families' awareness and understanding of the Child Care Package and to support families in their transition to the new system. The communication strategy was implemented from August 2017, initially focusing on raising awareness and providing information about the Package, then informing families about the actions they needed to take to transition to the new package. This included a 'call to action' that directed families to the Department's website and its online subsidy estimator. The Department's website was a central element of the strategy, being a repository of information for families and services about the Child Care Package, with information being added to and updated in the lead up to the transition. Services and providers were provided with materials to share with families, and materials that they could use to assist families to prepare for the transition. The then Department of Human Services also undertook their own communications activities.180 Many services and provider organisations also provided their own information and support to parents in the transition period.
The June 2018 DESE/ORIMA Baseline Parent Survey, conducted just before the introduction of the Child Care Package, collected information on parents' awareness of the changes to child care fee assistance. Findings indicated that the different information campaigns were reaching families, with 86.4 per cent of families using paid child care reporting that they were aware that the child care system was changing. The CCPFamS (in November 2018, after the Package had commenced) asked families about the sources of information they had used to find out about CCS and the actions they needed to take in order to transition to the new arrangements. The most frequently used source was child care services (63.6 per cent used formal communication from child care providers, e.g. emails, newsletters), although, 55.0 per cent of parents reported using at least one of the Government sources of information (the DESE or Centrelink website or helpline, information put out on TV, radio or other advertising, social media, or on the website).
Through the evaluation data collections with services, there was a range of views on whether there was enough information for families. Several interviewees noted that there was a lot of information communicated to families through the media and that this was helpful. Some interviewees who worked for services observed that despite the large amount of information for families available through the media, the families did not understand the impact that the transition would have, did not understand the changes and did not understand what they needed to do to receive CCS. Several services spoke of the resourcing they invested to provide individualised, face-to-face support to families to support them to interpret and apply the information they received to their individual circumstances. This was relevant to services' own experiences of the transition, as reported in Section 10.3.
10.2.4 Family experiences of the transition
According to survey data collected from families soon after the transition, for the majority of parents, the transition to the Child Care Package was not too difficult. For example, the July 2018 wave of the LinA survey provided a contemporaneous snapshot of family experiences through asking families who were using paid child care: 'For your family, was the process of applying for the new child care fee assistance (which commenced from 2nd July 2018) easy or difficult?'181 Most reported it to be easy (22.4 per cent reported it to be 'very easy', and 48.9 per cent 'quite easy') but 18.7 per cent reported it to be 'quite difficult' and 9.5 per cent 'very difficult'. Similar findings emerged some months later (November 2018) when, in the CCPFamS, families were asked about their experiences of the transition. Two-thirds of families agreed or strongly agreed with the statement 'the transition to the new subsidy was fairly seamless for me', while 20.7 per cent disagreed or strongly disagreed and 12.4 per cent neither disagreed nor agreed.
However, as the survey responses reported above also indicate, some families' experiences of the transition were more negative. A review of the comments provided by respondents suggests difficulties largely centred on the process of engaging with Centrelink to put in their applications, consistent with reports about engaging with Centrelink that emerged through data collections about the Child Care Package more generally.
Subsequent data collections with services and stakeholders also reiterated some of the negative experiences of families at the time of transition. These concerns largely centred around issues for vulnerable families and the child care services that they were connected to and included the following:
- understanding steps required to complete the enrolment and the subsidy application
- problems with the process - with lack of access to the Internet and/or required documentation
- challenges with Centrelink.
Throughout the evaluation data collections there were reports of system issues (including but not limited to IT issues) that impacted on families (see Section 10.4). Help-seeking by families to address the issues they experienced or to resolve other problems was itself a challenge for families (and their child care services), particularly during the transition period. While reports of having difficulties resolving problems were most apparent in relation to the transition period, some families continued to experience these difficulties into 2019.
10.3 Transition of services and providers
10.3.1 Experiences of the transition
In preparation for the transition to the Child Care Package, services and providers needed to learn about the changes to child care assistance, adopt and learn new software for their service, and learn about new service-level requirements for enrolments and reporting. Specific administrative tasks that had to be undertaken ahead of the reforms included completing an online Transition Form, linking personnel with administrative responsibilities to enrolment software (using the new online authentication system PRODA (Provider Digital Access)), updating service details in the CCS and ensuring all enrolments met Complying Written Arrangement requirements. Many of the difficulties experienced by services during the transition period were related to the transition of the IT system, and these issues are described in Section 10.4.
10.3.2 Service preparedness for the transition
Services were asked, in the May-June 2018 Baseline SELCS, about the extent to which their service was prepared for the changes. At that time, just before the transition, services reported that, on balance, they were prepared for the change. These perspectives were captured before the transition had taken place, and service interviews conducted later revealed that some services realised they were not as prepared as they had thought they were. However, overall, when asked again in the July 2019 SELCS, it seems that most services still agreed they were prepared when reporting on their agreement with the statement, 'This service was prepared for the changes' The overall pattern of responses pre and post the transition is similar, with a higher percentage strongly agreeing that they were prepared when asked about the transition in July 2019. This increase appears to have come from those who were unsure whether they were prepared in May 2018.
- In May 2018, 15.2 per cent of services said they strongly agreed and 50.6 per cent agreed that their service was prepared for the changes; 21.1 per cent neither agreed nor disagreed; and 9.8 per cent disagreed, and 3.4 per cent strongly disagreed, that their service was ready for the changes.
- In July 2019, 20.2 per cent of services said they strongly agreed and 51.3 per cent agreed that their service was prepared for the changes; 14.7 per cent neither agreed nor disagreed; and 9.3 per cent disagreed, and 4.5 per cent strongly disagreed, that their service was ready for the changes.
Patterns of responses at both points in time were similar across service types, as shown in Figure 152, with the exception of In Home Care services, which were most likely to strongly disagree that their service was prepared for the changes when asked in July 2019. As described in Section 9.9.3, this sector faced very significant changes at the time of transition. Also, the former Budget Based Funded services reported more negatively at the second time period. In Home Care and former Budget Based Funded services also experienced difficulties with the transition related to changes in their specific funding and operation models. These are described in more detail below (see Section 9.9.1 for findings related to former Budget Based Funded services).
Figure 152: Service agreement that their service was prepared for the changes, as reported before the transition and after, by service type, 2018 and 2019
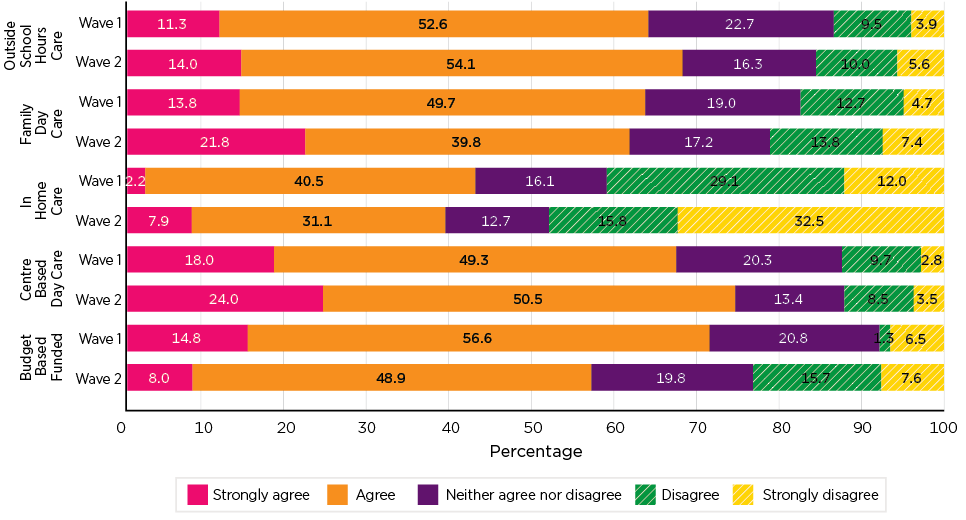
Note: Cross-sectional weighted, 'do not know/prefer not to say' and 'not applicable' excluded from analysis.
Source: SELCS Wave 1 and 2
Another perspective is gained from services' responses to the statement, 'The transition to the new arrangements was smooth', which was asked in July 2019. Overall services' responses tend towards the positive (11.7 per cent strongly agreed and 37.2 per cent agreed), although a significant proportion were more negative (19.2 per cent disagreed, 13.6 per cent strongly disagreed), with 18.3 per cent saying they neither disagreed nor agreed. In Home Care services and Family Day Care services were the most likely to strongly disagree that the transition to the new arrangements was smooth, and Centre Based Day Care services were the least likely to strongly disagree that the transition was smooth.
In interviews with services, those who felt the transition had gone smoothly included those that referred to their having accessed the available information, felt they were well supported by their third-party software provider and, in some cases, had invested substantial resources in the transition. For example:
I took on board all the training sessions that were offered to our software company. And I read all the information sheets that came out from the Department. So I found the transition really quite smooth. As long as you were up to date with the information and read it carefully, it wasn't really that difficult to transition.
[OSHC provider, April 2019]
Findings from the July 2019 SELCS on the smoothness of the transition showed differences in experiences of services according to what software provider they used. Most apparent were more difficulties reported by those using the 2 software providers commonly used by Family Day Care Services. This is consistent with reporting by services and stakeholders that some lack of functionality by some software early on had significant impacts on the transition, particularly for the Family Day Care sector.
10.3.3 Supporting the sector to prepare for the transition
The then Department of Education and Training provided a range of supports for services during the period leading up to the transition, including online fact sheets and task cards. There were face-to-face information sessions conducted around Australia and webcasts for providers who could not attend in person. Regular updates were sent to the sector via email. These emails contained information and links to resources such as the Child Care Service Handbook and video presentations to support services and providers to prepare for transition. Services were able to use the CCS Helpdesk 182 and other Department of Education and Training contacts to ask questions.
In addition to resources to support their own transition, child care services and providers were also sent emails and other targeted communications containing messages and resources - such as fact sheets and brochures - to disseminate to families, so services could assist families to complete their call to action and transition to the new system.
When surveyed in May-June 2018, the most frequently cited source of information used by services was their provider organisation or peak, with 66.1 per cent using these and finding them helpful. Around half had accessed the then Department of Education and Training website, CCS Helpdesk and Department of Human Services website and found them helpful, along with around a quarter of services saying that they had not needed to access these sources. Less than half had accessed and found helpful the Department's webinars (42.1 per cent using them and finding them helpful), and services were more likely to say they were unable to access this resource (9.1 per cent) compared to the other sources of information.
When interviewed in 2018 after the transition period, some services noted issues with access to or understanding of information. For several services who had attended training or followed the guidance provided by the Department of Education, software providers and peak bodies, this took them by surprise as while they felt well-informed, they still found the implementation of the transition challenging and somewhat overwhelming.
I thought that it was a fabulous rollout of that information. We had, you know, if you did it when it came out, one thing at a time, I felt that was, like, bite-sized and manageable and I had my head around it. And then all of a sudden, it was transition and it was like - it was - it just really felt that - I didn't know what I was doing, and therefore I wasn't really capable of supporting, like, the families. It was kind of tricky.
[CBDC and OSHC provider, March 2019]
Challenges reported by services during the transition, included difficulties in contacting the CCS helpdesk, PRODA, or third-party software providers, long wait times for families attempting to contact Centrelink and incorrect advice provided to families by Centrelink.
Some of the information for providers was not made available until quite close to the time of transition, which caused some challenges for services and also for software providers. Updates to information about the Child Care Package were also provided in the months after the transition to the Child Care Package, including elaborating on aspects of the Package that services and providers were having more difficulties with.
10.4 Changes to the information technology (IT) system
The introduction of the Child Care Package involved the implementation of a new IT system - the Child Care Subsidy System (CCSS). The new IT system was developed to provide a simpler interface for both parents and services, through simplifying, streamlining and automating the administration of child care payments and programs. It was intended to also enhance the capacity of the Department to ensure effective compliance and minimise fraud. Key elements included:
- the ability for families to make CCS claims and view the status of their claims - including the enrolment and attendance details submitted to the government by child care services - by signing into myGov to access their Centrelink online account
- an enhanced system for services, either directly accessed through a Provider Entry Point or through third-party software to provide services with access to a simpler, streamlined and automated administration of the program, including the payment of subsidies
- the development and enhancement of the system with respect to grants and related payments.
The planning, design and build of the new IT system involved DESE as well as the Department of Social Services (DSS) (who had hosted the previous IT system, the Child Care Management System (CCMS)) and Services Australia who was to host the new system.
10.4.1 Overall perspectives and IT system readiness
IT was a particular challenge for services at transition, with most stakeholders and providers participating in qualitative interviews and surveys identifying the transition to the new IT system as the most difficult aspect of the transition. Many services reported bugs, crashes, limited functionality and delays in their IT systems, including reference to PRODA, the Provider Entry Point and their third-party software. This was exacerbated by their lack of familiarity with the new system and perceptions of a lack of information and training. Almost all interviewees said that it was very difficult to resolve problems and issues with the new CCSS, and that key functionality was slow to come online.
Services that reported difficulties in the transition tended to have experienced significant challenges with the complexity and volume of the work related to the IT system involved in getting themselves ready for the change, within a time-constrained period. This issue is also discussed in Section 10.5.
The CCS transition process is complex and confusing and frustrating. There are so many layers of requirements just to get the system over to CCS. PEP, PRODA numbers, CCS ID numbers, CCS enrolment confirmations, etc. Educators have had difficulty getting a PRODA number, which holds up the entire CCS and enrolment confirmation process. We are in support of the one payment system, but it is very difficult to understand why there has had to be so many layers of changes to get there.
[FDC provider, June 2018]
The interviewees who reported a smooth transition also reported that their software and PRODA were easy to use.
State Officers of DESE also acknowledged some frustrations both in resolving issues for the sector and resolving problems with their own CCSS interface. They described glitches and a lack of functionality in their interface with the system.
Some of the issues raised related to the interaction between various parts of the system: between the Provider Entry Point, third-party software, myGov and Centrelink. Many of the DESE state network staff also identified inter-departmental communication issues, explaining that it was difficult to find out from Services Australia (who was responsible for the build and back end) when issues would be fixed and core functionality would come online.
Particular issues noted in reporting about the IT system and the transition included:
- not all functionality available on launch (due to time frames)
- lack of communication from Services Australia about when or if glitches have been fixed
- lack of visibility within the system (not being able to see things that service could), which made assisting services with the transition difficult.
By 2019, services reported that IT issues experienced during transition were mostly resolved, software functionality had improved and that staff were learning and becoming more comfortable with new software. Issues that were said to have been addressed included IT-related problems related to ACCS certificates and determinations, a lack of software functionality, electronic sign-in issues, and issues for Family Day Care services that were delaying CCS payments. However, services still reported some ongoing system and software issues such as CCS payment irregularities and system glitches.
The Provider Entry Point (PEP) was developed to allow services to apply for approval as a provider, communicate with the Department about their services and provide information required for the payment of child care subsides. To interact with PEP, providers must be registered with PRODA, an online authentication system. Providers can submit child care data and retrieve payment information either through PEP or a third-party software provider (see below). Most providers use third-party software providers as this software provides additional functionality including rostering, room management, payroll and other functions.
10.4.2 Third-party software
The vast majority of child care services and providers use third-party software to access the CCSS. Third-party software often has additional functionality that is not available through the PEP, including business management functions.
The software providers themselves reported to have experienced significant challenges in the lead up to transition, with the flow-on effects of this being issues in the operation of the software and, in many cases, a lack of information and support for child care providers and services. From a third-party provider perspective, the year leading up to 2 July 2018 was challenging. Both software providers interviewed for the evaluation said that specifications for the software build were provided very late in the process and then were subject to a number of revisions. They also considered that there was poor coordination and communication between Services Australia and DESE, further complicating the Department's IT build and having consequences for third-party providers. Software providers also considered that communication from Services Australia about resolving problems had been poor in the period after transition, and in 2019 both reported that there were many outstanding issues and problems that were yet to be resolved.
Many services reported issues with software providers, particularly around transition, when they had issues with software and they could not access support. Several services expressed frustration and felt that they had been let down by software providers, with some reporting that they had changed software providers or were seeking to.
Almost all providers and stakeholders agreed that some third-party software providers were better prepared for the transition than others, with some third-party providers being described as excellent and others being said to have been ill-prepared, struggling to provide key functionality and slow to resolve identified issues. Some stakeholders reported that third-party software for Family Day Care was particularly problematic.
There were, however, a few services that spoke more favourably of their software providers, some noted that their transition had been smooth and that the support provided by the software providers had been useful. A few services also noted that additional functionality was being introduced by software providers that was supporting them to understand and resolve CCS payment issues. This also aligns with findings from the SELCS in which it was quite common for services to report their software provider as a source of support during the transition.
10.4.3 IT system issues
Child care services described a range of issues within their system that were affecting them. In many cases, it is difficult to determine the extent to which these issues related to the transition specifically or were longer term problems. It was also difficult to ascertain the exact circumstances under which these issues occurred. Nevertheless, the commonplace reporting that these issues affected services and families indicates that they occurred on some level.
A number of providers across all service types reported system issues with CCS payments that could not be explained by any action of the service or family. These varied, but included enrolments being ceased although children were regularly attending, families being overpaid CCS, or family entitlements disappearing from the system so that families were suddenly paying full fees. Although these issues did not appear to affect a large number of families, the time spent by families and services in attempting to resolve these issues was substantial and was reported to have had potential for financial impacts on families or services through the accumulation of debt.
This was echoed in the qualitative interviews, with the then Department of Education and Training state networks reporting issues in the IT system that then created issues, in particular, for services when applying for ACCS.
Visibility of payments and reminders
There were a number of concerns reported by services related to lack of functionality in the IT system, largely related to notifications and reminders. Corrections of CCS payments in response to updated information provided by a family - for example, activity or income levels - were also causing issues and concern for services who found these and other backdated CCS payment adjustments difficult to track and communicate to families. Services did not get notification about a discrepancy or change in a family's level of CCS, and several services reported that they were manually checking individual accounts before issuing debts and statements to families. This was time consuming, and services that did not manually check were only finding out about CCS payment anomalies when they were reported by families.
Sometimes we're told that the money will come to us, but it's backdated to the date that it applies to. So we might be sitting here in, you know, in March, and a parent's rectified something from November, and it's backdated as November. So in effect, I have to then go back through PRODA to see if I can find that payment to see if it's gone through before I can then deduct that from the parent's bill. Which just, you know, is incredibly time consuming.
[FDC provider, March 2019]
Services also had difficulties tracking batched payment discrepancies to individual accounts, and a few services noted that they had difficulty invoicing families as the system automatically adjusted the previous figure - making it difficult to communicate changes to families. One service was using previously printed statements to demonstrate the difference to families.
Services noted some other IT-related issues to do with a lack of prompts and reminders for families on myGov. In particular, services noted that there was no reminder for families to confirm their enrolment, and this was requiring considerable time for services to follow up with families. Services themselves also noted a lack of reminders and prompts - to update their PRODA key, or to warn that a child's enrolment would be ceased due to the 8-week rule.
Family Day Care services and IT
As noted previously, Family Day Care services were particularly negatively impacted by commonly used software not being fully functional at the time of transition. Family Day Care providers reported that they had to manually submit session reports (rather than as a batch) and that there were substantial delays in receiving the payment associated with these. This had flow on effects for educators who could not be paid and for families who could not be accurately charged. Some providers reported that this issue continued, although to a lesser extent, for several months after transition, and that at the time of interviews undertaken in March to July of 2019, Family Day Care providers were still responding to corrections from this period. One local council Family Day Care service reported that having centralised payments through the provider had protected educators from payment inconsistencies associated with the transition and ongoing issues with irregular CCS payments.
10.5 Administrative burden during the transition
A common theme in the qualitative data (from both interviews and survey) was the significant amount of work required to administer the Child Care Package. This was a common theme in the interviews conducted in March to July 2019, with almost all interviewees describing an increased volume of administrative work associated with the introduction of the Child Care Package. At the time of the interviews, some child care services and providers were still working to resolve issues associated with transition, others were still learning the new package and the associated new software systems, and many were responding to emerging issues.
Experiences of the transition remained relevant to some services' reflections about simplicity when interviewed in 2019, with some reporting they transitioned without difficulty (and reported that the Child Care Package was simple) but most having identified a substantial administrative burden as a result of transition and the Child Care Package and identified information technology difficulties and challenges finding information and resolving issues.
In terms of the administrative burden that it puts service under, no, I don't think it's simpler but that might be part of the sort of glitches that have been felt by everybody with the IT system settling down and then making changes to the system. And obviously the third-party software provider had to make those changes and had to do adaptions et cetera, so I think going forward, it may become more simple but certainly in the transition period, it hasn't been simple.
[FDC provider, June 2019]
In the interviews with high level stakeholders in late 2018 and early 2019, administrative burden was mentioned by most of the interviewees. The increased administrative work associated with the new package was attributed to a range of related issues including: learning and transitioning to a new system for example, entering and managing enrolments, communicating with and supporting families, managing CCS payments, ensuring the service was compliant, and resolving any issues that came up.
In addition, all the large providers interviewed noted the work required by services and providers to ensure that families transitioned. This included providing dedicated computers at child care services and providing one-on-one support for families to complete their enrolment, talking with families about changes to the subsidy and how they should record their hours, and following up families that had not transitioned.
In later interviews for the CALD case study (September-December 2019), all 10 services reported a very high administrative load during transition but found that this load lessened after transition.
The additional administrative burden of transition was discussed as having a significant impact on smaller services who did not have the infrastructure or staffing of large providers that could be invested to support their transition. Large providers were able to employ business analysts and draw on other expertise (e.g. legal) to help them understand and plan for the new package, in contrast to smaller, volunteer and community-run services that struggled to prepare for the new package.
I've seen a couple struggle with the administrative burden when they've been, as I said, manned by volunteers in the main, and that is very dependent on the demographic they're serving and I think it's also - they don't have the sophistication to be able to know - you know, to plan for it or understand exactly what it's all going to mean for them down the track if they do become approved they - you know, it is quite complicated too …
[Child care stakeholder, November 2018]
The administrative burden associated with the transition was also noted to have had a greater impact on rural and remote services. Poor or no internet access, and families not having email accounts or the required documentation increased the administrative requirements for some remote services as they were required to find ways to work around these challenges. These issues were also experienced by former Budget Based Funded services, many of whom faced these challenges, in addition to transitioning to a new funding model. It was noted that some services were required to manage 2 different fee structures to accommodate families who were attending full-time but only eligible for 2 days of CCS.
It's been a lot of hard work, I don't think they realise how much work we have to do, been really, really hard work and still not 100 per cent ready for it. Families don't really understand the importance of transitioning over. Having a lot of problems getting people to go on the myGov website to transition over. A lot of unnecessary paperwork and changes in agreements and enrolment forms. For a little centre like us, who have to do everything, we don't have the time or the money to do it. The impact on little centres, so remote and without support, big, big burden.
[CBDC and OSHC provider (former BBF), July 2019]
10.6 ACCS transition issues
The period immediately following transition was widely reported to have been challenging for services seeking to access ACCS, particularly ACCS (Child Wellbeing). This was said by child care stakeholders interviewed to be due to a combination of factors including the ACCS guidelines being released late, a lack of training about ACCS processes, and the learning curve involved for child care providers needing to adjust to new policy and a new IT system.
Information for the sector was released on 29 June 2018, just days before 2 July 2018, and this left limited time for child care services and providers to interpret and operationalise the ACCS guidelines. Many interviewees reported a lack of understanding in the sector around the evidence requirements for an ACCS (Child Wellbeing) determination.
For many long day care services, they were confused. They felt that the information around the additional Child Care Packages was difficult to find and interpret, and there were a number of challenges in getting the support in a timely manner from the provider helpline with those changes in particular.
[Child care stakeholder, March 2019]
Getting clarity around that was really difficult, which meant we were running at 1 July without processes in place and we had to … put those together very quickly and train different people to actually enable this to - to progress. We had child care centres that hadn't been educated by the Commonwealth or the states around what that would mean, so we had people - child care centres threatening to not allow children to return or to give their spots away.
[Child care stakeholder, March 2019]
In addition to these issues adjusting to the new system, there were a number of reported IT issues related to ACCS applications, as well as lack of functionality in software and problems related to Centrelink's approach to the assessment of ACCS applications, including long delays in assessments for determinations, inconsistent outcomes and a high number of rejections. In a submission to the Department concerning ongoing issues with ACCS, the Early Learning and Care Council of Australia noted the assessment process was resulting in genuine applications being rejected, and later overturned, creating administrative load and having a negative impact on families. To address concerns about inconsistencies in ACCS (Child Wellbeing) funding and gaps in cover for vulnerable children, the Department initiated a backdating project, which reviewed applications for ACCS and corrected historical issues. This project required a change being made to the Minister's Rules to allow backdating beyond the legislated 28 days. While this backdating addressed issues with applications that were made during the early months of the Package, it is unknown how many potential applications were not submitted during this time due to the known issues.
ACCS was also noted as an issue for former Budget Based Funded services and for rural and remote services who may have high numbers of those who would benefit from the subsidy; however, these services had less resourcing and administrative support to enable them to complete ACCS applications. The administrative requirements of applying for ACCS was noted as a barrier to ACCS applications being submitted in some communities.
In regards to ACCS in remote communities, I think a few of them have said to me that it is an administration burden for them. And we know very well that there are children in those communities [with a need] because they have set up programs. Especially the after school care, to take the children off the streets and into care until their parents are at home … So there are children that are eligible for it but it's an administrative burden on the centre at the moment with all the other work that they're doing. And just the lack of education going back to what (name) said, the lack of education on some of our transition items.
[Child care stakeholder, June 2018]
The increase in the number of children covered by ACCS (Child Wellbeing) was particularly sharp during the first quarter of the Package (see Chapter 7). This may be explained by these transitional issues, with numbers picking up as issues were resolved and understanding of eligibility and processes improved.
Services reported that many of the issues with and delays in ACCS applications have resolved over time.
If everything goes as it should, the process is easy. There have been system 'glitches', which do seem to be becoming fewer with time. The recent evidence guide has been very helpful to provide information to third parties about what is required. We find the ACCS (Child Wellbeing) process is very much driven by the service (and we have to adopt responsibility for managing).
[FDC provider, July 2019]
So we're getting approved now in two minutes, I reckon… So we apply for the certificates for the first six weeks, and by the time I've gone in to look at the children's new entitlement, it's been confirmed. It's brilliant. So we've got about 12 children on certificates and determinations at the moment.
[CBDC provider, (Former BBF), October 2019]
10.7 Transition of Budget Based Funded services
Just over half of the former Budget Based Funded (BBF) services (55.3 per cent) transitioned to mainstream child care funding with the commencement of the Child Care Package in July 2018. As of 2 July 2018, the funding arrangements for these services changed from a grant-based funding model to deriving income from the CCS, ACCS and parent fees. These services' funding is also supported through the Community Child Care Fund-Restricted grants (see Section 9.7 for funding information).
10.7.1 Former Budget Based Funded services: numbers of services, families and children
While just over half of existing Budget Based Funded services transitioned to the new Child Care Package, others were precluded from transitioning due to the nature of the activities they provided (although these may be important to local communities and the children and families using them, the activities were not deemed to be child care). DESE advised that of the 244 services, 135 services transitioned to the Package and are receiving funding under the Community Child Care Fund. Another 65 were transferred to the Department of Prime Minister and Cabinet, and 25 to the Department of Social Services, as their activities more closely aligned with those departments' responsibilities. Three services continued operation with alternative funding sources. The remaining 16 services closed, identifying issues such as staff retention, declining demand, availability of alternative services and changes in service offering.183
As evident in the service numbers, the number of former Budget Based Funded services that had delivered session reports to the Department was lower in the weeks just after the introduction of the Child Care Package (87-88 services), see Figure 153, and gradually increased in the months after the transition, up to 113 by late November 2018. Aside from weeks over holiday periods, the number of former Budget Based Funded services delivering some child care, and submitting session reports, was around 117 services in 2019. Most former Budget Based Funded services are Centre Based Day Care services, with around 15 of the services being Outside School Hours Care services.
Figure 153: Former BBF service numbers, by week and service type, July 2018 to December 2019
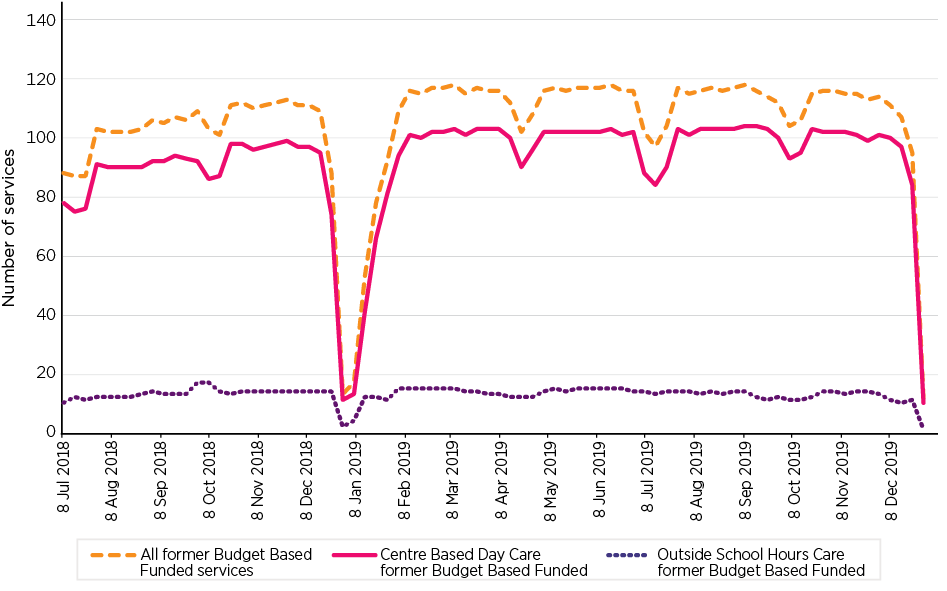
Source: DESE administrative data
Just after transition, there were about 2,600 to 2,700 children enrolled in the former Budget Based Funded services and covered in the services' session reports. The number increased in subsequent months, with 3,500 children recorded as using child care at these services in December 2018. As is the case for child care generally, the numbers were lower at the beginning of 2019 and have since increased to more than 3,600 by December 2019.
10.7.2 The transition experience for former BBF services and families
DESE provided individualised support to Budget Based Funded services to manage their transition to the new Child Care Package through a number of consultancy contracts commencing in 2016.
The Department engaged transition consultants to support BBF services to transition to mainstream funding. The transition consultants worked with services to develop transition plans and to support them in developing new business processes and tools to support this transition.
Data collection with 13 former BBF services in late 2019-early 2020 indicated that many of these services considered themselves to still be going through a transition process, and many were still engaging with their transition consultants.
The interviews suggested that the transition from the BBF model to the CCS was challenging for both staff and families. All of those interviewed said that the transition to the CCS created a high administrative burden for services, describing the transition as overwhelming, confusing and at times unmanageable.
Families didn't understand it; we didn't really understand it. We had to learn completely new systems and things like that.
[Child care provider, September 2019]
Information and support
While most of those interviewed said that there was a lot of information and support available during the transition, approximately half of interviewees said that the information wasn't always relevant or applicable in the very particular geographic and cultural contexts in which services operate. These services said that information wasn't available in languages other than English and training and support was not always culturally appropriate.
Given that we are in a remote context where English is a second, third, fourth language, it was something that was really difficult … to navigate with the team, you know, like there is an expectation that staff will be able to understand, you know, the way the fees work, the systems in place to help families, but it was just such a vague space without resources and materials in first language for people.
[Child care provider, December 2019]
The support that we asked for they couldn't provide us. I asked for face-to-face training for the staff, because our staff don't respond well to teleconferences or webinars, because English is their second language, and none of them have ever used a system like this before, so they need to be able to talk to someone, see them and be able to, you know, ask questions and that - that hands on learning, not just that they're sitting there and have someone talking at them.
[Child care provider, December 2019]
myGov and Centrelink
All interview participants said that supporting families to register for myGov was particularly time consuming and difficult for services and usually involved a staff member sitting with parents for several hours in front of the centre's computer, setting up an account, explaining the requirements of myGov registration, obtaining Customer Reference Numbers (CRN), immunisation records, birth certificates and other documentation and entering information into the myGov interface. Interviewees explained that this kind of intensive support often fell to the service because parents were unable or unwilling to get assistance from Centrelink, had low IT and/or English literacy, or didn't have access to the internet, a computer or a phone. Overall, 13 of the 14 services told us that they provided this intensive support for all but 1 or 2 of the families accessing their services.
You know, for some families it could take up to four hours of my time. Because we would have to set them up with an email address, we would have to make sure that we had all their details written down for them, so they could take that so that we weren't holding onto that and breaching any privacy laws. You know, and we would then have to help them to connect their - set up a myGov account, connect their Centrelink to a myGov account, and for us that sometimes took phone calls to the clinic to get Medicare numbers; it took visits for the people to go to Centrelink and get Centrelink - you know, information from them; it took, you know, people going and getting bank statements or online banking to be able to find out the exact amount of their last payment. Like that process of actually connecting up to Centrelink requires some really detailed information.
So we had to buy a computer to have at work so families that wouldn't do it or couldn't do it because they don't have internet or anything, could come in and we would go help these families, one by one, to set up a myGov account.
[Child care provider, December 2019]
About half of the services interviewed said that a small number of families in their services opted to withdraw from child care rather than have contact with myGov and Centrelink.
So there's very big … distrust of Centrelink within the communities and families don't want to be part of it. And you know, it's a very hard system for First Nations people in a remote location.
[Child care provider, December 2019]
Some families didn't want the government knowing all their details. And removed their children from child care. Which is really sad because we have three families where we've lost children that really needed to be coming.
[Child care provider, October 2019]
10.8 The In Home Care transition
The revised In Home Care program was introduced on 2 July 2018, coinciding with the alignment of In Home Care with the Child Care Package. Findings about the transition, reported here, are drawn from the evaluation of the In Home Care program (Baxter et al., 2020). Experiences of the transition for the In Home Care project relate to the setup of In Home Care Support Agencies and the transition for families and services to the revised program. A 'Transition Project' was established to help manage the changes for In Home Care families and services and is described below. This information and support provided as part of the Transition Project supplemented the more general information and support provided to families and services for the transition to the Child Care Package.
10.8.1 The Transition Project
A Transition Project was established with the objectives to 'convey and promote information on the new Child Care Package and In Home Care program to families and services' and 'gather information from families and services to provide to the new support agencies to assist families in transitioning to the new CCS and new In Home Care program by 2 July 2018 or other arrangements as appropriate' (PwC, 2018, p. ii).
The transition arrangements were intended to move families previously on In Home Care or the Nanny Pilot Programme onto the new program, such that they were guaranteed a place in the new program but would be transitioned out over time if they did not meet the new eligibility criteria. The information gathered through the work of the PwC Transition Consultant was to inform this.
The Transition Project started in February 2018, with interviews with services concluded in March and with families by early May. Handover meetings were conducted with all In Home Care Support Agencies between 21 and 30 May 2018. However, the Transition Project was not successful in contacting all families who had previously been on In Home Care. There were significant challenges related to out-of-date contact information, as well as resistance from some families to providing information. The complex needs of some families, particularly parents with disabilities or from a culturally and linguistically diverse background, made collecting information challenging even when contact was made.
Another area of support that was expected to be provided to families during the transition period was referring them to other support services. According to the In Home Care Guidelines, the intention was that the Transition Consultant and the In Home Care Support Agencies would help refer families to other support services. It is not clear that this support was provided by the Transition Consultant, although lists of services were provided in their accompanying guide to transition plans for the In Home Care Support Agencies.
10.8.2 In Home Care Support Agencies
The In Home Care Support Agencies were established in May 2018. Many service providers and other stakeholders felt that In Home Care Support Agencies were not provided with enough time to become properly established before the revised In Home Care program was introduced. This made it difficult for the In Home Care Support Agencies to operate as intended and at the level needed to support services and families through the transition.
During qualitative interviews, the In Home Care Support Agencies talked about the tight time frames and the considerable administrative demands required at the implementation of the program. However, a couple of the In Home Care Support Agencies indicated that these challenges began to ease about 6 months into the program implementation. In Home Care Support Agencies in the smaller states also tended to manage the transition more easily than those in the bigger states where there were large volumes of families.
10.8.3 Families' transition to the revised In Home Care program
Numbers of families and children using In Home Care around the transition
The Department reports that there were about 1,900 families using In Home Care or the Nanny Pilot Programme prior to transition. Drawing on early indicative data from the In Home Care Support Agencies, the Department estimated that about 80 per cent of these families transitioned to the new In Home Care program. However, this was a more gradual transition than for other types of child care (see Chapter 6) due to the complexities and multiple steps involved.
To formalise the transition to In Home Care, once families were assessed by In Home Care Support Agencies as eligible for CCS, information provided through the Transition Project was used to prepare Family Management Plans to confirm their In Home Care needs, and confirm services' capacity to continue providing that care. Timing constraints meant it ended up being impossible for the In Home Care Support Agencies to assess the eligibility for In Home Care for all prior recipients before implementation on 2 July 2018. Instead, for those not yet assessed, families receiving In Home Care prior to the transition were transitioned over at implementation if they registered their information through myGov and were assessed as being CCS-eligible. Assessment of their eligibility for In Home Care was done subsequently, such that the transition period extended beyond implementation.
During the period of transition that followed, there were transitions from In Home Care for some families, while other new families began using In Home Care, and waiting lists were compiled. Before the transition to the revised In Home Care program, about 1,900 families were accessing either In Home Care or the Nanny Pilot Programme. Overall, the Department estimated that 4 in 5 families previously using In Home Care transitioned over to In Home Care at 2 July, with the remaining 1 in 5 transitioned to other arrangements or no longer needing In Home Care.184
Findings from the Transition Project as well as evaluation data collections indicate that transitions out of In Home Care or the Nanny Pilot Programme may have occurred because:
- Families did not apply for or were not eligible for CCS.
- Families no longer needed the In Home Care or Nanny Pilot Programme they had used in the past.
- In Home Care was no longer suitable for families under the new program, in that their circumstances did not meet the eligibility criteria.
- Mainstream care was available to the family.
- Families wanted to use In Home Care for reasons other than early childhood education and care.
- Families could not afford the revised costs.
- There was no suitable educator available to families.
Compiled In Home Care Support Agency program data about families transitioning off In Home Care during the transition period show that at least half of the families transitioned out because they no longer needed In Home Care, with about 200 transitioning out because they could not afford In Home Care, they did not meet the revised eligibility criteria, they were transitioned to other services, their educator was not qualified to provide In Home Care or they were not eligible for CCS. However, it is noted that reasons for transitioning out of In Home Care were not available for many families, and AIFS was advised by the Department that coding of reasons was likely not done uniformly across the In Home Care Support Agencies.
In Home Care Support Agencies and family transitions
An initial task for the In Home Care Support Agencies was to contact families, to determine their eligibility for the new program, and to develop Family Management Plans for those families for whom In Home Care was suitable. In Home Care Support Agencies reported this task being complicated by the incomplete data provided to them by the Transition Consultant. The information had gaps and had to be supplemented by In Home Care Support Agencies with other information (from services) to ensure contact with all families was made. Some jurisdictions were more successful at transitioning families to other services, particularly those states and territories managing a smaller number of families.
A challenge was that problems with educator availability left some families without an educator, leaving them without access to In Home Care, even if they were approved for it. Some of these families will have joined the waiting list, although some may have elected not to do this.
A finding from the evaluation of the In Home Care program was that In Home Care Support Agencies had challenges in transitioning families who used In Home Care under the previous program and who relied on it for parenting support. In Home Care Support Agencies talked about the amount of time it took to transition such families to other services, because of the resources and delays in finding other appropriate services and because it takes time for the family to adjust to the idea of new education and care arrangements. In Home Care Support Agencies reported allowing families to continue to receive In Home Care during the transition time, until appropriate other services and supports were in place.
However, it is important to note that a minority of In Home Care Support Agencies indicated that some families from the previous program would probably never transition because of continuing needs that could not be met by mainstream services. For some, these were regional families who were on the waiting list for mainstream services but, in some cases, there were no other services in the area. It was expected these families would stay in the program until children started school. One In Home Care Support Agency explained the challenge of transitioning a family who had been using the program for 10 years, indicating the family had 'become absolutely reliant on [In Home Care] for a variety of their family needs'. She went on to say that 'it's really tough thing to move families forward' (In Home Care Support Agency, February 2020).
Survey and interview findings about families' transitions
About 7 in 10 families surveyed as part of the In Home Care evaluation said that the In Home Care Support Agency had explained the changes coming in on 2 July 2018. Of these, 53.3 per cent expressed satisfaction with this interaction, 21.1 per cent were neither satisfied nor dissatisfied and 24.3 per cent were dissatisfied.
Qualitative interviews with families for the In Home Care evaluation indicated that communication with In Home Care Support Agencies and with In Home Care services was a key challenge for families, with participants expressing this had been associated with feelings of stress, fear and confusion. This was supported with survey findings, with participants reporting confusion about the process and about the roles of different stakeholders (the Transition Consultant, the In Home Care Support Agency, the service provider).
Reports of services surveyed for the In Home Care evaluation also indicated that some of the challenges to families at this time were connected to the transition to the Child Care Package more generally, not just related to In Home Care itself. In particular, uncertainty around the fees and costs of the new program was another key issue coming out of the interviews and the survey data. The transition period was marked by some uncertainty for families about whether their fees would stay the same or increase.
Families who stopped using In Home Care or were waiting to use In Home Care
In the first family survey undertaken for the In Home Care evaluation (conducted February-March 2019), past users of In Home Care as well as those on the waiting list were invited to complete the survey. Among the past users who were not on the waiting list, about one in 3 had stopped using In Home Care because their circumstances had changed in some way, including recovering from a medical condition, changed work circumstances, or children now older or care now being available. A larger proportion had stopped for reasons related to the affordability of care or other aspects of In Home Care. These details are shown in Figure 154, which compares reasons for leaving In Home Care for those who had previously used In Home Care but were on the waiting list at the time of the survey with those who stopped altogether. For those on the waiting list who had previously used In Home Care, by far the most common reason given for their having stopped using In Home Care was the lack of a service or educator.
Figure 154: Reasons for leaving In Home Care, by whether IHC/NPP past user or on IHC waiting list, 2019
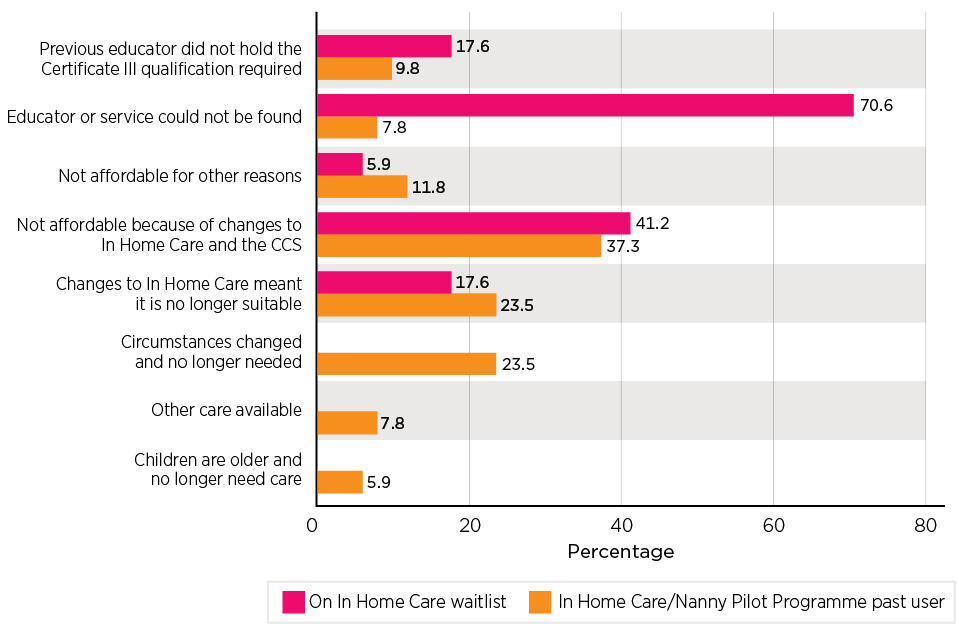
Notes: There were 51 respondents who were IHC/NPP past users and 17 that were on the In Home Care waitlist.
Source: In Home Care Evaluation Family Survey, Wave 1 (February-March 2019)
Families were asked what happened to their children's care and early childhood education when they stopped using In Home Care. The most common response was that care was provided by children's parents or guardians, but some had transitioned to formal care. The waitlisted families more often reported having had support provided by other services, but were more likely to report going without formal early learning and care.
10.8.4 In Home Care service experiences of the transition
The transition process for services was initially managed through the Transition Consultant making contact with services, providing information to them about the changes, and collecting information about their service and their educator for handover to the In Home Care Support Agencies. On In Home Care Support Agency set-up, the transition process was then facilitated through the In Home Care Support Agencies. In addition, the Department established guidelines and the handbook for services and educators leading up to this period and, as mentioned above, there was considerable communication and resources provided to all early learning and care services in the transition period about the broader changes connected to the Child Care Package.
As background to how prepared services felt leading up to the transition, in the Survey of Early Learning and Care Services (May-June 2018) services were asked for their level of agreement with the statement: 'This service is ready for the changes.' Overall, 42.7 per cent of the In Home Care services agreed or strongly agreed with this statement, compared to 65.9 per cent for all other service types. In contrast, 41.1 per cent of the In Home Care services either disagreed or strongly disagreed. Also, in this survey, respondents were asked to rate their agreement with the statement that they were getting enough support from the then Department of Education and Training during the transition period. Among In Home Care services, 17.3 per cent of services agreed they were receiving enough support, while 67.7 per cent disagreed or strongly disagreed. As with the comparison to other service types, above, the In Home Care services tended to be more negative than other service types.
As indicated by the survey data cited above, In Home Care services often felt they were not ready for the transition on 2 July 2018; similarly, the In Home Care Support Agencies. However, service providers in the smaller states reportedly managed the transition more easily than those in the bigger states where there were large volumes of families to transition over. Services relayed strong feelings of dissatisfaction about the transition period and the impacts of the transition on their services.
Because of the introduction of the Child Care Package as well as revisions to the In Home Care program, this was a period of uncertainty for services. In evaluation data collections, many reported feeling unable to help families that they had been working with and had built a relationship with over time, because they themselves were unsure of the eligibility criteria.
10.8.5 Educators and the In Home Care transition
The alignment of the revised In Home Care program to the Child Care Package included the requirement for In Home Care educators to be qualified at, or studying toward a Certificate III level early childhood education and care qualification. It was expected that meeting the qualification requirements would be difficult for In Home Care educators in rural and remote areas. To address this, transitional provisions for educators in rural and remote areas were put in place. These provisions were initially due to end 1 January 2020 but were later extended a further 2 years until 31 December 2021.
10.8.6 Summary of In Home Care transition
Considerable effort was expended on the transition process; in particular, the employment of the Transition Consultant to work with families and services. Nevertheless, the transition from the previous In Home Care and Nanny Pilot Programme to the revised In Home Care program was challenging for services as well as families. Challenges included those related to the alignment to the Child Care Package, which was linked to uncertainty for families and services around the rate of subsidy and costs for families. There was also uncertainty for families and services about how the eligibility criteria would be operationalised. The new requirement for a qualified educator was a significant issue for some families, particularly those who had ongoing and trusting relationships with educators who did not have the required qualification and therefore had to stop providing In Home Care (or begin studying for the qualification). Many participant families had to reduce hours or drop out of In Home Care altogether because of the new arrangements, and few of these found suitable alternative child care arrangements.
Some of these challenges were inevitable and arose because of the changed structure and eligibility of the In Home Care program, but others were due to issues within the transition process itself; in particular, the late introduction of the In Home Care Support Agencies, that came on board only a few weeks before the transition.
10.9 Summary
The transition was successful in the transfer of the majority of services and families to the new arrangements by 2 July 2018. The transition process was supported by an extensive communications campaign and the development of supporting materials for services and parents - resulting in most of these groups saying they had felt well prepared for the transition. Additional intensive supports were also provided for former Budget Based Funded services and In Home Care services that also experienced significant changes to their funding and operating models at this time. Many services reported that despite the extensive preparation, they had experienced significant administrative burden at the time of the transition, while they navigated new systems and processes and supported parents in doing the same. Other issues that arose in the transition included the IT system and third-party software issues, the implementation of the ACCS and specific challenges for former Budget Based Funded services and In Home Care services. With the bushfires and then COVID leading to the 2020 data collections with services and parents being cancelled, the longer-term impacts of the transition have not been able to be explored with these groups. However, most of the challenges experienced through the transition were reported to be largely resolved 12 months later - although some IT challenges remained for some services.
180 The Department of Human Services was renamed Services Australia in May 2019.
181 The July Living in Australia (LinA) survey had 2,260 respondents. Of these, 206 reported having used formal child care and answered this question.
182 The CCS Helpdesk was previously named the CCMS Helpdesk.
183 In addition to the Budget Based Funded services, there were 27 services classified as Non-Formula Funded Occasional Child Care (NFF-OCC) that were transitioned. Of these 22 services, 12 are operating under the new package, 5 have been transferred to the Department of Social Services, 4 have closed and 1 had sought alternative funding. This data was provided by DESE.
184 The source of these estimates was indicative data as advised by In Home Care Support Agencies as at 31 July 2018. See also www.aph.gov.au/Parliamentary_Business/Senate_estimates/ee/2018-19_Supplementary_Budget_estimates.
11. Conclusion and recommendations
The Child Care Package was introduced in 2018 as a significant reform to child care provision and funding. It involved a major restructuring of subsidies and a range of other measures, and significant additional government expenditure. In addition to the introduction of the new Child Care Subsidy, this included the implementation of the Child Care Safety Net programs. This evaluation has focused on 4 identified outcomes and 3 areas of impact in its assessment of the Package. In addressing these, the evaluation has largely adopted a comparative focus on whether or not the Package has had a positive or negative impact relative to outcomes under the previous funding arrangements.
While implementation of the Package was largely suspended during 2020, and certain aspects of the evaluation curtailed due to the impact of COVID-19, we consider that the elements of the Package were sufficiently implemented, and the evaluation had collected adequate information, to enable conclusions to be drawn on the program outcomes and impacts. These are reported in this Chapter along with recommendations.
The evaluation drew heavily on the administrative data on the children's and families' use of child care along with surveys implemented by the Department and by the evaluation, as well as extensive qualitative data from consultations and location-based case studies. It also drew on the extant literature and data published by the ABS and others. The evaluation also provided an early monitoring report on the Package (Baxter et al., 2019) and reports here on aspects of the transition. Associated with the main evaluation, the evaluation team has undertaken specific evaluations of the Inclusion Support Program and In Home Care. These are not reported here, although the underlying research is drawn on.
11.1 Overview of key findings
These findings relate to the outcomes and impacts that were established in the evaluation framework.
11.1.1 Outcome 1: Child care services are accessible and flexible relative to families' needs, including disadvantaged and vulnerable families
Analysis of data at the time of the implementation of the CCS and the 18 months following the implementation shows no marked changes in access to child care in Australia. While the data suggests a slightly elevated level of entries and exits of children in child care at the immediate point of transition, the overall size of this was small. In the case of exits, this was some 0.3 to 0.6 of a percentage point of the child care population. The more elevated rate of inflow reflected both real change and structural changes, including bringing the former BBF services into scope of the child care subsidy system and the introduction of a new reporting system. Data on use of child care by families in receipt of FTB suggests the impact of the package on this group of lower and lower-middle income families, who account for 42.5 per cent of families using child care, was small, an increase in participation of 0.2 percentage points for children aged under 5 years and a fall of 0.6 percentage points for children above this age. Parental reporting of satisfaction with access suggests there may have been some increase in satisfaction with access for older children, but this was not statistically robust, and there was no substantive pattern for younger children. While there was an apparent increase in the number of Indigenous children using child care, this is largely a data artefact, and growth in this population was generally consistent with longer term trends, although modelling suggests some marginal relative gains. The evaluation found that there was a significant population of child care users who used hours of care above those for which they were eligible for a subsidy under the operation of the activity test, including the safety net provisions. This has implications for the cost of care for these families and more broadly for the adequacy of these settings.
The data suggests that levels of usage is variable by geographic location, with particular low levels of use in small urban locations and in non-urban regional locations, especially outer regional and remote and very remote locations. There were also marked differences between states and territories. For some child ages these differences are up to 25 to 28 percentage points. There is little substantive change in the number of hours of care, and a slight decrease in children having only a single day of care in the week. While parents, except those on high incomes, were generally weakly positive in their agreement that the hours of care they accessed under the activity test were adequate, the administrative data indicates that some 10 per cent of children use hours in excess of their subsidised hours.
Families with children with additional needs reported a higher level of having to change care because services asked children to leave and, on average, over 10 per cent of services reported that they had declined an enrolment because they could not meet the needs of the child.
Overall, the evaluation found that there was little change in the flexibility of child care following the introduction of the Child Care Package. It, however, is a multi-dimensional concept and parents' views varied with the question asked. Capacity to change hours received the second lowest satisfaction rating (only higher than affordability) of a range of attributes of child care provision, but the question of whether child care was sufficiently flexible to meet needs was more neutrally rated by parents. While cited as a barrier by many of those parents who wanted to work more hours than they currently did, it was only the sole barrier for a very small group of parents. Dissatisfaction with flexibility was associated with higher incomes, single parents working varying shifts and with couples where both were.
While data on opening hours was only available in the administrative data post introduction of the Package, other than In Home Care, which showed some increase in effective opening hours of services, there has been little change in the hours for which care was available across services. The evaluation found that there had been an increase in the range of sessions of care being provided; however, more detailed analysis of services offering a range of longer session times in the Centre Based Day Care sector found that not only were the shorter sessions charged at a markedly higher hourly rate but, in some cases, the cost of long and short sessions were the same. This, and the findings of qualitative research, suggests that this apparent flexibility in session length was mainly a device for allowing parents to maximise their approved hours of subsidy, and was cheaper for them as it avoided non-subsidised hours of care. Where shorter sessions were offered these were generally charged at a premium, in some cases only selectively offered, and frequently were very rigid in the periods of time for which shorter sessions could be selected, with limited options around start and end times. These limitations reflected the degree to which services offering these considered these sessions were not necessarily economically viable. They were more frequent in services in more disadvantaged areas and where a significant number of children only had access to 24 hours of CCS per fortnight.
The key barrier to providing more flexibility in child care is cost. This includes the cost of staff working non-standard hours and the impact on services who have to manage, and roster ahead, staffing to maintain statutory staffing ratios and whose viability is underpinned by having this matched by pre-booked numbers of children attending sessions of care. It was also noted that achieving high quality ratings was associated with a stable workforce.
Summary
The introduction of the Child Care Package had little impact on the accessibility or flexibility of child care provision. There is though considerable variability in access and barriers to access for some children including exclusionary service practice. While the Package has stimulated the Centre Based Day Care sector to develop a more diverse set of session lengths, these appear to have primarily been a device to manage the constraints introduced by the activity test. While there is some demand for greater flexibility in child care by parents, the primary barrier to provision is economic, as for services flexibility can be costly.
11.1.2 Outcome 2: Access to child care support is simple for families and services
A key feature of the Package was the replacement of the 2-part, CCB and CCR, subsidy arrangement with the single CCS. This was accompanied by regulatory changes for services to reduce some constraints and streamline processes, along with a new IT system. These were all seen as elements that would improve the simplicity of the provision of child care support. At the same time, the CCS introduced additional elements such as multiple maximum approved subsidy hours linked to the activity test and delivery of all assistance through Centrelink. An early change in the program was an extension of the previous 8-week rule for absence from care, which had resulted in an increased need for re-enrolment of children and families.
Parents were only weakly positive, on balance, in their rating of the CCS as being easier to understand than the previous funding arrangements, with the largest group, some 43 per cent across 2 surveys, neither agreeing nor disagreeing. Low to middle income earners were somewhat more positive than those on higher incomes. There was a small increase in parents' views that information on the assistance was easy to understand, although on balance parents continued to disagree with this, and there was no change in their perception of how easy it was to obtain information.
In terms of the operation of the program, in large part, it appears that for most people the processes operate relatively smoothly; however, when issues arise, resolution of these appears to be a major problem. Two specific issues had prominence. The first was the 2-stage process associated with agreeing the Complying Written Agreement and then confirming the enrolment; the second was the operation of both the DESE Helpdesk and Centrelink helpdesk. There was strong negative feedback on these including tardiness and circular referrals - that is, being referred back to services, rather than resolution. One specific issue also raised was the functionality and ease of use of the Centrelink calculator relative to that produced by DESE prior to the transition.
Summary
Notionally, the introduction of a single subsidy for families using child care has produced a simpler child care system. It however also has additional strictures associated with the activity test and has brought the operation of all subsidies within the purview of Centrelink. Parents' views on the program relative to the previous arrangements are largely neutral, although, on balance, weakly positive. Operationally, the 2-stage enrolment process does cause some problems. While for most families the process is smooth, where problems arise these appear to be difficult and resource intensive to resolve. Some supports can be improved.
11.1.3 Outcome 3: Child care is affordable to families especially those with limited means
Improving affordability of child care for low and middle income families was central to the Child Care Package, with the new CCS also including a taper reducing, and then ceasing, the payment of subsidies to high income earners, along with a cap on subsidies for some. The hourly fees cap, indexed by CPI, limited the level of subsidy and was seen as a means of putting downward pressure on fees.
The evaluation noted that there had been a long history of government interventions to reduce the cost of child care as measured by the CPI. These historically, while reducing the cost in the short term, did not impact the long-term trend, with the cost of child care trending well above the CPI but consistent with trends in earnings.
Analysis of trends in child care fees found no change in the pattern of increase following the introduction of the Package, and a significant proportion of hours of care were charged above the cap. This on average varied from 10.3 per cent in Centre Based Day Care to 17.4 per cent in In Home Care. Above cap charging was more frequent in capital cities and in remote locations, in the Australian Capital Territory, Western Australia and Victoria, and for younger children. As noted above, the analysis also found a significant group of children who were charged for hours of care in excess of those which were subject to the subsidy.
Parents' survey responses showed a marked and statistically significant increase in reporting that child care was affordable following the introduction of the CCS. However, in November 2019 parents with a youngest child aged under 5 were still more likely to disagree (54.7 per cent) than agree (28.4 per cent) that child care was affordable, while those with older children were more equally balanced.
Extensive modelling was undertaken of the impact of the CCS relative to the CCB/CCR system. This used the 2018-19 population of child care users and estimated, using their actual current fees, income and usage, the value of assistance under the CCS and the old subsidies. This found that, holding fees and income constant:
- The CCS had reduced the net cost of child care for 62.1 per cent of families using child care, had little impact on the cost for 8.6 per cent and increased the net cost for 29.2 per cent.
- For those with a reduced cost under the CCS, the average proportion of gross income spent on child care fell from 6.7 per cent to 4.5 per cent, with annual net spending falling from $5,412 to $4,026. The median cost of child care for these families fell from 4.4 per cent of gross family income to 3.2 per cent, and actual spending from $3,472 to $2,436.
- In contrast to those who had an increase in costs, who had an average annual gross family income of $177,240, the annual average income of those that gained was $95,848.
Further analysis found that the gains were strongest for low income families, families with larger numbers of children using child care, families using longer periods of care and for those using for-profit Family Day Care. Once controlled for family characteristics there were no strong regional effects.
Analysis of the operation of the annual cap on the subsidy found this only impacted a small group of parents, some 1.3 per cent, in a small part of the income distribution, and that the annual subsidy saving associated with the cap was $24 million. The substantive role of this, given that the taper rate effectively reduces subsidy rates across this range, was unclear.
Summary
The introduction of the Package has achieved the objective of targeting additional support to low and middle income families and has reduced support for higher income families. It is estimated from modelling, assuming constant costs and usage, that around two-thirds of families have lower net costs under the CCS, one in 10 the same costs, and 3 in 10 a higher cost. The median net annual cost to families is estimated to have fallen from $2,957 to $2,507.
The CCS had particularly benefited some families, including those: using large amounts of care; the small group with 3 or more children in care; with children under the age of 5 years; in receipt of income support; living in areas of socio-economic disadvantage; and using for-profit Family Day Care.
The annual subsidy cap only impacts a small number of families mainly in the middle of the upper income band. More broadly, while the higher benefits from the Package have reduced the immediate cost of child care to families, there is little evidence in the data available to the evaluation of the hourly fee cap working as a constraint on fees being charged by services. The existence of a significant group of parents being charged for hours beyond those subject to the CCS, and indeed half of parents having some experience of this, warrants further review and consideration.
11.1.4 Outcome 4: Child care services are viable and the sector is robust
It is noted that this evaluation is of the operation of the system to end 2019 and does not take account of economic and social disruptions associated with COVID-19.
The child care sector is dominated by Centre Based Day Care, accounting for 61.8 per cent of services and 79.5 per cent of the hours of care provided by the sector. Two-thirds (62.8 per cent) of services are for-profit with this varying by sector and geography. The proportion of services that are for-profit is around 50 per cent outside of the capitals and major urban centres, and declines further in outer regional and more remote areas. In 2018-19 child care subsidies accounted for some 60.7 per cent of services' revenue from care provision. Since Q2 2017 there has been strong growth in the number of Centre Based Day Care services and a marked decline in Family Day Care, with 79.6 per cent of exits in this sector being associated with compliance activity. Other than a spike at the point of introduction, there was no change in the level of new services entering and existing services ceasing operating. There has been a trend towards consolidation across the sector. At the provider level, the Outside School Hours Care sector is the most concentrated; that is, with a small number of providers dominating the market, and it is the only sector identified as consistently becoming more concentrated over the past 3 years.
Analysis of self-reported service viability indicates that most services view themselves as viable, although there was a slight, but statistically significant, drop in this following the introduction of the Package. Relative to Centre Based Day Care, the In Home Care sector was much more negative, and Family Day Care somewhat more negative about their viability, while Outside School Hours Care services were more positive. Although individual companies varied in performance, the spread of share price movements of listed entities did not show any consistent variation away from the overall share market. Issues raised with regard to viability included concerns about the underlying business model in the Centre Based Day Care sector, given the focus on 'flexibility', issues of debt and the expectation of full-fee charging until determination of eligibility for CCS and over supply. Regarding the latter, while there were many concerns expressed, data on vacancies tended to confirm analysis that this was more a location specific issue.
Analysis of the CCCF indicates that these grants represent for many services a significant proportion of their revenue and were often of an extended duration. This funding was particularly significant for former BBF services, many of which faced significant challenges, including to their underlying focus on providing culturally appropriate child care to Aboriginal and Torres Strait Islander children in their communities.
The labour market for educators is, in general, not experiencing shortages in supply; however, some specific issues were identified in terms of quality and the need for services to provide development, as well as some reports of needing to pay a premium to attract and maintain a quality workforce. There were also issues especially for In Home Care related to recruiting staff to work in remote locations, to work short shifts and variable or non-standard hours. Data on the relative numbers of course commencements to completions suggests that the question of training warrants further attention.
Summary
The introduction of the Package appears to have had little impact on the viability of the sector as a whole. The circumstances of some specific sectors, however, remain uncertain. The for-profit Family Day Care sector has been the focus of compliance actions and in major states its role has declined dramatically. At the same time, there has been a small but steady reduction in the for-profit sector. In the In Home Care sector, the new program and the increase in subsidy rates are still bedding in and longer term viability is unclear. A number of services - in particular, former BBF services - are effectively underpinned by the CCCF, with the program appearing to be acting, and potentially required, as an ongoing complementary funding stream for services that are unlikely to be viable under the CCS alone.
11.1.5 Impact 1: Parents of children can engage in work, education and the community
Workforce participation by parents with dependent children has been increasing over several decades. Increased government child care subsidies can have both positive and negative labour market impacts. Analysis of administrative and survey data found evidence of some increase in reported activity. For single parents there was a small positive increase in reported activity under the activity test (1.4 per cent), and for couples 0.3 per cent. Survey data, however, suggests there was no increase in the overall hours of employment of these parents between the June 2018 and June 2019 surveys. The analysis also highlighted the need to take account of seasonality in making comparisons over time. For couples, there was some increase in activity under the activity test at a much lower rate than for single parents, and also in survey data, although this was not statistically significant.
When parents were asked whether they had changed work arrangements due to CCS, around 20 per cent said they had, while there were no statistically significant differences between the proportion of those reporting increased and decreased activity in any individual survey, the data pointed to an excess of increased over decreased activity of 1.5 percentage points for single parents and 1.9 percentage points for couples. There was similarly a split between those parents wanting to work more (19.4 per cent) and those wanting to work less (21.5 per cent), and while many of those reporting that they wanted to work more cited child care as a barrier, this was rarely the sole reason, and most frequently related to the cost of child care.
Assessing these changes in activity and employment, the evaluation found the magnitude of change was incremental rather than fundamentally different and not inconsistent with the longer term trends. It was also noted that parental workforce participation was strongly associated with parental attitudes.
Modelling of the Effective Marginal Tax Rates for parents under both the CCB/CCR and CCS points, across the scenarios, to an average 8.5 percentage point reduction in the EMTRs on the earnings parents would gain from working an additional day. After these reductions, however, the median EMTR remained at 67.5 per cent, and a quarter of the scenarios had an EMTR of over 78.3 per cent. Generally single parents had higher EMTRs than a second earner in a couple, and the EMTR tended to be higher when people moved, for example, from 4 to 5 days work, than from none to one.
Summary
The evidence suggests that the Package has had diverse impacts on parents' participation in employment. While on balance these are likely to have been positive, the extent of this is small, and the overall trends are not inconsistent with historical trends in the workforce participation of families with children. A key issue to increasing workforce participation is parental values and attitudes. Although the CCS has acted to reduce the Effective Marginal Tax Rates for many single parents and second earners in couples, these remain very high for most because of the other elements of the tax-transfer system.
11.1.6 Impact 2: Vulnerable and disadvantaged children are engaged and supported
Analysis of the rate of participation of children from vulnerable groups suggests that, overall, there has been little significant impact on the extent to which these children access child care. As noted above, the changes in participation among families in receipt of FTB - a population that encompasses most lower income households - were generally small. A more marked negative effect was seen within this population for some subgroups, including children of parents who were on a humanitarian visa, and by some children whose parents were in receipt of a full-rate of income support, as well as some children of lower income single parents.
More positive relative outcomes were recorded by Aboriginal and Torres Strait Island children. However, overall, these changes can be considered to be at the margin rather than representing any substantive shift in access. Data on children who had a recorded health or disability condition indicates that, overall, these children appear to access child care at a similar rate to other children. This, however, is not the case for Aboriginal and Torres Strait Islander children, some children with specific non-English speaking backgrounds, and children in remote and very remote locations, who access child care at substantially lower rates than children as a whole. In considering these results it is noted that engaging and supporting vulnerable children is not just a question of their having equal access, but also needs to take account of the potential role of child care and early childhood education and care in addressing disadvantage.
The evaluation found that although just 1.6 per cent of children were only entitled to 24 hours of subsidised care per fortnight, there was a high concentration of vulnerable children within this group even with the very substantial extent to which ACCS provides many vulnerable children with access to 100 hours. Given the issues identified elsewhere with shorter sessions of care, and the extent to which many of these families incurred higher costs associated with non-subsidised care, this element of the package seems to have limited merit. The evaluation was not able to fully examine the question of the allocation of 36 hours because of interactions with Universal Access to Early Childhood Education but again notes a disproportionate number of vulnerable children on this provision.
While there were a number of significant transition issues with the introduction of the ACCS, the program appears to have substantially ramped up and plays an important role in supporting access by several groups of vulnerable children. At the same time, some aspects of the program's operation were seen as problematic. Many services reported that processes were difficult and administratively burdensome in respect to the ACCS (Child Wellbeing) application, and that particular problems arose where parents were not within the child care system at the point of application. The process of application for continuation of access to ACCS (Child Wellbeing) shows some clear discontinuities. Additionally, the rigidities of the guidelines do not reflect the variety of forms of kinship and similar care, and the language of children being 'at risk' is an inhibition, especially for communities that have been scarred by welfare removal of children, and the Stolen Generations.
Summary
While the Child Care Package has not had any significant negative impacts on access to child care for most vulnerable children, it has not addressed the lower level of participation by some groups, nor focused on the question as to whether more proactive and substantial interventions are needed for these children. Particular issues arise for Aboriginal and Torres Strait Islander children, children living in more remote locations and some children with a non-English speaking background. Specific aspects of the ACCS should be reviewed to reduce some of the burden on services and parents and to take account of diverse kinship and other relationships, and greater sensitivity with regard to ACCS (Child Wellbeing). The 24 hours limit on subsidised care under the safety net relative to previous settings raises questions on the adequacy, targeting and effectiveness of this provision.
11.1.7 Impact 3: Child care funding is sustainable for government
From the evaluation there is little evidence of any changes to the economic fundamentals of child care provision. While the industry is robust, and there is evidence of continued investment, this appears to be more related to the maturing of the sector and competition for market share. The main driver of cost is wages, and it is to be expected that these will maintain, consistent with wage growth overall, increases at a rate above CPI. To the extent that there are rigidities in provision of child care, these are driven by the economic cost of more flexible products, and statutory controls on staffing levels and qualifications based on child wellbeing and development objectives. As noted above, the hourly fees cap does not appear to have been effective in constraining hourly fees and, similarly, families are consuming a volume of care beyond that supported under the activity test.
Historically, while a series of other subsidy and related interventions have been successful in reducing the real cost of child care to families in the short term, none to date has changed the longer term trajectory.
The structure of CCS is such that government costs, while potentially exposed to a large increase in demand, a response not seen in data to date, are constrained by the indexation of the fees cap. Essentially, any increases in cost beyond this are borne by parents. In this context, the decisions on sustainability are concerned with political assessments, including the extent to which such a shift might negatively impact other government objectives such as participation and child development.
Summary
Assessment of the sustainability of child care funding is essentially an issue for government in terms of a balance of revenue and expenditure priorities. The evaluation did not address this question. From the evaluation findings there is little evidence of the Package impacting the fundamental drivers of cost in the provision of care. While indexation of the fees cap by the CPI will curtail the extent of cost increases to the government, this is by transferring these to parents.
11.2 Summary of effects of the Package
Overall, the program has been successful in reducing the cost for most low and middle income families using child care. It has been particularly beneficial for those families with 3 or more children using child care and for those who use longer hours of care. In this regard, the Package can be seen as having been successful in meeting one of its core objectives.
Beyond this, its impacts have been modest and marginal. There has been little impact on access or flexibility. This latter is largely constrained by the economics of provision, and some apparent shifts in session lengths appear to be a means of working within the constraints of the new program rather than any substantive change. While notionally the single CCS is simpler, some aspects of its operationalisation have made processes more difficult and parents largely see its impact on simplicity as being neutral.
The Package appears to have had little impact on the robustness of the sector, although it is noted that the CCCF underpins the viability of a number of services. The changes in subsidy payments have had an impact on individual family workforce decisions, resulting in some increasing and some decreasing activity; with the net impact, while weakly positive, not being strongly differentiable from historical patterns. Rather, participation decisions tend to be constrained by the values held by some parents with regard to work and child raising, and by the Effective Marginal Tax Rates faced by parents. These, while reduced by the Package, remain very high for many. The Package has had limited impact on access by disadvantaged children and families, leaving the challenge of how this can be increased, and how early childhood education and care can be used to improve outcomes for these children.
11.3 Emergent issues
In undertaking the evaluation, a number of significant issues identified in the analysis were beyond the specifics of the Child Care Package, although integral to the outcomes of the child care it supports.
11.3.1 The role of child care and ECEC
The OECD has placed strong emphasis on the importance of ECEC to economic and social futures, emphasising that 'equitable access to quality ECEC can strengthen the foundations of lifelong learning for all children and support the broad educational and social needs of families' (OECD, 2017, 16).
In Chapter 1, the evaluation has noted the tension between the focus of the Child Care Package on its role in supporting parental employment and the role of early childhood education and care in child development. This is a tension that was recognised in the 2014 Productivity Commission report, which noted, 'Furthermore, the 2 policy objectives that the Australian Government is seeking to meet - child development and workforce participation - are not always mutually consistent and their interaction needs to be carefully considered in ECEC policy design' (PC 2014 (Overview & Recommendations), 16). In large part, the focus of the key elements of the package have been on the second.
Looking at this broadly we would note issues such as:
- The level of consistency between the 24 hours per fortnight limit on CCS support for some families and the child development role of child care; in particular, in the context where this provision is concentrated among more vulnerable children and where this support in general only enables the purchase of a day of subsidised care a week in most services for young children.
- A lack of clarity around the inter-relationship with child care and expected outcomes of Universal Access to Early Childhood Education. In the case of child care, it appears that it is simply deemed that children are accessing 'a quality preschool program' if attending Centre Based Day Care.
- The large differences in the quality of child care services, as measured under the National Quality Standards; in particular, in the Centre Based Day Care sector, and accessed by children based on parental income. Such a gradient in favour of high income families raises the potential of embedding, rather than redressing disadvantage.
- A question of better clarification, and if need be differentiation, of the role of different sectors of child care services in terms of these 2 objectives. Of note here is the content of Outside School Hours Care, noting that this is approached internationally in a number of different ways, and the various elements of In Home Care such as provision in evenings and overnight.
11.3.2 Delivering early childhood development and education and flexibility
While flexibility was just one of the outcomes identified for the evaluation of the Package, it is one which bears some additional analysis. In terms of the role of the sector, the language of 'flexibility to parents' needs' is one that is largely positioned in terms of the provision of child care as 'child minding' with respect to parents' work, and other participation, and affordability. In terms of child development, the question of flexibility is one of responding to the specific needs of the child and best developing approaches to assist that child to learn and develop. This latter is largely absent in the policy framing.
Moreover, there is a strong tension between the concept of flexibility in the terms in which it has been framed and the structure of the major provision through Centre Based Day Care. In the context of child development, an important dimension is that of stability - with regard to an environment that is familiar and safe to the child, and with respect to the relationships the child can build with educators (and the relationships that educators develop with the child, including the knowledge of the child and their development, which is built over time) and their peers. This, in turn, is linked to organisational stability, including a stable workforce and the ability of services to structure and roster this, as well as to provide stability to their educators.
Additionally, as has been presented in the body of the evaluation with regard to flexibility, it is noted that in large part, a lack of flexibility is not a market failure, but rather reflects the economics of provision, and without this being funded by parents or by subsidies, some options that may be preferred by some will not be delivered.
The other key issue, to the extent flexibility is required to meet the strictures of employment demands, is whether some of the balance is to be better achieved by greater flexibility in these demands, rather than full accommodation by the child care sector.
11.3.3 Need for a coherent and explicit policy
These issues, and other aspects of the system identified in the evaluation, highlight the importance of having a clear, coherent and comprehensive policy environment for child care, linking the important goals of the package relating to workforce participation and other policies related to quality of care and the critical role of measures such as Universal Access to preschool in child development and in preparation for schooling, including strategies which account for Commonwealth/State divisions in responsibility.
As pointed out by the Productivity Commission, the objectives they identify in government policy are not mutually consistent. For the effective implementation of policy, there is, therefore, a need for a clear articulation of what the balance of policy goals is, of the specific outcomes that are sought against each of these goals and of the trade-offs which are inherent in this. We do not consider that such a framework exists nor are the specific objectives of aspects of the Package articulated against such a set of goals. Specifically, while some of the rationale is articulated in aspirational terms, this fails to reflect the reality of needing a more precise specification to both guide the program and provide a basis for performance to be judged.
This is further exacerbated by the division of responsibility between governments and the extent to which much of the responsibility for the child wellbeing element is largely seen as a state responsibility (although under the broader overview of the Education Council), while the Australian Government largely determines the financial resources available.
11.4 Recommendations
As discussed above, while achieving a significant shift in affordability, which benefits an overwhelming majority of lower and middle income families who use child care, the Child Care Package has had limited impact on other aspects of child care provision in Australia. Taking this into account, our recommendations fall into 2 categories. The first are some generally quite small and specific recommendations for changes to the Package to address particular issues; the second group identify some key issues that emerged from our evaluation of the package as we considered the outcomes and impacts of child care in Australia. These we view as being important to future considerations of child care and its role.
11.4.1 Program changes
In looking at program changes the evaluation notes that the government has already made 2 significant changes to the program with respect to the 8-week rule and the rate of the CCS for In Home Care, as well as a number of more minor adjustments. We consider that there remain some areas where changes should be contemplated.
Enrolment and commencement
There are 2 areas in the enrolment and commencement process that appear to be unnecessary or cause particular difficulties:
- The 2-stage application process with enrolment confirmation requires review to simplify the process and to avoid the problems that arise with respect to parents failing to confirm. This could include actions such as reminders to families, including text messages with quick links, or deeming confirmation on attendance.
- The payment of full fees on commencement pending approval. The processes that lead to this being a problem require review, with consideration of the speed of the approval process or options such as providing some form of pre-approval advice on the expected CCS eligibility. The current departmental advice would appear to be more an approach of avoiding the substantive issue of the inability of many parents to pay full fees pending some later potential refund, and the expectation that services demand this of them.
Allowed hours
The Package effectively reduced the minimum level of support from 24 hours per week to 24 hours per fortnight. The adequacy of this, in particular as it operationalises in many cases to a single day of subsidised care a week, was questioned. The evaluation found that this limitation applied to just 1.6 per cent of families, and notwithstanding the very significant role of ACCS in providing more substantial hours to many vulnerable children, these children remained significantly over-represented among those with this entitlement. While it is noted that some services have introduced shorter sessions of care to accommodate this policy, this is far from universal and is often structured as a morning or an afternoon as it otherwise occupies a full place in the service. The evidence suggests that the main limitations on flexibility of sessions are economic. Taken together, these suggest that the 24 hours limit is not particularly significant as a cost constraint on program spending, nor as a factor to change either service or family behaviour, but disproportionately impacts more vulnerable children.
More generally, we note that while services have, in many cases, responded to the structure of allowed hours by offering a range of different 'shorter' session lengths, as a means of allowing parents to operate within the constraints of the restriction imposed by allowed hours, these are frequently charged at the same or similar rate as longer sessions, and often involve more rigid structures, such as fixed start and end times, which, in turn, reduces the flexibility available to these parents.
Additionally, it is noted that while those parents with a CCS limit of 100 hours per fortnight have the lowest level of average above the activity test cap on hours of child care subsidy, the incidence does point to some parents having a need for a higher level of access (or access to notional sessions of care that are beyond 10 hours to provide flexibility in start and end times). This was not able to be investigated in detail with the curtailment of the evaluation but is an issue that should be further considered, along with a review of an increase in the 24 hours allocation, given its potential negative impact on disadvantaged children relative to its small impact on program costs, and more generally the extent to which the new structure of allowed hours is resulting in greater rigidity in child care options.
Removal of the Annual Cap
The annual cap limits the amount of Child Care Subsidy that is paid to families. As detailed, it is a policy that impacts a small group of families in the $186,958 to $351,247 income band. Effectively for this group, it is a policy that accelerates the impact of the income-related decline in the rate of subsidy.
While the policy is estimated to involve a savings of $24m to government, it introduces an unnecessary complication to the program, including a distortion into the rate of effective subsidies across the income distribution. It is unclear as to why this small group of parents are the focus of this policy, rather than simply allowing the income-related reduction in the rate of subsidy to operate smoothly across incomes.
Improved CCS calculator
The current CCS calculator operationalised through Centrelink is designed to provide a comprehensive Centrelink assessment, rather than as a flexible tool for parents, including an easy to use means to consider scenarios to guide their decision making. An alternative, such as the original DESE calculator, which was decommissioned at the time of implementation, should be developed and made easily available.
Operation of the ACCS
The administrative processes involved in ACCS Child Wellbeing applications are viewed as difficult by a significant proportion of services. Attention should be given to reviewing where the impacts of these administrative processes can be reduced. The program guidelines should better reflect a range of non-parental care including kinship care relative to the quite rigid current settings, and greater attention should be given to focusing support for 'child wellbeing' rather than children 'at risk'. Consideration should be given to improving processes for families that are required to apply for other types of ACCS.
Improved helpdesks
Neither services' reports on the operation of the DESE helpdesk nor parents' and services' views on the Centrelink helpdesk are positive. These should be reviewed in close consultation with users and be adequately resourced and have clear benchmarks and publicly available performance information against these.
11.4.2 More cohesive Early Childhood Education and Care
As detailed in Section 11.3, the evaluation identified a range of significant questions about the role of the child care sector in Australia. These are challenges that we consider continue.
- This issue is not new. The PwC report A Practical Vision for Early Childhood Education and Care articulated this a decade ago as: 'Australia's ECEC services remain fragmented. Australian services continue to be shaped by divisions between education and care systems; between child development and workforce participation objectives; and between Commonwealth, State and Territory Governments' (PwC, 2011, p. 8). From our evaluation we consider that this perspective remains valid.
- We also note the vision of the 2009 National Early Childhood Development Strategy: 'By 2020 all children have the best start in life to create a better future for themselves and for the nation' (COAG, 2009). Against this we note that in 2018, 21.7 per cent of children in the Australian Early Development Census (AEDC) were identified as being developmentally vulnerable on one or more dimensions and 11.0 per cent on 2 or more and that these are only a little down on the 23.6 per cent and 11.8 per cent recorded in 2009 (AEDC, 2020). Again, from our work on this evaluation we see scope for an important role for child care in this.
11.5 Conclusion
The Package has had an impact on affordability - delivering a significant benefit to lower and middle income families, with higher income families having to shoulder a higher proportion of their child care costs. This is consistent with the objectives of the policy. It is estimated that the CCS has reduced the net cost of child care for 62.2 per cent of families using child care when compared with previous funding arrangements. For these families the average proportion of gross income spent on child care fell from 6.7 per cent to 4.5 per cent, with annual net spending falling from $5,412 to $4,026.
Beyond this, the Package has had lesser impact. In particular, with respect to flexibility, access and employment outcomes, the evaluation found limited evidence of any marked changes. It also did not find substantive evidence to suggest that it will address the longer term issue of costs.
While there are some practical actions that can be taken to improve the operation of the program, and these are important for some families, children and services, they are relatively limited. Rather, the real challenge is in developing a clearer vision of the role of early childhood education and care in Australia, and working towards this.
References
- Australian Children's Education and Care Quality Authority. 2019. National Quality Framework Annual Performance Report. Sydney: ACECQA.
- - - - . 2020a. Quarterly National Quality Standard Data (Q3 2013 - Q4 2019), Released on 6 February 2020. Sydney: ACECQA.
- - - - . 2020b. Guide to the National Quality Framework, Released September 2020. Sydney: ACECQA. www.acecqa.gov.au/sites/default/files/2020-09/Guide-to-the-NQF-September-2020.pdf
- Australian Early Development Census. 2020. Data Explorer. www.aedc.gov.au/data/data-explorer
- Australian Government. 2017. Australian Government response to the Senate Education and Employment Legislation Committee report: Inquiry into the Family Assistance Legislation Amendment (Jobs for Families Child Care Package) Bill 2016 [Provisions] and Social Services Legislation Amendment (Family Payments Structural Reform and Participation Measures) Bill 2016 [Provisions], February 2017.
- - - - . 2018. Child Care Subsidy (What Constitutes a Session of Care) Determination 2018 www.legislation.gov.au/Details/F2018L00827
- - - - . 2020a. Family Assistance Guide, 3.5.2.10 CCS - activity test - general. guides.dss.gov.au/family-assistance-guide/3/5/2/10
- - - - . 2020b. Vacancy Report. lmip.gov.au/default.aspx?LMIP/GainInsights/VacancyReport
- - - - . 2021. Guides to Social Policy Law, Family Assistance Guide Version 1.226 - Released 4 January 2021. guides.dss.gov.au/family-assistance-guide
- Australian Healthcare Associates. 2019. Evaluation of the Connected Beginnings Program. Final Report. June 2019. Melbourne: AHA.
- Australian Institute of Family Studies (AIFS), Australian National University (ANU), Social Policy Research Centre (SPRC), and Social Research Centre (SRC). 2018. Child Care Package: Evaluation Framework. Melbourne: AIFS.
- Australian Institute of Health and Welfare. 2015. Literature review of the impact of early childhood education and care on learning and development: working paper. Cat. no. CWS 53. Canberra: AIHW.
- - - - . 2019. Australia's Welfare 2019 - Snapshot, Family Assistance Payments. www.aihw.gov.au/reports/australias-welfare/family-assistance-payments
- Australian National Audit Office. 2019. Design and governance of the Child Care Package (Auditor-General Report No. 10 2019-20). Performance Audit, Commonwealth of Australia, Canberra.
- Australian Securities and Investments Commission. 2019. Australian Insolvency Statistics. asic.gov.au/regulatory-resources/find-a-document/statistics/insolvency-statistics/
- Baxter, Jennifer and Kelly Hand. 2013. Access to early childhood education in Australia. Australian Institute of Family Studies, (Research Report 24). Melbourne: AIFS.
- - - - . 2016. Flexible child care. Key findings from the AIFS Evaluation of the Child Care Flexibility Trials. Melbourne: AIFS.
- Baxter, Jennifer, J. Rob Bray, Megan Carroll, Kelly Hand, Matthew Gray, Ilan Katz, Mikayla Budinski, Cara Rogers, Jessica Smart, Jen Skattebol and Megan Blaxland. 2019. Child Care Package Evaluation: Early monitoring report. (Research Report). Melbourne: AIFS.
- Baxter, Jennifer, Mikayla Budinski, Megan Carroll, Cara Rogers, Elizabeth Adamson, Megan Bedford, Megan Blaxland, Anna Jones, Paula Jops, Ilan Katz and Jen Skattebol. 2020. In Home Care evaluation report. Unpublished report for the Department of Education, Skills and Employment. Melbourne: AIFS.
- Biddle, Nicholas. 2007. 'Indigenous Australians and preschool education: Who is attending?' Australian Journal of Early Childhood, 32(3), 9-16.
- Birmingham, Simon. 2017. 'New measures target dodgy Family Day Care providers', Media Release, Senator the Hon. Simon Birmingham, Minister for Education and Training, Monday 27 February 2017.
- Bita, Natasha. 2015. 'Simon Birmingham flags paying for childcare by the hour', The Australian, 23 November 2015.
- Bellour, Flora, Paul Bartolo, and Mary Kyriazopoulou, Eds. 2017. Inclusive early childhood education: Literature review. Odense, Denmark: European Agency for Special Needs and Inclusive Education.
- Burchinal, Margaret, Martha Zaslow and Louisa Tarullo, Eds. 2016. Quality thresholds, features, and dosage in early care and education: secondary data analyses of child outcomes. Wiley.
- Commonwealth of Australia. 2017. Budget 2017-18 Portfolio Budget Statements 2017-18, Budget Related Paper, No. 1.5, Education and Training Portfolio. Canberra: Commonwealth of Australia.
- Commonwealth of Australia. 2019. Budget 2019-20 Portfolio Budget Statements 2019-20. Education and Training Portfolio. Canberra: Commonwealth of Australia.
- Council of Australian Governments. 2009. Protecting children is everyone's business: National Framework for Protecting Australia's Children 2009-2020. Canberra: DSS. www.dss.gov.au/our-responsibilities/families-and-children/publications-articles/protecting-children-is-everyones-business
- Council of Australian Governments (COAG). 2009. Investing in the Early Years - A National Early Childhood Development Strategy. An initiative of the Council of Australian Governments. Canberra: Australian Government.
- Dandie, Sandra and Joseph Mercante. 2007. Australian labour supply elasticities: Comparison and critical review. Treasury Working Papers No. 2007-04. Canberra: The Treasury.
- Department of Education, Skills and Employment. 2017. 'Child Care Reforms Pass Parliament', News, 10 April 2017. Canberra: DESE.
- - - - 2019a. Child Care data for December quarter 2019 - Department of Education, Skills and Employment, Australian Government. Canberra: DESE.
- - - - 2019b. Child Care Provider Handbook Version 2, June 2019 Canberra: DESE. www.dese.gov.au/download/4216/child-care-provider-handbook/6272/document/docx
- - - - 2019c. National, state and territory skill shortage information. ANZSCO 2411-11 Early Childhood (Pre-primary School) Teacher - SA. 30 November 2019. www.employment.gov.au/national-state-and-territory-skill-shortage-information
- - - - 2019d. National, state and territory skill shortage information. Ratings Summary - Labour Market Analysis of Skilled Occupations. www.employment.gov.au/national-state-and-territory-skill-shortage-information
- - - - 2019e, Child Care in Australia report: Financial year 2018-19, Technical Notes. www.dese.gov.au/key-official-documents-about-early-childhood/early-childhood-and-child-care-reports/child-care-australia-report-financial-year-2018-19
- - - - . 2020a. Child Care Safety Net. Canberra: DESE. www.education.gov.au/child-care-safety-net-1 (Accessed 30 November 2020).
- - - - . 2020b. Fact Sheet: Services Ineligible for Child Care Subsidy Approval. Canberra: DESE. www.dese.gov.au/download/4213/services-ineligible-child-care-subsidy-approval/19862/services-ineligible-ccs-approval-fact-sheet/pdf
- - - - . 2020c. In Home Care National Guidelines, Effective 2 July 2018 Revised Guidelines as at August 2020 - Version 1.6. Canberra: DESE.
- - - - . 2020d. Child Care Subsidy minimum operating periods - special circumstance requirements. Canberra: DESE.
- - - - . 2020e. 2005 Disability Standards for Education plus guidance notes. Canberra: DESE.
- - - - . 2020f. Child Care Subsidy activity test: Fact sheet. Canberra: DESE.
- - - - . 2020g. Child Care Package - frequently asked questions. www.dese.gov.au/child-care-package/ccp-resources-providers/child-care-package-frequently-asked-questions
- - - - . 2020h. Changes to the ISP Guidelines. Canberra: DESE. docs.education.gov.au/system/files/doc/other/isp_updated_guidelines_0.pdf
- Department of Education and Training. 2015a. Regulation impact statement - Jobs for families Child Care Package. Canberra: DET.
- - - - . 2015b. New Child Care Package Child Care Safety Net. www.dese.gov.au/uncategorised/resources/child-care-safety-net Canberra: DET
- Department of Education and Training. 2016. Interim Home Based Carer Subsidy Programme. Canberra: DET.
- Department of Education and Training. 2017. New Child Care Package - Key changes for services. Canberra: DET.
- Department of Education and Training. 2017b. A Guide to Special Child Care Benefit. Canberra: DET. docs.education.gov.au/system/files/doc/other/a_guide_to_special_child_care_benefit_0.pdf
- Department of Education and Training. 2018a. Fact sheet: Child Care Subsidy Activity Test, May 2018. Canberra: Australian Government.
- Department of Education and Training. 2018b. Child care services business support resource. Canberra: DET www.dese.gov.au/uncategorised/resources/child-care-services-business-support-resource
- Department of Jobs and Small Business. 2018a. Child care occupation Australia 2018. Canberra: Australian Government.
- Department of Jobs and Small Business. 2018b. Child care occupation Australian Capital Territory 2018. Canberra: Australian Government
- Department of the Prime Minister and Cabinet. 2020. Closing the gap: Report 2020. Canberra: Department of Prime Minister and Cabinet.
- Department of Social Services. 2020. Family Assistance Guide - FTB Part A - historical rates. Canberra: DSS. guides.dss.gov.au/family-assistance-guide/3/6/1
- Early Learning: Everyone Benefits. 2019. State of early learning in Australia 2019. Canberra: Early Childhood Australia.
- Fair Work Ombudsman, Children's Services Award. 2010. MA000120, 20 November 2020.
- Family Day Care Australia. 2019. Sector viability brief. uploads.prod01.sydney.platformos.com/instances/97/assets/public-pdf/Submissions-and-Briefs/FDCA_SectorViabilityBrief_online.pdf?updated=1585200197
- G8 Education Limited. 2020. Annual report 2019. Varsity Lakes (WA): G8 Education Limited.
- Hockey, Joe, Tony Abbott and Sussan Ley. 2013. 'Government announces Productivity Commission inquiry to focus on more flexible, affordable and accessible child care.' Media Release, 17 November 2013.
- IBISWorld. 2019. IBISWorld Industry Report Q8710 Child Care Services in Australia March 2019. Melbourne: IBISWorld.
- - - - . 2020. IBISWorld Industry Report Q8710 Child Care Services in Australia 1 October 2020. Melbourne: IBISWorld.
- Ley, Sussan. 2014a. 'New Taskforce to crack down on dodgy child care claims.' Media Release, The Hon Sussan Ley MP, Monday 21 July 2014.
- - - - . 2014b. 'Transcript 'The Hon Sussan Ley MP, Assistant Minister for Education, AM with Elizabeth Jackson - Child Care Compliance Taskforce', Saturday 18 October 2014'.
- Maclennan, Duncan, and Ruth Williams. 1990. Affordable housing in Britain and the United States. Joseph Rowntree Foundation, York.
- Maki, Park, Caitlin Katsiaficas, and Margie McHugh. 2018. Responding to the ECEC needs of children of refugees and asylum seekers in Europe and North America. Washington DC: Migration Policy Institute.
- Mayfield Childcare Limited. 2020. Annual Report 31 December 2019. Malvern (Vic.): Mayfield Childcare Limited.
- Melhuish, Edward. 2014. The impact of early childhood education and care on improved wellbeing. 'If you could do one thing…' Nine local actions to reduce health inequalities (pp. 33-43). London, United Kingdom: British Academy.
- National Centre for Vocational Education Research. 2021. Government funded students and courses. DataBuilder. www.ncver.edu.au/research-and-statistics/data/databuilder#gov-funded-students-courses
- National Disability Insurance Scheme. 2014. Mainstream interface: Early Childhood - Supports National Disability Insurance Scheme will fund in relation to early childhood. Canberra: National Disability Insurance Scheme.
- Niëns, Laurens M., Ellen Van de Poel, Alexandra Cameron, Margaret Ewen, Richard Laing and Werner B.F, Brouwer. 2012. 'Practical measurement of affordability: an application to medicines.' Bulletin of the World Health Organization, 90: 219-227. doi:10.2471/BLT.10.084087
- OECD. 2017. Starting strong 2017: Key OECD indicators on early childhood education and care. Paris: OECD.
- Porter, Christian. 2016. 'Second Reading Speech: Family Assistance Legislation Amendment (Jobs for Families Child Care Package) Bill 2016', 1 September 2016, House of Representatives. Canberra: Parliament of Australia.
- - - - . 2017a. 'Explanatory Memoranda, Social Services Legislation Amendment (Omnibus Savings and Child Care Reform) Bill 2017'. Canberra: Parliament of Australia.
- - - - . 2017b. 'Omnibus Savings and Childcare Reform Bill 2017, Transcript by The Hon Christian Porter MP' 9 February 2017. DSS: Canberra.
- Productivity Commission. 2014a, Childcare and early childhood learning, Inquiry Report No. 73 (Volume 2), Canberra: Productivity Commission.
- Productivity Commission. 2014b. Childcare and early childhood learning: Overview, Inquiry Report No. 73 (Overview & Recommendations). Canberra: Productivity Commission.
- PwC. 2011. A practical vision for early childhood education and care, March 2011. Melbourne: PwC.
- PwC. 2018. In Home Care Transition Project Final Report. Canberra: Department of Education and Training.
- Refugee Council of Australia. 2019. Submission into evaluation of the Adult Migrant English Program (AMEP) new business model (NBM). www.refugeecouncil.org.au/submission-into-evaluation-of-the-adult-migrant-english-program-amep-new-business-model-nbm/
- Richardson, Arna. 2019. Child care services in Australia March 2019. IBISWorld Industry Report Q8710. IBISWorld Pty Ltd.
- SCRGSP (Steering Committee for the Review of Government Service Provision). 2021. Report on Government Services 2021. Canberra: Productivity Commission.
- Services Australia. 2019. Child Care Subsidy, How much you can get. Your activity level affects it. Casual or irregular hours of work. www.servicesaustralia.gov.au/individuals/services/centrelink/child-care-subsidy/how-much-you-can-get/your-activity-level-affects-it/casual-or-irregular-hours-work
- Social Compass. 2019. Evaluation of the Adult Migrant English Program New Business Model. Carlton: Social Compass.
- Social Research Centre. 2017. 2016 Early Childhood Education and Care National Workforce Census. Melbourne: SRC.
- Tehan, Dan. 2018. 'Stamping out fraud in Family Day Care.' Media Release The Hon Dan Tehan MP, Minister for Education, Monday 17 December 2018.
- Think Childcare Group. 2020. Annual report 2019. Drummoyne (NSW): Think Childcare Group.
- Tudge, Alan. 2020. 'Legislative reforms to enhance access to English language tuition', Media release 10 December 2020. minister.homeaffairs.gov.au/alantudge/Pages/Legislative-reforms-to-enhance-access-to-English-language-tuition.aspx
- Turnbull, Malcolm, Scott Morrison, Simon Birmingham and Christian Porter. 2017. 'Responsible budget savings to fund more affordable child care for Australian families'. Media Release, 8 February 2017.
- Trudgett, Michelle and Rebekah Grace. 2011. 'Engaging with early childhood education and care services: the perspectives of Indigenous Australian mothers and their young children.' Kulumun: Journal of the Wollotuka Institute, 1(1), 15-36.
- University of Technology: Centre for Local Government. 2013. Best practice guideline for the planning and development of child care facilities final review report, September 2013.
Australian Bureau of Statistics publications and datasets
- Census of Population and Housing 2016, Microdata, (Cat. No. 2037.0), TableBuilder.
- Average Weekly Earnings Australia, (Various), (Cat. No. 6302.0)
- Employee Earnings and Hours, Australia, May 2018, (Cat No 6306.0)
- Characteristics of Employment 2020, (Cat No 6333.0), TableBuilder (set: Characteristics of Employment, 2014-2019).
- Consumer Price Index, Australia, (various and as cited),(Cat. No. 6401.0).
Legislation
- Disability Discrimination Act 1992 (Cth)
- Family Assistance Legislation Amendment (Jobs for Families Child Care Package) Act 2017 (Cth).
- Racial Discrimination Act 1975 (Cth)
Appendix 1: Evaluation process and data
A1. Evaluation design and data sources
This Chapter summarises the approach taken to the evaluation, evaluation design and data sources. The evaluation uses a mixed-methods approach to explore both the implementation of, and outcomes associated with, different elements of the Package. It draws on data collected for the purposes of the evaluation, administrative by-product data and a range of other secondary data sources including from the Australian Bureau of Statistics and ACECQA. The evaluation design reflects the multidimensionality of the goals for the Child Care Package including: affordability; access and targeting; sustainability; and ensuring that the system is simpler to understand and more flexible.
As noted in Chapter 1, the evaluation was impacted by external events, particularly bushfires and COVID-19, which resulted in the suspension of the child care funding system for a period that meant that any data from this period did not reflect the operation of the funding arrangements introduced as part of the Child Care Package. This means that the evaluation only draws on data to the end of 2019 and does not include data from 2020 as originally intended.
A1.1 Evaluation design and project management
Scope of the evaluation
The evaluation assesses the Child Care Package against the outcomes and impacts outlined in the high-level program logic developed for the evaluation (see Chapter 1). The evaluation commenced in December 2017 and was planned to be completed in June 2021.
As outlined in Chapter 1, the evaluation was guided by the Evaluation Framework that was developed by the evaluation team to meet the terms of reference for the evaluation set by DESE. The final evaluation framework was agreed with the Department.185
As described in Chapter 1, the evaluation considers the impact of the new child care subsidy system (Child Care Subsidy (CCS), Additional Child Care Subsidy (ACCS) and the Community Child Care Fund (CCCF)). It also covers the Inclusion Support Program and the In Home Care Program, which are subject to separate reporting, with findings synthesised into this overall evaluation.186
Consultation, governance and reporting
The evaluation consortium worked with DESE to identify the administrative data that would be valuable for the evaluation and in developing specifications for the administrative data to be made available for the purposes of the evaluation. The evaluation consortium established relationships with key child care stakeholders to draw on their insights about the operation and impact of the Child Care Package, and for some stakeholders to seek their support for data collection from service providers. Formal governance arrangements included meetings and consultations with the Department's Implementation Transition Reference Group, comprising representatives of peak bodies and large child care providers and the Department's Evaluation Working Group.
It was initially planned that 'interim' evaluation reports would be provided in December 2018, December 2019 and December 2020. The final evaluation report was due in 2021. As discussed in Chapter 1, COVID-19 resulted in the suspension of the child care funding arrangements introduced as part of the Child Care Package, which meant that the planned 2020 data collection would not have provided data on the impact of the Child Care Package and, therefore, the planned 2020 data collection activities did not proceed. As a result, the decision was made to not have the December 2020 report and to bring forward the final evaluation report to earlier in 2021. In addition, a series of snapshot reports are being developed for the purposes of knowledge translation on particular themes, and will draw on Departmental data and evaluation data, and are being prepared for completion in 2021.
The first 'interim' report was an early monitoring report that focused on the introduction of the Child Care Package (See Baxter et al., 2019). The second 'interim' report provided a summary of initial findings based on data available at the time of writing and was an internal report to DESE and not intended for publication.
A1.2 Data collections undertaken by the evaluation consortium
The evaluation undertook a number of primary data collection activities including surveys of services and parents; interviews with parents, services, providers and stakeholders and location-based case studies that included the experiences of services, parents and other local community stakeholders. Some of these planned activities were impacted by the bushfires and COVID 19 pandemic. These data collection activities are summarised in Table 122 and described in more detail below.
Data collections developed for the evaluation were subject to the approval of the AIFS Ethics Committee, which is a Human Research Ethics Committee registered with the National Health and Medical Research Council (NHMRC). Approval was also obtained from The Aboriginal Health and Medical Research Council of New South Wales Human Research Ethics Committee, The Human Research Ethics Committee of Northern Territory Department of Health and Menzies School of Health Research and the Australian Institute of Aboriginal and Torres Strait Islander Studies Human Research Ethics Committee.
| Data collection | Specific waves and components | Status |
|---|---|---|
| Survey of Early Learning and Care Services | Wave 1 (June 2018). | Completed |
| Wave 2 (June-July 2019). | Completed | |
| Wave 3: November to December 2020 - refocused to be used for ISP evaluation. | Initially delayed due to bushfires, then COVID-19. Repurposed for ISP evaluation. | |
| Services, providers and stakeholder interviews | Wave 1 high level stakeholder interviews complete (November 2018 to April 2019). | Completed |
| Wave 2 stakeholder interviews replaced with an online survey of stakeholders (July-August 2019). | Completed | |
| Wave 3 stakeholder interviews planned in 2020. | Not undertaken due to COVID-19. | |
| Wave 1 service/provider interviews complete (April-July 2019). | Completed | |
| Wave 2 interviews are underway, focusing on specific services (focusing on former BBFs). | Completed | |
| Wave 3 interviews planned for 2020. | Not undertaken due to COVID-19. | |
| Child Care Package Family Survey | Wave 1: (October 2018) complete. | Completed |
| Wave 2: in the field (September-October 2019). | Completed | |
| Wave 3: scheduled for first half of 2020. | Not undertaken due to COVID-19. | |
| Parent qualitative interviews | Wave 1 interviews were conducted through an online discussion board in 2019 with a broad cross-section of child care users. | Completed |
| Wave 2 interviews (face to face) with a sample of low-income families were conducted in August 2019. | Completed | |
| Wave 3 interviews with families - focus group at the SNAICC conference. | Completed | |
| Case studies | 1. Major capital: middle to outer suburban - with low socio-economic focus; also contains a high Indigenous population. | Waves 1 and 2 completed. Wave 3 planned for 2020, but not conducted due to COVID-19. |
| 2. Inner metro: CBD/inner suburbs focus. | Waves 1 and 2 completed. | |
| 3. Major capital: middle to outer suburban - with CALD focus. | Wave 1 (single wave) completed. | |
| 4. Regional: Town 1,000-5,000 people with significant (≈20 per cent) Aboriginal population. | This single wave case study was scheduled for 2020 but due to COVID-19 was not conducted. | |
| 5. Regional: Town 5,000-10,000 with significant (≈10 per cent) Aboriginal population. | This single wave case study was scheduled for 2020 but due to COVID-19 was not conducted. | |
| 6. Middle metro: Middle income with significant preschool provision and established NDIS services for children. | Wave 1 (single wave) completed. | |
| 7. Outer metro: Middle income with significant Indigenous and CALD population. | Wave 1 completed. A planned second wave was not conducted due to COVID-19. |
Survey of Early Learning and Care Services
The Survey of Early Learning and Care Services (SELCS) is a longitudinal survey of managers or directors (or equivalent) of a sample of child care services. Wave 1 was conducted in June 2018 (2,808 responses) and Wave 2 in June-July 2019 (2,104 responses). The surveys collected largely quantitative data, with some open-ended response questions. Survey weights are used to provide population estimates for the child care sector and open text responses analysed using qualitative methods.
A third wave of the survey was originally planned for early 2020 but was first delayed due to the bushfires and then as a result of COVID-19. In November 2020, the third wave of the survey was undertaken with a focus on the ISP rather than the Package as a whole and is not reported on here.
Services, providers and stakeholder qualitative interviews
This qualitative component involved interviews with services, providers and other child care sector and community stakeholders. The methodology involves a mix of longitudinal and cross-sectional data collection. It was also supplemented with an online survey of stakeholders. All interviews were semi-structured, with topic guides designed to prompt for discussion about issues relevant to the evaluation outcomes and impacts.
A total of 25 interviews (involving 58 participants) were conducted with child care stakeholders between November 2018 and April 2019. To tap into a wide range of stakeholders, the second wave was undertaken as an online (largely qualitative) survey from late June to early August 2019. Complete responses from 32 stakeholders were received.
For services and providers, Wave 1 sought input from a broad cross-section of the sector. Interviews were conducted with 23 services (30 participants) between March 2019 and July 2019. Wave 2 involved data collection from former Budget Based Funded services from September to December 2019. Participants included 13 former Budget Based Funded services, 3 professionals providing support services to Aboriginal and Torres Strait Islander families and one child care service that was previously funded via Child Care Benefit (CCB) but provided services exclusively to Aboriginal and Torres Strait Islander families.
While additional interviews with stakeholders were planned for 2020, they were not undertaken due to bushfires and COVID-19.
Child Care Package Families Survey
The Child Care Package Families Survey (CCPFamS) was an online longitudinal survey, with the sample drawn from consenting participants in the June 2018 DESE/ORIMA Parent Survey who were child care users as of May 2018.187 Wave 1 was conducted in November 2018. The second wave follows up this sample, plus tops up with child care users from the June 2019 ORIMA Parent Survey. Wave 2 was conducted September-October 2019. Wave 1 has a final sample size of 502 participants. Wave 2 has a sample size of 563 (396 from the new cohort and 167 from the original cohort).
While the survey largely comprises closed questions, the survey provides many opportunities for participants to write about their circumstances and experiences. This is used to identify common issues that emerge, and to identify and report specific quotes that usefully illustrate findings from this survey or from analysis of other information sources.
Parent qualitative data collection
This component of evaluation data collection involved qualitative data collection with parents. Interviews (by phone or face to face), online forums and focus groups were planned for collection of this data. Overall, this component was designed to allow for some flexibility, so data could be collected from parents as issues emerged during the evaluation. The following qualitative data collections were completed:
- a discussion board focusing on a general population of child care users
- interviews with a sample of low-income parents
- a focus group with parents/carers at the SNAICC conference.
Data was analysed to determine common themes, issues or experiences that emerge in the data, against specific questions explored in each data collection, and against the broad outcomes and impacts.
Case studies
As described in Table 122, 5 case studies were undertaken (either partially or fully completed) and 2 did not proceed due to COVID-19. Case study sites were selected on the basis of their importance to the overall understanding of the impact of the Child Care Package on particular populations of interest and in a range of different geographical and demographic contexts, particularly vulnerable and low-income populations that are the focus of many of the provisions in the Package.
The case studies are designed to provide detailed information about how the local ecology of services interacted with each other and other programs (such as state funded preschools and the NDIS), and how the labour market and demographics interacted with each other in relation to the Child Care Package in different geographic, demographic and economic contexts. This was achieved by using multiple sources of data about the local market and the factors determining outcomes such as flexibility of provision, perceived viability of services and how the local child care offerings influenced the decisions of parents to engage with different forms of child care and, in turn, their decisions to participate in the workforce and/or in community activities.
They also provided insight into how this combination of factors affected the way parents from different groups engaged with the local child care offerings. The case studies were used to look at interactions and contradictions between different parts of the Package and to reveal unintended consequences or perverse incentives as they play out in local contexts. Findings from the case studies were informed by and triangulated with findings from other parts of the evaluation and are woven throughout this report.
Each case study involved:
- Site selection, mapping of the site, its population and services using Census, Australian Early Development Census (AEDC), and web searches for local services, for example consulting a directory of local services for children developed by the council.
- Qualitative interviews with services, families and stakeholders with knowledge of children's services in the local area. These interviews used a semi-structured approach, with participants having been recruited via a number of means. Participant numbers varied across case studies.
- Interviews voice recorded with the permission of each participant. Transcripts of these interviews were analysed thematically to identify how different aspects of the Child Care Package were experienced by different groups.
The major capital: middle to outer suburban case study examines a low income area in an outer metropolitan location that also has a significant Aboriginal population. It provides insights into how provisions such as the activity test are impacting low income families and the local market in this context.
The inner-metropolitan: CBD/inner suburbs focus case study was designed to focus on the provision of child care in a relatively high income CBD environment. Some of the characteristics of this type of environment are likely to be: higher costs for services including rents and potentially higher costs to attract staff given higher wage rates in the location, a higher proportion of parents being dual income, working full-time and having higher earnings, in some cases the service will have been chosen for its proximity to employment rather than home. At the same time, there may be some lower income parents. The study examines how the local market has adapted in terms of fees and length of sessions.
The major capital: outer-suburban with Culturally and Linguistically Diverse (CALD) focus case study is primarily on the experiences of children from a CALD background. The case study explores the capacity of services to meet the needs of CALD children, including responding to the diversity of CALD groups, and how the parents of these children navigate the child care system. It also explores the role of child care for these families including enabling participation in employment and other forms of participation.
The middle income with significant preschool provision and established NDIS services for children case study provides insights into the impact of the Package on middle income families - the main users of child care. It also explores the interaction with state funded preschool and other policy areas such as NDIS.
The outer metropolitan middle income with a significant Indigenous and CALD population case study complements the other urban locations by focusing on an area that was developed as a satellite city, but with close integration with the main urban area of the rest of the city. It has a mix of middle and lower income earners and quite high workforce participation. The location also has both significant Aboriginal and CALD populations. These, as well as the urban growth of the location, make it a contrast with the other urban locations.
A1.3 DESE/ORIMA Parent Survey
This survey was designed to be the major source of data from parents for the evaluation, as well as being used to collect information for the Department on the program and related early childhood education and care subjects. The data was provided to the evaluation by the Department, which designed and managed the survey. The Department commissioned ORIMA Research Pty Ltd to undertake the survey. The survey was conducted twice-yearly, starting with a baseline survey in June 2018. The survey design involves a larger sample size in the first half of 2018, 2019 and 2020 (involving a mix of online and telephone interviews) and an online-only survey in the second half of 2018 and 2019. Given the impacts of COVID-19, the early 2020 survey did not proceed, and this report draws on data from the June 2018, November 2018, June 2019 and November 2019 surveys.
For each survey, child care users were sampled from Department administrative data with non-users sampled from an online panel. The November 2019 survey was only directed to child care users. The final sample numbers for each of the surveys were 6,189 in June 2018, 845 in November 2018, 5,186 in June 2019 and 2,265 in November 2019.
The survey captures a range of quantitative data including parents' experiences of child care. The types of data captured through the surveys include (with some variation across waves):
- respondent and partner's employment and activity status
- use of, and views on, paid child care
- use of, and views on, early childhood education (ECE)
- use of, and views on, unpaid child care
- understanding of the child care system, including sources of information about child care services and government fee assistance
- attitudinal questions related to career, child care and family
- demographic characteristics.
The weighted confidentialised unit record data files from the surveys were provided to the evaluation team by ORIMA Research Pty Ltd. These unit record files were used for this report, with all estimates weighted. Due to different analytical approaches, there may be some differences between estimates reported here and those reported by ORIMA to DESE from the same data sources.
Implications of COVID-19 for the data available for the evaluation
As discussed, due to COVID-19, data collection activities planned for 2020 did not take place. The key limitations are:
- Information from services that would have been collected in Wave 3 of the SELCS and qualitative interviews with the survey could not be collected. This impacted our ability to obtain data about the slightly longer-term service system experiences of changes.
- The 2 case studies to be conducted in smaller regional towns including the area with a relatively large Aboriginal and Torres Strait Islander population limited, to some extent, the evaluation of the impact of the Child Care Package in these types of areas and for Aboriginal and Torres Strait Islander families.
- Data from parents was only available up to about 18 months after the changes and not, as planned, about 24 months after the changes.
A1.4 Administrative data
Two key sources of administrative data were used in the evaluation. The main source of administrative data is from the child care system, referred to as DESE administrative data in this report. The second key source is administrative data from the Family Tax Benefit system, referred to as DSS administrative data. The administrative data used in the evaluation is for the period beginning 2017 to end 2019, and thus provides data before and after the introduction of the Child Care Package.
It is important to bear in mind that because the administrative data is drawn from systems that are designed for the administration of payments rather than being designed for research and evaluation purposes, while this data is very extensive and very valuable for the evaluation, it does have limitations from an evaluation perspective. Some of the key limitations are discussed below. In addition, a challenge in using the administrative data for the evaluation is that much of it is drawn from 'live' datasets with many revisions, which means that data from the past can be revised as further information is provided to government departments and thus version control and benchmarking of the data is critical.
DESE administrative data
The backbone to the administrative dataset used in the evaluation is weekly data on child enrolments in child care including information on the amount and type of child care subsidy payments received, hours of child care paid for, family income, a limited range of family characteristics and characteristics of the child care services that the child used. The weekly data includes common child, parent and service level identifier variables, which enables records to be linked across weeks creating a longitudinal dataset. Because it is possible to link child to parent and child to service the dataset is hierarchical and analysis can be undertaken at the child, family or service level. In addition to a unique service identifier, the data includes a unique identifier for services that are part of a broader provider organisation, this was used to derive information such as size of provider.
A child may be represented more than once per week if they either are enrolled in more than one child care service in a particular week or have more than one enrolment identifier, which may occur if child care fees are being paid by more than one parent (e.g. in the case of separated parents). The combined 2017-19 dataset includes 170,486,950 records.188 A quarterly dataset (March quarter 2017 (Q1 2017) to December quarter 2019 (Q4 2019) was constructed from the weekly file and this is also used in the evaluation.
Data on all sessions of care reported by services to DESE (i.e. individual children's attendance and charging) was also used. This dataset provides information on date of session (from which day of week is obtained) and start and end time of each session. Due to the large size of this dataset, it was provided for all services for a reference fortnight around the mid-point of each quarter for the period after the introduction of the Child Care Package (i.e. from July 2018). The fortnight for which data was extracted was chosen to avoid public holidays and school term breaks in all states to provide a 'typical fortnight'.189 This dataset is matched onto the weekly child enrolment dataset. In addition, the sessions of care dataset provided for the August 2019 and November 2019 fortnights also included fees charged for each session record, so that analysis could be done to derive hourly fees charged according to session lengths.
At the end of the financial year an income reconciliation process takes place involving data from customers' tax returns. Annual reconciled income for the 2017-18 and 2018-19 financial years was provided for customers for whom reconciled income was available at the time of extraction of this data for the evaluation. The reconciled income data is matched onto the weekly child enrolment longitudinal dataset.
Australian Children's Education and Care Quality Authority (ACECQA) data on child care quality, measured at the service level, was linked to the weekly child enrolment longitudinal dataset.
The introduction of the Child Care Package involved changes to the DESE administrative data due to changes in the policy that resulted in some changes to the information required to administer the child care payments system and due to changes to the underlying IT system. Key changes that have implications for the comparability of the administrative data from the perspective of the evaluation include:
- Prior to the Package, the DESE administrative data related only to those that had applied for child care assistance (CCB and/or CCR). Post the introduction of the Package the DESE administrative data includes details of all children enrolled in child care, regardless of whether they received a child care subsidy.
- Changes to some demographic variables (including Aboriginal and Torres Strait Islander classification190 and single/couple family status191) due to changes in the source or derivation of information feeding into these variables. This also included whether one or both the customer and their partner speak a language other than English.
- Changes in the information collected about parental activity.
- Data from July 2018 includes more detailed information on child care being charged for including the total number of sessions in a week, as well as the number of individual days over which child care was charged.
- From January 2019, the administrative data includes the total weekly number of hours a child attended child care. The requirement to report hours of attendance was one of the changes introduced as part of the Child Care Package. It was initially planned to be part of the transition in July 2018, but the deadline was pushed back, with services required to report this information as part of session reports from mid-January 2019. There was, nevertheless, some lack of confidence in the quality of the attendance data in the initial months of 2019, with advice to be more confident in this data from March 2019.
- The inclusion of children enrolled in services that were formerly Budget Based Funded services in the DESE administrative data. Prior to this, these children were outside the child care subsidy system and not in the DESE administrative data. Some services with highly vulnerable populations (in particular, former Budget Based Funded services) relayed experiences of having some families using child care at their service without being formally enrolled in the IT system. It is expected that the numbers affected by this would be small.
- Service location information, including state/territory, remoteness, postcode and SA2 code, which allows linkage to other Australian Bureau of Statistics geographic information.
DSS administrative data
Data from the Family Tax Benefit (FTB) administrative data system for the period beginning 2017 to end 2019 was made available for the evaluation (referred to as Department of Social Services (DSS) administrative data). This dataset is constructed from a series of quarterly snapshots and includes the records of all Family Tax Benefit (FTB) recipients on the DHS system who were eligible for FTB Part A and/or FTB Part B as at the dates of extractions for each file (the last Friday of each quarter).192 For each quarter there is a customer file and a child file. As with the DESE administrative data, children may have more than one record if they are attached to more than one customer.193
The customer data file includes information on demographic characteristics of the customer (more detailed than those available in the DESE administrative data), information about the customer's partner, estimated taxable income (customer and partner), amount of FTB received and whether eligible to receive income support, and if so whether it was full- or part-rate along with its type. The child datasets include variables for the child's age, date of birth, codes for any medical conditions, relationship to the DSS customer (their parent or carer), and shared care percentage (in the case of separated parents).
The child and parent identifiers in the child care system administrative data are consistent with those used in the Family Tax Benefit (FTB) administrative data. This allowed matching of the DESE and DSS data. The linked DESE and DSS administrative data file is primarily used to undertake the characteristics associated with participation and non-participation in child care and to allow analysis for a wider range of family/child characteristics than is available from the DESE administrative data, including for the analysis of vulnerable families.
The linked DESE and DSS administrative dataset comprises between 2,786,698-2,868,598 records per quarter. Just over half (51.7 to 55.7 per cent), in each quarter, are records just in the DSS data (so in receipt of FTB, but children not in child care or, prior to July 2018, not receiving child care assistance). Overall, 26.9 per cent were in the DESE administrative data but not the DSS administrative data and 19.2 per cent were in both the DESE and DSS administrative data.
Limitations of the administrative data
While extensive administrative data was made available for the evaluation, there were, however, some gaps and limitations. Some of these are due to the fact that the data is administrative by-product data and some as a result of what data was made available for the evaluation. The key gaps are:
- family level data on child care debt not available including due to income reconciliation and no data available on activity related debt
- no data on exemptions to the activity test
- detailed activity data. Data was provided on hours and start/end dates of detailed activities undertaken (e.g. employment, study, volunteering) but this was missing for a substantial proportion of single parents and thus could not be used for the evaluation.
- detailed attendance data
- detailed geographic information on where families lived. As a result, the geographic location of services attended by children is used.
- detailed data on sessions of care. While some of this has been derived from the detailed snapshot sessions data, this was not available prior to the Package nor continuously over the period. Similarly, the number of days of care used per week is only available post-Package.
Furthermore, as administrative by-product data, it is impacted by operational aspects of the program. A number of these, which have been noted in the analysis, are:
- While we have treated the child CRN as identifying a child we recognise that in some cases a child's CRN does change over time, and that in analysis this would be seen as 2 separate children.
- There is no data on actual commencements and cessations of services. This is rather imputed from the commencement or cessation of claims.
- In analysis, provider CRNs have been used to analyse issues such as concentration. It is understood that in some cases a corporate entity may, in fact, while being effectively a single provider, have several registrations, for example by state.
- Pre-Package identification of family status was only derived and was relatively poor and has largely been excluded from analysis.
- There was a major shift in the classification of children as being Aboriginal and/or Torres Strait Islanders in July 2018.
- It is noted that some variables, such as activity test data, are sourced from a database that is only updated from the 'live' system periodically, and hence may not necessarily be current.
A1.5 Other data sources
Data from a range of other data sources is used in the evaluation. These are:
- Departmental program specific administrative and operational data including:
- CCCF data. Detailed data was provided on the CCCF restricted and CCCF open grants. This data was used to flag former Budget Based Funded services, and to flag services receiving grant funding.
- In Home Care program data. Detailed data was provided for the evaluation of the In Home Care program. Some broad numbers from this program data are included in this report.
- The Life in Australia (LinA) Survey that provides data on parents with child care aged children. The LinA Survey is a panel survey conducted by the Social Research Centre. It is based on random probability-based sampling methods and comprises both an online and offline populations. In July and August 2018 (Waves 18 and 19) the survey contained a number of child care questions relating to the introduction of the Child Care Package.
- Various Australian Bureau of Statistics data sources including the Labour Force Survey, Survey of Employee Earnings and Hours, Australian Census of Population and Housing, Survey of Income and Housing and Consumer Price Index data.
185 The evaluation consortium also played a supporting role in providing advice to the relevant program areas within DESE on the Post Implementation Reviews and in providing advice to DESE on the development of the Department's Early Monitoring Strategy. These activities are distinct and separate from the evaluation of the Child Care Package, which is the subject of this report.
186 An interim ISP evaluation report was delivered in 2019 and the final report will be completed in 2021. An interim evaluation report for the In Home Care program was delivered in 2019 and the final evaluation report delivered in 2020.
187 The non-users of child care surveyed in the DESE/ORIMA surveys were recruited via an online panel.
188 There are 86,151,381 records for the period January 2017 to June 2018 and 81,335,569 records for the period July 2018 to December 2019.
189 The compiled dataset across these fortnights included 47,613,913 records, which represented around 4,000,000 records per week.
190 From July 2018, the Indigenous status of the child was defined as either the customer or their partner identifying as Aboriginal or Torres Strait Islander, as recorded in the Services Australia data, whereas prior to this, only customer Aboriginal or Torres Strait Islander status was used. It is also important to note that administrative data does not record the child's Indigenous status, but rather this is inferred from whether their parents are Aboriginal or Torres Strait Islander. In the post July 2018 data, for single parent families, only the customer's Indigenous status is taken into account, making this particularly likely to undercount Indigenous children. Aboriginal and Torres Strait Islander children living with non-Indigenous foster carers would not be counted. Furthermore, Aboriginal or Torres Strait Islander people may choose not to self-identify to Services Australia/Centrelink. The variable used to identify Indigenous families is linked to the child care data via the anonymised version of the Customer Reference Number (CRN). If a family is not fully enrolled or is not accessing CCS they may not have a CRN, so this variable will not be linked. We note also that using this data to analyse child care participation by Aboriginal and Torres Strait Islander children is also complicated by the inclusion of former BBF services in the data from July 2018. As these services are predominantly focused on providing care to Aboriginal and Torres Strait Islander children, this is important to consider in comparing to pre-Package data, when these services were not included in the administrative data.
191 Whether the family is a single or couple parent family is determined by whether there is partner income recorded on the file. In the data relating to pre the Child Care Package, the partner income was recorded as being zero. This included both single parents who did not have a partner and couples in which the partner actually had an income of zero. This issue was not present in the data post the introduction of the Child Care Package. In the pre Child Care Package dataset 29 per cent of the families in the dataset were classified as single parents, which is higher than approximately 20 per cent in the data relating to July 2018 onward. Analysis of the underlying data indicates that the undercount in the new data (or overcount in the old data) was most prevalent among parents in the DESE administrative data but not the DSS FTB administrative data. However, for parents in the FTB data, there is a good match in all datasets, before and after transition, between relationship status as derived in DESE administrative data and DSS administrative data. Care therefore needs to be taken when analysing changes in child care patterns, by relationship status, for those families that are not accessing FTB.
192 DSS advice is that FTB recipients who choose to receive their FTB entitlement after the end of the entitlement year (i.e. they are paid through a lump sum payment) are excluded from this population. The number of these 'lump sum' recipients varies between the different entitlement years but on average they have accounted for approximately 6 per cent of all FTB entitled recipients.
193 The number of records per quarter in the customer-level dataset varied between 1,354,450 and 1,502,146. Overall, the combined 2017-19 dataset included 17,232,945 records at the customer level, including 8,884,275 for January 2017 to June 2018 and 8,348,670 for July 2018 to December 2019.
This evaluation was commissioned by the Australian Government Department of Education, Skills and Employment (previously the Department of Education, Department of Education and Training).
The authors would like to acknowledge and thank all of those who participated in or assisted with the early stage of the evaluation, including families and services as well as representatives of peak bodies and other organisations with an interest in the Child Care Package.
We also acknowledge the helpful assistance of staff from the Australian Government Department of Education, Skills and Employment for their continuing collaboration, guidance and support.
This report was reissued in December 2022. The authors made a number of corrections to values in Table 3.
Research team
Australian Institute of Family Studies
Jennifer Baxter, Mikayla Budinski, Megan Carroll, Kelly Hand, Cara Rogers, Jessica Smart and Diana Warren
Australian National University
J. Rob Bray, Matthew Gray, Richard Webster and Ben Phillips
Social Policy Research Centre
Elizabeth Adamson, Megan Blaxland, Anna Jones, Ilan Katz and Jennifer Skattebol
Megan Bedford (Social Policy Research Centre), Marie Delany (Social Policy Research Centre) and Pam Muth (Social Research Centre) have provided valuable research assistance.
Fieldwork
The fieldwork for the Survey of Early Learning and Care Services (SELCS) was conducted by the Social Research Centre. The fieldwork team was managed by Leon Head (Wave 1), Alexa Polichroniadis (Wave 2) and Eugene Siow. Additional qualitative data collection with parents was also undertaken by the Social Research Centre.

Featured image: © Gettyimages/liderina
Bray, J. R., Baxter, J., Hand, K., Gray, M., Carroll, M., Webster, R., Phillips, B., Budinski, M., Warren, D., Katz, I., Jones, A. (2021). Child Care Package Evaluation: Final Report. (Research Report). Melbourne: Australian Institute of Family Studies.
978-1-76016-229-0
28 February 2022
Download Research report
Related publications

In Home Care Evaluation Report
This final evaluation report for the IHC program draws on data collected about IHC up to February 2020.

Child care and early childhood education in Australia
What types of childcare are Australian parents choosing for their children?

Child Care Package Evaluation: Early monitoring report
This early monitoring report is the first formal evaluation of the Commonwealth’s Child Care Package.