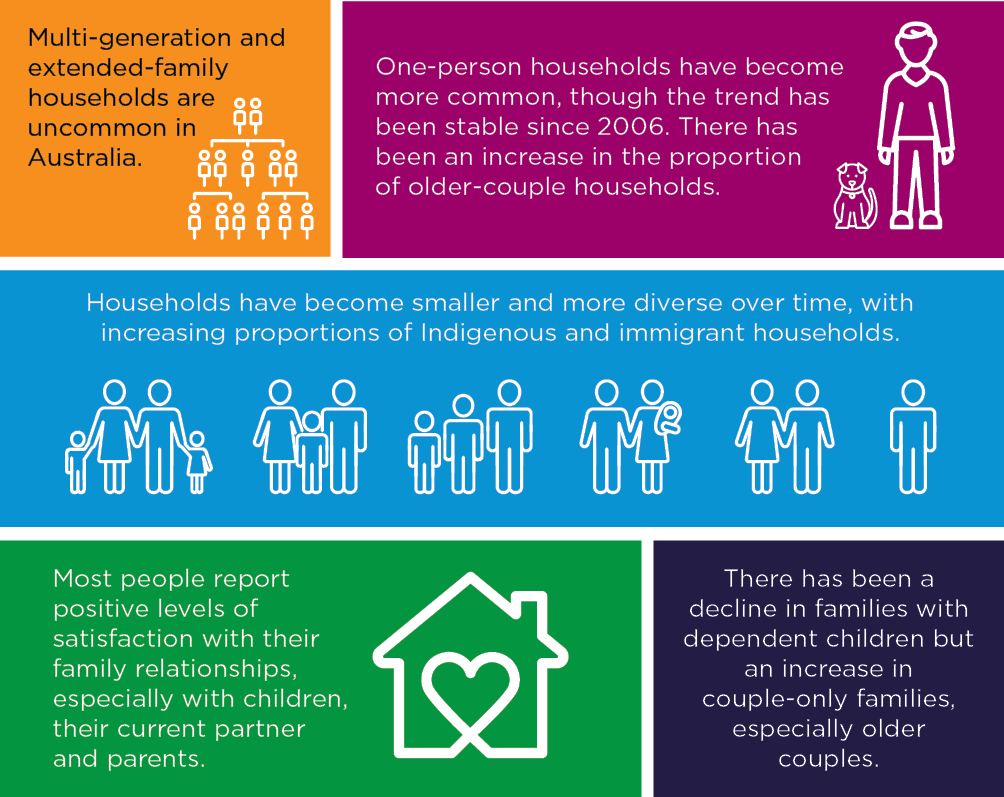
Families Then & Now: Households and families

Since the establishment of the Australian Institute of Family Studies (AIFS) in 1980, Australian families have undergone profound changes. AIFS is releasing a series of snapshots to outline some of the changes in Australian families over the last four decades. This snapshot focuses on some changes relating to Australian household and family forms.
This snapshot draws on census data extensively and uses the definitions for household and family by the Australian Bureau of Statistics (ABS). ABS defines a household as 'one or more persons, at least one of whom is at least 15 years of age, usually resident in the same private dwelling' and a family as 'two or more persons, one of whom is at least 15 years of age, who are related by blood, marriage (registered or de facto), adoption, step or fostering, and who are usually resident in the same household' (ABS, 2016) (see Appendix for definitions of different forms of households and families used in the 2016 Census). A family household is a household with a family (or more than one family) and some households may not contain family members
Key trends
Trends in households and families
Households become smaller
According to the 2016 Census, there were 8,286,000 households in Australia.1 Households are deliniated into three basic forms - those that comprise families where members are related by blood or relationship, individuals living alone, and groups of unrelated persons. Family households made up the majority of Australian households. Just under one in four households was occupied by one person. Only 4% of households represented groups of unrelated persons. A household may contain more than one family, though such multiple-family households were uncommon, with less than 2% of households with two or more families.
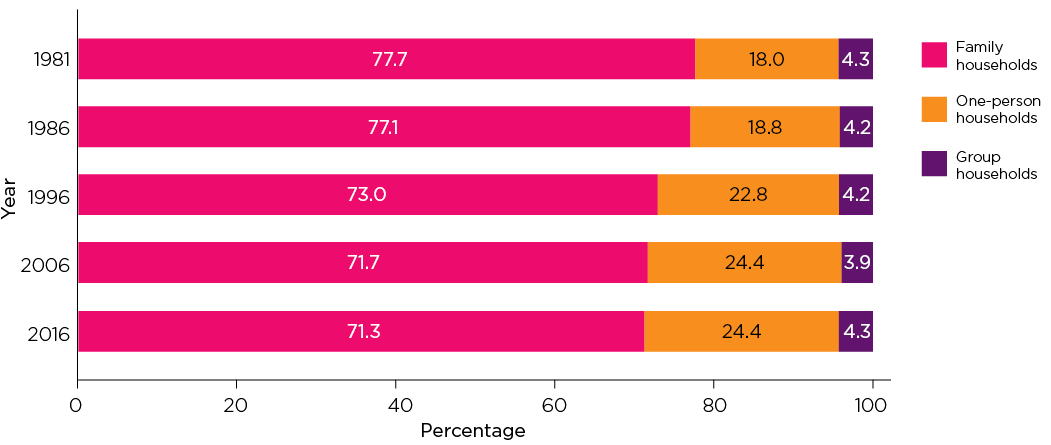
Figure 1 shows the proportion of these household types since 1981.
- While family households have remained predominant over the last few decades, their prevalence declined between 1981 and 2016 (from 78% to 71%).
- One-person households increased from 18% in 1981 to 24% in 2006 and have since remained stable.
- The proportion of households occupied by a group of unrelated persons has changed little.
- Most of the change in the proportion of family and one-person households took place during the period between 1981 and 1996.
Figure 1: Household types, 1981-2016
Notes: (a) Data for 1981 were derived from 1981 Census 1% Household sample file. (b) In 1986, household membership was based on the household in which the person happened to be residing on the night of the Census rather than on the household in which the person usually resided. (c) In 1996, 2006 and 2016, households were classified according to 'usual residence' for up to three residents of a household who were temporarily absent on Census night. (d) 'Visitors only' and 'other non-classifiable' households were excluded in the 2006 and 2016 data.
Sources: ABS 1981, 1986, 1996 and 2016 Censuses
Credit: Australian Institute of Family Studies 2020
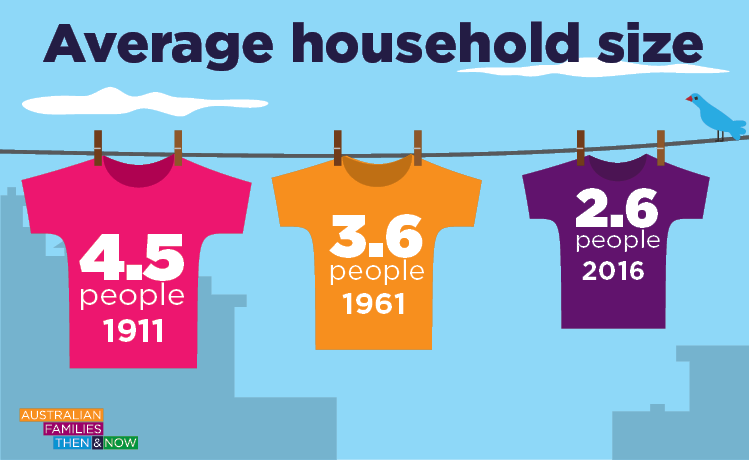
The average household size declined from 4.5 in 1911 to 3.6 in 1961, and to 2.6 in 2016 (Figure 2).
Figure 2: Average household size, 1911-2016
Credit: Australian Institute of Family Studies 2020
Despite the overall decline, household size has changed little since 2001 (Figure 3).
Figure 3: Average household size, 1911-2016
Sources: Hugo, G. (2002). A century of population change in Australia. In Australian Bureau of Statistics (Ed.), 2001 Year Book Australia, No. 83, Cat. No. 1301.0. (pp. 169-210). Canberra: ABS. ABS 2011 and 2016 Censuses - Time Series Profile (Catalogue No. 2003.0).
Credit: Australian Institute of Family Studies 2020
Increase in Indigenous households
Figure 4 shows that the proportion of households which had at least one member who was of Aboriginal and/or Torres Strait Islander origin has steadily increased. Less than 1% of households were Indigenous in 1981; the proportion rose to over 3% by 2016. This trend is consistent with the increasing representation of Indigenous people in the Australian population (ABS, 2017c).
Figure 4: Households with Indigenous members as % of all households, 1981-2016

Notes: Data for 1981-1996 were derived from a 1% household sample file of each census period, using the most recent definition. For 2001, the definition of Indigenous household differed from other years (see the Appendix).
Sources: ABS 1981-1996 Census 1% of household sample files; ABS 2006-2016 Census Community Profile Series - Indigenous Profile
Credit: Australian Institute of Family Studies 2020
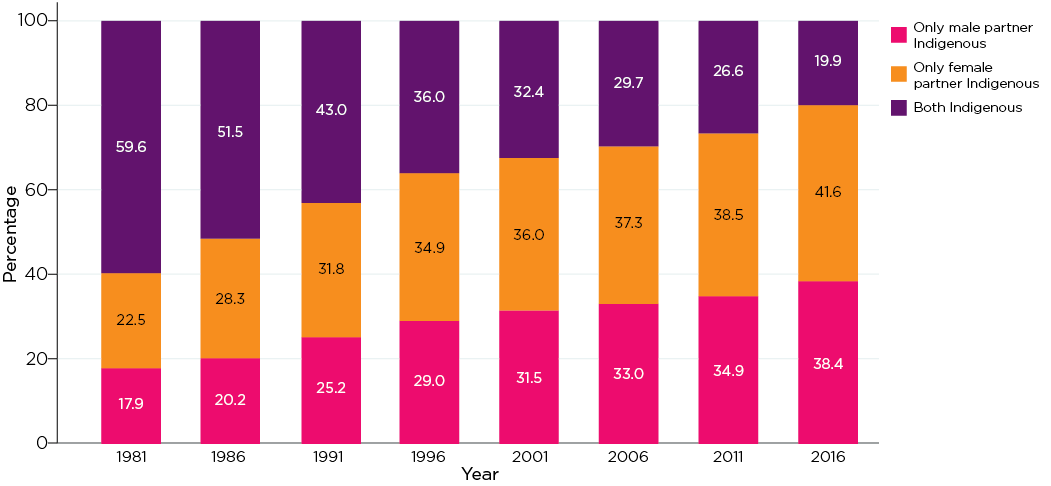
Figure 5 focuses on couples where at least one partner was of Indigenous origin and shows the Indigenous status of each partner.
- There has been a decline in the proportion of Indigenous couples where both partners were of Indigenous origin. Indigenous couples with both partners identifying as Indigenous were in the majority in 1981, while they accounted for one-fifth of Indigenous couples by 2016.
- Couples where one partner alone identified as Indigenous have increased.
- Across all census years depicted in the chart, the proportion of Indigenous couples where only the female partner was Indigenous was higher than couples involving only a male of Indigenous origin.
Figure 5: Indigenous couples showing Indigenous status of each partner, 1981-2016
Sources: ABS 1981, 1986 and 2016, Census 1% of household sample files; ABS 1991-2011 Customised census tables
Credit: Australian Institute of Family Studies 2020
More immigrant households
Over the last four decades, Australia has become a more multicultural society, with an increasing proportion of the population born overseas, and with Asian countries becoming key sources for immigrants (ABS, 2020). Figure 6 presents proportions of household reference persons by their country of birth.
- The proportion of households with reference persons born in Australia had declined from 72% in 1981 to 62% in 2016.
- In 1981, UK and Ireland were the largest group of immigrant households (based on household reference persons) (11%), while household reference persons from Southern, Eastern and Southern-Eastern European countries were the second largest group (9%). The proportions of these two groups had fallen to 6% and 4% respectively by 2016.
- In 1981, few households had reference persons from Asian countries. Such households accounted for less than 2% of Australian households (three Asian regions combined). By 2016, the percentage of households with reference persons from the Asian regions had risen to 11%, with similar proportions across the three groups (4% from South-East Asia, 3% from South and Central Asian and 3% from North-East Asia).
- The proportions of households with reference persons from New Zealand, the Middle East and North Africa, and Sub-Saharan Africa also increased. The percentages of these three groups households ranged from 1% to 3% in 2016.
Figure 6: Proportion of household reference persons born in Australia and other countries, 1981-2016
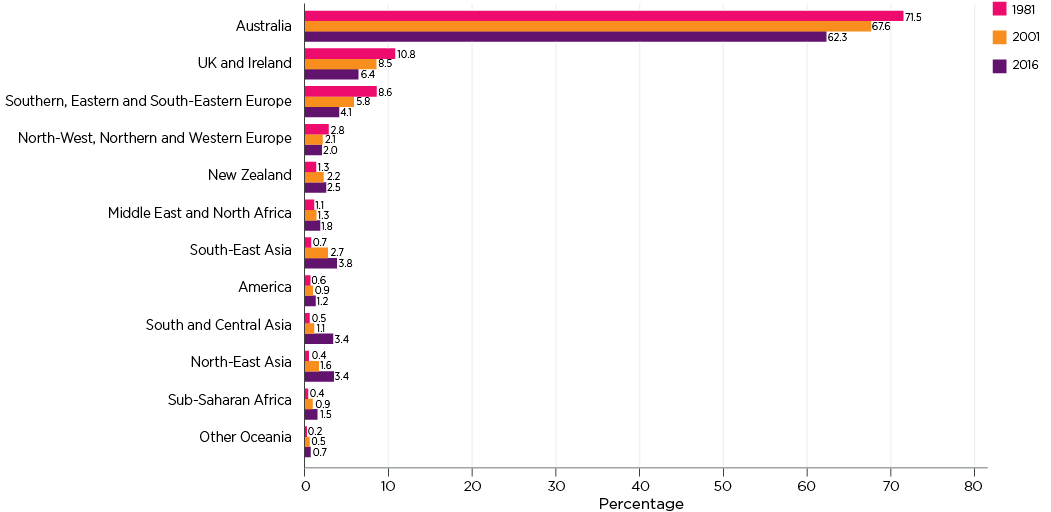
Sources: ABS 1981, 2001 and 2016 Census 1% of households sample file
Credit: Australian Institute of Family Studies 2020
Extended family households - uncommon but increasing
Figure 7 focuses on four types of family households with related and unrelated adults (excluding one-person households and group households), and their proportion of all family households, between 1991 and 2016:
- family households with three generations (parents, children of any age, grandparents)
- family households with other extended family members (e.g. uncle, aunt, cousin, siblings)
- family households with unrelated persons
- family households with adult children aged 25 years and older.
Note that these four types of family households are not mutually exclusive.
- Households with three generations or other relatives, households with adult children over 25 years, and unrelated-person households were uncommon in Australia when considering their total proportion of all family households. These four types of family households contributed to 16% of all family households in 1991 and 20% in 2016.
- Households with three generations (i.e. parents, children and grandparents) were uncommon across the census years between 1991 and 2016. This living arrangement increased from 3% to 5% of all family households from 1991 to 2016.
- The proportions of family households with other extended relatives and unrelated persons had little change over time.
- Families with adult children aged 25 years and older increased slightly between 1991 and 2016, from just under 7% to 9%.
Figure 7: Extended family households, 1991-2016

Note: The four groups are not mutually exclusive and the sum may exceed 'All'.
Source: ABS 1991-2011 Customised census tables
Credit: Australian Institute of Family Studies 2020
Living with extended family members is relatively more common in some cultural groups. Figure 8 shows the proportion of family households with extended family members by country of origin of household reference persons. Extended family living arrangements were particularly high among households from the following cultural backgrounds: South-East Asia, Chinese Asia, Other Oceania and Antarctica (i.e. excluding Australia and New Zealand) (e.g. Papua New Guinea, Tonga, Samoa), and Southern and Central Asia (e.g. India, Sri Lanka, Georgia, Armenia).
Figure 8: Proportions of family households with extended relationships by region/country of birth of household reference persons, 2016
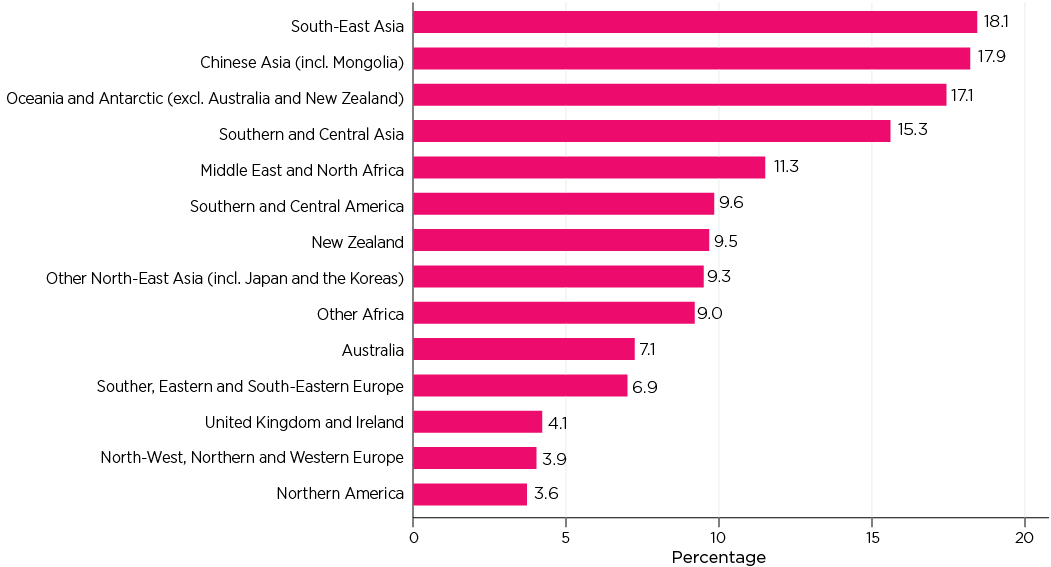
Source: ABS 2016 Customised census tables
Credit: Australian Institute of Family Studies 2020
Decline in couple families with children
According to the 2016 Census, there were 6,070,000 families in Australia. Most of these families represented couples without children (37.8%) and couples with dependent children (36.8%). One-parent families with dependent children accounted for 10.2% of all families. The remainder were couples with non-dependent children only (representing 7.9% of all families), one-parent families with non-dependent children only (representing 5.6% of all families), and 'other families' (1.7%).
From 1976 to 2016, Figure 9 shows:
- The proportion of couple families without children increased.
- The proportion of couple families with children decreased - a trend that applied to both those with dependent children and those with non-dependent children only.
- In families with dependent children, the percentage of couples with children declined, and one-parent families increased substantially. The rise in the one-parent families are mainly due to the rise in divorce and the increase in cohabiting relationships, which are less stable than marriage (de Vaus 2004; Hayes, Weston, Qu, & Gray, 2010).
- It is worth noting that the trends in families during the period 2006-16 were largely stable compared to the previous decades.
Figure 9: Family types, 1976-2016
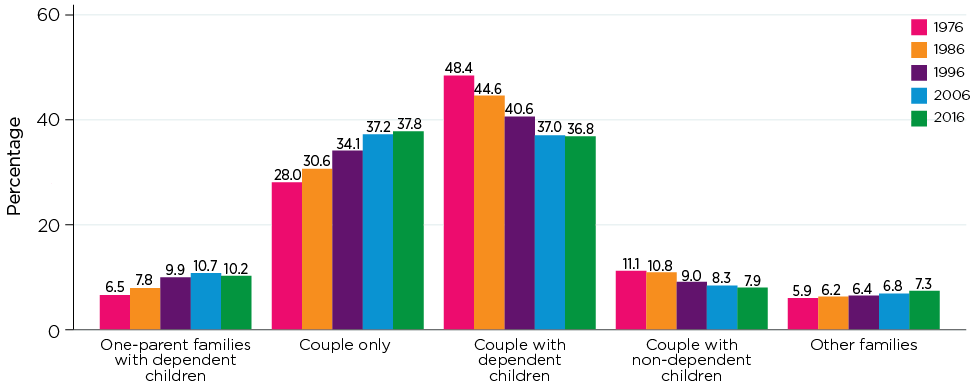
Note: Other families include one-parent families with non-dependent children.
Sources: ABS 1976-2016 Censuses
Credit: Australian Institute of Family Studies 2020
Increase in older couple-only families
The increase in the proportion of couple families without children is mainly attributed to the rise in older couples, which is consistent with Australia's ageing population. Figure 10 shows the distribution of couple-only families by the age of the female partner for 1991-2016.
- The proportion where a female partner was 65 years and over rose from 26% in 1991 to 33% in 2016.2
- The proportion of couple-only families with a female partner aged 55-64 years increased from 23% in 1991 to 27% in 2006 and fell to 25% in 2016.
- The proportion of couple-only families with a female partner aged 45-54 and under 25 years fell respectively from 16% to 12% and from 10% to 5% during the period 1991-2016.
Figure 10: Couples without children: age of female partner, 1991-2016
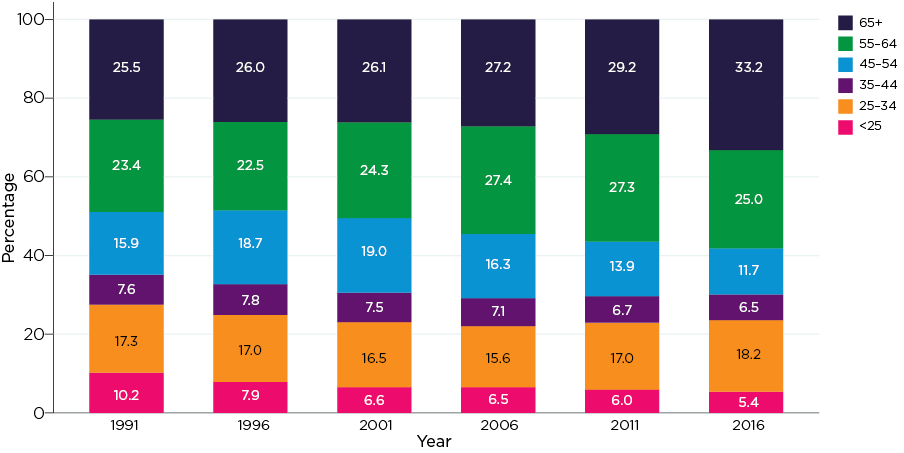
Sources: ABS 1991-2011 Census customised tables; ABS 2016 Census TableBuilder, data based on use of ABS Tablebuilder data
Credit: Australian Institute of Family Studies 2020
Family ties still strong
While the size and shapes of families have changed over the past 40 years, they remain important sources of our closest relationships, as demonstrated in Figure 11. Based on Wave 18 (2018) of the Household, Income and Labour Dynamics in Australia (HILDA) Survey, the figure presents the ratings of respondents aged 15 years and older on their satisfaction with various family relationships, including with a partner, children, step-children, parents and step-parents.
- The majority of people were highly satisfied with these relationships. On a scale of 0-10, with higher ratings representing higher levels of satisfaction, the proportion of ratings 8-10 (here referred to as high satisfaction) ranged from 57% to 82%.
- Of all the relationships examined, satisfaction with relationships with children was highest, with 82% of parents expressing high satisfaction, followed by the relationship with their current partner (77%) and parents (72%).
- Relationships with step-children and step-parents were also positive but rated less favourably compared with other family relationships examined. High satisfaction with relationships with step-children was expressed by 59% of parents. Likewise, 57% of those who had a step-parent were highly satisfied with their relationship with the step-parent.
Figure 11: Satisfaction with family relationships, 2018

Source: HILDA Wave 18
Credit: Australian Institute of Family Studies 2020
While the large majority of people living with a partner were highly satisfied with their relationship with their current partner, Figure 12 shows that the level of satisfaction varied across family type.
- Regardless of family types, the proportions of partnered people reporting high satisfaction were high across all the couple types (74-84%).
- High satisfaction with the relationship with a current partner was highest among couples without children (84%),3 followed by couples with non-dependent children.
- Couples with children under 15 years or with dependent students were less satisfied compared to the other two groups of couples.
Figure 12: Satisfaction with relationship with current partner by family type, 2018

Source: HILDA Wave 18
Credit: Australian Institute of Family Studies 2020
References
- Australian Bureau of Statistics (ABS). (1979). 1976 Census: Population and dwellings: cross-classified tables (2426.0). Canberra: ABS.
- Australian Bureau of Statistics. (1983). 1981 Census household sample file (1%) - Confidentialised Unit Record File. Findings based on use of ABS Microdata. Canberra: ABS.
- Australian Bureau of Statistics. (1988). 1986 Census household sample file (1%) - Confidentialised Unit Record File. Findings based on use of ABS Microdata. Canberra: ABS.
- Australian Bureau of Statistics. (1989a). Census 86 - Summary characteristics of persons and dwellings Australia (Catalogue no. 2487.0). Canberra: ABS.
- Australian Bureau of Statistics. (1989b). Census 1986 - Cross-classified characteristics of persons and dwellings, Australia (Catalogue no. 2498). Canberra: ABS.
- Australian Bureau of Statistics. (2000). 1996 Census of population and housing - Basic community profile (Catalogue no. 2001.0). (Table B26 Household type and family type by number of persons). Canberra: ABS. Retrieved from quickstats.censusdata.abs.gov.au/census_services/getproduct/census/1996/communityprofile/0?opendocument&navpos=230
- Australian Bureau of Statistics. (2007). 2006 Census of population and housing - Basic community profile (Catalogue no. 2001.0). (B24 Family composition; B30 Household composition by number of persons usually resident). Canberra: ABS. Retrieved from quickstats.censusdata.abs.gov.au/census_services/getproduct/census/2006/communityprofile/0?opendocument
- Australian Bureau of Statistics. (2012a). 2011 Census of population and housing, TableBuilder. Findings based on use of ABS TableBuilder data. Canberra: ABS.
- Australian Bureau of Statistics (2012b). 2011 Census of population and housing - Time series profile (Catalogue no. 2003.0). (T02 Selected medians and averages) Canberra: ABS. Retrieved from quickstats.censusdata.abs.gov.au/census_services/getproduct/census/2011/communityprofile/0?opendocument
- Australian Bureau of Statistics. (2016). Census of population and housing: Census dictionary, Australia 2016 (Catalogue no. 2901.0). Canberra: ABS. Retrieved from www.abs.gov.au/AUSSTATS/[email protected]/ProductsbyCatalogue/ 9795AA2F5B1A5C2DCA2581BE00127257?OpenDocument.
- Australian Bureau of Statistics. (2017a). 2016 Census of population and housing - Basic Community Profile (Catalogue no. 2001.0). (G25 Family composition). Canberra: ABS. Retrieved from quickstats.censusdata.abs.gov.au/census_services/getproduct/census/2016/communityprofile/036?opendocument
- Australian Bureau of Statistics. (2017b). 2016 Census of population and housing - Time series (Catalogue no. 2003.0). (Table T14 Dwelling structure by household composition and family composition; T02 Selected medians and averages). Canberra: ABS. Retrieved from quickstats.censusdata.abs.gov.au/census_services/getproduct/census/2016/communityprofile/036?opendocument
- Australian Bureau of Statistics. (2017c). Census of Population and Housing: Reflecting Australia - Stories from the Census, 2016 (Catalogue 2071.0). Canberra: ABS.
- Australian Bureau of Statistics. (2018). 2016 Census household sample file (1%) - Confidentialised Unit Record File. Findings based on use of ABS Microdata. Canberra: ABS.
- Australian Bureau of Statistics. (2020). Migration, Australia, 2018-19 (Catalogue no. 3412.0). Canberra: ABS. Retrieved from www.abs.gov.au/AUSSTATS/[email protected]/Latestproducts/3412.0Main%20Features32018-19?opendocument&tabname= Summary&prodno=3412.0&issue=2018-19&num=&view=
- de Vaus, D. (2004). Diversity and change in Australia families: Statistical profiles. Melbourne: Australian Institute of Family Studies.
- Hayes, A., Weston, R., Qu, L., & Gray, M. (2010). Families then and now, 1980-2010. Melbourne: Australian Institute of Family Studies.
- Hugo, G. (2002). A century of population change in Australia. In Australian Bureau of Statistics (Ed.), 2001 Year Book Australia, No. 83, Cat. No. 1301.0 (pp. 169-210). Canberra: ABS.
Appendix: Definitions of household and family forms
Definitions of households
Household
A household is defined by the ABS as 'one or more persons, at least one of whom is at least 15 years of age, usually resident in the same private dwelling.
'Under this definition, all occupants of a dwelling form a household and complete one form.
'Therefore, for Census purposes, the total number of households is equal to the total number of occupied private dwellings as a Census form is completed for each household from which dwelling information for the household is obtained.'
Family household
A family is defined by the ABS as 'two or more persons, one of whom is at least 15 years of age, who are related by blood, marriage (registered or de facto), adoption, step or fostering, and who are usually resident in the same household.
'Each separately identified couple relationship, lone parent-child relationship or other blood relationship forms the basis of a family. Some households contain more than one family.
'Non-related persons living in the same household are not counted as family members (unless under 15 years of age).
'Other related individuals (brothers, sisters, aunts, uncles) may be present in the household. If more than one family is present these people can only be associated with the primary family.'
For census, a family household is a household with a family (or more than one family) present on Census night.
Lone-person household
According to the ABS, a lone-person household is 'any private dwelling in which there is only one usual resident at least 15 years of age, is classified as being a lone person household.' A lone-person household is considered as a non-family household.
Group household
'The ABS defines a group household as a household consisting of two or more unrelated people where all persons are aged 15 years and over. There are no reported couple relationships, parent-child relationships or other blood relationships in these households.
'An unrelated child (e.g. boarder) under the age of 15 who lives in a household with one or more usual residents, is coded as forming a parent-child relationship within that household. These households become family households, not group households.'
A group household is considered as a non-family household.
Indigenous household
An Indigenous household is 'any household where at least one usual resident at the time of the Census was a person of any age who was identified as being of Aboriginal and/or Torres Strait Islander origin.'
In 2001 and previous censuses, an Indigenous household referred to 'households where any family in the household is defined as an Indigenous family or a lone-person household where the lone person is of Aboriginal/Torres Strait Islander origin' and the definition of an Indigenous family was a family where either the reference person and/or spouse/partner were of Aboriginal and/or Torres Strait Islander origin (ABS, 2003 community file).
Definitions of family forms
Couple family
A couple family is identified by the ABS by 'the existence of a couple relationship. A couple relationship is defined as two people usually residing in the same household who share a social, economic and emotional bond usually associated with marriage and who consider their relationship to be a marriage or marriage-like union. This relationship is identified by the presence of a registered marriage or de facto marriage. A couple family can be with or without children, and may or may not include other related individuals. A couple family with children present can be expanded to elaborate on the characteristics of those children, such as their number, age and dependency status.'
One-parent family
According to the ABS, 'a one-parent family consists of a lone parent with at least one child (regardless of age) who is also usually resident in the household and who has no identified partner or child of his/her own. The family may also include any number of other related individuals.
'Examples of one parent families include: a 25-year-old parent with dependent children; and an 80 year old living with a 50-year-old child.
'Information on people who are temporarily absent is used in family coding to differentiate between lone-person households and one-parent families (if child was temporarily absent) or between one-parent and couple families (if a spouse was temporarily absent).'
Other family
'Other family' is defined by the ABS as 'a group of related individuals residing in the same household, who cannot be categorised as belonging to a couple or one-parent family.
'If two brothers, for example, are living together and neither is a spouse/partner, a lone parent or a child, then they are classified as an other family. However, if the two brothers share the household with the daughter of one of the brothers and her husband, then both brothers are classified as other related individuals and are attached to the couple family.'
Source: ABS (2016 Census Dictionary).
1 This excludes 575,500 households consisting of visitors only and those that were not classifiable. The classification of households into three basic forms - families, individuals living alone, and groups of unrelated persons - has only been available in the census since 1986.
2 When there are two female partners, the first female partner listed on the census form was selected.
3 Couples without children include couples who did not have any children and couples whose children had left home.
This paper uses unit record data from the Household, Income and Labour Dynamics in Australia (HILDA) Survey. The HILDA Project was initiated and is funded by the Australian Government Department of Social Services (DSS) and is managed by the Melbourne Institute of Applied Economic and Social Research (Melbourne Institute). The findings and views reported in this paper, however, are those of the author and should not be attributed to either DSS or the Melbourne Institute.
The author acknowledges Dr Briony Horsfall's contribution to the preparation of this publication.
Featured images: © GettyImages/Pekic
14 July 2020