The Stronger Families in Australia (SFIA) Study: Phase 2
You are in an archived section of the AIFS website
Overview
This report presents a medium- to long-term evaluation of the Communities for Children (CfC) initiative. This Australian Government initiative aims to improve services for young children and their families and the communities they grow up in. The evaluation, known as the Stronger Families in Australia (SFIA) study, looks at the impact of CfC on child, family, and community outcomes. Phase 1 of the evaluation, published in 2009, found a small but positive impact of the initiative. This new report presents findings from Phase 2 of the study, which followed up 1,927 of the original study families, with the children now aged from 8-10 years old. Phase 2 also introduced a new cohort of 1,800 families and four new "contrast" sites.
Key messages
-
CfC has had some of the desired effects on parents and children, but these were not strong or sustained for long enough to make statistically significant differences over the long term.
-
Over the five waves of SFIA, the vast majority of findings indicated that the wellbeing of children and parents in CfC communities was better than in comparison communities, even if these differences did not reach statistical significance.
-
Very few studies of early intervention services follow children for six years and provide the depth of information that SFIA has been able to deliver.
-
Many other studies of early intervention services have also failed to find sustained positive effects over the longer term (e.g., NESS Team, 2012).
-
Whether another model, a more intensive version of CfC or a set of evidence-based interventions would have had a greater effect is not known.
Executive summary
This report presents the results of Phase 2 of the Stronger Families in Australia (SFIA) study, an evaluation of the Communities for Children (CfC) initiative. The focus is on examining the effects of the initiative on child, family and community outcomes. By using data from Phase 1 (Waves 1 to 3 conducted from 2006-08) and Phase 2 (Waves 4 and 5 conducted in 2010-12) of the Stronger Families in Australia (SFIA) study, the medium- to longer-term effects of the program can be assessed.
As is outlined in detail in the report: Stronger Families in Australia Study: The Impact of Communities for Children (Edwards et al., 2009), the CfC initiative aimed to:
- improve the coordination of services for children 0-5 years of age and their families;
- identify and provide services to address unmet needs;
- build community capacity to engage in service delivery; and
- improve the community context in which children grow up.
As part of the CfC initiative, the Department of Social Services (DSS; formerly Department of Families, Housing, Community Services and Indigenous Affairs [FaHCSIA]) funded non-government organisations as "Facilitating Partners" initially in 45 disadvantaged geographic areas around Australia. Their task was to develop and implement a "whole-of-community" approach to enhancing early childhood development, through consultation with local stakeholders. The idea behind the CfC model is that service effectiveness is dependent not only on the nature and number of services, but also on coordinated service delivery. The types of services offered in the CfC sites differ depending on the needs of each community, and include home visiting; programs on early learning, child nutrition and literacy; parenting and family support services; and community events (Edwards et al., 2011). There are now 52 funded CfC Facilitating Partners.
In 2009, CfC services were incorporated into the Family Support Program, which brought together a wide range of services for children and families, broadening their scope to include services for children aged 0 to 12 years and targeting vulnerable and disadvantaged families. In the same year, eight sites were targeted to focus on preventing child abuse and neglect in particular - four were existing CfC sites and four were new sites. In this report, these sites are referred to as Stage 2 CfC sites. Stage 2 CfC sites have not been included in the CfC evaluation reported in the main body of this report; however, preliminary waves of data from the early implementation of seven Stage 2 CfC sites and comparison (contrast) sites are included in the appendix.
As in the initial phase of the evaluation, Phase 2 of the SFIA study provides a unique opportunity to consider the effectiveness of the CfC initiative. The strengths of the SFIA study include having a large sample representing 42% of the initial target population in the selected CfC and contrast sites, relatively low and non-systematic attrition from Wave 2 (when children were 2-3 years of age) to Wave 5 (when children were 9-10 years of age), robust measurements of child and family outcomes, and an appropriately matched comparison group. However, the SFIA survey cannot identify the extent to which particular children or families have received CfC services, as one of the key features of the initiative was to change the nature of how the service delivery system operates in a community context.
Summaries of the key findings of the study and some of the implications of these findings are provided below.
Summary of evaluation findings
Effects of CfC initiative on child, family and community outcomes in Stage 1 CfC sites
To date, findings from the evaluation of Stage 1 CfC sites suggest that there were some positive effects of the program on a variety of outcomes during Phase 1, although some faded out when children started school (Phase 2). The positive effects of the CfC initiative included:
- a reduction in jobless households from Wave 1 to Wave 3, but not in later waves;
- reductions in primary-carer-reported hostile or harsh parenting practices (from Wave 1 to Wave 3 only), and at Wave 3 and Wave 5, lower levels of harsh parenting practices at Wave 3 and Wave 5;
- primary carers feeling more effective in their role as parent (at Wave 3 only);
- greater improvements in reading often to the target child between Waves 1 and 3 and Waves 1 and 5 compared to those living in comparison sites, with these gains largely being reflected in benefits to children living in families that were relatively more advantaged (particularly higher income families);
- greater engagement with children in music and singing among primary carers from more disadvantaged families (with lower income and education) between Wave 1 and 5; and
- greater volunteering by primary carers between Waves 1 and 3 overall, and evidence of greater engagement in volunteering between Waves 1 and 5 for primary carers with lower levels of education.
There were several other noteworthy results that were less conclusive:
- Overall, CfC had little effect on neighbourhood social cohesion and community safety, but there were some improvements for families in the lower income group.
- In Phase 1 of the evaluation, primary carers reported that children's physical functioning worsened in CfC compared to comparison sites between Wave 1 and Wave 3 but this was no longer the case in Waves 4 and 5.
- There were two instances that were likely to indicate pre-existing differences at baseline and are not indicative of a program effect. Namely, when primary carers' mental and physical health improved over time in comparison sites for the lower educated subgroup, compared with CfC sites, which remained the same over time. Although this might suggest worse outcomes in CfC sites, it is more likely to reflect comparison sites "catching up", given that parents in comparison sites reported lower levels of physical and mental health than parents in CfC sites in Wave 1.
Residential mobility and out-migration from CfC sites
While all families in the intervention group lived in CfC sites at Wave 1 of the survey, many may have moved out of a CfC site in subsequent waves. Measuring any change in subsequent waves is important because:
- there was a need to establish that the findings from the Stage 1 CfC sites were robust to residential mobility; and
- the extent to which individuals move out of areas that are targeted for area-based initiatives is largely unknown.
In general, there was no evidence to suggest that residential mobility biased the findings of the overall evaluation. Key findings on residential mobility and out-migration from CfC sites were that:
- one in two families living in CfC sites when their children were 2-3 years of age were still living in a CfC site seven years later; and
- these rates are consistent with that of the general population (Edwards, 2011).
Links between program effects and child outcomes
There were significant program effects in Stage 1 CfC sites relating to family joblessness, the engagement of primary carers in children's reading and the community involvement of primary carers, particularly at Wave 3 and at later ages for subgroups. Given that other studies (Coelli, 2005; Huttenlocher, Haight, Bryk, Seltzer, & Lyons, 1991; Kalil & Ziol-Guest, 2008; Senechal, LeFevre, Hudson, & Lawson, 1996) have found that these outcomes are likely to be beneficial to children's development in the longer term, we wanted to examine whether there were flow-on benefits to children when they were in their primary school years.
To consider this, we explored associations between family joblessness, the engagement of primary carers in children's reading, and the community involvement of primary carers and:
- NAPLAN (the National Assessment Program Literacy and Numeracy) scores relating to children's reading, writing, grammar and punctuation, spelling and numeracy at Year 3 of primary school; and
- children's social and emotional wellbeing measured at 3-5, 8-9 and 9-10 years of age.
The overall conclusion from this analysis was that there were many instances where family joblessness, parents reading to their children and the community involvement of primary carers were associated with later literacy/numeracy and social/behavioural outcomes for children in the CfC and comparison sites. More specifically:
- Primary carers reading often with children at 3-5 years was consistently associated with improved literacy and numeracy scores from NAPLAN tests, but not with increased reading scores at later ages.
- Family joblessness when children were 4-5 years of age was associated with lower literacy and numeracy skills and poorer social and emotional behaviour in children aged 8-10 years.
- Family joblessness prior to children entering school was associated with poor early literacy, which later undermined learning in primary school.
- In families that had moved out of family joblessness by the time their children were 4-5 years of age, the negative effects of joblessness on literacy/numeracy and social/behavioural outcomes in children were not apparent at 8-10 years.
- Consistent volunteering by primary carers when children were aged 4-5 years and 8-9 years of age was associated with lower levels of social and behavioural problems in children.
- There were no statistically significant differences between CfC and comparison sites on any of the NAPLAN scores.
Timing of the CfC initiative effects: interpreting the implications
Although there were a number of positive (and a few negative) effects of the CfC initiative, most were not durable and faded out by the time children started school. It is important to recognise that this pattern of findings is not unexpected or unique in area-based initiatives. The National Evaluation of Sure Start (NESS) in the UK reported similar findings (NESS Team, 2012), with positive findings in children's outcomes observed when children were 5 years of age no longer evident when children were aged 7 years and in primary school.
With respect to interpreting the results for volunteering, normative data from the Longitudinal Study of Australian Children (LSAC) suggest that parents increase their rates of volunteering once their child starts school. Our results certainly reflect this normative increase.
One of the key findings from Phase 1 of the evaluation was that there was a reduction in jobless families in CfC compared to comparison sites. Phase 2 results suggest that comparison sites caught up to CfC sites in terms of the percentage of jobless families by the time children were 8-10 years of age. The same pattern of results was also observed in the Sure Start initiative (NESS, 2012), where there was a reduction in the rate of joblessness for Sure Start sites compared to comparison sites when children were aged 9 months to 5 years. There are two possible reasons why this may have occurred in the CfC sites:
- when children are at school, primary carers have more time to go to work and have much lower child-care costs; and
- over 2006-08, welfare-to-work reforms required parents on income support (single and partnered) to actively seek part-time work, with these changes being put in place after Wave 3 but before Wave 4 of the SFIA survey.
It may also be that once a certain "floor" is reached, it is very difficult to further reduce joblessness, even with a combination of the CfC initiative and welfare-to-work requirements.a
Effects on later child wellbeing of early vs late reading, volunteering and moving out of joblessness
We have seen positive early results relating to primary carers reading to children, primary carers volunteering and family joblessness. Given that there is some evidence that both children starting school and the introduction of the welfare-to-work reforms may have enabled families in comparison sites to catch up to families in CfC sites, it is important to consider whether these early positive effects in the families of young children would have demonstrable benefits in the longer term for families in both CfC and comparison sites. In Chapter 6 we explore this issue by examining whether children benefitted in the early primary school years in the areas of literacy, numeracy, social and behavioural outcomes if they were often read to at age 3-5 years, had a primary carer who consistently volunteered and had a family that moved out of joblessness.
It is important to note that we were examining whether associations between these variables and child outcomes mattered, not whether there was a treatment effect of CfC on children's outcomes.
One of the key findings with respect to these rather disparate factors was that timing seemed to matter. Engagement in reading, volunteering and moving out of family joblessness were all associated with positive benefits to children's outcomes for those in CfC and comparison sites. We also saw some evidence to suggest that there were detrimental effects of joblessness prior to starting school, when children were 4-5 years of age, as the influence of joblessness on later NAPLAN scores was mediated through differences in early literacy skills at 4-5 years that were associated with concurrent family joblessness. Therefore, school readiness and what happens prior to school entry is also an important consideration. Findings from this set of analyses seem to suggest the timing of when we observe the beneficial effects of CfC matters for children's development is important.
Caveats for translating evaluation findings into policy
Before commenting on the implications of these findings for policy development, it is important to note some of the limitations and caveats. These include:
- The size of the CfC effects was small, but comparable in size and timing to the UK Sure Start evaluation. Other reviews of the effectiveness of early childhood interventions have also suggested the majority of effects on parenting and child outcomes were small (Wise, da Silva, Webster, & Sanson, 2005; except for Triple P which reported greater effects).
- The CfC initiative encouraged heterogeneous service delivery operating in each site, and therefore families from each site may have received services focused on different aspects of the outcomes that were examined. Thus, not all the CfC sites would have had a consistent set of services targeting each particular outcome in the evaluation and perhaps this explains why, while there was a general trend towards positive effects in many outcomes, only a few were statistically significant.
- As far as we are aware, the CfC services were not required to meet a certain standard of service delivery as part of the initiative. Therefore, the quality of program delivery was not assessed and cannot be ascertained by the evaluation.
- Site-by-site analysis of outcomes was not possible because of the small number of sites in the CfC and contrast sites examined.
- SFIA sites were not randomly chosen from CfC sites (although they are broadly representative of the range of CfC sites, outside of remote communities).
- The nature of SFIA (and the logic model of CfC) meant that the evaluation was not able to link outcomes with exposure to CfC-funded services. Children and primary carers in the SFIA cohort are a random sample of the population in the CfC community. It is not known therefore whether these families had had contact with CfC services and if so, how much contact they had had.
- The evaluation did not compare CfC (as it then was) with other models of service delivery. The contrast sites were demographically similar to CfC communities, but did not receive CfC funding. Therefore, CfC was not compared to other models, such as direct funding of non-government organisations (NGOs), programs that are not area-based, or programs funded through state and territory sources or interventions not specifically aimed at children in their early years and their parents.
- Finally, it is important to note that the outcomes measured point to aspects of parenting and child development that are difficult to measure accurately. We have used well-validated measures, but there is always error in measurements that can affect the efficacy of any statistical analysis.
Implications
What are the advantages of area-based initiatives?
- SFIA does not provide any direct evidence of the potential effects of place-based initiatives compared to individually targeted interventions.
- However, there were clear advantages of a place-based approach in the early years, as around the time of implementation, there were significant service gaps, and few mechanisms to coordinate early years services.
- The advantages for older age groups are less clear.
Would a more targeted/evidence-based approach produce better outcomes?
- SFIA did not compare community-level outcomes for CfC and targeted services, and so cannot answer this question directly.
- While some evidence-based interventions can have a significant and lasting effect on outcomes (see Chapter 2), the effects apply to people who received the service and not for the community as a whole.
- To our knowledge, none of the targeted programs have followed up families in the general community, and certainly not over six years.
- Targeted programs tend to be much more expensive than CfC.
- The evaluation of CfC found that it was challenging to engage and retain the most hard-to-reach families in the communities, but the area-based approach of CfC was effective in this respect.
- Thus, we would tentatively conclude that the most effective approach would be to provide evidence-based interventions within the context of a community-level intervention.
What are the implications of extending the age range of CfC from 0-5 years to 0-12 years?
Another potential explanation for the effects observed was that in Phase 1 of the evaluation the CfC initiative was funded to focus on 0-5 year olds. In 2009, the focus of CfC expanded to include 6-12 year olds. It was beyond the scope of the evaluation to examine how the service delivery system changed as a result of the 2009 expansion, but given that the financial resources were not increased substantially in line with the increased focus, it is possible that there was not a commensurate expansion in the focus on services for 6-12 year olds.
There is little data on how CfC affected the various services for 6-12 year olds, for example:
- services provided by large institutional providers (schools, medical services, etc.); and
- no information about whether the Facilitating Partner model was able to successfully engage schools, GPs and other statutory providers as early years service providers.
If school-entry and school-based services overcame most of the deficits in the contrast sites, then the implication would be that policy should focus more on improving school provision and school-based services than on services targeted at the early years. On the other hand, the analysis showed that primary carers reading to their children and volunteering and returning to the workforce early in their children's lives had more influence on children's later wellbeing than reading and volunteering when the children were older.
On balance, therefore, the findings indicate that early years interventions are likely to be more effective than interventions when children are already at school.
Conclusion
Key points:
- CfC has had some of the desired effects on parents and children, but these were not strong or sustained for long enough to make statistically significant differences over the long term.
- Over the five waves of SFIA, the vast majority of findings indicated that the wellbeing of children and parents in CfC communities was better than in comparison communities, even if these differences did not reach statistical significance.
- Very few studies of early intervention services follow children for six years and provide the depth of information that SFIA has been able to deliver.
- Many other studies of early intervention services have also failed to find sustained positive effects over the longer term (e.g., NESS Team, 2012).
- Whether another model, a more intensive version of CfC or a set of evidence-based interventions would have had a greater effect is not known.
a This is not to say that other policies (family-friendly employment initiatives, skills training, etc.) may not further reduce rates of joblessness.
1. Introduction
This report presents the results of Phase 2 of the Stronger Families in Australia (SFIA) study, which is an evaluation of the Communities for Children (CfC) initiative. The focus is on examining the effects of the initiative on child, family and community outcomes. By using data from both phases of the SFIA study (Waves 1 to 5, conducted from 2006 to 2012), the medium- to longer term effects of the program can be assessed.
As in the initial phase of the evaluation, Phase 2 of the SFIA study (2010-12) provides a unique opportunity to consider the effectiveness of the CfC initiative. The strengths of the SFIA study include having a large sample representing 42% of the initial target population in the selected CfC and contrast sites, relatively low and non-systematic attrition from Wave 2 (when children were 2-3 years of age) to Wave 5 (when children were 9-10 years of age), robust measurements of child and family outcomes, and an appropriately matched comparison group. However, the SFIA survey cannot identify the extent to which particular children or families have received CfC services, as one of the key features of the initiative was to change the nature of how the service delivery system operates.
Following this introductory chapter, Chapter 2 describes the methodology of the report; Chapter 3 contains the results of the evaluation; Chapter 4 provides a description of residential mobility and considers the implications of this for the main results of the evaluation; Chapter 5 considers associations between some of the early impacts of the CfC initiative on later child outcomes; and Chapter 6 provides some discussion and conclusions. Finally, the Appendix provides an overview of early results from the Stage 2 CfC sites.
1.1 Communities for Children and other area-based initiatives
Communities for Children (CfC) is a large-scale area-based initiative that aims to enhance the development of children living in disadvantaged community areas across Australia. As part of the CfC initiative, the Department of Social Services (DSS; formerly Department of Families, Housing, Community Services and Indigenous Affairs [FaHCSIA]) has funded non-government organisations (NGOs) as "Facilitating Partners" in 45 disadvantaged geographic areas around Australia. Their task is to develop and implement a "whole-of-community" approach to enhancing early childhood development, through consultation with local stakeholders. The idea behind the CfC model is that service effectiveness is dependent not only on the nature and number of services, but also on coordinated service delivery. In each CfC site, the Facilitating Partner conducts a "needs analysis" to decide upon the required services for that community. The Facilitating Partner then engages, coordinates and funds local service providers to deliver the needed services. The types of services provided as part of the CfC initiative include: home visiting; programs on child nutrition, early learning and literacy; parenting and family support services; and community events (Edwards et al., 2011).
The CfC initiative has thus implemented four new service delivery innovations for young children and their families residing in areas of disadvantage (Edwards et al., 2009):
- improve the coordination of services for children 0-5 years of age and their families;
- identify and provide services to address unmet needs;
- build community capacity to engage in service delivery; and
- improve the community context in which children grow up.
1.1.1 Brief history of the CfC initiative
The evolution of the CfC initiative began in 2008, when the Australian Government commenced a strategy of widespread reform of children, families and communities grant programs to more comprehensively support families and build socially inclusive communities. In 2009, the CfC initiative was incorporated into the Australian Government's Family Support Program, bringing together a wide range of services for children and families. At the same time, CfC services were required to widen their scope to include services for children aged 0-12 years and to target vulnerable and disadvantaged families.
In 2009, the CfC initiative was expanded in response to the National Framework for Protecting Australia's Children 2009-2020 (Council of Australian Governments [COAG], 2009). The Australian Government and state/territory governments together identified eight communities where targeted and integrated service delivery was needed in order to help prevent child abuse and neglect. This was part of a broader recognition, from a public health perspective, that in order to reduce the number of notifications of concerns about child safety to state/territory statutory authorities, investment is needed in more than just primary (universal) services that support all families. In particular, it is important to increase the capacity of the secondary system to work with families in need where children might be at risk of abuse or neglect, and require a range of family and community supports to ensure children grow up safe and well (Higgins, 2011). Funding was provided under the first Action Plan of the National Framework to address child protection concerns in these eight locations. They included four existing CfC sites and four locations where new CfC services had been established. In this report, these sites are referred to as Stage 2 CfC sites. Stage 2 CfC sites specifically aim to address the risk factors for child abuse and neglect before they escalate, and to help parents of children at risk to provide a safe, happy and healthy life for their children.
In July 2011, the Family Support Program was further streamlined into its current structure. Under the new structure, CfC encompasses a broad range of children's and family services. Area-based services delivered under a Facilitating Partner model are known as the CfC Facilitating Partner program. Other services are known as CfC Direct services. From July 2011, all CfC Facilitating Partners were expected to provide services to prevent child abuse or neglect.
Stage 2 CfC sites have not been included in the CfC evaluation reported in the main body of this report; however, preliminary waves of data from the early implementation of seven Stage 2 CfC sites and comparison sites are included in the appendix.
1.1.2 Evidence base for area-based initiatives
The evidence base for programs such as CfC comes from the wealth of literature indicating that local communities have an important influence on child and family wellbeing. Depending on their availability and quality, community services can provide essential support for families and affect critical child-related outcomes, such as cognitive development and educational achievement (Crane, 1991; Harding, 2004), emotional/psychological wellbeing (Aneshensel & Sucoff, 1996), and physical health (Morland, Wing, Diez-Rouz, & Poole, 2002; Winkleby & Cubbin, 2003).
Previous studies have also indicated that living in a more disadvantaged area can have a negative effect on children's development and wellbeing, over and above any differences in family characteristics (Burdick-Will et al., 2011; Edwards, 2005; Edwards & Bromfield, 2009). This is a primary reason behind area-based models of service delivery coming into effect within the last two decades (Bloom, 2005; Harding, 2004). The Sure Start Local Programmes (SSLPs) in the UK are a prime example of this, and the evaluation of that initiative provides insights that may be helpful when considering the evaluation of the CfC initiative.
1.1.3 Sure Start Local Programmes: A UK area-based intervention
The SSLPs initiative in the UK is one of the largest area-based initiatives currently in operation. Sure Start was launched in 1999, with its ultimate goal being to enhance the life opportunities for young children growing up in disadvantaged neighbourhoods, due to their higher risk of doing poorly at school, having trouble with peers and authority figures, and ultimately experiencing compromised life chances. As with CfC, there is a specific focus on low socio-economic areas, with all children under five years of age and their families within these prescribed areas serving as the intervention "targets". In addition, similar to CfC, SSLPs do not have a prescribed set of services, with each SSLP having a degree of autonomy over the service delivery in its area, despite the SSLPs coming under the control of Local Authorities in 2005-06 and beginning to operate as children's centres (National Evaluation of Sure Start [NESS] Team, 2010).
Early findings from NESS were somewhat inconclusive, with both positive and adverse effects detected for the disadvantaged families living in the SSLP areas (NESS Team, 2005). Results from the second stage of the evaluation, when the study children were 3 years old, were far more positive, however, with no adverse effects observed. More specifically, children in SSLP areas were more likely to be immunised, were less likely to have accidents requiring treatment, and reported significantly higher levels of positive social behaviour and independence/self-regulation (NESS Team, 2008).
The third stage of the evaluation, reported in 2010, indicated effects that were predominantly positive and beneficial in nature for the 5-year-old study children and their families. The main effects identified for the SSLP children were that they had lower body mass index (BMI) scores and experienced better physical health than the children in the non-SSLP (comparison) areas. Secondly, in regards to maternal wellbeing and family function, it was found that, in comparison to the non-SSLP areas, mothers residing in SSLP areas provided a more cognitively stimulating and less chaotic home learning environment for their children, and also reported having greater life satisfaction and engaging in less harsh discipline. On the negative side, however, mothers in SSLP areas reported more depressive symptoms, and the parents in SSLP areas were slightly less likely to visit their child's school for parent-teacher meetings or other arranged visits, compared to those in non-SSLP areas (NESS Team, 2010).
Overall, results from the third stage of the NESS generally supported the notion that the program's area-based approach had paid off and benefitted children and families in the disadvantaged SSLP sites. However, while there were more positive than negative effects found, there were also many non-significant findings, and hence, the degree of benefit was (at that stage) relatively modest. Evaluators suggested placing greater emphasis on services that improved child outcomes, particularly language development, to enhance school readiness for the SSLP children (NESS Team, 2010).
The fourth stage of the evaluation provided an indication of the effects of the SSLP for school-aged children and whether exposure was associated with longer-term benefits. Some beneficial effects of Sure Start were found for 7-year-old study children and their families (NESS Team, 2012). Of the 15 outcomes that were investigated, there were two positive outcomes across all those living in SSLP areas compared to non-SSLPs. Mothers were engaging in less harsh discipline and providing a more stimulating home learning environment for their children. In addition, there was also a trend towards improved maternal mental health. Also, home environments were rated as less chaotic in SSLP families than non-SSLP families for boys, but there was no difference for girls. Mothers in lone-parent and jobless households also reported better life satisfaction when living in SSLP areas than non-SSLP areas. These findings were based on cross-sectional analyses with sophisticated statistical methodology to control for measured differences between families living in SSLP and non-SSLP areas. The analyses that focused on the eight outcome measures that were repeatedly measured when the children were between 3 and 7 years suggest that mothers living in SSLP areas reported greater decreases in harsh discipline and improvement in the home learning environment than mothers in non-SSLP areas. Mothers living in SSLPs who were lone parents and in jobless households showed greater improvements in life satisfaction compared to their counterparts not living in SSLP areas.
Although the authors concluded that Sure Start had provided some modest benefits relating to disadvantaged mothers' parenting skills, they found no program effects relating to their 7-year-old children's outcomes. They noted that one of the possible explanations for the limited longer-term benefits to children could be due to their access to universal education (NESS Team, 2012). Previously there had been some benefits to children at age 3, but at ages 5 and 7 these were no longer evident. Since 2004, there has been free part-time preschool available in the United Kingdom to every child from age 3 years, and thus 95% of UK children had engaged in preschool during the evaluation period. The authors also noted that by age 7 years, children had been in primary school for three years and therefore the influence of early childhood education and care (ECEC) and primary school may have served to equalise the developmental advantage of children living in SSLP areas. In addition, parental support is a focus of SSLP areas; therefore, an improvement in mothers but not children's outcomes might be expected. While the beneficial effects of parenting and home learning may translate into positive child outcomes in the longer term (as has been observed in home visiting; see Olds et al., 1999), further follow-up into later primary and secondary school and early adulthood will be required to confirm that this does occur. In summary, the findings from the fourth stage of the NESS found limited benefits of SSLPs, and these were to mothers and not to children.
1.2 Key findings from Phase 1 of Stronger Families in Australia
Phase 1 of the SFIA study included data collection waves in 2006, 2007 and 2008 when the study children were aged 2-3, 3-4 and 4-5 years. The purpose of the Phase 1 evaluation was to measure the "short-run" or initial effects of the CfC program across 10 CfC Stage 1 sites and five comparison sites (see section 2.2 for more information about site selection). The evaluation measured whether the CfC initiative had an effect on a range of outcomes it was designed to improve, including families' experiences of local services, primary carers' perceptions of community cohesion, parenting quality, child wellbeing, and the wellbeing of families as a whole (Edwards et al., 2009).
An at-home interview methodology was employed for the three waves of Phase 1, with Wave 1 occurring during the consultation and partnership-building stage of the CfC initiative, and therefore providing baseline data. Wave 2 followed up families around 9 to 10 months after Wave 1, with CfC services commencing either shortly before or shortly after this wave. Finally, the study collected Wave 3 data approximately 11 months after Wave 2 commencement and CfC implementation, meaning that only very short-term effects could be measured by the Phase 1 evaluation (Edwards et al., 2009).
The interviews were conducted with the person in the family who knew most about the child (the primary carer). In most cases, this was the mother. In the remaining cases, the primary carer was the child's resident father, a relative who was the primary carer for the child or a foster parent.
The broad conclusion drawn from Phase 1 of the SFIA study was that the CfC initiative had a small but positive effect on parenting outcomes (i.e., less harsh parenting and higher levels of parenting confidence), the number of jobless households, and children's receptive vocabulary.1 In addition, there was some evidence of a negative effect on the mental health of primary carers with a lower level of education (defined as Year 10 or less), and poorer general health of primary carers in lower income households.
Given the importance of understanding the extent to which the CfC initiative had succeeded in closing the gap between the most disadvantaged and relatively less disadvantaged children in the CfC areas, the analysis in Phase 1 looked at outcomes for the most disadvantaged families in the CfC sites compared to similarly disadvantaged families in the contrast sites. Disadvantage was operationalised in the study in two ways:
- families where primary carers had a lower level of education (Year 10 or less); and
- families with lower incomes (bottom 20% of the sample income distribution).
The following positive changes between Wave 1 and Wave 3 were found for the CfC intervention, which varied according to the families' levels of disadvantage:
- for primary carers with a lower level of education:
- children's improved receptive vocabulary and verbal ability;
- a decrease in the rates of injuries requiring medical treatment;2
- greater involvement in community service activities;
- for primary carers with higher levels of education, a reduction in the level of hostile/harsh parenting practices;
- for lower income households, an increase in the quality of the home learning environment; and
- for higher income households, a decrease in the level of hostile/harsh parenting practices.
Therefore, there was some evidence that the most disadvantaged families benefitted to a greater extent than less disadvantaged families from the CfC initiative in regard to measures of early learning and community engagement. However, this was not the case for hostile or harsh parenting practices, where a positive effect was only found for relatively high-income households (Edwards et al., 2009). Overall, the Phase 1 evaluation concluded that the results were promising, particularly given the short amount of time that the CfC initiative had been in place across the participating sites. Although most of the effects were small, they were similar, if not greater, to those found for many alternative early childhood interventions. The comparability with the effects of other childhood interventions could potentially be attributable to the distinguishing characteristics of CfC, including its highly coordinated service provision and community-focused approach (Edwards et al., 2009).
1.3 Justification, objectives and key features of Phase 2 of Stronger Families in Australia
In the Phase 1 evaluation report, we argued that it was important to understand which elements of the program are most effective, and "whether the CfC is a strategy that can sustain benefits in the long term, and whether longer exposure to the CfC at a later stage in operation can produce greater benefits is unclear" (Edwards et al., 2009, p. 34). Although the Phase 1 evaluation provided several encouraging findings with regard to the potential benefits of CfC, the number and scope of these effects were possibly limited by the short time over which the initiative had been running (i.e., in most sites, just under one year). Therefore, Phase 2 of the study was necessary to evaluate the medium- to longer-term effects of CfC, and identify whether there were any benefits associated with the program for the study children and their families following school entry (i.e., when children were aged 7-8 years, at the start of Phase 2). This is a particularly important question given that the majority of services target preschool children and parents. A key focus of the Phase 2 CfC evaluation was therefore to investigate whether these gains were sustained as children reached school age. Additional longitudinal data have also been collected that may facilitate better explanations or further substantiate some of the Phase 1 effects. This notwithstanding, the overarching aim for the Phase 2 evaluation remained the same as that in Phase 1: to measure changes in child, family and community outcomes in the CfC communities, and to ascertain the extent to which these effects are related to the CfC initiative.
2. Methodology
2.1 Study design
The study design and selected sites for both phases of the SFIA study are shown in Figure 2.1. This diagram shows the CfC study and contrast sites from Phase 1 and Phase 2, the years in which data have been collected and the sample sizes for each wave. Figure 2.1 also shows that there were two CfC study sites that were given additional funding to focus more on risk factors for child abuse and neglect. More information about the Stage 2 sites and the establishment of the Stage 2 cohort is provided in the Appendix ("Stage 2 sites"). It is important to note, however, that the existing study children from these two sites with additional funding (Inala to Goodna and Launceston) were still followed as part of the CfC cohort, and thus are included in the results presented here.
Figure 2.1: Stronger Families in Australia study design
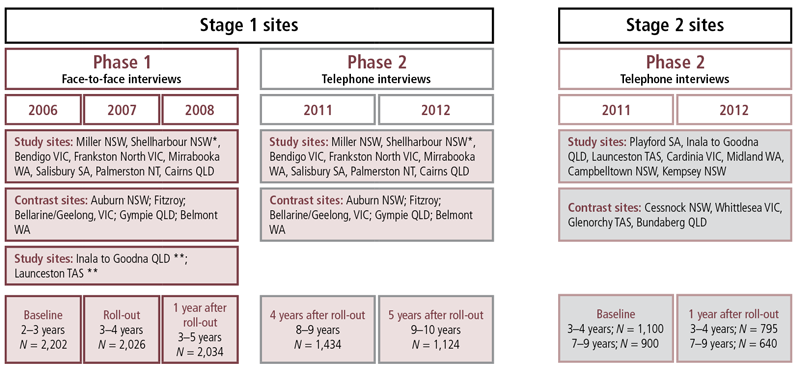
* Building Australia’s Future Workforce (BAFW) site.
Sampling frame: random sample of Family Tax Benefit (Part A) recipients in study locations. Outcomes: healthy families, supporting families & parents, early learning & care, child-friendly communities. All sites are funded under the Communities for Children Facilitating Partner model. There are 52 sites in total, which includes 8 CfC Plus sites (4 are new CfC Plus sites and 4 are enhanced existing CfC sites).
** Inala to Goodna QLD and Launceston TAS were converted to CfC Plus sites for Phase 2.
2.2 Site selection
For Phase 2, Phase 1 respondents from the original ten CfC sites and five contrast sites were followed up in Wave 4 and Wave 5. The ten CfC sites selected were from a total pool of 45 sites where the CfC initiative was implemented. As was reported in Edwards et al. (2009), a structured approach was applied in initially selecting these sites.
In order to avoid respondent burden, areas sampled for the Longitudinal Study of Australian Children (LSAC) were excluded. At least one site from each Australian state and territory was included, and sites had to be sufficiently large to meet the sampling quota.
In addition, five contrast communities were "matched" to the ten CfC sites. The contrast sites were chosen from the same states and territories as the CfC sites and were also similar in location, size and socio-economic status (as measured by the ABS Socio-Economic Indexes for Areas, or SEIFA, score). Sites in the pool of possible communities considered for CfC funding, and communities where the Australian Early Development Index (AEDI) was administered, were also considered. As per the CfC sites, a sufficient population size of 2-3 year old children (the age of the study children in Wave 1) was required.
2.3 Phase 2 sample recruitment
In September-October 2011, DSS provided the fieldwork agency, the Social Research Centre, with the sampling units for the Phase 2 CfC evaluation. The sample file for the continuing CfC cohort provided up-to-date contact records and details for the Phase 1 participants. A total of 2,037 records were provided across all of the CfC and contrast sites, with 2,011 of these having eligible contact numbers.
A pilot study tested the questionnaire before the start of the main study. As part of the pilot study, the Social Research Centre mailed out to all potential respondents a pre-approach letter introducing the study and encouraging participation. A freecall (1800) telephone number to assist with query resolution was sent to sample members, in addition to a brochure providing more information about the SFIA study and the study's website address. A random selection process was applied in selecting the pilot study sample, with 55 interviews conducted in total.
Following the conclusion of the pilot study in late October 2011, the main data collection periods for the CfC cohort were November 2011 to January 2012 (for Wave 4), and September 2012 to November 2012 (for Wave 5). The sample was released in batches so that calls to each could be exhausted before releasing new numbers. Similarly to the pilot study, letters were sent out to the sample members within each batch a few days prior to the commencement of interviews.
A number of call procedures were applied in order to maximise the quantity as well as representativeness of the sample. These included spreading contact attempts over weekdays, weekends, and across various parts of the day; calling later in the day to ensure respondents in WA, SA and NT were called, up until 8:30 pm; using the contact details for both parents; leaving voicemail messages on mobile phones; scheduling appointments so sample members could complete their interview at a convenient time; and calling sample members back until non-contact records were resolved.
The interviews were conducted with the person in the family who knew most about the child (the primary carer). In most cases (96%), this was the mother. In the remaining cases, the primary carer was the child's resident father, a relative who was the primary carer for the child or a foster parent.
2.4 The questionnaire and interviewing methodology
The survey instrument was developed with a focus on including the primary outcome measures that would enable the effects of the CfC initiative to be evaluated. Although it was important to retain as much of the Phase 1 questionnaire content as possible so that longitudinal data across the same measures could be collected for the CfC cohort, some changes were necessary due to:
- using a different data collection method - at-home interviews were conducted in Phase 1 versus telephone interviews in Phase 2; and
- time restrictions - the mean interview length in Phase 1 was approximately 60 minutes, but in Phase 2 were restricted to 25 minutes.
Once all of the items were confirmed for the questionnaire, the Social Research Centre transformed the content into a computer-assisted telephone interviewing (CATI) script, and performed a thorough testing process to ensure all skips and loops worked correctly.
2.5 Outcome measures
In Phase 1, the primary outcome measures related to the four overall objectives of the Australian Government's former Stronger Families and Communities Strategy (2004-09), of which CfC was an integral part. These were:
- healthy young families;
- supporting families and parents;
- early learning and care; and
- child-friendly communities.
In Phase 2, we slightly modified the first and second of these categories, primarily to reflect the ageing of the study child. The "healthy young families" category from Phase 1 was divided into child behaviour and primary carer's health. The "supporting families and parents" category from Phase 1 was also divided, into parenting style, parental conflict, and jobless households. Box 1 contains details about the outcome measures included in the analysis.
Box 1: Outcome measures
Child behavior
- The number of child injuries requiring medical attention in the past 12 months.
- Child physical functioning, as assessed using the 8-item Pediatric Quality of Life (PedsQL) Inventory (Varni, Burwinkle, Seid, & Skarr, 2003).
- Child emotional and behavioural problems, as assessed using the 20-item Strengths and Difficulties Questionnaire (SDQ; Goodman, 1997).1
- A global rating of the primary carer's physical health.
- The primary carer's mental health, as measured using the 6-item Kessler-6 scale (Kessler et al., 2003).
- Argumentative relationship, assessed through a 5-item scale of the frequency of verbal and physical arguments, derived from LSAC.
- A measure indicating a jobless household (no parent in paid employment).
Parenting style
- Primary carers' self-ratings of hostile/irritable parenting and warmth, sourced from LSAC and the National Longitudinal Study of Children and Youth (NLSCY; Statistics Canada & Human Resources Development Canada, 1995).
- A single-item measure of parenting self-efficacy, taken from LSAC.
Early learning and care
- Primary carer or other adult read with study child from a book every day or almost every day.
- Primary carer or other adult drew pictures or did other craft activities with the study child every day or almost every day.
- Primary carer or other adult played music, sang songs, danced or did other musical activities with study child every day or almost every day.
- Primary carer or other adult played a game outdoors or exercised together (like walking, swimming, cycling) with the study child every day or almost every day.
Child-friendly communities
- A single item detecting primary carer's involvement in community service activities, such as volunteering at school or coaching a sports team.
- Community social cohesion, measured on a 5-item scale relating to primary carer's perceptions of trust, reciprocity and shared values existing between individuals in the local community (Sampson, Raudenbush, & Earls, 1997).
- Neighbourhood unsafe to raise children, based on three items indicating whether the neighbourhood is safe and clean in general, and safe for children in particular.
- A measure of unmet service needs, focusing on difficulties accessing medical, developmental, family support or mental health services.2
Notes:
1 This measure is applicable to children 4 years and over only, and so is measured at Wave 4 only.
2 This indicator was developed in Phase 1 of SFIA, which assessed whether respondents had difficulties accessing medical, developmental, family support or mental health services. In Phase 2, an additional component was included for these service areas, which inquired as to whether any of the occasions in which the applicable services were required were an emergency or crisis.
Overall, these scales (i.e., multi-item measures) have demonstrated good internal consistency reliability (see Edwards et al., 2009). As previously mentioned, it was not possible to retain all outcome measures due to a reduced interview length and change in interview method (i.e., from face-to-face to telephone), but as many as possible were retained so that changes in these outcomes could be tracked over time for the CfC cohort.
There are a few changes to the outcomes measured in Phase 2 of the evaluation. There were 19 outcome variables in Phase 1, with 15 of these outcomes measured at Wave 1 and Wave 3. We measured all except two of these outcomes again at Wave 4 and Wave 5. The measure relating to community facilities and a measure of children's weight were not collected at Waves 4 and 5, and in both cases, the move from face-to-face to telephone interviewing was the key factor. The measure of community facilities was dropped because of interview time constraints, and the telephone interview format was deemed unsuitable for collecting data on children's weight.
Another change relates to the measure of early learning and care, measured in Phase 1 using a single indicator. In Phase 2, we divided this into four distinct activities (bearing in mind that the study children were older and that it was important to distinguish between different aspects of the home learning environment).
It is important to note that for some outcomes, higher scores are positive (e.g., child physical health), while for other outcomes, higher scores are negative (e.g., hostile parenting). Therefore, it follows that a positive effect (+) indicates an improvement for positively scaled outcomes (e.g., increased child health), while a negative effect (-) indicates an improvement in negatively scaled outcomes (e.g., decreased hostile parenting). In order to facilitate the interpretation of the results (see Chapter 3), Table 2.1 summarises all the outcomes used in the evaluation and reports the direction that indicates a positive outcome of CfC.
| Outcome measure | Direction of positive effects for CfC |
|---|---|
| Child number of injuries requiring medical attention | - |
| Child physical health (PedsQL) | + |
| Child total emotional and behavioural problems (SDQ) | - |
| Primary carer's general health (high health) | + |
| Primary carer's mental health problems | - |
| Hostile parenting | - |
| Parenting high self-efficacy | + |
| Parental conflict | - |
| Living in a jobless household | - |
| Primary carer reading with child | + |
| Primary carer doing arts and crafts with child | + |
| Primary carer playing music with child | + |
| Primary carer playing outdoor games and exercising with child | + |
| Primary carer's involvement in community service activity | + |
| Community social cohesion | + |
| Community unsafe for children | - |
| Unmet service needs | - |
2.6 Response rates and attrition
2.6.1 Response patterns
Table 2.2 shows the response patterns for the CfC cohort in Phase 1 (Waves 1 to 3) and Phase 2 (Waves 4 and 5). A total of 1,434 telephone interviews were completed at Wave 4, which represents a 74% response rate for the total sample of 1,923 participants, drawn from 2,011 contact numbers that were provided in the sample file. Some call outcomes - including disconnected numbers and the named person not being known - were excluded from this figure, thereby reducing the total sample to 1,923. Some families who participated in Wave 1 did not participate at Wave 4 because either they could not be contacted via telephone (n = 256; 13%), or they explicitly refused or opted out (n = 181; 9%). At Wave 5, 1,124 interviews were completed, representing an 85% response rate out of 1,328 eligible contact numbers. Only a small proportion actually refused to be interviewed at Wave 5 (n = 85; 6%). The remaining non-responses were associated with non-contact (n = 52; 4%), or the respondent was away for the entire data collection period, or otherwise out of scope (n = 55; 4%). Finally, appointments were made for 12 respondents but no interview was completed.
| Wave and year | Total sample | Total interviews | Response rate (%) |
|---|---|---|---|
| Phase 1 | |||
| Wave 1, 2006 | 3,379 | 2,202 | 65.6 |
| Wave 2, 2007 | 2,202 | 2,014 | 92.0 |
| Wave 3, 2008 | 2,034 | 1,835 | 90.3 |
| Phase 2 | |||
| Wave 4, 2011 | 1,923 | 1,434 | 74.6 |
| Wave 5, 2012 | 1,328 | 1,124 | 84.6 |
As can be observed in Table 2.2, the Wave 4 response rate was lower than those for Waves 2 and 3. Although there was less than 12 months between Waves 2 and 3, there was a much larger gap of 3.5 years between Waves 3 and 4, thereby making retention more difficult. The response rate at Wave 5 increased, though it is clear that attrition continued as the study progressed.
2.6.2 Attrition in CfC cohort
As noted in Table 2.2, there was a modest degree of sample attrition in the CfC cohort in Phase 2. To analyse the reasons for this attrition, we took the sample at Wave 1 and identified those who responded to Waves 4 and 5 and those who dropped out. We then conducted a logistic regression analysis to examine factors (measured at Wave 1) associated with dropping out of the survey at the later waves. The variables included in the regression analyses were: whether the child was of Aboriginal or Torres Strait Islander origin; the age, education and employment status of the primary carer; whether the primary carer was born overseas; household income; and whether the father was "present and working", "present and not working" or "absent".
The results, reported in Table 2.3, show that there was no significant difference in the attrition rates between families in CfC sites and those in comparison sites. However, attrition was significantly associated with a range of factors. Families where the primary carer had completed Year 12 or were older were less likely to drop out. Lone-parent families and families where the second parent was not employed were significantly more likely to drop out, as were families with primary carers in paid employment. Families where the primary carer was born overseas were significantly more likely to dropout. Differences in attrition rates were not, however, associated with household income. It is typical for attrition to be associated with the factors reported in Table 2.3 (see Daraganova & Sipthorp, 2011, for details of factors associated with attrition in LSAC). It is important, therefore, to control for these factors to guard against bias in the results arising from attrition.
| Wave 4 | Wave 5 | |
|---|---|---|
| CfC site | 1.08 | 1.11 |
| Child is Aboriginal or Torres Strait Islander | 1.63 ** | 1.64 ** |
| Primary carer older | 0.59 *** | 0.50 *** |
| Primary carer completed Year 12 | 0.78 * | 0.83 |
| Primary carer employed | 1.73 *** | 1.55 ** |
| Father present not working | 2.13 *** | 2.40 *** |
| Father not present | 1.69 *** | 1.95 *** |
| Primary carer born overseas | 1.32 * | 1.75 *** |
| Household income | 1.00 | 1.00 |
| No. of observations | 2,202 | 2,202 |
Notes: N = 1, 927; *** p < .001; ** p < .01; * p < .05. Odds ratios < 1.0 reflect a negative association. Odd ratios > 1.0 reflect a positive association. Odds ratios ? 1.0 reflect no association.
In addition, we estimated models including interactions between each of these variables and a variable indicating the families that live in a CfC site (results not shown). This allowed us to test whether the association between sample attrition and any of these factors differed for families in CfC and contrast sites. It would allow us to see, for example, whether the primary carer's level of education influenced dropout in CfC sites but not contrast sites. If this were the case, we would have evidence for selective attrition, which could affect the validity of the contrast sites. The main effect for all CfC interactions was insignificant, which indicates clearly that patterns of attrition were similar for CfC and contrast sites. In other words, there was no selective attrition with respect to the family characteristics observed in the study.
2.7 Evaluation design and analytic approach
In this report, we employ a range of analytic techniques to explore patterns of change and stability across the range of indicators in both comparison and CfC sites, from the onset of the study (Wave 1) to the most recent data collection (Wave 5). Following the approach in the Phase 1 evaluation we omit data collected at Wave 2 due to the relatively short period of time between Waves 1 and 2 (less than 1 year). We first provide a descriptive overview of outcomes at baseline (Wave 1) and then provide a further description of patterns of change across Waves 3, 4 and 5. We do this for the whole sample, and for subgroups based on income and education (details of which are provided below).
We then test whether there are significant differences at each point in time from baseline through to Wave 5 using cross-sectional regression analyses that control for the gender and age of the child; whether the child was of Aboriginal or Torres Strait Islander origin; primary carers' age, education and labour force status; household income; whether at least one of the parents was born overseas; and whether the father was "present and working", "present and not working" or "absent". This analysis allows us to assess whether differences between CfC and comparison sites emerged (or disappeared) at particular points in time.
Following descriptive and multivariate analyses at each wave, we employed difference-in-difference modelling to assess differences in patterns of change between waves in CfC and comparison sites. This approach compares a treatment (CfC) group with a contrast group at multiple points in time. The basic premise of this approach is that the patterns observed over time in comparison sites are those that would have prevailed in CfC sites had there been no intervention. Underscoring this premise is the requirement that the CfC and comparison sites were broadly comparable initially. However, with the difference-in-difference approach, it is possible to explicitly control for any known differences in the CfC and contrast sites so that these do not influence the robustness of the findings.3 Therefore, this approach provides a relatively strong indication of a program effect, but because it relies on changes, it depends heavily on precise estimates of those changes, and thus can be vulnerable to issues around measurement error. In other words, the capacity to detect statistically significant differences in changes in outcomes is dependent on the precision of the measurements at two time points.
The difference-in-difference model specifications include a variable indicating whether the family lived in a CfC site or a comparison site (comparison is the reference site). In addition, they include a variable indicating whether the observation is at Wave 1, Wave 3, Wave 4 or Wave 5 (Wave 1 is the reference time point). The key variables in these models are interactions between the indicators for CfC and Waves 3, 4 and 5. These variables tell us whether there was a significant difference in the change in an outcome at Waves 3, 4 or 5 relative to Wave 1 for CfC families relative to contrast families. In other words, it will tell us whether CfC families changed between Wave 1 and Waves 3, 4 or 5 at a greater or lesser rate than contrast families, or whether there are no significant differences between the rates of change for the two groups.
The additional control variables included in all difference-in-difference regression analyses were: the gender and age of the child; whether the child was of Aboriginal or Torres Strait Islander origin; primary carers' age, education and labour force status; household income; whether at least one of the parents was born overseas; and whether the father was "present and working", "present and not working" or "absent".4
Although the difference-in-difference models provide the strictest test of program effects, the methodological approach in this report is motivated by an understanding of the complexity of the program and of the nature of change in this context. Therefore, we have sought to provide a comprehensive overview both of patterns in the outcomes between comparison and CfC sites at distinct points in time, and of patterns of change in stability in these outcomes over time in comparison and CfC sites.
3. The effects of the CfC initiative on child, family and community outcomes
This chapter describes differences between families in CfC and comparison sites across the five waves of surveys for Stage 1 CfC sites. We report the average levels for all outcomes (unadjusted for other factors) at each wave, though we only report on findings that remained statistically significant after adjusting for other factors at each wave. These are equivalent to the cross-sectional results from Phase 1 of the evaluation. In addition, we provide details of significant results from difference-in-difference models, which provide an indication as to whether there have been significant differences in rates of change at Waves 3, 4 and 5 compared with Wave 1 between comparison and CfC sites (more details of this methodology are given in section 2.7).
Following the methodology established in Phase 1, in addition to analysing the overall sample, we analyse subgroups relating to income and education. Firstly, we consider lower income families (bottom 20% of income distribution at Wave 1) compared with higher income families (top 80% of income distribution at Wave 1). Secondly, we look at families with a lower level of education (primary carer has Year 10 or lower) compared with the remaining families (primary carer with Year 11 equivalent or higher). These analyses provide an opportunity to explore the robustness of findings for the overall sample and to assess whether the effects are more or less pronounced within different groups. Note, however, that the reduced sample size for the subgroup analyses (especially for subgroups with lower income or education) likely reduces the power of the analyses to detect statistically significant differences.
Table 3.1 reports the proportion of families with a primary carer who had higher and lower levels of education with families with incomes in the top 80% and in the bottom 20%. Overall, about one-third of families had a primary carer with a lower level of education (Year 10 or lower) at Wave 1. Not surprisingly, the majority of families with a primary carer who had a higher level of education had an income in the top 80% of the distribution of income at Wave 1. Perhaps more surprisingly, among families in the bottom 20% of the income distribution, about half of the primary carers had Year 11 or higher and half had Year 10 or lower. This suggests that the level of education of the primary carer is perhaps less effective as a means of identifying the most disadvantaged families with children of these ages. It does serve, however, as a useful comparison group to further assess the effects of the CfC initiative.
| Education level | Top 80% income (%) | Bottom 20% income (%) | Totals |
|---|---|---|---|
| Year 11 or higher | 71.1 | 51.1 | 66.9 |
| Year 10 or lower | 28.9 | 48.9 | 33.1 |
| Totals | 100.0 | 100.0 | 100.0 |
Notes: c2(1), 65.6; p < .001 indicates a significant degree of association (i.e., non-independence) between these indicators.
3.1 Jobless families
This section considers results relating to jobless families. We start with a descriptive overview of rates of jobless families in CfC and comparison sites in Waves 1, 3, 4 and 5, and further explore patterns in income and education subgroups. Finally, we present results from difference-in-difference analyses.
3.1.1 Descriptive overview
Table 3.2 reports the proportions of jobless families in CfC and comparison sites across four waves of the study, including Phase 1 (Waves 1 and 3) and Phase 2 (Waves 4 and 5) of the evaluation. Rates of joblessness were very similar between the two types of sites at Wave 1, though they are slightly lower in CfC sites (a marginally significant difference; p < .08). By Wave 3, a significant difference in joblessness emerged, and this was one of the key findings from Stage 1 of the evaluation.5 However, by Waves 4 and 5, rates of joblessness were again very similar in the comparison and CfC sites.
| Wave 1 (%) | Wave 3 (%) | Wave 4 (%) | Wave 5 (%) | |
|---|---|---|---|---|
| Comparison sites | 29.1 + | 24.4 ** | 18.8 | 16.1 |
| CfC sites | 27.1 | 19.4 | 17.0 | 14.9 |
Notes: Significant differences are derived from cross-sectional regressions adjusted for child gender and Indigenous status, primary carer age and education, and cultural background. *** p < .001; ** p < .01; * p < .05; + p < .08.
3.1.2 Patterns in income and education subgroups
Figure 3.1 reports the proportion of jobless families in CfC and comparison sites, further disaggregated by the lower and higher income and education subgroups. Not surprisingly, rates of joblessness were substantially lower in the relatively more advantaged families in both CfC and comparison sites, and across waves. This was particularly pronounced with the income subgroup.
Figure 3.1: Proportion of jobless families at Waves 1, 3, 4 & 5, by level of income and education, comparison and CfC sites
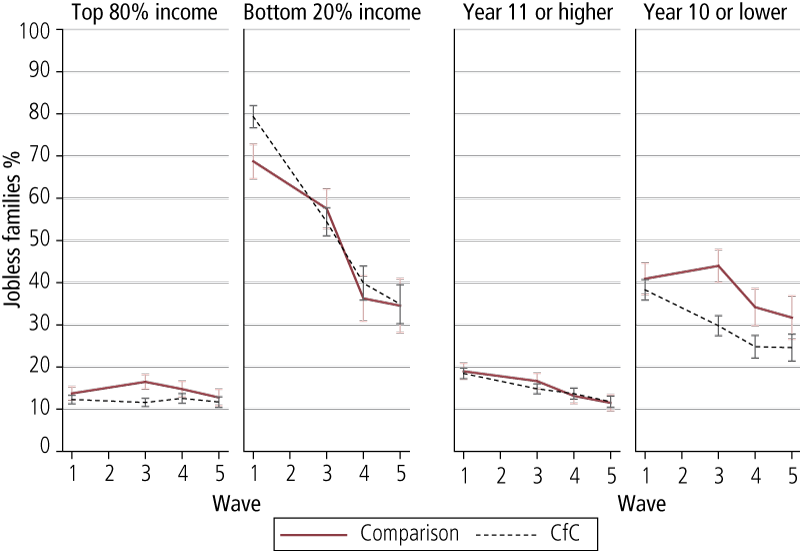
Looking at the majority of families in the top 80% of the income distribution (at Wave 1) the pattern of joblessness across waves very much drives the patterns reported in Figure 3.1, with a significant difference only emerging at Wave 3. However, the difference was not sustained, with rates of joblessness at Waves 4 and 5 being very similar between CfC and comparison sites.
There was a dramatic decrease in joblessness from Wave 1 to Wave 5 for families who were in the bottom 20% of the income distribution at Wave 1 in both CfC and comparison sites. The rate of joblessness appeared to be somewhat higher for families in CfC sites at Wave 1, but this was not statistically significant after adjusting for other factors. At all other waves, for this lower income group, rates of joblessness in CfC and comparison sites were very similar.
The third and fourth panels of Figure 3.1 relate to families where the primary carer had higher and lower levels of education respectively. In the families with a primary carer with Year 11 or higher education, the rates of joblessness dropped over time in a very similar fashion for both CfC and comparison sites, and there were no statistically significant differences between these subgroups at any wave. The presence of a relatively high proportion of lower income families in the subgroup with higher levels of education likely underscores the relative similarity of joblessness at Wave 3 between comparison and CfC sites in the subgroup with higher levels of education. (It is important to bear in mind that half of families in the lower income group, where there was no significant difference in joblessness at Wave 3 between CfC and comparison sites, had Year 11 or equivalent; see Table 3.2.)
Rates of joblessness were higher among families where the primary carer had a lower level of education (Year 10 or lower). This is particularly the case with comparison group families, who had significantly higher rates of joblessness than CfC families at all waves except Wave 5. The difference in rates of joblessness across all waves between subgroups with higher and lower levels of education is less pronounced than the differences observed between higher and lower income subgroups, which is likely because these education subgroups are more diffuse with respect to income, which was particularly strongly associated with joblessness. This is likely to be because some primary carers with higher levels of education temporarily give up employment when they have children, and thus are temporarily in the lower income bracket. Once their children are old enough to attend child-care, many of these primary carers return to work. Primary carers who have Year 10 or below may not have similar opportunities to return to the workforce, as their workforce participation is likely to have been much lower before they had children in the first place.
3.1.3 Difference-in-difference results
As described in section 2.7, we estimated difference-in-difference models to assess the program's effects. We used these models to compute estimates of the percentage change in the odds of being a jobless family at different points in time for families in comparison and CfC sites. In addition, we tested the extent to which there were differential effects in CfC sites compared with comparison sites. This is captured in the model using an interaction between waves and the variable indicating whether the family lived in a CfC site. In assessing the patterns of change over time, we consider changes in odds in tandem with a more descriptive assessment of changes in the outcomes over time.
Table 3.3 shows the percentage change in the odds of being a jobless family at Waves 3, 4 and 5 compared with Wave 1, for families in comparison sites and CfC sites.
| Comparison sites (% change in odds) | CfC sites (% change in odds) | |
|---|---|---|
| Wave 3 compared with Wave 1 | -10.5 | -48.7 * |
| Wave 4 compared with Wave 1 | -39.7 | -40.4 |
| Wave 5 compared with Wave 1 | -47.1 | -41.4 |
Notes: Statistical significance is derived from difference-in-difference models. *** p < .001; ** p < .01; * p < .05; + p < .08.
The odds of being a jobless family at Wave 3 compared with Wave 1 for families in CfC sites was 49%, whereas for families in comparison sites, the odds reduced by only 11%. The difference in these reductions is statistically significant (p < .05). In other words, the percentage reduction in the odds of being a jobless family was significantly greater in CfC sites than in comparison sites. This echoes the results reported in Table 3.2, which shows a 5% decrease in joblessness in comparison sites (between Wave 1 and 3) compared with an 8% decrease in CfC sites over this period. This is simply a restatement of one of the key findings from Stage 1 of the evaluation, highlighting a positive effect relating to joblessness.
Table 3.3 also shows that for both CfC and comparison sites, there was a substantial reduction in the odds of being a jobless family at Waves 4 and 5, compared with Wave 1. The similarity between CfC and contrast sites in the reduction by Waves 4 and 5 echoes the descriptive results reported in Table 3.2.
Table 3.4 shows the percentage change in the odds of being in a jobless family at Waves 3, 4 and 5 compared with Wave 1 for families in CfC and comparison sites for the income and education subgroups. We present the results for the relatively more disadvantaged families, as this was the only group with significant differences. The results highlight a significant difference in the percentage reduction of the odds of being in a jobless family between comparison and CfC sites in relatively more disadvantaged groups. Specifically, for lower income families, the reduction in the odds of joblessness at Wave 3 was significantly greater in CfC sites (86%) compared with comparison sites (62%), but by Waves 4 and 5, although families still had significantly reduced odds of being jobless, there was no longer a statistically significant difference between CfC (94%) and contrast sites (90%). There was a similar result among lower educated families, where differences in the change in odds at Wave 3 were no longer evident at Waves 4 and 5. Surprisingly, for lower educated families, the odds of being jobless at Wave 3 compared with Wave 1 increased by 30% in comparison sites, while the odds reduced by 61% in CfC sites. However, as with the overall results, at Waves 4 and 5 there were no longer any significant differences in any changes in the odds of being a jobless family between comparison and CfC sites, compared with Wave 1.
| Comparison sites (% change in odds) | CfC sites (% change in odds) | |
|---|---|---|
| Bottom 20% of income | ||
| Wave 3 compared with Wave 1 | -62.4 | -85.6 * |
| Wave 4 compared with Wave 1 | -87.6 | -92.5 |
| Wave 5 compared with Wave 1 | -89.5 | -93.9 |
| Year 10 or lower | ||
| Wave 3 compared with Wave 1 | 29.7 | -61.3 * |
| Wave 4 compared with Wave 1 | -14.2 | -55.4 |
| Wave 5 compared with Wave 1 | -15.3 | -44.9 |
Notes: Statistical significance is derived from difference-in-difference models; *** p < .001; ** p < .01; * p < .05; + p < .08.
These results suggest that the CfC initiative reduced the rate of jobless families when the target children were aged 4-5 years, but that by the time children were 7-8 years of age, increased employment in families in comparison sites meant that rates of joblessness converged. The improvement corresponds to a period when the target child was entering school, which would have provided all primary carers with more free time to engage in the workplace and may explain the similar reduction in jobless households for contrast sites at this later wave. Importantly, while the trajectories of the two groups were different over the four waves (with CfC families benefitting from lower levels of joblessness earlier on than contrast families), there was no significant difference between them by Waves 4 and 5.
What is unknown is whether there are any demonstrable benefits to children or their families from the earlier reduction of joblessness in CfC sites. The findings indicate that children in CfC families were likely to have spent less time in total growing up in a jobless family. Certainly there is good evidence to suggest that at the individual level, the longer the duration of unemployment the greater the negative effects (e.g., on mental health, Paul & Moser, 2009; subsequent employment and earnings, Arulampalam, Gregg, & Gregory, 2001; and child wellbeing, Gray & Baxter, 2012). We will explore this issue when we examine associations between joblessness and children's educational outcomes, using NAPLAN data, in Chapter 6.
3.2 Primary carer health
In this section, we focus on primary carers' self-reported health status, and specifically whether or not primary carers reported having good or excellent health. The analysis starts with a descriptive overview of the proportion of primary carers in CfC and comparison sites in Waves 1, 3, 4 and 5 who reported good or excellent health. Following this, we further explore patterns of self-reported good or excellent health in income and education subgroups. Finally, we present results from difference-in-difference analyses.
3.2.1 Descriptive overview
Table 3.5 reports the percentage of primary carers who reported high levels of health (good or excellent) across all waves in CfC and comparison sites. The percentages are very similar across waves and they do not differ significantly between primary carers in CfC and comparison sites.
| Wave 1 (%) | Wave 3 (%) | Wave 4 (%) | Wave 5 (%) | |
|---|---|---|---|---|
| Comparison sites | 59.7 | 62.5 | 59.2 | 62.2 |
| CfC sites | 60.6 | 61.1 | 62.1 | 61.8 |
Notes: Statistical significance is derived from cross-sectional regression models adjusted for child gender and Indigenous status, primary carer age and education, cultural background, father involvement and family income. *** p < .001; ** p < .01; * p < .05; + p < .08.
3.2.2 Patterns in income and education subgroups
Figure 3.2 shows the percentage of primary carers reporting good or excellent health across Waves 1, 3, 4 and 5 in CfC and comparison sites by income and education subgroups. There was no significant difference between CfC and comparison sites at any wave in the self-reported physical health of primary carers in the top 80% or bottom 20% of the income distribution. In the lower income group, self-reported health tended to be lower, and there was relatively more variation across the waves; however, the proportion of primary carers with good health remained similar between CfC and comparison sites at each wave.
Figure 3.2: Proportion of primary carers reporting good health at Waves 1, 3, 4 & 5, by level of income and education, comparison and CfC sites
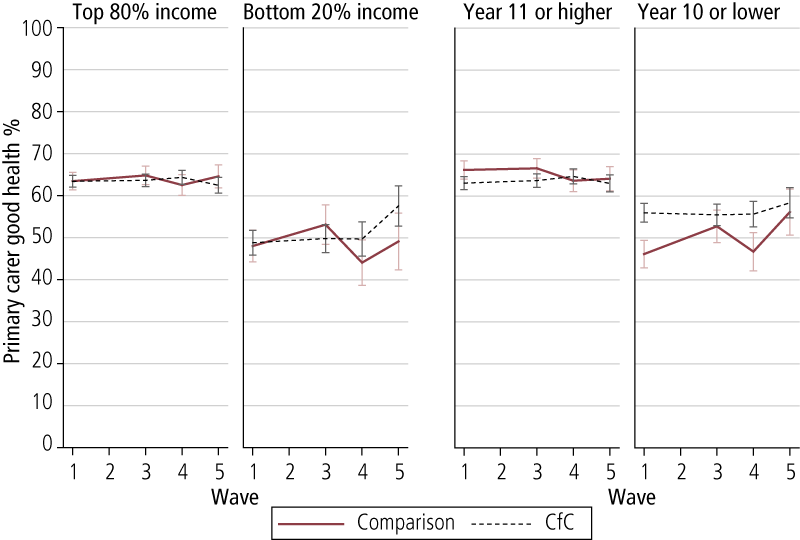
At Wave 1, primary carers with a Year 11 or higher level of education in CfC sites were slightly less likely to report good/excellent health than those in comparison sites (p < .08), but thereafter there were no differences between comparison and CfC sites. In contrast, at Wave 1, primary carers with a lower level of education (Year 10 or lower) in CfC sites were more likely to report good/excellent health than their counterparts in comparison sites (p < .05). At Wave 3, the proportion of lower educated primary carers in comparison sites reporting good/excellent health increased, and there was no significant difference between CfC and comparison sites. A gap appeared to emerge again at Waves 4 and 5 (favouring CfC sites), but this was not statistically significant after adjusting for other factors.
3.2.3 Difference-in-difference results
Overall, from the difference-in-difference analysis, there were no significant differences between primary carers in CfC and comparison sites with respect to changes in the odds of reporting good health at Waves 3, 4, and 5 compared with Wave 1. This reflects the descriptive analysis above that showed no significant difference between CfC and comparison sites in the proportion of primary carers who reported good health across the waves. The only significant differences in the income and education subgroups related to families where the primary carer had lower levels of education. Table 3.6 shows the percentage change in the odds of a primary carer with lower levels of education reporting good health at Waves 3, 4, and 5 compared with Wave 1 for families in comparison and CfC sites.
In CfC sites, there were slightly reduced odds (-16%) at Wave 3 of a lower educated primary carer reporting good health, whereas the odds increased by 68% for lower educated primary carers in comparison sites. The divergence in these results is statistically significant. Broadly, this reflects the pattern shown in the fourth panel of Figure 3.2, where there was a sharp increase at Wave 3 for comparison group primary carers, who were significantly less likely than primary carers in CfC sites to report good health at Wave 1.
A similar pattern is found for Wave 5 when compared with Wave 1. Between Waves 1 and 5 there was just over a 100% increase in the odds of reporting good health for lower educated primary carers in comparison sites. The percentage change in odds was more muted for lower educated primary carers in CfC sites (-11%). But, as depicted in Figure 3.2, there was no significant difference at Wave 5 between lower educated primary carers in comparison and CfC sites, so the increased odds of lower educated primary carers in comparison sites reflects them "catching up" to the higher self-reported health of those in CfC sites.
| Comparison (% change in odds) | CfC (% change in odds) | |
|---|---|---|
| Wave 3 compared with Wave 1 | 68.2 | -16.4 * |
| Wave 4 compared with Wave 1 | 17.6 | -21.1 |
| Wave 5 compared with Wave 1 | 113.3 | -10.7 * |
Notes: Statistical significance is derived from difference-in-difference models and corresponds to numbers within each row. *** p < .001; ** p < .01; * p < .05; + p < .08.
In this particular instance, the difference-in-difference estimates for the physical health of primary carers with lower levels of education are being driven by pre-existing differences at baseline (Wave 1). There were quite marked differences at Wave 1 in the percentage of primary carers who reported good or excellent health (46% for comparison sites and 56% for CfC sites). In CfC sites, the percentage of primary carers reporting good or excellent health was largely unchanged over the four waves, and therefore suggests that the CfC initiative is not leading to primary carers in these sites being worse off. Rather, this result is likely due to "regression toward the mean", a phenomenon where extreme measurements revert back to their long-term average on subsequent measurement. Given that only a single item measured physical health, this is a likely explanation for the findings we observed.
3.3 Primary carer mental health and relationships
This section considers measurements of primary carers' mental health (depression) and argumentative relationships (see section 2.5 for details of these measures). We begin with an overall review of the average scores for the primary carer mental health and argumentative relationship scales. Then we consider results for income and education subgroups, and finish with a review of the results from difference-in-difference analyses.
3.3.1 Descriptive overview
Table 3.7 reports the average scores for the K6 depression scale and the argumentative relationship scale. Recall from section 2.5 that both scales range from 1 to 5, and that higher scores indicate more problems. Broadly, the average scores on both scales lie very close to the minimum on both scales, and are very similar for primary carers in comparison and CfC sites across all waves. The only exception to this relates to primary carer mental health, where the average was significantly lower for primary carers in CfC sites (M = 1.67) than in comparison sites (M = 1.74) at Wave 1. This is a small difference (corresponding to about 10% of one standard deviation when adjusted for other factors), and it does not persist across other waves.6 By Wave 4, mental health for primary carers in comparison sites had "improved" (i.e., there was a decrease in average K6 depression scores from 1.74 to 1.56), such that they were now similar to primary carers in CfC sites. In both groups, mental health improved across the waves, though the magnitude of change was low.
With respect to argumentative relationships, with the exception of Wave 3, the average scores were relatively stable across the waves, at around 1.9.
| Mental health (K6 depression scale) | Argumentative relationship | |||
|---|---|---|---|---|
| Comparison sites | CfC sites | Comparison sites | CfC sites | |
| Wave 1 | 1.74 * | 1.67 | 1.89 | 1.90 |
| Wave 3 | 1.64 | 1.59 | 2.09 | 2.07 |
| Wave 4 | 1.56 | 1.56 | 1.91 | 1.86 |
| Wave 5 | 1.52 | 1.52 | 1.87 | 1.86 |
Notes: Statistical significance is derived from cross-sectional regression models adjusted for child gender and Indigenous status, primary carer age and education, cultural background, father involvement and family income. *** p < .001; ** p < .01; * p < .05; + p < .08.
3.3.2 Patterns in income and education subgroups
Figure 3.3 shows the average scores for the mental health scale (top panel) and the argumentative relationship scale (bottom panel) across waves for the income (left panel) and education (right panel) subgroups in comparison and CfC sites. Looking first at mental health, there is no significant difference at any wave in mental health between primary carers in comparison and CfC sites in the top 80% of the income distribution, and there is an apparent, though small, decrease (i.e., improvement) in the average scores over the waves.
Figure 3.3: Average scores on the mental health and argumentative relationship scales at Waves 1, 3, 4 & 5, by level of income and education, comparison and CfC sites
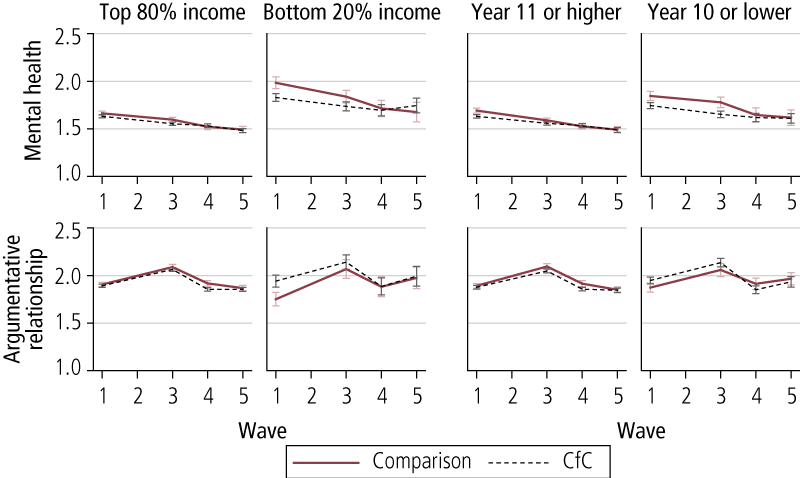
The average scores on the measure of mental health problems for primary carers in CfC sites in the bottom 20% of the income distribution were significantly lower than for those in comparison sites at Wave 1. This difference was not apparent in later waves. Recognising this initial difference, it is perhaps not surprising that improvements in mental health for lower income primary carers were therefore greater in comparison sites than in CfC sites. Patterns are very similar for the education subgroups, but in those cases there were no significant differences between comparison and CfC sites at any wave (adjusting for other factors).
The subgroup analysis for the argumentative relationship scale very much reflects the overall patterns reported in Table 3.7. The only exception relates to lower income families at Wave 1, where argumentative relationship scores were significantly higher for primary carers in CfC sites than comparison sites. However, this difference was no longer statistically significant after adjusting for other factors.
3.3.3 Difference-in-difference results
There were no statistically significant results at any wave from the difference-in-difference models for the argumentative relationship scale overall and within the income and education subgroups. There were some significant results, however, from the difference-in-difference models for mental health.
Table 3.8 reports the difference-in-difference coefficients from the model for mental health. They estimate the difference between primary carers in comparison and CfC sites with respect to changes in mental health at Waves 3, 4 and 5 compared to Wave 1. They show that across all families, there was a significant and positive difference-in-difference coefficient at Waves 4 and 5. In other words, the difference-in-difference models show that the difference in the changes in mental health at Waves 4 and 5 compared with Wave 1 between primary carers is significant in comparison as well as CfC sites.
| All | Bottom 20% income | Top 80% income | Year 10 or lower | Year 11 or higher | |
|---|---|---|---|---|---|
| Wave 3 | .03 | .11 | .01 | .06 | .02 |
| Wave 4 | .08 * | .15 | .06 + | .10 | .07 * |
| Wave 5 | .09 * | .31 ** | .05 | .17 * | .06 |
Notes: Statistical significance is derived from difference-in-difference models. *** p < .001; ** p < .01; * p < .05; + p < .08.
The Wave 4 effect is around 13% of a standard deviation and the Wave 5 effect is around 14% of a standard deviation. This reflects the descriptive findings reported above that showed that there was a larger decrease in the mental health scale in comparison sites than in CfC sites (though the former had a significantly higher mental health score than the latter at Wave 1).
Table 3.8 also shows the difference-in-difference results for income and education subgroups. The results show that the changes at Wave 4 appear to be concentrated in the relatively more advantaged families, especially for families with primary carers who have Year 11 or higher qualifications. The result at Wave 5, in contrast, is concentrated among the relatively more disadvantaged groups. This effect is particularly strong in the lower income group (50% of a standard deviation), while the effect in the lower education group is around 27% of a standard deviation.
When interpreting findings from these difference-in-difference estimates, it is particularly important to consider that mental health was significantly better in CfC sites than in contrast sites at baseline. This was particularly the case for the lower income subgroup. It is also important to note that after Wave 1 there were no statistically significant differences in primary carers' mental health overall, nor for any of the subgroups. Therefore, what is observed as a statistically significant difference-in-difference estimate is likely to be regression toward the mean.
3.4 Primary carer parenting self-efficacy
This section focuses on primary carers' self-reported parenting self-efficacy, and specifically whether they self-report as being highly effective parents. We provide a descriptive overview of the proportion of primary carers who self-reported as being highly effective across Waves 1, 3, 4 and 5 in comparison and CfC sites, and further disaggregate this by income and education subgroups. We then provide details of results from difference-in-difference analyses.
3.4.1 Descriptive overview
Table 3.9 reports the percentage of primary carers in comparison and CfC sites who self-reported as being highly effective parents across Waves 1, 3, 4 and 5.
| Wave 1 (%) | Wave 3 (%) | Wave 4 (%) | Wave 5 (%) | Total (%) | |
|---|---|---|---|---|---|
| Comparison sites | 66.5 | 60.8 | 63.5 | 62.5 | 63.9 |
| CfC sites | 59.9 | 59.2 | 62.7 | 62.2 | 60.3 |
Notes: Statistical significance is derived from cross-sectional regression models adjusted for child gender and Indigenous status, primary carer age and education, cultural background, father involvement and family income. *** p < .001; ** p < .01; * p < .05; + p < .08.
Primary carers in CfC sites were less likely to self-report as being highly effective parents at Wave 1 compared with primary carers in comparisons sites, but the difference was not statistically significant. At each wave, the proportions were very similar between CfC and comparison sites.
3.4.2 Patterns in income and education subgroups
Figure 3.4 shows the breakdown of self-reported high parenting efficacy across the income and education subgroups. The difference between comparison and CfC primary carers at Wave 1 is apparent in all groups, though it is much less pronounced in the group with Year 10 or lower education. However, after adjusting for other factors, the only significant difference was in the Year 11 or higher education group. High parenting self-efficacy was relatively similar across income groups up to Wave 4, but at Wave 5 it decreased for lower income families (in both comparison and CfC sites). High parenting self-efficacy was more prevalent among higher educated than lower educated primary carers.
Figure 3.4: Proportion of primary carers who self-reported as highly effective parents across Waves 1, 3, 4 & 5, by level of income and education, comparison and CfC sites
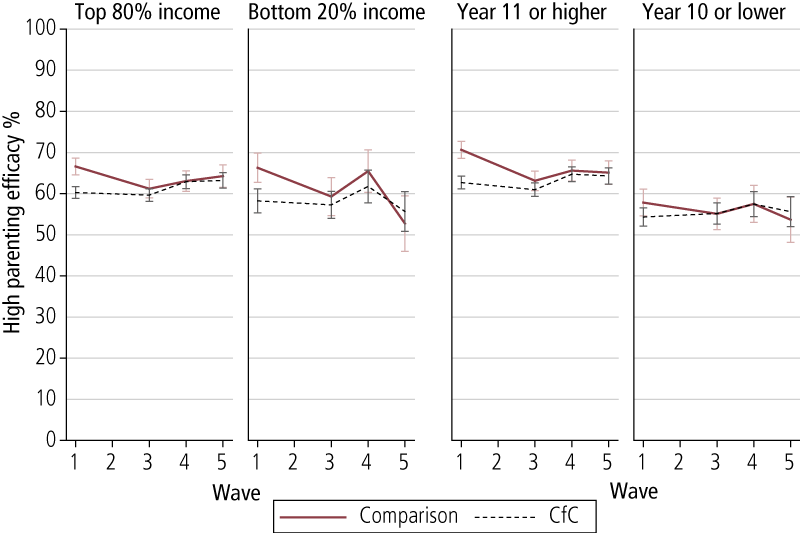
3.4.3 Difference-in-difference results
As reported in the Phase 1 evaluation, there was a marginally significant difference (p < .08) between primary carers in comparison and CfC sites with respect to changes in the odds of self-reporting as a highly effective parent between Waves 1 and 3. Specifically, there was a 40% reduction in the odds of primary carers in comparison sites reporting as highly effective parents compared with an 11% reduction for primary carers in CfC sites. This is clearly reflecting the decrease in the proportion of primary carers in comparison sites self-reporting as being highly effective compared with a relatively small decrease for primary carers in CfC sites, and the results from the difference-in-difference analysis show that this is marginally significant. Again, as reported in the Phase 1 evaluation, in the subgroups analyses this result was marginally significant (p < .08) in the higher educated subgroup only between Waves 1 and 3. There were no significant differences between comparison and CfC sites in any changes in the odds of primary carers self-reporting as highly effective parents at Waves 4 and 5 compared with Wave 1.
Between Waves 1 and 3 there was a decline in parenting self-efficacy in the comparison sites, while in the CfC sites, primary carers' ratings were relatively stable, leading to a positive difference-in-difference coefficient. Subgroup analysis suggests that this pattern of results was concentrated in primary carers who had higher levels of education. There were some modest pre-existing differences, with primary carers in comparison sites having higher ratings of parenting self-confidence, so it is possible that this finding reflects a regression toward the mean.
3.5 Primary carer parenting practices
This section looks at scale-measured outcomes relating to primary carers' parental warmth and hostility. Potential scores on parental warmth range from a low of 1 to a high of 5, and scores on the measure of parental hostility range from a low of 1 to a high of 10. Lower warmth and higher hostility indicate potential issues with parenting. We provide an overview of these scales across Waves 1, 3, 4 and 5, consider patterns in income and education subgroups, and then provide details of results from difference-in-difference analyses.
3.5.1 Descriptive overview
Table 3.10 reports the average scores of primary carers on the warm and hostile parenting scales. Overall, average warmth scores are very near the upper (positive) limit of 5, and average hostile scores are near the lower (positive) limit of 1. There was a modest decline in parental warmth and hostile parenting over the period. This coincides with the fact that the study child (in reference to whom the questions are asked) was growing older and spending more time away from parents, for example, in school.
| Warm parenting scores | Hostile parenting scores | |||
|---|---|---|---|---|
| Comparison sites | CfC sites | Comparison sites | CfC sites | |
| Wave 1 | 4.61 | 4.68 * | 3.30 | 3.31 |
| Wave 3 | 4.50 | 4.55 + | 3.45 | 3.29 ** |
| Wave 4 | 4.53 | 4.58 | 2.94 | 2.98 |
| Wave 5 | 4.42 | 4.50 * | 3.00 | 2.84 ** |
Notes: Statistical significance is derived from cross-sectional regression models adjusted for child gender and Indigenous status, primary carer age and education, cultural background, father involvement and family income. *** p < .001; ** p < .01; * p < .05; + p < .08.
There were many significant differences in parenting scores between primary carers in comparison and CfC sites. At all waves, primary carers in CfC sites averaged higher parental warmth scores, though the difference was marginally significant at Wave 3 and not significant at Wave 4. At Wave 1, the difference was about 10% of a standard deviation and at Wave 5 it was about 16% of a standard deviation. In addition, primary carers in CfC sites averaged significantly lower hostile parenting scores at Waves 3 and 5, with the difference around 15% of a standard deviation in both cases. Looking at patterns across waves, hostile parenting was relatively stable from Waves 1 to 3, and then decreased substantially at Wave 4 and increased again at Wave 5.
3.5.2 Patterns in income and education subgroups
Figure 3.5 shows the breakdown of parental warmth (upper panel) and hostility (lower panel) scores across the income (left panel) and education (right panel) subgroups. The first thing to note in relation to warm parenting is that the downward trend in this aspect of parenting is apparent across all subgroups. The second thing to note is that the difference in warm parenting between the comparison and CfC sites appears to be especially pronounced in the lower educated group, where primary carers in CfC sites averaged significantly higher parental warmth, with the exception of Wave 4. There were also substantial differences between comparison and CfC sites in the lower income group, but after adjusting for other factors these differences were no longer statistically significant. Finally, though relatively small, there were differences in the parental warmth of primary carers in comparison and CfC sites in the top 80% of the income distribution. These were significant at Wave 1 (p < .05) and to a lesser extent at Wave 5 (p < .08).
Turning to hostile parenting, the significant difference at Wave 3 (noted in Table 3.10) is observed in all subgroups except the lower income group, and the difference at Wave 5 (again noted in Table 3.10) is observed in the relatively more advantaged groups only (both in income and education). The broad patterns across time noted above are apparent to a greater or lesser extent in all subgroups. Hostile parenting tended to increase slightly from Wave 1 to 3 for comparison sites and the subsequent decrease at Wave 4 was more pronounced for these sites. Moreover, the increase at Wave 5 appears to be concentrated among relatively more disadvantaged families (both in terms of income and education).
Figure 3.5: Average parental warmth and hostility across Waves 1, 3, 4 & 5, by level of income and education, comparison and CfC sites
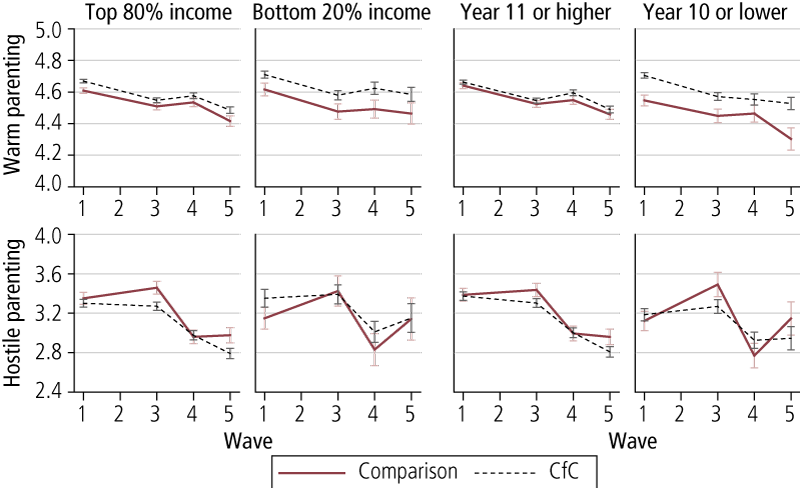
3.5.3 Difference-in-difference results
There was a marginally significant difference-in-difference result for hostile parenting at Wave 3 compared to Wave 1 (p < .08), which restates a finding from the Phase 1 evaluation. However, there were no significant difference-in-difference results at Waves 4 and 5.
Primary carers living in CfC sites consistently reported warmer parenting at baseline and at subsequent follow-up (Waves 3 and 5), which is likely to reflect pre-existing differences rather than the influence of CfC. Our results do suggest that the CfC initiative was somewhat effective in reducing harsh parenting practices. Firstly, the findings from the difference-in-difference model suggest that there was a significant reduction in hostile parenting between Waves 1 and 3. Secondly, the cross-sectional regressions support the view that primary carers in CfC sites engaged in lower levels of hostile parenting at Wave 3 and Wave 5. If there were differences at baseline, this finding would be less noteworthy, but in this instance it is important to note that, on average, the levels of hostile parenting in CfC and comparison sites were almost identical at baseline (there was a .01 point difference, which is .06% of a standard deviation). However, these differences were largely confined to more advantaged groups, as the cross-sectional estimates suggest lower levels of hostile parenting at Waves 3 and 5 for the higher education and income groups, with a positive gain found in the lower education group at Wave 3 only.
3.6 Primary carer-child shared activities
In this section, we consider primary carers' engagement in a range of shared activities with their children every day or almost every day (referred to as "often"). These activities are reading, arts and crafts, music and singing, and outdoor games and exercise. We begin with a descriptive overview of primary carers' engagement in each of these activities in Waves 1, 3, 4 and 5 in comparison and CfC sites. Then we consider patterns in the income and education subgroups, and finally present results from difference-in-difference results.
3.6.1 Descriptive overview
Table 3.11 reports the proportion of primary carers who engage in these activities with the study child every day or almost every day in comparison and CfC sites at Waves 1, 3, 4 and 5. At Wave 1, primary carers in CfC sites were significantly less likely to read to the study child often (42%) compared with primary carers in comparison sites (51%). However, this gap disappeared in subsequent waves, in tandem with a decrease in the proportion of primary carers reading with the study child often.
| Reading (%) | Arts and crafts (%) | Music and singing (%) | Outdoor games and exercise (%) | ||
|---|---|---|---|---|---|
| Wave 1 | Comparison sites | 51.0 * | 26.6 | 46.4 + | 35.7 |
| CfC sites | 42.3 | 26.8 | 50.3 | 36.6 | |
| Wave 3 | Comparison sites | 40.0 | 21.0 | 26.8 + | 29.0 |
| CfC sites | 37.7 | 17.9 | 31.0 | 27.9 | |
| Wave 4 | Comparison sites | 38.2 | 9.5 + | 24.8 | 21.2 |
| CfC sites | 33.9 | 11.8 | 26.9 | 22.4 | |
| Wave 5 | Comparison sites | 25.8 | 7.5 | 24.2 | 20.3 |
| CfC sites | 23.3 | 9.4 | 29.2 | 20.9 | |
| Total | Comparison sites | 41.3 | 18.9 | 32.7 | 29.0 |
| CfC sites | 36.7 | 18.6 | 36.5 | 29.5 |
Notes: Statistical significance is derived from cross-sectional regression models adjusted for child gender and Indigenous status, primary carer age and education, cultural background, father involvement and family income. *** p < .001; ** p < .01; * p < .05; + p < .08.
Engagement in arts and crafts activities is very similar between primary carers in comparison and CfC families, with the exception of Wave 4, where the latter are slightly more likely than the former to engage in this particular set of activities. The level of significance, however, is marginal (p < .08). At all waves, children in CfC families were more likely to engage in music and singing with their primary carers than their counterparts in comparison sites, but this was only marginally significant in Waves 1 and 3 and not significant in Waves 4 and 5. There were no significant differences in engagement in games and exercise between comparison and CfC sites across all waves.
3.6.2 Patterns in income and education subgroups
Figure 3.6 shows the proportion of primary carers who reported often engaging in reading, arts and crafts, music and singing, and games and exercise for the income and education subgroups.
A significantly lower proportion of primary carers in CfC sites in all subgroups except the lower income group read with their children often at Wave 1 (Figure 3.6, 1st row). The proportion of primary carers in CfC sites doing so is very similar between income subgroups. The lack of significant differences between CfC and comparison sites at Wave 1 arises because of the much lower proportion of lower income families in comparison sites who often read with their children. The proportion of primary carers who often read with the study child was very similar across other waves between CfC and comparison sites, though there was a marginally significant difference in reading at Wave 3 between CfC and comparison sites in the higher income subgroup (p < .08).
Overall, there was a downward trend in the rates of reading with children often, which is not surprising, as reading becomes more of an independent activity as children get older. Among the more disadvantaged groups, however, reading often was more stable across waves, though there was some volatility in the lower income comparison sites, which is most likely due to the smaller sample size than the other subgroups.
Frequent engagement in arts and crafts activities was less common than reading, though there was a similar downward trend over time that was more pronounced in the more advantaged subgroups, especially for comparison group families (see Figure 3.6, 2nd row). There was no significant difference in the proportion of primary carers who engaged in this activity often with the study child between CfC and comparison sites across all waves. The marginally significant difference at Wave 4 appears to be concentrated in the lower income subgroup, but this was not statistically significant after adjusting for other factors.
Patterns relating to music and singing differed markedly between the more and less disadvantaged groups (Figure 3.6, 3rd row). Among families in the top 80% of the income distribution or with primary carers who had more education, there was no significant difference in often engaging in this activity between comparison and CfC sites across all waves. This activity trended downwards relatively steeply up to Wave 3, and flattened thereafter. In the lower income and lower educated subgroups, families in CfC sites were significantly more likely to engage in music and singing with the study child across all waves. In the lower educated subgroup, there was no significant difference at Wave 3, and the difference at Wave 4 was marginally significant after controlling for other factors (p < .08). For the lower income group, though the differences were large, the small sample in this group reduced this statistical power and the difference was only marginally significant at Wave 3 (p < .08), though more significant at Wave 5 (p < .05). There was an apparent downward trend in this activity in comparison sites that extended across all waves, whereas in CfC sites, as with the relatively more advantaged subgroups, engagement in this activity became relatively stable after Wave 3.
The final activity relates to games and exercise (Figure 3.6, 4th row). As mentioned earlier, there were no significant differences in engagement in this activity between comparison and CfC sites overall. However, in the lower income subgroup, a significantly higher proportion of families in CfC sites engaged in this activity at Wave 3. There was a smaller but insignificant gap at Wave 1. In the lower education group, a small and marginally significant gap emerged at Wave 5 (p < .08). Generally, this activity was trending downwards and this pattern was observed in all subgroups.
Figure 3.6: Proportion of primary carers who reported often reading, engaging in arts, music, or games with children at Waves 1, 3, 4 & 5, by level of income and education, comparison and CfC sites
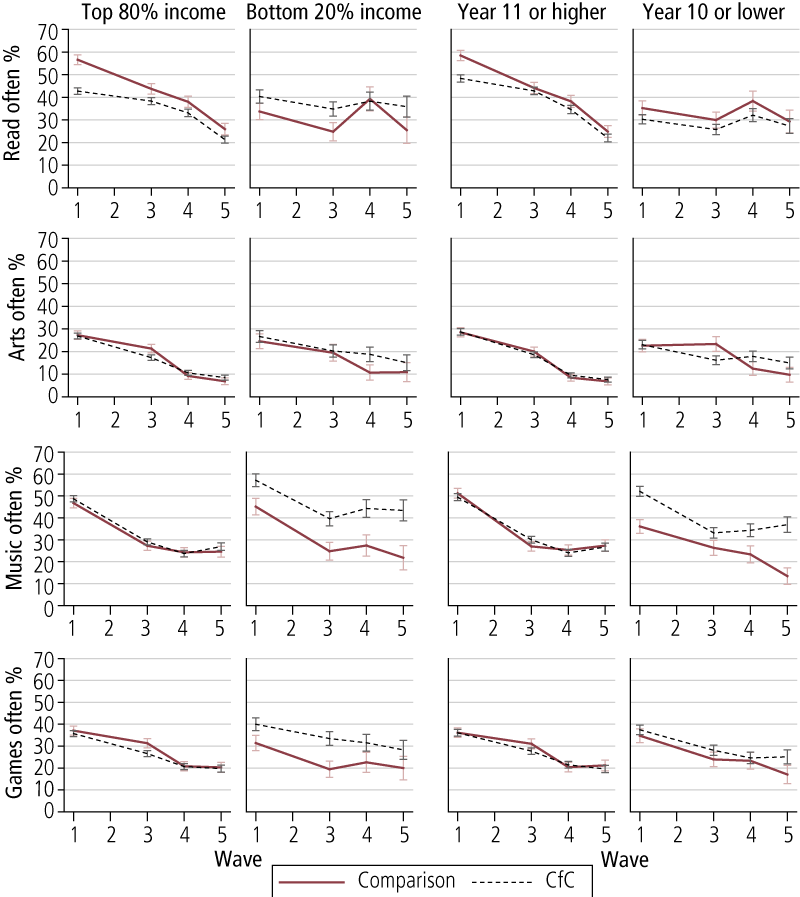
3.6.3 Difference-in-difference results
There were a number of significant differences between families in comparison and CfC sites for changes in the odds of reporting often engaging in reading and in music and singing across waves. Over the whole sample, there was only a significant effect with reading often to children, and this was seen at Waves 3 and 5. In comparison sites at Wave 3, there was a 55% reduction in the odds of primary carers reading often to the study child compared with Wave 1. The comparable figure in CfC sites was 31% and the difference between comparison and CfC sites was significant. The percentage reduction in the odds of primary carers reading often to the study child was relatively more similar between comparison (63%) and CfC sites (51%). But at Wave 5, a significant difference was found. At Wave 5, relative to Wave 1, there was an 86% reduction in the odds of reading often to the study child in comparison sites, compared with a 79% reduction in CfC sites. This was a more modest difference and was only marginally significant (p < .08).
This finding in relation to reading was particularly significant in the relatively more advantaged families (there were no significant effects in the more disadvantaged income/education subgroups). Table 3.12 shows the percentage change in the odds of primary carers often reading with the study child at Waves 3, 4 and 5 compared with Wave 1 in comparison and CfC sites. There was a clear reduction in the odds of reading with the study child at Wave 3 compared with Wave 1 in both comparison and CfC sites, but the change was greater in comparison sites than in CfC sites and this was statistically significant. In more educated families, the reduction in comparison sites was 61%, compared with 33% for CfC sites. The comparable figures in the income subgroup were 58% and 31% respectively.
| Top 80% of income distribution | Year 11 and over | |||
|---|---|---|---|---|
| Comparison sites (% change in odds) | CfC sites (% change in odds) | Comparison sites (% change in odds) | CfC sites (% change in odds) | |
| Wave 3 compared with Wave 1 | -58.1 | -31.2 * | -61.4 | -33.0 * |
| Wave 4 compared with Wave 1 | -71.6 | -54.6 * | -73.4 | -64.1 |
| Wave 5 compared with Wave 1 | -89.0 | -82.8 + | -90.7 | -87.1 |
Notes: Statistical significance is derived from difference-in-difference models and corresponds to numbers within each row. *** p < .001; ** p < .01; * p < .05; + p < .08.
Among the education subgroup, the changes at Waves 4 and 5 compared with Wave 1 were very similar between families in comparison and CfC sites. In the higher income group, there was a significant difference in the changes at Waves 4 and 5 compared with Wave 1. At Wave 4, there was a 72% reduction in the odds of reading often with a study child in comparison sites compared with only 55% in CfC sites. The difference at Wave 5 was smaller and marginally significant (p < .08). These findings confirm the descriptive results shown in the first row of Figure 3.6.
The other primary carer-child activity where there were significant differences in changes over time between families in comparison and CfC sites was music and singing. Table 3.13 shows the percentage change in the odds of a primary carer often engaging in music and singing with the study child at Waves 3, 4 and 5 compared with Wave 1 in comparison and CfC sites, and further disaggregated by income and education subgroups.
There are significant differences between comparison and CfC families in the pattern of change on this outcome between Waves 1 and 5 in relatively more disadvantaged families. The odds of comparison site primary carers with Year 10 or lower education engaging in music and singing with the study child decreased by 83% in Wave 5 compared with Wave 1. The comparable result for CfC families was 59%. Similarly, in lower income comparison sites, primary carers' odds of engaging in music and singing with their study children decreased by 88%, which is significantly greater than the change in CfC families (63%). In addition to these results, there is a marginally significant finding for more educated families (primary carer with Year 11 or higher) at Wave 3 compared with Wave 1. The reduction in comparison sites was 77%, which was slightly larger than the reduction for CfC sites (66%).
| Comparison sites (% change in odds) | CfC sites (% change in odds) | Comparison sites (% change in odds) | CfC sites (% change in odds) | |
|---|---|---|---|---|
| Bottom 20% income | Top 80% income | |||
| Wave 3 compared with Wave 1 | -80.8 | -69.1 | -68.1 | -66.9 |
| Wave 4 compared with Wave 1 | -77.0 | -62.3 | -73.1 | -76.7 |
| Wave 5 compared with Wave 1 | -88.1 | -63.4 * | -72.5 | -70.7 |
| Year 10 or lower | Year 11 or higher | |||
| Wave 3 compared with Wave 1 | -45.6 | -68.0 | -77.1 | -66.4 + |
| Wave 4 compared with Wave 1 | -53.5 | -67.1 | -78.5 | -76.5 |
| Wave 5 compared with Wave 1 | -82.8 | -58.9 * | -74.9 | -71.6 |
Notes: Statistical significance is derived from difference-in-difference models and corresponds to numbers within each row. *** p < .001; ** p < .01; * p < .05; + p < .08.
The results in this section suggest that the CfC initiative has a positive effect on primary carers' engagement with their children, notably in reading and music and singing. There are several points to note. The difference-in-difference estimates for reading suggest a positive program effect overall at Waves 3 and 5, though the subgroup analyses suggest that the gains were concentrated among children living in families that were more advantaged (particularly higher income families). In contrast, the benefits of being at a CfC site with respect to music and singing were reflected in greater engagement by primary carers from more disadvantaged families (in both income and education). Given that primary carers with lower levels of education may well have struggled with schooling themselves (and perhaps reading), the positive effects on another aspect of primary carer engagement is promising. As such, the positive gains in primary carers' engagement with their children possibly reflect the relative strengths of the primary carers in the two groups.
In this particular instance, it is highly unlikely that the difference-in-difference estimates merely reflect regression toward the mean, even though there were pre-existing differences in reading and playing music and singing. Firstly, there was substantial change over the five-year period in primary carer engagement in both groups that reflect children's underlying development. Therefore, there was not a stable long-term average, which extreme values would return to in the case of measurement error. Secondly, the direction of the pre-existing differences for reading and for music and singing were converse to one another - lower in CfC sites compared to comparison sites in the case of reading, and the reverse in the case of music - but in both instances, positive program effects of CfC were observed. Therefore, given this pattern of results, it is likely that these findings reflect positive effects of the CfC initiative.
3.7 Child health
This section presents results for two indicators relating to children's health: the proportion of children who were injured two or more times in the past 12 months; and the PedsQL physical activity scale, which ranges from a low of 0 to a high of 100, where higher values indicate better physical health. Note that these measures were reported by the primary carer, and therefore are not an objective measure of children's physical health.
3.7.1 Descriptive rates and patterns
Table 3.14 reports the proportion of children injured two or more times in the past 12 months in comparison and CfC sites across waves. The proportion was very small in Waves 1 and 3, though it increased at Waves 4 and 5. There was no significant difference between comparison and CfC sites. In addition, with a single exception, there were no significant differences in rates of two or more injuries in CfC and comparison sites across waves in the income and education subgroups. The only exception to this relates to children in CfC families in the higher educated subgroup, who were marginally more likely to be injured two or more times in the previous year than children in comparison sites at Wave 5 (p < .08), which could reflect parental vigilance or awareness (or better recall). However, it is advisable not to give too much weight to this finding given the low level of statistical significance and the fact that it was only apparent with this particular subgroup.
| Wave 1 (%) | Wave 3 (%) | Wave 4 (%) | Wave 5 (%) | |
|---|---|---|---|---|
| Comparison sites | 5.2 | 5.3 | 12.5 | 10.6 |
| CfC sites | 6.0 | 5.7 | 15.6 | 13.7 |
Notes: Statistical significance is derived from cross-sectional regression models adjusted for child gender and Indigenous status, primary carer age and education, cultural background, father involvement and family income. *** p < .001; ** p < .01; * p < .05; + p < .08.
Table 3.15 shows the average PedsQL physical health score for children in both CfC and comparison sites across waves. At Wave 1, there were no differences in this indicator of children's health between comparison and CfC sites. However, at Wave 3 children in CfC sites had significantly lower average scores than children in comparison sites, though this gap disappeared at Waves 4 and 5. This overall pattern was replicated in all subgroups relating to income and education (results not shown).
| Comparison sites (average scores) | CfC sites (average scores) | |
|---|---|---|
| Wave 1 | 90.6 | 89.5 |
| Wave 3 | 93.2 | 90.4 *** |
| Wave 4 | 92.4 | 92.1 |
| Wave 5 | 92.0 | 92.7 |
Notes: Statistical significance is derived from cross-sectional regression models adjusted for child gender and Indigenous status, primary carer age and education, cultural background, father involvement and family income. *** p < .001; ** p < .01; * p < .05; + p < .08.
3.7.2 Difference-in-difference results
Echoing this similarity between comparison and CfC sites on child injuries, there were no significant results from the difference-in-difference models of children's injuries, either overall or within income and education subgroups. The difference-in-difference models for the PedsQL physical health outcome restated the significant result for Wave 3 (reported in the Phase 1 evaluation), where children's physical functioning reported by primary carers in CfC sites was lower than in comparison sites. However, there were no significant differences in this outcome at Waves 4 and 5 compared with Wave 1 between children in comparison and CfC sites. This pattern of results is important because at the time of the Phase 1 evaluation we argued that the difference-in-difference effect between Waves 1 and 3 was likely to be due to greater engagement with health services and increased surveillance by primary carers (Edwards, et al, 2009). This finding for Phase 2 of the study is consistent with the surveillance argument, where children's physical health problems are more closely monitored and therefore rated worse by primary carers, but as treatments are engaged, primary carers see beneficial effects to their child's health over the longer term.
3.8 Child social and emotional wellbeing
3.8.1 Descriptive overview
In this section, we present results for two indicators of children's social and emotional wellbeing. These are the Strengths and Difficulties Questionnaire (SDQ) total "problem" and total "prosocial" scales. The former scale ranges from a low of 0 to a high of 40 and higher scores indicate more problems. The latter scale ranges from a low of 0 to a high of 10 and high scores indicate enhanced prosocial behaviour.
Table 3.16 shows children's average SDQ problem and prosocial scores in comparison and CfC sites across Waves 3, 4 and 5. The average SDQ problem scores are distant from the maximum (40), while the average SDQ prosocial scores are very close to the maximum (10). SDQ problem scores were highest at Wave 3 for children in both comparison and CfC sites and there was no difference between them. Average scores decreased at Wave 4, but then increased slightly in Wave 5. Again, there was no significant difference at each wave in the SDQ problem scores between children in comparison and CfC sites.
| SDQ problems (average score) | SDQ prosocial (average score) | |||
|---|---|---|---|---|
| Comparison sites | CfC sites | Comparison sites | CfC sites | |
| Wave 3 | 9.35 | 9.35 | 7.74 | 7.85 + |
| Wave 4 | 8.47 | 8.70 | 8.39 | 8.41 |
| Wave 5 | 8.61 | 8.40 | 8.33 | 8.45 |
Notes: Statistical significance is derived from cross-sectional regression models adjusted for child gender and Indigenous status, primary carer age and education, cultural background, father involvement and family income. *** p < .001; ** p < .01; * p < .05; + p < .08.
In contrast with the SDQ problem scores, SDQ prosocial scores were lowest at Wave 3, though they were slightly higher in CfC sites relative to comparison sites (p < .08). For children in both comparison and CfC sites, average SDQ prosocial scores increased at Wave 4. At Wave 5, they decreased slightly for comparison site children and increased slightly for children in CfC sites, but there were no significant difference at Waves 4 and 5.
3.8.2 Patterns in income and education subgroups
Figure 3.7 shows children's average SDQ problem and prosocial scores in comparison and CfC sites across Waves 3, 4 and 5 in the income and education subgroups. The overall pattern described in Table 3.16 is most pronounced in the more advantaged groups (higher income/education). Children in these groups were very similar in comparison and CfC sites, except that children in the CfC sites averaged significantly higher prosocial scores at Wave 1 than children in comparison sites, though it was a relatively small difference of about 12% of a standard deviation.
Among lower income families, children in CfC sites averaged higher SDQ problem scores at Wave 4 than children in comparison sites, but this was not significant after controlling for other factors.7 Among the lower educated group, children in CfC sites averaged lower SDQ prosocial scores at Wave 5 than children in comparison sites (p < .05), but this was no longer significant after controlling for other factors. However, children in the lower educated group at CfC sites averaged significantly higher prosocial scores at Wave 5 compared to other children with primary carers with lower levels of education, and this remained marginally significant after adjusting for other factors (p < .08).
Figure 3.7: Children’s average SDQ problem and prosocial scores at Waves 3, 4 & 5, by level of income and education, comparison and CfC sites
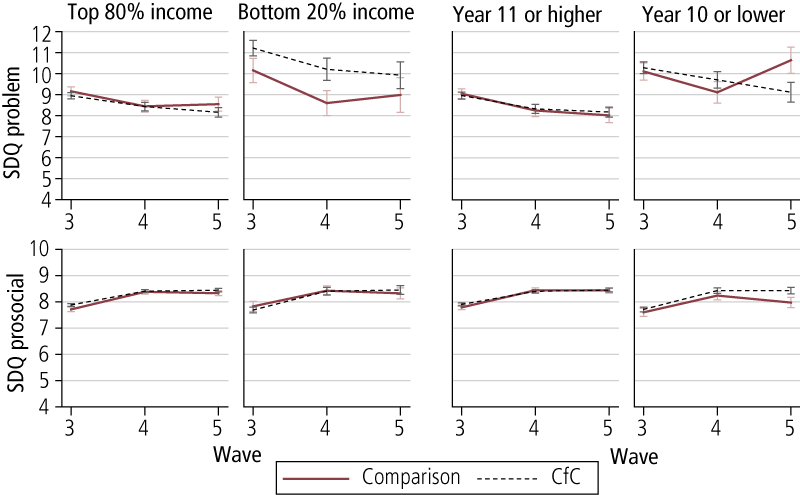
3.8.3 Difference-in-difference results
Given that we were only able to collect information about children's social and emotional problems and their prosocial behaviour when they were aged 4-5 years, it was not appropriate to conduct difference-in-difference analysis, as we did not have a baseline measure of pre-implementation functioning. Despite this limitation, the available evidence suggests a small, and somewhat inconsistent, positive effect of CfC on prosocial behaviour. At Wave 3 there was a positive effect on prosocial behaviour overall and at Wave 5 there is also a suggestion that children in the lower educated group in CfC sites saw some positive benefits in the same outcome. Given the lack of a baseline measure and the challenges of assessing child prosocial behaviour, we cannot rule out that these findings are due to pre-existing differences rather than a program effect.
3.9 Community cohesion and neighbourhood safety
This section looks at aspects of community cohesion and neighbourhood safety, with both scales ranging from a low of 1 to a high of 5, where higher scores indicate more positive views of cohesion and safety.
3.9.1 Descriptive overview
Table 3.17 reports the average scores on community social cohesion and neighbourhood safety for families in comparison and CfC sites across Waves 1, 3, 4 and 5.
| Community social cohesion (average score) | Neighbourhood safety (average score) | |||
|---|---|---|---|---|
| Comparison sites | CfC sites | Comparison sites | CfC sites | |
| Wave 1 | 3.32 | 3.31 | 3.53 | 3.58 |
| Wave 3 | 3.39 | 3.38 | 3.47 | 3.50 |
| Wave 4 | 3.51 | 3.50 | 3.68 | 3.75 |
| Wave 5 | 3.53 | 3.54 | 3.77 | 3.75 |
Notes: Statistical significance is derived from cross-sectional regression models adjusted for child gender and Indigenous status, primary carer age and education, cultural background, father involvement and family income. *** p < .001; ** p < .01; * p < .05; + p < .08.
There was no significant difference between families in comparison and CfC sites across waves. Generally, the social cohesion scores were trending upwards over time, and this pattern held for families in both comparison and CfC sites. Neighbourhood safety scores decreased in Wave 3 relative to Wave 1, but they increased thereafter. Again, these patterns were apparent in both comparison and CfC sites.
3.9.2 Patterns in income and education subgroups
Figure 3.8 shows the average scores for community social cohesion and neighbourhood safety across waves in comparison and CfC sites for income and education subgroups. The community social cohesion scores for families in comparison and CfC sites were very similar in the relatively more advantaged groups (both income and education) and there was a modest upward trend in these scores. The cohesion scores in the relatively less advantaged groups were also very similar, though they did not trend upwards as consistently as for the relatively more advantaged families.
Figure 3.8: Average community cohesion and neighbourhood safety scores at Waves 1, 3, 4 & 5, by level of income and education, comparison and CfC sites
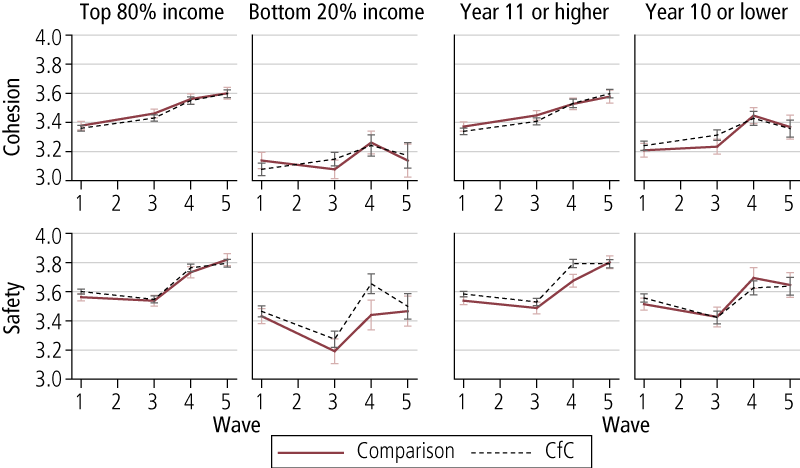
Average neighbourhood safety scores among families in the top 80% of the income distribution were very similar across waves between comparison and CfC sites and followed a profile over the waves largely underscoring the overall pattern reported in Table 3.17. Similar results are shown for the families with more educated primary carers, though there is a gap between comparison and CfC sites at Wave 4 that is marginally statistically significant (p < .08).
There was a decrease in perceptions of neighbourhood safety in lower income households in both comparison and CfC sites. A similar, though less pronounced result is found in the lower education subgroup. In lower income households there was a sharp increase in perceptions of neighbourhood safety at Wave 4 in both comparison and CfC sites, but a slight gap emerged between sites, with CfC sites averaging higher scores on this outcome at Wave 4. This, however, was not statistically significant after adjusting for other factors.
3.9.3 Difference-in-difference results
The only significant difference-in-difference results were found in the lower income subgroup. Table 3.18 reports the differences in the rates of change between comparison and CfC sites on measures of community cohesion and neighbourhood safety at Waves 3, 4 and 5 compared with Wave 1. A positive coefficient here means that the change in the CfC site was greater than the change in the comparison sites.
| Community cohesion | Neighbourhood safety | |
|---|---|---|
| Wave 3 compared with Wave 1 | .15 | .02 |
| Wave 4 compared with Wave 1 | .16 | .22 * |
| Wave 5 compared with Wave 1 | .21 + | .06 |
Notes: Statistical significance is derived from difference-in-difference models. *** p < .001; ** p < .01; * p < .05; + p < .08.
There was a significant difference in the rates of change in the measure of neighbourhood safety between comparison and CfC sites at Wave 4 compared with Wave 1. Figure 3.8 showed that the average score on this outcome increased in CfC sites but remained relatively fixed for comparison sites between Waves 1 and 4, and the difference-in-difference result confirms that this difference in the rates of change between comparison and CfC sites is significant. A similar, though only marginally significant (p < .08) result was found at Wave 5 compared with Wave 1 in the model for community cohesion. Again, this result confirms that the increase in perceived community cohesion was greater in CfC sites than in comparison sites.
Overall, the findings on community social cohesion and neighbourhood safety suggest that CfC had little effect on these outcomes. However, with respect to the lower income subgroup, there was some evidence of improvements for these families in CfC sites. For this subgroup, the difference-in-difference estimates suggest that neighbourhood safety improved between Waves 1 and 4, and there was improvement in community social cohesion between Wave 1 and 5. Theoretically, one would expect that improvements in neighbourhood safety may lead to greater connection with neighbours (Sampson, 2012). However, it should be noted that these findings were in evidence in only one wave for each outcome, and then only in the smallest subgroup, and therefore could reflect measurement error rather than a program effect.
3.10 Community involvement
In this section, we look at the extent to which primary carers' reported volunteering in the community. We first provide an overview of the proportion of primary carers who reported volunteering in the community at Waves 1, 3, 4 and 5 in comparison and CfC sites, and then look at patterns across waves in the income and education subgroups, again in comparison and CfC sites. Lastly, we present findings from difference-in-difference analyses.
3.10.1 Descriptive overview
Table 3.19 reports the proportion of primary carers who reported volunteering (including at schools) across waves in comparison and CfC sites. At each wave there was no significant difference in the proportion of primary carers who reported volunteering in their community. Rates of volunteering increased substantially at Waves 4 and 5, and this is mostly likely related to volunteering activities at their children's schools.
| Wave 1 (%) | Wave 3 (%) | Wave 4 (%) | Wave 5 (%) | |
|---|---|---|---|---|
| Comparison sites | 25.2 | 34.0 | 55.1 | 52.8 |
| CfC sites | 24.8 | 37.9 | 52.0 | 50.3 |
Notes: Statistical significance is derived from cross-sectional regression models adjusted for child gender and Indigenous status, primary carer age and education, cultural background, father involvement and family income. *** p < .001; ** p < .01; * p < .05; + p < .08.
3.10.2 Patterns in income and education subgroups
Figure 3.9 shows the proportions of primary carers who reported volunteering across the waves in comparison and CfC sites for income and education subgroups. A significant gap emerged at Wave 3 in the higher income group between comparison and CfC sites, with the latter more likely than the former to have volunteered in the community. This difference disappeared in Waves 4 and 5, as primary carers in both comparison and CfC sites increased their engagement in volunteering, most likely as a consequence of their children's schooling. A gap emerged at Wave 4 in the lower income group, but this was not statistically significant after controlling for other factors.
Figure 3.9: Proportion of primary carers who reported volunteering at Waves 1, 3, 4 & 5, by level of income and education, comparison and CfC sites
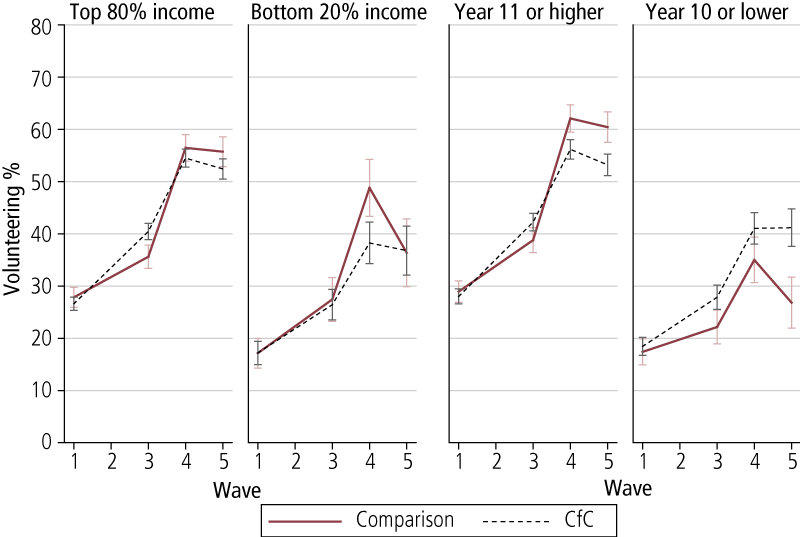
At Waves 1 and 3, engagement in volunteering was very similar in comparison and CfC sites in the education subgroups, but there were significant differences in later waves. Among the higher educated subgroup, average engagement in community volunteering was significantly greater in comparison sites than CfC sites at both Waves 4 and 5. The reverse pattern was observed for the lower educated subgroup, where average engagement in volunteering was higher in CfC sites at both Wave 4 and Wave 5. This was marginally significant for Wave 5 only (p < .08).
3.10.3 Difference-in-difference results
The previous section highlighted some differences in primary carers' community involvement between comparison and CfC sites at different waves. The difference-in-difference models provide an indication as to whether there were significant differences between comparison and CfC sites in the rates of change over time. Results reveal a number of significant differences.
Table 3.20 reports the percentage change in the odds of primary carers volunteering at Waves 3, 4 and 5 compared with Wave 1 in comparison and CfC sites. These results show that the rate of change between Waves 1 and 3 was significantly higher in CfC sites than in comparison sites. At Waves 4 and 5, there were similar increases in volunteering in comparison and CfC sites.
| Comparison sites (% change in odds) | CfC sites (% change in odds) | |
|---|---|---|
| Wave 3 compared with Wave 1 | 60.0 | 129.5 * |
| Wave 4 compared with Wave 1 | 494.7 | 437.1 |
| Wave 5 compared with Wave 1 | 301.3 | 300.7 |
Notes: Statistical significance is derived from difference-in-difference models and corresponds to numbers within each row. *** p < .001; ** p < .01; * p < .05; + p < .08.
The second and final statistically significant result from the difference-in-difference models for volunteering was found in the lower educated subgroup. Table 3.21 reports the percentage change in the odds of volunteering at Waves 3, 4 and 5 compared to Wave 1 for primary carers in comparison and CfC sites in the lower educated subgroup. The odds of primary carers volunteering in Waves 3, 4 and 5 compared with Wave 1 were higher in both CfC and comparison sites, but they were greater in CfC sites and this difference was statistically significant at Wave 5. This result shows that the gaps that emerged in volunteering between primary carers in comparison and CfC sites in this subgroup, as shown in Figure 3.9, reflect significant differences in the increasing engagement in volunteering between primary carers in comparison and CfC sites.
| Comparison sites (% change in odds) | CfC sites (% change in odds) | |
|---|---|---|
| Wave 3 compared with Wave 1 | 25.5 | 106.0 |
| Wave 4 compared with Wave 1 | 215.9 | 433.0 |
| Wave 5 compared with Wave 1 | 36.6 | 320.8 * |
Notes: Statistical significance is derived from difference-in-difference models and corresponds to numbers within each row. *** p < .001; ** p < .01; * p < .05; + p < .08.
In summary, the difference-in-difference estimates show clear evidence of a program effect of CfC on primary carers' volunteering at Wave 3 overall. As mentioned previously, this was no longer evident overall in Waves 4 and 5, which points to the likely influence of children's schooling as a mechanism by which primary carers engage with community organisations. The large increases in primary carer engagement in volunteering following children's involvement in school reflect a normative trend (in LSAC, parents of B Cohort children reported a ten percentage point increase from 4-5 to 6-7 years of age).8 The increases in primary carer engagement observed in SFIA were apparent for all groups except those who were most disadvantaged. What is notable, however, is that there is some evidence that by Wave 5 primary carers in the lower educated subgroup were more likely to maintain their higher levels of engagement in volunteering in CfC sites compared to those in the comparison sites. This finding reinforces the notion that for this disadvantaged group, the CfC initiative had assisted this form of social participation.
3.11 Unmet service needs
This final section considers two indicators relating to the level of service support that primary carers receive.
3.11.1 Descriptive rates and patterns
The first indicator points to the extent to which primary carers reported unmet service needs. Table 3.22 shows the percentage of primary carers who reported having a service need that was unmet across Waves 1, 3, 4 and 5 in comparison and CfC sites. Unmet service needs were relatively uncommon at Wave 1, though they increased at Wave 3, and were slightly higher in comparison sites than CfC sites (p < .08). At Waves 4 and 5, unmet service needs decreased slightly to around one in ten primary carers. This overall pattern was apparent in both income and education subgroups.
| Wave 1 (%) | Wave 3 (%) | Wave 4 (%) | Wave 5 (%) | |
|---|---|---|---|---|
| Comparison sites | 6.2 | 13.6 + | 9.9 | 8.6 |
| CfC sites | 5.7 | 11.3 | 9.8 | 9.7 |
Notes: Statistical significance is derived from cross-sectional regression models adjusted for child gender and Indigenous status, primary carer age and education, cultural background, father involvement and family income. *** p < .001; ** p < .01; * p < .05; + p < .08.
3.11.2 Difference-in-difference results
There were no significant differences in change over time between comparison and CfC sites in the measure of unmet needs from the difference-in-difference models.
3.12 Summary
Table 3.23 provides a summary of the results from the difference-in-difference analyses that give an indication of a program effect of the CfC initiative. Although there are other statistically significant program effects, we will concentrate here on the findings that are new to Phase 2.
| Outcomes | All | More disadvantaged | More advantaged | ||
|---|---|---|---|---|---|
| Bottom 20% income | Year 10 or lower | Top 80% income | Year 11 or higher | ||
| Joblessness | (W3 *) ? | (W3 *) ? | (W3 *) ? | ||
| Good health | (W3 *, W5 *) ? | ||||
| Mental health (distress) | (W4 *, W5 *) ? | (W5 *) ? | (W5 *) ? | (W4 +) ? | (W4 *) ? |
| Argumentative relationship | |||||
| Community involvement | (W5 *) ? | (W3 +) ? | |||
| Social cohesion | (W5 +) ? | ||||
| Safe neighbourhood | (W4 *) ? | ||||
| Warm parenting | |||||
| Hostile parenting | (W3 +) ? | ||||
| High self-efficacy | (W3 +) ? | (W3 +) ? | |||
| Reading with child | (W3 *, W5 +) ? | (W3 *, W4 *, W5 +) ? | (W3 *) ? | ||
| Arts/crafts with child | |||||
| Music/singing with child | (W5 *) ? | (W5 +) ? | (W3 +) ? | ||
| Games with child | |||||
| Support for child care | (W4 *) ? | ||||
| Unmet service needs | |||||
| Child injuries | |||||
| Child physical health | (W3 ***) ? | (W3 *) ? | (W3 *, W5 +) ? | ||
| SDQ problems | |||||
| SDQ prosocial | |||||
Notes: W3 = Wave 3 compared with Wave 1; W4 = Wave 4 compared with Wave 1; W5 = Wave 5 compared with Wave 1. *** p < .001; ** p < .01; * p < .05; + p < .08. ? = positive difference-in-difference effect; ? negative difference-in-difference effect.
There was a clear negative effect at Waves 4 and 5 for mental health distress for the primary carers. Recall from earlier in this chapter that primary carers in CfC sites had significantly lower levels of mental health distress at Wave 1, but there was no significant difference in later waves. The difference-in-difference result highlights the fact that primary carers' mental health distress lessened in comparison sites, such that they were equivalent to primary carers in CfC sites.
There was a positive result for community involvement, but this was concentrated in particular subgroups at particular points (the lower educated group at Wave 5 and the higher income group at Wave 3). It is difficult to draw firm conclusions here, especially considering the latter result is only marginally significant. Lower income families in CfC sites reported increased neighbourhood safety at Wave 4 relative to Wave 1, and increased social cohesion at Wave 5 relative to Wave 1.
There was a positive program effect for reading regularly with children at Wave 4, across the whole sample, and at Waves 3, 4 and 5 among the higher income subgroup. Finally, there was a positive program effect relating to support for child-care at Wave 4 in the lower educated subgroup.
5 This finding held after controlling for differences in joblessness at Wave 1, using a difference-in-difference methodology (see section 2.7 for more details).
6 Differences in standard deviation units can also be referred to as effect sizes. Effect sizes can readily be used to assess the magnitude of the effect of the CfC intervention. A general rule of thumb is that effect sizes of between 0.1 and 0.2 are "small", between 0.3 and 0.5 are "medium", and 0.6 and above are "large" (Cohen, 1988). However, these rules of thumb are very broad generalisations (Hill, Bloom, Black, & Lipsey, 2007).
7 It was only marginally significant (p < .08) when not adjusting for other factors.
8 At ages 4-5 years, 37% of parents were engaged in volunteering, while two years later this increased to 47%. A similar trend was also evident for those families in the lowest quintile (20%) of the socio-economic position index.
4. Residential mobility and out-migration from CfC sites
As outlined in section 2.1, there is a large research literature to suggest that children who grow up in disadvantaged neighbourhoods have worse outcomes than other children. However, there have been few studies examining residential mobility into and out of disadvantaged areas. The limited research to date suggests that moving residences into and out of disadvantaged areas are not random events and are associated with particular demographic characteristics as well as the characteristics of the areas (Quillian, 2003; Sampson, 2012; South, Crowder, & Trent, 1998). Some researchers have even gone so far as to say that the patterns of neighbourhood selection constitute a form of neighbourhood effect, because they expose residents to different levels of risk (Sampson, 2012).
In SFIA, areas that were included in comparison sites were matched to CfC sites on the basis of the SEIFA Index of Disadvantage, and, as such, similar types of families reside in these areas. However, for the purposes of the evaluation of CfC, the important overall question to answer in this chapter is to establish that there were not systematic differences in residential mobility for families living in CfC sites that would undermine the findings we reported in Chapter 3.
Australian and international research suggests that high levels of residential mobility also have negative consequences for the development of children (Jelleyman & Spencer, 2008; Taylor & Edwards, 2012). So if there are systematic differences between families living in CfC and comparison sites, this also has the potential to bias the estimates of the effects of the CfC initiative.
Another question relates to the rate of out-migration from CfC sites. Given that one of the advantages of area-based initiatives such as CfC is that they enable populations that are in need of services and supports to be targeted, it is important to understand for how long the families of young children reside in these areas. This additional information will assist policy-makers to understand whether area-based initiatives that target particular groups (e.g., jobless households) should periodically assess whether it is relevant for such initiatives to be operating in an area. It should be noted that residential mobility is a common feature of families with younger children. For instance, by 8-9 years of age, 73% of Australian children will have moved at least once and 49% would have moved twice or more since birth (Maguire , Edwards, & Soloff, 2012). While most moves are within the same town or suburb (Maguire et al, 2012), over 40% of children move out of their neighbourhood by the ages of 6-7 years (Edwards, 2011).
The extent to which individuals move out of areas that are targeted for area-based initiatives is largely unknown. To our knowledge there is no existing evidence on the rates of residential mobility out of sites with area-based initiatives, so any information on out-migration from area-based initiatives is a new addition to the knowledge base.
In this chapter we provide information on:
- the residential mobility of families in CfC and comparison sites;
- factors associated with residential mobility for CfC and comparison sites;
- the extent to which families living in CfC sites at Wave 1 have moved out of CfC sites at later waves;
- factors associated with moving out of CfC sites when living in these sites at Wave 1; and
- whether staying in CfC sites until children were 8-9 years led to any differential outcomes.
4.1 Residential mobility in CfC and comparison sites
Figure 4.1 provides information about the extent to which families living in CfC and comparison sites moved residence between waves from Wave 1 to Wave 3, Wave 3 to Wave 4 and Wave 4 to Wave 5.
Figure 4.1: Proportion of families who stayed in or moved out of their residence from the previous wave, Waves 3, 4 & 5, comparison and CfC sites
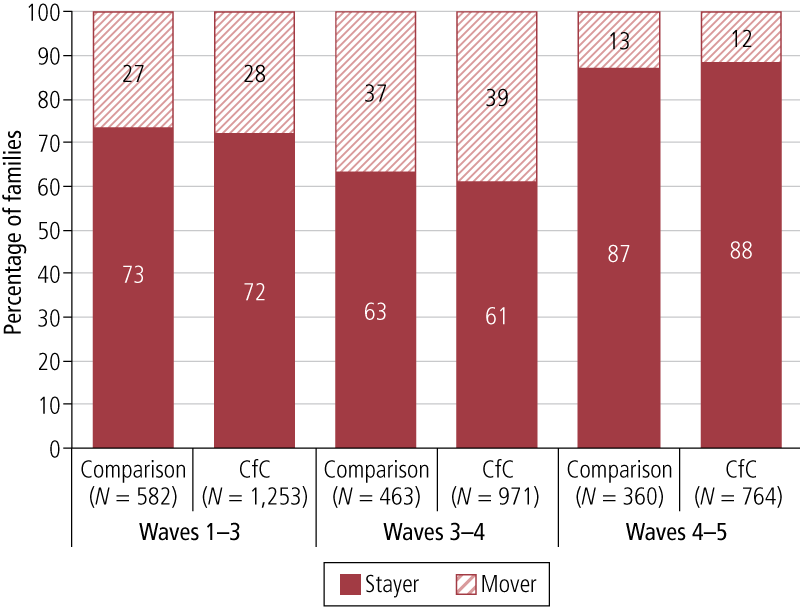
In general, the patterns of residential mobility were very similar for families living in comparison and CfC sites. For families living in comparison and CfC sites a little over one-quarter had moved by Wave 3 (27% and 28% respectively). Between Waves 3 and 4, a little over one-third had moved residence in comparison sites (37%) and CfC sites (39%). A smaller percentage moved between Waves 4 and 5, with 13% moving in comparison sites and 12% moving in CfC sites. In terms of the percentage of families that did not move at all over the course of the SFIA survey, in comparison and CfC sites, 49% did not move at all. More detailed sequences of residential mobility can also be gleaned from Figure 4.2, with the general conclusion being that the patterns of residential mobility for comparison and CfC sites were very similar.
A series of logistic regression models were conducted to test whether there were particular factors associated with higher rates of residential mobility overall and separately in comparison and CfC sites in the previous wave. We considered residential mobility between Waves 1 and 3, Waves 3 and 4 and Waves 4 and 5. Results are reported in Table 4.1. Confirming findings from Figure 4.2, there was no evidence of greater rates of residential mobility between CfC and comparison sites at Waves 3, 4 and 5. All of the odds ratios for CfC were close to 1.00 and not statistically significant.
Not having a father present in the household over each two-wave period in each model was positively and significantly associated with having higher rates of residential mobility over the three waves. Moreover, partnership change (a breakdown in partnership or re-partnering) over each two-wave period was a significant factor associated with a higher likelihood of moving.9 The coefficients for these effects were relatively large and this is likely due to the relatively small sizes of these groups, especially in the Wave 5 model (the partnership change group accounted for approximately 3% of the sample). Therefore, partnership transitions were positively associated with mobility, but families with consistently no father present also tended to be more mobile. Lastly, at Wave 4 only, families with a primary carer with a Year-12-level education or with an employed primary carer were less likely to move between Waves 3 and 4.
Figure 4.2: Proportion of families who stayed in or moved out of their residence from Waves 3 to 4 to 5, comparison and CfC sites
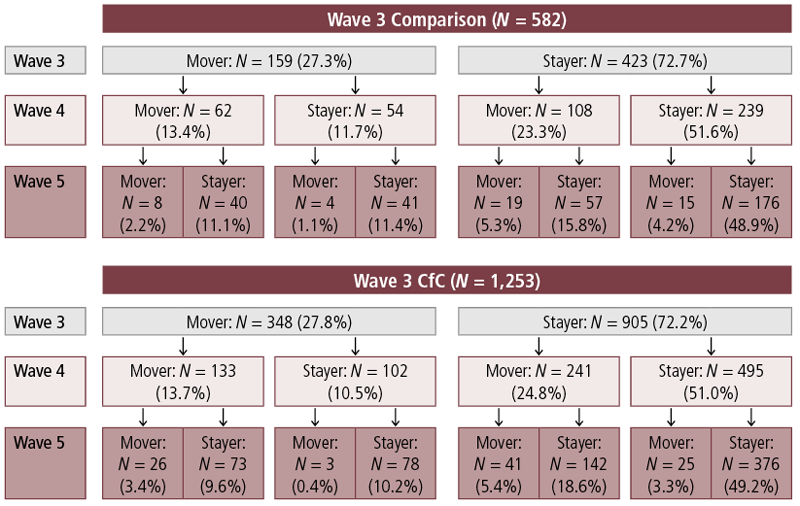
| Different address at Wave 3 | Different address at Wave 4 | Different address at Wave 5 | |
|---|---|---|---|
| CfC sites (compared to comparison sites) | .94 | 1.08 | .93 |
| Child Indigenous | 1.08 | .77 | 1.44 |
| Born overseas | .81 | 1.11 | .92 |
| Primary carer has Year 12-level education | .93 | .78 * | .93 |
| Primary carer employed | .97 | .74 ** | .88 |
| No father at both waves a | 2.01 *** | 1.45 * | 2.45 *** |
| Partnership change | 3.67 *** | 2.28 *** | 7.64 *** |
| Household income | .81 | .97 | .99 |
Notes: a Between Waves 1 & 3 for result column 1, Waves 3 & 4 for result column 2, and Waves 4 & 5 for result column 3. An odds ratio greater than 1 indicates a positive association, an odds ratio less than 1 indicates a negative association, and an odds ratio equal to 1 indicates no association. *** p < .001; ** p < .01; * p < .05; + p < .08.
We explored whether any of the results in Table 4.1 were any different for families living in CfC and comparison sites. In general, the patterns of associations were similar in separate logistic regression models of residential mobility with families living in CfC sites or only in comparison sites. In the few instances where one factor was significantly associated with residential mobility for CfC but not in comparison sites or vice versa, there were no statistically significant differences in the strength of the relationship of the particular factor with residential mobility between models using only the CfC sample compared to the comparison sites (results not reported).
In summary, the general conclusion from this section is that the rates of residential mobility were very similar between CfC and comparison sites and there was little systematic difference in the type of families that were moving in CfC and comparison sites. Across both comparison and CfC sites, changes in partnership status, or families with no co-resident parent were significantly more likely to have moved residence between waves.
4.2 Movement out of CfC sites
The residential mobility observed in CfC sites documented in the previous section may not have meant that families moved out of the CfC areas. One of the mechanisms that CfC may have triggered was to help families move out of disadvantaged locations and that this potentially beneficial impact could be achieved with a limited "dose" of the intervention. Figure 4.3 provides a summary of the rates of mobility out of CfC sites.10 Between Wave 1 to Wave 3, 28% of families living in CfC sites moved outside the CfC sites. Of families who responded at Wave 4, 18% were not living in a CfC site and this increased slightly to 20% of families who responded at Wave 5.
Figure 4.3: Proportions of families moving out of and into CfC sites at Waves 3, 4 & 5
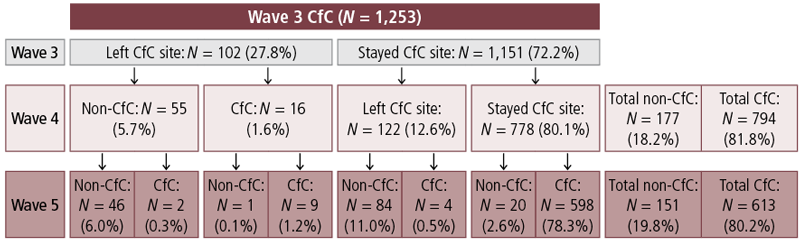
It is important to establish whether there were systematic differences between families who moved out of CfC sites and those who moved either within or between CfC sites, because any differences in outcomes between those staying and leaving CfC sites could be due to:
- systematic differences between stayers or movers; or
- limited exposure to an enhanced service delivery environment in CfC sites.
In order to ensure that any systematic differences between families who moved out of CfC sites compared to those who stayed were not due to a predisposition towards residential mobility, we also compared families that moved either within or between two CfC sites.
For each wave we employed multinomial logistic regression to systematically test differences between three groups:
- those that were present in the same residence as in the previous wave (stayers, the reference group);
- those that moved within or between CfC sites; and
- those that moved out of a CfC site.
The results relating to families that moved either within or between CfC sites are quite similar to those above for all movers (regardless of destination), which is not surprising as the majority of movers continued to reside in CfC sites. The strongest and most consistent finding across waves related to the presence or absence of a father in the family and partnership change (breakdown or re-partnering). Compared to stayers, at all three waves, those families that moved either within or between two CfC sites were:
- more likely to have a father not present in each two-wave period; and/or
- more likely to have experienced partnership change in each two-wave period.
These factors were also most strongly associated with moving outside of a CfC site, relative to stayers. The cell sizes are very small here (for example, only 14 families experienced partnership change and moved outside a CfC site between Waves 1 and 3). Therefore, we must treat the results with some caution. However, they are broadly consistent with the results for those who moved either within or between CfC sites, compared with stayers.
To consider this further, Figure 4.4 reports the predicted probabilities of not moving, moving either within or between CfC sites, or moving outside a CfC site for families initially in CfC sites where the father was present or not present, or where there was partnership change between Waves 1-3, 3-4 and 4-5. Echoing the significant results reported above, the probability of not moving was highest across all waves in families where the father was present across all waves. The probability of not moving was lowest among families that experienced partnership change.
Figure 4.4: Predicted probability of not moving, moving within/between CfC site and moving to non-CfC site between Waves 1–3, 3–4 and 4–5, by whether families had a father present or partnership change
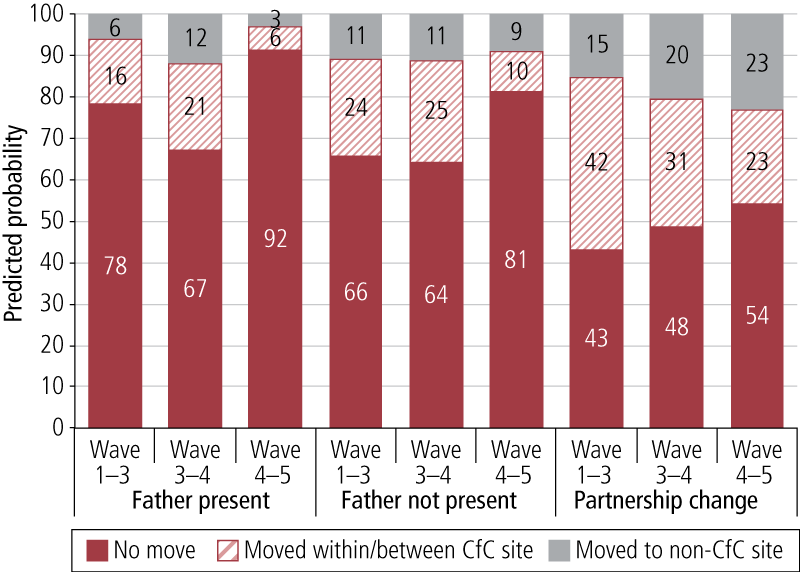
The probability of not moving was highest between Waves 4 and 5, again echoing the descriptive findings presented above showing rates of movement to be the lowest at this point in the study.
In families where the father was always present, the probability of moving within/between CfC sites was greater than the probability of moving out of CfC sites at the three periods we consider. In families where the father was never present during the period we consider, the probability of moving outside CfC sites was relatively consistent over time, while the probability of moving within/between CfC sites was stable up to Wave 4 and decreased substantially at Wave 5, such that the probabilities for these two groups were more equal between Waves 4 and 5.
Among families experiencing partnership change, there was a gradual increase in the probability of moving, a gradual decrease in the probability of moving within/between CfC sites and a gradual increase in the probability of moving outside a CfC site. As with families where the father was not present, the probabilities for movers were very similar between those who moved within/between CfC sites and those who left CfC sites.
In addition to these findings, families who moved within/between CfC sites only between Waves 3 and 4 were less likely to have a primary carer with a Year 12 certificate or equivalent than stayers. Families who moved outside a CfC site between Waves 4 and 5 were significantly less likely to have an employed primary carer. In addition, those who moved outside of CfC sites between Waves 1 and 3 were less likely to be lower income families and less likely to have a parent born overseas than families who did not move.
4.3 Consistency of findings for stayers
Although the patterns of residential mobility out of CfC sites were similar in CfC and comparison sites, there were a few systematic differences between those who moved out of CfC sites and those who stayed in the same residence. Despite these limited differences, only 47% of those living in CfC sites at Wave 1 were still living in a CfC site11 by the time children were 8-9 years of age. Therefore, it is important to establish whether the overall findings reported in Chapter 3 are consistent with families that stayed in CfC sites for the duration of the study.
The estimates from the difference-in-difference models are very similar to those reported in Chapter 3. In summary, the odds ratios in the overall findings were not statistically different when just restricted to the sample that were living in a CfC site up until the target child was aged 8-9 years. This suggests that overall out-migration from CfC sites did not benefit nor detriment the outcomes examined.
In terms of statistical significance, there was a smaller sample size and therefore less statistical power to detect significant differences; however, the following findings were replicated:
- a reduction in jobless households from Wave 1 to Wave 3 (at p < .08), but not in later waves;
- greater improvements in reading often to the target child between Waves 1 and 3 and Waves 1 and 5 in comparison to those living in comparison sites (both p < .05);
- greater improvements in reading between Waves 1 to 4 as well (at p < .05);
- lower levels of harsh parenting practices, but not statistically significant reductions in hostile or harsh parenting practices (unlike in Wave 1 to Wave 3 with the entire sample); and
- lower levels of mental health for primary carers living in comparison sites compared to CfC sites, leading to significantly lower improvements in CfC sites.
Although primary carers felt more effective in their parenting between Waves 1 and 3, this was not statistically significant for this period. However, between Waves 1 and 4 (at p < .08) and Waves 1 and 5 (at p < .05), there were statistically significant differences in the rates of change in parental efficacy.
Rather than focus on specific findings, the most important point to note from these analyses is that the coefficients in the statistical models were not significantly different for the sample that was restricted to families that lived in CfC sites until children were 8-9 years compared to the overall analyses.
Two key conclusions can be drawn from this finding. First, there is no evidence that residential mobility undermined the validity of the results. Second, there is also no evidence that living in a CfC site for longer improved outcomes. It is important to note that families living in CfC sites for the six-year period did not necessarily receive a greater "dose" of CfC services. We did not collect information on families that received CfC services because the nature of the initiative is not just funding CfC services, but also changing the way in which early childhood services are coordinated and integrated.
4.4 Summary
The general conclusion to be drawn from this chapter is that there was little evidence to suggest that residential mobility biased the findings of the overall evaluation. However, it is important to note that there were significant levels of residential mobility for families living in CfC and comparison sites. More specifically, the key findings from this chapter were as follows:
- Families living in disadvantaged areas had high rates of residential mobility, with about one in three families moving between waves. However, the rates were very similar in both CfC and comparison sites and were consistent with what has been observed in the general population of families with young children (Maguire et al., 2012). After other demographic characteristics were adjusted for in multivariate models, there were no significant differences in the rates of mobility between CfC and comparison sites.
- Families were more likely to move between waves if there was not a father living in the household, but there were no other systematic differences between movers and non-movers.
- One in two families living in CfC sites when their children were 2-3 years of age were still living in a CfC site six years later. While this may seem a high proportion of families moving out of disadvantaged areas, these rates are consistent with that of the general population (Edwards, 2011).
- There were no consistent demographic characteristics that differentiated families that stayed or those that moved out of CfC sites; therefore, families that were leaving CfC sites were not different to those that stayed. However, because we did not examine families that moved into CfC sites in subsequent years of the evaluation, we cannot say whether these families would be similar to those that remained.
- Finally, the overall findings from the evaluation were very similar to what they would have been if only families who had stayed in CfC sites for the duration were examined.
9 We considered partnership breakdown and re-partnering separately and the findings were in the same direction in both cases. We combined them because cell sizes were very small.
10 Fifty-nine families in comparison sites moved into CfC sites for at least one wave between Wave 1 and Waves 3-5. This is a very small group, and there are around 20 distinct transition patterns within this group.
11 It is important to note that this may mean that there was mobility between two CfC sites.
5. Links between program effects and child outcomes
In Chapter 3 we reported that there were significant program effects in Phase 1 CfC sites relating to family joblessness, primary carers' engagement in children's reading, and community involvement of primary carers overall. These occurred at Wave 3 in all three instances, and in the case of primary carers' engagement in children's reading and community involvement (in subgroups) at later waves as well. In addition to being positive outcomes in their own right, theoretically, each of these outcomes have been found in other studies to have a positive effect on child outcomes (Coelli, 2005; Huttenlocher et al., 1991; Kalil & Ziol-Guest, 2008; Senechal et al., 1996).
Although there were no direct positive effects relating to child outcomes observed in Chapter 3, it is possible that the significant effects early in the CfC initiative (when children were 4-5 years old) link to more positive outcomes for children when they were 7-8 and 8-9 years of age. To consider this, in this chapter we explore associations between these factors and child outcomes measured when the children were older. The outcomes we focus on are NAPLAN scores relating to children's reading, writing, grammar and punctuation, spelling, and numeracy at Year 3 (when children were aged 8-10 years). In addition, we consider children's social and emotional wellbeing measured using the SDQ total problem score and the SDQ prosocial scales.
NAPLAN data were matched to children from Queensland, Victoria and Western Australia, and therefore do not cover the entire available sample. In total, NAPLAN scores were available for 601 children, which represents around 40% of Wave 4 respondents. As NAPLAN data were missing from entire states/territories for procedural reasons relating to rules governing the release of these data, there is no reason to suppose that the missing data introduce bias into the analysis. However, the reduced sample may have a negative effect on the statistical power of the analysis.
We first present the results relating to NAPLAN and then present the results for children's SDQ problem and prosocial scores.
5.1 NAPLAN scores
This section considers potential links between child outcomes and primary-carer-related outcomes where there were more significant positive changes in CfC sites than in comparison sites. Figure 5.1 reports children's average NAPLAN scores in CfC and comparison sites, all sites and the average of the three states for which we have NAPLAN data (Victoria, Queensland and Western Australia - sourced from LSAC - which we refer to as the "tri-state" average. NAPLAN scores were nominally higher in the comparison sites, but a series of bivariate t-tests revealed that the differences were not statistically significant.
Further bivariate t-tests revealed that the tri-state averages were very similar to the comparison group averages in all subjects except numeracy, where the tri-state average was higher. Average NAPLAN reading, writing and numeracy scores were significantly lower in CfC sites than the tri-state average. The tri-state average scores for writing and numeracy were significantly higher than the combined CfC and comparison site average. These results likely point to the relatively more disadvantaged nature of both CfC and comparison sites compared with the broader population of which the LSAC sample is representative.
In CfC and comparison sites, scores for grammar/punctuation and reading were highest, and scores for numeracy were the lowest.
Figure 5.1: Average Year 3 NAPLAN scores, comparison sites, CfC sites, all sites and tri-state sites
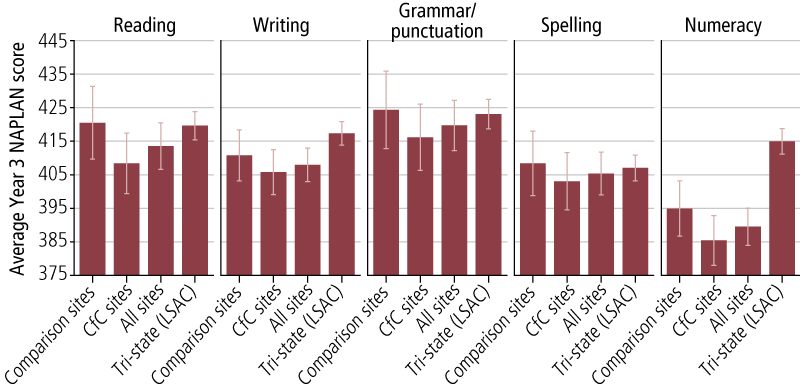
5.1.1 Primary carer engagement in reading often with study child at 3-5 years
Figure 5.2 shows the average NAPLAN scores for children with primary carers who did and did not read often with them when they were 3-5 years in comparison and CfC sites. Children aged 3-5 years whose primary carers were relatively more engaged in reading had, on average, higher NAPLAN scores than those whose primary carers were not. This applies to each of the different aspects of NAPLAN relating to literacy and the single score relating to numeracy, and appears to be stronger with respect to reading and grammar/punctuation. The differences relating to primary carer engagement in reading were very similar across comparison and CfC sites, though they appear greater for NAPLAN spelling and writing scores in CfC sites compared with comparison sites (we will consider statistical differences below).
Figure 5.2: Average Year 3 NAPLAN scores, by whether primary carer read often with children when aged 3-5 years, comparison and CfC sites
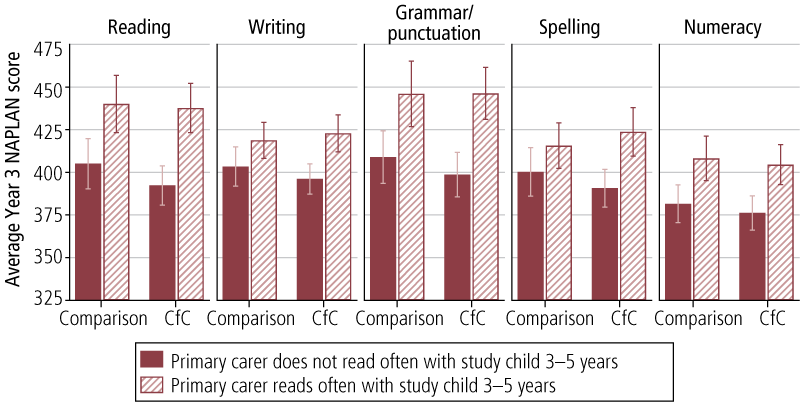
Table 5.1 reports coefficients from regressions showing the difference in the standardised NAPLAN scores in both CfC and comparison sites between children whose primary carers did or did not read often with them when aged 3-5 years. The results confirm a significant positive association between primary carers often reading with children at 3-5 years and later NAPLAN reading scores in both comparison and CfC sites. The effect is around one quarter of a standard deviation, which is a small to medium effect size.
| Reading | Writing | Grammar/ punctuation | Spelling | Numeracy | |
|---|---|---|---|---|---|
| Comparison sites | .25 * | .13 | .27 * | .15 | .23 + |
| CfC sites | .25 * | .31 ** | .31 ** | .28 * | .19 |
Notes: Models adjusted for children's early literacy scores (centred Peabody Picture Vocabulary Test) and primary carers' education (Year 12 certificate or higher, compared with less than Year 12 education). *** p < .001; p < .01; p < .05; + p < .08.
With respect to NAPLAN writing scores, there was a significant effect for children in CfC sites but not in comparison sites. Note, however, that the difference between these coefficients was not significant (in other words, there was no significant interaction effect between reading and CfC sites versus comparison sites). Similarly, there was a significant positive effect for spelling in CfC sites but not in comparison sites, but again the difference between these coefficients was not statistically significant. As with reading, there were significant positive effects for grammar/punctuation in both comparison and CfC sites. Lastly, there was only a marginally significant association between primary carers reading often with children 3-5 years and later NAPLAN numeracy scores in comparison sites (p < .08). The effect size in CfC sites was only marginally lower than in comparison sites. In summary, these findings suggest that reading often to or with children at 3-5 years contributes to literacy at 8-9 years.
Figure 5.3 shows average NAPLAN scores for children whose primary carers often read with them when aged 3-5 years and/or 8-10 years in CfC and comparison sites.
Figure 5.3: Average Year 3 NAPLAN scores, by whether primary carers read often with children when aged 3-5 years and/or 8-9 years, comparison and CfC sites
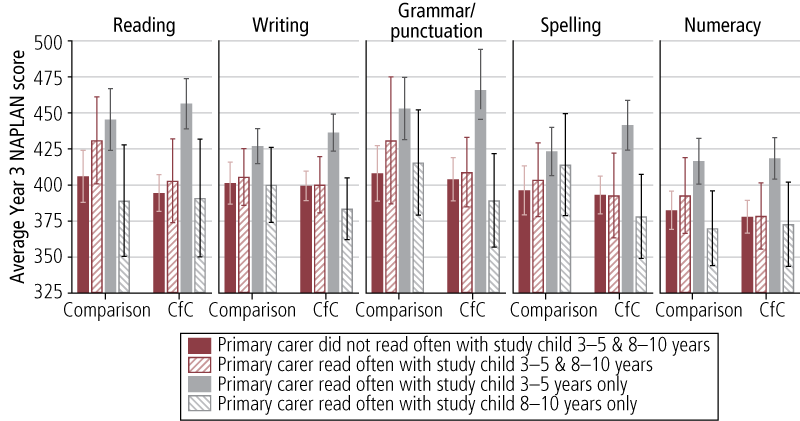
In both CfC and comparison sites, children who were read with often when aged 3-5 years and 8-10 years had higher average NAPLAN scores than children who were not read with often at both ages. However, it was children who were read with often at ages 3-5 years only who averaged the highest NAPLAN scores of all the groups. Children who were only read with often when 8-10 years averaged lower NAPLAN scores than children who were not read with often at either 3-5 years or 8-10 years.
Table 5.2 reports coefficients from regressions showing the difference in the standardised NAPLAN scores in both CfC and comparison sites between children whose primary carers read often with them when aged 3-5 and/or 8-10 years and those who were not read with often at either age (adjusted for children's early literacy and primary carers' education). There were no significant effects associated with reading often with children 3-5 years and 8-10 years and children's NAPLAN scores on any subject. The results for children who were read with often at 3-5 years only were almost identical to those presented above, grouping together all children who were read with at 3-5 years. However, the effect in the model for spelling was significant for children in comparison sites, and the positive effects for numeracy were significant for children in both comparison and CfC sites. Although not statistically significant, reading often with children aged 8-10 years was negatively associated with children's NAPLAN scores and this was particularly notable in CfC sites.
| Read often with at … | Reading | Writing | Grammar/ punctuation | Spelling | Numeracy | |
|---|---|---|---|---|---|---|
| 3-5 & 8-10 years | Comparison sites | .19 | -.04 | .23 | -.01 | .11 |
| CfC sites | -.13 | -.09 | -.14 | -.16 | -.20 | |
| 3-5 years only | Comparison sites | .30 * | .26 | .36 * | .30 * | .33 * |
| CfC sites | .40 ** | .43 ** | .48 *** | .46 *** | .35 ** | |
| 8-10 years only | Comparison sites | .02 | .08 | .23 | .22 | .07 |
| CfC sites | -.10 | -.25 | -.13 | -.10 | -.06 | |
Notes: Models adjusted for children's early literacy scores (centred Peabody Picture Vocabulary Test) and primary carers' education (Year 12 certificate or higher, compared with less than Year 12 education). *** p < .001; p < .01; p < .05; + p < .08.
These results need to be interpreted in the context of the children's development with respect to reading. By 8-10 years of age, most children would be expected to be reading independently; for example, in LSAC only 11% of 8-9 year old children often read with their primary carers. Those who required additional assistance at this age could have developmental problems of one kind or another. Overall, the results in both comparison and CfC sites confirm the important role that early reading with children plays in the development of literacy and, to a less extent, numeracy (Farrant, 2012).
What are the implications of these findings for the CfC initiative? The associations between reading and literacy/numeracy confirm that shifting a higher percentage of parents into reading often to their children at 3-5 years of age has positive implications for their learning at school, even after taking into account early literacy skills at 3-5 years and primary carers' education. The regression results also suggest that there is a more consistent association between early reading and later school achievement in CfC compared to comparison sites for all of the outcomes examined.
5.1.2 Joblessness
There are a few studies that have examined the effects of parental job loss on children's educational outcomes. In one study, primary school children with fathers who lost their job were more likely to repeat a grade, be suspended or expelled (Kalil & Zio-Guest, 2008), while in another, adolescents were more likely to drop out of secondary school or not go on to attend university (Coelli, 2005). In this section, we examine associations between parental joblessness on children's NAPLAN scores for those living in CfC and comparison sites.
Figure 5.4 shows children's average NAPLAN scores for those in families that were not jobless at Waves 1 and 3 (when children were aged 2-3 and 3-5 years respectively), that were jobless at Wave 1 but had moved out of joblessness by Wave 3, and that were jobless at Wave 3 (regardless of their employment status at Wave 1).
Figure 5.4: Average Year 3 NAPLAN scores, by family joblessness at Waves 1 and 3, comparison and CfC sites
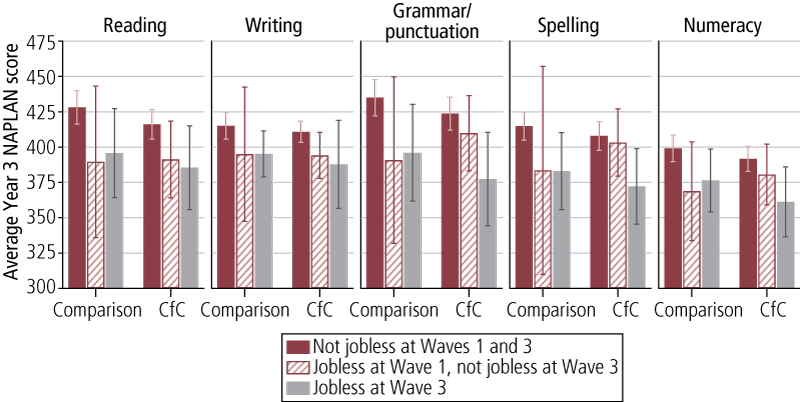
Average NAPLAN scores were highest for children in families that were not jobless at both Waves 1 and 3. In many instances, average NAPLAN scores for children in families that moved out of joblessness at Wave 3 were broadly more similar to children whose families were jobless at Wave 3. However, average NAPLAN grammar/punctuation, and spelling scores for children in families who were no longer jobless at Wave 3 were very similar to children in families that were never jobless in CfC sites.
Table 5.3 presents standardised regression coefficients for the effect of family joblessness on NAPLAN scores.
| Family joblessness | Reading | Writing | Grammar/ punctuation | Spelling | Numeracy | |
|---|---|---|---|---|---|---|
| Adjusted for primary carers' education (ref. = Not jobless at Waves 1 and 3) | ||||||
| Jobless at Wave 1, not jobless at Wave 3 | Comparison sites | -.45 | -.32 | -.47 | -.39 | -.44 |
| CfC sites | -.29 | -.27 | -.15 | -.06 | -.16 | |
| Jobless at Wave 3 | Comparison sites | -.37 * | -.32 + | -.41 ** | -.40 * | -.33 * |
| CfC sites | -.35 * | -.37 * | -.49 ** | -.45 * | -.44 * | |
| Adjusted for primary carers' education and literacy skills at 3-5 years (ref. = Not jobless at Waves 1 and 3) | ||||||
| Jobless at Wave 1, not jobless at Wave 3 | Comparison sites | -.42 | -.28 | -.39 | -.30 | -.34 |
| CfC sites | -.13 | -.20 | .03 | .08 | .05 | |
| Jobless at Wave 3 | Comparison sites | -.01 | -.18 | -.17 | -.17 | -.02 |
| CfC sites | -.14 | -.14 | -.33 + | -.27 | -.27 | |
Notes: In the top panel, models are adjusted for primary carers' education (Year 12 certificate or higher, compared with less than Year 12 education). In the bottom panel, models are adjusted for children's early literacy scores (centred Peabody Picture Vocabulary Test) and primary carer education (Year 12 certificate or higher, compared with less than Year 12 education). *** p < .001; p < .01; p < .05; + p < .08.
The top panel presents regression estimates that have been adjusted for primary carers' education but not the children's literacy skills. There are two main points to note. Firstly, compared to children who were in households where at least one parent had a job at Waves 1 and 3, those who were living in jobless households at Wave 3 had significantly worse Year 3 NAPLAN scores on all measures in both comparison and CfC sites. These differences varied between .32 to .49 standard deviation units, which was a medium effect size. Secondly, for children living in both types of sites, there were no statistically significant differences between NAPLAN scores on any measure for children who lived in a family that had moved out of joblessness by Wave 3, compared to those who were not jobless at either wave. While there was no evidence that the transition out of family joblessness was more beneficial for those in CfC sites, it should be remembered that more families transitioned out of joblessness in CfC compared to comparison sites.
We also examined the effect of family joblessness adjusting for children's literacy skills at 3-5 years of age (bottom panel of Table 5.3). This was important to do because we know that early literacy skills enable children to start school ready to learn. We also know that children who live in jobless families have lower levels of early literacy skills prior to starting school (Gray & Baxter, 2012). Therefore, if the inclusion of early literacy skills explains differences in NAPLAN scores in children living in jobless families, it suggests that joblessness undermines children's literacy skills prior to entering school and highlights the potential efficacy of programs that target families prior to children starting school. The results show that there are no significant associations between being jobless at Wave 3 and children's NAPLAN scores (with the sole exception of grammar/punctuation in CfC sites; p < .08).
While the regression models presented above were intentionally exploratory and did not include many covariates to adjust for pre-existing differences, the results do suggest that persistent joblessness in early childhood undermines academic achievement in middle childhood. Our findings suggest that this occurs through the disruption of the acquisition of early literacy skills that put children in a worse position prior to starting school. It supports the view that a reduction in family joblessness, as was observed in a greater percentage of families in CfC sites compared to comparison sites, enhances children's academic achievement at 8-9 years.
5.1.3 Community involvement
Figure 5.5 shows average NAPLAN scores for children with primary carers who did and did not report volunteering when the study child was 3-5 years or 8-10 years. In comparison sites, children with a primary carer who volunteered when they were 8-10 years averaged higher NAPLAN scores than those with a primary carer who did not report volunteering when the child was 3-5 years or 8-10 years. However, these differences never approached statistical significance. NAPLAN scores are relatively more stable across different groups that vary in terms of primary carers' community involvement.
Figure 5.5: Average Year 3 NAPLAN scores, by primary carers' community involvement and age of study child, comparison and CfC sites
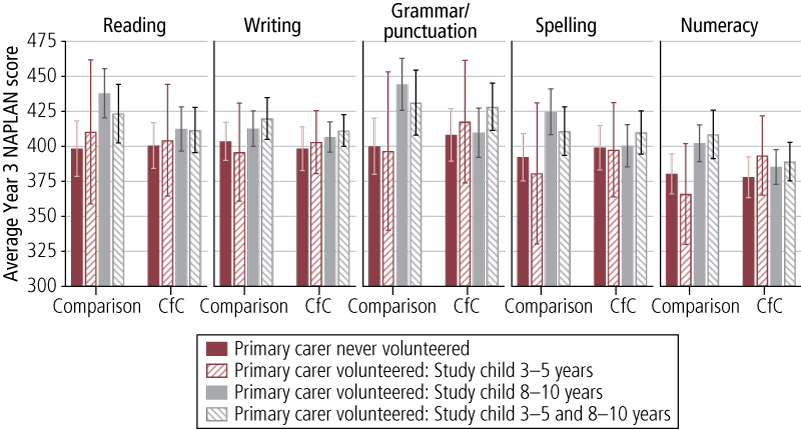
5.2 SDQ total problems and prosocial behaviour scores
In addition to educational achievement, we also examine social and behavioural problems and prosocial behaviour as measured by the SDQ total problems and prosocial behaviour scales.
5.2.1 Primary carer engagement in reading often with study child at 3-5 years
Table 5.4 shows the average SDQ total problem score and the SDQ prosocial scores for children 3-5 years, 8-9 years and 9-10 years in comparison and CfC sites who were and were not read with often at ages 3-5 years. Children who were read with often at 3-5 years averaged significantly lower SDQ problem scores at 3-5 years, 8-9 years and 9-10 years in both comparison and CfC sites. Differences ranged from around 20% to 30% of a standard deviation, which is a small to medium effect. SDQ prosocial scores were also higher among children who were read with often at 3-5 years than among children who were not, but this was only statistically significant for children 8-9 years in comparison sites and children 3-5 years in CfC sites.
| Not read with often | Read with often | |||
|---|---|---|---|---|
| Comparison sites | SDQ problem score | 3-5 years | 9.8 | 8.6 *** |
| 8-9 years | 9.1 | 7.9 *** | ||
| 9-10 years | 9.4 | 7.7 * | ||
| SDQ prosocial score | 3-5 years | 7.6 | 7.9 | |
| 8-9 years | 8.3 | 8.6 + | ||
| 9-10 years | 8.2 | 8.4 | ||
| CfC sites | SDQ problem score | 3-5 years | 9.9 | 8.4 ** |
| 8-9 years | 9.3 | 7.8 * | ||
| 9-10 years | 8.8 | 7.9 ** | ||
| SDQ prosocial score | 3-5 years | 7.7 | 8.1 *** | |
| 8-9 years | 8.3 | 8.5 | ||
| 9-10 years | 8.4 | 8.5 |
Notes: *** p < .001; p < .01; p < .05; + p < .08.
Figure 5.6 shows children's SDQ problem and prosocial scores measured at 8-9 years and 9-10 years by whether they were read with often at ages 3-5 years and/or 8-10 years.
Reflecting the results shown in Figure 5.6, children who were read with often at ages 3-5 years, with and without reading at 8-10 years, averaged lower SDQ total problem scores than children who were not read with often at either 3-5 years or 8-10 years. However, children who were read to at 8-10 years only, had total SDQ problem scores that were relatively high or comparable with children who were not read with often at 3-5 years or 8-10 years. SDQ prosocial scores varied much less, with few noticeable differences in patterns of reading often with children.
Table 5.5 reports the standardised regression coefficients showing the effect on SDQ problem and prosocial scores of reading often with children at 3-5 years and/or 8-10 years in comparison and CfC sites. There were no significant differences in children's SDQ problem scores when aged 8-9 years associated with being and not being read with often when aged 3-5 years and/or 8-10 years in both comparison and CfC sites.
Figure 5.6: Average SDQ problem and prosocial scores at 8-9 and 9-10 years, by whether study child was read with often at 3-5 and 8-10 years, comparison and CfC sites
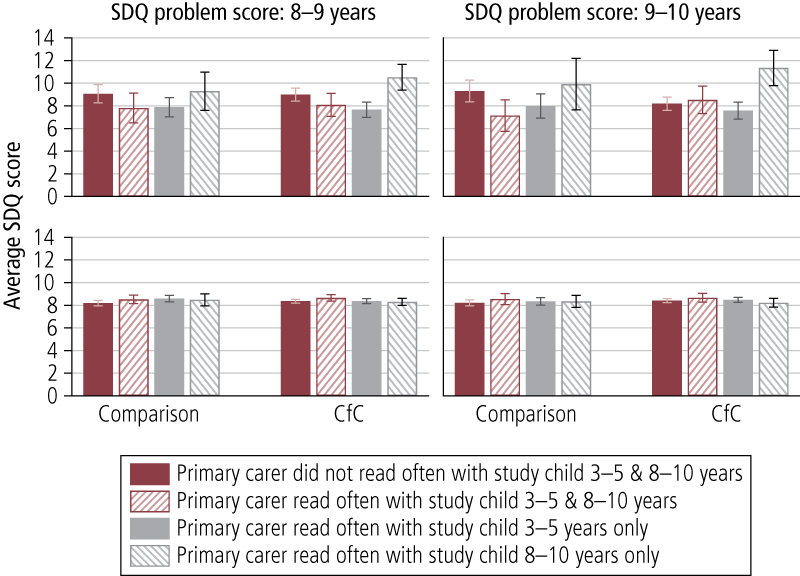
| Read with often at: | SDQ problem score | SDQ prosocial score | |||
|---|---|---|---|---|---|
| 8-9 years | 9-10 years | 8-9 years | 9-10 years | ||
| Comparison site | 3-5 & 8-10 years | -.11 | -.19 | .13 | .11 |
| 3-5 years only | -.16 | -.22 * | .22 + | .07 | |
| 8-10 years only | -.03 | .02 | .19 | .11 | |
| CfC site | 3-5 & 8-10 years | -.10 | .09 | .15 | .14 |
| 3-5 years only | -.09 | .02 | -.05 | -.02 | |
| 8-10 years only | .09 | .32 ** | .04 | -.02 | |
Notes: Models adjusted for primary carers' education (Year 12 certificate or higher, compared with less than Year 12 education). *** p < .001; p < .01; p < .05; + p < .08.
Children aged 9-10 years in comparison sites who were read with often only when aged 3-5 years averaged significantly higher SDQ problem scores than children who were not read with often at 3-5 years and 8-10 years. The difference was 0.22 of a standard deviation, which is a small effect size. Though it is not statistically significant, the effect for being read with often at 3-5 years and 8-10 years was also very similar for children aged 9-10 years living in comparison sites. For children 9-10 years in CfC sites, being read with at 8-10 years was associated with higher SDQ problem scores, and the effect was around 30% of a standard deviation. This suggests that reading with older children may be an indication of problems for those children and echoes findings above showing lower NAPLAN scores for children who were read with often when 8-10 years. There are a couple of reasons underlying this assertion. Firstly, the SDQ problems scale includes items that capture hyperactivity and inattentiveness, and children with higher levels of these characteristics may have difficulty reading. Secondly, the pattern of primary carer engagement is also consistent with a child who had difficulties reading at earlier ages because of hyperactivity/inattentiveness (hence primary carers were not reading to them often) but at a later age would still be struggling; at this later age, primary carers may be trying to enhance their capacity in reading by being more engaged. While this is speculation, it is notable that this only occurs in CfC sites.
The results in Table 5.5 echo those presented in Figure 5.6, showing very few differences in SDQ prosocial scores across groups with different reading patterns. There is only one marginally significant positive association between reading often with children at 3-5 years and SDQ prosocial scores measured at 8-9 years for children in comparison sites. In this instance, primary carer engagement in regular reading at the age of 3-5 years was associated with higher prosocial behaviour at 8-9 years.
In summary, the findings from this set of analyses are inconclusive. There was limited evidence of any effect of primary carer reading on emotional and behavioural problems, with one instance of a positive effect for one group and a suggestion of a negative association for another. In terms of prosocial behaviour, the results were also largely inconclusive.
5.2.2 Joblessness
Figure 5.7 shows the average SDQ problem and prosocial scores for children at 3-5, 8-9 and 9-10 years in comparison and CfC sites in families with varying patterns relating to joblessness at Waves 1 and 3 (when the study child was 2-3 and 3-5 years respectively).
Figure 5.7: Average SDQ problem and prosocial scores and patterns of family joblessness, by age of children, CfC and comparison sites
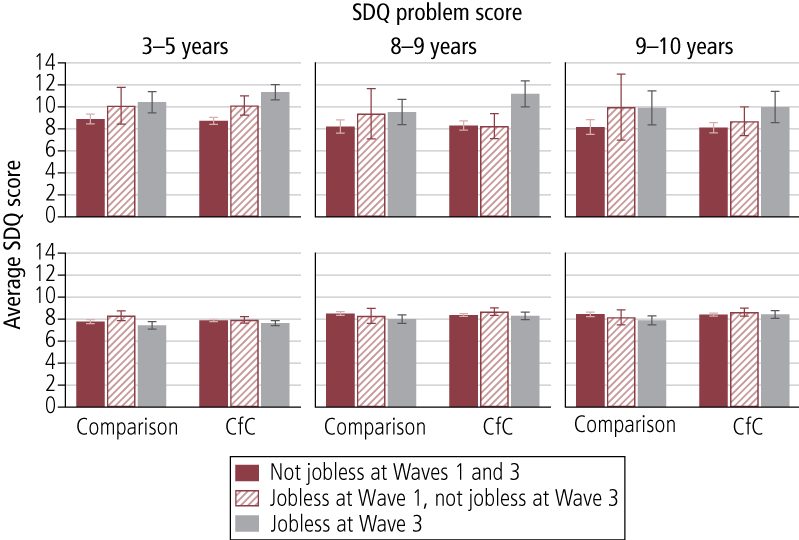
Table 5.6 shows standardised regression coefficients from regression models that adjust for primary carers' education level. There are two major lessons from these sets of analyses. Firstly, there was a fairly consistent finding that children living in a jobless household at Wave 3 had higher levels of social and emotional problems than those living in a household where at least one parent had a job for the same period. More specifically, in both comparison and CfC sites, children in families that were jobless at Wave 3 averaged significantly higher SDQ problem scores than children in families that were not jobless at Waves 1 and 3. This significant difference was found for SDQ problems at 3-5 and 9-10 years in comparison sites, and 3-5, 8-9 and 9-10 years in CfC sites.
Secondly, children living in households where their parents moved out of joblessness between Waves 1 and 3 had similar levels of social and behavioural problems as those who were not in jobless families in Waves 1 and 3. A sole exception for SDQ problem scores relates to children aged 3-5 years in CfC sites, who had significantly higher SDQ problem scores than their counterparts in families that were not jobless at either wave. However, in later waves there was improvement in their problem scores.
| SDQ problem score | SDQ prosocial score | ||||||
|---|---|---|---|---|---|---|---|
| 3-5 years | 8-9 years | 9-10 years | 3-5 years | 8-9 years | 9-10 years | ||
| Jobless at Wave 1, not jobless at Wave 3 | Comparison sites | .24 | .19 | .31 | .30 + | -.13 | -.17 |
| CfC sites | .25 ** | -.03 | .07 | .04 | .17 | .13 | |
| Jobless at Wave 3 | Comparison sites | .25 ** | .21 | .27 * | -.17 | -.32 ** | -.32 * |
| CfC sites | .49 *** | .49 *** | .31 ** | -.12 | -.06 | .01 | |
Notes: Reference is children in families that were not jobless in Waves 1 and 3. Models adjusted for primary carers' education (Year 12 certificate or higher, compared with less than Year 12 education). *** p < .001; p < .01; p < .05; + p < .08.
There were less consistent findings for SDQ prosocial scores. In both comparison and CfC sites, SDQ prosocial scores for children 3-5 years were lower for those in families that were jobless at Wave 3 compared with children 3-5 years in families that were not jobless at Waves 1 and 3. For children aged 8-9 years and 10-11 years, this result was only significant in comparison sites. Finally, 3-5 year-old children in comparison sites in families that moved out of joblessness at Wave 3 had higher SDQ prosocial scores, but this finding was only marginally statistically significant (p < .08).
In summary, the findings on family joblessness with respect to social and behavioural problems were similar to the analyses of NAPLAN results - persistent joblessness undermined children's development, but children were resilient to more transitory periods of parental joblessness. Findings in relation to prosocial behaviour were less clear-cut, although there is a suggestion that persistent joblessness undermines prosocial behaviour and moving out of joblessness promotes prosocial behaviour, and this was only observed for children living in comparison sites and for particular time periods.
5.2.3 Community involvement
Community involvement has been found to have positive associations with children's developmental outcomes (Edwards & Baxter, in press; Elder & Conger, 2000). Edwards and Baxter analysed the first three waves of LSAC and found that compared to children who had primary carers who were not involved in a volunteer or community group, children who had a primary carer who was involved had lower levels of emotional or behavioural problems. Figure 5.8 shows average SDQ problem and prosocial scores for children aged 3-5 years in comparison and CfC sites for those whose primary carer contemporaneously reported volunteering in the community and those whose primary carer did not. In both comparison and CfC sites, children whose primary carer was more involved in the community averaged significantly lower SDQ problem scores than children whose primary carer was not. In contrast, average SDQ prosocial scores did not vary significantly with differences in primary carers' reports of volunteering in the community.
Table 5.7 reports the result from regressions considering the effect of primary carers' volunteering in the community when the child was younger (3-5 years) and older (8-10 years) on children's standardised SDQ problem and prosocial scores at 8-9 years and 10-11 years. There are several points to note. Firstly, children who had a primary carer who volunteered in the community when they were 3-5 and 8-9 years had much lower levels of emotional and behavioural problems than those whose primary carer did not volunteer at either time periods. This was the case in both comparison and CfC sites. Children whose primary carer reported volunteering in the community either when the child was 3-5 years or 8-10 years averaged significantly lower SDQ problem scores when aged 8-9 years in CfC sites and when aged 9-10 years in comparison sites.
Figure 5.8: Average SDQ problem and prosocial scores and patterns of volunteering in the community, children 3-5 years, comparison and CfC sites
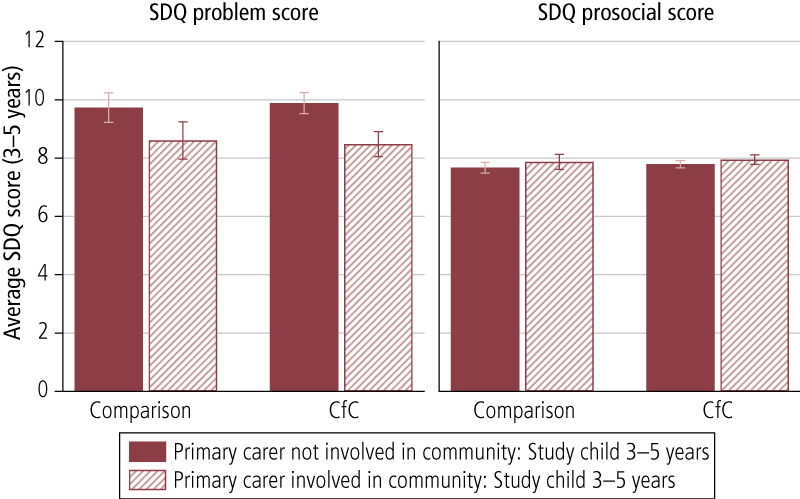
| Primary carer volunteered in community | SDQ problem score | SDQ prosocial score | |||
|---|---|---|---|---|---|
| 9-10 years | 8-9 years | 9-10 years | 8-9 years | ||
| Comparison sites | Study child 3-5 years | -.37 | -.54 * | .50 * | .36 |
| Study child 8-10 years | -.14 | -.26 + | .24 * | .29 * | |
| Study child 3-5 & 8-10 years | -.45 *** | -.62 *** | .37 ** | .41 ** | |
| CfC sites | Study child 3-5 years | -.24 + | -.14 | .09 | .05 |
| Study child 8-10 years | -.19 * | -.03 | .10 | -.02 | |
| Study child 3-5 & 8-10 years | -.27 ** | -.20 * | .24 ** | .13 | |
Notes: Models adjusted for primary carers' education (Year 12 certificate or higher, compared with less than Year 12 education). *** p < .001; p < .01; p < .05; + p < .08.
One possible conclusion that could be gleaned from these findings is that continuous primary carers' involvement in volunteering is positive for children's development, but the results are not as consistent for interrupted involvement. Moreover, given that primary carers are somewhat more likely to be continuously involved in CfC sites given that they have higher levels of involvement at Wave 3, there is a possibility that there could be longer-term benefits of the CfC initiative.
For prosocial behaviour, there was a fairly consistent pattern of positive associations with volunteering in the community for comparison but not CfC sites. In comparison sites, average SDQ prosocial scores at 8-9 and 9-10 years were significantly higher for children with primary carers who volunteered in the community when the child was 3-5 years and/or 8-10 years. The only exception to this relates to volunteering when the study child was 3-5 years in the model for SDQ prosocial scores when the child was 9-10 years. In CfC sites, the only significant finding was in the model for SDQ prosocial scores at 8-9 years for children whose primary carer reported volunteering in the community at ages 3-5 years and 8-10 years. It is difficult to understand this finding; it may be that the types of volunteering that were done in comparison sites reflected primary carers' own predilections towards prosocial behaviour, and given that there is likely to be a shared genetic and environmental component that is transmitted to children, the positive associations may reflect a form of selection effect rather than the effect of volunteering per se. This interpretation is given more weight when considering CfC sites, where there was not a consistent association with prosocial behaviour but volunteering was a focus of the initiative, and therefore a primary carer's own propensity towards helpful behaviour would have been less of a confounding factor in this instance. Regardless of whether this or another explanation fits the pattern of results, it is clear that there is not a consistent pattern across both sites, unlike with children's social and behavioural problems.
5.3 Summary
In this chapter we explored whether three significant program effects in Stage 1 CfC sites could be linked to positive child outcomes in the longer term - namely primary carers reading often with children, family joblessness and primary carer volunteering.
Several conclusions can be drawn from this chapter, but the overall conclusion is that there were many instances where these factors were associated with children's later literacy and numeracy, and social and behavioural problems. Firstly, primary carers reading often to their children at 3-5 years (but not at later ages) was consistently associated with higher literacy and numeracy scores from NAPLAN tests. Secondly, persistent family joblessness when children were 2-3 and 4-5 years of age undermined children's literacy and numeracy skills and was associated with poorer social and emotional behaviour. Additional analyses confirmed that the likely pathway by which family joblessness undermines children's development was through early literacy skills, as they are important to later learning in primary school. These findings are consistent with other international literature on factors that promote children's development (Coelli, 2005; Huttenlocher et al., 1991; Kalil & Ziol-Guest, 2008; Senechal et al., 1996). Perhaps more importantly for the CfC initiative, children living in families that moved out of family joblessness by the time children were 4-5 years of age were resilient to the detrimental effects of family joblessness for literacy, numeracy and social and emotional behavioural problems. Finally, primary carer volunteering when children were aged both 4-5 years and 8-9 years was consistently associated with lower levels of social and behavioural problems.
6. Discussion and conclusion
There are several reasons for the increasing interest in area-based initiatives. Firstly, the Australian Government's Social Inclusion Agenda (Australian Government, 2010) has an explicit focus on locational disadvantage. Secondly, there has been an increase in income inequality in neighbourhoods in many developed nations, including Australia (Hunter, 2003). Finally, there are numerous studies, both international (e.g., Leventhal & Brooks-Gunn, 2000) and Australian (e.g., Edwards, 2005; Edwards & Bromfield, 2009) that have found that neighbourhood socio-economic disadvantage is correlated with worse outcomes for children and youth, even after family factors are taken into account. However, we are still in the early stages of understanding how community-level interventions like Communities for Children influence individual families and their children's development. Area-based initiatives usually target the entire population of families within a prescribed area. There are few examples of area-based interventions that have been national in scope. Two recent examples include Sure Start in the UK (NESS Team, 2012) and Communities for Children in Australia (Muir et al., 2010). Both have been implemented nationally as a means of improving the life chances of children. Another more localised example is the Pathways to Prevention Project, which focused on providing comprehensive and integrated services in several ethnically diverse, socially disadvantaged, and high-crime Brisbane suburbs (Homel et al., 2006). In this section, we summarise and discuss the findings of Phase 2 of the evaluation of CfC.
When considering the results of Phase 2 of the CfC evaluation, it is important to keep in mind the aims, structure and evolution of the CfC initiative. The CfC initiative aimed to:
- improve coordination of services for children and their families;
- identify and provide services to address unmet needs;
- build community capacity to engage in service delivery; and
- improve the community context in which children grow up.
Under the CfC initiative, in 2005, DSS funded non-government organisations in 45 geographic areas to develop and implement a whole-of-community approach to enhancing children's development. Facilitating Partners were tasked to increase cooperation and collaboration among local service providers and therefore improve outcomes for children and their families. Facilitating Partners established committees comprising local service providers and members of the community who decided on and managed the funding for CfC sites. The intention was that this model would enhance coordination and cooperation as well as meet the individual needs of the community. As a result of this model, no one community receives a similar mix of services. The types of services offered in the CfC sites differ depending on the needs of each community, including home visiting; programs on early learning, child nutrition and literacy; parenting and family support services; and community events (Edwards et al., 2011).
As with Sure Start in the UK, there was no requirement that the Facilitating Partners and the committees fund services that had an evidence base to support them; nor was there a requirement to have standardised and manualised services, such as is typical of evaluations of discrete interventions (Barrett, 2010). Therefore, in each site, over the course of the evaluation period, there was a heterogeneous mix of services with varying degrees of individual efficacy.
In 2009, the Australian Government announced that it was widening the scope of CfC services to include services for children aged 0-12 years and targeted vulnerable and disadvantaged families (however, it is beyond the scope of the current evaluation to measure whether there was any commensurate increase in the funding, or change in the nature of services provided in the CfC sites to reflect this policy change). In the same year, eight sites were targeted to focus on preventing child abuse and neglect in particular - four were existing CfC sites and four were new sites. In this report, these sites are referred to as Stage 2 CfC sites. Stage 2 CfC sites are not included in the CfC evaluation reported in the main body of the report; however, preliminary waves of data from the early implementation of seven Stage 2 CfC sites and four comparison sites are included in the Appendix.
As in the initial Phase 1 report of the evaluation (Edwards et al., 2009), the Stronger Families in Australia Phase 2 study provides a unique opportunity to consider the effectiveness of the CfC initiative. The strengths of the SFIA study include having:
- a large sample representing 42% of the initial target population in the selected CfC and contrast sites;
- relatively low and non-systematic attrition from when children were 2-3 to 8-9 years of age;
- robust measurement of child and family outcomes; and
- an appropriately matched comparison group.
However, the SFIA survey cannot identify the extent to which particular children or families have received CfC services, as one of the key features of the initiative was to change the nature of how the service delivery system operates.
The structure of the discussion is as follows. The first three sections provide summaries of the key findings from different aspects of the empirical chapters in the report. The fourth section discusses some of the implications of these findings and the last section concludes.
6.1 Summary of evaluation findings
6.1.1 Effects of CfC initiative on child, family, and community outcomes in Stage 1 CfC sites
Findings from the evaluation of Stage 1 CfC sites suggest that there were some positive effects of the program on a variety of outcomes. These did vary in their timing, however, with some appearing to "fade out" when children started school. The positive effects of the CfC initiative (i.e., greater improvements in CfC than comparison sites) included:
- a reduction in jobless households from Wave 1 to Wave 3, but not in later waves;
- reductions in primary carer reports of hostile parenting practices (between Wave 1 to Wave 3) and at Wave 3 and Wave 5 lower levels of hostile parenting practices only;
- improvements in parental self-efficacy (at Wave 3, but not Waves 4 or 5);
- improvements in frequency of primary carers reading to the target child between Wave 1 and both Waves 3 and 5 (though these gains were largely reflected in benefits to children living in families that were relatively more advantaged, particularly higher income families);
- increased engagement with children in music and singing by primary carers from more disadvantaged families between Waves 1 and 5 (both lower income and education); and
- increased volunteering by primary carers between Waves 1 and 3 overall, and increased engagement in volunteering between Waves 1 and 5 for primary carers with lower levels of education.
There were several other noteworthy results that were less conclusive, which are discussed in some detail below.
First, the findings suggest that, overall, CfC had little effect on neighbourhood social cohesion and community safety. However, there is some evidence of improvements in ratings of cohesion and safety for families in the lower income group. In these families, community safety improved between Waves 1 and 4 at a greater rate in CfC sites than in comparison sites, and there was the same pattern of improvement between Waves 1 and 5 for community social cohesion.
Second, for some outcomes (indicators of children's social and emotional wellbeing, and cognitive development), the lack of a baseline measure precluded us from concluding that there was a positive effect from the CfC initiative. Baseline or Wave 1 information about outcomes was important, as it enabled us to be able to establish that differences between families and children in CfC sites compared to comparison sites were not due to pre-existing differences but rather to the program. However, there were a few measures of children's development that, given the age of the target child at the time (2 years of age), were not able to be collected as there were no measures that were developmentally appropriate that could be administered effectively within the study design. At later ages, notably at Wave 3 (when the children were 4-5 years of age), it was developmentally appropriate to measure social and emotional problems and prosocial behaviour (using SDQ). There is some evidence from these measures that is suggestive of a positive effect of CfC, although it is not possible to establish this definitively without baseline information. For example, prosocial behaviour was higher in CfC sites than in comparison sites at Wave 3 overall, while this same pattern was also observed at Wave 5, but only for children in the lower educated group. These findings are consistent with the view that CfC had positive effects, but the lack of baseline data precludes the conclusion that this is a program effect.
Third, in Phase 1 of the evaluation, primary carers reported that children's physical functioning declined in CfC sites (relative to comparison sites) between Waves 1 and 3. However, there were no significant differences between CfC and comparison sites in child physical functioning at Waves 4 and 5. Findings from this latter phase of the evaluation support the view from the earlier evaluation (focused on Waves 1-3) that this may have been due to greater engagement with health services (resulting in heightened surveillance by health professionals) and monitoring by primary carers (Edwards et al., 2009).
Fourth, there were two instances where the difference-in-difference estimates suggested worse outcomes for CfC sites; however, these are likely to be due to pre-existing differences at baseline and are not indicative of a program effect. The difference-in-difference coefficients for primary carers' mental health suggested that CfC had a negative effect on this outcome between Waves 1 and 4 and Waves 1 and 5. However, in CfC sites, primary carers' mental health scores were precisely the same at Waves 4 and 5, and the difference-in-difference findings were being driven by the fact that primary carers in comparison sites had significantly worse mental health at baseline compared to those living in CfC sites. A similar pattern of results was evident for the lower educated group on primary-carer-reported physical health, with pre-existing lower rates of physical health at baseline in comparison groups driving a negative difference-in-difference finding for CfC sites, even though the proportions in good health were almost identical at Waves 3 and 5.
6.1.2 Residential mobility and out-migration from CfC sites
While all families in the intervention group actually resided in CfC sites at Wave 1 of the survey, some may have moved out of a CfC site in subsequent waves. Australian families commonly move multiple times in a child's early years (Edwards, 2011; Maguire et al., 2012), so it is important to establish that the findings from the Stage 1 CfC sites were robust to residential mobility. Moreover, there is evidence that high levels of residential mobility undermine children's development (Jelleyman & Spencer, 2008; Taylor & Edwards, 2012), so it is also important to ensure that systematic differences in residential mobility in CfC and comparison sites have not biased our findings.
Another reason to focus on residential mobility for the report is that the extent to which individuals move out of areas that are targeted for area-based initiatives is largely unknown. Therefore, this information is of interest to the policy development of area-based initiatives in its own right.
The general conclusion to be drawn from the data is that there is no evidence to suggest that residential mobility biased the findings of the overall evaluation. However, it is important to note that there were significant levels of residential mobility for families living in both CfC and comparison sites. The more specific findings from this analysis were as follows:
- One in three families moved between waves. However, the rates were very similar between CfC and comparison sites and were consistent with what is observed in the general population of families with young children (Maguire et al., 2012).
- Families were more likely to move between waves if there was no father living in the household or if there was a change in relationship status between waves; however, there were no other consistent systematic differences between "movers" and "non-movers".
- Only one in two families that were living in CfC sites when their children were 2-3 years of age were still living in a CfC site six years later. While this may seem a high proportion of families moving, these rates are consistent with that of the general population (Edwards, 2011).
- Families that left CfC sites were not different to those that stayed in terms of demographic characteristics. However, because we didn't examine families that may have moved into CfC sites in subsequent years of the evaluation, we cannot say whether these families would be similar to those that remained. Any families who moved into CfC (or comparison) sites after Wave 1 were not in scope for the evaluation, even though they might have been receiving a range of services from local agencies in the sites.
- Even if we take only those families who had stayed in CfC sites for all five waves, the overall pattern of findings from the evaluation remains very similar.
6.1.3 Links between program effects and child outcomes
There were significant program effects in Stage 1 CfC sites relating to family joblessness, primary carer engagement in children's reading, and community involvement of primary carers. These positive program effects occurred at Wave 3 and in later waves, and in the case of community involvement and primary carer engagement in children's reading, positive program effects were evident for the lower and higher income and education subgroups. Given that other studies have found that these outcomes are likely to be beneficial to children's development in the longer term (Coelli, 2005; Huttenlocher, et al., 1991; Kalil & Ziol-Guest, 2008; Senechal et al., 1996), we wanted to examine whether there were flow-on benefits to children when they were in the primary school years. To consider this, we explored associations between these factors and NAPLAN scores relating to children's reading, writing, grammar and punctuation, spelling, and numeracy at Year 3, and indicators of children's social and emotional wellbeing and prosocial behaviour measured at Waves 3, 4 and 5.
There were no statistically significant differences between CfC and comparison sites on any of the NAPLAN scores. However, the overall conclusion from this analysis was that there were many instances in which these factors were associated with children's later literacy and numeracy and social and behavioural problems. More specifically:
- Primary carers reading often with children at 3-5 years was consistently associated with improved literacy and numeracy scores from NAPLAN tests, but not with increased primary carer reports of reading at later ages.
- Family joblessness when children were 4-5 years of age (i.e., Waves 1-3) was associated with having lower literacy and numeracy skills and poorer social and emotional behaviour in children aged 7-8 years.
- Family joblessness prior to children entering school was associated with poor early literacy, and poor early literacy undermined later learning in primary school.
- More importantly for the CfC initiative was the finding that in families that moved out of family joblessness by the time children were 4-5 years of age, the effects of early joblessness were no longer apparent by 7-8 years (i.e., Wave 5).
- Finally, consistent primary carer volunteering when children were aged 4-5 years and 8-9 years of age was associated with lower levels of social and behavioural problems in children.
While many of these educational and social-emotional outcomes did not show differentiating effects between CfC and comparison sites, what they do demonstrate is that across all highly disadvantaged areas, there are particular family characteristics and primary carer behaviours in the early years that can be encouraged that are associated with improvements for children in middle childhood, namely:
- primary carer volunteering;
- employment of at least one parent/adult in the household; and
- frequency of primary carers reading to children.
6.2 Interpreting the implications of the timing of the effects of the CfC initiative
Although there were some positive - and a couple of negative - effects of the CfC initiative, most were not durable and faded out by around the time children were starting school. It is important to recognise that this pattern of findings is not unexpected or unique in area-based initiatives. The National Evaluation of Sure Start initiative in the UK reported similar findings, with positive findings in children's outcomes observed when children were 5 years of age no longer evident when children were aged 7 years, when they were in primary school (see section 1.1 for details). The authors of the Sure Start evaluation report interpreted the "catching up" that occurred to be a function of the UK Government's increased investment in preschool and schooling rather than the lack of effectiveness of Sure Start (NESS Team, 2012).
Children's universal attendance at primary school is one possible reason for why some positive effects of CfC had faded out by 7-8 years of age. For example, the percentage of primary carers volunteering increased markedly in both CfC and comparison sites during this time, so that over half of all primary carers in both types of sites were volunteering. This could be because of the opportunities that local schools provide for primary carers to become involved and volunteer, as well as the change in daily routine that may free up a primary carer's time during school hours to be involved in other community activities, including volunteer roles. Corroborating evidence that there is a "schooling effect" on primary carers' volunteering comes from a nationally representative sample of children. Analyses conducted for this report using LSAC data suggest that for the younger children in the study (the "B Cohort"), at ages 4-5 years, 37% of their primary carers were engaged in volunteering. Two years later, this increased to 47%. When the sample was restricted to families in the bottom 20% of the socio-economic positions, a similar trend was also evident. So for one of the more robust positive effects of the CfC initiative, it seems likely that volunteering by primary carers increases once their children reach school age. It is not clear from that set of analyses whether the timing of earlier engagement in volunteering has positive developmental consequences for children. We will return to this issue of importance of timing for children after discussing some of the other key outcomes.
One of the key findings from the first phase of the evaluation was that there was a greater reduction in jobless families in CfC relative to comparison sites. Our results suggest that by the time children were 7-8 years of age (Wave 5), comparison sites "caught up" to CfC sites in terms of the percentage of jobless families. The same pattern of results was also observed in Sure Start. From when children were aged 9 months to when they are 5 years old, there was a reduction in the rate of joblessness for Sure Start sites compared to comparison sites. However, the difference was no longer evident by the time the children reached 7 years of age (NESS Team, 2012). One explanation for the comparison sites "catching up" in both Sure Start and CfC is that children begin the first years of formal schooling around this time. When children are at school, primary carers have more time to volunteer or go to work, and the need for (or costs of) child-care to do so are significantly lower or absent.
However, in Australia there is another related explanation to the differences in family joblessness not being sustained - the former Australian Government's Welfare to Work reforms. There were activity requirements in the Australian income support system that required parents who were new recipients of income support from 1 July 2006 to seek part-time work once their youngest child had turned 6 years of age; or if they had been on income support prior to 1 July 2006, to seek part-time employment once their youngest child turned 7 years of age. This element of the policy was not grandfathered. The critical date for both of these requirements fell between the data collection periods for Waves 3 and 4. Therefore, families on income support would not have been required to consider employment at Wave 3 because their children were too young at that stage. This is the most likely explanation for the decrease in joblessness for all parents in the study, and the lack of differences between CfC and contrast sites at Waves 4 and 5 despite differences being found at Wave 3.
The Welfare to Work reforms are likely to have had some impact on the employment rates of disadvantaged families, as the evidence from a Department of Education, Employment and Workplace Relations (DEEWR) evaluation suggests that the reforms have been effective (DEEWR, 2008). The evidence suggests that there was a 51% decline in new recipients of the Single Parent Payment and a 55% decline in the number of recipients of Parenting Payment Partnered. In the first six months following the introduction of Welfare to Work, 38% of those on Single Parent Payment who had a youngest child aged 8 to 15 years exited the payment, compared to 15% over the previous three years. Those with a youngest child aged 6-7 years also exited at a faster rate (after 6 months, 23% had left compared to an average of 12% over the previous three years). For those on Parenting Payment Partnered, 45% had left the payment after 6 months compared to 32% in previous years. While the evaluation of Welfare to Work shows that the policy has been effective, it is important to acknowledge that the results from the SFIA survey suggest that the rate of joblessness in CfC sites was similar between Wave 3 when children were 4-5 years and Wave 4 when they were 7 years of age. This suggests that even if the Welfare to Work reforms were one of the factors leading to the reduction of joblessness in comparison sites, there is little evidence to suggest that they reduced joblessness further in CfC sites. Explanations for these findings could include:
- CfC combined with Welfare to Work had a similar effect on family joblessness as did Welfare to Work policies on their own, although the area-based interventions were effective in getting primary carers to work earlier in their children's lives.
- Once a certain "floor" is reached, it is very difficult to further reduce joblessness, even with a combination of area-based interventions and welfare policy change focused on parental employment.
6.3 Effects on later child wellbeing of early vs late reading, volunteering and moving out of joblessness
We have seen positive early results relating to primary carers reading to children, primary carers volunteering and family joblessness. Given that there is some evidence that both starting school and the Welfare to Work reforms may have enabled families in comparison sites to catch up to families in CfC sites, it is important to consider whether these positive effects at an early stage in the families of young children would have demonstrable benefits in the longer term for both families in CfC and comparison sites. In Chapter 5, we explored this issue by examining whether children benefitted in the early years of primary school (in terms of literacy, numeracy, social and behavioural problems, and prosocial behaviour) if they were often read to at ages 3-5 years, had a primary carer who consistently volunteered, and had a family that moved out of joblessness. It is important to note that we were examining the issue to see whether associations between these variables and child outcomes mattered, not whether there was a treatment effect of CfC on children's outcomes (we did not find that there were significant differences).
One of the key findings with respect to these rather disparate factors was that timing seemed to matter for children in CfC and comparison sites. If primary carers were reading more frequently to their children in later years but not earlier years (when the positive effect of CfC was observed on reading), there was no demonstrable benefit to numeracy and literacy scores of children. If primary carers were only volunteering in the school years but not in the preschool years (when the positive effect of CfC was observed on volunteering), this was much less consistently associated with beneficial outcomes (in terms of reductions in children's emotional and social problems). If there was family joblessness only in Wave 1 and not Wave 3, then these families' children's outcomes (numeracy and literacy, emotional and behavioural problems, and prosocial behaviour) were generally no different from those of children living in families where at least one parent was consistently employed. We also saw some evidence to suggest that the detrimental effects of joblessness occurred prior to starting school (when children were 4-5 years of age), as much of the influence of early joblessness on later NAPLAN scores was entirely mediated through differences in early literacy skills at 4-5 years, which were associated with concurrent joblessness. Therefore, school readiness and what happens prior to school entry are also important considerations. Findings from this set of analyses seem to suggest that the timing of when interventions occur and when potential effects are observed both matter for children's development.
Part of the reason for the lack of durability of positive outcomes of the CfC initiative is due to the fact that other broader policies (e.g., Welfare to Work) and programs (e.g., universal primary schooling) enable families and children in comparison sites to "catch up" to those in CfC sites. However, it is also important to be realistic about what can be achieved by an area-based initiative such as CfC. The size of the CfC effects was small, but comparable in size and timing to the UK Sure Start evaluation. Other reviews of the effectiveness of direct service delivery interventions or programs in early childhood have also suggested that the majority of the effects on parenting and child outcomes are small, except for a manualised parenting program called Triple P, which has reported greater effects (Wise et al., 2005). Another possible reason could be that the CfC initiative encouraged heterogeneous service delivery to operate in each site, and therefore families from each site may have received services focused on different aspects of the outcomes that were examined. For instance, in one CfC site, parenting services might have been a focus, while in another, reading programs, play groups, or other school-readiness programs may have been emphasised. What is likely is that not all the CfC sites would have had a consistent set of services targeting each particular outcome in the evaluation, and perhaps this explains that while there was a general trend towards positive effects for many outcomes, only a few were statistically significant.
It is also important to note that many of the participants may not have been the direct recipient of any CfC-funded service, so any treatment effects that were observed would be dependent on a subsample of "treated" families as well as the indirect benefits of CfC to other families in the same geographic location. As far as we are aware, the CfC services were not required to meet a certain standard of service delivery when implementing different types of services as part of the initiative. Therefore, the fidelity of how programs were delivered was not assessed and cannot be ascertained by the evaluation. Another potential explanation for the effects observed was that in the original evaluation, the CfC initiative was funded to focus on 0-5 year-olds. It was beyond the scope of the evaluation to examine how the service delivery system altered as a result of the 2009 changes, but given that the financial resources were not increased substantially in line with the broadened focus, it is possible that there was not a commensurate expansion in services provided to 6-12 year-olds.
Finally, it is also important to bear in mind the service delivery context in Australia. There are a number of moderate to large non-government organisations that work across different geographic locations. They would have been operating CfC-funded programs in the CfC locations, but the same organisations may have also been operating other similar programs and services in other locations, including the comparison sites. Although these comparison sites would not have benefited from the additional funding and service coordination of CfC, it is possible that agencies that were operating across multiple sites were learning from the lessons and practice improvement opportunities that CfC sites provided, and translated these into their service delivery in other locations. This was the explicit aim of the Communities and Families Clearinghouse Australia, which operated at the Australian Institute of Family Studies from 2008 to 2011, particularly through the publication of "promising practice profiles" developed from the CfC initiative and other elements of the Stronger Families and Communities Strategy (see <www.aifs.gov.au/cafca/topics>).
6.4 Evaluation of CfC
The findings in this report should be viewed in the light of the findings of the earlier evaluation of CfC (Muir et al., 2009). The evaluation of CfC was part of the larger evaluation of the then Stronger Families and Communities Strategy 2004-09. The evaluation findings are based on a range of sources and methodologies. These include:
- an outcome indicators framework - analysis of secondary data for evidence of community-level changes across 77 indicators;
- community profiles of the then 45 CfC sites;
- service mapping in all 45 CfC sites in 2006 and 2007;
- a service coordination study, which surveyed agencies in 41 CfC sites - with 442 respondents in 2006 and 302 in 2008 - and 222 interviews with key personnel conducted in the 10 SFIA sites in 2006 and 2007;
- a partnership model study, also based on 222 interviews and the service coordination survey;
- costs and effects analysis; and
- dissemination of key messages and promising practices learned along the way by service providers.
In summary, the evaluation found that CfC had been successful in expanding the number and reach of early years services in CfC communities and had been particularly successful in coordinating early years services in their communities and increasing inter-agency collaboration. CfC appeared to be particularly successful at engaging "hard-to-reach" families, such as those from Aboriginal and Torres Strait Islander backgrounds, families with alcohol problems and families of children with disabilities (Cortis, Katz, & Patulny, 2009). The place-based model of the program was seen to be particularly significant in facilitating the involvement of different agencies to address the needs of disadvantaged children and families. CfC was most effective when it deployed a community development approach, and particularly created "soft entry points" (i.e., locations or situations where families could engage with services in a non-stigmatised and non-threatening environment) or outreach approaches, which encouraged the participation of families who would normally not access formal services such as parenting classes or counselling services. In addition, the role of the Facilitating Partner agency was essential to the development and implementation of CfC, especially in those areas where the agency had some local knowledge and also the capacity to manage and administer a complex initiative such as CfC. Overall, the evaluation found that all five core elements of CfC (increased funding for NGOs, a focus on the early years, the Facilitating Partner model, a place-based approach and local service coordination) were important in the success of the program.
The earlier evaluation did find, however, that there were some significant challenges in the CfC model. These included the short-term nature of the funding and the lack of involvement of statewide services such as education and health. Many of these issues were addressed in the policy changes following the publication of the evaluation, described in Chapter 1 of this report.
6.5 Caveats for translating evaluation findings into policy
Before commenting on the implications of the findings for policy development, it is important to note some of the limitations of the evaluation that affect both the earlier report (Edwards et al., 2009), and the current report. These limitations include:
- Because of the relatively small number of survey participants in each of the CfC and contrast sites, it was not possible to undertake a site-by-site analysis of outcomes. This means that we were not able to relate the outcomes for children in a particular site with the characteristics of the CfC in that site. For example, it was not possible to examine whether children's outcomes were better in sites where services were working more collaboratively or where outreach was more effective, and it was also not possible to say whether children's health (for example) had improved more in sites that had focused on health.
- SFIA sites were not randomly chosen from CfC sites (although they are broadly representative of the range of CfC sites outside of remote communities).
- The nature of SFIA (and the logic model of CfC) meant that the evaluation was not able to link outcomes with "exposure" to CfC-funded services. Children and primary carers in the SFIA cohort are a random sample of the population in the CfC community. It is not known whether these families have had contact with CfC services and, if so, how much contact they have had.
- The evaluation did not compare CfC (as it then was) with other models of service delivery. The contrast sites were similar areas to CfC communities that did not receive CfC funding. CfC was therefore not compared to other models such as direct funding of non-government organisations, programs that are not area-based, programs funded from other sources (e.g., state/territory budgets, or philanthropy), or interventions that are not specifically aimed at children in their early years and their parents.
- This earlier report was carried out between 2006 and 2008 as part of the National Evaluation of the Stronger Families and Communities Strategy, with additional waves of data collected in 2011 and 2012. We have no knowledge of how CfC sites have progressed since then. We also do not know what interventions have been funded in the comparison sites, either during the period of the earlier evaluation report or subsequently.
- Finally, it is important to note that the outcomes we measure point to aspects of parenting and child development that are difficult to measure accurately. We have used well-validated measures, but there is always error in measurements that can affect the efficacy of any statistical analysis.
Because of these limitations, caution should be exercised in translating the findings from the SFIA study directly towards policy development. Nevertheless these findings have significant implications for policy and do provide some important indications for policy initiatives to support vulnerable children and families.
6.6 Implications
This section will discuss the implications of the findings from the first five waves of the SFIA study for policy and practice in relation to early intervention in vulnerable families and communities. As we have seen from the discussions above, the findings from SFIA are rather complex, and need to be carefully interpreted.
6.6.1 Summary of findings
In summary, the five waves of the SFIA study found that families in CfC sites appeared to benefit from CfC in a number of different areas, particularly in relation to parenting behaviours. However, very few of the effects of CfC persisted over the five waves of SFIA and CfC had not (or had not yet) had a strong enough effect to translate the positives into differences in children's developmental outcomes between CfC sites and comparison sites. This could have been for a number of reasons. One potential explanation, which cannot be discounted, is that the failure to find significant differences in child developmental outcomes lies in the limitations of the design of SFIA itself, as discussed earlier. However, the analysis of NAPLAN results mirrored that of SFIA, and this gives us more confidence that the SFIA findings are robust. Other explanations for the failure to detect an effect of CfC on children's outcomes include:
- improvements in service delivery in comparison sites may have allowed them to "catch up" with CfC;
- the universal primary schooling system in Australia helps to equalise differences by providing help to children who need it and also the opportunity for parents to work and volunteer (and importantly, SFIA does not contain information about the quality of schools in CfC and comparison sites); and
- many early interventions, including a number of area-based programs such as CfC, have tended to produce similar findings: modest outcomes for a few years followed by a "fading out" of improvements over time, at which point comparison sites "catch up". (It should be noted that very few outcome studies track changes over six years as was the case with SFIA, so most of these do not show effects over this period of time.)
6.6.2 What are the advantages of area-based initiatives?
SFIA does not provide any direct evidence of the potential effect of area-based initiatives as opposed to those that are individually targeted, as it did not compare area-based initiatives with those that are not area-based. Nevertheless, the earlier evaluation report on Waves 1-3 of SFIA found that there were clear advantages of a place-based approach in the early years where, when it was implemented, there had been significant service gaps and few mechanisms to coordinate early years services. The advantages for older age groups of children are less clear.
6.6.3 Would a more targeted/evidence-based approach produce better outcomes?
SFIA did not compare community-level outcomes for CfC with targeted services, so we cannot answer this question directly. Research outlined in Chapter 1 does indicate that some evidence-based interventions can have a significant and lasting effect on outcomes. However, these effects apply to people who actually receive a service, not for the population of the community as a whole. Results are also likely to vary depending on whether the service is a universal service, versus one targeted at those families most in need (e.g., evaluations of intensive home-based services show that targeting at-risk groups is more effective).12 To our knowledge, none of the targeted programs have followed up families in the general community, and certainly not for six years. These interventions tend to be much more expensive than CfC. The evaluation of CfC found that it was challenging to engage and retain the most hard-to-reach families in the communities, but that the area-based approach of CfC was effective in this respect (Muir et al., 2009). Thus, we would tentatively conclude that the most effective approach would be to provide evidence-based interventions within the context of a community-level coordinated intervention.
6.6.4 What are the implications of extending the age range of CfC from 0-5 years to 0-12 years?
There is little information from the current evaluation on how CfC affected services for 5-12 year olds. The kinds of services accessed by families with children in this age group are typically large institutional providers (schools, medical services, etc.) as opposed to the small playgroups, long-day-care facilities, and other local services that predominate in the early years. There is no information about whether the Facilitating Partner model was able to successfully engage schools, GPs and other statutory providers in the way in which it engaged early years providers in Phase 1 of CfC.
If school entry and school-based services overcame most of the deficits in the comparison group, then the implication would be that policy should focus more on improving school provision and school-based services than on services targeted at the early years. On the other hand, the analysis showed that primary carers reading to their children and volunteering and returning to the workforce early in their children's lives had more effect on children's later wellbeing than reading and volunteering when the children were older. On balance, therefore, the findings indicate that early years interventions may have some unique efficacy - particularly in relation to some outcome domains - relative to interventions when children are already at school.
The importance of schooling, and other services or programs for families of school-aged children is further confirmed by the fact that differences tended to fade out over time. If the provision of services to school-aged children in CfC had made a large and lasting difference, then we would have expected a greater divergence between CfC and comparison families over time as the benefits of the early interventions should have been sustained by services aimed at children in their middle years. It should also be remembered that the SFIA cohort would have benefitted from this change of policy more than subsequent cohorts of children in CfC communities in that they were exposed to intensive intervention in their early years, as well as the ongoing influence of CfC once they had reached age 5. With the expanded age range, subsequent cohorts of children will have fewer services, by comparison, in their early years.
6.7 Overall conclusion
The SFIA study provides a rare opportunity to evaluate an early intervention service system and its effects on children, families and communities over a relatively long period of time. Very few studies of early intervention services follow children for six years and provide the depth of information that SFIA has been able to deliver. In addition, the link with NAPLAN data provides further robustness and value to the design of the study.
Although it may be seen as disappointing that SFIA did not find statistically significant positive outcomes for children at ages 7 and 8, this should be considered in the context of many other early interventions that similarly failed to show that early effects are sustained over the longer term. Furthermore, over the course of the five waves of SFIA, the vast majority of findings indicated that the wellbeing of children and their primary carers in CfC communities was better than in comparison communities, even if these differences did not reach statistical significance. Thus, it can be concluded that CfC has had the desired effects on parents and children in the early years, but that these were not strong or sustained enough to make a statistically significant difference over the long term. It is not known whether a different model, a more intensive version of CfC, or an evidence-based suite of direct programs (such as Communities that Care; Hawkins et al., 2009) would have had a greater influence on outcomes.
12 In a review of parent education programs, Holzer, Higgins, Bromfield, Richardson and Higgins (2006) concluded that the key features of successful programs include targeted recruitment; having a structured program; using a combination of interventions/strategies; and adopting a strengths-based approach.
References
- Aneshensel, C. S., & Sucoff, C. A. (1996). The neighbourhood context of adolescent mental health. Journal of Health and Social Behaviour, 37, 293-310.
- Arulampalam, W., Gregg, P., & Gregory, M. (2001). Unemployment scarring. The Economic Journal, 111(475), 577-584.
- Australian Government. (2010). Social inclusion priorities. Canberra: Australian Government. Retrieved from <www.socialinclusion.gov.au/about/priorities>.
- Barrett, H. (2010). The delivery of parent skills training programmes: Meta-analytic studies and systematic reviews of what works best. London: Family & Parenting Institute. Retrieved from <www.ccinform.co.uk/research/the-delivery-of-parent-skills-training-programmes-meta-analytic-studies-and-systematic-reviews-of-what-works-best/>.
- Bloom, H. S. (2005). Learning more from social experiments: Evolving analytical approaches. New York: Russell Sage Foundations.
- Burdick-Will, J., Ludwig, J., Raudenbush, S. W., Sampson, R. J., Sanbonmatsu, L., & Sharkey, P. (2011). Converging evidence for neighborhood effects on children's test scores: An experimental, quasi-experimental and observational comparison. In G. J. Duncan & R. J. Murnane (Eds.), Whither opportunity? Rising inequality, schools, and children's life chances. New York: Russell Sage Foundation Press.
- Coelli, M. (2005). Parental income shocks and the education attendance of youth. Unpublished manuscript, Department of Economics, University of British Columbia.
- Cohen, J. (1988). Statistical power analysis for the behavioral sciences (2nd ed.). Hillsdale, NJ: Lawrence Earlbaum Associates.
- Cortis, N., Katz, I., & Patulny, R. (2009). Engaging hard-to-reach families and children (FaHCSIA Occasional Paper No. 26). Canberra: Department of Families, Housing, Community Services and Indigenous Affairs.
- Council of Australian Governments. (2009). Protecting children is everyone's business: The National Framework for Protecting Australia's Children 2009-2020. Canberra: Council of Australian Governments.
- Crane, J. (1991). The epidemic theory of ghettos and neighborhood effects on dropping out and teenage childbearing. American Journal of Sociology, 96, 1226-1259.
- Daraganova, G., & Sipthorp, M. (2011). Wave 4 weights (LSAC Technical Paper No. 9). Melbourne: Australian Institute of Family Studies.
- Department of Employment, Education and Workplace Relations.(2008). Welfare to Work evaluation report. Canberra: DEEWR.
- Department of Families, Housing, Community Services and Indigenous Affairs (2009). Family Support Program: Community and Family Partnerships (currently Children and Parenting Services) Guidelines, Version 1.2. Canberra: FaHCSIA.
- Edwards, B. (2005). Does it take a village? An investigation of neighbourhood effects on Australian children's development. Family Matters, 72, 36-43.
- Edwards, B. (2011). A longitudinal view of children living in disadvantaged neighbourhoods. In The Longitudinal Study of Australian Children annual statistical report 2010. Melbourne: Australian Institute of Family Studies.
- Edwards, B., & Baxter, J. (in press). A tyranny of distance or disadvantage? Children's development in regional and socio-economically disadvantaged areas of Australia. (LSAC Research Report No. 3). Melbourne: Australian Institute of Family Studies.
- Edwards, B., & Bromfield, L. M. (2009). Neighborhood influences on young children's conduct problems and pro-social behavior: Evidence from an Australian national sample. Children and Youth Services Review, 31, 317-324.
- Edwards, B., Gray, M., Wise, S., Hayes, A., Katz, I., Muir, K., & Patulny, R., (2011). Early impacts of Communities for Children on children and families: Findings from a quasi-experimental cohort study. Journal of Epidemiology and Community Health, 65(10), 909-914.
- Edwards, B., Wise, S., Gray, M., Hayes, A., Katz, I., Misson, S. et al. (2009). Stronger Families in Australia Study: The impact of Communities for Children (FaHCSIA Occasional Paper No. 25). Canberra: Department of Families, Housing, Community Services and Indigenous Affairs.
- Elder, G. H., & Conger, R. D. (2000). Children of the land: Adversity and success in rural America. Chicago: University of Chicago Press.
- Farrant, B. M. (2012). Joint attention and parent-child book reading: Keys to help close gaps in early language development, school readiness and academic achievement. Family Matters, 91, 38-46.
- Goodman, R. (1997). The Strengths and Difficulties Questionnaire: A research note. Journal of Child Psychology and Psychiatry, 38, 581-586.
- Gray, M., & Baxter, J. (2012). Family joblessness and child wellbeing in Australia. In A. Kalil, R. Haskins, & J. Chesters (Eds.), Investing in children: Work, education and social policy in two rich countries (pp. 48-78). Washington: The Brookings Institute.
- Harding, D. J. (2004). Counterfactual models of neighborhood effects: The effect of neighborhood poverty on dropping out and teenage pregnancy. American Journal of Sociology, 109, 676-719.
- Hawkins, J. D., Oesterle, S., Brown, E. C., Arthur, M. W., Abbott, R. D., Fagan, A. A., & Catalano, R. F. (2009). Results of a Type 2 translational research trial to prevent adolescent drug use and delinquency: A test of communities that care. Archives of Pediatric and Adolescent Medicine, 163(9), 789-798.
- Higgins, D. J. (2011). Protecting children: Evolving systems. Family Matters, 89, 5-10.
- Hill, C. J. , Bloom, H. S., Black, A. R., & Lipsey, M. W. (2007). Empirical benchmarks for interpreting effect sizes in research (MDRC Working Paper on Research Methodology). New York: MDRC.
- Holzer, P. J., Higgins, J., Bromfield, L. M., Richardson, N., & Higgins, D. J. (2006). The effectiveness of parent education and home visiting child maltreatment prevention programs (Child Abuse Prevention Issues No. 24). Melbourne: National Child Protection Clearinghouse. Retrieved from <www.aifs.gov.au/nch/pubs/issues/issues24/issues24.html>.
- Homel, R., Freiberg, K., Lamb, C., Leech, M., Hampshire, A., Hay, I. et al. (2006). The Pathways to Prevention Project: The first five years, 1999-2004 . Sydney: Griffith University and Mission Australia. Retrieved from <www.griffith.edu.au/__data/assets/pdf_file/0017/13382/pathways-final.pdf>.
- Hunter, B. (2003). Trends in neighbourhood inequality of Australian, Canadian and United States of America cities since the 1970s. Australian Economic History Review, 43(1), 22-44.
- Huttenlocher, J., Haight, W., Bryk, A., Seltzer, M., & Lyons, T. (1991). Early vocabulary growth: Relation to language input and gender. Developmental Psychology, 27(2), 236-248.
- Jelleyman, T., & Spencer, N. (2008). Residential mobility in childhood and health outcomes: A systematic review. Journal of Epidemiology and Community Health, 62(7), 584-592. doi:10.1136/jech.2007.060103
- Kalil, A., & Ziol-Guest, K. M. (2008). Parental employment circumstances and children's academic progress. Social Science Research, 37, 500-515.
- Kessler, R. C., Barker, P. R., Colpe, L. J., Epstein, J. F., Gfroerer, J. C., Hiripi, E. et al. (2003). Screening for serious mental illness in the general population. Archives of General Psychiatry, 60, 184-189.
- Leventhal, T., & Brooks-Gunn, J. (2000). The neighbourhoods they live in: The effects of neighbourhood residence on child and adolescent outcomes. Psychological Bulletin, 126(2), 309-337.
- Maguire, B., Edwards, B., & Soloff, C. (2012). Housing characteristics and changes across waves. In The Longitudinal Study of Australian Children annual statistical report 2011. Melbourne: Australian Institute of Family Studies.
- Morland, K., Wing, S., Diez-Roux, C., & Poole, C. (2002). Neighborhood characteristics associated with the location of food stores and food service places. American Journal of Preventive Medicine, 22, 23-29.
- Muir, K., Katz, I., Edwards, B., Gray, M., Wise, S., & Hayes, A. (2010). The national evaluation of the Communities for Children initiative. Family Matters, 84, 35-42.
- National Evaluation of Sure Start Team. (2005). Early impacts of Sure Start Local Programmes on children and families (Research Report 27). London: Department for Education and Skills. Retrieved from <www.ness.bbk.ac.uk/impact/documents/41.pdf>.
- National Evaluation of Sure Start Team. (2008). The impact of Sure Start Local Programmes on three year olds and their families (Research Report 13). London: Department for Education and Skills. Retrieved from <www.ness.bbk.ac.uk/impact/documents/1183.pdf>.
- National Evaluation of Sure Start Team. (2010). The impact of Sure Start Local Programmes on five year olds and their families (Research Report DFE-RR067). London: Department for Education. Retrieved from <www.ness.bbk.ac.uk/impact/documents/RR067.pdf>.
- National Evaluation of Sure Start Team. (2012). The impact of Sure Start Local Programmes on seven year olds and their families (Research Report DFE-RR220). Retrieved from <www.ness.bbk.ac.uk/impact/documents/DFE-RR220.pdf>.
- Olds, D. L., Henderson, C. R., Kitzman, H., Eckenrode, J. J., Cole, R. E., & Tatelbaum, R. C. (1999). Prenatal and infancy home visitation by nurses: recent findings. Future of Children, 9, 44-66.
- Paul, K. I., & Moser, K. (2009). Unemployment impairs mental health: Meta-analyses. Journal of Vocational Behavior, 74(3), 264-282. doi:10.1016/j.jvb.2009.01.001
- Quillian, L. (2003). How long are exposures to poor neighbourhoods? The long-term dynamics of entry and exit from poor neighbourhoods. Population Research and Policy Review, 22, 221-249.
- Sampson, R. J. (2012). Great American city: Chicago and the enduring neighborhood effect. Chicago: University of Chicago Press.
- Sampson, R.J., Raudenbush, S.W., & Earls, F. (1997). Neighborhoods and violent crime: A multilevel study of collective efficacy. Science, 277(5328), 918-924.
- Senechal, M., LeFevre, J. A., Hudson, E., & Lawson, E. P. (1996). Knowledge of storybooks as a predictor of young children's vocabulary. Journal of Educational Psychology, 88(3), 520-536.
- South, S. J., Crowder, K. D., & Trent, K. (1998). Children's residential mobility and neighbourhood environment following parental divorce and remarriage. Social Forces, 77(2), 667-693.
- Statistics Canada, & Human Resources Development Canada. (1995). National Longitudinal Survey of Children and Youth: Overview of survey instruments for 1994-95. Data collection cycle 1. Ottawa: Statistics Canada & Human Resources Development Canada.
- Taylor, M., & Edwards, B. (2012). The influence of unstable housing on children's wellbeing and development: Evidence from a national longitudinal study. Melbourne: Australian Institute of Family Studies.
- Varni, J. W., Burwinkle, T. M., Seid, M., & Skarr, D. (2003). The PedsQL 4.0 as a pediatric population health measure: Feasibility, reliability, and validity. Ambulatory Pediatrics, 3, 329-341.
- Winkleby, M., & Cubbin, C. (2003). Influence of individual and neighborhood socioeconomic status on mortality among black, Mexican-American, and white women and men in the United States. Journal of Epidemiology and Community Health, 57, 444-452.
- Wise, S., da Silva, L., Webster, E., & Sanson, A. (2005). The efficacy of early childhood interventions: A report prepared for the Australian Government Department of Family and Community Services (AIFS Research Report No. 14). Melbourne: Australian Institute of Family Studies.
Appendix: Stage 2 CfC Sites
Introduction
A further objective of SFIA Phase 2 was to investigate the initial, short-run effects of the Stage 2 CfC sites among the new cohort of study children and families. The Stage 2 CfC sites retain many similar features of CfC, with services in these sites working more closely to involve the Commonwealth, state/territory and local governments, as well as the non-government sector, to plan and deliver the required services within each community. A particular focus of Stage 2 CfC is to establish links with state/territory government child protection services, to address known parental risk factors in this area (e.g., family violence and mental health issues) (FaHCSIA, 2009).
These Stage 2 CfC sites also intend to link early childhood services with other Commonwealth services, including Family Relationship Centres, Centrelink and Job Services Australia. Stronger associations with maternal and early childhood nurses are also anticipated (FaHCSIA, 2009).
Stage 2 CfC sites were established in two different ways. Firstly, in 2009-10, four new CfC sites were established with this additional focus. In 2010, a further four CfC sites that had already been established received additional funding from the government to focus on working more closely on state/territory government child protection services. In seven of these eight sites, interviews were conducted with families of 2-3 and 7-8 year old children to investigate the initial, short-run effects of this new focus of CfC. For Wave 1 of SFIA Stage 2, interviews were conducted soon after implementation in 2011, with Wave 2 interviews conducted in 2012. Therefore, it is important to note that the results we report on are from the early implementation period of a community-based initiative. Given the early state of implementation and the smaller sample size, we did not report subgroup analyses for the lower and higher income and education subgroups.
This chapter provides an overview of some of the early results from this study. The next section outlines aspects of the methodology associated with this aspect of the study. Following that, the findings for parent-level outcomes are discussed, followed by the findings for child-level outcomes. The appendix concludes with a summary of the main findings.
Methodology
Stage 2 CfC site selection
The newly established Stage 2 CfC cohort consists of families from seven Stage 2 CfC sites, as well as four contrast sites that were selected so as to be socio-economically and geographically similar to the Stage 2 CfC sites. This process was similar to the process applied for the Stage 1 CfC cohort described in section 2.2. There was a Stage 2 CfC site included for each state/territory (two in NSW), but not in the Northern Territory, due to the unavailability of a suitable site. The four contrast sites were spread over NSW, Victoria, Tasmania and Queensland.
Three of the seven selected Stage 2 CfC sites were previously CfC sites (i.e., had been "upgraded" or "converted"), with two of these locations being among the 10 selected CfC sites in Phase 1. As a consequence, the study continued to follow the 7-8 year-olds from these two "upgraded" sites, and, unlike other sites, no new 7-8 year-olds were recruited. New 2-3 year-olds were recruited from all seven Stage 2 CfC and contrast sites, regardless of whether they were "upgraded" or not. Please note that the 7-8 year-olds from the two "upgraded" sites have been included as part of the Stage 1 CfC cohort, and thus, are not part of these analyses.
Stage 2 CfC cohort sample recruitment
In September/October 2011, DSS provided the Social Research Centre with the sampling units for the Stage 2 CfC cohort. The Stage 2 CfC cohort sample file provided details of families with a 2-3 year-old and/or a 7-8 year-old child who was living in a Stage 2 CfC or contrast site, as identified by postcode. All included families were receiving Family Tax Benefit (FTB) Part A or B, with the sample extracted from the FTB's administrative database.
The sample file for the seven Stage 2 CfC sites contained a list of 7,010 records. Records with missing telephone numbers (n = 120) were excluded from the sample. The remaining sample of 6,890 records were classified according to whether they included a 2-3 year-old study child, a 7-8 year-old study child, or both a 2-3 year-old and a 7-8 year-old study child (i.e., information could be obtained potentially for two study children in a single family). The same classification was used for the four contrast sites, with a total of 3,459 records available following missing telephone number exclusions.
A pilot study was conducted with the Stage 2 CfC cohort, to test the questionnaire for both 2-3 and 7-8 year-old study children, as well as when interviews for both ages were available within the one family. Following the conclusion of the pilot study, the main data collection periods for the Stage 2 CfC cohort were November 2011 to January 2012 (for Wave 1), and September 2012 to November 2012 (for Wave 2). Call procedures applied to the Stage 1 CfC cohort were applied to data collection for the Stage 2 CfC cohort.
Table A1 reports the number of interviews completed at Waves 1 and 2, along with the response rates. The overall response rate for the Stage 2 CfC cohort at Wave 1 was 55%, which was lower than for the initial Wave 1 response rate of 66% found for the Stage 1 CfC cohort. In addition, attrition at Wave 2 was more pronounced in the Stage 2 CfC cohort than the Stage 1 cohort at a comparable stage. However, the response rate was similar to the response rate for the latest wave of the Stage 1 CfC cohort (Wave 5).
| Stage 2 cohort | Total sample (n) | Total interviews (n) | Response rate (%) |
|---|---|---|---|
| Wave 1, 2011 | 3,323 | 1,824 | 54.9 |
| Wave 2, 2012 | 1,824 | 1,456 | 79.8 |
Attrition in the Stage 2 CfC cohort
We followed a similar procedure described in section 2.6.2 to analyse attrition in the Stage 2 CfC sites, conducting separate analyses for the younger and older cohorts as different factors may affect responses for parents with younger and older children. Results from logistic regressions (reported in Table A2) show that, as with the Stage 1 CfC cohort, attrition was not significantly associated with living in a CfC site compared with a comparison site. However, attrition was significantly associated with a number of factors. As with the Stage 1 CfC cohort, older primary carers and primary carers with a Year 12 certificate were less likely to drop out of the study and this applied across both the younger and older cohorts.
Unlike the Stage 1 CfC cohort, attrition was not significantly associated with primary carer employment status, the Indigenous status of the child or whether or not a primary carer was born overseas. Lower household income was significantly associated with attrition in the older cohort but not in the younger cohort. In the younger cohort, families where the secondary parent was not in paid work and lone-parent families were more likely to drop out from the sample. This was not the case in the older cohort.
| Younger cohort (youngest child 0-3 years) | Older cohort (youngest child 4+ years) | |
|---|---|---|
| CfC site | 0.8 | 1.17 |
| Child is Aboriginal or Torres Strait Islander | 1.08 | 1.00 |
| Primary carer older age | 0.97 ** | 0.97 * |
| Primary carer completed Year 12 | 0.74 * | 0.53 *** |
| Primary carer employed | 1.00 | 1.12 |
| Father present not working | 1.78 ** | 0.9 |
| Father not present | 1.89 *** | 1.11 |
| Primary carer born overseas | 0.87 | 0.85 |
| Household income | 1.00 | 1.00 * |
| No. of observations | 1,140 | 668 |
Notes: Odds ratios < 1.0 reflect a negative association, odd ratios > 1.0 reflect a positive association, odds ratios ? 1.0 reflect no association. The reference is a non-employed parent in a couple living in a contrast site, who was born in Australia, and has not completed Year 12. The reference study child is a non-Indigenous boy. *** p < .001; ** p < .01; * p < .05.
To test whether the association between sample attrition and any of these factors differed for families in Stage 2 CfC and contrast sites, we estimated models including interactions between each of these variables and a variable indicating those families that live in a Stage 2 CfC site (results not shown). The main effect indicating the family was in a Stage 2 CfC site was still not statistically significant and none of the interaction terms were statistically significant. However, the main effects in the younger cohort relating to whether or not the parent who was not the primary carer (usually the father) was employed, or the presence of father was no longer statistically significant. Therefore, although the interaction terms were not statistically significant, the inclusion of the interactions substantively altered the main effects, suggesting that there may be some selective attrition. Exploring this further, we estimated separate models for families in Stage 2 CfC and comparison sites in the younger cohort. Results (not shown) reveal that the effects relating to these factors were statistically significant for Stage 2 CfC sites only, and that these factors were not significantly associated with attrition in comparison sites. As with the main (Stage 1) cohort, it is important to control for these factors to guard against bias in the results arising from attrition.
Analysis plan
The approach to the analysis in this chapter mirrors that set out in detail in section 2.7. As noted above, in some instances there were two study children in one family (a younger study child aged 2-4 years and an older study child aged 7-9 years). For the child-level outcomes, it was important to analyse study children of different ages separately, while this was largely unnecessary for parent-level outcomes (i.e., outcomes for the primary carer). Therefore, we partitioned the analysis into parent-level and child-level outcomes. When looking at primary carer employment indicators, we divided primary carers into two groups based on the age of the youngest child in the family. We did this because age of the youngest child is a key factor related to primary carers' employment and we sought to highlight potential differences in families with younger and older children.
As with the main CfC evaluation, we conducted descriptive analyses along with multivariate cross-sectional regression analyses and difference-in-difference analyses (see section 2.7 for more details). Together, these varied analyses allowed us to identify points in time where families in CfC and comparison groups differed, and assess the extent to which rates or patterns of change varied between comparison and Stage 2 CfC sites.
Parent-level outcomes
Primary carer employment
Figure A1 shows the proportion of employed primary carers (usually mothers) with a youngest child 0-4 years and 5 years and over (panels 1 and 2) and the other parent (usually fathers) with a youngest child 0-4 years and 5 years and over (panels 3 and 4), in comparison and Stage 2 CfC sites at Waves 1 and 2 of the study.
Figure A1: Percentage of primary carers and other parent employed at Waves 1 and 2 with youngest children 0–4 years and 5 years and over, comparison and CfC sites

Primary carers with a youngest child 0-4 years in comparison and Stage 2 CfC sites had very similar engagement in paid employment (42% and 38% respectively) and this increased modestly for both groups to around 45% for both groups at Wave 2. The pattern is somewhat different for primary carers whose youngest child is 5 years and over. At Wave 1 there was a significant difference in employment, with around 55% of primary carers in Stage 2 CfC sites in paid employment compared with about 64% of primary carers in comparison sites. By Wave 2, however, engagement in employment was equal, at 62% for primary carers in both comparison and Stage 2 CfC sites.
Employment for the other parent with a youngest child aged 0-4 years was very similar between comparison and Stage 2 CfC sites at Wave 1. However, at Wave 2, a higher proportion were employed in comparison sites (around 88%) compared with those in Stage 2 CfC sites (83%), though this was only marginally significant (p < .08). Among those with older children (5+ years), engagement in employment at Wave 1 was lower in Stage 2 CfC sites (79%) than in comparison group sites (86%), but this was not significant. A marginally significant difference emerged at Wave 2, however, and around 77% of the other parent in Stage 2 CfC sites were employed compared with around 86% of those in CfC sites (p < .08).
Difference-in-difference results
The difference-in-difference models confirm that there was a significant difference in the rates of change in employment at Wave 2 compared with Wave 1 between primary carers with older children (5 + years) in comparison and Stage 2 CfC sites. As shown in Figure A1, this result reflects a situation where primary carers in Stage 2 CfC sites "caught up" with primary carers in comparison sites. This result is consistent with a pattern associated with regression to the mean (i.e., starting from a relatively low position, the only way for primary carers in Stage 2 CfC sites to progress was upward). So by Wave 2, the employment rates of primary carers in comparison and Stage 2 CfC sites were similar; however, without further information about the employment rates of these primary carers in ensuing years, it is difficult to draw firm conclusions from this result.
Another significant finding from the difference-in-difference model related to the other parents' employment in families with young children 0-4 years. This model confirmed that there was a significant difference in the rates of change in employment at Wave 2 compared with Wave 1 between those in comparison and Stage 2 CfC sites. Specially, that the other parents' employment in comparison sites increased at a significantly greater rate than those in CfC sites. It is worth noting that their employment in Stage 2 CfC sites was relatively unchanged over the period (decreasing by around less than 1%). Again, over a relatively short period, it is difficult to draw firm conclusions about this result.
Community cohesion and safety
This section considers primary carers' perceptions about the level of cohesion in their community and the level of safety in their community. Table A3 shows the average scores on the community cohesion and community safety scores. Recall that both these measures range from a low of 1 to a high of 5. There was very little change between Waves 1 and 2 in the average scores on both these measures and there were no significant differences between comparison and Stage 2 CfC sites at either wave.
| Community cohesion | Community safety | |||
|---|---|---|---|---|
| Comparison sites | CfC sites | Comparison sites | CfC sites | |
| Wave 1 | 3.37 | 3.37 | 3.62 | 3.57 |
| Wave 2 | 3.43 | 3.38 | 3.64 | 3.63 |
Notes: Significant differences are derived from cross-sectional regressions adjusted for child gender and Indigenous status, primary carer age and education, cultural background, father involvement and family income. *** p < .001; ** p < .01; * p < .05; + p < .08.
Difference-in-difference results
Difference-in-difference analysis provides insights as to whether there are significant differences in rates of change over time between comparison and Stage 2 CfC sites. Results (not reported in a table) show that over the whole sample, there was no significant difference in rates of change over time at Wave 2 compared with Wave 1 on these measures between comparison and Stage 2 CfC sites.
Primary carers' health, relationships and community involvement
The remaining primary carers' outcomes relate to their physical and mental health, their relationship with their partner, and their engagement in volunteering in the community (details of these measures are given in section 2.5). Table A4 reports the proportion of primary carers who reported volunteering in their community, those who reported good/excellent health, and their average scores on the mental health problem scale and the argumentative relationship scale in comparison and Stage 2 CfC sites at Waves 1 and 2. Across the entire sample of primary carers, there was no significant difference in any of these outcomes between comparison and Stage 2 CfC sites at either wave. Moreover, difference-in-difference analyses revealed that there was no significant difference between primary carers in comparison and Stage 2 CfC sites in the rates of change at Wave 2 compared with Wave 1 on any of these outcomes.
| Wave 1 | Wave 2 | ||
|---|---|---|---|
| Involved in the community (%) | Comparison sites | 33.2 | 35.3 |
| CfC sites | 34.9 | 34.9 | |
| Good/excellent health (%) | Comparison sites | 60.5 | 60.7 |
| CfC sites | 61.5 | 60.1 | |
| Average mental health problem score | Comparison sites | 1.62 | 1.57 |
| CfC sites | 1.58 | 1.55 | |
| Average argumentative relationship score | Comparison sites | 1.90 | 1.86 |
| CfC sites | 1.91 | 1.90 |
Notes: Significant differences between comparison and CfC sites at each wave are derived from cross-sectional regressions adjusted for child gender and Indigenous status, primary carer age and education, cultural background, father involvement and family income. *** p < .001; ** p < .01; * p < .05; + p < .08.
Child-level outcomes
As outlined earlier, we followed a younger and an older cohort of children who were aged 2-4 and 7-9 years respectively at Wave 1 of Phase 2 of SFIA. Given the age difference between the two cohorts of children, we report on child-focused outcomes separately in this section. Table A5 provides descriptive statistics (means or percentages as appropriate) for each outcome for families in Stage 2 CfC and comparison sites for each cohort.
Within each wave, there were no significant differences between children in comparison and Stage 2 CfC sites in either cohort on any of these outcomes. The proportion of children with a primary carer who self-reported as being a highly effective parent in Wave 1 was higher in comparison sites (76%) than in Stage 2 CfC sites (70%), and this difference was marginally significant (p < .08). This aside, all other differences between comparison and Stage 2 CfC sites at each wave were not statistically significant.
Between Waves 1 and 2, there were some differences within each cohort. Among study children aged 2-4 years (younger cohort), there was a significant reduction in the proportion of primary carers who self-reported as being highly effective parents (p < .05). There was also a significant reduction in the proportion of primary carers who reported often engaging in music and singing, or games and exercise with the child (p < .05). Finally, there was a significant decrease between Waves 1 and 2 in the proportion of primary carers who reported unmet service needs.
Between Waves 1 and 2, among study children 7-9 years (older cohort), there was also a significant reduction in the proportion of primary carers who self-reported as being highly effective parents (p < .05). In addition, there was a significant decrease in the proportion of primary carers who reported often reading with children (p < .05). Lastly, there was a significant reduction in hostile parenting in the older cohort between Waves 1 and 2 (p < .05).
Difference-in-difference analysis was conducted to assess whether there were differences in the rates or patterns of change over time between comparison and Stage 2 CfC sites. This analysis allows us to answer questions such as, was there a larger decrease in hostile parenting in Stage 2 CfC sites than in comparison sites, which would lend support to a significant program effect. The results from the difference-in-difference analyses reveal that there were no significant differences between comparison and Stage 2 CfC sites in the rates or patterns of change between Waves 1 and 2 on any of these child-level outcomes.
| Study child 2-4 years (Younger cohort) | Study child 7-9 years (Older cohort) | ||||
|---|---|---|---|---|---|
| Wave 1 | Wave 2 | Wave 1 | Wave 2 | ||
| Child health | |||||
| Injured 2 or more times (%) | Comparison sites | 16.8 | 15.7 | 17.5 | 15.5 |
| CfC sites | 17.5 | 14.2 | 16.9 | 13.2 | |
| Average child physical health score | Comparison sites | 93.8 | 94.1 | 91.0 | 91.6 |
| CfC sites | 93.0 | 93.0 | 90.3 | 91.7 | |
| Average SDQ problem score | Comparison sites | - | - | 8.8 | 9.1 |
| CfC sites | - | - | 8.7 | 8.5 | |
| Average SDQ prosocial score | Comparison sites | - | - | 8.4 | 8.5 |
| CfC sites | - | - | 8.5 | 8.5 | |
| Parenting | |||||
| High parenting self-efficacy (%) | Comparison sites | 75.9 | 69.9 | 69.4 | 63.2 |
| CfC sites | 70.3 | 64.6 | 65.3 | 63.3 | |
| Average warm parenting score | Comparison sites | 4.8 | 4.8 | 4.6 | 4.6 |
| CfC sites | 4.8 | 4.7 | 4.6 | 4.6 | |
| Average hostile parenting score | Comparison sites | 2.9 | 2.8 | 3.2 | 3.0 |
| CfC sites | 2.9 | 2.9 | 3.1 | 2.9 | |
| Early learning | |||||
| Reading (%) | Comparison sites | 53.9 | 57.3 | 38.8 | 31.3 |
| CfC sites | 57.0 | 55.0 | 35.2 | 25.5 | |
| Arts (%) | Comparison sites | 32.5 | 33.6 | 15.1 | 12.7 |
| CfC sites | 30.8 | 29.9 | 13.8 | 11.5 | |
| Music and singing (%) | Comparison sites | 57.3 | 48.6 | 32.7 | 30.9 |
| CfC sites | 56.4 | 46.8 | 34.7 | 34.1 | |
| Games and exercise (%) | Comparison sites | 51.4 | 39.5 | 26.1 | 26.5 |
| CfC sites | 48.1 | 40.9 | 26.4 | 24.6 | |
| Child-friendly communities | |||||
| Unmet service needs (%) | Comparison sites | 8.0 | 3.9 | 10.7 | 7.9 |
| CfC sites | 7.5 | 6.5 | 14.3 | 9.2 | |
Notes: Significant differences between comparison and CfC sites at each wave are derived from cross-sectional regressions adjusted for child gender and Indigenous status, primary carer age and education, cultural background, father involvement and family income. *** p < .001; ** p < .01; * p < .05; + p < .08.
Summary
Overall, there are not many significant results from the Stage 2 CfC sites at this point. It is important to note that the time interval between waves is very small. It is comparable with the time interval between Waves 1 and 2 for the CfC cohort in the SFIA Phase 1 study, and the Wave 2 data are not considered explicitly in the analysis of the Phase 1 evaluation (nor in the Phase 2 analysis). This notwithstanding, there are some initial results relating to primary carers' employment that seem promising. seem promising.
List of tables
- Table 2.1: Outcome measures used in Phase 2 of CfC evaluation and direction of positive effects for CfC
- Table 2.2: Total sample size, interviews and response rates across five waves of data collection for the CfC cohort
- Table 2.3: Factors associated with dropout from the CfC cohort sample at Waves 4 and 5, odds ratios
- Table 3.1: Proportion of families with higher and lower household incomes, by whether primary carer has higher or lower education level
- Table 3.2: Percentage of jobless families at Waves 1, 3, 4 & 5, comparison and CfC sites
- Table 3.3: Percentage change in the odds of being a jobless family at Waves 3, 4 & 5 compared with Wave 1, comparison and CfC sites
- Table 3.4: Percentage change in the odds of being a jobless family at Waves 3, 4 & 5 compared with Wave 1, by lower income and education subgroups, comparison and CfC sites
- Table 3.5: Proportion of primary carers with high levels of health at Waves 1, 3, 4 & 5, comparison and CfC sites
- Table 3.6: Percentage change in the odds of primary carers with lower levels of education reporting good health at Waves 3, 4 & 5 compared with Wave 1, comparison and CfC sites
- Table 3.7: Average primary carer mental health and argumentative relationship scores at Waves 1, 3, 4 & 5, comparison and CfC sites
- Table 3.8: Difference-in-difference coefficients for mental health scores at Waves 3, 4 & 5, by level of income and education
- Table 3.9: Proportion of primary carers who self-reported as highly effective parents at Waves 1, 3, 4 & 5, comparison and CfC sites
- Table 3.10: Average primary carer scores on warm and hostile parenting scales at Waves 1, 3, 4 & 5, comparison and CfC sites
- Table 3.11: Proportion of primary carers often sharing activities with study children at Waves 1, 3, 4 & 5, comparison and CfC sites
- Table 3.12: Percentage change in the odds of primary carers often reading with the study child at Waves 3, 4 & 5 compared with Wave 1, subgroups with higher levels of income and education, comparison and CfC sites
- Table 3.13: Percentage change in the odds of primary carers engaging in music and singing with study children at Waves 3, 4 & 5 compared with Wave 1, by level of income and education, comparison and CfC sites
- Table 3.14: Proportion of children injured two or more times in the previous 12 months at Waves 1, 3, 4 & 5, comparison and CfC sites
- Table 3.15: Children's average PedsQL physical health scores at Waves 1, 3, 4 & 5, comparison and CfC sites
- Table 3.16: Children's average SDQ problem and prosocial scores at Waves 3, 4 & 5, comparison and CfC sites
- Table 3.17: Average community social cohesion and neighbourhood safety scores at Waves 1, 3, 4 & 5, comparison and CfC sites
- Table 3.18: Difference-in-difference coefficients from models of community cohesion and neighbourhood safety at Waves 3, 4 & 5 compared to Wave 1, lower income subgroup
- Table 3.19: Proportion of primary carers who reported volunteering at Waves 1, 3, 4 & 5, comparison and CfC sites
- Table 3.20: Percentage change in odds of primary carers volunteering at Waves 3, 4, and 5 compared with Wave 1, comparison and CfC sites
- Table 3.21: Percentage change in odds of primary carers' volunteering at Waves 3, 4 & 5 compared with Wave 1, comparison and CfC sites lower educated subgroup
- Table 3.22: Proportion of primary carers who reported unmet service needs at Waves 1, 3, 4 & 5, comparison and CfC sites
- Table 3.23: Summary of statically significant outcomes from the difference-in-difference models, by level of income and education
- Table 4.1: Odds ratios from logistic regression models of residential mobility from the previous wave, Waves 3, 4 & 5
- Table 5.1: Effect on NAPLAN scores of primary carers reading often with children 3-5 years, comparison and CfC sites, standardised regression coefficients
- Table 5.2: Effect on NAPLAN scores of primary carers reading often with children 3-5 years and/or 8-10 years, comparison and CfC sites, standardised regression coefficients
- Table 5.3: Effect on NAPLAN scores of family joblessness, unadjusted and adjusted for literacy skills at 3-5 years, comparison and CfC sites, standardised regression coefficients
- Table 5.4: Average SDQ problem and prosocial scores and being read with often when aged 3-5 years, by age of child, comparison and CfC sites
- Table 5.5: Effect on SDQ problem and prosocial scores of primary carers reading often with children 3-5 years and/or 8-10 years, comparison and CfC sites, standardised regression coefficients
- Table 5.6: Effect on SDQ problem and prosocial scores of joblessness, comparison and CfC sites, standardised regression coefficients
- Table 5.7: Effect on SDQ problem and prosocial scores of community involvement, comparison and CfC sites, standardised regression coefficients
List of figures
- Figure 2.1: Stronger Families in Australia study design
- Figure 3.1: Proportion of jobless families at Waves 1, 3, 4 & 5, by level of income and education, comparison and CfC sites
- Figure 3.2: Proportion of primary carers reporting good health at Waves 1, 3, 4 & 5, by level of income and education, comparison and CfC sites
- Figure 3.3: Average scores on the mental health and argumentative relationship scales at Waves 1, 3, 4 & 5, by level of income and education, comparison and CfC sites
- Figure 3.4: Proportion of primary carers who self-reported as highly effective parents across Waves 1, 3, 4 & 5, by level of income and education, comparison and CfC sites
- Figure 3.5: Average parental warmth and hostility across Waves 1, 3, 4 & 5, by level of income and education, comparison and CfC sites
- Figure 3.6: Proportion of primary carers who reported often reading, engaging in arts, music, or games with children at Waves 1, 3, 4 & 5, by level of income and education, comparison and CfC sites
- Figure 3.7: Children's average SDQ problem and prosocial scores at Waves 3, 4 & 5, by level of income and education, comparison and CfC sites
- Figure 3.8: Average community cohesion and neighbourhood safety scores at Waves 1, 3, 4 & 5, by level of income and education, comparison and CfC sites
- Figure 3.9: Proportion of primary carers who reported volunteering at Waves 1, 3, 4 & 5, by level of income and education, comparison and CfC sites
- Figure 4.1: Proportion of families who stayed in or moved out of their residence from the previous wave, Waves 3, 4 & 5, comparison and CfC sites
- Figure 4.2: Proportion of families who stayed in or moved out of their residence from Waves 3 to 4 to 5, comparison and CfC sites
- Figure 4.3: Proportions of families moving out of and into CfC sites at Waves 3, 4 & 5
- Figure 4.4: Predicted probability of not moving, moving within/between CfC site and moving to non-CfC site between Waves 1-3, 3-4 and 4-5, by whether families had a father present or partnership change
- Figure 5.1: Average Year 3 NAPLAN scores, comparison sites, CfC sites, all sites and tri-state sites
- Figure 5.2: Average Year 3 NAPLAN scores, by whether primary carer read often with children when aged 3-5 years, comparison and CfC sites
- Figure 5.3: Average Year 3 NAPLAN scores, by whether primary carers read often with children when aged 3-5 years and/or 8-9 years, comparison and CfC sites
- Figure 5.4: Average Year 3 NAPLAN scores, by family joblessness at Waves 1 and 3, comparison and CfC sites
- Figure 5.5: Average Year 3 NAPLAN scores, by primary carers' community involvement and age of study child, comparison and CfC sites
- Figure 5.6: Average SDQ problem and prosocial scores at 8-9 and 9-10 years, by whether study child was read with often at 3-5 and 8-10 years, comparison and CfC sites
- Figure 5.7: Average SDQ problem and prosocial scores and patterns of family joblessness, by age of children, CfC and comparison sites
- Figure 5.8: Average SDQ problem and prosocial scores and patterns of volunteering in the community, children 3-5 years, comparison and CfC sites
- Figure A1: Percentage of primary carers and other parent employed at Waves 1 and 2 with youngest children 0-4 years and 5 years and over, comparison and CfC sites
Ben Edwards was a Senior Research Fellow (Executive Manager, Longitudinal Studies) and Daryl Higgins was Deputy Director (Research) at the Australian Institute of Family Studies at the time of writing. Ilan Katz is a Professor in the Social Policy Research Centre, University of New South Wales. At the time of writing, Killian Mullan was a Research Fellow at the Australian Institute of Family Studies and is now based at the London School of Economics.
The authors would like to acknowledge and thank the families who generously gave their time to participate in Phase 2 of the Stronger Families in Australia (SFIA) study. We acknowledge the contribution of Mark Sipthorp, for his role in the SFIA data management, and of Professor Alan Hayes AM, AIFS Director, for his valuable feedback and direction throughout the life of the study and the Phase 2 analysis.
This report makes some use of data from Growing Up in Australia: The Longitudinal Study of Australian Children (LSAC). LSAC is conducted in partnership between the Department of Social Services (DSS), the Australian Institute of Family Studies (AIFS) and the Australian Bureau of Statistics (ABS), with advice provided by a consortium of leading researchers. Findings and views expressed in this publication are those of individual authors and may not reflect those of the AIFS, DSS, or the ABS.
Edwards, B., Mullan, K., Katz, I., & Higgins, D. J. (2014). The Stronger Families in Australia (SFIA) Study: Phase 2 (Research Report No. 29). Melbourne: Australian Institute of Family Studies.
978-1-922038-62-3
2 September 2014