Constructing family households with administrative data
An Australian example
Abbreviations/acronyms
| ABS | Australian Bureau of Statistics |
| AIFS | Australian Institute of Family Studies |
| ARID | Anonymised Address Register ID |
| DOMINO | Data Over Multiple Individual Occurrences |
| DSS | Department of Social Services |
| MADIP | Multi Agency Data Integration Project |
| PLIDA | Person Level Integrated Data Asset |
Acknowledgements
This report draws on research completed with funding from the Australian Public Service Commission through the 2023–24 APS Capability Reinvestment Fund. The project team comprised representatives from the Australian Bureau of Statistics, the Australian Government Department of Social Services, Deakin University and Monash University. We are grateful for the contributions of all team members in the development of the project and, in particular, the development of programming code and documentation aimed to improve the utility of the Person Level Integrated Data Asset (PLIDA).
Views expressed in this publication are those of individual authors and may not reflect those of the Australian Government or the Australian Institute of Family Studies (AIFS).
Overview
This report provides an overview of the steps and outcomes of deriving a classification of family households and applying it to a relationship dataset created in the Person Level Integrated Data Asset (PLIDA).
The created relationship dataset drew on information from DOMINO (data on recipients of Department of Social Services (DSS) payments, benefits and concessions) and on Australian Bureau of Statistics (ABS) created datasets of individual’s demographics and location. The project included the development of logic (and associated programming code) that could be applied to family-household data, created from the administrative data, to create a family household classification. For this work, using the relationship dataset, we created a variable called ‘DOMINO Family’, which was the derived family classification at the time of the 2021 Census (10 August 2021). In establishing whether relationships existed at the time of the Census we required that the related people had to be living at the same address, as indicated by the linked address information. We compared this variable to a family classification from the Census data.
We have aimed for transparency in this work, identifying the limitations of the administrative data and how we attempted to work with data gaps. Some of the data gaps were significant ones, although there remained a large part of the population for whom the administrative data classification was consistent with the Census. There were typically greater gaps for families that did not include someone receiving a payment, benefit or concession from DSS at the time of the Census, although the concordance between our variable and the Census classification varied according to the payment received. This work relied on being able to link people across datasets to confirm co-residence. Where that was not possible, it created further gaps in knowledge about relationships within families. The resulting classification from the administrative data was weakest in respect to misclassifying a large number of couple-parent families as one-parent families because data on the couple relationship was missing from the final dataset.
The work summarised here should be seen as a starting point; a foundation that may help researchers undertake social policy analysis at the family and household level; and to help inform more robust longitudinal identification of families and households in administrative data in the future.
Introduction
Research overview
In 2023–24 the Australian Institute of Family Studies (AIFS) led a project to improve the accessibility and usefulness of administrative datasets in the Person Level Integrated Data Asset (PLIDA).1 Project partners were the Australian Bureau of Statistics (ABS) and the Department of Social Services (DSS), with input from academic partners. PLIDA is a popular data repository for researchers as it holds linkable person-level administrative data from multiple agencies in one place covering health, education, employment, government payments, income and taxation and demographics (Productivity Commission, 2024). A core focus of this work was to develop an approach to derive family units from person-level administrative data in PLIDA for use by policy makers and researchers. This report documents the outcome of that work.
The context for this work is the growing reliance on administrative data for reporting and research. Administrative data are information that government agencies collect and hold for registration, program administration and record keeping. Governments around the world are increasingly using administrative data to compile official statistics (Global Partnership for Sustainable Development Data, 2020). Using this type of data for research and official statistics reduces the cost and response burden associated with collecting new data via surveys. However, administrative data may be difficult to use given that systems designed for their collection are not typically designed for the purpose of delivering statistics and supporting research (Productivity Commission, 2013). Databases that include administrative data are becoming more accessible to researchers and policy makers, including through PLIDA, but these data are rarely available at the family level, limiting the potential for these data to explore issues that have a family dimension.
This report documents the approach taken in this project to derive family units and presents some of the challenges and limitations of this work. We are aware that many Australian researchers have derived family units from administrative data, including using PLIDA. However, the creation of family-level data is typically a means to an end and is usually not fully documented when reporting on research findings. An intended aim of this report is to provide documentation of our approach to this, acknowledging that it had its own limitations, and acknowledging it is not the only way that families can be derived from administrative data.
A brief literature review revealed that researchers in New Zealand (Gath & Bycroft, 2018) and the United States (Cuccaro-Alamin et al., 2021) documented similar challenges and results to those encountered in this project in attempting to derive family units from administrative data.
Families as units of research
The family is the building block of society, with individuals’ experiences of housing, health, caring and wellbeing very often connected to their family circumstances. Despite this, much social policy research focuses on individuals’ experiences, reflecting in part that individual-level administrative and survey data are more accessible to researchers and policy officers. Considering PLIDA as a resource for research, consultations with social policy experts during the early stages of this project revealed that a range of research questions would benefit from the ability to construct and identify family units in PLIDA, including:
- Who are participating families, or the families of participating individuals across DSS’ portfolio program? What are their family structures, and how do they vary across programs and from the broader Australian population. How does eligibility (government support) change as family structure changes?
- What is the health, wellbeing and service use of families receiving government support payments, before and after they receive payment?
- How do major life events at the family level (i.e. new baby, divorce, retirement) impact family income and health?
- How do health and socio-demographic parental factors link to child health and wellbeing outcomes; and how does this differ in separated families?
- How does the perinatal period impact men’s health, including their health service and pharmaceutical use during this critical period, compared to other life stages?
These questions require up-to-date and longitudinal family-level information, capturing changes in individuals’ circumstances. The Census of Population and Housing (the Census) is central to PLIDA and contains family-level information. However, a major limitation of this as a source of family information is that it reflects circumstances at one point in time every 5 years.
Outside of PLIDA there are options for researchers looking for family-level information. For example, the Household, Income and Labour Dynamics in Australia (HILDA) is a household-based panel study that collects data about economic and personal wellbeing, as well as family life. While such studies continue to be important, the very large datasets in PLIDA, especially when linked across different databases, offer enormous potential to delve into some topics more thoroughly than is possible with survey data.
This work aimed to capitalise on the rich administrative data within PLIDA, to link individuals to their co-resident families (where applicable), offering the potential for more up-to-date information than is available in the Census. The main source of administrative data about family relationships came from data on recipients of DSS payments (including pensions, benefits and concessions). Limitations of using these data are discussed in ‘Concepts, data and method’, below, and further throughout the report and in the report’s summary.
Report focus and structure
The overall intent of this work is to show the capacity for the administrative data in PLIDA to be used for family-centred research. This report answers the following research questions:
- How can family units be constructed using relationship data collected through the administrative processes associated with DSS payments?
- What are the differences between family units in the DSS data, compared to the Australian population more broadly?
- Are the family unit classifications derived from the DSS data sufficient for policy and research?
The section that follows introduces the concepts, data and method used in this work. The results are then presented, stepping through the creation of the family household dataset from the administrative data and checking its representativeness against the Census data; presenting the approach to classifying families from administrative data; and then discussing how the administrative data classification compares to the Census classification. The report concludes with a summary and discussion.
Concepts, data and method
Conceptualising and defining family (households)
Family is often defined as a group of people related by blood, marriage or adoption who live together. The ABS (2021) defines family as:
Two or more people, one of whom is at least 15 years of age, who are related by blood, marriage (registered or de facto), adoption, step or fostering, and who are usually resident in the same household.
This definition captures the concept of family that researchers typically seek to apply, with many interested in creating units that capture relationships between co-resident family members. In particular, the partner relationships and parent–child relationships are ones that are central to many peoples’ lives and matter to areas of social policy, such as eligibility for particular government payments. While the definition is useful and aligned to the needs of many, we are mindful that it does not cover all facets of families or all kinds of families. Most notably it does not allow for families who live across different households. The restriction to co-resident families was an important one to manage in the scope of the work. In the report discussion we return to consider how the concept of family is broader than that covered in this report.
Given the usefulness of the ABS definition, we applied it to our construction of families from administrative data. We began by looking for individuals who were co-resident and who had an identified parent–child relationship or partner relationship.2 This is described further in the method section below, as there were some practical constraints that caused challenges.
We used the standard ABS family classification:
- Couple family with no children
- Couple family with children
- Couple family with children under 15
- Couple family with no children under 15
- One-parent family
- One-parent family with children under 15
- One-parent family with no children under 15
- Other family.
In this work, our approach was to identify and classify ‘family households’. Such households are those in which at least one parent–child or partner family relationship was observed at the same address.
Persons living alone or in a household of unrelated people were outside the family classification, and outside this research.
The ABS typically applies the above standard to family-level data, noting that a household or dwelling can contain more than one family. With the method used in this project making it impossible to group people into families within households, we applied the above family classification to the ‘family household’ data. One way we had to modify its use to fit households is that ‘other family’ was used when it appeared that there were multiple families or multigenerational relationships in the household. This was the case, for example, when an older person was living with their grown-up child; and that grown-up child was also parent to a young child living at the same address. Another example that was coded as ‘other’ was when two apparently unrelated couples shared the same address.
PLIDA and specific data sources
In 2015 the ABS established the Multi Agency Data Integration Project (MADIP) in response to calls to improve the accessibility of integrated administrative datasets in Australia. It was renamed the Person Level Integrated Data Asset (PLIDA) in 2023. PLIDA is a secure data asset that integrates person-level administrative datasets collected from various agencies over time. Data within PLIDA are updated and maintained by different custodians (e.g. DSS or ABS). Within PLIDA, individuals’ information stored in different datasets can be linked via unique identifiers for approved research projects. To link between sources (e.g. link Census to DOMINO) the PLIDA SpineID variable (referred to throughout as SpineID) is used.3
This project drew entirely on PLIDA. It used 3 key data sources in PLIDA – DOMINO, the Combined modules and the 2021 Census. See Table 1 for the specific data used. The project was undertaken in 2023–24, using the latest extracts available at the time of the research.
Table 1: Data sources used
| Source | Dataset(s) | Uses and comments |
|---|---|---|
| DOMINO (11 March 2023 extract) |
| Creation of DOMINO family households. Note that we did not use the grandparent–grandchild relationship table that could have been used to identify other kinds of family relationships. It was excluded for practical reasons, to manage the scope of the project. Outside of the PLIDA environment, DSS refers to these datasets as ‘tables’. |
| Combined modules (June 2022 extract) |
| |
| 2021 Census |
| Creation of Australian population family households, for comparison to DOMINO family households |
| DOMINO (10 December 2023) |
| DSS payment information for examining concordance between DSS and Census family households |
DOMINO
The relationships table in DOMINO was used to derive the family classification, also drawing in demographic and location information from the Combined modules. DOMINO is administered by DSS, with the name of the database coming from ‘Data Over Multiple Individual Occurrences’. It covers information about individuals’ receipt of DSS payments, including pensions, benefits and concessions.
A limitation of using these administrative data is that relationship data were only available for those who have received DSS payments. Also, we only have this information as collected for administering different government payments, such as when applying for a benefit or updating this information. For example:
- In order to receive the JobSeeker payment, an individual needs to declare whether they are single or partnered and whether they have any dependent children.
- Paid Parental Leave is payable in respect of a particular child, and eligibility is determined by the parents’ (or others’) relationship to that child, as well as other factors.
A limitation of relying on the DOMINO data for relationship information is that these details may not be up to date once people stop receiving DSS payments. For those who have stopped a payment, the relationship status remains set at what it was when they stopped receiving that payment.5 The relationship dataset does not include information on whether or not peoples’ payment receipt continues, so finding out if they are on payments at a particular time requires matching to other datasets within DOMINO. We have done this in later testing but not in the initial data set-up.
A key aspect of the DOMINO data in PLIDA is that it contains episodic records spanning over long time periods, capturing events on and off different payments, and capturing changes in relationships over time and as people age. To derive family-level information from DOMINO that could be compared to the 2021 Census, we extracted data about individuals and their relationships as at the time of the 2021 Census. That is, a snapshot of family relationships was created for all persons identified as having a record in DOMINO at the time of the Census.
As described in the methods section, we applied further restrictions on this dataset of relationships to include only related people who were resident in the same household on Census night. This posed challenges, as discussed in the methods section below.
Data were also extracted on individuals’ receipt of DSS payments at the time of the Census. This was used in later analysis, investigating characteristics of families for which the DOMINO and Census classifications did and did not align.
The Combined modules
The Combined module datasets (recently renamed ‘core modules’) are derived by the ABS to provide demographic and location information for individuals, drawing on data from various agencies and modules such as Medicare, taxation and social services. The Combined Locations dataset was the source of information on a person’s address (saved as a unique confidentialised identifier) on the day of the Census (10 August 2021). When linked to DOMINO via SpineID, this location information allowed a means of confirming that 2 people identified as having a relationship according to DOMINO and were living together at the time of the Census (see methods section below). Information from the Combined modules could not be linked or was not available for everyone in the relationships dataset.
Census
The Australian Census is conducted every 5 years by the ABS, with the 2021 Census conducted on 10 August 2021. The Census provides a detailed snapshot of the demographic, education, employment, housing and other characteristics of every Australian person and household. The aim of the Census is to cover the whole Australian population, and the ABS estimates 96% of Australian dwellings completed the 2021 Census.6
The Census is conducted at a dwelling level, collecting information about all persons present (and some information about temporarily absent persons), allowing families within dwellings to be identified. Data from the Census can be analysed at the person level, family level or dwelling level. For this analysis, we used the person-level data for people living in private dwellings, also using some of the family-level and dwelling-level characteristics.
Our analysis focused on persons living in dwellings that included one or more family members. We refer to these as family households throughout the report. That is, persons living alone or only with unrelated people were excluded from the analysis.
Methods
The following sections describe the steps taken in this work. We first constructed the DOMINO family household dataset from records of people in DOMINO who were identified as being in a co-residential relationship at the time of the Census. Second, we compared these households to the Census to explore how representative they were. Third, we developed the ‘logic’ to be used to classify these households into family types. Finally, we compared the classification produced by the logic against the Census family household classification.
While this report does not cover all technical details, users of ABS DataLab can access the full code (in Stata and R) that produced the output discussed here and associated documentation in the PLIDA code sharing library via the PLIDA Modular Product (PMP) Portal, available on the DataLab desktop.
Construct family households in DOMINO
The first step was to create a dataset of all DOMINO parent–child and partner relationships that were active and at the same address (using ARID, the anonymised address ID) at 10 August 2021 (to correspond with Census night).7 Specific steps included:
- Compiling a dataset containing all parent–child and partner relationships and then limiting this dataset to only relationships active on Census night. Each ‘row’ included the identification (ID) variable for 2 people, with information on the nature of the relationship between them.
- Adding the SpineID to both individuals in the relationship record to allow linkage to the Combined Locations and Demographics dataset. Removing cases where either person in the relationship had missing SpineID.
- Using SpineID, linking the anonymised address (ARID) data from the Combined Locations dataset for both individuals in the relationship. Removing any cases where either individual was missing their ARID data.
- Using SpineID, linking date of birth, date of death (if applicable) and gender for both individuals in a relationship from the Combined Demographics dataset. Removing cases in which either person in the relationship was missing the required demographic data, or the data indicated they were deceased or not born yet at Census night.
- Restricting the relationship table to only those relationships that involved both people sharing the same ARID (i.e. they lived in the same household).
We refer to this dataset as the DOMINO family household dataset. It includes ARID, which is used as the family-household-level identifier, as well as all person-level identifiers and a code to indicate the nature of relationship between co-resident persons.
In the results section we provide a summary of these steps and the numbers of records retained or dropped at each step.
The decision to restrict relationships to co-resident ones was made to manage the scope of this exercise. While we know that some people do have family relationships that cross households, we were mindful that identifying these relationships correctly could be complex. On developing this method and starting on the analysis, we also found that the requirement for related people to be co-resident was one way of checking that the relationship data in DOMINO was still correct.
There was, however, a key difficulty with this step, with the linkages to address (and other) information not always successful. This was sometimes because the SpineID was missing, and sometimes because the address or other demographic information was missing. Where information could not be found, this relationship had to be dropped, as it could not be validated that people were co-resident.
In practice, this meant that, in some cases, we retained partial information about relationships within a family household. We sometimes dropped one or more parent–child relationship and we sometimes dropped a partner relationship, leaving behind partial households. Not surprisingly, this had an impact on the classification of family type within those family households, and we return to this throughout the report.
Representativeness of the DOMINO family household data
After creating the DOMINO family household dataset, we then analysed to what extent it represented the population of Australian family households (as captured in the Census). This is to provide some insights on whether certain types of families will be under- or over-represented if using the DOMINO family household data for research.
Assessing the representativeness of the DOMINO family household dataset required starting with Census population data. Census data were aggregated to the family household level (using dwelling identifiers). Only single-family households that were couples (with or without children) or one-parent families were used in the analysis.8 We refer to these as in-scope Census family households.
We then used person-level identifiers (SpineID) for all those in the in-scope Census family household dataset to look for a link to individuals in the DOMINO family household dataset, and the result of this linkage was aggregated up in the Census data to the family household level. A Census family household was said to be represented in the DOMINO data if at least one member of an in-scope Census family household had a link to the DOMINO family dataset.
The percentage of family households represented in DOMINO is analysed by the Census variables of family household composition, numbers and ages of children, age of oldest family member, and household income.
Developing the family classification logic
The next step was to design a means of applying a family classification (starting with the ABS classification in ‘Conceptualising and defining family (households)
Given the potential for the family configurations to be quite complicated, our process involved identifying what set of relationships (and other characteristics) within a household would trigger a family household to be classified a certain way. This involved developing and testing a logic model that covered as many scenarios as possible, taking account of relationships and ages of individuals.9 The ‘logic model’ is a set of steps the data are checked against, in this case, applying rules such as the number of relationships and relationship types within the household. This was developed through an iterative process, using synthetic data, starting with simple cases then incrementally adding more complex scenarios.
For a simple example, if a household contained 2 adults in a partnership, one child under the age of 15 with a recorded child–parent relationship to at least one of the parents and no other members in the household, then our model determined that this household was classified as a ‘couple with children under 15’.
A more complex example is when there are multiple relationships between adults in the one household. For example, person A is a parent aged 68 living with a child aged 35 (person B), and person B is also a parent to a child (person C). This would indicate a multigenerational family and was classified as ‘Other family’.
To start, a small dummy dataset was produced that covered each of the ABS standard family types, with variables like those in the DOMINO family household dataset. For example, a couple-only family has only 2 records. One was person A partnered to person B, and the other was person B partnered to person A. For this simple case, the logic required there to be only 2 members of a household, and both members were partnered to each other. The logic was then developed through an iterative process, gradually increasing the complexity of the cases in the sample dummy set and adjusting the logic to ensure families were classified appropriately.
More information is provided in the results section, as the development of this logic model was a key outcome of the project.
Applying the family classification to DOMINO data
After developing the logic model, it was applied to the DOMINO family household dataset. The logic model assessed each family household (identified by ARID) and the resulting family type classification was applied to each individual of that household. This classification process drew on the partner and parent–child relationship information coming from DOMINO, the address information coming from the Combined Locations dataset, as well as age information coming from the Combined Demographics dataset. The result of this step was the creation of a new variable, which we refer to as DOMINO Family.
Checking family classification against Census
After the classification of individuals into DOMINO family households, the next step was to assess how well this classification aligned to the family household coding as derived from the Census. As noted before, the Census family classification was used, unless there were multiple families in the household, in which case the family household was classified as ‘other’. For these comparisons, we refer to the Census variable as Census Family.
Linking between DOMINO and Census data was done at the person level using SpineID. If Census data could not be linked for someone in the DOMINO dataset, that person’s household was excluded from later analysis, as it meant we had incomplete data about the Census classification for that household.
When the DOMINO family household dataset (with the matched Census Family variable) was aggregated to the DOMINO family household level, we found that some people living together according to DOMINO plus ARID were not living together according to the Census. This was apparent in the Census data when the Census Family variable contained different values for people who were living in one family household according to DOMINO. We coded these cases as ‘split households’.
In comparing the DOMINO Family and Census Family variables, we considered which kinds of families had better alignment.
Results
Construct family households in DOMINO
As set out in the methods section, the construction of families involved a number of steps, and we have set these out, with the numbers retained and lost at each point, in Figure 1. We started by creating a dataset of all parent–child and partner relationships active in DOMINO on 2021 Census night.10 This dataset contained 63.4 million active relationships, noting that relationships are duplicated given a person is in the data as the reference person (with a partner, child or parent) as well as the ‘related’ person (with their partner, child or parent as the reference person).
In the next step, each person’s date of birth, date of death (if applicable) and ARID were linked to the relationship dataset, where possible. The ARID allowed the data to be organised by household, so we could create family households.
Figure 1: Creating the DOMINO Family Household Dataset
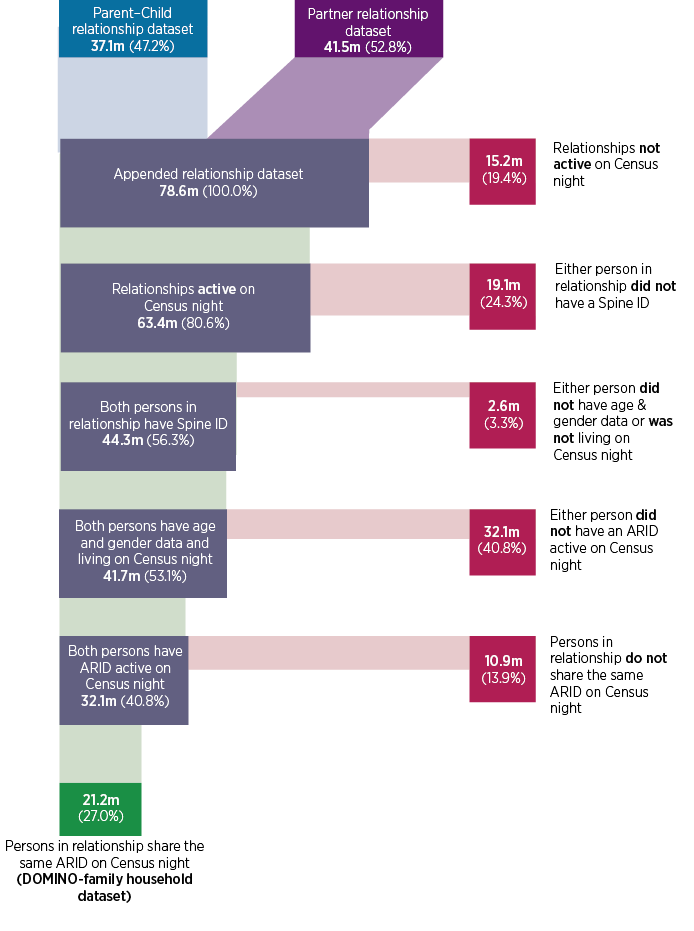
The linked information on ARID and age were required for the family coding, while gender, particularly of the parents, was retained as it was deemed to be of interest to researchers. In a large number of cases, some of this information could not be linked or was missing. Of the original 63.4 million records, 31.3 million records were dropped.11,12 We return to discuss this further below. Of the 32.1 million remaining relationship records, 21.2 million (66%) shared the same ARID, indicating they were living together.
The 21.2 million records were used in the family coding. This dataset is known as the DOMINO family household dataset. Aside from the duplication noted above, a person could be in the DOMINO family household data multiple times – for example, both as partner and as parent. Table 2 provides an illustration of what this information looked like. Overall, this dataset contained records for 4.3 million households.
Table 2: Sample records show the kinds of family relationships in the DOMINO data
Illustration of the created relationship dataset
| Reference person | Related person | ||||||
|---|---|---|---|---|---|---|---|
| Household | ID | Age | Gender | Relation to second person | ID | Age | Gender |
| 1 | A | 34 | F | Parent of | B | 2 | F |
| 1 | B | 2 | F | Child of | A | 34 | F |
| 2 | C | 34 | F | Parent of | D | 2 | F |
| 2 | D | 2 | F | Child of | C | 34 | F |
| 2 | E | 31 | M | Parent of | D | 2 | F |
| 2 | D | 2 | F | Child of | E | 31 | M |
| 2 | C | 34 | F | Partner of | E | 31 | M |
| 2 | E | 31 | M | Partner of | C | 34 | F |
We note that a key step in this work was linking the DOMINO relationship information to the location data, to identify families as included related people who were living at the same address (using the unique address identifier, ARID). Our reliance on the relationship data in DOMINO means we have excluded people who have no identified relationship, even if the ARID information indicated that they lived with others at the time of the Census. Consider a DSS payment recipient who was single in 2019 when they stopped receiving a payment. If they go on to marry in 2020 and are living with their spouse at the time of the Census, this relationship will not be captured in the DOMINO relationship dataset, as the DOMINO data still see them as single, the relationship status they had when they last received a DSS payment.13
We also experienced a significant loss of records because we were unable to match one or both persons in a relationship to ARID or, when matched, the ARID was missing. There were also drops when we were unable to match records to the Combined modules demographic dataset (containing age and gender information). By dropping records, we sometimes dropped full family households but we also dropped partial households. This means we classified those families based on incomplete information. For example, it means some couple families appeared to be one-parent families, and some families with children appeared to have no children (or to have not had children with the correct age range).
These 2 factors – the relationship information being missing in DOMINO and the created dataset having dropped relationship information – are both factors that contribute to the DOMINO Family variable being inaccurate for some family households. We see later the degree to which this might be a problem when comparing the DOMINO Family classification to the Census Family classification.
Representativeness of DOMINO family household data
This section reports on our analysis of the representativeness of the DOMINO family household dataset, focusing on single-family households of couples (with or without children) and one-parent families.
There were 5.6 million family households in the in-scope 2021 Census family household data, covering 16.5 million family members.14 Overall, of the in-scope Census family household data, 65% of family households in the Census had at least one individual matched to the DOMINO family household data.
Table 3 presents the proportions of in-scope Census family households with at least one member in our DOMINO household family dataset. The representativeness of DOMINO was highest for families with children under 15 years (80% of Census family households were also in the DOMINO family household dataset) and lowest in couple families with no children (49%). This does not mean that all family members were in the DOMINO data and, as we see later, this has implications for the classification of families using DOMINO data alone.
Table 3: Coverage of DOMINO family households, by Census family type
Number and proportion of in-scope Census family households with a member in the DOMINO family household dataset, by Census family classification
| Census family type | In scope Census family households (number) | Census family households also in DOMINOa (number) | Coverage of DOMINO family household (%) |
|---|---|---|---|
| Couple families | |||
| No children | 2,283,463 | 1,106,888 | 48.5 |
| Youngest child aged under 15 years | 1,714,625 | 1,376,080 | 80.3 |
| Youngest child aged 15 years and over | 753,486 | 580,352 | 77.0 |
| One-parent families | |||
| Youngest child aged under 15 years | 368,717 | 289,737 | 78.6 |
| Youngest child aged 15 years and over | 448,310 | 245,277 | 54.7 |
| Total (all) | 5,568,601 | 3,598,334 | 64.6 |
Note: (a) This is the number of in-scope Census family households with at least one member in the DOMINO family household dataset. This analysis excluded families classified as ‘other’.
Taking a range of family/household variables from the Census, Figure 2 shows that the representativeness of DOMINO varied by some of these characteristics.
- Focusing on families with children, families with more dependent children were more likely to be in the DOMINO dataset, and the proportion was highest when the youngest child was aged under 15 years (with little variability by age group within this broad range).
- The representativeness of DOMINO was lowest for the youngest and oldest family households, as measured by the age of the oldest person in the family. The representativeness was highest when the oldest person was aged 44–54 years, no doubt this being related to it being a peak age for having children in the family.
- By household income, those most likely to be in DOMINO were those households with lower incomes (household income of up to $51,999 per year) and those least likely to be in DOMINO were those with the highest income ($234,000 or more per year).
In summary, there is some indication that particular families are more likely to be observed in the DOMINO data, with better representation when there are children in the family and with lower income families. We might expect that DOMINO will be a better dataset for creating family units for further analysis for these kinds of families. We return to this further below, when we consider how the families were classified using the DOMINO data, and comparing the classifications to those derived from the Census.
This analysis did not explore how many family members were present in the DOMINO data. In hindsight, and a recommendation for research in the future, is that it would have been useful to count how many adults and children ‘matched’, to better see where the gaps in the DOMINO relationship data were.
Figure 2: Proportion of Census family households represented in the DOMINO family household data by selected Census characteristics
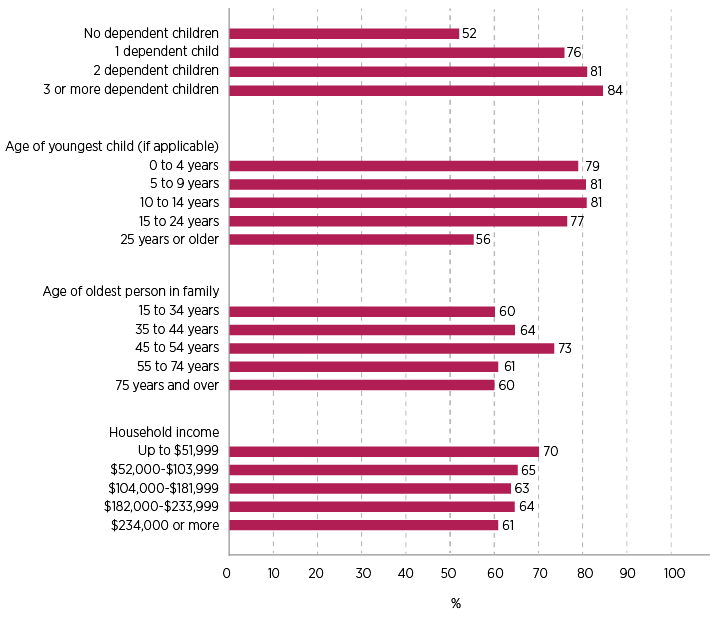
Note: Percentages are calculated over in-scope family households from the 2021 Census.
Develop the family classification logic
Using the constructed DOMINO household family dataset, the next step was the development of a family classification logic that, when applied to all records, would classify families correctly. The ‘logic’ is the set of decisions to be asked, and applied through programming, to determine the classification that best fits the data. The final logic model checks for the existence and configuration of partner and parent–child relationships within a household, as well as looking at the age of youngest child. We note that this step was somewhat independent of the created family household dataset, and the resulting logic could be applied to a different set of data containing information about family relationships.
As described in the methods section, the logic was initially developed and tested through application to synthetic data that captured variations on family relationships that were known to exist in the full dataset. The steps taken are described below.
The first step was to test for one-parent families. These family households were easily identified as involving one adult with a parent relationship to a co-resident child or children, having no partner relationships, and no other co-resident adults with relationships with the child/children. These family households were further classified by age of youngest child.
The next most easily identified family household type was that of a couple family without the presence of parent–child relationships. That is, there was just the presence of a partner relationship between the 2 co-resident adults.
For couple families with children, early examination of sample data showed there were multiple ways these data might appear. Figure 3 shows some combinations for those later classified as couple families with children. The dataset only includes individuals who were related to at least one other person in the household but, in Figure 3, some different scenarios are shown:
- Case (1) shows complete relationship information, including a partner relationship, and both parents having a parent–child relationship with the child/children.
- Likewise, case (3) shows couple relationships but the parent–child relationships are not common to both parents, as might indicate a blended family.
- Case (5) takes this a step further, with no children in common, such as in a step-family.
- Cases (2) and (4) show households in which 2 adults are not identified as having a partner relationship but they are parents to all (case 2) or some (case 4) of the co-resident child/children. While it is possible the parents are not in a relationship, we have treated them as a couple with children, assuming, for some at least, this partner relationship information is missing.
- Case (6) shows a partner relationship. It shows a parent–child relationship for one of the adults but not the other. This may indicate missing relationship information, although it may also indicate the second adult has no parental responsibilities to the co-resident child/children.
All these cases were classified as couple families with children, despite the ambiguity of information. That it appears some relationships are not represented in the DOMINO data is a precursor to our later findings that within this DOMINO family household dataset, the DOMINO Family variable has some limitations, with partner and parent–child relationships not always captured.
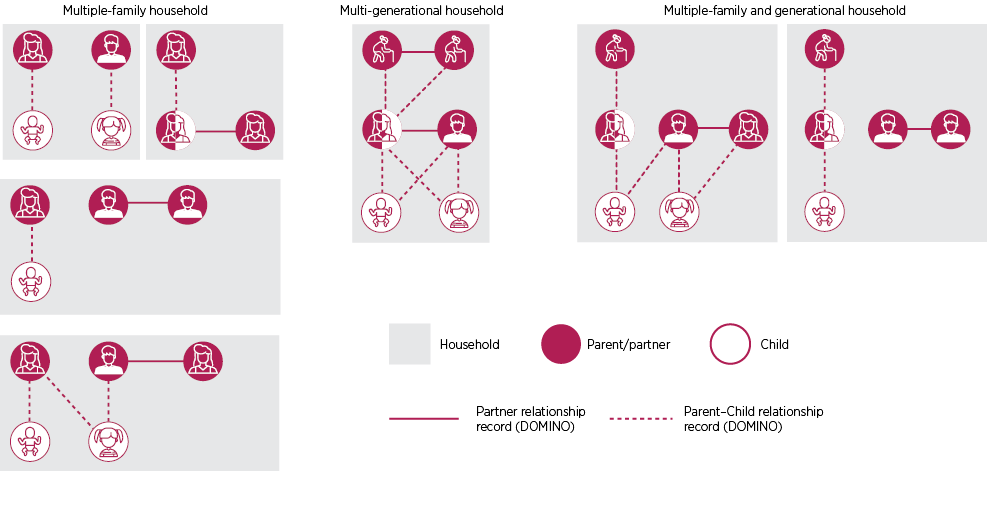
There were more complex family households observed when the possible networks of relationships were put together at a family household level. Figure 4 illustrates some ways people may be connected in more complex family households, such as those in which there appeared to be multiple families or multigenerational families. All individuals living in these kinds of family households were classified as ‘other’ families.
The outcome of this step was the development of a final logic model. It was a key outcome of the full project, and the programming code and documentation is available to PLIDA researchers. Researchers may use this code as a starting point, and modify it as required to make their own decisions about family classifications.
Figure 3: Relationships in couple families with children were not always observed
Examples of DOMINO family compositions, couple families with children
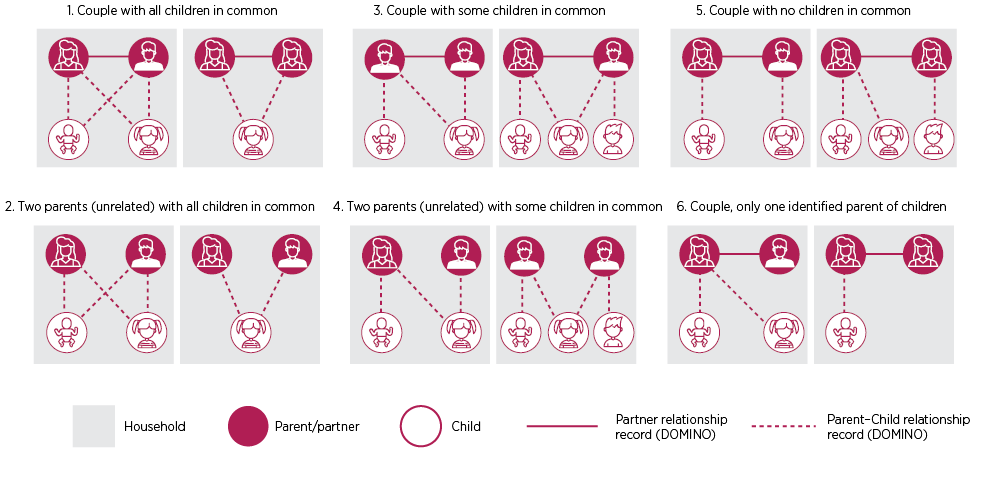
Note: For cases of ‘Two parents (unrelated)’ the ‘unrelated’ is implied by the lack of a DOMINO partner relationship record between the 2 parents.
Figure 4: Relationships in family households classified as ‘other’
Examples of DOMINO family compositions, multiple-family and multi-generational households
Apply the family classification to DOMINO data
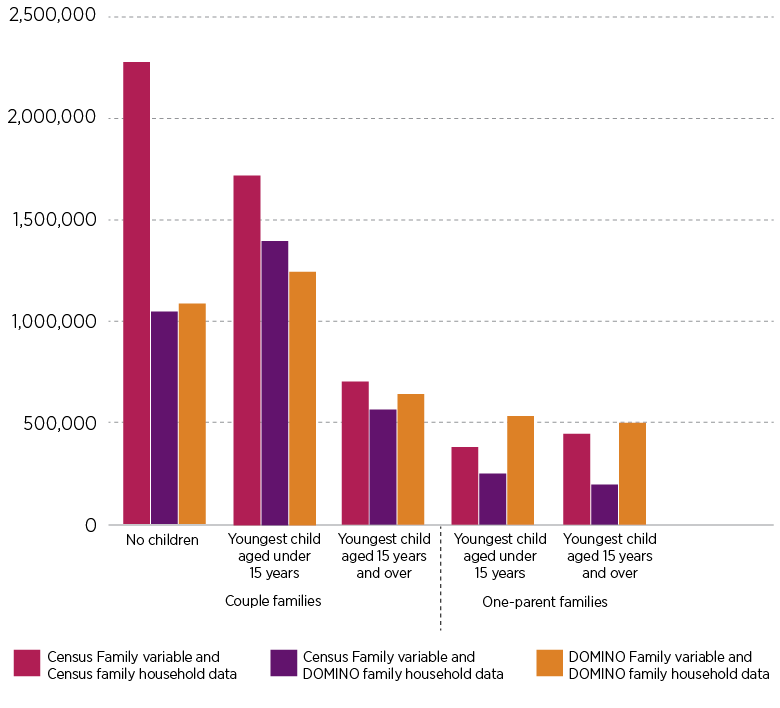
Once the logic model was finalised, it was applied to the DOMINO family household dataset to create a variable named DOMINO Family. Overall, we identified 4.3 million unique family households in this dataset. Figure 5 shows the distribution of these family households over the variable DOMINO Family.
In presenting findings, for context we also refer to numbers using the type of family household reported from the Census data. We refer to this variable as Census Family. In Figure 5 this Census Family variable is shown for both the overall population of Census family households and for the subset of DOMINO family households.
Overall, this shows:
- According to the Census data, the most common kind of family household is that of couples without children. These, however, are under-represented in DOMINO as we saw in the earlier analysis of the representativeness of the DOMINO data. The number of these families in the DOMINO family household dataset is less than half that in the overall Census. Within the DOMINO family household dataset, the number is similar whether classified according to Census Family or DOMINO Family.
- The next largest group in the Census counts of family households was couples with a youngest child aged under 15 years. This category was the largest in the DOMINO family household data. As shown in earlier analysis, this type of family was well-represented in the DOMINO data relative to the Census data.
- For couple families with older children, the numbers in DOMINO were similar to those in the Census. Looking at just the DOMINO family household data, Census Family produces a smaller number compared to DOMINO Family, so we explore this further in looking at the concordance between these classifications in the section below.
- For one-parent families with the youngest child aged under 15 years, the DOMINO Family variable identified considerably more families compared to the Census Family variable. Earlier, in looking at how well DOMINO represents different family types, we found DOMINO had good representation of these families. It appears that when using DOMINO information (and address information) some families may be incorrectly classified, and we return to this in looking at the concordance analysis.
- For one-parent families with older children, there is a similar result and, in particular, there is a marked difference when focusing on just those in DOMINO with Census Family producing a smaller count than DOMINO Family.
Some of the differences between Census and DOMINO are consistent with our knowledge that some relationships were lost due to missing data in the DOMINO dataset. We noted earlier that this meant we would classify families incorrectly as one-parent families where the partner relationship was lost, and this is likely contributing to the number of these families being greater than expected using the DOMINO Family variable within the DOMINO dataset.
We compare the Census and DOMINO Family variables further in the section below but first look in more detail at results from the DOMINO Family classification.
Figure 5: Couple families were the most commonly identified family types in DOMINO
Counts of family households according to Census and derived from DOMINO data, 2021
We reported earlier that some kinds of family households were more easily categorised into the DOMINO Family variable than others, and couples with children included different combinations of relationships. To put some numbers on this, Table 4 presents the detailed categories from the DOMINO Family variable, showing numbers of persons as well as family households. The split by age of youngest child is not included.
Within the couples with children group, the largest category was number 6, in which 2 adults were recorded as being partnered but the children were identified as only being related to one of the parents. This represented 60% of the cases classified as couples with children. This being such a large number suggests that there probably is a parent–child relationship for the second parent in many of these families. Some are likely to be step-families, for which it might be valid to have the relationship to the second parent missing.
For this case, the missing parent–child relationship could reflect this information not being in the DOMINO relationship table. For example, to determine eligibility or payment information, it might only be necessary to find out about children of the recipient, and find out about the recipient’s partner or spouse, but it may not always be necessary to find out about and record the relationship between partner/spouse and children. In fact, through this work we were advised that DOMINO parent–child relationship records are only generated for one parent of children when applying for certain payments such as parenting payments or benefits such as the Family Tax Benefit. This is despite parents being partnered or separated and sharing parenting responsibilities.
The other factor that we know has contributed to dropped records in the DOMINO relationship data is when key information (address and demographics) could not be linked to one of the two related individuals. However, in these couple families with children, the individuals are in the dataset through linkages to others, and so this could not have contributed to the loss of information about these parent–child relationships.
Table 4: DOMINO family household data classified by the DOMINO Family variable
| DOMINO Family | Persons | Family households | ||
|---|---|---|---|---|
| n | % | n | % | |
| Couple/Two-parent families with children | ||||
| 1. Couple with all children in common | 1,700,862 | 12.3 | 460,572 | 10.8 |
| 2. Two parents (unrelated) with all children in common | 115,251 | 0.8 | 30,586 | 0.7 |
| 3. Couple with some children in common | 1,050,347 | 7.6 | 227,424 | 5.3 |
| 4. Two parents (unrelated) with some children in common | 74,395 | 0.5 | 14,995 | 0.4 |
| 5. Couple with no children in common | 42,996 | 0.3 | 8,921 | 0.2 |
| 6. Couple, only one identified as parent of children | 4,300,357 | 31.1 | 1,117,741 | 26.1 |
| One-parent family | 2,706,108 | 19.6 | 1,029,166 | 24.1 |
| Couple family with no children | 2,220,378 | 16.1 | 1,110,189 | 26.0 |
| Other family type | 1,609,366 | 11.7 | 279,256 | 6.5 |
| Total | 13,820,060 | 100.0 | 4,278,850 | 100.0 |
Notes: Refer to Figure 3 and Figure 4 for diagrams illustrating the above classification of couple families and ‘other family type’. For cases of ‘Two parents (unrelated)’ the ‘unrelated’ is implied by the lack of a DOMINO partner relationship record between the two parents. Couple families with children and one-parent families with children include those with youngest child aged under 15 years or aged 15 years and over.
Compare DOMINO classifications to Census
This section reports on our analysis of the DOMINO family household data, comparing the classification of family households using DOMINO Family to the Census Family classification. This provides some insights about whether researchers or policy makers may find the derived DOMINO Family classification sufficiently reliable for particular research questions.
As noted previously, this analysis is based on deriving the DOMINO Family variable in the created DOMINO family household dataset. We acknowledge there were some limitations with this dataset that led to some families being incorrectly classified – we see this further below. The logic developed for this project will be able to be used as more complete sources of data about family relationships become available in PLIDA.
This analysis only includes those family households for which the DOMINO and Census family coding could be linked. See the earlier method section for more information.
Overall findings comparing family classifications
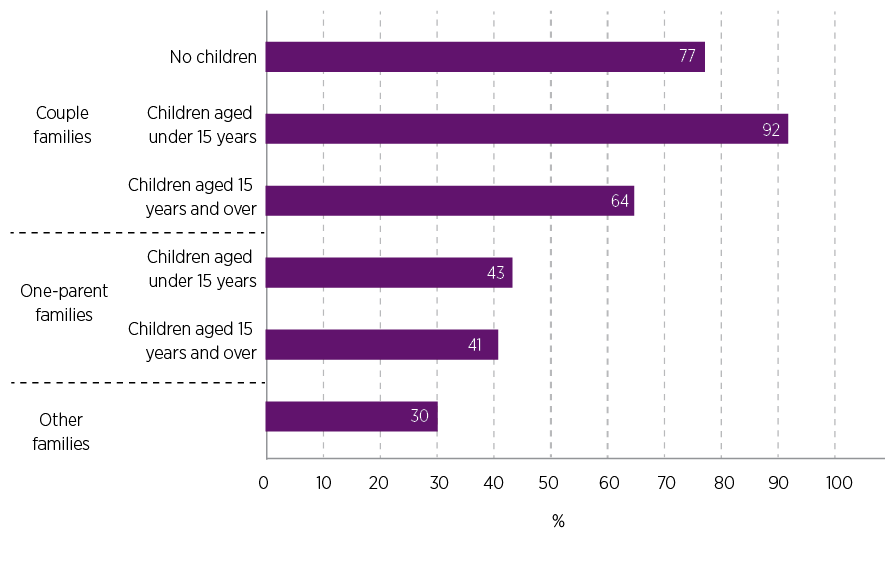
Of the 3.6 million family households for which Census and DOMINO family household data were linked, 2.5 million (70%) had the same classification of family household whether using DOMINO Family or Census Family. We consider there to be a ‘match’ in the classification for these households. The remaining 1.1 million (30%) had family household classifications that did not match.
Figure 6 shows there was a higher match rate for those classified as couple families with children under 15 years in the DOMINO Family variable (92% had the same classification in Census Family). There was also a high percentage matching for couple families without children (77%). The match rate was notably lower for one-parent families. These findings are consistent with Figure 5, which showed that the Census Family variable and DOMINO Family variable, when applied to DOMINO family household dataset, produced very different numbers for one-parent families.
Figure 6: The DOMINO Family variable was most likely to match the Census Family variable for couple families with children under 15 years
Percentage matched – Census classification was the same as the DOMINO-derived classification, by DOMINO family type
Does it make a difference if family members are currently receiving DSS payments?
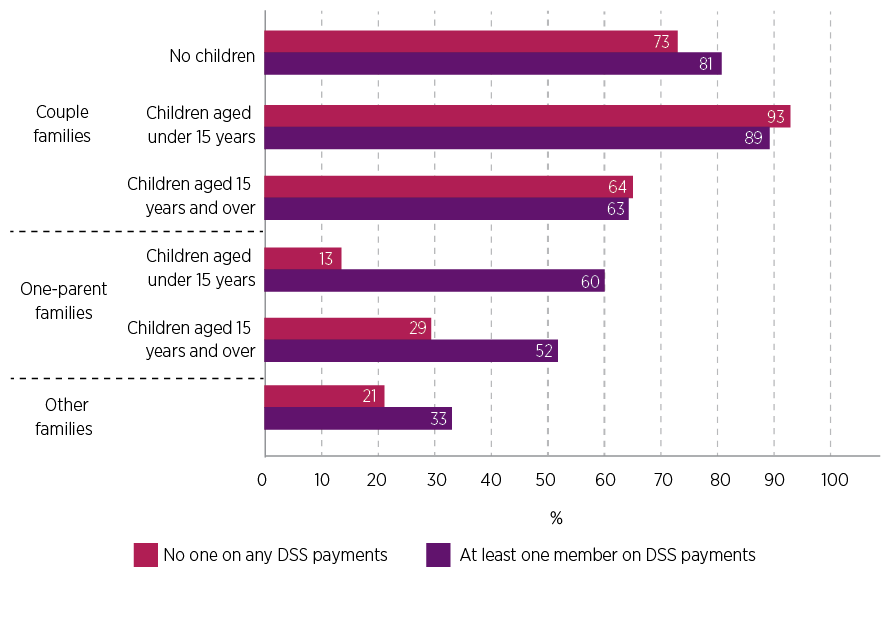
As we have noted elsewhere, one reason the DOMINO relationship data may not match the Census data is that the DOMINO relationship information may be out of date, given it is not updated once people leave DSS payments. Overall, if we bring in information on whether there is someone in the family receiving DSS payments at the time of the Census, the percentage of family households with the same classification in DOMINO Family and Census Family is 69% if no-one is on a DSS payment at the time of the Census. It is slightly higher, at 71%, if at least one person is on a DSS payment. While these differences are not large, we can see more variation when compared by the DOMINO Family variable. See Figure 7:
- For couple families with no children and for ‘other’ families the percentage matching is higher when someone in the family is receiving a DSS payment, compared to those families with no-one receiving a payment.
- The percentage matching is far higher for one-parent families when at least one parent is receiving a DSS payment.
- Interestingly, the match rate is lower for couple families with children aged under 15 years when at least one person is receiving DSS payments on Census night, compared to those families not receiving a DSS payment.15 For couples with older children, there is not much difference according to receipt of DSS payments.
Figure 7: For most categories, DOMINO Family was more likely to match Census Family when someone in the family was receiving DSS payments on Census night
Percentage with DOMINO Family matching to Census Family, by whether some in family was receiving DSS payment, by DOMINO Family
A closer look at the cross classification
To explore the concordance between Census Family and DOMINO Family further, Table 5 tabulates the Census Family variable for each category of the DOMINO Family variable. We assume that the ‘true’ family composition is captured in the Census data. The Census captures all relationships within the household on Census night, incorporating relationship information for those temporarily absent.
Note one new category reported for Census Family, being ‘split households’. This category is family households in which we found residents in the derived DOMINO family households were not living together according to the Census data and lived in different kinds of families.16
As expected, given the findings above, the most notable misclassifications were among those identified as one-parent families in DOMINO Family.
- Of those classified as one parent with children under 15 years in DOMINO Family, 43% were classified the same in the Census but 42% were classified as couple families with children in Census Family. We return to this further below.
- Among those classified as one-parent families with older children in DOMINO Family, 41% were classified the same in Census Family, with others spread over a number of Census Family categories. For some, as for those with younger children, this was about a mismatch in information about the couple relationships but for others it related to the Census having different information about the presence of older children.
Table 5: Mismatches were related in part to Census classifying more as couples and finding older children no longer living with parents
Census family household classifications by DOMINO family households classifications, families linked between Census and DOMINO
| Census family household classification (%) | ||||||||
|---|---|---|---|---|---|---|---|---|
| DOMINO family household classification | Couple | One parent | Other | Split household | Total | |||
| No children | Youngest child aged under 15 years | Youngest child aged 15 years & over | Youngest child aged under 15 years | Youngest child aged 15 years & over | - | |||
| Couple | ||||||||
| No children | 77.3 | 8.0 | 6.9 | – | – | 6.0 | 1.8 | 100.0 |
| Youngest child aged under 15 years | – | 91.7 | – | 0.5 | – | 2.4 | 5.3 | 100.0 |
| Youngest child aged 15 years & over | 4.1 | 2.0 | 63.6 | – | – | 3.5 | 26.4 | 100.0 |
| One parent | ||||||||
| Youngest child aged under 15 years | – | 41.9 | – | 42.7 | – | 5.0 | 10.3 | 100.0 |
| Youngest child aged 15 years & over | 3.0 | 2.2 | 15.7 | 2.5 | 40.9 | 10.3 | 25.5 | 100.0 |
| Other | 2.79 | 11.5 | 0.9 | 4.3 | 0.6 | 30.4 | 49.7 | 100.0 |
Notes: Some numbers suppressed due to small cell size. Bold text indicates expected matches.
Other mismatches may also be important, depending on researchers’ needs. For example, while there was a reasonably good match rate for couples with no children (77%), this is a large population and so the mismatched group may be important and need further investigation. As seen in Table 5, a lot of this mismatch was related to the DOMINO relationship data not including parent–child relationships. It is possible some of these records were dropped due to our being unable to link the child data to their address and demographics but also some child details may not be in the DOMINO data if parents have not accessed DSS payments since becoming parents.
Across all categories, it is expected that some mismatch is related to the deficiencies in the relationship dataset – that the DOMINO relationship data will be missing some relationships because it is out of date and because we have dropped some of the relationship data (due to missing information). Without undertaking very in-depth analysis, it is difficult to assess the exact causes of the mismatch but we take a closer look at this briefly below, focusing on one-parent families and families with older children.
One-parent families
In the case of the one-parent families according to DOMINO Family who are couple parent families in the Census, this reflects the absence of a partner relationship in the DOMINO relationship dataset. We saw in Figure 7 that for these one-parent families, the DOMINO and Census Family variables were more likely to agree when there was someone in the family receiving a DSS payment at the time of the Census. Even so, there was far from complete alignment of these variables.
To explore this further, Figure 8 focuses on one-parent families with children under 15 years by the proportion with the same classification in the Census data according to selected DSS payments received on Census night. The ones reported here are the main kinds received in one-parent families.17
- Alignment was greatest for families who were receiving the Parenting Payment Single, for which 77% of those classified in DOMINO Family as one parent with children aged under 15 had the same classification in Census Family. As only one-parent families are eligible for this payment, it would be expected to have closer alignment.
- There was weaker alignment for those listed as current on FTB (64%–67%).
Without more information, it is not possible to determine why the relationship data in DOMINO for current payment recipients is not well-aligned to the Census data. While we extracted what families were classified as in the Census when there was a mismatch, we did not tabulate this by DSS payment receipt. It is possible that the mismatch is due to Census data being more complete, as with family households in Census classified as ‘other’.18 For some, it may reflect that relationship data in PLIDA is not always complete or up to date, as well as the issues with creating the relationship dataset and losing records for which ARID and other information could not be linked.
Figure 8: Classification of family type as one parent with children under 15 years in DOMINO was most likely to agree with Census when parents were on Parenting Payment Single at the Census
Percentage of one-parent families as classified in DOMINO, also classified as one parent in the Census, by selected payment types received at Census date, families with children under 15 years
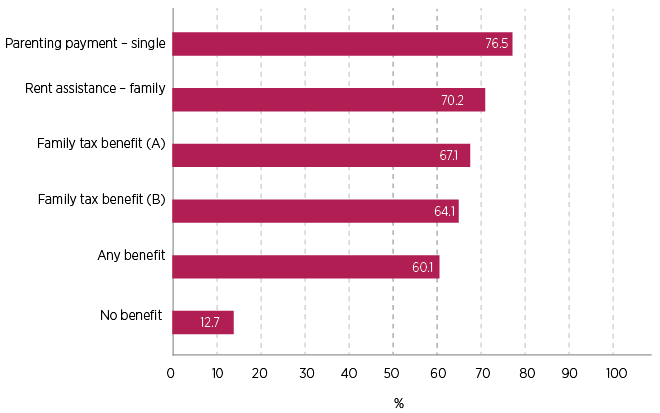
Notes: Selected payments shown. Family members may be on multiple payments. Match rates were lower for a range of payment types not shown.
Older children and the parental home
While DOMINO couples with children aged under 15 years had the highest match rate with the Census (92%), this dropped by 28 percentage points to 64% when couples had only older children in the household (15 years of age or older). Table 5 shows that one in four (26%) of the couples with older children, as classified using DOMINO, were classified as split families according to the Census Family variable. This was the biggest contributor to mismatches for this family type. Split households occur when members within the same DOMINO family household have different Census family classifications. Two relevant scenarios may cause this split household mismatch.
First, this may reflect that the administrative data are not up to date for older children who have moved out of the parental family home by the time of the Census. This may happen if these older children have not updated their living circumstances with DSS, Medicare or other agencies. Their administrative data used in the Combined Locations dataset would still show them living in the parental home, leading to the constructed DOMINO family household being based on out-of-date data.
Another possibility is that our derivation using the Census data has revealed complexities in where people were counted on Census night. Some of the people in split households might have been away from their usual family household temporarily. Further analysis showed that 15% of couples with older children, as classified using DOMINO Family, have at least one member absent on Census night. That is, an older child may still be living in the parental home but be staying elsewhere on Census night.
When excluding families who had someone absent on Census night, the prevalence of split households for couples with older children fell from 26% to 16%. This reduction suggests that temporary absence explains some of this mismatch between DOMINO and Census family classifications. That it does not reduce the proportion in split households to zero suggests that the first explanation, related to out-of-date administrative data, also contributes to the mismatch.
These observations also hold true for one-parent families (as classified using DOMINO Family), where both the rates of mismatch due to split households and prevalence of absent members on Census night are higher when all children are aged 15 years and over.
Summary
This report has provided an overview of the steps and outcomes of deriving a classification of family households and applying it to a relationship dataset created in PLIDA. The dataset drew on information from DOMINO (data on recipients of DSS payments) and on ABS-created datasets containing an individual’s demographics and location. The project included the development of a logic (and associated programming code) that could be applied to family-household data created from the administrative data to create a family household classification. For this work we created a variable called DOMINO Family, which was the derived family classification at a point in time using the created family household dataset. The reference date was the date of the 2021 Census (10 August 2021). We used Census data to compare to the derived variable.
In this report we set out to answer some research questions about the possibility of creating family units from the administrative data in PLIDA. We summarise these results against the research questions below. This is followed by some key learnings for researchers seeking to create family units from administrative data, using this approach or their own.
How can family units be constructed?
The first question we asked was ‘How can family units be constructed using relationship data collected through the administrative processes associated with DSS payments?’ This report has stepped this out in some detail, although researchers can access more technical information (and programming code) through the PLIDA Code Sharing Library managed by the ABS.
Key to this work was the use of the relationships data from DOMINO. Both parent–child and partner relationships are stored in datasets in DOMINO so can provide a family lens when these relationships are linked up. In asking how to create family units from these data, a key question to ask is ‘What is a family?’ We return to this as a conceptual question in the Discussion, below. For this work we made a pragmatic decision that families comprised co-resident people who were related through partnership or through a parent–child relationship. The requirement that people be co-resident was applied through linking in information on individuals’ addresses. This was done for the dataset of people who had been identified through the DOMINO data as being part of a partner relationship or parent–child relationship at the time of the 2021 Census.
As we used location as a key identifier of whether related people were living together, we used the concept of ‘family household’ when reporting findings. We were unable to isolate families within households when the relationship data indicated there were multigenerational or more complex relationships, so these cases we recorded as ‘other’ households and they were subject to less scrutiny in our analysis.
Through these data, we created family household units, and developed logic that would classify people according to the relationships that were observed in their family household. We also brought in information on people’s ages so we could classify families with children according to the age of the youngest child.
Family household units could therefore be constructed using the administrative data alone. However, we have highlighted in this report various challenges that resulted in some apparent misclassification of family households. We return to this below.
Are the derived family units accurate and representative?
To answer this question, we need to address 2 separate issues. One concerns the approach taken to classify families – did it classify them accurately? The other concerns the data used in the analysis, and to what extent it accurately reflected family households, and to what extent it represented the population of Australian family households.
First, looking at the approach taken to classify families, much care was taken to explore different family configurations and make informed decisions on how to classify those families. The ABS standard was used as the base and we explored how to use information in the administrative data to determine which categories families fell into. The result of this was a set of programming logic (and code) that can be used by researchers using PLIDA. It is a standalone outcome of the project that allows researchers to accurately classify families, assuming the underlying data is correct. This assumption is key, and one that caused challenges with this project.
The creation of an appropriate relationship dataset was where we faced the most difficulties. We used DOMINO data plus information on location and demographics. The resulting dataset had some gaps, both in terms of representation of the Australian population and in accuracy of family households. An improved dataset about family relationships would vastly improve researchers’ capacity to undertake work that is family centred. We welcome the proposed focus of the ABS to develop a new set of data to meet this need.
The ABS core relationships module
The ABS Data Integration Services Branch is currently considering the development of a core relationships dataset that would provide a more robust longitudinal source of information on family and household relationships in PLIDA. As well as DOMINO, other likely sources of relationship data include the Medicare Safety Net, spouse identifiers from the ATO tax return, migrant data, birth registrations and childcare subsidies.
One difficulty related to the fact that DOMINO is a subset of the Australian population. To be in the DOMINO dataset, family members need to have received a DSS payment at some time, and where that payment was received in the past, the information in DOMINO could be well out of date. Not surprisingly, we found some differences when we looked at whether the DOMINO family household dataset under- or over-represented some groups. Families with children were more likely to be represented than those without children. Lower income households were more likely to be in DOMINO than those with higher income.
On top of the question of representativeness of DOMINO, was an issue more generally with PLIDA and the data in its databases. There are individuals in PLIDA with missing SpineID, so individuals cannot be linked across datasets and there is missing data in some of the datasets. For this work, missing SpineID, demographic and location information led to a loss of a large number of relationship records. Having to drop records with missing data caused the creation of partial households, which was most evident for families we classified as one-parent families often showing in the Census as two-parent families. Some of this may be due to the DOMINO relationship data being out of date but we expect that dropping records with missing data contributed to this issue.
We note also that if we are talking about family households across Australia and to what extent the administrative data can be used to report about these families, our approach did not extend to the more complex families, such as multi-generational households or families with multiple partner relationships. We hope that researchers and policy makers can extend the work done so far to explore these and other configurations of families.
Is the derived family variable sufficient for policy and research?
This work to derive family units from the administrative data was undertaken to help policy officers and researchers who would find it useful to see one way this could be done, and to use or possibly modify this approach to suit their specific needs. As noted in the report’s introduction, there are numerous quite disparate research questions that might be best answered using family-level data. To what extent the approach used in this report and the resulting family classification will suit specific research needs is going to depend on the question being asked.
Particular thought needs to be given to any issues that might arise through families being misclassified when using the administrative data. We hope this report builds awareness of the gaps and potential sources of misclassification that might arise.
The DOMINO relationship information appeared to be more consistent with the Census data when family members received some DSS payments, although this wasn’t the case in all kinds of families. The general finding, though, suggests that if a research activity is focused on families receiving DSS payments, the relationship information in DOMINO might be sufficient to provide a reasonable classification of families.
Key learnings about the approach taken
The key learnings for this work relate to the data limitations within PLIDA. We note this work drew only on DOMINO, Census and the Combined Locations and Combined Demographics dataset. Bringing in information from other datasets in PLIDA may have helped with some issues but not all.
DOMINO data may be out of date when payment ceases
From the outset we knew one challenge in using DOMINO was that it would only capture changes in relationships while individuals were receiving DSS payments, including pensions, benefits or concessions. In the DOMINO relationships dataset, each person’s change of relationship is indicated by a start and end date and when they leave DSS payments, they remain recorded as having the relationship they had at the time, with an open-ended finish date to that relationship.
In setting up our relationship dataset, we identified relationships that were active at Census night. We referred to a relationship as being active if the Census date fell between the relationship start and end dates. However, some of these relationships were not necessarily ‘active’ because relationships were recorded as ongoing after people left DSS payments. Our cross-check with address information will have helped remove relationships that were not current, as indicated by related (by partner or parenthood) people not living in the same residence. It will not, however, have picked up new relationships that had not been reported to DSS (because, e.g., individuals were not receiving DSS payments).
DOMINO data does not capture every relationship
Our analysis suggested that full family relationship data are not always collected or saved into the DSS relationship datasets. For example, our linking by ARID as well as family relationships found there were many families in DOMINO with 2 parents and children but the children were identified as only being related to one parent. There were more of these cases than might be expected.
These findings are consistent with one of the learnings gained through this work, that for some payments (benefits, pensions or concessions), the parent–child relationship information is only present for one parent. The relationship between partner/spouse and children is therefore not always captured in the data. This also extends to separated parents, with the parent–child relationship only recorded for one of the parents in some circumstances. We note that if the parent–child relationship data in DOMINO were used for research without doing the more complex family linking, the partner in these families would show as being partnered without children.
Missing PLIDA linkage information
A key piece of information in PLIDA is the SpineID, the unique identifier that allows linkages across datasets in PLIDA. When this PLIDA SpineID is missing, linkages can only be made within a dataset. For example, without it, we could not link DOMINO to Census data. There are cases with a missing SpineID (see Figure 1) and, as noted in an earlier footnote, the ABS advises that there are some populations for which creating a SpineID is more difficult. This includes younger people, more mobile populations and recent arrivals to Australia who do not yet have sufficient presence in the administrative data. It might be especially useful to understand more about the family circumstances of those with this key SpineID variable missing.
Missing address information
Another distinct challenge of this work related to the decision to use ARID (address) to confirm co-residence of people. This allowed us to check that relationships reported in DOMINO were still valid at the Census date (assuming the address data are correct). This address information comes from a Combined Locations module, which the ABS derives by drawing on address information from multiple sources. However, we had not anticipated that we would lose a large number of records that could not be linked to the address information. (We lost others in linking to demographics as well.)
When address information could not be attached, we could not use that relationship data, and this sometimes meant our construction of family households was based on partial data. While we might wonder if we should have restricted our analysis to households for which we had complete data – in fact, it was impossible to identify whether we had complete or partial data about a household when the address data could not be linked.
Potential to use address to find other relationships
We note that where address information did link there was an opportunity not only to validate the DOMINO data but also to potentially identify new relationships by noticing co-residence of others not found in the DOMINO data. We did not develop this idea in this work but in future research it may be one way of finding a possible new couple relationship, although co-residence alone would not tell you the nature of the relationship.
Discussion
A foundation for future work
This exercise is a starting point; a foundation that may help some researchers undertake social policy analysis at the family and household level and to help inform more robust longitudinal identification of families and households in future.
We have aimed for transparency in this work, identifying, in particular, the limitations of the administrative data and how we attempted to work with data gaps. An important initiative of the ABS is the development of a core relationships dataset, which will improve the availability of longitudinal data on individuals’ relationships.
The logic we have developed and presented here, to create family units from relationship data, will still be relevant with more complete relationship data, although will need careful testing as new issues are likely to emerge when applied to a new dataset.
PLIDA in context
This research has focused exclusively on the potential for family units to be constructed using administrative data in PLIDA, and our project used selected datasets in PLIDA with the main focus on DOMINO. Going beyond the datasets used in this work, there is potential to use family coding such as presented here to explore other sets of information in PLIDA, including data from the Australian Tax Office and Medicare, to get family perspectives on income and health, for example.
While there is considerable potential for PLIDA to help with important policy questions for families, it will not be able to answer all questions, with limits on the scope and coverage of data in PLIDA as we have seen in this report. There remains much value in survey and Census data to provide insights about families in Australia, from the perspective of what families look like and also how families function, their challenges and opportunities.
Concepts and definitions of families
We noted earlier in the report that the approach taken to conceptualise and identify families in this research was a pragmatic one, focusing on families that live together and on family households. These kinds of family units are the kinds that researchers typically seek to construct from person-level data. Such family units are ones that government policies are often designed around. They do not cover all kinds of families though. By focusing on these families, we have not been able to report on families that do not live together and have provided limited insights about reporting on the more complex families, where multiple families are living in the one household.
We know that individuals experience and understand family in different ways. The way we have classified families in this report will resonate with many people but does not include all kinds of family relationships. For example, we have not been able to report on those couples who live together apart – that is, have a committed relationship (including marriage) but choose to live separately. We have also not been able to report on children who live across 2 households, when they live some time with each parent. By limiting the identification of family relationships to those of partner and parent–child, we also missed families in which grandparents are raising grandchildren, and we missed all sibling and extended family relationships.
Beyond this, others are creating ‘chosen family’ with non-biological kin and/or those not recognised as family by law (Weeks, Heaphy, & Donovan, 2001). Today, many Australians consider love to be more important than legal ties or obligations when defining family (Budinski & Gahan, 2024). Such family relationships are especially difficult to find in administrative data such as PLIDA, as these relationships may not be reportable to the government for the purposes of administering payments or services.
We hope that, in future, further research will be able to build on the research presented here, to account for other variants in family structure, using PLIDA alongside other data collections to improve our understanding of family wellbeing.
References
Australian Bureau of Statistics. (2021). Census of Population and Housing: Census dictionary. ABS.
www.abs.gov.au/census/guide-census-data/census-dictionary/2021.
Budinski, M., & Gahan, L. (2023). What is family? Australian views on what makes a family. Melbourne: Australian Institute of Family Studies. aifs.gov.au/research/research-reports/what-is-family
Cuccaro-Alamin, S., Eastman, A. L., Foust, R., McCroskey, J., Nghiem, H. T., & Putnam-Hornstein, E. (2021). Strategies for constructing household and family units with linked administrative records. Children and Youth Services Review, 120, Article 105706. doi.org/10.1016/j.childyouth.2020.105706
Gath, M., & Bycroft, C. (2018). The potential for linked administrative data to provide household and family information. Stats NZ. www.stats.govt.nz.
Global Partnership for Sustainable Development Data. (2020). Collaborative on administrative data. Global Partnership for Sustainable Development Data. www.data4sdgs.org/initiatives/collaborative-administrative-data
Productivity Commission. (2013). Annual report 2012–13. Canberra: Productivity Commission.
Productivity Commission. (2024). A-PLIDA-nalysis: Using PLIDA for public policy research and reporting. Canberra: Productivity Commission. www.pc.gov.au/research/completed/plida
Weeks, J., Heaphy, B., & Donovan, C. (2001). Same sex intimacies: Families of choice and other life experiments. London: Routledge.
1 With funding from the 2023–24 Australian Public Sector Capability Reinvestment project.
2 Other relationships are captured by DSS, and specifically grandparent–grandchild relationships can be identified where relevant to payments. Only the partner and parent relationships were in scope for this project.
3 While each custodian of data (e.g. DSS, ATO, etc.) have their own unique person or client identifier in their datasets, the Person Linkage Spine (referred to here as SpineID) is a unique individual identifier that is universal across PLIDA datasets. It serves as a linkage mechanism that allows researchers to connect person-level records from different sources. The spine draws on Medicare, DOMINO and ATO data and is updated annually.
4 Dates are provided as month and year.
5 DSS records will be updated for those who do notify DSS of a change in their circumstances after cessation of payments.
6 ABS. (2021). Participation in the 2021 Census. Canberra: ABS. www.abs.gov.au/census/about-census/2021-census-overview/participation-2021-census
7 Relationships were assumed to be active based on start and end dates of the relationship. Once a client stops reporting to DSS, their relationship status in the relationship dataset remains ‘active’ at the last reported status.
8 Restricting the analysis to these family household types was done as these family household types were the focus of this research and readily comparable.
9 Another way this might have been done is through the application of graph theory, which would comprehensively identify all networks of relationship. This was not used as it is very computationally intensive.
© GettyImages/Dimple Bhati
978-1-76016-375-4
27 February 2025