Care time arrangements after parental separation
Latest trends
Overview
Although most children remain primarily in their mother's care post-separation, the proportion of children spending significant time with both parents has increased over recent decades (e.g. Weston et al., 2011). Smyth and Chisholm (2024) focused on shared care and found a modest rise in such arrangements among recently separated parents over the last 2 decades.1
This research adds to these reports by examining the trends in care time arrangements after parental separation using information on how many nights per year children of separated parents stay with each parent, as recorded in the child support administrative data.2 We explore trends in care time arrangements since 2015, including arrangements beyond shared care and differences by child age.
While care time arrangements are just one way of measuring parental involvement following parents' separation, they provide some indication of the extent to which children's care is shared or remains predominantly with one parent. Importantly, these care time arrangements are one of the elements that determine how much child support transfers from one parent to the other.
We suggest this report be read alongside our companion report on the changing nature of the Child Support Program (CSP) data (Qu & Baxter, 2026). Importantly, that report explores the decline in the size and changing age profile of the CSP population. We analyse the impact of this changing age profile on care patterns.
Key messages
- Most payers and payees in the Child Support Program (CSP) data had care arrangements where the mother had primary care or above primary care. At June 2024, almost 3 in 5 payees and payers had care arrangements where the mother had above primary care (i.e. care time of 87%-100% of nights per year). A further 1 in 5 had care arrangements where the mother had primary care (i.e. care time of 66%-86% of nights per year).
- About 1 in 7 payers/payees were in shared care arrangements (child spending 35%-65% of nights with
each parent). - Payers and payees with father primary and father above primary care arrangements (i.e. father care time of 66%-100% of nights) were the least common, applying to fewer than 1 in 10 payers and payees as at June 2024.
- From 2015 to 2024, there was a modest shift towards shared care, from a low base, and a reduction in mother above primary care. Father primary care and father above primary care changed little over this period.
- Care time arrangements varied by child age. Although primary care by mother was the most common for children in all age groups, this declined as children got older until age 10-11 years and then increased slightly again by age 15-17 years. Shared care increased with child age until 10-11 years and then declined as children got older.
- The CSP total population size declined from 2015 to 2024, with a shift in the age profile of children. Further analysis confirmed that overall care time trends remained after taking account of the changing age profile of the CSP data.
- Overall and after adjusting for changes in the age profile over time, these analyses confirm that within the CSP population there has been a modest shift toward shared care from 2015 to 2024 and a moderate reduction in care time arrangements where the mother had above primary care.
About the data
This report uses customised tables derived from the Child Support Evaluation Dataset (CSED), provided by the Australian Government Department of Social Services (DSS). This dataset is an extract of Child Support Program (CSP) data from the Services Australia Enterprise Data Warehouse. The analysis covers June 2015 to June 2024, with the focus on children up to 18 years. Some high-level analysis includes children aged 18 years and older (less than 1% of CSP children). See Appendix A for technical notes about the data.
There has been a notable decline in the number of separated parents registered with the Child Support Program over the period analysed. See the companion report on the changing coverage of the Child Support Program (Qu & Baxter, 2026) for an exploration of the changing nature of the data.
In the child support assessment formula in the CSP, the payers'/payees' care for children is classified under 5 categories:
- Below regular care (0-51 nights per year, 0%-13%)
- Regular care (52-127 nights per year, 14%-34%)
- Share care (128-237 nights per year, 35%-65%)
- Primary care (238-313 nights per year, 66%-86%)
- Above primary care (314-365 nights per year, 87%-100%).
(See CSP, Services Australia for details).
When applying these care time categories to payees or payers of child support, it is possible for payees/payers to be in more than one category if they have children with different care time arrangements. These categories are therefore not mutually exclusive when grouping payers and payees.
Information on the gender of payers and payees is used with the care time arrangements data to derive the following 5 broad categories (and with more detail about shared care), which are used for the analysis in this report. For simplicity, male payers/payees are referred to as fathers and female payers/payees as mothers.
- Mother above primary care (87%-100% of nights with mother, 0-13% of nights with father)
- Mother primary care (66%-86% of nights with mother, 14%-34% nights with father)
- Shared care (35%-65% of nights with each parent):
- Shared care: mother more time (53%-65% of nights)
- Shared care: equal time (48%-52% of nights with each parent)
- Shared care: father more time (53%-65% of nights)
- Father primary care (14%-34% of nights with mother, 66%-86% of nights with father)
- Father above primary care (0%-13% of nights with mother, 87%-100% of nights with father).
Almost all payers and payees are parents. Although uncommon, child support cases may involve non-parent carers (e.g. grandparents).3 Gender was not recorded for a small number of payers and payees; this is treated as a separate category.
Care time arrangements can be reported according to the payee or payer data, with a child support case including a payee, a payer and the children covered by the child support. The overall patterns are consistent from payee and payer perspectives, and so for ease of reading, the payee data have been used to describe these patterns. The equivalent data from the payer perspective are provided in Appendix B. We note that the total number of payees and payers is not the same as the number of child support cases, as a payee and payer may be involved in more than one case. The payee numbers, for example, are slightly lower than case numbers because a payee may be involved in multiple child support cases and considered as one payee.
Some of the analysis uses the child-level data instead, using children of payees, so that care time arrangements for children in different age groups can be examined. When analysing these child-level data, the categories are generally mutually exclusive (in very rare instances a child may be in more than one category, see Appendix A).
Limitations
There are 2 significant limitations to this work. One is that the CSP population does not include all separated parents. Some separated parents with children aged under 18 years do not register with the CSP. Parents registered with the CSP may differ from those who are not, and this may include their having different patterns of care time arrangements. We discuss this further in the changing coverage report (Qu & Baxter, 2026).
The other limitation is that we are using administrative data for this analysis. These data may not always accurately reflect care time arrangements in reality. For instance, parents may not always update changes in care arrangements if the changes in care level do not impact on the child support formula. It is also worth noting that some parents may not proceed with reporting changes affecting child support assessments, including changes in care time arrangements, for various reasons such as safety concerns, minimal or no impacts on child support payment, complicated processes and avoiding care time disputes (Cook et al., 2019). Additionally, there can be delays in the timeliness of administrative processes after the reporting of any changes.
Overall trends in care time arrangements
Figure 1 shows the proportion of payees in each of the care time categories from June 2015 to June 2024.
Figure 1: The proportion of payees in the care category of mother above primary care has declined and the proportion in shared time has slightly increased
Proportion of payees in different care-time arrangements, June 2015-June 2024
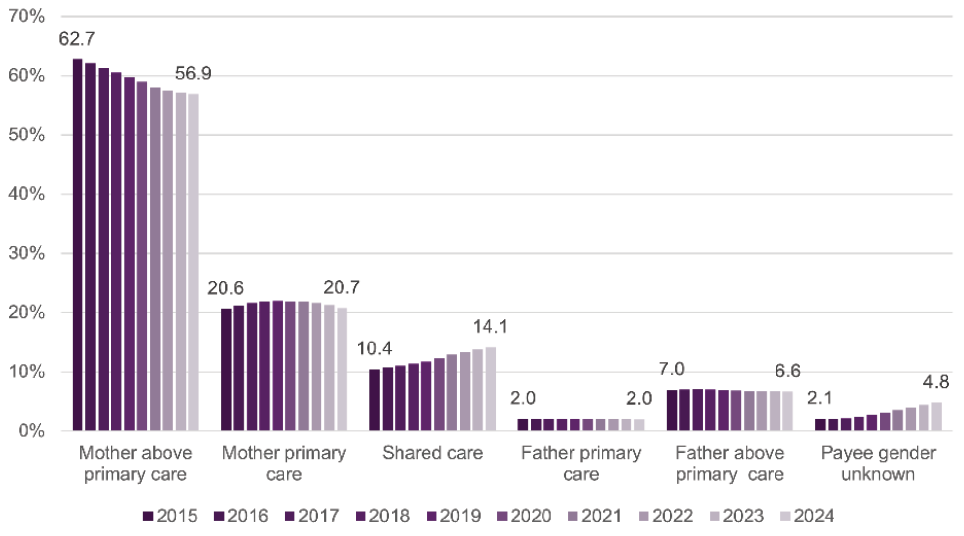
Notes: Care time categories are not mutually exclusive as a payee may have children in different care categories. The percentages can therefore add to more than 100%. The denominator (the number of payees) includes those without a care amount. CSP children include small numbers of children aged 18+. See Appendix A for more technical information.
Source: CSED customised tables
- The most common care time category was mother above primary care. In June 2024, 57% of payees had the care time arrangements where the mother had above primary care.
- The second most common care time category was mother primary care, with just over one-fifth of payees (21%) who had children in this category.
- Categories of father primary care and above primary care were much less common (2% and 7% of payees respectively).
- Shared care time was more common than father primary care or father above primary care, with 14% of payees having children in shared care time.
As noted above, these categories are not mutually exclusive as payees can appear in more than one category if they have different care time arrangements for different children.4 The equivalent payer data are shown in Figure A1 in Appendix B.
Figure 1 shows how patterns of care time arrangements for payees changed over the 9-year period from June 2015 to June 2024. The trend indicated a modest shift towards shared care and away from mother above primary care.
- The proportion of payees with children in shared care time trended up from 10% in June 2015 to 14% in June 2024.
- The percentage with mother above primary care (i.e. father below regular care) declined during the period by 6 percentage points, from 63% in June 2015 to 57% in June 2024.
- The trends from the perspective of payer data are the same as those described above.
Figure 2: The proportion of payees with children in equal time care has increased
Proportion of payees in different shared care time categories, June 2015-June 2024
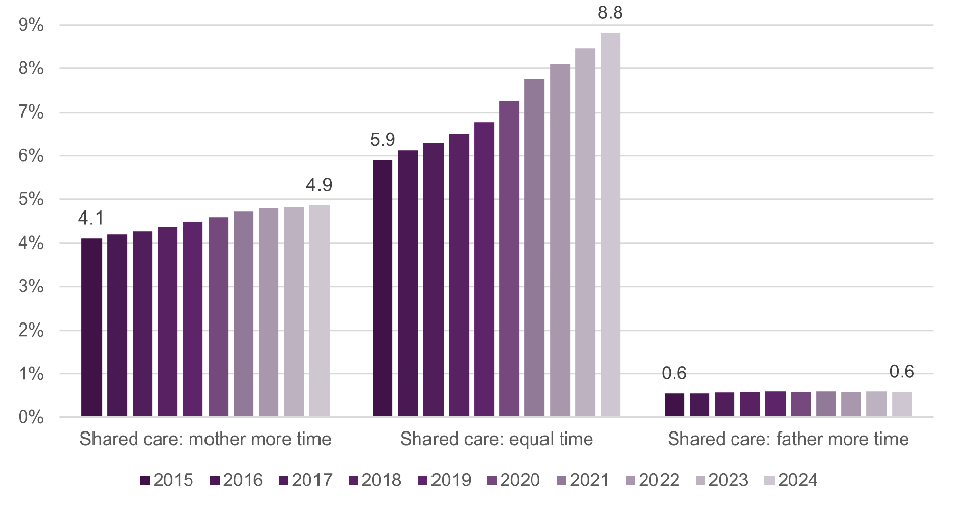
Note: See notes for Figure 1.
Source: CSED customised tables
Figure 2 divides shared care time into 3 categories: those with the mother having more care time (53%-65% of nights annually); those with equal time (48%-52% of nights annually with each parent); and those with the father having more care time (53%-65% of nights annually). The 3 categories do not add to the total percentage in shared care, as payees can be in multiple categories if they have different care time arrangements for different children.
- Across the 3 categories, equal time was most common, follow by shared care with the mother having more time.
- In June 2024, 9% of payees had children in equal time. This compares to 5% of all payees having children in shared care where the mother had more care time. Shared care with the father having more time was the least common of the 3 shared care time categories (less than 1% of payees).
- From 2015-2024 there was a notable increase in the proportion with children in equal care time, and slight increase in the proportion with children in shared care time where the mother had more time. In contrast, the proportion with children in shared care time where the father had more time remained stable.
The same findings were apparent from the payer perspective (see Figure A2 in Appendix B).
The data cover the years of the COVID-19 pandemic, which caused many significant disruptions. However, Figure 1 does not show any apparent spikes regarding changes in the patterns of care time arrangements among payees from immediately before COVID-19 (2018-19) to the COVID-19 pandemic period (i.e. 2020-21) and post this period. With these data being the arrangements according to the CSED, the lack of change associated with COVID-19 does not necessarily mean there was no change in care time during this period.
Some parents may have changed their arrangements without having formally sought changes in their child support assessment. For example, some may have changed arrangements temporarily when children were prevented from staying with one parent due to border closures or restrictions on movement. Smyth and Chisolm (2024) found that the proportion of separated parents who were new entrants to CSP and who were in shared care increased during the COVID-19 pandemic. Also refer to analysis of changing care time arrangements using Household Income and Labour Dynamics in Australia (HILDA) data by Wilkins et al. (2024).5
Care time arrangements by child age
It is expected that care time arrangements will vary by child age (Weston et al., 2011). This section uses child-level data (using data on children of payees) to explore age variation at June 2024. The overall care time patterns are similar to those obtained from the payee level data.
According to the June 2024 child-level data overall for children of payees:
- 55.4% were in the mother above primary care category (compared to 56.9% of payees being in this category).
- 19.1% were in the mother primary care category (compared to 20.7% of payees).
- 13.2% were in the shared care category (compared to 14.1% of payees).
- 1.6% were in the father primary care category (compared to 2.0% of payees).
- 5.6% were in the father primary care category (compared to 6.6% of payees).
- Another 4.8% had unknown parent gender (the same as the payee distribution).
As explained in the data section, the percentages for payees are not mutually exclusive, so add to more than 100.0%.
Figure 3a shows the June 2024 distribution of care time arrangements by child age. These data focus on children aged 0-17 years.
- The percentage of mother above primary care declined with increasing child age, from 71% for 0-2 years to 51% for 10-11 years. The percentage then rose to 57% for the oldest age group of 15-17 years.
- The proportion of children in mother primary care rose from 12% for children aged 0-2 years to 22% for children aged 10-11 years. It fell to 17% for children aged 15-17 years.
- The proportion of children in shared care time rose with child age from 5% for the youngest age group to 16% for 10-11 year olds, and then fell to 12% for the 15-17 years age group. These age-related patterns also applied to each of the detailed shared care time subcategories (see Figure 3b).
- Father above primary care and father primary care both increased with child age, such that the highest proportions were at ages 15-17 years (8% and 2% respectively).
- Where it could not be determined which parent had primary or above primary care was the highest for the youngest group. It is likely that these children were typically cared for by their mothers.
These patterns are consistent with previous AIFS research (Weston et al., 2011).
Figure 3: Shared time increased with child's age for age groups under 12 years
a. Care time arrangements by child age, children of payees, June 2024
b. Detailed shared care time categories by child age, children of payees, June 2024
Notes: The denominator includes those whose care amount was missing. In Figure 3a, the care categories may not sum to 100% and in Figure 3b the care categories may not sum to the total percentage in shared care.
Source: CSED customised tables
Figure 4 explores care time arrangements by child age in June 2015 and June 2024. The first chart focuses on the broad care time categories (Figure 4a) and the second shows the 3 shared care time subcategories (Figure 4b). As before, the children of payee data have been used for this analysis.
From 2015 to 2024, the increase in shared care time and decline in mother above primary care (father below regular care) were trends common to all age groups.
- Across all child age groups, the proportion with mothers above primary care declined over time. This trend was less apparent for the age groups 5-9 years and 10-11 years compared to the younger and older age groups.
- The proportion in shared care time increased for all the age groups, with the second chart (Figure 4b) showing that the rise was mainly in the equal time subcategory.
- The changes in the proportions of children in the care time categories father primary or above primary care for all children's age groups were very small, although the data suggest a slight downward trend.
For clarity, only 2 time points are shown in Figure 4. The care time arrangements by child age for each of the 9 years from 2015 to 2024 are shown in Figure A3 in Appendix B.
Figure 4: There has been a rise in shared time and a decline in mother above primary care for children in all age groups
a. Care time arrangements by child age, children of payees, June 2015 and June 2024
b. Detailed shared care time categories by child age, June 2015 and June 2024
Notes: All children include those aged 18+. See notes for Figure 3.
Source: CSED customised tables
Overall trends adjusting for age differences
The report on the changing CSP coverage (Qu & Baxter, 2026) shows that the number of CSP cases has declined over this period, and as the CSP population has declined, the age of profile of children in the CSP has shifted. The number of children aged under 10 years has fallen while the numbers in older age groups have remained stable. For example, the proportion of CSP children aged 0-2 years declined from 7.9% in June 2015 to 5.5% in June 2024, while the proportion of children aged 10-17 years increased from 54.6% to 60.7%. In light of this shift, and that there are marked differences in care arrangements for children in different age groups, it is important to consider whether the changing age profile of children in the CSP population has contributed to the overall care time trends (shown in Figure 1).
A simple way of taking account of the change to the age profile is to recalculate what the overall care time arrangement distribution would look like in 2024 if the age profile of CSP children was the same as it was in 2015. For this, we used the age-specific care time arrangements for June 2015 and June 2024 (as shown in Figure 4) and computed the distribution of care time as if there was no difference in the child age profile at the 2 times.
Figure 5 shows that:
- Before taking account of any changes to the composition, there was a 3.5 percentage point increase in the shared time category, from 9.7% to 13.2% for all children of payees. If changes in the distribution of children's age are taken into account, this difference reduces slightly to 3.2 percentage points, with the age-adjusted percentage for 2024 being 12.9%. That is, the overall increase in shared time is largely due to changes in the age-specific shared care rates. The change in the age profile of CSP children made a marginal difference.
- Before taking account of compositional change, there was a reduction in the percentage with mother above primary care, from 60.8% to 55.4% for CSP children, a difference of 5.4 percentage points. After adjusting for the distribution by child age, this difference was 4.9 percentage points, with the age-adjusted percentage for 2024 being 55.9%. So again, the change in the age distribution of children only marginally contributes to the change in this care time category.
Overall, these analyses confirm that within the CSP population there has been a very modest shift toward shared care and a moderate reduction in mother above primary care.
Figure 5: Adjusting for changes in the distribution by child age composition makes little difference to care time distributions
Decomposition of change in care time arrangement distributions for children of payees between June 2015 and June 2022, adjusting for the distribution of children of payees by child age composition
Notes: CSP children include small numbers of children aged 18+. Children with missing care category are included when calculating the age-specific rate of care time arrangements. Also see notes for Figure 3.
Source: CSED customised tables
Summary
Drawing on the Child Support Program administrative data, this report presents the latest trends in care time arrangements based on the population of child support payers and payees, focusing on a 9-year time frame from 2015 to 2024. The analysis demonstrates subtle shifts in care arrangements, with a modest increase in shared care time, and a decline in mother above primary care time.
The analysis shows that the most common care time category was mother above primary care, applying to almost 3 in 5 payees between June 2015 and June 2024. The second most common category was that of mother primary care, with one-fifth of payees in this category. A further 10%-15% were in shared care time. Data in Appendix B confirm the findings were the same if analysed from the payers' perspective.
Care time arrangements varied by child age, with primary care by mother declining as children got older. Shared care increased with child age until 10-11 years and then declined among older children. Father primary care and father above primary care continued to increase with child age, although from a lower base.
Patterns of care time arrangements changed between June 2015 and June 2024. Shared care time increased in a gradual but consistent manner, although from a low base. These trends were apparent for children in all age groups. The proportion of children who were in mother above primary care declined over this period, with this change applying to children in all age groups.
Only a small proportion of children were with their father as primary care or above primary care time, and this pattern remained largely unchanged from 2015 to 2024 regardless of the children's age.
The changing care time patterns remained apparent after taking account of the changes in the child age profile.
References
Kaspiew, R., Carson, R., Dunstan, J., De Maio, J., Moore, S., Moloney, L. et al. (2015). Experiences of Separated Parents Study (Evaluation of the 2012 Family Violence Amendments). Melbourne: Australian Institute of Family Studies.
Cook, K., Goodall, Z., McLaren, J. & Edwards, T. (2019). Debts and disappointment: Mothers' experiences of the child support system. Melbourne: Swinburne University of Technology.
Qu, L., & Baxter, J. (2026). The changing coverage of the Child Support Program and implications for research about separated parents. Melbourne: Australian Institute of Family Studies.
Smyth, B. M., & Chisolm, R. (2024). Shared-time parenting after separation in Australia: How much does the law matter? Family Transition. doi: 10.1080/28375300.2024.2425469
Weston, R., Qu, L., Gray, M., Kaspiew, R., Moloney, L., Hand, K., & the Family Law Evaluation Team (2011). Care-time arrangements after the 2006 reforms: Implications for children and their parents. Family Matters, 86, 19-32.
Wilkins, R., Vera-Toscano, E. & Botha, F. (2024) The Household, Income and Labour Dynamics in Australia survey: Selected findings from Waves 1 to 21. Melbourne Institute: Applied Economic & Social Research, the University of Melbourne.
Appendix A: Technical notes about the data
Child support administrative data
Most separated parents (including never partnered parents) with children under the age of 18 years are registered with the Child Support Program (CSP). However, over time, the number of children registered in the CSP has declined. Qu and Baxter (2026) on the changing coverage of the CSP has further analysis of the dataset and its changing composition.
This paper is based on customised tables derived from the Child Support Evaluation Database (CSED), which is an extract of CSP data from the Services Australia Enterprise Data Warehouse. Some key methodological points about the data used for the analyses are described below.
Care time categories for payers and payees
Care time categories from the perspective of payers and payees refer to counts of either payers or payees with CSP children in different care time categories. A payer or payee may appear in multiple care time categories if they have CSP children in those care time categories. A payer or payee may be involved in more than one child support case. A child support case refers to one payer and one payee for the eligible child or children. Typically, a child support case involves a mother, a father and their children.
Payers/payees and separated parents
Payers and payees are not necessarily separated parents. A small number of cases may involve non-parent carers (e.g. grandparents or other carers). This report is interested in care time by parents' gender (e.g. mother primary care, father primary care). When mother or father is referred to in a care time category, mothers include other female carers and fathers include other male carers.
Care time categories for CSP children
When considering care time categories from the perspective of CSP children, the analysis is based on CSP children of payees. In very rare instances, one child may be involved with multiple payees and in multiple care time categories, in which case the child would appear in each of the categories (i.e. counted more than once).
Age of eligible CSP children
Child support payments generally stop when the child turns 18 years. However, a small number of cases involve children aged 18 years and over as child support may extend beyond 18 years in limited circumstances. For example, it may continue until the end of the secondary school year if the child is 18 and in full-time secondary education. These instances were included in the depiction of overall care time arrangements (e.g. for all payers/payees, for all children) and table/figure notes indicate whether they were included or excluded.
Appendix B: Additional analyses
Figure A1: There has been a rise in shared time care and a decline in mother above primary care for children in all age groups
Proportion of payers in different care time arrangements, June 2015-June 2024
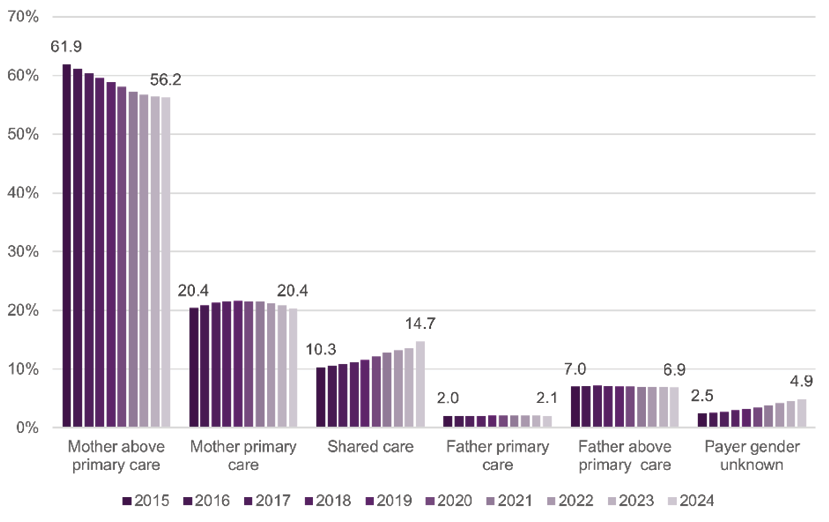
Notes: See notes for Figure 3.
Source: CSED customised tables
Figure A2: The proportion of payers with children in equal time has increased
Proportion of payers in different shared care-time categories, June 2015-June 2024
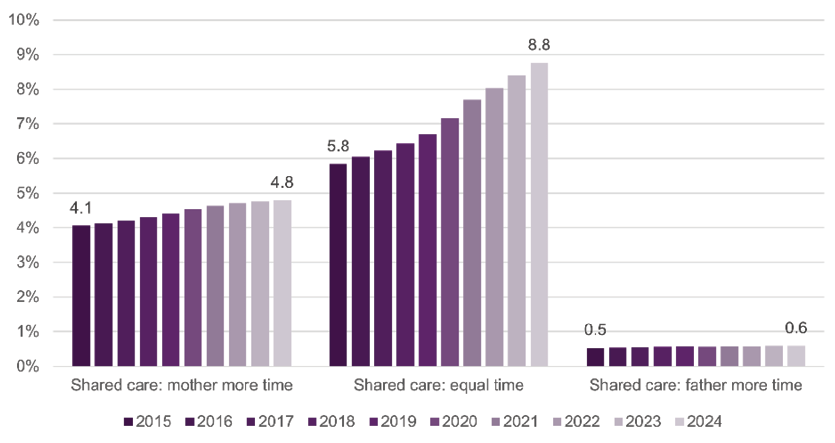
Note: See notes for Figure 3.
Source: CSED customised tables
Figure A3: There has been a rise in shared time for children in all age groups
a. Care time arrangements by child age, children of payees, June 2015-June 2024
b. Detailed shared care time categories by child age, children of payees, June 2015-June 2024
Note: See notes for Figure 3.
Source: CSED customised tables
1 The study used the data of parents who were new entrants to the Australian Child Support Agency, later known as Child Support Program under Services Australia.
2 We refer to parents involved with the Child Support Program as separated parents throughout the paper as most cases involve separated parents. However, the scheme also includes parents that were never partnered or in a relationship and those who were not partnered at the birth of the child. A small number of cases involve non-parental carers. Kaspiew and colleagues (2015) found that 2%-3% of separated parents had never lived together or separated before the reference child was born.
3 Although the extent of child support cases involving non-parent carers is unclear, the census data suggest it is uncommon. Author calculations using the 2021 Census data in TableBuilder found that 2% of children aged 0-17 years who were not living with both parents were living with grandparents only.
4 The analysis in this paper is based on aggregated data, and it is not possible to identify individual parents who had children in different care categories. However, between 2015 and 2024, the counts of care time categories exceeded the number of payees by 4.9%-5.2%. Given that a payee may have children in 2 or more categories. The proportion of payees in more than one care time category is likely smaller than this range.
5 Analysis of the HILDA data by Wilkins et al. (2024) explores changes in care time arrangements, although the approach varies to this analysis of CSP data. The HILDA analysis shows that the proportion of youngest children aged 0-17 years from separated families who spent 3 or more nights per week with non-major-care parents was the same between 2019 and 2020 (at 22%) and increased to 26% in 2021, while the proportion of children who did not have any overnight stay with the non-major-care parent declined from 36% in 2019 to 34% in 2021. Children who spend less than one night per week remained stable (12% in both 2019 and 2021). The COVID-19 pandemic had greater impact on care-time arrangements for children aged under 5 than for older children, with the proportion having no nights with the non-major-care parents having increased for children under 5 but decreased for older children.
Acknowledgements
The Australian Institute of Family Studies (AIFS) acknowledges and thanks the Performance and Evaluation Branch of the Australian Government Department of Social Services (DSS) who provided the customised tables from the Child Support Evaluation Database for the purposes of this research. We also thank the Families and Payment Support Branch for their helpful comments on earlier versions of this report.
Views expressed and findings reported in this publication may not reflect those of the DSS.
Cover images: © gettyimages/zeljkosantrac (L); © gettyimages/pointstudio (R)
Suggested citation
Qu, L., & Baxter, J. (2026). Care time arrangements after parental separation: Latest trends. Melbourne: Australian Institute of Family Studies
978-1-76016-433-1
8 April 2026
