Population and households
You are in an archived section of the AIFS website
Population growth
By September 2017, Australia’s population had reached 24.70 million. In 1901, the population was 3.77 million.
Ageing
In 1901, 35% of the population were under 15 years of age. In 2015 that percentage had declined to 19%. By contrast, in 1901 only 4% of the population was 65 years and older; by 2015 that had grown to 15%.
Proportions of population aged 0–14 years and 65 years and over, 1901–2017
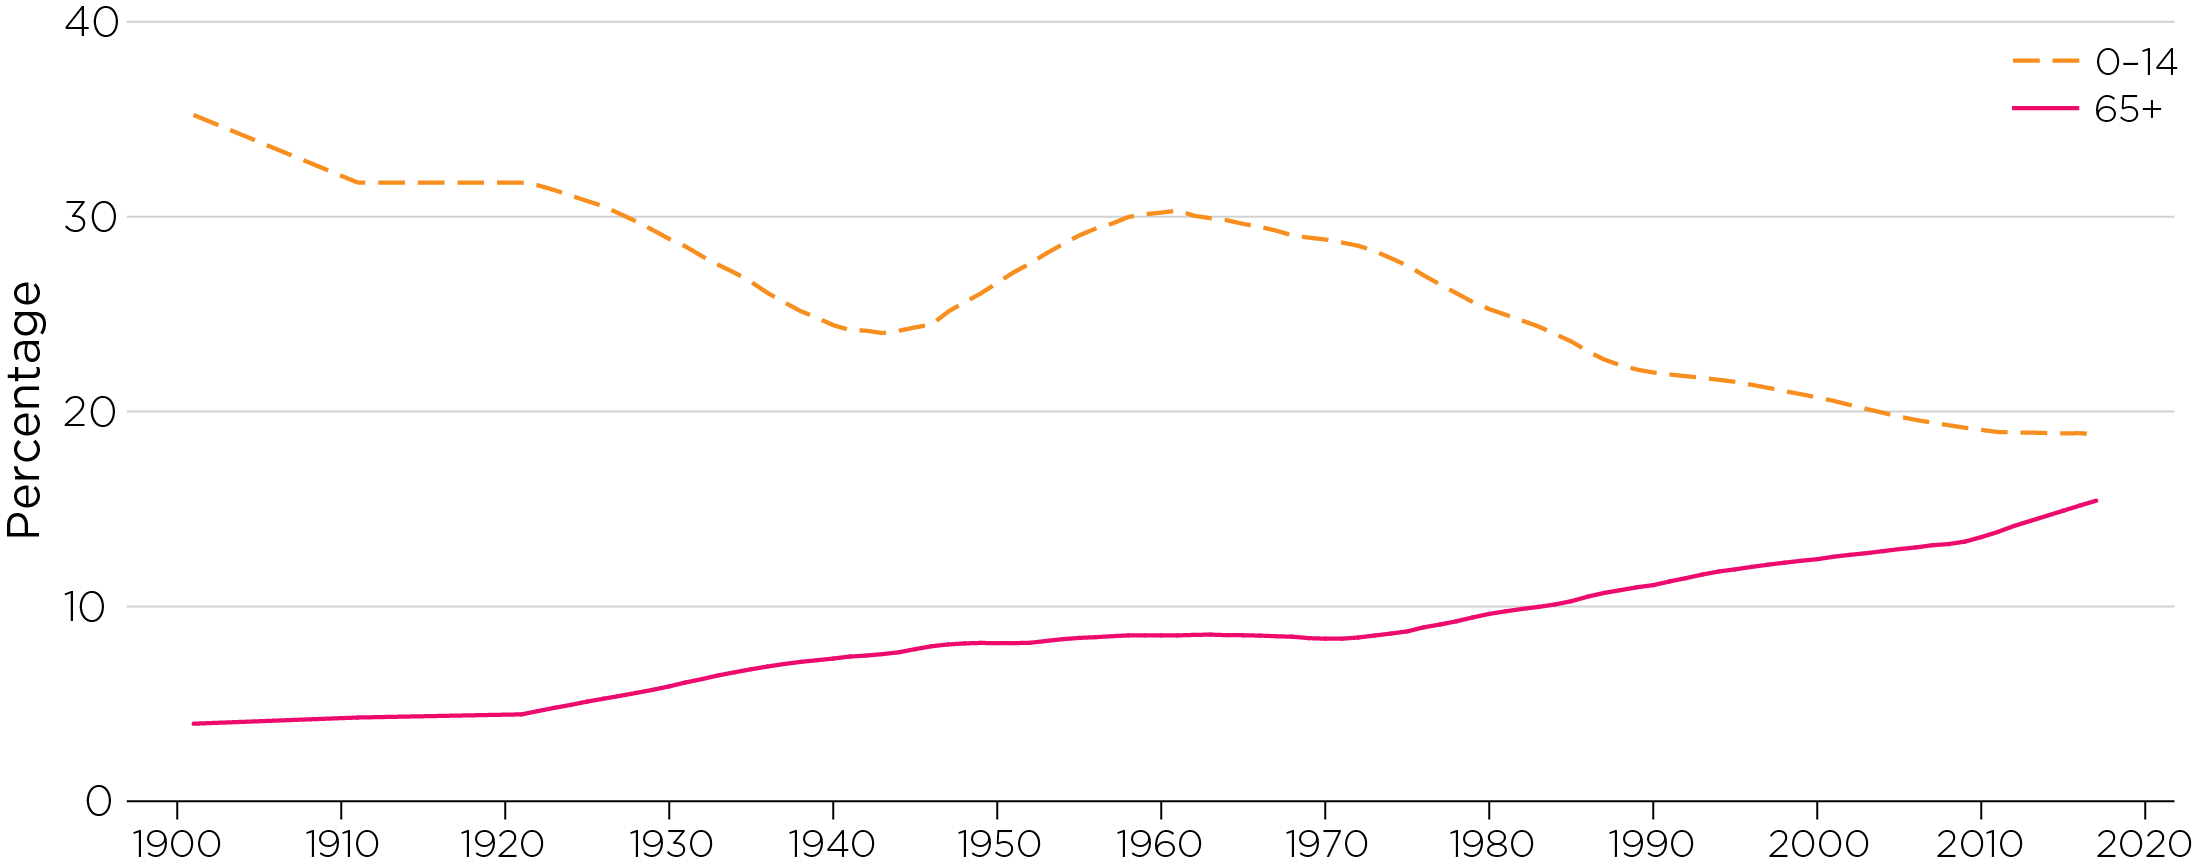
Data sources: ABS (2014) Australian historical population statistics 2014 ‘Table 2. Population Age-Sex Structure’ (Cat no. 3105.64.001). Data extracted on 03 Apr 2018 11:18 UTC (GMT) from ABS.Stat © Commonwealth of Australia. Creative Commons Attribution 2.5 Australia (https://creativecommons.org/licenses/by/2.5/au)
Changing households
The proportion of family households has been declining. In 2016, families made up 71% of Australia’s households; in 1986 it was 77%. Over this same period, the number of single-person households increased from 19% to 24%.
Households are getting smaller. In 1911, the average number of people per household was 4.5. By 2016, that number had fallen to 2.6.
Average household size, 1911–2016
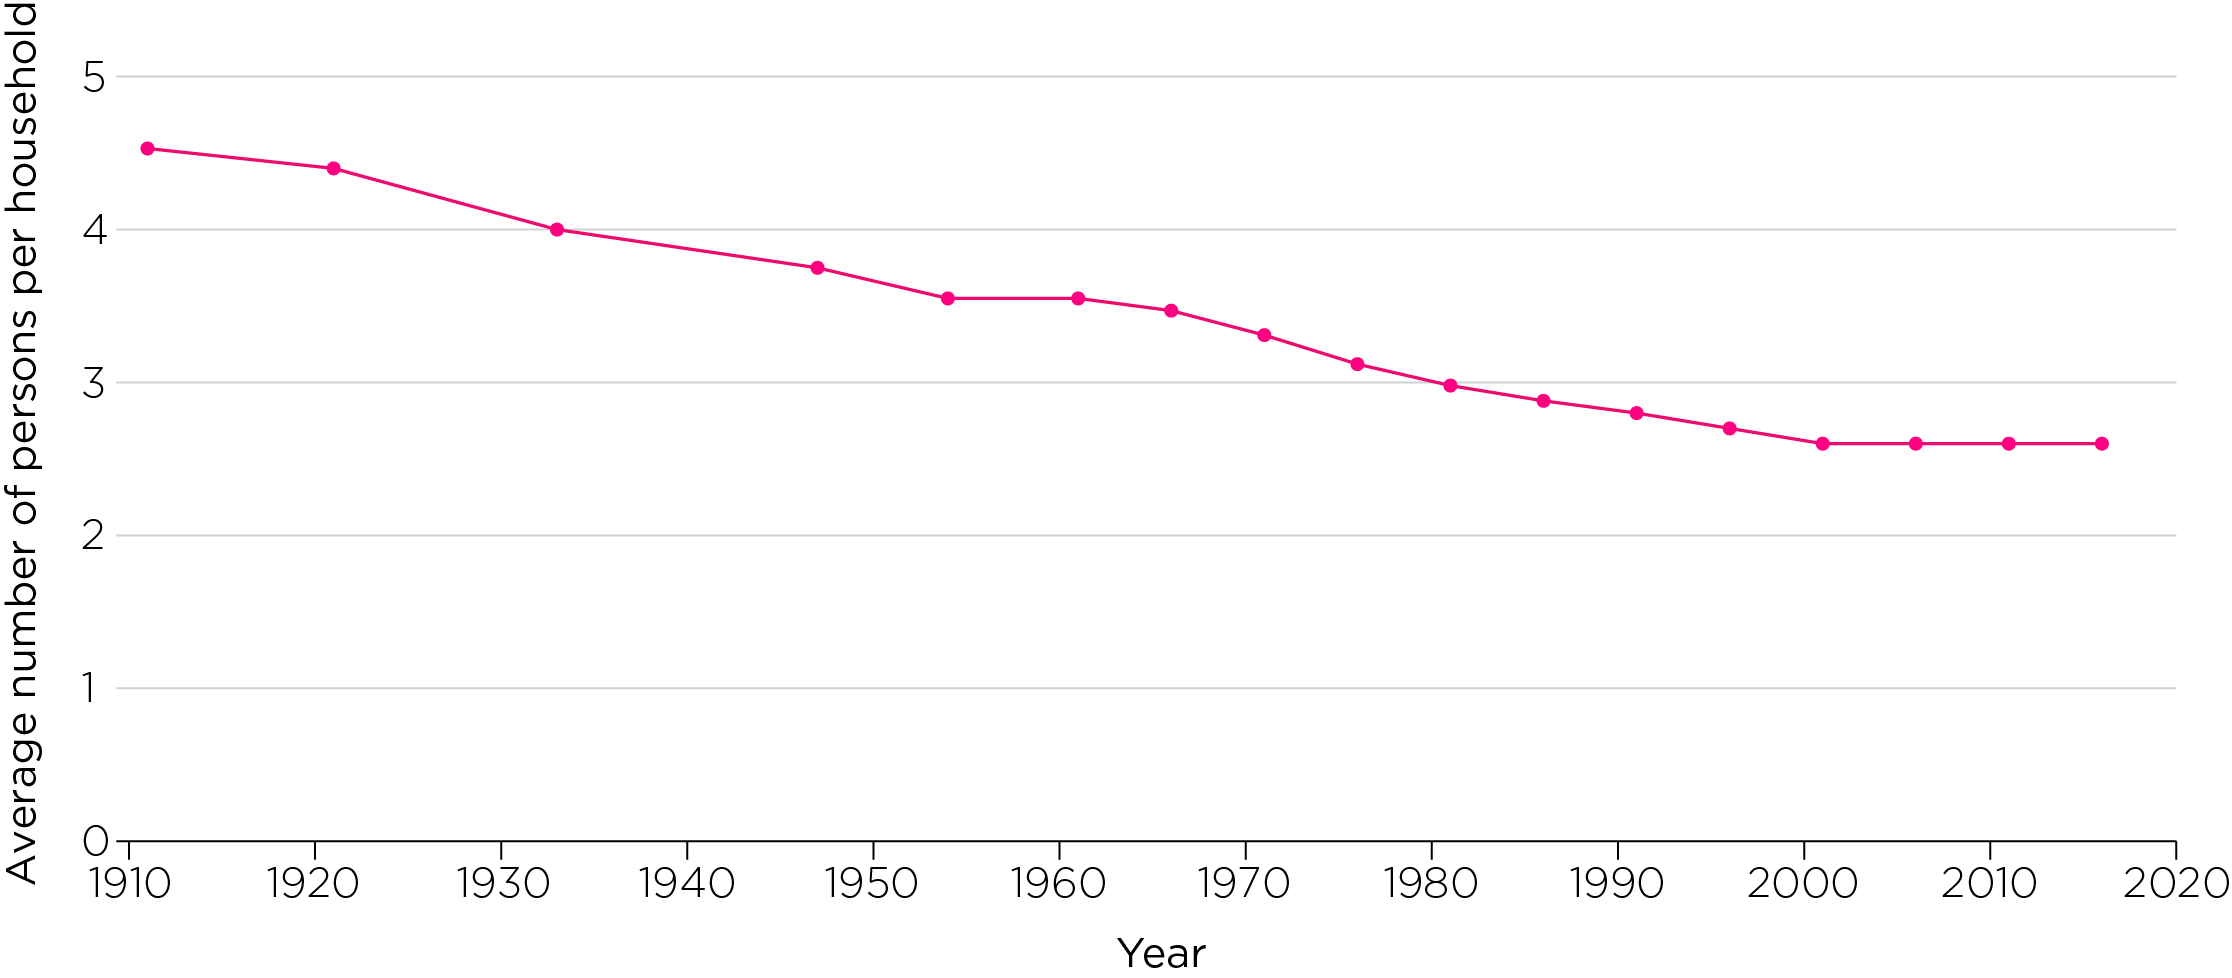
Sources: Hugo, G. (2001). A century of population change in Australia (ABS – Yearbook 2001 Australia (Catalogue no. 1301.0)).
ABS 2011 & 2016 Censuses – Time series Profile (Census No. 2003.0)
Families with and without children
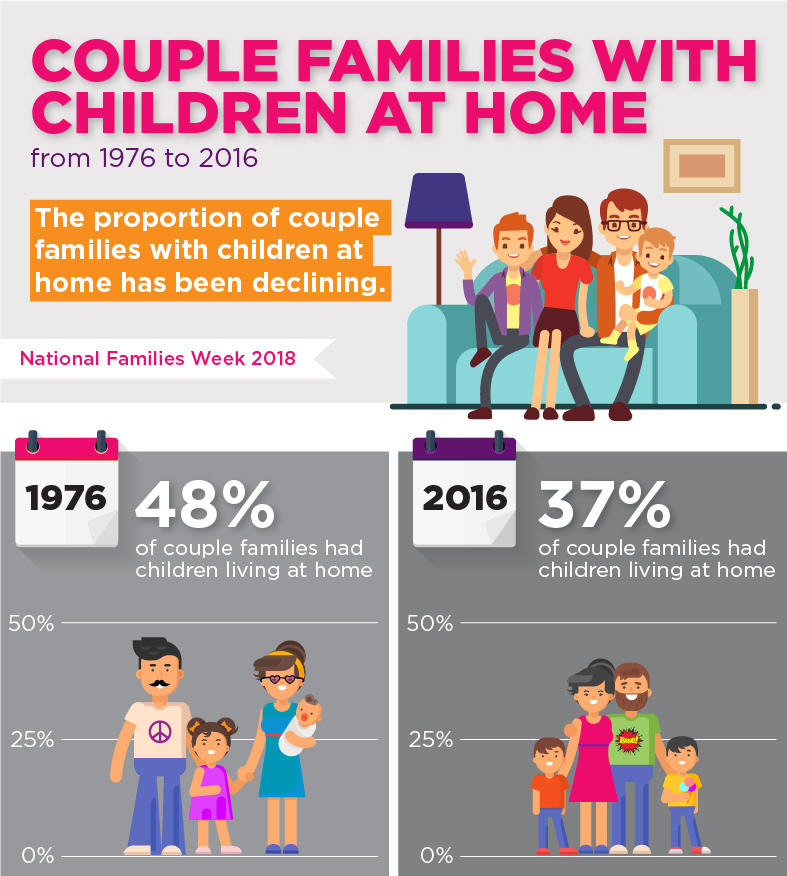
From 1976 to 2016, the proportion of couple families with children at home has been declining. In 1976, couple families with children made up nearly half of families (48%). By 2016, this had gone down to a little over a third of families (37%).
Meanwhile, couples with children are having fewer children. In 1961 the fertility rate was 3.55; in 2012 it had fallen to 1.93. At the same time, the percentage of couples without children has increased from 28% in 1976 to 38% in 2016.
Single-parent families have also increased – from 6.5% of families in 1976, to 10.2% in 2016.
Extended households
According to the 2016 Census, 8.3% of households contained extended family members; that is, couple (with or without children) or one-parent families living with other relatives (e.g. parents, grandparents, uncles/aunts, etc.).
Extended family households often involved one family unit with older parents (or grandparents). Extended households are more common among Indigenous households and some immigrant households (e.g. from the Asian region).
Family type, 1976–2011
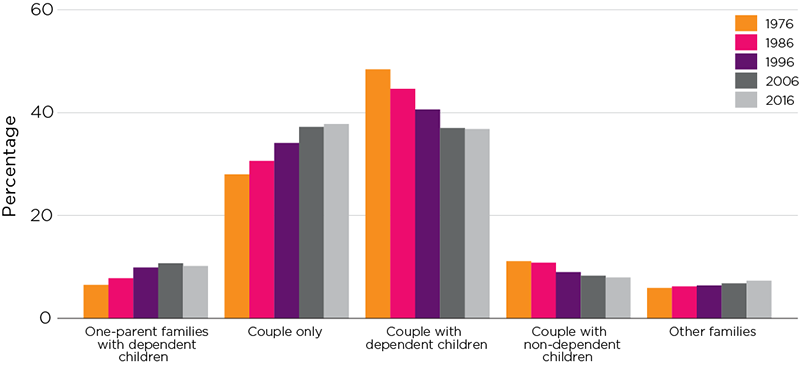
Note: Other families include extended families one-parent families with non-dependent children.
Sources: ABS 1976–2016 Censuses
References
Australian Bureau of Statistics (ABS). (2014). Australian historical population statistics 2014. (Cat no. 3105.64.001). Canberra: ABS.
ABS. (2017). 2016 Census of population and housing: General community profile, Australia (Cat no. 2001.0). Canberra: ABS. Retrieved from <www.censusdata.abs.gov.au/census_services/getproduct/census/2016/communityprofile/036?opendocument>.
8 May 2018