Australian households and families
You are in an archived section of the AIFS website
Overview
This facts sheet looks at the major changes in Australian families since 1976. It covers information about trends in Australian family household types, including single parent and same sex couple families. It is a comprehensive picture of the changing nature of Australian family life over the last four decades.
Key messages
-
From 1911 to 2011, the number of Australian households increased from 894,000 to nearly 7,760,000. In 2011, there were 5.68 million families.
-
Nearly three-quarters of all households are family households (72%), about one-quarter are single person households (24%), and 4% are households consisting of unrelated people.
-
Of all families, couple-only (38%) and couples with dependent children (37%) were the most common family forms in 2011. Eleven percent were single parent families with dependent children and 8% were couple families with non-dependent children.
-
The greatest changes have been with couple-only families compared to couples with dependent children. In 1976, couple families with dependent children predominated (48%), while only 28% were couple-only families. In 2011, these two family types were equally common.
-
The proportion of single parent families has increased (22% in 2011 up from 19% in 1996), but they remain a small percentage of all families (11% in 2011).
Introduction
The size of Australian households and the forms they take have changed in profound ways across the years. These trends result from the interaction of many factors; for example, the increasing size and ageing of the population, along with an extended period of "healthy ageing"; technological advances; immigration patterns and cultural changes; economic shifts and the changing financial capacities of families; delays in milestones that most people experience in the course of their lives (such as leaving home, marrying and having children); changes in fertility; increased instability of relationships; increased family mobility and dispersion; and the increasing participation of women in the workforce.
This facts sheet outlines the extent and nature of various changes that have been occurring in households in Australia, with particular attention given to households consisting of families of different forms. An understanding of these changes is an important policy issue, given that lifestyles, needs and resources are affected by the circumstances of living alone or with others, in a family or non-family setting. Such changes may have wide repercussions extending not only to immediate family members living elsewhere, but also to neighbourhoods and communities.
What is a family?
Given that this facts sheet uses Census data extensively, many of the analyses adopt the following definition of "families" (or more precisely "household families"), which is used by the Australian Bureau of Statistics (ABS) for statistical purposes:
Two or more persons, one of whom is at least 15 years of age, who are related by blood, marriage (registered or de facto), adoption, step or fostering; and who are usually resident in the same household. The basis of a family is formed by identifying the presence of a couple relationship, lone parent-child relationship or other blood relationship. Some households will, therefore, contain more than one family. (ABS, 2005b, para. 21)
Under this "household family" definition, families may comprise: couples with or without co-resident children of any age; single parents with co-resident children of any age; grandparents caring for grandchildren; and other families of related adults, such as brothers or sisters living together, where no couple or parent-child relationship exists (although this excludes relatives beyond first cousins).
However, it is important to keep in mind that the concept of "family" is neither unitary nor unchanging. It involves the drawing of boundaries delineating "who is in" and "who is out", with the boundaries changing as individuals move through their life course. The boundaries drawn by analysts and policy-makers vary according to the purpose behind their focus on families, and even members of the same household may hold different ideas about whether a particular co-resident is a member of their "family". This may arise, for example, when a parent re-partners. Virtually all people also have family members who are spread across households and communities.1 Grandparents, for instance, are very likely to see their adult children and grandchildren as "family", even if separated by vast distances, and also probably include their own siblings and wider kin in this extended sense of family. The two households formed in the process of parental separation is another clear example of families crossing household boundaries. Defining Indigenous family boundaries is particularly challenging, for some Indigenous communities adopt kinship terminology that differs from each other and from that used in the "Anglo-Celtic" system (Morphy, 2006). Especially in remote areas, households comprising Indigenous people tend to be complex and fluid in their composition, with kinship networks overlapping, and adults and children often moving between households (see ABS & Australian Institute of Health and Welfare [AIHW], 2011).
1 The ABS, of course, recognises the fact that families cross household boundaries, and points out that: (a) the concept of "family" to those living outside a household would lead to "double counting" of some individuals; and (b) some of the ABS surveys (e.g., the General Social Survey and Family Characteristics Survey) take account of exchanges of support between relatives who do not reside within the same household.
Households and basic family forms
Across the last 100 years, from 1911 to 2011, Australia has experienced a five-fold increase in its population, from 4.5 million to 22.3 million.2 Over this time, the number of households increased more than eight-fold, from 894,000 to nearly 7,760,000.3 In total, the average number of persons in a private dwelling fell from 4.5 to 2.6 (Hugo, 2001; ABS, 2012a).
Households tend to be classified in a hierarchical form, with the three broadest classifications being families, those living alone ("lone-person households"), and groups of unrelated individuals living together ("group households") (see Box 1 for detailed definitions). In addition, most households contain families, including couples with or without children, one-parent families, and households comprising other types of relatives (e.g., adult siblings).
Box 1: Definitions of households and family forms
Definitions of households
Household
A household is defined by the ABS as "one or more persons, at least one of whom is at least 15 years of age, usually resident in the same private dwelling.
"Under this definition, all occupants of a dwelling form a household and complete one form.
"Therefore, for Census purposes, the total number of households is equal to the total number of occupied private dwellings as a Census form is completed for each household from which dwelling information for the household is obtained."
Family household
"A family is defined by the ABS as two or more persons, one of whom is at least 15 years of age, who are related by blood, marriage (registered or de facto), adoption, step or fostering, and who are usually resident in the same household.
"Each separately identified couple relationship, lone parent-child relationship or other blood relationship forms the basis of a family. Some households contain more than one family.
"Non-related persons living in the same household are not counted as family members (unless under 15 years of age).
"Other related individuals (brothers, sisters, aunts, uncles) may be present in the household. If more than one family is present these people can only be associated with the primary family."
The "family" is sometimes referred to by the ABS as the "household family", "as a way of distinguishing it from extended family networks which are not bounded by a single dwelling" (ABS, 2005b, para. 14).
Lone-person household
According to the ABS, a lone-person household is "any private dwelling in which there is only one usual resident at least 15 years of age, is classified as being a lone person household".
Group household
"The ABS defines a group household as a household consisting of two or more unrelated people where all persons are aged 15 years and over. There are no reported couple relationships, parent-child relationships or other blood relationships in these households.
"An unrelated child (e.g. boarder) under the age of 15 who lives in a household with one or more usual residents, is coded as forming a parent-child relationship within that household. These households become family households, not group households."
Definitions of family forms
Couple family
A couple family is identified by the ABS by "the existence of a couple relationship. A couple relationship is defined as two people usually residing in the same household who share a social, economic and emotional bond usually associated with marriage and who consider their relationship to be a marriage or marriage-like union. This relationship is identified by the presence of a registered marriage or de facto marriage. A couple family can be with or without children, and may or may not include other related individuals. A couple family with children present can be expanded to elaborate on the characteristics of those children, such as their number, age and dependency status."
One-parent family
According to the ABS, "a one-parent family consists of a lone parent with at least one child (regardless of age) who is also usually resident in the household and who has no identified partner or child of his/her own. The family may also include any number of other related individuals.
"Examples of one parent families include: a 25-year-old parent with dependent children; and an 80-year-old living with a 50-year-old child.
"Information on people who are temporarily absent is used in family coding to differentiate between lone person households and one parent families (if child was temporarily absent) or between one parent and couple families (if a spouse was temporarily absent)."
Other family
"Other family" is defined by the ABS as "a group of related individuals residing in the same household, who cannot be categorised as belonging to a couple or one parent family.
"If two brothers, for example, are living together and neither is a spouse/partner, a lone parent or a child, then they are classified as an other family. However, if the two brothers share the household with the daughter of one of the brothers and her husband, then both brothers are classified as other related individuals and are attached to the couple family."
Note: In the present document, one-parent families with non-dependent children have been included in the "other families" category in order to simplify Figure 1 (and owing to the small representation of these two forms of families).
Source: ABS (2011a)
The three basic forms of households
According to the 2011 Census, nearly three-quarters of all households are family households (72%), nearly one-quarter comprise a single person (24%), while only 4% are group households.
Table 1 shows the changes that have taken place in the representation of these household forms since 1986.4
- The proportion of all households that comprised families fell from 77% to around 72%, with much of this change occurring between 1986 and 1996 and little change occurring since 2001. Of these family households, 2% comprised more than one family in 2011 (not shown in Table 1).
- Lone-person households, on the other hand, increased from nearly 19% to around 24%, again mostly occurring between 1986 and 1996, but has remained stable over the past decade.
- The representation of group households, on the other hand, has remained much the same over the 25-year period (around 4%).
| 1986 (%) | 1991 (%) | 1996 (%) | 2001 (%) | 2006 (%) | 2011 (%) | |
|---|---|---|---|---|---|---|
| Family households | 77.1 | 75.4 | 73.0 | 72.1 | 71.7 | 71.5 |
| Lone-person households | 18.8 | 20.0 | 22.8 | 24.0 | 24.4 | 24.3 |
| Group households | 4.2 | 4.5 | 4.2 | 3.9 | 3.9 | 4.1 |
| Total | 100.0 | 100.0 | 100.0 | 100.0 | 100.0 | 100.0 |
Note: Percentages may not total exactly 100.0% due to rounding
Sources: ABS 1986-2011 Censuses
Why did the decline in the representation of family households slow down then plateau between 2006 and 2011? Some of the transitions outlined by Weston and Qu (2013) in Australian Family Trends No. 3 are relevant here. These include the fact that partnership rates among older people have increased substantially - given the increasing longevity of the population and narrowing of the gap in the life expectancies of men and women5 - and the total fertility rate has increased since 2001. Most young people want to share their life with a partner (typically in marriage), and there would be a limit to how long at least one of the potential partners may be prepared to delay commitment (see Qu & Soriano, 2004). This limit would be reinforced by the fact that, notwithstanding advances in assisted reproductive technology, many of these young adults may take into account the age-related window of opportunity available (especially to the female partner) for having children.6 While some increase in the incidence of young people remaining at home occurred between 1996 and 2001, no increase was apparent between 2001 and 2011.
Trends in the life expectancy of men and women would have also contributed to the slow-down and recent virtual cessation of changes in the representation of lone-person and family households.7 The increase in the relative prevalence of lone-person households apparent in the earlier years can be explained in part by the ageing of the population and the instability of relationships (when separated individuals do not re-partner for some time, if at all), together with the fact that the female partner tends to outlive the male partner. The introduction of policies to help elderly people remain in their home would have also been a relevant factor. The narrowing gap in the life expectancy of men and women is apparent both for life expectancy at birth and for the extra years that men and women aged 65 years can expect to live (ABS, 2012c).
Family forms
According to the 2011 Census, there were 5.68 million families - the main focus of this facts sheet.
Couple-only families comprise young couples who have not had children together, older couples whose children have all left home, couples who have never had children, and re-partnered parents whose children (from a former relationship) spend most of their time living with their other parent.
Couple-only families and couple families with dependent children were the most common family forms in 2011, representing 38% and 37% respectively of all families. In total, 11% of all families were one-parent families with dependent children and 8% were couple families with non-dependent children. The remainder (hereafter referred to as "other families") accounted for 7%, and include one-parent families with only non-dependent children, along with families comprising related individuals, who are neither living with a partner nor having a parent-child relationship (e.g., siblings living together).8 Of all these "other families", 75% comprised one-parent families with non-dependent children.
Figure 1 shows the level of change that has occurred in family forms since 1976.
Figure 1: Family forms, 1976-2011
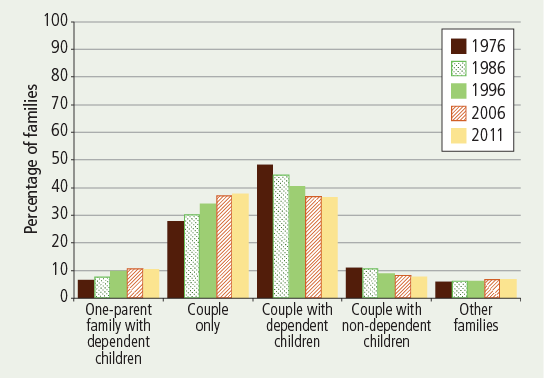
Sources: Hugo, G. (2001); Cat. No. 1301.0); ABS 2006 & 2011 Censuses
The greatest changes are apparent in the representation of the two most common family forms - couple-only families and couple families with dependent children:
- In 1976, couple families with dependent children predominated (representing 48% of all families), while only 28% were couple-only families.
- By 2006, these two family types were equally common, with each representing 37% of all families.
- In 2011, however, couple-only families were marginally more common than couple families with dependent children (38% vs 37%).
The proportion of one-parent families with dependent children also increased (from 7% to 11%). At the same time, the already small proportion of couple families with only non-dependent children fell (from 11% to 8%). Finally, the proportion of families that lie outside the above classifications (i.e., "other families") changed little (representing around 6-7% across the time periods).
Transitions from one family form to another
While the changes in the representation of the different family forms are considerable, they represent the net effects of even greater levels of change in the life courses of individuals. For instance, some single parents with dependent children will have re-partnered, thereby becoming couples with dependent children, while some couples with dependent children will have separated, with the mother and children typically forming a one-parent family for a time.9
Transitions into different family forms can have important financial implications, with flow-on social effects. For example, most one-parent families with dependent children are formed through relationship dissolution, and most are headed by mothers (86% in 2011). These families tend to be considerably worse off financially than other families. On the other hand, re-partnering is likely to improve their financial circumstances. (For further discussion on the financial effects of relationship dissolution and/or repartnering, see Australian Council of Social Services, 2012; de Vaus, Gray, Qu, & Stanton, 2010; Hayes, Qu, Weston, & Baxter, 2011.) Whatever the change in financial circumstances, these transitions carry other risks, including those associated with children's acceptance of a new step-parent and the negotiation of parenting roles (see Cartwright, Farnsworth, & Mobley, 2009).
2 According to ABS projections, the Australian resident population reached 23 million in April 2013 (ABS, 2013).
3 The number of households in 2011 is derived from the ABS (2012a) 2011 Census Basic Community Profile, which is based on a person's usual residence. This number is smaller than that based on the place of enumeration on the Census night (ABS, 2012b) as the latter includes households comprising visitors only and those that were not classifiable (representing 422,200 households in 2011).
4 Lone-person households and group households were not identified separately prior to 1986.
5 Although partnership rates have fallen for most other age groups, much of this change occurred before 2001. Furthermore, some of the unpartnered are parents living with their children, and therefore continue to form "household families".
6 Weston, Qu, Parker, and Alexander (2004) found that most childless men and women aged in their twenties and thirties want to have children. On average, the age considered personally ideal for starting a family varied according to respondents' current age and sex, being 27.5-29.8 years for childless men, and 26.8-30.1 for childless women. Age-related concerns (especially the age of the female partner) featured strongly among the considerations emphasised when thinking about having children.
7 This is not to suggest that there will be no subsequent changes in trends.
8 The ABS does not include one-parent families with non-dependent children in the "other families" category. The inclusion in this facts sheet of one-parent families with non-dependent children in the "other families" category has been made for the sake of simplicity, given that almost all families are of neither type. (See Box 1 for the ABS definitions of families).
9 Despite the fact that some children spend a considerable number of nights with each parent after parental separation, most children spend most or all nights with their mother. Mothers are also less likely than fathers to re-partner, at least within the first few years of separation (see Qu & Weston, 2010). In addition, a UK study suggests that the older the women are when they become single mothers (which in most cases happens after relationship breakdown), the less likely they are to re-partner (Skew, 2009).
Families with dependent children
Families face different challenges as the children mature. The birth of the first child may be anticipated with much joy, but the changes in the lifestyle of new parents are enormous and can be quite stressful (see Moloney, Weston, Qu, & Hayes, 2012). Many parents with very young children experience falls in income and are likely to be struggling in relation to balancing work and family life (see Baxter, 2013a). After parental separation, many children spend all or most of their time in a one-parent family, and some will subsequently experience a period of their childhood in a step- or blended family. Given varying care-time arrangements, some children will spend time in two one-parent families, and if each parent re-partners, some will spend time in two couple-parent families.10 All such transitions would generate considerable challenges to the parents, the children and their families in general.
This section first provides insight into the proportional representation of all families with dependent children of different ages - as inferred from the age of the youngest child. Next, the families are grouped according to the age of the youngest child and the proportional representation of one-parent families among all families in each age-related group. Attention is then directed to the characteristics of couple families with dependent children. Firstly, the proportion of parents who are cohabiting (rather than in a registered marriage) is provided, according to the age of the youngest child. Secondly, the proportions of all couple families (with dependent children) that are intact, step- or blended is shown. In all these analyses, the patterns that are apparent across the 15-year period from 1996 to 2011 are outlined.
All families with dependent children
Figure 2 shows the distribution of families with dependent children according to the age of their youngest dependent child at each of the Census years 1996 to 2011.
Figure 2: Families with dependent children, by age of youngest dependent child, 1996-2001
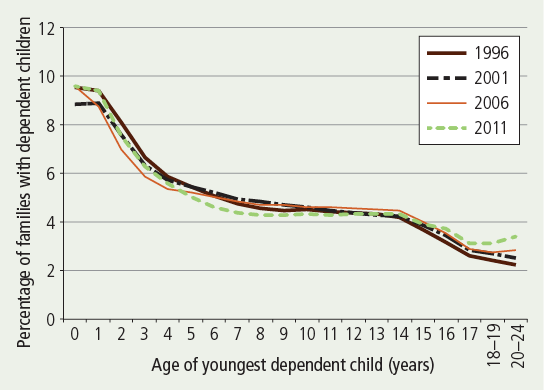
Sources: ABS 1996-2011 Censuses, unpublished tables
In the four Census years examined, the proportions of families represented fell as the age of youngest dependent child increased to around 7 years. Beyond this age, the proportions tended to level out, before falling again from age 15 years. For example, in 2011:
- the youngest dependent child of 10% of all families with dependent children was under 12 months old;
- for 4% of families, the youngest dependent child was 7 years old;
- for another 4%, this child was 14 years old; and
- families with a youngest dependent child aged 17, 18-19 and 20-24 years each represented 3% of all families with dependent children.
In each of the Census years, 37-40% of all families with dependent children had a child under the age of 5 years.
Small differences in overall trends are apparent across the Census years. For example, the 2001 Census recorded a slightly lower proportion of families with a child under the age of 12 months compared with the other Censuses. This is not surprising, given the decline in fertility that had been occurring at the time (the total fertility rate reached its lowest level on record in 2001). By 2006, the total fertility rate had picked up considerably.
The increased tendency for young adults to remain dependent on their parents while they pursue further education is reflected in the small increases in the representation of families whose youngest dependent child was 18-24 years (from 5% of all families with dependent children in 1996 and 2001, to 6% in 2006, and 7% in 2011).
One-parent families with dependent children
It has already been shown that the proportion of all families that are headed by a single parent has increased but remains quite small (11% in 2011). Of all families with dependent children, on the other hand, 22% were one-parent families in the 2011 Census, up from 19% in 1996. As would be expected, the distribution of such families varies according to the age of the youngest dependent child. This is shown in Figure 3, which depicts the proportion of all families with dependent children that are headed by a single parent, according to the age of the youngest dependent child and Census year (1996 to 2011). It basically shows that one-parent families were less commonly represented among those with preschool-aged children and most commonly represented among those whose youngest child was a young adolescent.
Figure 3: Families with dependent children headed by a single parent, by age of youngest dependent child, 1996-2011
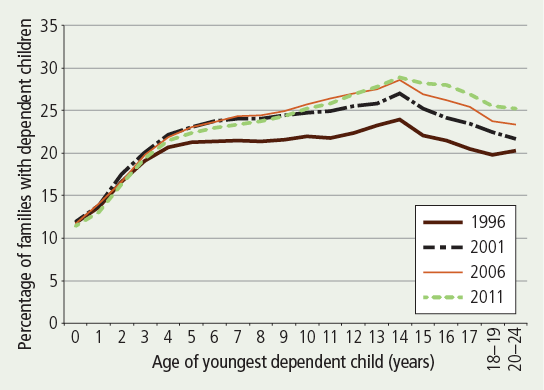
Sources: ABS 1996-2011 Censuses, unpublished tables
Across all four Census years, the proportion of families with dependent children that were headed by a single parent was lowest where the youngest dependent child was under 12 months old (11-12%), and highest when this child was 14 years old (24-29%). Put another way, families with an infant were the most likely of all these groups to be couple families, while those whose youngest dependent child was 14 years old were the least likely of all groups to be couple families.
At the same time, couple families predominated across all these families, grouped according to the age of the youngest dependent child.
The steepest increase in representation of one-parent families tended to occur when the youngest dependent child was under 5 years old, suggesting that the rate of parental separation was relatively high during this period. Whereas, once the youngest dependent child was older than 14 years, the proportion of one-parent families tended to decrease progressively as the age of the youngest dependent child increased.
It has already been shown (in Figure 1) that the proportion of all families with dependent children that were headed by a single parent increased over the 15-year period examined. However, the picture differs somewhat according to the age of the youngest dependent child.
- Where the youngest dependent child was under 4 years old, the proportion of one-parent families in each Census year was similar.
- From age 4, the 1996 period began to stand out as having lower proportions of one-parent families than was apparent for the more recent periods.
- From around age 10, the 2001 period began to emerge as having lower proportions than the two more recent periods (i.e., 2006 and 2011).
- From age 15 years, the 2006 period began to emerge as having lower proportions than those apparent in 2011.
In other words, among families with very young children, there has been very little change in the proportions that have been headed by a single parent since at least 1996. Furthermore, it is only for families in which the youngest child was at least 15 years old that the representation of single-parent families increased progressively across all four Census periods.
Couple families with dependent children
While the proportion of all couples who were cohabiting rather than being in a registered marriage increased from 10% in 1996 to 16% in 2011, many of these couples did not have resident children. Among couples with dependent children, the proportion who were cohabiting increased from 8% to 14%.
Figure 4 focuses on couple families with dependent children across the 15-year period from 1996 to 2011, and shows the proportion of these couples who were cohabiting (rather than in a registered marriage), according to the age of their dependent child. The following trends are apparent:
- Across all years, the proportion of couples who were cohabiting decreased as the age of the youngest dependent child increased. This decrease is greatest during the first two years of life, and from around age 16 years to age 20-24 years.
- Across the Census years examined, cohabitation became increasingly common for each subgroup of families. For example, among couples whose youngest dependent child was under 12 months old, the proportion who were cohabiting increased progressively from 16% in 1996 to 23% in 2011. Where the youngest dependent child was 12 years old, the proportion rose from 5% in 1996 to 11% in 2011.
Figure 4: Couple families with dependent children in a cohabiting relationship, by age of youngest dependent child, 1996-2011
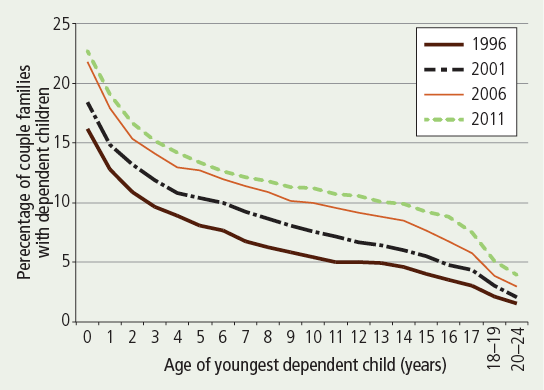
Sources: ABS 1996-2011 Censuses, unpublished tables
Several factors may explain these trends. First, cohabitation has increased across all age groups of couples and has become a normative pathway to marriage. The proportion of marriages preceded by cohabitation increased from 16% in 1975 to 56% in 1992, and to 78% in 2011 (ABS, 1996, 2012e; see also Weston & Qu, 2013). Second, the proportion of all births that are ex-nuptial has increased (though it has leveled off in the past few years, representing one in three births since 2006), with this increase apparently being explained almost entirely by the increase in births to cohabiting couples rather than to single mothers (Qu & Weston, 2012). In addition, some cohabiting parents may subsequently marry (and some others may separate).11
Step- and blended families with dependent children
The ABS classifies couple families as intact, step- or blended, based on the nature of the parent-child relationship. Here, an intact family is "a couple family containing at least one child who is the natural or adopted child of both partners in the couple, and no child who is the step-child of either partner in the couple". A step-family is "a couple family containing one or more children, at least one of whom is the step-child of one of the partners in the couple, and none of whom is the natural or adopted child of both members of the couple", and a blended family is "a couple family containing two or more children, of whom at least one is the natural or adopted child of both members of the couple, and at least one is the step-child of either partner in the couple" (ABS, 2011a).
There has been little change over the last four Census years in the representation of these three types of couple families with dependent children, as shown in Figure 5. The vast majority are intact families (91% in 1996 and 2001, and 89% in 2006 and 2011). Step-families remain only marginally more prevalent over this period than blended families (step-families: 5-6%; blended families: 4-5%).
Figure 5: Couple families with dependent children that were intact, step- and blended families, 1996-2011

Sources: ABS 1996-2011 Censuses, unpublished tables
10 Based on parents' reports of whether they had at least one child under 18 years living with them or elsewhere, Qu and Weston (2005) found that, of all couple families with co-resident children of this age, 11% entailed co-resident step-relationships (i.e., at least one of the parents was a step-parent to at least one of the children in the household), and 2% entailed only non-resident step-relationships (i.e., at least one parent was a step-parent to at least one child living elsewhere). In around 3% of couple families with no resident children under 18 years, one or both parents were step-parents to children of this age who lived elsewhere. These results are based on Wave 3 of the Household, Income and Labour Dynamics in Australia (HILDA) survey.
11 Qu and Weston (2012) examined changes in family forms experienced by children in the elder of the two birth cohorts in Growing Up in Australia: The Longitudinal Study of Australian Children (aged 4-5 years in Wave 1, conducted in 2004). Only one child per family is represented. Of those living with both biological parents who were cohabiting in Wave 1, 65% were in the same family form by Wave 3 (conducted in 2008), 16% were still with both biological parents who had married by this time, another 16% were living with a sole parent, and 4% were in a step-parent family.
Families with only non-dependent children
In 2011, only 8% of all families were couple families with only non-dependent children, and around 5% were one-parent families with only non-dependent children. Here a non-dependent child refers to "a person aged 15 years or more, who is a natural, adopted, step, or foster child of a couple or lone parent usually resident in the same household, who is not a full-time student aged 15-24 years, and who has no identified partner or child of his/her own usually resident in the household" (ABS, 2011a).
In Figure 6, these families are classified into three groups according to the age of the youngest non-dependent child (15-19 years, 20-24, and 25 years or more). The proportional representation of each group is depicted for each of the four Census years, covering 1996 to 2011.
Figure 6: Families with only non-dependent children, by age of youngest non-dependent child, 1996-2011

Sources: ABS 1996-2011 Censuses, unpublished tables
Not surprisingly, the youngest child in these families was most likely to be at least 25 years old (applying to close to half or more of all such families) and least likely to be 15-19 years old (applying to fewer than 20% of all such families).
Given the increasing tendency for young people to pursue further education or training, it is also not surprising that, among all these families with only non-dependent children, the representation of those whose youngest child was 15-19 years or 20-24 years fell over the period (15-19 years: from 19% in 1996 to 17% 2011; 20-24 years: from 32% to 28%). There was therefore an increase in the representation of these families (with only non-dependent children) whose youngest child was 25 years or more (from 48% in 1996 to 56% in 2011).
Some less common family forms and living arrangements
Each of the above family forms is characterised by a great deal of diversity. Two of the less common forms represented within these broader categories - same-sex couple families and grandparent families - are described below. In addition, the living arrangements of some people do not fit neatly into the classification of households and family forms outlined above. These include families entailing separated parents whose children spend virtually the same amounts of time in the two homes, and individuals who live apart from their partner.
Same-sex couple families
Couple families, of course, include partners of the same sex, but it is only from 1996 onwards that it has been possible to gain insight into the representation of same-sex couple families among all families. While societal acceptance and formal protection and recognition of same-sex relationships has apparently grown over past decades, attitudes toward these relationships vary according to such factors as age, gender, religious beliefs and geographic location (Australian Human Rights Commission, 2007, 2011; de Vaus, 2004; Norton, 2010; Pew Research Center, 2013; Smith, 2011). For instance, in Wave 11 of the Household, Income and Labour Dynamics in Australia (HILDA) survey, conducted in 2011, more women than men were likely to agree with the statement that "homosexual couples should have the same rights as heterosexual couples do" (61% vs 47% respectively), with agreement decreasing progressively with age (from 59% of men and 80% of women aged 15-24 years to 24% of men and 31% of women aged 75 years or more).12
Support services and groups are now available to help gay and lesbian people acknowledge their sexual orientation to their families and to others, and help same-sex parents and their children handle questions about their circumstances and expressions of intolerance.13
The following summary is based largely on an ABS (2012f) publication that focuses on same-sex couple families, and readers are referred to this document for a more detailed picture. Unless otherwise specified, the trends are derived from the 2011 Census.
According to the 2011 Census, there were 33,700 same-sex couple households in Australia, with a marginally higher proportion comprising males than females (52% vs 48%). This 2011 gender gap is smaller than that apparent in 1996 (58% of same-sex couples were male and 42% were female in this earlier period).
In 2011, 12% of same-sex couples had children of any age, including adult children, living with them in their family - a situation that was more common for female than male couples (22% of female couples and only 3% of male couples).
Same-sex couples accounted for 0.7% of all couple households in 2011, compared with 0.3% in 1996. The ABS (2012f) noted that this apparent change over the 15-year period may partly reflect an increasing willingness for such couples to disclose their relationship. It may also be the case that same-sex partners are now more prepared to form a couple household, rather than to maintain separate homes (i.e., adopt a "living-apart-together" arrangement).
Same-sex partners were most commonly aged 35-44 years (representing around 30% of all such partnerships) and tended to be younger than opposite-sex partners. The median age of both groups, and the total Australian population aged 15 years and over has increased since 1996 (same-sex partners from 35 to 40 years; opposite-sex partners from 44 to 48 years; total population aged 15 years and over: from 40 to 44 years). However, among all partners (opposite-sex and same-sex combined), the proportional representation of same-sex partners decreases with increasing age, from 1.6% of those aged 15-24 years to 0.1% of those aged 65 years and over. This trend was also apparent in previous Census years but, as the ABS (2012f) pointed out, this may have arisen through a greater willingness of younger than older people to acknowledge their sexual orientation and to live with their same-sex partner.
Since 1996, the representation of same-sex couples has increased progressively across the Census years among couples in each of six age groups (from 15-24 years to 65 years and over).14
Most same-sex couples live in couple-only families, with no other relatives living with them (representing 95% of male couples and 75% of female couples).
Female couples were seven times more likely than male couples to be living with children (22% vs 3%). However, more than half of the same-sex couples with children had only one child (59% of male couples and 52% of female couples), compared with 36% of opposite-sex couples with children). In total, 0.1% of all dependent children in families were living in same-sex couple families.
Of the 6,120 children under 25 years in same-sex couple families, 78% were under 15 years old, and 14% were dependent students (aged 15-24 years). The remaining 8% were non-dependent children aged 15-24 years.
Grandparent families
The forms families take, as specified by the ABS, are based on the relationships between the reference person (i.e., the person being surveyed by the ABS) and other household members. Where there are grandparent-grandchild relationships in the absence of parent-child relationships, then the family is classified as a grandparent family.15 The 2011 Census has, for the first time, enabled the generation of a variable that classifies grandparent families into couple- and single-grandparent families, each of which have: (a) grandchildren under 15 years old; (b) dependent (full-time) students aged 15-24 years (where there were no grandchildren under 15 years old); or (c) non-dependent grandchildren (where there were no dependent grandchildren). In each case, there may have been other children in the household. For instance, those with grandchildren under 15 years old may have also had dependent student grandchildren and non-dependent grandchildren.
As for all family households, children under 15 years old and those aged 15-24 years who are full-time students are classified as dependants. However, it should be noted that no information is available concerning the extent to which these children were being supported financially by the grandparents. The ABS (2012d) therefore cautions against assuming the caring roles within such families, and points out that in some cases a young adult grandchild who is a full-time student may have moved to live with the grandparents in order to provide help to them.
Nevertheless, it seems to often be the case that grandparent families are formed when the parents are unable to care for their children, owing to a combination of traumas, such as mental health problems, alcohol or substance addictions, family violence, child abuse, parental incarceration, or death (COTA National Seniors, 2003; Horner, Downie, Hay, & Wickmann, 2007; McHugh & Valentine, 2011).
In total, there were 46,680 grandparent families in 2011, representing just under 1% of all families. Table 2 shows that there was considerable diversity among grandparent families, with fewer than 30% being represented in any of the six family forms.
| Family form | Percentage |
|---|---|
| Couple: dependent grandchildren under 15 years old | 27.4 |
| Couple: dependent student grandchildren aged 15-24 years | 9.3 |
| Couple: non-dependent grandchildren | 15.0 |
| Single: dependent grandchildren under 15 years old | 19.3 |
| Single: dependent student grandchildren aged 15-24 years | 8.0 |
| Single: non-dependent grandchildren | 21.0 |
| Total grandparent families | 100.0 |
Note: Although discrete, each of these groups may have had other children in the household. The families classified as having dependent student grandchildren had no grandchildren under 15 years old in the household; the families with non-dependent grandchildren had no dependent grandchildren who were under 15 years old or were students.
Source: ABS Census 2011, unpublished data
The most common forms of grandparent families were couple families with grandchildren under 15 years old. The two next most common forms (with similar representation) were single-grandparent families with either grandchildren under 15 years old or non-dependent grandchildren. The least common forms were couple- and single-grandparent families with dependent student grandchildren.
Of all grandparent families:
- 64% comprised couple- or single-grandparent families with dependent grandchildren (whether under 15 years old, or older dependent students); and
- 36% comprised grandparent families with only non-dependent grandchildren.
The following trends emerge for grandparent families with dependent grandchildren (29,880 families):
- 43% of such grandparent families were couple families with grandchildren under 15 years old;
- 30% comprised a single grandparent with grandchildren under 15 years old;
- 15% comprised a single grandparent with grandchildren who were dependent students; and
- 13% were couple families with grandchildren who were dependent students.
Comparable data on grandparents are not available for earlier Census years. However, three ABS surveys on family characteristics, conducted in 2003, 2006-07 and 2009-10, have identified grandparent families in which the grandparents were the guardians or main carers of resident children aged under 18 years (see ABS, 2004, 2005a, 2008, 2011b). These suggest that of all families with children under 18 years old, the number of such grandparent families fell slightly between 2003 and 2009-10 (23,000 in 2003, 14,000 in 2006-07 and 16,000 in 2009-10) (ABS, 2008, 2011b).16
The following trends were apparent in the 2003 survey (ABS, 2004, 2005a):17
- In most cases, the youngest child in these grandparent families was either 5-11 years or 12-14 years, whereas the youngest child in other families was most commonly under 5 years or 5-11 years. The following proportions applied for age of youngest child in these grandparent families and other families (respectively):
- 0-4 years: 15% and 38%;
- 5-11 years: 37% and 36%;
- 12-14 years: 36% and 14%; and
- 15-17 years: both 12%.
- In 61% of these families, the grandparents (including any partner) were at least 55 years old, compared with just 1% of parents (including any partner).
- The proportion of all grandparent families that were headed by a single grandparent was higher than the proportion of all other families that were headed by a single parent (47% vs 21%).
- Of all families headed by a single grandparent, most were grandmothers (93%).
- Nearly two-thirds of these grandparents (63%) were relying on government payments for their main source of income, but as the ABS (2005a) noted, most older Australians own their own homes outright.
- Of the 28,700 children in grandparent families with a parent living elsewhere, 37% saw a parent fortnightly or more frequently, 25% saw a parent monthly or quarterly, and 12% saw a parent every 6 months or once a year. In total, 26% saw a parent either less frequently than once a year or not at all.
Of all children (aged 0-17 years) in out-of-home care (i.e., where the state or territory offers financial payment to the carer, regardless of whether this payment is accepted), the proportion in "relative/kinship care" increased from 39% in 2002 to 47% in 2012 (AIHW, 2003, 2013). Horner et al. (2007) concluded that almost all kinship/relative care is provided by grandparents. They also noted that, in Australia, there has been insufficient research into these grandparent families to provide the necessary evidence to enable community and state government agencies and policy-makers to develop a policy or service framework.
Separated families with equal shared care of children
One of the key objectives of the 2006 changes to the family law system was to encourage greater involvement of both parents in children's lives following separation, provided that the children are protected from family violence, child abuse or neglect. As part of this general goal, the reforms were also specifically designed to encourage shared care time where such arrangements are reasonably practicable and in the child's best interest. It seems reasonable to suggest that, in general, the more equal the overnight stays with each parent, the more likely it would be that, when completing a Census form or survey, each parent of the same children would see the children as members of his/her household.
Figure 7, derived from repeated ABS surveys, shows the proportion of children in four different age groups with equal care-time arrangements (here defined as 48-52% of nights with each parent) in 1997, 2003 and 2006-07. These results are based on the reports of parents who indicated that they cared for their child for at least half the nights.
Figure 7: Children with equal care-time arrangements, by age of children, 1997, 2003 and 2006-07
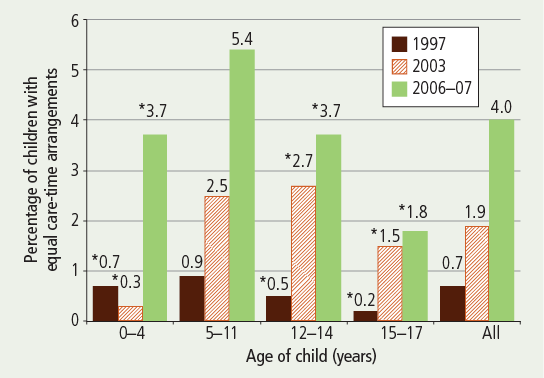
Note: * These percentages are based on a small number of cases and should therefore be interpreted with caution.
Sources: Customised tables provided by the ABS based on the Family Characteristics Survey, conducted in 1997 and 2003, and the Family Characteristics and Transitions Survey, conducted in 2006-07.
It appears that equal care time is an uncommon, but nonetheless increasing, arrangement for children whose parents have separated. The proportions in equal care time in the 1997 survey were very low, with negligible differences apparent across the age groups (0.2-0.9%). The proportion of all children under 18 years experiencing equal care time increased from 0.7% in 1997 to 1.9% in 2003, and 4.0% in 2006-07. In other words, equal care-time arrangements, though very uncommon, appeared to be increasing before the 2006 reforms were introduced. Although most of the age-related estimates are unreliable, owing to the small number of children on which they are based, children aged 5-11 and 12-14 years seemed more likely than the other two age groups to experience equal care time.
It is important to note that the parents of some of the older children represented in these ABS surveys would have been separated for several years. Data from the first two waves of the Australian Institute of Family Studies (AIFS) Longitudinal Study of Separated Families (LSSF; Kaspiew et al., 2009) suggest that equal care time is now relatively common among families - at least during the first couple of years of separation.18
According to the LSSF reports of all parents who participated in Wave 1, equal care time was experienced by 7% of the children some 15 months after separation. This arrangement was most commonly experienced by children aged 5-11 years and 12-14 years (11-12%), followed by those aged 3-4 years (9%), then teenagers aged 15-17 years (6%). Only 2% of children under 3 years old experienced this arrangement. The second survey wave suggested that, some 12 months later, equal care time was the most stable of the 11 care-time arrangements examined - applying to 86% of the children who had this arrangement in Wave 1.19
Couples living apart together
Some individuals in an intimate relationship may choose to live in a separate household from their partner. These circumstances are often referred to as living-apart-together arrangements, though opinions vary as to whether this arrangement should include or exclude couples who are married to each other but residing in separate homes (e.g., Levin & Trost, 1999; Strohm, Seltzer, Cochran, & Mays, 2009). There is also a "grey area" regarding the point at which a developing intimate relationship between people who live in different households should be considered a living-apart-together relationship. Each partner may hold a different understanding of the nature of the relationship and their living arrangements.
Using Wave 5 of the Household, Income and Labour Dynamics in Australia (HILDA) Survey (conducted in 2005), Reimondos, Evans, and Gray (2011) found that around 24% of respondents aged 18 years or more who were neither married nor cohabiting indicated that they were in an ongoing relationship with someone with whom they were not living. This represents 9% of all respondents who were 18 years or older. While 40% had commenced their relationship fewer than 12 months prior to interview, another 28% had been in this relationship for at least three years. Those aged 45 years or more were more likely than younger groups to have commenced their relationship at least three years prior to interview. Reimondos and colleagues also found that while nearly two-thirds of the respondents expected to live with their partner within the next three years, this was reported by only one-third of the older previously married individuals (mostly aged 45 years or more) with these living arrangements. In nearly three-quarters of all cases, the two residences were located in the same city and most of the others lived within the same state.
12 The rating scale used in HILDA ranged from 1 ("strongly disagree") to 7 ("strongly agree"). The percentages quoted refer to those participants who provided ratings of 5, 6 or 7. The HILDA project was initiated and is funded by the Australian Government Department of Families, Housing, Community Services and Indigenous Affairs (FaHCSIA) and is managed by the Melbourne Institute of Applied Economic and Social Research (Melbourne Institute). The findings and views provided in this facts sheet are those of the authors and should not be attributed to either FaHCSIA or the Melbourne Institute.
13 Examples of support services include: Coming Out Workshops <www.comingout.com.au/workshops>, and the Resilient Rainbow Kids Group <midsumma.org.au/event/resilient-rainbow-kids-group>.
14 The six age groups compared by the ABS were: 15-24 years, 25-34 years, 45-54 years, 55-64 years and 65 years and over.
15 Grandparent couple families form part of the couple families with children classification, while lone grandparents with grandchildren (and no parents) are treated as one-parent families.
16 Although the definition of grandparent families differs between the Census 2011 and ABS surveys, it is noteworthy that the Census 2011 suggests that there were around 21,760 couple- and single-grandparent families with grandchildren under 15 years old.
17 Such information was not provided in relation to the subsequent relevant surveys.
18 The 10,000 parents in the LSSF had been separated for an average of 15 months when first interviewed (in late 2008). The second survey, based on 70% of the original sample, was conducted in late 2009. Data were weighted to account for known sample biases, including that associated with loss of sample members by Wave 2. The sample was drawn from the Child Support Agency (now the Department of Human Services Child Support Program) database. The study was commissioned by the Attorney-General's Department (AGD) and the Department of Families, Housing, Community Services and Indigenous Affairs (FaHCSIA) and formed part of the family law reform evaluation conducted by AIFS (see Kaspiew et al., 2009). Unlike the ABS surveys, which focused on all children born of the separated parents, the LSSF study focused on only one child in each family.
19 The different care time arrangements ranged from the child never seeing the father to the child never seeing the mother, and included categories in which the father or mother had daytime-only care.
Conclusion
The picture provided in this facts sheet represents a series of snapshots of Australian households and family forms across time, with a particular focus on 2011. The periodic snapshots highlight the level of overall net change that has occurred over the past 25 years, and a stabilising of family forms over the past decade, but in so doing, they mask an even greater level of change that has also taken place. For example, individuals living alone in one of the snapshots might have been partnered in a subsequent snapshot, while some partnered individuals in the earlier period might have been living alone in the subsequent period examined. In some cases, transitions then reversions to an earlier status may occur between snapshots. For instance, partnered individuals captured in the first snapshot may have had a spell of living alone, but by the time the second snapshot was taken, they may have reconciled or re-partnered.
Although there tends to be considerable diversity in the nature of needs within household and family forms, there is also evidence that some family forms are more likely to experience significant financial difficulties than others. For example, after separation, single mothers and their children typically experience significant increases in financial difficulties (de Vaus et al., 2010). Some single mothers with little or no paid work subsequently increase their labour force participation, but in so doing their need for child care increases (see Baxter, 2013a, 2013b). And for most grandparent families, government payments represent their main source of income (ABS, 2005a).
Non-financial challenges experienced within and between family forms are many and varied. The breakdown of relationships between partners or parents is very likely to be an extremely difficult emotional period for all concerned - a period in which the notion that "time tends to heal" may seem a very remote possibility. For at least one of the partners, however, the breakdown may have been occurring well before the actual separation took place.
In forging new pathways, some separated parents will re-partner, a trend that occurs more commonly, and earlier, for fathers than mothers. However, this adjustment sometimes triggers further conflict between the parents (see Moloney et al., 2007; Qu & Weston, 2010), which often has negative flow-on effects for the children.
Parents who re-partner form step-families, even if the children are spending little time in the home of their re-partnered parent. The relationship and role dynamics experienced in step-families are often extremely challenging, especially in the early years. The rate of separation among re-partnered couples with step-children is higher than that among other couples, with overseas research suggesting that the presence of step-children contributes to the risk of separation (Coleman, Ganong, & Fine, 2000).
While societal acceptance and formal protections and recognition of same-sex relationships have increased, attitudes toward such relationships appear to vary according to such factors as age, gender, religious beliefs and geographic location. Same-sex couples and their children are therefore likely to experience episodes of discrimination of some form over time.
A substantial proportion of grandparent families appear to be formed under circumstances that entail considerable trauma for the children, parents and grandparents, with long-lasting effects (e.g., the parents may have severe mental health problems or alcohol or substance addictions).
Although little attention has been given to lone-person households in this analysis, there is evidence that those living alone have diverse socio-demographic characteristics and associated needs. These households, for instance, include young adults who have left their parental home, middle-aged people (especially fathers) who have separated from their children's mother, and older widowed people. Their financial and socio-emotional needs obviously vary according to such circumstances, though, again, there is much diversity of needs within these different circumstances, and their needs would change (de Vaus & Qu, 2011).
In short, there are many dynamics behind the picture these snapshots present. Needs change during the period that individuals spend in a particular household or family form, as well as when they move from one household or family form to another. The early stages of a transition often represent a crucial period, when families and individuals may require a great deal of support. However, in some situations, the need for support is likely to be high later on, especially when health-related issues increase the risks of living alone.
References
- Australian Bureau of Statistics. (1996). Marriages and divorces, Australia, 1995(Cat. No. 3310.0). Canberra: ABS. Retrieved from <tinyurl.com/ cwfj8kl>.
- Australian Bureau of Statistics. (2004). Family characteristics, Australia, Jun 2003 (Cat. No. 4442.0). Canberra: ABS. Retrieved from <tinyurl.com/c2sb2rd>.
- Australian Bureau of Statistics. (2005a). Australian social trends, 2005: Family functioning. Grandparents raising their grandchildren (Cat. No. 4102.0). Canberra: ABS. Retrieved from <tinyurl.com/crfzt6k>.
- Australian Bureau of Statistics. (2005b). Family, household and income unit variables, 2005 (Cat. No. 1286.0). Canberra: ABS. Retrieved from <tinyurl.com/d3j2qvy>.
- Australian Bureau of Statistics. (2008). Family characteristics and transitions, Australia, 2006-07(Cat. No. 4442.0). Canberra: ABS. Retrieved from <tinyurl.com/dxeskxk>.
- Australian Bureau of Statistics. (2011a). Census dictionary, 2011 (Cat. No. 2901.0). Canberra: ABS. Retrieved from <www.abs.gov.au/ausstats/[email protected]/mf/2901.0>.
- Australian Bureau of Statistics. (2011b). Family characteristics, Australia, 2009-10 (Cat. No. 4442.0). Canberra: ABS. Retrieved from <tinyurl.com/d2ust3m>.
- Australian Bureau of Statistics. (2012a). 2011 Census community profile series: Australia. Basic community profile. Canberra: ABS. Retrieved from <tinyurl.com/cc3u8s2>.
- Australian Bureau of Statistics. (2012b). Census of Population and Housing: Place of enumeration profile datapack, 2011. Third release (Cat. No. 2069.0.30.004). Canberra: ABS. Retrieved from <tinyurl.com/bnxqm76>.
- Australian Bureau of Statistics. (2012c). Deaths, Australia, 2011 (Cat. No. 3302.0). Canberra: ABS. Retrieved from <www.abs.gov.au/ausstats/[email protected]/mf/3302.0>.
- Australian Bureau of Statistics. (2012d). Grandparent families. Canberra: ABS. Retrieved from <tinyurl.com/crvwruw>.
- Australian Bureau of Statistics. (2012e). Marriages and divorces, Australia, 2011 (Cat. No. 3310.0). Canberra: ABS. Retrieved from <tinyurl.com/c48nf3u>.
- Australian Bureau of Statistics. (2012f). Same-sex couple families: Reflecting a nation. Stories from the 2011 Census, 2012-2013 (Cat. No. 2071.0). Canberra: ABS. Retrieved from <tinyurl.com/bubfrq7>.
- Australian Bureau of Statistics. (2013, 23 April). Australia to reach 23 million on 23 April 2013 (media release). Retrieved from <www.abs.gov.au/AUSSTATS/[email protected]/mediareleasesbyReleaseDate/A959C7C902683284CA257B550015D8D0?OpenDocument>.
- Australian Bureau of Statistics & Australian Institute of Health and Welfare. (2011). Demographic, social and economic characteristics: Family and community (The health and welfare of Australia's Aboriginal and Torres Strait Islander Peoples, 2010; ABS Cat. No. 4704.0; AIHW Cat. No. IHW 21). Canberra: ABS. Retrieved from <www.abs.gov.au/AUSSTATS/[email protected]/lookup/4704.0Chapter250Oct+2010>.
- Australian Council of Social Services. (2012). Poverty in Australia (PDF 1.2 MB) (ACOSS Paper No. 194). Strawberry Hills, NSW: ACOSS. Retrieved from <www.acoss.org.au/uploads/ACOSS%20Poverty%20Report%202012_Final.pdf>.
- Australian Human Rights Commission. (2007). Same-sex: Same entitlements. National Inquiry into Discrimination Against People in Same-Sex Relationships: Financial and work-related entitlements and benefits. Sydney: AHRC. Retrieved from <www.humanrights.gov.au/publications/same-sex-same-entitlements>.
- Australian Human Rights Commission. (2011). Addressing sexual orientation and sex and/or gender identity discrimination: Consultation Report. Sydney: AHRC. Retrieved from <tinyurl.com/oty9s4y>.
- Australian Institute of Health and Welfare. (2003). Child protection Australia 2001-02 (Child Welfare Series No. 32; Cat. No. CW2 20). Canberra: AIHW.
- Australian Institute of Health and Welfare. (2013). Child protection Australia 2011-12 (Child Welfare Series No. 55; Cat. No. CW2 43). Canberra: AIHW.
- Baxter, J. (2013a). Families working together: Getting the balance right (Australian Family Trends No. 2). Melbourne: Australian Institute of Family Studies. Retrieved from <www.aifs.gov.au/institute/pubs/factssheets/2013/familytrends/aft2/index.html>.
- Baxter, J. (2013b). Parents working out work (Australian Family Trends No. 1). Melbourne: Australian Institute of Family Studies. Retrieved from <www.aifs.gov.au/institute/pubs/factssheets/2013/familytrends/aft1>.
- Cartwright, C., Farnsworth, V., & Mobley, V. (2009). Relationships with step-parents in the life stories of young adults of divorce. Family Matters, 82, 30-37.
- Coleman, M., Ganong, L., & Fine, M. (2000). Reinvestigating remarriage: Another decade of progress. Journal of Marriage and the Family, 62, 1288-1307.
- COTA National Seniors. (2003). Grandparents raising grandchildren. (PDF 270 KB) Canberra: Department of Families, Housing, Community Services and Indigenous Affairs. Retrieved from <tinyurl.com/ctnlqoo>.
- de Vaus, D. (2004). Diversity and change in Australian families: Statistical profiles. Melbourne: Australian Institute of Family Studies. Retrieved rom <www.aifs.gov.au/institute/pubs/diversity/main.html>.
- de Vaus, D., Gray, M., Qu, L., & Stanton, D. (2010). Effect of relationship breakdown on income and social exclusion. In R. Sainsbury & P. Saunders (Eds.), Social security, poverty and social exclusion in rich and poorer countries. Portland, OR: Intersentia.
- de Vaus, D., & Qu.L. (2011, 24 August.). Understanding the rise in solo living households. Paper presented at the AIFS Seminar Series, Melbourne.
- Hayes, A., Qu, L., Weston, R., & Baxter, J. (2011). Families in Australia 2011: Sticking together in good and tough times. Melbourne: Australian Institute of Family Studies. Retrieved from <www.aifs.gov.au/institute/pubs/factssheets/2011/fw2011/>.
- Horner, B., Downie, J., Hay, D., & Wichmann, H. (2007). Grandparent-headed families in Australia. (PDF 1.5 MB) Family Matters, 76, 77-84. Retrieved from <www.aifs.gov.au/institute/pubs/fm2007/fm76/bh.pdf>.
- Hugo, G. (2001). A century of population change in Australia. In Australian Bureau of Statistics, Year Book Australia 2001 (Cat. No. 1301.0). Canberra: ABS.
- Kaspiew, R., Gray, M., Weston, R., Moloney, L., Hand, K., Qu, L., & the Family Law Evaluation Team. (2009). Evaluation of the 2006 family law reforms. Melbourne: Australian Institute of Family Studies. Retrieved from <www.aifs.gov.au/institute/pubs/fle/index.html>.
- Levin, I., & Trost, J. (1999). Living apart together. Community, Work & Family, 2(3), 279-294.
- Madden, R., & Al-Yaman, F. (2003) How statisticians describe Aboriginal and Torres Strait Islander Peoples. (PDF 519 KB) Canberra: Australian Institute of Aboriginal and Torres Strait Islander Studies. Retrieved from <www.aiatsis.gov.au/research/docs/pdfs2003/Madden.pdf>.
- McHugh, M., & Valentine, K. (2011). Financial and non-financial support to formal and informal out-of-home carers (Occasional Paper No. 38). Canberra: Department of Families, Housing, Community Services and Indigenous Affairs.
- Moloney, L., Smyth, B., Weston, R., Richardson, N., Qu, L., & Gray, M. (2007). Allegations of family violence and child abuse in family law children's proceedings: A pre-reform exploratory study (Research Report No. 15). Melbourne: Australian Institute of Family Studies. Retrieved from <www.aifs.gov.au/institute/pubs/resreport15/main.html>.
- Moloney, L., Weston, R., Qu, L., & Hayes, A. (2012). Families, life events and family service delivery (Research Report No. 20). Melbourne: Australian Institute of Family Studies. Retrieved from <www.aifs.gov.au/institute/pubs/resreport20/index.html>.
- Morphy, F. (2006). Lost in translation? Remote Indigenous households and definitions of the family. Family Matters, 73, 23-31.
- Norton, A. (2010). Sexual attitudes over time #2: Same-sex relations. Melbourne: Andrew Norton. Retrieved from <andrewnorton.info/2010/07/26/sexual-attitudes-over-time-2-same-sex-relations/>.
- Pew Research Center. (2013). The global divide on homosexuality: Greater acceptance in more secular and affluent countries. Washington, DC: Pew Research Center. Retrieved from <www.pewglobal.org/files/2013/06/Pew-Global-Attitudes-Homosexuality-Report-FINAL-JUNE-4-20131.pdf>.
- Qu, L., & Soriano, G. (2004). Forming couple relationships: Adolescents' aspirations and young adults' actualities. Family Matters, 68, 43-49
- Qu, L., & Weston, R. (2005). Snapshot of couple families with stepparent-child relationships. Family Matters, 70, 36-37.
- Qu, L., & Weston, R. (2010). Parenting dynamics after separation: A follow-up study of parents who separated after the 2006 family law reforms. Melbourne: Australian Institute of Family Studies.
- Qu, L., & Weston, R. (2012). Parental marital status and children's wellbeing (Occasional Paper No. 46). Canberra: Department of Families, Housing, Community Services and Indigenous Affairs. Retrieved from <tinyurl.com/owdjljw>.
- Reimondos, A., Evans, A., & Gray, E. (2011). Living-apart-together (LAT) relationships in Australia. Family Matters, 87, 43-55.
- Skew, A. J. (2009). Leaving lone parenthood: Analysis of the repartnering patterns of lone mothers in the UK. (PDF 1.5 MB) (doctoral dissertation). Retrieved from <eprints.soton.ac.uk/72373/1.hasCoversheetVersion/PhD_thesis_Alex_Skew.pdf>.
- Smith, T. W. (2011). Cross-national differences in attitudes towards homosexuality. (PDF 324 KB) (GSS Cross-National Report No. 31). Los Angeles: The Williams Institute, University of California Los Angeles. Retrieved from <williamsinstitute.law.ucla.edu/wp-content/uploads/Smith-CrossNational-NORC-May-2011.pdf>.
- Strohm, C. V., Seltzer, J. A., Cochran, S. D., & Mays, V. M. (2009). "Living apart together" relationships in the United States. Demographic Research, 21(7), 177-214.
- Weston, R., & Qu, L. (2013). Working out relationships (Australian Family Trends No. 3). Melbourne: Australian Institute of Family Studies. Retrieved from <www.aifs.gov.au/institute/pubs/factssheets/2013/familytrends/aft3/index.html>.
- Weston, R., Qu, L., Parker, R., & Alexander, M. (2004). "It's not for lack of wanting kids": A report on the Fertility Decision Making Project (Research Report No. 11). Melbourne: Australian Institute of Family Studies. Retrieved from <www.aifs.gov.au/institute/pubs/resreport11/main.html>.
Dr Lixia Qu is a Senior Research Fellow and Ruth Weston is Assistant Director (Research) at the Australian Institute of Family Studies.
Qu, L., & Weston, R. (2013). Australian households and families (Australian Family Trends No. 4). Melbourne: Australian Institute of Family Studies.
978-1-922038-31-9
1 July 2013