Demographics of living alone
You are in an archived section of the AIFS website
Overview
One in four Australian households is a lone-person household. This fact sheet describes the trends in living alone and the characteristics of people who live alone.
Key messages
-
Living alone is slightly more common with women than men, and the chance of living alone increases with age.
-
Women who live alone are, on average, older than men who live alone.
-
Separation is a significant driving factor for living alone in middle age.
-
Women who live alone have higher education levels, are higher income earners and are more likely to be professionals than women living with others.
-
Men who live alone have lower levels of education, are lower income earners and are more likely to be in less prestigious jobs than those living with others.
Introduction
Living alone is increasingly on the public radar. One in four Australian households is a lone-person household, and rates have increased sharply since the 1970s. Throughout the Western world lone-person households have become increasingly common, and this trend is spreading to non-Western countries. In some quarters these developments have been interpreted as signifying a decline of commitment to family living, increasing social fragmentation and a rise in loneliness. For others, the growth in living alone has been celebrated as reflecting the greater choice that people have in their living arrangements and lifestyle.
But to appreciate the meaning and significance of living alone we must understand more about the make-up of those living alone. Who is living alone? Which social groups are driving this change? We also must understand more about the nature of living alone, its duration, where it fits into the life course and its links with social connection and wellbeing. Do people tend to live alone for short periods, or is it a long-term arrangement? To what extent do people choose to live alone and like living alone? How lonely are those who live alone? Why do they commence living alone and why do they stop? It is only when we can answer these questions that we can begin to understand its significance.
This paper describes the trends in living alone and describes the characteristics of people who live alone. It will show that within this single category of "living alone" there is tremendous diversity and that living alone has very different meanings within the various sub-groups. It will show that any characterisation of living alone as "fragmentation" or as "freedom" is simplistic.
To explore the nature of living alone, a second paper will look at how long people live alone, when they live alone, and how moving into and out of living alone arrangements affects the wellbeing and social connection of those living alone.
Is living alone still increasing in Australia?
Throughout much of the Western world living alone has become more common since at least the 1970s, and in many countries since the end of the Second World War. Is this upward trend continuing in the 21st century and is it spreading beyond the Western world? This section explores what is happening in Australia. The following section broadens the focus to international trends.
Living alone rates can be expressed in two ways - as the percentage of households that contain just one person and as the percentage of individuals who live alone. Rates expressed as the percentage of households are always higher than the percentage of individuals. In this paper most of the discussion will report the percentage of individuals who live alone. But initially, because of the nature of the available data, the figures report the percentage of one-person households in both Australia and selected overseas countries.
Figure 1 reports the percentage of one-person households in Australia at various points since 1911. Three facts stand out:
- There was no growth in one-person households from the First World War till the end of the Second World War.
- Since the end of the Second World War the percentage of one-person households has increased in Australia by 300% - from 8% in 1946 to 24% in 2011.
- Since at least 2001 the increase has ceased for the first time since the Second World War.
Figure 1: One-person households as percentage of population, Australia, 1911-2011
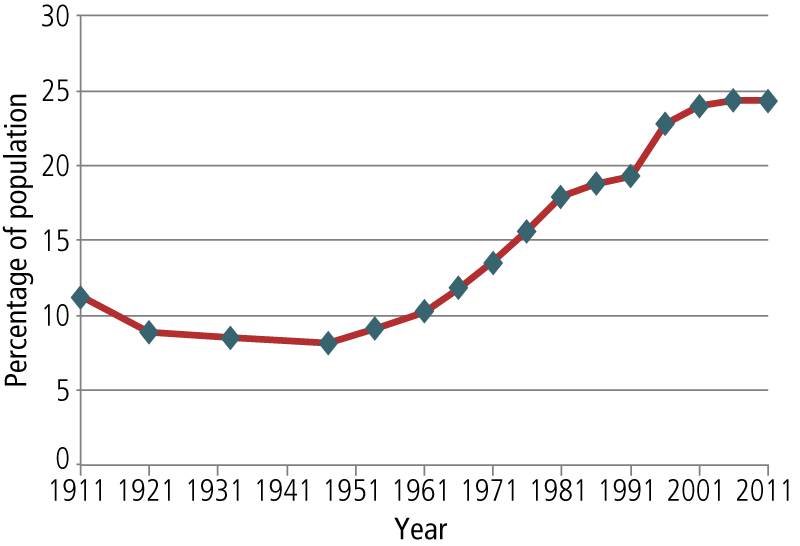
Source: ABS Census of Population and Housing (various years)
How does Australia compare internationally?
How does the Australian level of lone living and the pattern of growth compare with other countries? Does Australia have lower or higher rates of lone living than elsewhere? Is the Australian slowdown in growth repeated in other countries?
Table 1 reports the percentage of lone-person households in selected countries for 2010 and, where earlier data are available, figures for earlier years also. Where possible, rates of change in living alone are calculated over the last two decades. In the comparison figures, data are provided as close as possible to 2010. Usually the figures are for 2009, 2010 or 2011, depending on the availability of figures in different countries. In some countries the most recent figures are for the year 2000 or 2001.
| Countries | 1990-01 (%) | 2000-01 (%) | 2010-11 (%) | Change (%) 1990-2010 | Change (%) 1990-2000 | Change (%) 2000-10 |
|---|---|---|---|---|---|---|
| Scandinavia | ||||||
| Denmark a | 34.0 | 37.1 | 38.6 | 13.5 | 9.1 | 4.0 |
| Finland a | 31.7 | 37.3 | 41.0 | 29.3 | 17.7 | 9.9 |
| Sweden a | 44.1 | 46.5 | 48.6 | 10.2 | 5.4 | 4.5 |
| Norway a | 34.3 | 37.7 | 39.7 | 15.7 | 9.9 | 5.3 |
| Western Europe | ||||||
| Netherlands a | 29.9 | 32.6 | 36.1 | 20.7 | 9.0 | 10.7 |
| Switzerland a | 32.4 | 36.0 | 36.4 | 12.3 | 11.1 | 1.1 |
| Austria a | 28.0 | 30.2 | 36.0 | 28.6 | 7.9 | 19.2 |
| Belgium a | 28.4 | 31.2 | 33.8 | 19.0 | 9.9 | 8.3 |
| France a | 27.5 | 31.5 | 34.7 | 26.2 | 14.5 | 10.2 |
| Germany a | 35.0 | 36.1 | 40.2 | 14.9 | 3.1 | 11.4 |
| Southern Europe | ||||||
| Italy a | - | 24.9 | 28.6 | - | - | 14.9 |
| Greece a | - | 19.7 | 25.7 | - | - | 30.5 |
| Spain a | - | 20.3 | 23.2 | - | - | 14.3 |
| English-speaking | ||||||
| Australia | 19.3 | 24.4 | 24.3 b | 25.9 | 26.4 | −0.4 |
| New Zealand | - | 22.7 b | 22.4 d | - | - | −1.3 |
| Ireland b | 20.2 | 21.6 | 23.7 | 17.3 | 6.9 | 9.7 |
| Canada a | 22.8 | 25.7 | 27.6 | 21.1 | 12.7 | 7.4 |
| UK a | 27.0 | 28.5 | 28.9 | 7.0 | 5.6 | 1.4 |
| US a | 24.6 | 25.5 | 26.7 | 8.5 | 3.7 | 4.7 |
| Eastern Europe | ||||||
| Hungary a | 24.3 | 26.2 | 32.1 | 32.1 | 7.8 | 22.5 |
| Czech Republic a | - | 20.7 | 27.8 | - | - | 34.3 |
| Poland a | 18.3 | 21.6 | 24.0 | - | 18.0 | 11.1 |
| Croatia a | 17.8 | 20.8 | 27.6 | 55.1 | 16.9 | 32.7 |
| Malta | - | - | 33.3 | - | - | - |
| Slovenia | 18.0 b | 21.9 | 32.8 b | 82.2 | 21.7 | 49.8 |
| Turkey | - | 4.0 | 6.1 a | - | - | 52.5 |
| Asia | ||||||
| Taiwan c | 13.4 | - | 22.0 | 64.2 | - | - |
| Japan b | - | 27.6 | 32.4 | - | - | 17.4 |
| Hong Kong | - | 15.6 c | 17.1 b | - | - | 9.6 |
| China c | 1.6 | 3.6 | - | - | - | - |
| Malaysia b | - | 7.1 | - | - | - | - |
| Singapore c | 6.6 | 8.2 | 11.5 | 74.2 | 24.2 | 40.2 |
| South Korea | 9.0 c | 15.5 c | 24.0 b | 166.7 | 72.2 | 54.8 |
| Viet Nam c | - | 4.4 | 7.3 | - | - | 65.9 |
| Sri Lanka c | 3.3 | - | 5.6 | 70.0 | - | - |
| Iran c | 5.0 | 5.0 | 7.0 | - | - | 40.0 |
| India | - | - | 3.7 | - | - | - |
| Central and South America | ||||||
| Brazil b | - | 8.9 | - | - | - | - |
| Mexico b | - | 8.8 | - | - | - | - |
| Colombia b | - | 11.1 | - | - | - | - |
| Chile b | - | 11.6 | - | - | - | - |
Sources: a United Nations Economic Commission for Europe Statistical Database <tinyurl.com/jvkptjn>; b United Nations Demographic Yearbook (PDF 900 KB) <unstats.un.org/unsd/Demographic/products/dyb/dyb_Household/4.pdf>; c Living Alone: One-Person Households in Asia conference held 2013 <www.ari.nus.edu.sg/showfile.asp?eventfileid=793>; d 2013 figures obtained from 2013 Census Totals by Topic (XLS 1.5 MB) <tinyurl.com/mx4utf2>
These international comparisons show that:
- In 2010, the Australian level of living alone lay between the high level found in Scandinavia and the low level found in parts of Asia and Central and South America.
- The Australian rate (24%) is similar to those of other English-speaking countries, which all have rates ranging from 22% (New Zealand) to 29% (the UK).
- Scandinavia has the highest rates of living alone, ranging from 39% in Denmark to 49% in Sweden.
- Western European countries also have higher rates of living alone than Australia and range from 34% in Belgium to 40% in Germany.
- Rates in Eastern Europe are marginally lower than in Western Europe, but are typically at least as high as English-speaking countries.
- Lone-person households in Southern Europe are similar to English-speaking countries and range from 23% in Spain to 28% in Italy.
- The rates of living alone in Asia and South and Central America are much lower than in Europe, Australia and North America.
- Within Asia there are some important differences, with countries such as Japan (32%), South Korea (24%) and Taiwan (22%) having levels very similar to English-speaking countries and parts of Europe. In contrast, countries such as India, Sri Lanka and Vietnam have low rates of 7% or less. The extent to which the variations between Asian countries reflect different levels of westernisation, affluence or simply demographic profiles is difficult to assess.
Rates of living alone have been changing in most countries over the last two decades, but the pattern of change is quite variable between them.
- While Australia has experienced substantial growth in lone-person households since the Second World War, there has been an uncharacteristic absence of growth since the turn of the 21st century (a decline of -0.4% since 2001). This stands out from the higher level of growth in most other countries and even the accelerating growth in some.
- The absence of recent growth of lone-person households in Australia is similar to patterns in New Zealand (-1%), Switzerland (+1%) and the UK (+1%).
- In Scandinavia, although rates of recent growth are higher than Australia, there has been a marked slowdown in the rate of growth of one-person households.
- The slow recent growth in Australia is in sharp contrast to the strong growth in lone-person households in Eastern and Southern Europe and a range of Asian countries, where the growth rates in lone-person households in the decade 2000-10 are often in the range of 30% to 50%.
- Particularly notable is the growth in one-person households in South Korea where there has been a 54% increase, from 16% in 2001 to 24% in 2011.
These figures cannot explain the different rates of lone-person households in different countries or the widely differing trajectories. However, it is likely that differences in culture, demographic profiles (e.g., age), and patterns of family formation and dissolution, together with differing levels of affluence and the availability and cost of suitable housing, all contribute to the international patterns seen in Table 1.
What sorts of people live alone?
Identifying which sectors of the population are most likely to live alone can provide clues regarding drivers of this living arrangement. Is it mainly older people who live alone? Are women more likely to live alone than men? Is living alone driven by widowhood? How much is marital separation driving rates of living alone? Or is it because people are partnering later and less often? Are people who live alone well off financially and thus live alone because they can afford to, or are they struggling? Do they live alone because they are unable to find or retain a partner? Answering these types of questions can shed light on factors that may be behind the growth and more recent stability in the rates of living alone.
In the sections that follow, living alone is reported in terms of the percentages of individuals living alone rather than the percentages of households. When reporting these figures, it is important to be clear who is included and who is not included in the calculations. Frequently, the percentage of individuals living alone is calculated as the percentage of individuals aged 15 or older. Using this age cut-off results in a lower percentage of people living alone, since very few people aged 15 to 19 are in a position where they can live alone. In addition, rates of living alone are sometimes based only on people who live in private dwellings (i.e., are not living in institutions such as care homes, hospitals, dormitories or prisons). Restricting calculations only to those in private dwellings will inflate the figures. In this publication, unless stated otherwise, the rates at which individuals live alone are based on the percentage of the population aged 20 and older who live in either private or non-private dwellings. Where Census data are used, the figures reflect a person's usual place of residence and not necessarily where they were on Census night.
Is it mainly older women who live alone?
Living alone is shaped by age and gender. While about 13% of adults overall live alone this figure varies greatly according to a person's age and sex.
Living alone is a little more common among women than among men. In 2011, 13% (1,023,042) of women aged 20+ lived alone compared to 12% (852,128) of men. This means that 55% of those living alone are women.
But the age profile of women who live alone is quite different to that of men (Figure 2). Women who live alone are, on average, substantially older than men who live alone. In 2011, 39% of women who lived alone were aged over 70, compared to just 19% of men. Conversely, just 26% of women who lived alone were under the age of 50, while among men who lived alone 45% were younger than 50.
Figure 2: Percentage of population living alone in each age group, by gender, Australia, 2011
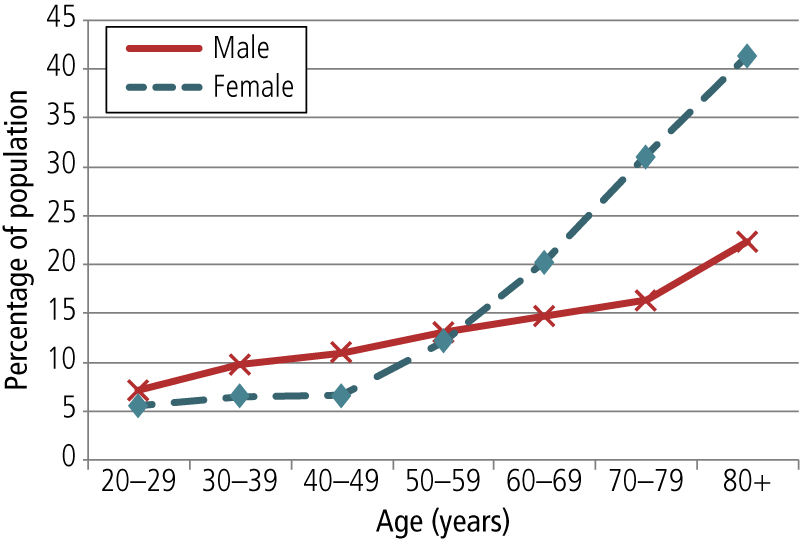
Source: ABS Census of Housing and Population, 2011
Overall, the chance of living alone increases steadily as both men and women grow older. For example, of men aged 20-29, 7% were living alone in 2011. By age 50-59, this had almost doubled to 13%, and by the time they were 80 or older, 23% of men lived alone.
Among women, the rates of living alone also increase as they grow older, but much more sharply than for men in the older age groups. In the younger age groups, women are a little less likely than men to live alone, but from the age of 50 onwards the chance of women living alone increases sharply, and from the age of 60 onwards is much higher than for men. By age 80 and over, 40% of women live on their own.
Are the people living alone becoming older?
The age profile of those who live alone has changed substantially over the last quarter century (1986-2011). Figure 3 shows that over this period there has been:
- a substantial decline in the proportion of those living alone who are young - in 1986, 14% of those living alone were in their 20s, but by 2011 this had declined to 9%;
- a decline in the proportion of those living alone who come from the "young elderly" age groups (60-79);
- a sharp increase in the proportion of those living alone who are aged 80 and older - the over 80s made up just 9% of those who lived alone in 1986, but by 2011 this had increased to 15% (an increase of 62%); and
- an increase in the living-alone population who are middle-aged (40-59) - in 1986, 22% of those living alone came from this middle-aged group, but by 2011, 31% of those living alone were middle-aged.
Figure 3: Change in age profile of people living alone, Australia, 1986-2011
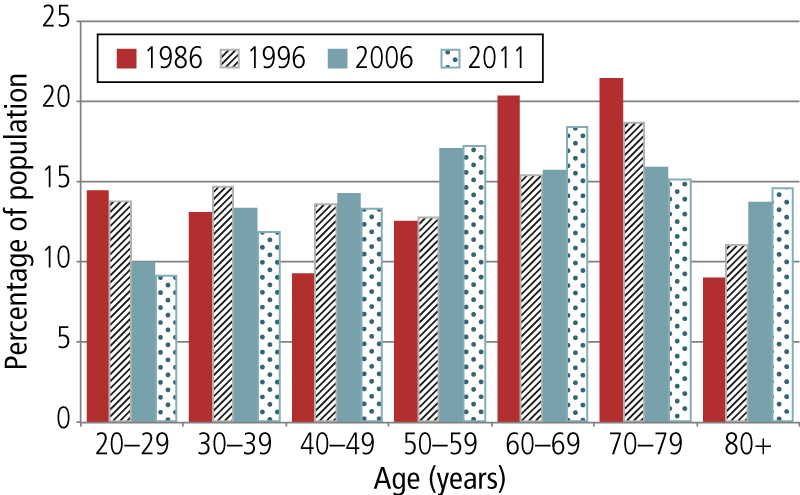
Source: ABS Census of Housing and Population (various years); 1986 and 1996 figures are from customised data cubes, and 2006 and 2011 figures were produced from Table Builder Pro
Some of these changes in the age profile of those living alone reflect changes in the population structure over the same period. Since the population is ageing, we would expect that young people would represent a smaller proportion of those living alone in 2011 and that older people would represent a larger proportion. It is therefore important to see how the changing age profile of those living alone compares to the changing age profile of the population at large. Do changes in the two age profiles match or is the age profile of those living alone changing in different ways to the population as a whole?
Figure 4 shows the following:
- Those in their 20s declined by 5 percentage points as a share of the living alone population from 1986 to 2011 (bottom bar in graph for 20-29 year olds). But since people in their 20s declined by 6 percentage points in the whole 20+ population (top bar in graph for 20-29 year olds), the fact that there were relatively fewer younger people living alone reflects the fact that by 2011 there are relatively fewer young people available to live alone.
- In the living alone population, those in their 30s declined by just 1% percentage point (bottom bar in graph for 30-39 year olds) - considerably less than would be expected given the fact that people in their 30s declined by 5 percentage points of the 20+ population (top bar in graph for 30-39 year olds).
- Those in their 60s and 70s became less common in the living alone population despite maintaining their share of the 20+ population.
- The oldest age group (over 80) increased their share of the living alone population at a much faster rate than they grew in the 20+ population (6 percentage points compared to 2 percentage points).
Figure 4: Rate of change in living alone by age group compared to rate of population change, Australia, 1986-2011
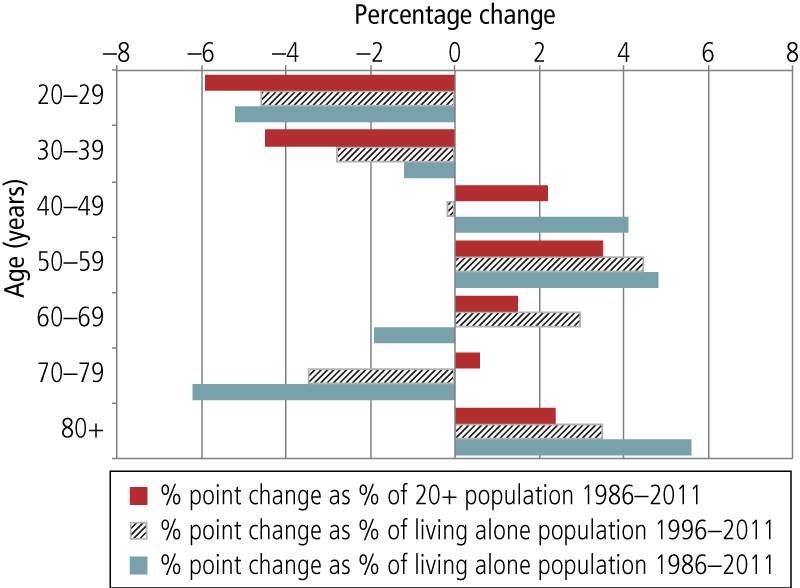
Source: ABS Census of Housing and Population (various years); 1986 and 1996 figures are from customised data cubes, and 2006 and 2011 figures were produced from Table Builder Pro
It is worth noting that, consistent with the ageing of the population, the rise of people aged 80+ years among those people living alone has been continuing since 1986 (with an increase of 4 percentage points between 1996 and 2011, and 6 percentage points between 1986 to 2011).
While the changing age profile of those who live alone is partly linked to changes in the population structure, it is also partly due to changes in the rate at which the various age groups live alone in 2011 compared to 1986. Some age groups are now living alone at a lower rate than previously, while others have increased their rates of living alone.
Table 2 shows that since 1986 the rate of living alone:
- increased among those aged in their 30s, 40s and 50s, but most of this occurred between 1986 and 1996 (second last column), with very little change since then (last column);
- declined among those in their 70s; and
- increased sharply among those aged 80 and over, though most of this increase took place between 1986 and 1996 (second last column), with no increase since 1996 (last column).
| Age (years) | 1986 (%) | 1996 (%) | 2006 (%) | 2011 (%) | Percentage point change 1986-2011 | Percentage point change 1996-2011 |
|---|---|---|---|---|---|---|
| 20-29 | 5.6 | 7.8 | 7.0 | 6.3 | 0.7 | −1.5 |
| 30-39 | 5.3 | 7.9 | 8.4 | 8.0 | 2.7 | 0.1 |
| 40-49 | 5.2 | 8.0 | 8.8 | 8.7 | 3.5 | 0.7 |
| 50-59 | 8.6 | 10.8 | 12.2 | 12.6 | 4.0 | 1.8 |
| 60-69 | 15.7 | 16.8 | 16.9 | 17.5 | 1.8 | 0.7 |
| 70-79 | 26.3 | 27.3 | 25.1 | 24.3 | −2.0 | −3.0 |
| 80+ | 28.0 | 34.0 | 35.6 | 33.8 | 5.8 | −0.2 |
| All | 9.3 | 11.9 | 12.5 | 12.6 | 3.3 | 0.7 |
Source: ABS Census of Population and Housing (various years); figures for 1986 and 1996 are from customised data cubes, while those for 2006 and 2011 were obtained via Table Builder Pro
Does marital status affect living alone?
This section describes the links between marital status and living alone and shows how the marital status of different age groups is linked to living alone.
Wider social changes have meant changes in the marital status of the population. Greater longevity of both men and women means that widowhood is increasingly delayed until later in life. Higher divorce and separation rates since the family law reforms of 1976 have produced a population of people liable to live alone. Similarly, delays in partnering and the rise of cohabitation, coupled with the relative instability of these relationships, increase the pool of people who may live alone.
While having never married, having separated or divorced, or being widowed creates a pool of people who may potentially live alone, these marital statuses do not necessarily result in actually living alone since other living arrangements are available. So how does marital status link to the chance of living alone? Table 3 shows that:
- only among widows does a majority (54%) live alone;
- compared to widows, relatively fewer (a third) of those who are separated or divorced live alone;
- there are two main reasons why divorced or separated people do not live alone:
- many have children living with them following separation - 41% were lone parents (50% of women); and
- a third were in a de facto relationship; and
- fewer than one in five people who have never married (17%) live alone. In part this relatively low rate of living alone is because those who have never married are younger than the other groups. Many of these never married people who do not live alone live with parents (33%) or in group households (16%), and a further 38% are either a lone parent or in a de facto relationship.
| Living arrangement | Married (%) | Never married (%) | Separated/ divorced (%) | Widowed (%) |
|---|---|---|---|---|
| Lone person | 0.7 | 17.3 | 33.2 | 54.3 |
| Not living alone | 96.3 | 77.5 | 62.7 | 31.2 |
| Non-private dwelling | 3.0 | 5.2 | 4.1 | 14.5 |
| Total | 100.0 | 100.0 | 100.0 | 100.0 |
Source: ABS Census of Population and Housing, 2011, using Table Builder Pro
Marital status and age are obviously linked. Among younger age groups, living alone is associated with delays in marriage; in the middle age groups, living alone often results from separation and divorce; while among older people, living alone is more often than not the result of the death of a partner (Figure 5).
Figure 5: Marital status of those living alone, by age group, Australia, 2011
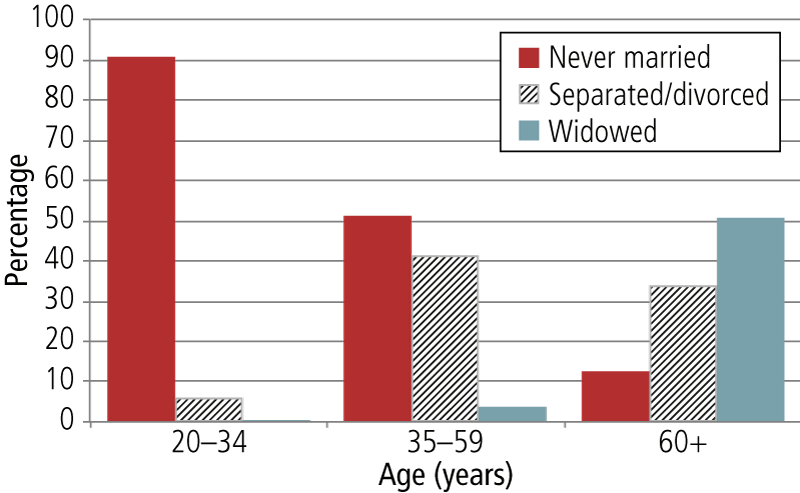
Source: ABS Census of Population and Housing, 2011, using Table Builder Pro
While people who live alone in early adulthood mainly have never married and many middle-aged people living alone have never married, relatively few older people who live alone (11%) have never married. Figure 5 highlights the importance of marital separation as a factor behind living alone, and there is no doubt that separation is one of the drivers in the growth of living alone: separations are a significant component of the living alone population among both the middle age group (41%) and the older group (33%). The importance of these separations is likely to be one of the reasons why the growth in living alone is particularly concentrated in the middle age groups.
Since people who are not partnered provide the main pool of people who can live alone, changes in patterns of couple formation and dissolution will have an effect on both overall rates and age-related patterns of living alone.
The different rates of living alone within each marital status category, as observed earlier, go some way to explaining patterns of growth in living alone. Since relatively few never-married people live alone, any increase in people never marrying or delaying marriage will have only a modest effect on living alone. Changes in separation and divorce will have more effect, given that a third of separated people live alone. But since living alone rates are highest among widows, any changes to the timing and duration of widowhood will have the greatest effect on living alone rates.
The marital status of older people who live alone can be examined more closely. It comes as no surprise that in the 60+ age group there is a marked change in the marital status of those living alone with each decade of age. The marital status of older men and women is also somewhat different. Table 4 shows that among the older age groups:
- divorce and separation mainly characterise those living alone in their 60s and men in their 70s;
- widowhood is the main cause of living alone for women in their 70s and both men and women in their 80s;
- increased longevity is delaying widowhood and is shifting living alone in later life from commencing in the 70s age group and delaying living alone until people move into their 80s; and
- having never married contributes to rates of living alone in later life - but more so for men than for women. Of men who live alone in their 60s and 70s, over 20% have never married, compared to less than 10% of similarly aged women who live alone.
| 60-69 years | 70-79 years | 80+ years | ||||
|---|---|---|---|---|---|---|
| Male (%) | Female (%) | Male (%) | Female (%) | Male (%) | Female (%) | |
| Never married | 26.8 | 12.7 | 20.0 | 6.7 | 11.1 | 4.3 |
| Widowed | 11.5 | 31.9 | 33.1 | 65.9 | 65.9 | 85.6 |
| Separated/divorced | 57.8 | 53.1 | 43.0 | 25.0 | 16.7 | 7.9 |
| Married | 3.9 | 2.3 | 3.9 | 2.4 | 6.3 | 2.2 |
| Total | 100.0 | 100.0 | 100.0 | 100.0 | 100.0 | 100.0 |
Source: ABS Census of Population and Housing, 2011, using Table Builder Pro
How common is living alone in ethnic groups?
Cultural norms affect living arrangements. These norms affect matters such as childlessness, divorce, multi-family household living and the acceptability and desirability of living alone. Further, cultural groups will have varying financial resources that in turn affect the capacity of people to live alone.
Table 5 reports the percentage of people born in different countries who live alone. A number of patterns emerge. Disregarding age group, it shows that:
- The highest rates of lone living are among those who were born in Western and North-Western Europe, Southern and Eastern Europe and the United Kingdom. In general terms, this reflects patterns in these countries of origin where the rates of living alone are relatively high (Table 1).
- The percentage of Australian-born people who live alone falls midway between the high rates of those born in various parts of Europe and the United Kingdom and the low rates of most Asian areas and the Middle East.
- The lowest rates of living alone are found among those born in Southeast Asia, China and the Middle East.
However, the patterns of living alone are somewhat different when considering just older people born in different countries. Table 5 shows that:
- Among older people (60 and over) those born in Australia have the equal-second highest rates of lone living (24%) - a rate that is only exceeded by those older people born in Eastern Europe (30%).
- The rate of those living alone among Australian-born people aged 60+ are very similar to those of people born in Western and Northern Europe, the United Kingdom and Ireland.
- Older people born in Greece, Asia and the Middle East have relatively low rates of lone living - certainly much lower than among the older Australian-born population. For example, in 2011, while 24% of Australian-born people aged 60 or over lived on their own, just 14% of Greek-born older Australians and 11% of Chinese-born older Australians lived on their own.
| Country of birth | 20-39 years (%) | 40-59 years (%) | 60+ years (%) | All ages (20+ years) (%) |
|---|---|---|---|---|
| Eastern Europe | 8.4 | 11.6 | 29.5 | 19.6 |
| Western Europe | 8.1 | 11.6 | 24.5 | 18.3 |
| Italy | 8.7 | 8.3 | 19.0 | 16.2 |
| United Kingdom | 7.3 | 10.1 | 22.3 | 14.8 |
| Northern Europe | 6.1 | 10.7 | 24.0 | 14.0 |
| Australia | 7.7 | 11.7 | 24.5 | 13.2 |
| Greece | 7.1 | 8.3 | 14.3 | 12.6 |
| Southern and South-Eastern Europe (excl. Greece and Italy) | 6.0 | 7.9 | 18.0 | 12.1 |
| Ireland | 5.8 | 9.6 | 23.4 | 12.0 |
| New Zealand | 6.1 | 10.9 | 21.7 | 10.8 |
| Japan and Korea | 6.7 | 5.5 | 14.9 | 7.1 |
| Middle East | 5.2 | 5.6 | 12.9 | 6.8 |
| South East Asia | 6.1 | 5.5 | 12.2 | 6.7 |
| Chinese Asia a | 6.5 | 4.9 | 10.7 | 6.6 |
Note: a Chinese Asia consists of China, Hong Kong, Macau, Mongolia, Taiwan.
Source: ABS Census of Population and Housing, 2011, using Table Builder Pro
Are people living alone renters?
There are good reasons for expecting that people living alone would rent rather than purchase a home.
- First, since lone-person households rely on one income, it would be more difficult, at least among younger age groups, to purchase a home. For lone-person households formed as a result of separation, the person living alone will often have financial obligations that make it difficult to purchase again, at least in the short term.
- Second, for some people, living alone is part of a lifestyle that enables mobility, change and flexibility. Where these issues are priorities, renting is an attractive arrangement that means that the person is not tied down and can take advantage of the greater freedom afforded by living alone.
These expectations of renting hold for people aged under 60. Figures 6a and 6b show that the older the person living alone:
- the lower the rate of renting; and
- the higher the rate of home ownership.
Figure 6a: Housing tenure type by age group of those living alone, Australia, 2011
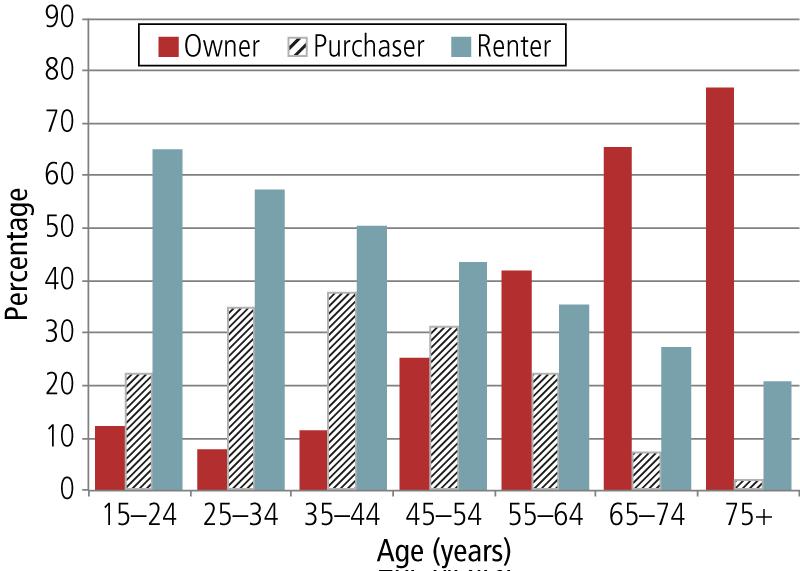
Figure 6b: Housing tenure type by age group of those not living alone, Australia, 2011
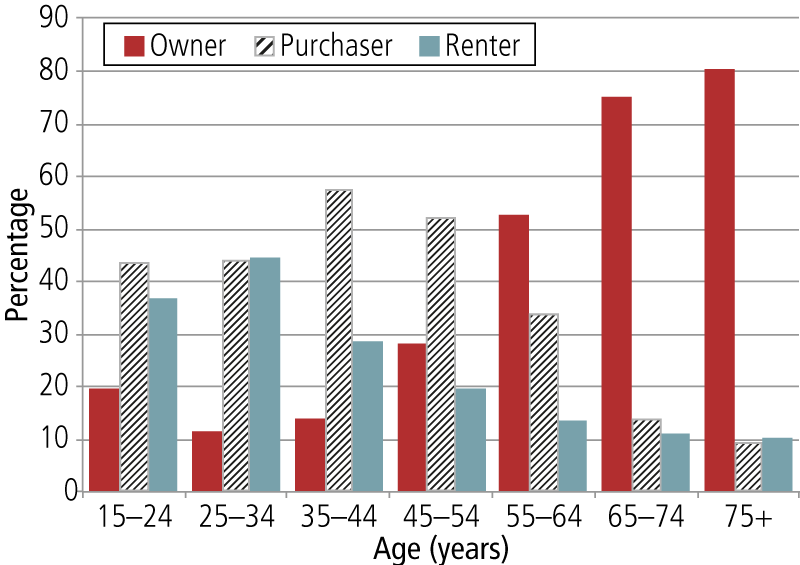
The high rate of home ownership among older people who live alone is because many of these people are living alone due to widowhood. In these cases, the home will likely have been purchased by a couple.
A comparison of the two graphs in Figures 6a and 6b indicates that in every age group:
- home purchasing and ownership are more common among multi-person households than among lone-person households and;
- renting is more common among lone-person households than in multi-person households.
Professor David De Vaus and Dr Lixia Qu are Senior Research Fellows at the Australian Institute of Family Studies.
Feature photo © istockphoto/rollover
de Vaus, D., & Qu, L. (2015). Demographics of living alone (Australian Family Trends No. 6). Melbourne: Australian Institute of Family Studies.
978-1-922038-98-2
Social advantage and disadvantage
People may live alone because they can both afford to and choose to. For others, living alone may not be their desired arrangement - they may live alone because of difficulties finding a partner, as a result of relationship breakdown, or following the death of a partner.
Is living alone more common among the well-to-do or among the more disadvantaged and marginalised? On the one hand it might be expected that living alone will be more common among the more highly educated middle class. It is an arrangement that is more within the financial reach of people with better incomes, and compatible with the more middle-class values of privacy, independence, freedom and flexibility. The international comparisons (Table 1) indicate that living alone has been much more common among the more economically advanced nations, and the growth of living alone seems to be associated with rising standards of living.
However, those who see living alone more negatively offer a different perspective. In some of the popular discourse, living alone is represented as a failure - as a sign of being unable to develop or sustain relationships, of marginalisation and social fragmentation. By this view, we might expect that living alone will be more common among the more marginalised sectors of the population - among those with less education, without a job and with lower income.
The section below addresses the question of whether living alone is more common among those who are doing well in terms of traditional measures of socio-economic status or whether it is more common among those who are doing less well. The answer is not straightforward and depends on a person's gender and age group.
Are those with higher education more likely to live alone?
The short answer to this question is yes and no. The educational level of women who live alone is quite different to that of men who live alone. Women who live alone stand out for having high levels of education while men who live alone have relatively low education (Table 6).
Source: ABS Census of Population and Housing, 2011, using Table Builder Pro
The high education of women who live alone is especially evident for women aged under 60 and clearest among those aged under 40. These women who live alone have higher education than women who do not live alone and higher education than men in general.
Comparing women who live alone with women who do not live alone shows that:
Comparing the education levels of women who live alone with those of men who live alone shows that:
While women who live alone have relatively high levels of education the picture is different for men - particularly middle-aged men (aged 40-59) - who live alone. Middle-aged men who live alone stand out for their relatively low levels of education, with:
Are those with a higher income more likely to live alone?
Middle-aged men who live alone have lower incomes than middle-aged men living with others. Table 7 reports the income quintile into which a person's individual income falls (of those aged 20-59). Quintile 1 is the income range in which the lowest 20% of incomes falls, while quintile 5 is the income range of the highest 20% of income earners.
Table 7 demonstrates the poorer income position of middle-aged men living alone. Among middle-aged men:
Source: ABS Census of Population and Housing, 2011, using Table Builder Pro
Women show the opposite pattern. Women living alone are higher income earners than women who live with others. For example:
This pattern among women is hardly surprising, and undoubtedly largely reflects the fact that many women living with others will have lower rates of workforce participation, and thus income, due to family responsibilities.
Is labour force status linked to living alone?
The links between living alone and labour force participation are similar to those for income. Unsurprisingly, women living alone have higher levels of labour force participation than women not living alone (Table 8). Among younger women living alone:
Source: ABS Census of Population and Housing, 2011, using Table Builder Pro
As with income, the most instructive pattern emerges with middle-aged men, where men living alone have a lower level of workforce participation than men who live with others. For example, among middle-aged men living alone:
Which occupational groups are more likely to live alone?
The occupational profile of men and women who live alone reflects a similar picture to the other measures of social advantage and disadvantage. The occupational profile of younger women who live alone reflects greater social advantage than that of young women who do not live alone. It also reflects a more socially advantaged situation than for younger men in general. In contrast, middle-aged men who live alone seem to fare less well than men who do not live alone.
Table 9 shows young women who live alone to be:
Note: Percentages are based on those in the labour force.
Source: ABS Census of Housing and Population, 2011, using Table Builder Pro
The same pattern is repeated, but not as sharply, among middle-aged women.
Among middle-aged men some evidence of the same pattern of relative social disadvantage is repeated. Although there were no differences between men living alone and with others in regard to professional occupations, there were differences in relation to managerial and labouring occupations. Among middle-aged men, those who live alone:
In summary, whatever the measure of social advantage or disadvantage, a consistent picture emerges that shows that younger women who live alone are a socially advantaged group in terms of their education, labour force levels, income and occupational group. They stand out in these respects from women who do not live alone and from men in general in the same age group. In many respects these young women who live alone are well-to-do and have options. We can only speculate why these young women are living alone, but four possibilities can be offered:
In contrast, all the measures show that middle-aged men who live alone stand out because of their relative lack of success on these aspects of achievement. Compared to other middle-aged men, those who live alone are more likely to have lower levels of education, be less likely to be in the labour force, have lower income and have less prestigious (and lower paying) jobs. We interpret the high levels of living alone among the less advantaged middle-aged men as being due, at least in part, to their being less reliable breadwinners and thus less attractive as partners.
The question raised at the beginning of this section was: Does living alone reflect success and the financial resources that go with success, or does it reflect the living arrangement of the less successful and more marginalised? The answer appears to be that it is both. Living alone appears to be linked with social advantage among younger women but with social disadvantage among middle-aged men.