Families working together
Getting the balance right
You are in an archived section of the AIFS website
The National Families Week theme for 2013 draws attention to the sometimes difficult task of achieving balance in our lives. Achieving balance can be helped by working together in our immediate and extended families, as well as with friends, neighbours and the wider community.
One of the pressing challenges today is finding the balance between the hours spent in paid work and the time spent with family and friends, in community activities, and looking after our own health and wellbeing. This facts sheet highlights some of the ways in which such time commitments vary over the life course, and how families manage these and other competing demands on their time. It draws on a range of Australian data to highlight some current trends.
Employment over the life course
Almost all people are in the labour force at some stage in their lives, although there are distinct differences in the levels of involvement of men and women at different life stages and transitions. This is apparent if labour force status by age (according to the 2011 Australian Census) is examined for men and women (Figure 1).1
- When men and women are young (aged 15-24 years), patterns of labour force involvement are quite varied. In 2011, more than one in three were not in the labour force (36%), but many of these people would have been studying or training full-time. Some had difficulties finding work, as indicated by the percentages unemployed (9% and 7% for young men and women respectively, which are higher rates than for any other age group). Just over half of this age group were employed, but part-time work (that is, working fewer than 35 hours per week) was quite common. For some, this reflects combining part-time work with study or training, while for others (mostly women), this reflects some take-up of part-time work by those who had had their first child.
- The patterns of men's labour force participation then stay quite stable from ages 25 through to 54 years, with over 70% employed full-time, 12-14% employed part-time, 5% or fewer unemployed and 9-12% not in the labour force. Women's labour force status looks quite different to men's, with more part-time work being done by women, especially between the ages of 25 and 54 years. Also, more women than men were not in the labour force at this stage. The different patterns of involvement by women at these ages reflects that many women withdraw from paid work, or reduce their hours of paid work, when they have young children to care for.
- In the 55-64 years age group, employed men begin to retire from or reduce their involvement in paid work, and this is true too of women. The percentages employed at this age, and older ages, are therefore lower than at younger ages. For example, 24% of men and 13% of women aged 65-74 years were employed in 2011. At ages 75 years and over, very few men and women are employed. More detailed analyses of parental employment patterns, including trends over the last 30 years, are presented in Australian Family Trends No. 1.
Figure 1: Labour force status, by sex and age, 2011
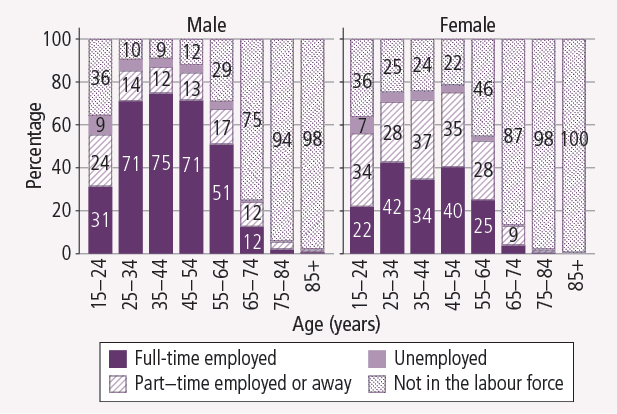
Note: Excludes those with labour force status or hours worked not stated. Numbers for percentages of 5% and lower are not shown.
Source: Census 2011 Tablebuilder
Work and family over the life course
Differences in employment participation through the pre-retirement ages are clearly related to family reasons, with mothers often taking time out of employment, or reducing hours to part-time when they have young children at home. This is evident when looking at time use data from the Household, Income and Labour Dynamics in Australia (HILDA) survey for men and women at different life stages.2
The first life stage considered is that of young men and women (aged less than 35 years) who still lived with their parents. They were found to spend 20 hours per week on paid employment (or commuting)3 and 6 hours per week on household tasks, errands or outdoor work. One hour or less per week was spent on each of parenting/playing with children or volunteering/caring. Unlike for the other life stages, these data are not shown in Figure 2, since one of the likely ways in which these people spend their time is not captured in these data; that is, time spent in study or training. This would account for a considerable amount of the day for some of these young men and women.
Figure 2 shows the time spent by men and women at other life stages in employment, doing household-related tasks, parenting/playing with children, or volunteering/caring. Across the life stages, there are different gendered patterns of engagement in work and family life.
- When living apart from parents, but before having children, young men and women had similar patterns of time use, although men spent more time than women in paid work and associated commuting(on average, 42 hours compared to 35 hours per week respectively). Men and women in this group spent similar amounts of time on household work (averages of 12 hours and 14 hours per week respectively).
- Compared to fathers, mothers with young children (aged less than 5 years) in the home, spent less time in paid work/commuting (on average, 14 hours per week, compared to 46 hours for fathers), but more time on household work (averages of 32 hours and 15 hours per week respectively) and more time on child care (41 hours and 17 hours per week respectively).
- When children were a little older - when the youngest was aged 5-14 years - fathers spent an average of 46 hours per week in paid work/commuting. Mothers' average time in paid work/commuting at this life stage increased to 25 hours per week. Time spent in household work for men and women remained at similar levels to parents of younger children (29 hours per week for women and 17 hours for men), while time spent in parenting declined (18 hours per week for women and 11 hours for men).
- The next life stage examined includes men and women who did not have children aged under 15 years living in the home, but were aged between 35 and 54 years, and so had not reached the typical retirement age. At this life stage, men spent 42 hours per week, on average, in paid work/commuting. This is slightly fewer hours than among men with children in the home. Women's paid work/commuting hours increased to 31 hours per week at this life stage.
- The next life stage group presented is for men and women aged between 55 and 64 years without children living in the home. At these ages, men and women have reduced their time in paid work/commuting (averages of 31 hours and 18 hours per week respectively), and time spent on household tasks is a little higher than that apparent for the 35-54 age group (averages of 17 hours and 28 hours per week for men and women respectively).
- For those aged 65 years and over, most have significantly reduced their labour market involvement, with men and women each spending less time in paid work/commuting (averages of 5 hours per week for men and 2 hours for women). Household tasks took up, on average, 30 hours per week for women and 22 hours for men.
- The average time spent volunteering or caring is greatest at the two later life stages examined here, though the average time in these activities only amounted to 3-5 hours per week for men, and 5-6 hours per week for women.
Figure 2: Time use of men and women at different life stages, 2011

Note: Excludes men and women aged less than 35 years who are living at home with parents (see text for details).
Source: HILDA Wave 11 (2011)
Sharing child care and housework
The Longitudinal Study of Australian Children (LSAC) also provides some insights into mothers and fathers sharing child care and household work.4 For couple parents with children aged under 5 years, it is estimated that, per day:
- mothers spent 5.1 hours on child care and 3.8 hours on household work; and
- fathers spent 2.2 hours on child care and 1.3 hours on household work.
The estimates for mothers with a youngest child aged under 5 years decline with increasing paid work hours. Figure 3 shows that, per day:
- those who were not in paid employment spent 5.7 hours on child care and 4.5 hours on housework;
- those who worked part-time hours spent 4.9 hours on child care and 3.5 hours on housework; and
- those who worked full-time hours spent 3.6 hours on child care and 2.4 hours on housework.
Figure 3: Time spent on child care and housework, mothers and fathers, by mothers' paid work hours, parents with youngest child aged under 5 years, 2006-08

Source: LSAC Waves 2-3, B and K cohort
When mothers spend longer hours in paid work, fathers spend slightly more time doing child care and housework. Figure 3 shows that, per day:
- when mothers were not in paid employment, fathers spent 2.1 hours on child care and 1.3 hours on housework;
- when mothers worked part-time hours, fathers spent 2.2 hours on child care and 1.3 hours on housework; and
- when mothers worked full-time hours, fathers spent 2.6 hours on child care and 1.8 hours on housework.
Note that regardless of mothers' employment status, most fathers were themselves in full-time employment, and their paid work hours remained relatively high. The following trends are apparent for partnered fathers who were employed and whose youngest child was aged under 5 years:
- when mothers were not in paid employment or worked part-time hours, employed fathers worked an average of 47 hours per week; and
- when mothers worked full-time hours, employed fathers worked an average of 46 hours per week.
Differences in the time use of mothers and fathers are evident when examining how couples share specific child care activities. Using the 2011 HILDA survey, Figure 4 shows the reports of parents of children up to 12 years old regarding which person in the household undertook specific child care activities:
- For all tasks, the majority of parents stated that the mother always or usually did each activity, or that they were done by the mother and father equally.
- The activities that were more often undertaken by mothers than fathers were: helping children get dressed and staying home with children when they are ill.
- The activities that were more evenly shared were: playing with the children (or participating in their leisure activities) and getting the children ready for bed.
- The reports of mothers and fathers were similar for each activity, although fathers were more likely to say they and the mother shared the responsibility for the activity than were mothers, who more often reported that they alone always or usually undertook the activity.5
Figure 4: Sharing of child care activities, mothers and fathers reports, parents with youngest child aged up to 12 years, 2011
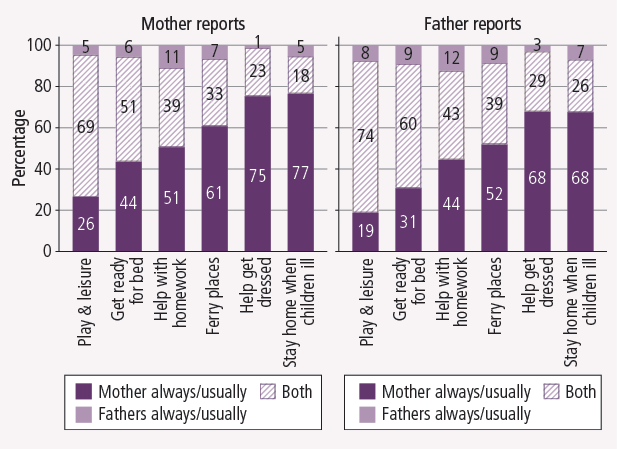
Note: The exact items were: "Dressing the children or seeing that the children are properly dressed"; "Putting the children to bed and/or seeing that they go to bed"; "Staying at home with the children when they are ill"; "Playing with the children and/or taking part in leisure activities with them"; "Helping the children with homework"; "Ferrying the children to and from places (such as school, child care or leisure activities)".
Source: HILDA Wave 11 (2011)
Time pressure and work-life balance
For many people, a consequence of trying to balance the responsibilities of work, family and other activities is that they feel that they are often rushed or pressed for time. In 2011, the HILDA survey showed that of all people aged 15 and over:
- 30% of men said they were almost always or often rushed or pressed for time, 45% said they sometimes were, and 25% said they rarely or never were; and
- 38% of women said they were almost always or often rushed or pressed for time, 43% said they sometimes were, and 18% said they rarely or never were.
Figure 5 shows that these perceptions vary with employment status and also the presence of children aged under 15 years.
- The men who were most likely to indicate feeling rushed or pressed for time were employed, with children aged under 15 years. In this group, 47% were always or often rushed or pressed for time, 42% sometimes, and 11% rarely or never.
- Employed women with children were more likely than other women to be rushed or pressed for time, with 62% always or often being rushed, 32% sometimes, and 6% rarely or never.
- For both men and women, those who were employed but without children were the next most likely to be often or always rushed or pressed for time.
Figure 5: Perceptions of being rushed or pressed for time, men and women, by employment status and presence of children, 2011
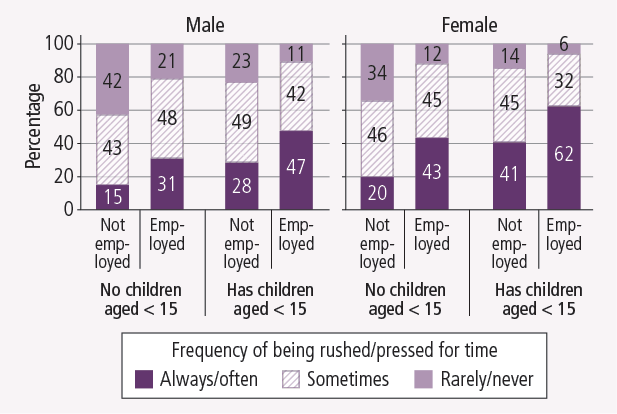
Source: HILDA Wave 11 (2011)
When asked about the flexibility of their jobs, employed men and women in the HILDA survey reported quite high levels of satisfaction with the flexibility that they had to balance work and non-work commitments. Figure 6 shows that:
- fewer than 1 in 20 employed men and women reported being very dissatisfied about the flexibility they had in balancing their work and non-work commitments;
- around 6 in 10 employed men and women reported being very satisfied about this issue; and
- satisfaction did not appear to vary according to whether these employed men and women were parents of children aged under 15 years.
However, satisfaction appears to vary according to job characteristics. For example, as might be expected:
- among men and women who were able to access flexible start and finish times, 71% were most satisfied with their flexibility to balance work and non-work commitments, 27% scored in the middle of the range, while fewer than 2% were at the most dissatisfied end of the scale; and
- among men and women who were not able to access flexible start and finish times, 47% were most satisfied with their flexibility to balance work and non-work commitments, 46% scored in the middle of the range, and 7% were at the most dissatisfied end of the scale.
Figure 6: Satisfaction with job flexibility for balancing work and non-work commitments, employed men and women with and without children, 2011
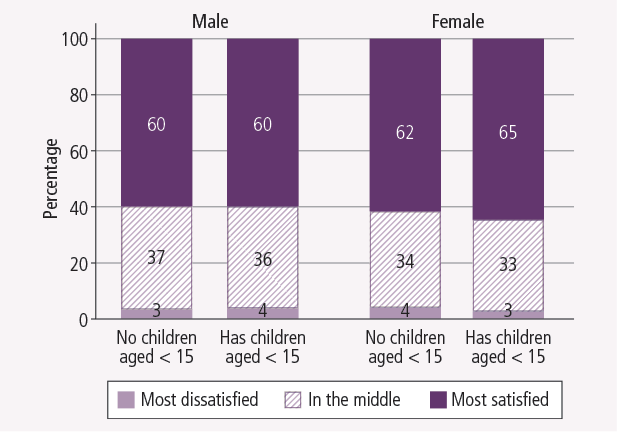
Note: Satisfaction about the flexibility to balance work and non-work commitments was measured on a scale of 0 (totally dissatisfied) through to 10 (totally satisfied). "Most dissatisfied" were those who scored 0 to 2, "in the middle" had scores 3 to 7, and "most satisfied" had scores 8 to 10.
Source: HILDA Wave 11 (2011)
Community engagement beyond the labour market
Men and women can also make a vital contribution to the Australian community through unpaid or voluntary work. Here, three different forms of unpaid work are considered, with data sourced from the 2011 Australian Census. Of those aged 15 years and over:
- 11% of women and 5% of men had undertaken unpaid care of someone else's children in the two weeks prior to Census night;
- 13% of women and 9% of men had provided care or help to someone due to that person's disability, ill health or old age in the week prior to Census night;
- 21% of women and 17% of men had volunteered through an organisation or group in the twelve months prior to Census night; and
- in general terms, 34% of women and 25% of men reported undertaking some form of unpaid work.6
The percentage of men and women involved in various unpaid or voluntary activities is shown by age in Figure 7.
- The percentage who undertook at least one of the unpaid activities peaked in the 55-64 and 65-74 age groups for both men and women, and was also higher than average for those aged 45-54 years.
- The percentage reporting that they provided unpaid care of others' children peaked in the 55-64 and 65-74 years age groups, especially for women.
- Caring for someone due to their ill health, disability or old age also peaked at 55-64 years, with some gradual increase with age in the percentage undertaking this activity up until the 55-64 age group, followed by a gradual decline into older ages.
- Volunteering through groups or organisations was undertaken by men and women of varying ages, with the percentage only dropping in the oldest age group.
Figure 7: Unpaid activities of men and women, by age, 2011
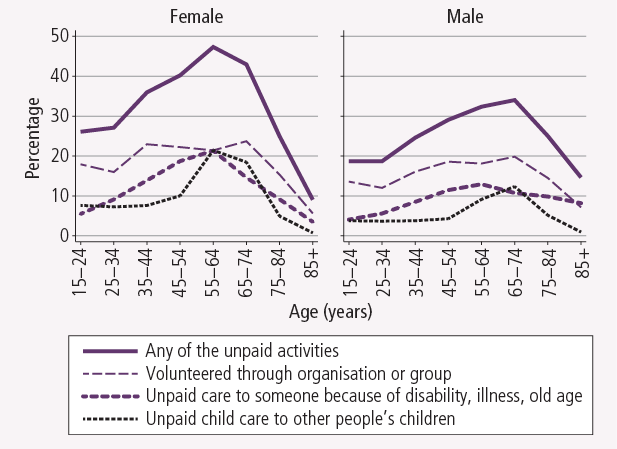
Note: Care of older/ill/disabled person refers to care in the previous week. Voluntary work is any voluntary work through groups or organisations in the last 12 months. Child care captures those caring for other peoples' children and includes care done in the previous two weeks. Those with a "not stated" response on any of these activities were assumed to have not participated in that activity.
Source: Census Tablebuilder, 2011
Engagement in the wider community can also be reflected in the types of social engagement people have with friends and family, including those outside their household. In the 2010 ABS General Social Survey,7 men and women aged 18 years and over were asked about their social activities in the previous three months. Figures did not vary a great deal for men and women, so results are presented for all people:
- 92% had visited or been visited by friends;
- 75% went out or met with a group of friends for outdoor activities;
- 73% went out or met with a group of friends for indoor activities;
- 40% spent some time in Internet-related social activities; and
- 43% undertook other informal social activities.
While the majority had engaged in some social engagement, the 8% who had not visited or been visited by others in the previous three months may represent a group of quite socially isolated people who are in need of supports and services.
When analysed by age, Figure 8 shows that:
- high levels of participation in visiting or being visited are apparent across all ages, with around 95% of people aged under 54 years having visited or been visited by friends in the previous three months, declining to lows of 81% for those aged 75-84 years and 85% for those aged 85 years and over;
- participation in other social activities tended to decline more with age; and
- the greatest age-related differences were for participation in Internet social activities, with more than 70% of 18-24 year olds having undertaken this form of social activity, compared to around 20% of 55-64 and 65-74 year olds.
Figure 8: Social activities in the previous three months, by age, 2010

Note: Estimates for Internet social activities are not shown for persons aged 75 years and older, and for other informal social activities for those aged 85 years and over, because of higher relative standard errors on the estimates.
Source: ABS General Social Survey 2010 publication table, Table 33.3 Social involvement, by age and sex, proportion
Conclusion
This facts sheet has described some of the ways in which men and women of various ages and life stages spend their time, focusing on paid work, caring and volunteering, and the social aspects of spending time with family and friends. At different points in our lives, these various ways of spending time can compete with each other, causing feelings of time pressure for many people. It is valuable to be reminded of the need to find the balance between these competing demands on our time, and to be mindful of finding time to care for our own wellbeing as well as that of others around us.
Endnotes
1 See Australian Bureau of Statistics (ABS). (2012). Census: Data and analysis. Canberra: ABS. Retrieved from <tinyurl.com/c6l63lz>. These data were derived using Tablebuilder.
2 The HILDA project was initiated and is funded by the Australian Government Department of Families, Housing, Community Services and Indigenous Affairs (FaHCSIA) and is managed by the Melbourne Institute of Applied Economic and Social Research (Melbourne Institute). The findings and views reported in this paper, however, are those of the author and should not be attributed to either FaHCSIA or the Melbourne Institute. These data are derived from Wave 11 (2011) of the HILDA survey. All estimates include those who did not report any time on the activity.
3 Commuting time is included in all these estimates of time in paid work. Out of an overall average of 26.0 hours per week spent on employment and commuting, 23.3 hours was on employment and 2.7 hours was on commuting.
4 The data here are derived from LSAC Waves 2-3, B and K cohort (N = 6,586 responses from 4,485 couple families). LSAC is conducted in a partnership between the Department of Families, Housing, Community Services and Indigenous Affairs (FaHCSIA), the Australian Institute of Family Studies (AIFS) and the Australian Bureau of Statistics (ABS). The findings are those of the authors and should not be attributed to FaHCSIA, AIFS or the ABS.
5 These analyses are based on 1,321 households in which mothers and fathers both provided responses to these questions. Responses were excluded if someone other than the mother and/or father was said to do these activities. Sample sizes were smaller for some items (e.g., helping with homework was not applicable to families with only very young children).
6 The different reference periods for each set of data here makes this somewhat difficult to interpret, but an aggregate result is also provided.
7 See Australian Bureau of Statistics. (2010). 41590DO010_2010 General Social Survey: Summary Results, Australia (Cat. No. 4159.0). Canberra: ABS, Table 33.1 Social involvement, by age and sex.
Baxter, J. (2013). Families working together: Getting the balance right. Family Matters, 92, 77-83.
18 July 2013