Growing Up in Australia: The Longitudinal Study of Australian Children
Entering adolescence and becoming a young adult
You are in an archived section of the AIFS website
In March 2014, the fifth wave of Growing Up in Australia: The Longitudinal Study of Australian Children (LSAC) was released. For the K cohort (kindergarten cohort) this means that information has been collected and released on children from 4-5 through to 12-13 years of age. That span of time marks an important transition to adolescence. Adolescence is widely considered to begin with the onset of puberty, with early adolescence typically spanning 10 to 14 years of age and late adolescence, 15 to 19 years of age. In the remainder of this article, these age groups will be referred to as young people. This period of development is marked by rapid development physically, cognitively and emotionally, and LSAC is uniquely placed to provide a national perspective on this period of life to inform the development of better policies, programs and services to support young people in a successful transition to young adulthood (20 to 24 years).
Information from LSAC is already providing some interesting insights into the onset of puberty. At age 8-9 years, we have asked parents about whether their children have started puberty, and in subsequent waves we repeated these questions to track the onset and variation in the physical signs of puberty. These physical signs include skin changes, body odour, body hair, and for girls, breast growth. These changes can then be categorised as definite physical signs of puberty starting (e.g., Mensah et al., 2013). Figure 1 shows the percentage of boys and girls at ages 8-9, 10-11 and 12-13 years that have started showing any of the definite signs of the onset of puberty. As can be seen from Figure 1, the onset of puberty starts quite early for some children, with 16% of girls and 7% of boys showing signs of puberty definitely starting at age 8-9 years. By 10-11 years, this had increased substantially to 74% for girls and 53% for boys. By 12-13 years, almost all girls (92%) and two-thirds of boys were showing the signs of the onset of puberty.
Figure 1: The start of puberty, by child age and gender
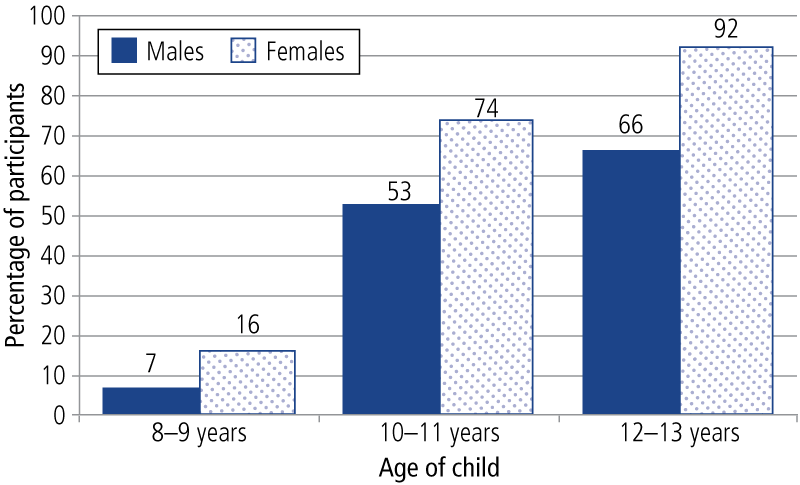
Note: Population weights, LSAC K cohort, Waves 3, 4 and 5
With the onset of adolescence well in train, and young adulthood emerging around the corner, the key research questions that frame LSAC are being revised and updated, while still keeping within the broad scope of the study, which focuses on the contribution of the children's social, economic and cultural environments to their adjustment and wellbeing.1 The study has examined physical health and social, cognitive and emotional development, and has a huge capacity to identify how family, early child care, school and neighbourhood contexts can enhance or detract from human development.
LSAC is conducted as a partnership between the Department of Social Services (DSS), the Australian Institute of Family Studies (AIFS) and the Australian Bureau of Statistics (ABS). DSS provides overall management of LSAC on behalf of the Australian Government; AIFS is responsible for the design and content of the study and for the preparation of research and statistical reports; and ABS is responsible for data collection and delivery, instrument development and management of the LSAC sample.
A consortium (the Consortium Advisory Group) of leading researchers at research institutions and universities throughout Australia provides advice to the study. The consortium brings together significant research expertise. It includes researchers from a wide range of disciplines, including child development, sociology, epidemiology, public health, family studies, psychology, paediatrics and child health, early childhood education, services and social policy research and economics (see Box 1). This breadth of expertise ensures comprehensive coverage of influences on child development.
Box 1: Consortium Advisory Group members
AIFS is supported by Professor Ann Sanson, as Principal Scientific Advisor, and the Consortium Advisory Group (CAG), which includes members from each of the consortium partners. The CAG is chaired by Professor Stephen Zubrick, and its membership is as follows:
- Dr John Ainley, Principal Research Fellow and former Head of Research at the Australian Council for Educational Research, Melbourne;
- Dr Peter Azzopardi, Centre for Adolescent Health, Murdoch Childrens Research Institute and Royal Children's Hospital, Melbourne;
- Professor Donna Berthelsen, Faculty of Education, Queensland University of Technology;
- Professor Michael Bittman, School of Behavioural, Cognitive and Social Sciences, University of New England;
- Associate Professor Jan Nicholson, Principal Research Fellow, Murdoch Childrens Research Institute, Melbourne;
- Professor Bryan Rodgers, Family Health and Wellbeing, Australian Demographic and Social Research Institute, Australian National University;
- Professor Ann Sanson, Department of Paediatrics, University of Melbourne;
- Professor Michael Sawyer, Research and Evaluation Unit, Women's and Children's Hospital, School of Paediatrics and Reproductive Health, University of Adelaide;
- Dr Lyndall Strazdins, Fellow, National Centre for Epidemiology and Population Health, Australian National University;
- Professor Melissa Wake, Centre for Community Child Health at the Royal Children's Hospital, Murdoch Childrens Research Institute and University of Melbourne; and
- Professor Stephen Zubrick, Head, Division of Population Science, Institute for Child Health Research, Perth.
Study design and sample recruitment
This section provides a brief description of the study's design and the way in which the initial sample was recruited. More detailed information can be found in discussion and technical papers on the project's website at <www.growingupinaustralia.gov.au>.
The study is using an accelerated cross-sequential design in which two cohorts of children are being followed for 14 years (and possibly longer), starting from when the children were aged 0-1 years in one cohort and 4-5 years in the other cohort. The 0-1 year old cohort is often described as the B (baby) cohort and the 4-5 year old cohort as the K (kindergarten) cohort (or alternatively, they can be identified by the years of their birth: 2003-04 birth cohort and 1999-2000 kindergarten cohort respectively).
Face-to-face interviews are conducted every two years, with the first wave of data collected in 2004. Wave 5 fieldwork was completed in February 2013.
The two-cohort design has enabled information on children's development over the first 10 or 11 years of life to be collected in six years. The two cohorts can also be compared at overlapping ages, to gauge the effect of growing up in differing social conditions and policy settings. The overlapping of cohorts first occurred in Wave 3 (at 4-5 years) and continues to occur for each subsequent wave (see Table 1).
| Cohort | Wave 1 | Wave 2 | Wave 3 | Wave 4 | Wave 5 | Wave 6 | Wave 7 | Wave 8 |
|---|---|---|---|---|---|---|---|---|
| Year | 2004 | 2006 | 2008 | 2010 | 2012 | 2014 | 2016 | 2018 |
| Infant (B) | 0-1 years | 2-3 years | 4-5 years | 6-7 years | 8-9 years | 10-11 years | 12-13 years | 14-15 years |
| Child (K) | 4-5 years | 6-7 years | 8-9 years | 10-11 years | 12-13 years | 14-15 years | 16-17 years | 18-19 years |
As the focus of the study is on children's development, "the child" was the sampling unit of interest. The sampling frame was the Medicare Australia (formerly the Health Insurance Commission) enrolments database. During 2004, a sample of more than 18,500 children within particular birth dates was taken from the Medicare administrative database. First, a sample of children was drawn via a random selection of 330 postcodes. Next, children and families within these postcodes were randomly selected for invitation into the study. A process of stratification was used to ensure that the numbers of children in each state/territory and within and outside each capital city were proportionate to the population of children in these areas.
A total of 10,090 children and their families participated in Wave 1; approximately half of the children were infants (aged 3-19 months) and half were 4-5 years old. The sample is broadly representative of all Australian children (citizens and permanent residents) in each of the two selected age cohorts: children born between March 2003 and February 2004 (B cohort) and children born between March 1999 and February 2000 (K cohort). Children in some remote parts of Australia were excluded because of the extremely high data-collection costs in these areas.
Response rates and sample retention
The final Wave 1 sample represented 53% of all families who were sent a letter by Medicare Australia. Refusals were the largest source of sample loss (31% for the B cohort and 35% for the K cohort), followed by "non-contact". Non-contact occurred when the address details were out-of-date or if only a post-office box address was available. The rates of non-contact were 10% for the B cohort and 14% for the K cohort. The response rates achieved if non-contactable families are excluded are 64% for the B cohort and 57% for the K cohort.
The Wave 5 data collection took place in 2012, with 8,041 families completing an interview, yielding a response rate of 80% of the originally recruited sample. Similar numbers of families from each cohort participated (4,085 in the B cohort and 3,956 in the K cohort). Table 2 summarises the response rates from families in later waves, using the Wave 1 sample and "available" sample as the bases for comparisons.
| Main waves | B cohort | K cohort | Total | ||||||
|---|---|---|---|---|---|---|---|---|---|
| No. | Response rate of Wave 1 (%) | Response rate of available sample (%) | No. | Response rate of Wave 1 (%) | Response rate of available sample (%) | No. | Response rate of Wave 1 (%) | Response rate of available sample (%) | |
| Wave 1 original | 5,107 | 100.0 | 4,983 | 100.0 | 10,090 | 100.0 | |||
| Wave 2 available a | 5,047 | 98.8 | 4,913 | 98.6 | 9,960 | 98.7 | |||
| Wave 2 responding b | 4,606 | 90.2 | 91.2 | 4,464 | 89.6 | 90.9 | 9,070 | 89.9 | 91.1 |
| Wave 3 available | 4,971 | 97.3 | 4,829 | 96.9 | 9,800 | 97.1 | |||
| Wave 3 responding | 4,386 | 85.9 | 88.2 | 4,332 | 86.9 | 89.7 | 8,718 | 86.4 | 89.0 |
| Wave 4 available | 4,929 | 96.5 | 4,774 | 95.8 | 9,703 | 96.2 | |||
| Wave 4 responding | 4,241 | 83.0 | 86.0 | 4,164 | 83.5 | 87.2 | 8,405 | 83.3 | 86.6 |
| Wave 5 available | 4,884 | 96.6 | 4,735 | 95.0 | 9,619 | 95.3 | |||
| Wave 5 responding | 4,085 | 80.0 | 81.1 | 3,956 | 79.4 | 83.5 | 8,041 | 79.7 | 83.6 |
Notes: a Available sample excludes those who opted out of the study between waves. Some additional families also opted out permanently during the fieldwork process. b Those who had home visit.
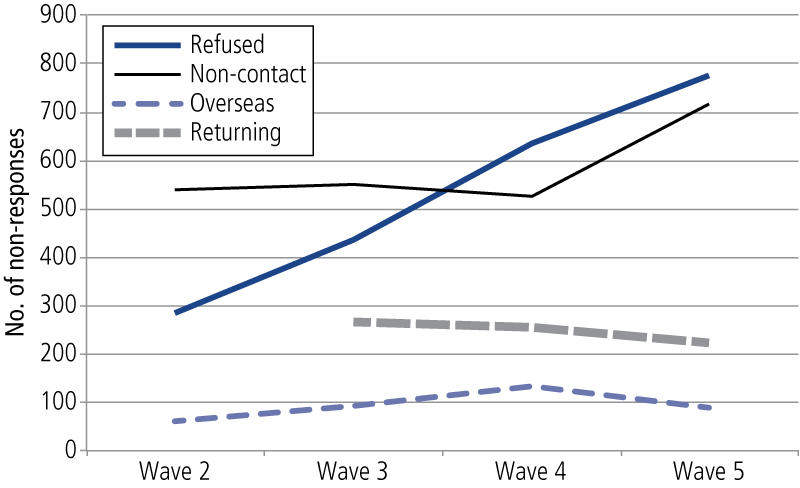
Figure 2 shows that after having participated in Wave 4, 774 families refused to participate in Wave 5. Eighty-eight families were overseas for the entire fieldwork period. A total of 714 families could not be contacted. Two-hundred and twenty-three families returned in Wave 5 who had not participated in Wave 4; of these, 57% had refused, 30% were not able to be contacted and 13% were overseas in the previous wave. Figure 3 also shows that the refusals and non-contacts are increasing for each wave, while the number of families returning who had previously not participated in previous waves has declined slightly. A concerted effort to engage families in future waves will be required to keep a high retention rate.
Figure 2: Reasons for non-response, by LSAC Waves 2, 3, 4 and 5
The LSAC retention rate compares favourably with those achieved by comparable international studies. The Millennium Cohort Study (MCS), for example, a United Kingdom longitudinal study of approximately 19,244 families and babies, has a much lower sample retention rate (Hansen, 2012). Figure 3 shows the percentage of the Wave 1 sample responding to subsequent waves of the MCS and the comparable LSAC cohort, the B cohort (birth cohort). Between Waves 1 and 2, LSAC was able to retain a much higher percentage of families participating in the study than the MCS. The percentage of families responding in LSAC, however, showed a similar, albeit less steep, decline to the MCS.
Figure 3: Percentage of Wave 1 participants responding, LSAC B cohort and Millennium Cohort Study
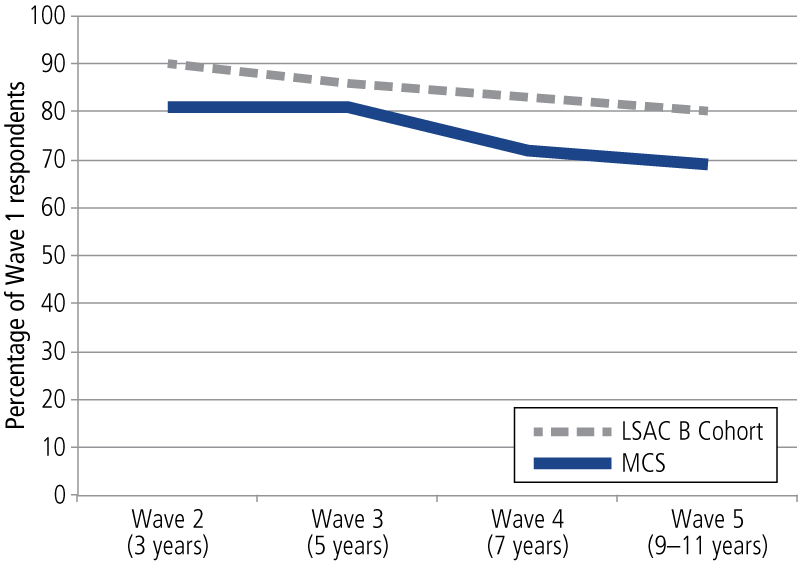
Source: Daraganova & Sipthorp, 2011; Hansen & Joshi, 2007
Methods of data collection
Reports from multiple informants are sought in order to obtain information about the child's behaviour across differing contexts and to reduce the effects of respondent bias. Information is also collected from the child (using a mix of physical measurement, cognitive testing and interviews, depending upon the age of the child), the parents who live with the child (biological, adoptive or step-parents), home-based and centre-based carers (for preschool children who are regularly in non-parental care), and teachers (for school-aged children). From Wave 2, information has also been sought from parents who live apart from the child's primary parent but who have contact with the child (parent living elsewhere; PLE). See Table 3 for a summary.
| Child | Parent 1 (primary carer) | Parent 2 (if lives with child) | Parent living elsewhere | Teacher | |
|---|---|---|---|---|---|
| Cognitive and/or physical testing | |||||
| B cohort (4-5 years old) | X CAI | ||||
| K cohort (8-9 years old) | X CAI | ||||
| Interviewer-administered | |||||
| B cohort | X CAI | X CAI | X CATI | ||
| K cohort | X ACASI & CAI | X CAI | X CATI | ||
| Self-complete form(s) | |||||
| B cohort | X CASI | X SCMB | X SCMB | ||
| K cohort | X SASI | X SCMB | X SCMB | ||
| Time use diary | |||||
| B cohort | |||||
| K cohort | X SC & CAI | ||||
Notes: PAPI: Face-to-face pen-and-paper interview. SCIP: Self-complete questionnaire while interviewer present. SCMB: Leave-behind or mail-out self-complete questionnaire. CASI: Computer-assisted self-interview. CAI: Face-to-face computer-assisted interview. SC & CAI: Self-complete time use diary followed by face-to-face computer-assisted interview to input information from the time use diary. CATI: Computer-assisted telephone interview. ACASI: Audio computer-assisted self-interview.
In Wave 5, face-to-face computer-assisted interviews (CAIs) were conducted with the child, with the K cohort also completing a self-administered interview on a laptop computer with headphones to provide audio guidance (audio computer-assisted self-interview; ACASI). Prior to the interview, the child was sent a paper time use diary and pen with a built-in clock. They were asked to write everything they did on a certain day and the time it took to do it. The child then assisted the interviewer to input their information into the computer, as well as provide information about who they were with and where and when they undertook the activities recorded. The primary carer of the child (Parent 1) also completed a computer-assisted self-interview (CASI), as well as being interviewed directly by the ABS. At Wave 5, Parent 1 was the child's biological mother in 95% of families. The other resident parent (biological, adoptive or step-parent) was also asked to complete a leave-behind questionnaire. If a parent lived elsewhere, then they were invited to participate in a computer-assisted telephone interview (CATI). Consent was sought to send a self-complete questionnaire to home-based carers, centre-based carers and teachers. Almost all parents provided consent. In addition, the interviewer recorded some observations about the neighbourhood, family and child.
Table 4 shows the response rates in Wave 5 for the differing data collection components; further information about response rates for earlier waves can be found in Edwards (2012). Participation rates are high for all data collection components. Participation rates for information that is not required to be collected in the household interview were lower, however, namely the Parent 2 self-complete questionnaire, PLE computer-assisted interview and the Teacher self-complete questionnaire. As a point of comparison, the Millennium Cohort Study surveyed teachers of children at 11 years of age (Sweep 5) and of those families that consented for the survey team to contact teachers, 77% of teachers completed the survey (Gallop, Anderson & Bram, 2013), 10% lower than in Wave 5 of LSAC (87%).
| Wave 5 | B cohort | K cohort | ||
|---|---|---|---|---|
| % of Wave 5 eligible interview sample | Response rate of those eligible | % of Wave 5 eligible interview sample | Response rate of those eligible | |
| Parent 1 computer-assisted interview | 100.0 | 97.9 | 100.0 | 97.2 |
| Parent 2 self-complete questionnaire | 85.9 | 70.3 | 82.8 | 71.6 |
| PLE CATI | 13.2 | 75.0 | 15.6 | 75.0 |
| ACASI | - | - | 97.9 | 99.3 |
| Child self-report | 98.6 | 99.7 | 100.0 | 97.3 |
| Teacher self-complete questionnaire | 98.7 | 86.6 | 97.8 | 83.4 |
| Time use diary | - | - | 97.8 | 94.3 |
Notes: Response rate columns are the percentage of those eligible to complete the form. There were five cases where a child interview was completed and the main interview with parents was not. Refer to Wave 4 issue paper for more details.
Source: Sipthorp, Edwards, & Daraganova (2013)
It is unusual to collect information from non-resident parents in large-scale longitudinal surveys. Growing Up in Ireland is one other longitudinal child cohort study that does consistently collect this information (Economic and Social Research Institute, 2014). The Panel Study of Income Dynamics Child Development Supplement collected some information about fathers who were not living with their biological child at Wave 1 but not in subsequent waves (Hofferth, Davis-Kean, Davis, & Finkelstein, 1997). The Longitudinal Study of Indigenous Children has also collected information on parent's living elsewhere but this has not been consistently collected across all waves (Department of Social Services, 2014).
Several direct assessments of the children's physical and cognitive development have been taken. The physical assessments include height, weight and girth at all waves, with head circumference collected for the B cohort at Wave 1. At Waves 4 and 5, body fat was also measured for both cohorts and the blood pressure of children in the K cohort. Cognitive tests have included a measure of general cognitive abilities needed for beginning school ("Who am I?"; WAI), a measure of language skills (the Peabody Picture Vocabulary Test; PPVT) and a measure of non-verbal intelligence (Matrix Reasoning from the Wechsler Intelligence Scale for Children; MR). The timing of the physical and cognitive testing varies depending on the developmental appropriateness of the particular measure, which can be seen in Table 5.
In Wave 1, interviewers spent an average of 120 minutes in each home. The times in subsequent waves were 75, 95, 105 and 98 minutes for Waves 2, 3, 4 and 5 respectively.
| Measure | Wave 1 | Wave 2 | Wave 3 | Wave 4 | Wave 5 |
|---|---|---|---|---|---|
| Physical measurement | Both cohorts | Both cohorts | Both cohorts | Both cohorts | Both cohorts |
| Who Am I? | K cohort | - | B cohort | - | - |
| PPVT | K cohort | K cohort | Both cohorts | B cohort | B cohort |
| Matrix reasoning | - | K cohort | K cohort | Both cohorts | B cohort |
| Blood pressure | - | - | - | K cohort | K cohort |
New developments for Wave 5: Entering the adolescent years
As outlined above, LSAC has collected data on a wide range of topics. There have been several exciting new developments in what was measured for the K cohort in Wave 5. This section outlines a few examples and then provides more detailed analyses on one of these examples, the beginnings of financial literacy - receiving pocket money.
Crime is a major cost to society. The genesis of criminal trajectories can occur in early adolescence (Laub & Sampson, 2006). In Wave 5, the K cohort children will be reporting on conflict with authority (e.g., was suspended or expelled from school), violence (e.g., got into physical fights), theft (e.g., stole something from a shop), vandalism or property damage (e.g., damaged or destroyed others' property) and police contact. Early involvement in crime and delinquency is an important risk factor for life-course persistent offending (Loeber & Farrington, 2000). Moreover, young people who are involved in crime and delinquency early are thought to play a role in enabling their peers in middle to late adolescence to engage in antisocial behaviour. In a chapter of the LSAC Annual Statistical Report 2014, Forrest and Edwards (in press) provide information on antisocial behaviour at 12-13 years of age and identify risk and protective factors at this early stage.
In LSAC, we have collected information about parents' mental health, smoking, diet, alcohol use and general health. In Wave 5, we asked Parent 1, Parent 2 and the Parent Living Elsewhere (if appropriate) about whether they had or currently suffered from several commonly occurring health conditions. These included conditions such as asthma, obesity, diabetes, heart disease, cancer, high blood pressure, arthritis, alcohol problems, drug addiction, depression, schizophrenia and bipolar disorder. This information will provide a much richer picture of parents' health conditions and how these influence their children's development.
While there are formal after-school care programs for children when their parents are at work, these tend to cater mostly for primary school children who are quite young. The need for effective supervision of young people may be important for some young people. Where children spend their after-school time and who they associate with during this period is therefore an important policy issue. As far as we are aware, there are no national data on this issue and, in Wave 5, information on after-school supervision was collected to remedy this gap in our understanding.
The beginnings of financial literacy? Pocket money
New information has been collected in the area of children's pocket money, an important area to understand as it plays a role in the development of financial literacy. Financial literacy is increasingly viewed as an issue of international importance, as the lack of financial literacy was one of the contributing factors to the global financial crisis (Organisation for Economic Cooperation and Development International Network on Financial Education [OECD-INFE], 2009). The OECD (2013) recently argued that the shift to individuals needing to take greater financial responsibilities (e.g., for their retirements) and the growing complexity and range of financial products and services available, makes it increasingly important for countries to focus on financial literacy. Benefits of enhanced financial literacy include increased savings, reduced debt and enhanced wealth creation (OECD, 2013). The OECD has shown a particular interest in the financial literacy of youth, as school is seen as an efficient mechanism for enhancing the financial literacy of populations. There is limited information, however, about children's financial literacy across OECD countries and, as a result, the most recent PISA survey conducted in 2013 had a module on financial literacy that attempts to address some of the gaps in the evidence base (OECD, 2013).
While schools can play a role in educating children in financial literacy, there is increasing recognition that parents play a key role in teaching children about money and money management (Gudmunson & Danes, 2011; Kim, LaTaillade, & Kim, 2011). One of the key ways that parents can explicitly provide guidance about money management is through the provision of pocket money or an allowance (Bonke, 2013; Lewis & Scott, 2000). From when children were aged 10-11 years of age, LSAC has collected information about whether children receive pocket money and how much they receive. By 12-13 years of age, 62% of children received pocket money in the previous 12 months, with 38% receiving pocket money on a regular basis. For those who receive pocket money on a regular basis, the average amount they received per week was $10.77 (in 2011). There is a wide variation, however, in the amount children regularly received from their parents. Figure 4 shows the amount of pocket money that children received divided into four equal groups, or quartiles, based on the amount of money they were given per week. The lowest quartile averaged $3.16 per week, the second quartile averaged $5.67 per week, the third quartile averaged $10.01 per week, and those in the top 25% averaged $20.98 per week. It is interesting to note that the amount of pocket money young people received was not associated with their parent's income at all (r = .01). In fact, the top pocket-money earners were evenly distributed across household income, with households in the lowest quartile having a very similar percentage of young people in the "top earners" (26%) as those in the second (25%), third (23%) and highest quartiles (26%).
Figure 4: Mean weekly pocket money received by 12-13 year olds, by quartiles
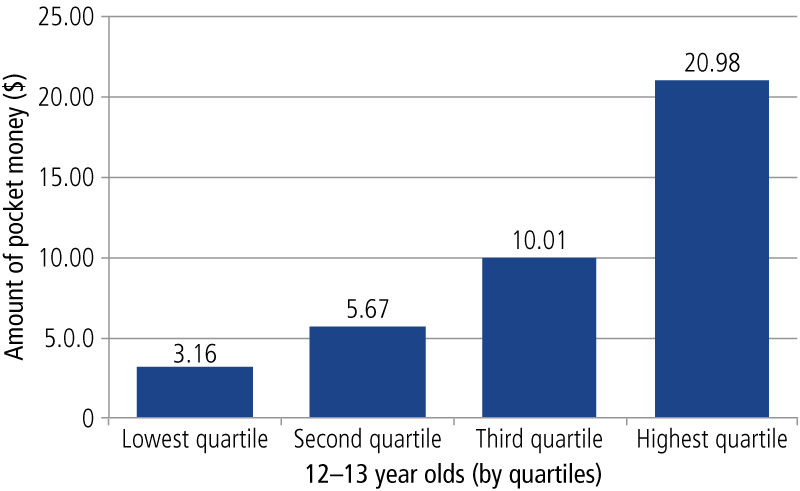
Note: LSAC K cohort, Wave 5, population weighted
The monitoring of children's spending is also an important element of family economic socialisation (Kim et al., 2011). In LSAC, children were asked whether their parents knew how they spent their money, in general. Just over three-quarters reported that their parents knew a lot (73%), 15% of parents knew a little and only 2% did not know. A further 7% were not sure what their parents knew. Parents who gave their children pocket money were a little more likely to know a lot (78 compared to [cf.] 75%) and less likely to know a little or not know how they spent their money (16 cf. 18%; ?2(3) = 8.80, p < 0.05). Parental knowledge about children's spending was not related to the amount of money they received (results not shown).
The provision of pocket money, however, and monitoring of children's expenditure of money is not sufficient on its own. Implicit modelling of responsible financial behaviour has also been found to be important (Beutler & Dickson, 2008). There is some evidence in LSAC that parents that monitor their expenditure are more likely to give their children pocket money, suggesting that providing adolescents with financial literacy skills is one consideration in the provision of pocket money. Parents who gave their children pocket money were somewhat more likely to keep written records of their expenditure than those who did not (22 cf. 19%), and somewhat less likely to pay no attention or only a little bit of attention (5 and 23% cf. 6 and 25%) than parents who did not provide their children with pocket money. Adolescents' engagement in the world of work may also provide opportunities to learn about finances, and from Wave 5 detailed information about hours of work and income earned will be collected. An examination of this issue is beyond the scope of the current article, however.
In summary, insights from LSAC do suggest that there is a wide variation in the amount of pocket money children receive, and that this is not associated with parental income. Parents are somewhat more likely to monitor their children's spending habits and be more conscious of their own spending if they provide their children with pocket money.
Data linkage
LSAC has been able to link to a number of administrative databases, which has and will continue to enhance the value of the rich data collected during fieldwork. To date, six data sources have been linked to the main waves, and a further two will be linked. A short description of these datasets follows.
ABS Census of Population and Housing
Data from the Census have been linked to the LSAC data file to obtain socio-demographic profiles of the neighbourhoods and communities in which children live.
National Childcare Accreditation Council (NCAC)
Key research question 4 of LSAC relates to the role of child care in shaping children's development. NCAC has quality assurance data on every long day care (LDC) centre, some family day care (FDC) schemes and some before- and after-school care providers. The LSAC dataset includes linked NCAC data for most children, using LDC or FDC at Wave 1, where contact details of this care were obtained and matched with NCAC data.
Medicare Australia
In Wave 1, we asked parents of study children to give consent for their children's data to be linked with Medicare Australia data for the duration of the study. This includes data from the Medicare Benefit Scheme (MBS), the Pharmaceutical Benefit Scheme (PBS) and the Australian Childhood Immunisation Records (ACIR). Data from these sources provide an indication of usage history of MBS, PBS and ACIR services.
National Assessment Program - Literacy and Numeracy (NAPLAN)
In 2008, NAPLAN commenced in Australian schools. Every year, all students in Years 3, 5, 7 and 9 are assessed on the same days using national tests in reading, writing, language conventions (spelling, grammar and punctuation) and numeracy. These data will enhance LSAC as the NAPLAN test gives a sense of the development of children's literacy and numeracy over time, and also in relation to national benchmarks. We have linked data from NAPLAN since Wave 3 for the K cohort and Wave 4 for the B cohort.
My School
Information from NAPLAN tests aggregated for each of the Years 3, 5, 7 and 9 for each school and other school information, is available for almost 10,000 Australian schools on the My School website at <www.myschool.edu.au>. The information on the My School website is available to the public, and relevant parts of the data will be linked to the LSAC data file. The My School data linked to LSAC includes detailed information about a school's performance in NAPLAN, its student population, the numbers of teaching and other staff, and the school type. Linking relevant aspects of the My School data to the LSAC data provides LSAC data users with valuable information about children's educational environments, which have an important influence on children's developmental experiences.
Australian Early Development Index (AEDI) (to be linked)
The AEDI is a measure of children's development as they enter school. Based on scores from a checklist completed by the child's teacher, the AEDI measures five areas of early childhood development. These are physical health and wellbeing, social competence, emotional maturity, language and cognitive skills (school-based), communication skills and general knowledge.
The AEDI was first implemented nationwide in 2009. At this time, the majority of the B cohort children were in their first year of school and would have had an AEDI checklist completed by their teachers. The K cohort were in their third or fourth year of school at this time, therefore no data are available for this cohort.
The AEDI data will be linked to the data file and will add considerable value to LSAC data because it will include rich information on the school readiness of the study children, as provided by the teacher. This will enable an investigation of the relationship between school readiness and early development measures, along with longer-term outcomes.
Data availability, data users and use of the LSAC data
Data from Waves 1, 2, 3, 4 and 5 have been released. There was also a Between Waves questionnaire between Waves 1 and 2, 2 and 3, and 3 and 4 on the released dataset. The LSAC dataset is publicly available, subject to an application process and the granting of a deed of licence. Individuals can have an individual licence, or organisations can be licenced users with their individual users being required to sign a deed of confidentiality. Data-user training workshops are regularly held to assist users gain familiarity with the complex dataset.
Figure 5 shows the number of data users has been steadily increasing from 90 in the 2005-06 financial year to 553 at the end of the 2012-13 financial year (there was a change to the counting rules that led to the small drop in users from 2011-12 to 2012-13 financial years).
Figure 5: Number of registered data users
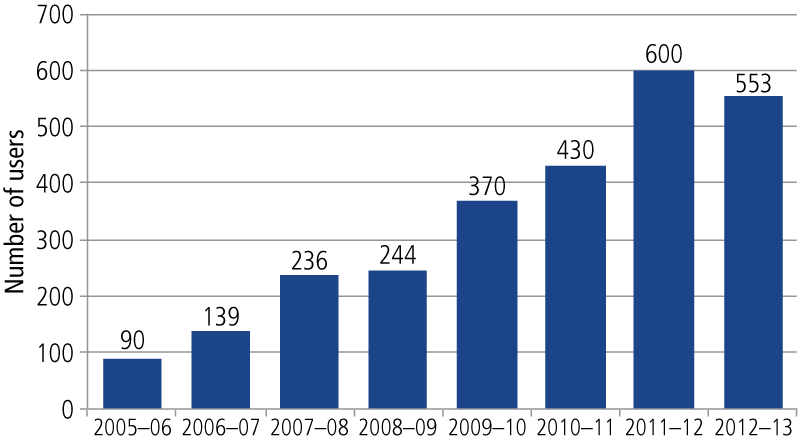
Source: Department of Social Services
Over 500 papers have been produced using the LSAC data. The DSS database, FLOSSE, indicates that there have been 163 journal articles, 83 reports, five book chapters, five books, three PhD theses, 28 newsletters and 287 conference papers produced to date. As part of the user agreement, the DSS requires users to provide information about their publications as well as nominating the relevant subject areas. Subject areas are not mutually exclusive and multiple subject areas can be nominated. Table 6 shows the subject areas on which works have been produced. As can be seen, a large number of works focus on policy relevant areas such as child care, education, employment, income and finance, and disability and carers.
| Topic | Number of works |
|---|---|
| Surveys and methodology | 164 |
| Child care | 155 |
| Child development | 155 |
| Health | 150 |
| Children | 132 |
| Families | 122 |
| Policy | 76 |
| Employment | 60 |
| Education and training | 46 |
| Income and finance | 42 |
| Disability and carers | 36 |
| Activities | 23 |
| Life events | 22 |
| Disadvantage | 20 |
| Culture | 16 |
| Relationships | 14 |
| Social capital | 12 |
| Beliefs and values | 11 |
| Finance | 10 |
| Location | 10 |
| Gender | 9 |
| Satisfaction | 8 |
| Ageing | 7 |
| Housing | 7 |
| Intergenerational transfer | 7 |
| Human capital | 6 |
| Stress | 3 |
| Benefits and payments | 2 |
| Carers | 0 |
| Transport | 0 |
Note: Subject areas are not mutually exclusive and multiple subject areas can be nominated.
Source: FLOSSE database
Conclusion
Information in this article provides several insights into how Growing Up in Australia: The Longitudinal Study of Australian Children has enhanced our capacity to understand the lives of Australian children and their families. As the older cohort have entered adolescence and become young people, our capacity to respond to and prevent risks, and to encourage resilience during this period will be enhanced by the many insights provided by the information collected. The quality of the sample retention, and the high quality and breadth of data of this nationally representative sample makes it a valuable resource to help policy-makers to develop and tailor effective service delivery. With over 500 data users and over 500 research papers to date, the research community is making good use of the rich information collected. The wide number of administrative datasets that have been linked will augment the usefulness of the information provided by study participants. From a policy perspective, many of the benefits of Growing Up in Australia are yet to be fully realised. As the young people transition to adulthood, the policy uses of the study will grow as the transition of child participants from the family home, into the adult world of work, post-school study, adult relationships and, in time, to parenthood themselves, will provide unparalleled insights into human development. These insights will help in developing nuanced policies that enhance the wellbeing of the Australian population.
Endnote
1 For a set of the 11 key research questions that have guided the study, clustered around the themes of child and family functioning, health, child care, and education see <www.growingupinaustralia.gov.au/pubs/reports/krq2009/keyresearchquestions.html>.
References
- Beutler, I., & Dickson, L. (2008). Consumer economic socialization. In J. J. Xiao (Ed.), Handbook of consumer finance research (pp. 83-103). New York: Springer.
- Bonke, J. (2013). Do Danish children and young people receive pocket money? (Study Paper No. 55). Solvgade, Denmark: Rockwool Foundation Research Unit.
- Daraganova, G., & Sipthorp, M. (2011). The Longitudinal Study of Australian Children: Wave 4 weights (LSAC Technical Paper No. 9). Melbourne: Australian Institute of Family Studies.
- Department of Social Services. (2014). Footprints in Time: The Longitudinal Study of Indigenous Children (LSIC). Canberra: DSS. Retrieved from <tinyurl.com/ofytpwc>.
- Economic and Social Research Institute. (2014). Growing Up in Ireland: National Longitudinal Study of Children. Overview. Dublin: Economic and Social Research Institute. Retrieved from <www.growingup.ie/index.php?id=9>.
- Edwards, B. (2012). Growing Up in Australia: The Longitudinal Study of Australian Children. The first decade of life. Family Matters, 91, 7-17.
- Forrest, W., & Edwards, B. (2014). Early onset of crime and delinquency among Australian children. In The Longitudinal Study of Australian Children annual statistical report 2014. Melbourne: Australian Institute of Family Studies.
- Gallop, K., Anderson, F., & Bram, A. (2013). Millennium Cohort Study fifth sweep (MCS5) teacher survey (Technical Report). London: Centre for Longitudinal Studies, Institute of Education, University of London.
- Gray, M., & Sanson, A. (2005). Growing Up in Australia: The Longitudinal Study of Australian Children. Family Matters, 72, 4-9.
- Gray, M., & Smart, D. (2008). Growing Up in Australia: The Longitudinal Study of Australian Children is now walking and talking. Family Matters, 79, 5-13.
- Gudmunson, C. G., & Danes, S. M. (2011). Family financial socialization: Theory and critical review. Journal of Family and Economic Issues, 32, 644-667.
- Hansen, K. (Ed.). (2012). Millennium Cohort Study: First, second, third and fourth surveys. A guide to the datasets (7th ed.). London: Centre for Longitudinal Studies, Institute of Education, University of London.
- Hansen, K., & Joshi, H. (2007). Millennium Cohort Study second survey: User's guide to initial findings. London: Centre for Longitudinal Studies, Bedford Group for Lifecourse and Statistical Studies, University of London.
- Hofferth, S., Davis-Kean, P., Davis, J., & Finkelstein, J. (1997). The Child Development Supplement to the Panel Study of Income Dynamics: 1997 user guide, Ann Arbor, MI: University of Michigan, Survey Research Center, Institute for Social Research.
- Kim, J., LaTaillade, J., & Kim, H. (2011). Family process and adolescents' financial behaviors of adolescents. Journal of Family and Economic Issues, 32, 668-679.
- Lewis, A., & Scott, A. (2000). The economic awareness, knowledge and pocket money practices of a sample of UK adolescents: A study of economic socialization and economic psychology. Children's Social and Economics Education, 4, 34-46.
- Laub, J. H., & Sampson, R. J. (2006). Shared beginnings, divergent lives: Delinquent boys to age 70. Cambridge, MA: Harvard University Press.
- Loeber, R., & Farrington, D. (2000). Young children who commit crime: Epidemiology, developmental origins, risk factors, early interventions, and policy implications. Development and Psychopathology, 12(4), 737-762.
- Mensah, F. K., Bayer, J. K., Wake, M., Carlin, J. B., Allen, N. B., & Patton, G. C. (2013). Early puberty and childhood social and behavioral adjustment. Journal of Adolescent Health, 53, 118-124.
- Organisation for Economic Cooperation and Development. (2013). Financial literacy framework. In PISA 2012 assessment and analytical framework: Mathematics, reading, science, problem solving and financial literacy. Paris: OECD Publishing.
- Organisation for Economic Cooperation and Development International Network on Financial Education. (2009). Financial education and the crisis: Policy paper and guidance. Paris: OECD-INFE Publishing. Retrieved from <www.oecd.org/finance/financial-education/50264221.pdf>.
- Sipthorp, M., Edwards, B., & Daragnova, G. (2013). Using National Assessment Program: Literacy & Numeracy (NAPLAN) data in the Longitudinal Study of Australian Children (LSAC) (LSAC Technical Paper No. 8). Melbourne: Australian Institute of Family Studies.
Dr Ben Edwards is the Executive Manager, Longitudinal Studies, at the Australian Institute of Family Studies. This overview of LSAC draws upon previous work by Gray and Sanson (2005), Gray and Smart (2008), and Edwards (2012).
Edwards, B. (2014). Growing Up in Australia: The Longitudinal Study of Australian Children: Entering adolescence and becoming a young adult. Family Matters, 95, 5-14.