'It's not for lack of wanting kids...' A report on the Fertility Decision Making Project
You are in an archived section of the AIFS website
Download Research report
Overview
Australia's fertility rate has fallen dramatically since the 1960s. It is now at an all-time low and well below replacement level.
This report attempts to gain an understanding of the reasons for fertility trends, at both the macro and micro levels. It reports the findings of the Fertility Decision Making Project, commissioned by the Federal Office for Women, and provides in-depth analyses of the aspirations, expectations and ideals of Australians as related to the question of whether to have children, or not. Particular attention is given to the ways in which views on having children vary according to age, gender, parenting status, relationship status, educational level, and employment status.
The aspirations examined included the family size respondents considered to be personally ideal; whether or not they wanted a first or additional child in the future; whether or not those aged 22 or more had changed their family size preferences since they were 20 years old, and reasons for any change; the reasons leading some of the childless respondents to prefer not to have children; and views about the ideal age for the respondents themselves to start, or to have started, a family. The 3,201 respondents were also asked to indicate how likely it was that they would have a child in the future.
The report concludes that, in short, governments need to use a combination of approaches that is based on the recognition that the low fertility rate is not due to a "lack of wanting children".
Key messages
-
Regardless of age, the most popular "ideal number of children" that people between the ages of 20 and 39 reported wanting to have was two. The second most popular ideal number of children was three. The average ideal family size was 2.4 children for men and 2.5 children for women.
-
On average, the number of children that people expected to have was less than their ideal number of children. While most people expected to meet their ideal family size, a sizeable proportion of people expected to have fewer children than they would ideally like. Around one third of men and women reported that they expected to achieve fewer children than they would ideally like, while only 6 per cent of men and 4 per cent of women thought they would have more children than they wanted.
-
Two thirds of male respondents and 41 per cent of female respondents were childless, but only 7 to 8 per cent of men and women said they definitely did not want children. Reasons for not wanting children included practical considerations (such as age, lack of a partner, health and fecundity issues); a dislike of children; work, financial and lifestyle choices; concerns about being a good parent; the belief that the world is not good for children; and concerns about overpopulation.
-
Women in their twenties and thirties with lower levels of education were not generally more likely than women with higher levels of education to want to have children but they were more likely to have had children.
-
Regardless of age, men with lower levels of education were more likely than men with higher levels of education to have fathered children. Of men in their thirties, those with no post-school qualifications were less likely than other men to be currently partnered.
Executive summary
Australia's total fertility rate is at an all time low (1.75 babies per woman) and is well below replacement level (2.1), resulting in a population that is ageing and one that may shrink if the fertility rate falls much further. This has sparked much public debate about the social and economic consequences for Australia. While increasing immigration levels has been proposed as one possible solution, research shows that such a strategy has limited ability to slow down population ageing.
Most governments in countries with similar or lower fertility rates than in Australia are focusing on the need to support families having children. The government in Australia is no exception. Chapter One of this report explains trends in the total fertility rate and summarises some of the most important Australian research in this area.
To help lift the fertility rate or at least keep it stable at its current level, public policies could well provide mechanisms for supporting the drivers that help couples to achieve their desired family size, and trying to overcome the drivers that operate as barriers to having children. To develop appropriate policies, a strong evidence base is required - one that not only indicates who is having children and who is not, but also enhances an understanding of factors that people consider important when they are contemplating the issue of having a child or more children.
"Getting inside people's heads" to see how they experience the decision-making path towards or away from children is not something that has been focused on much in the past. The Fertility Decision Making Project helps fill this gap and this report provides the first findings from the survey. The Office for Women contributed funding to the Australian Institute of Family Studies to conduct a national random survey of men and women aged between 20 and 39 years that focused on fertility decision making. This telephone survey resulted in an achieved sample of 3,201 respondents (1,250 men and 1,951 women). There was an additional mail-out questionnaire to partners of respondents leading to 313 self-completed questionnaires. Fieldwork commenced in December 2003 and was completed in March 2004. Chapter Two outlines the design and sample of the fertility Decision-Making Project, and Chapter Three examines the sample according to the key variables of age, gender, relationship status, parenting status, educational level and employment status.
Chapter Four examines various fertility-related aspirations held by men and women and the relationship between these aspirations and the above-mentioned key variables. Most of the childless respondents reported that they definitely wanted children, and most respondents with one child wanted a second. Although those in their twenties who had not had children were more likely than their older counterparts to 'definitely' want to have a child, this was the single most common response even for those in their late thirties who did not have children. Married respondents without children were the most likely of the relationship status groups definitely want to have a child. This chapter also shows that the strongest preference, in terms of ideal family size, was for two children. This preference persisted regardless of relationship status.
Chapter Five discusses fertility expectations and finds that while the patterns of expectations largely match those derived for aspirations, expectations 'fall off' with age (particularly for women) and where the respondent is not married. Childless men in their twenties and men with lower levels of education were less likely than those men with a degree or pursuing degrees to expect to have a family.
Chapter Six looks at the link between expectations and aspirations at the individual level to further explore the association between these two key concepts. The average family size that men and women wanted to achieve is above the replacement level of 2.1 children per woman. However, women's average expected family size falls close to this 'replacement' level and that for men is close to Australia's current total fertility rate (1.75). Around one-third of men and women expected to have fewer children than they ideally wanted.
Chapter Seven explores the issues that are considered important in fertility decisions. Both men and women were particularly likely to emphasise the ability to support a child financially as the most important issue when considering having children. Also high on the agenda for most respondents was whether or not each partner would make a good parent. The male partner's job security was another common concern. The emotional benefits to respondents of having children were also high on the list of issues feeding into the process of fertility decision making.
The main findings from the study show that it is not for lack of people wanting children that our fertility rate is low. The diversity of lifestyles and general aspirations these days means that there is a fair degree of variance in terms of how priorities across the life course are worked out at the individual level, and 'having kids, while a priority, often comes after having met some other priorities, or 'preconditions'.
In terms of policy development, the key findings provided in this report highlight some of the most important issues that have been raised via this initial analysis of the survey data. The analysis suggests that while most people want to have children, the most common pre-conditions people nominate for having them are a secure, stable and adequate partner, and a secure, stable and adequate income stream. It seems that these pre-conditions are becoming further out of reach for people in their twenties. One policy question that could be posed is: "What supports need to be in place to help people meet these pre-conditions in their twenties?"
1. Introduction
According to the Australian Bureau of Statistics (ABS), the total fertility rate in Australia has plummeted to an all-time low of 1.75 babies per woman (ABS, 2003). This rate is well below that required for replacement (2.1).1 Alarm bells are thus ringing and there is now much public debate about the social and economic consequences of this trend.
This chapter first outlines trends in the total fertility rate that have occurred since the late 19th Century and consider some of the events that took place that appear to explain shorter-term aberrations. The chapter then focuses on some of the challenges current fertility trends present for Australia. Finally, the literature concerning apparent reasons for these trends is reviewed, for some of the explanations that have been proposed have played a major role in shaping the Fertility Decision Making Project.
1.1 Trends in the total fertility rate
While much of the attention in Australia has focused on patterns of fertility since the post-war baby boom, the fertility decline well predates the boom. Indeed, at the start of the 20th Century, the total fertility rate was nearly 4.0, having fallen by about one third over the previous 30 years (Hugo 2001).
By 1934, during the Great Depression, the fertility rate had fallen to replacement level for the first time (2.1) - a trend that apparently resulted more from deliberate birth control within marriage than from the postponement of marriage that occurred at the time (Ruzicka and Caldwell 1982). In the late 1940s and early 1950s, the economic outlook improved and fertility increased, as births postponed during World War II took place. This rate was sustained by the trend towards earlier and near universal marriages at that time, as well as the influx of immigrants of child bearing age (Hugo 2001; Ruzicka and Caldwell 1982). In fact, the "baby boom" which began after World War II was really a "marriage boom" as fertility rates within marriage changed little (Ruzicka and Caldwell 1982).
By 1961, the total fertility rate was the highest for the century (3.5) - but 15 years later, it had for the first time fallen below replacement level. The rate levelled out in the late 1970s and 1980s as births that were postponed took place (Carmichael and McDonald 1999), but then fell in small progressive steps in the 1990s, as increasing proportions of couples restricted their family size to one or two children, or remained permanently childless.2
While the fall in fertility in the early years of the 20th century applied to virtually all age groups of women, the fall in recent decades has been restricted to those under the age of 30 years. In fact, the proportion of women in their thirties giving birth has increased in recent decades, although women of this age today are less likely to have a child compared with women of this age during the baby boom period and before the Great Depression of the 1930s. Nowadays, women giving birth when at least 30 years old are increasingly likely to be first-time mothers (38% of all first births in 2001 were to women of this age, compared with 28% in 1993) (Australian Institute of Health and Welfare 2004; ABS 2001). In other words, women are delaying having their first child. Nevertheless, the rise in the fertility rate of women aged 30 or more years has not made up for the fall in the rate for younger women.
These trends reflect dramatic changes in the number of children women have had by the time they have reached their early forties. By this age, women born between 1937 and 1941 were more likely than women born twenty years later (1957-1961) to have four or more children (28% compared with 15%) and less likely to be childless (9% compared with 13%) (ABS 2002a). Of women who are currently in their early childbearing years, around one quarter are projected to remain childless (ABS 2002b). But according to McDonald (1998), future trends in Australia's total fertility rate will be strongly affected by the proportions of women who have more than two children. He estimated that the total fertility rate would fall to 1.4 if those who currently have more than two children stopped at two.
The decline in fertility is not unique to Australia. Beginning in France from the 19th century, the decline in fertility, resulting not from catastrophe as in early times, but from deliberate birth control, spread globally but unevenly. Total fertility rates now fall below replacement level in countries that account for almost half the world's population, including virtually all populations of European origin, as well as Japan and China (Eberstat 2000). In fact, as de Vaus (2004) notes, Australia's total fertility rate is higher than the rate in most OECD countries. Public concern about flagging fertility rates is by no means new. In Australia, a Royal Commission was established in New South Wales soon after Federation to seek reasons for the dramatic fall in recent decades (the Royal Commission on the Decline of the Birth-Rate and on the Mortality of Infants in New South Wales [the "Mackellar Commission"]). And in 1945, British Prime Minister Winston Churchill encouraged women to have "One [child] for the mother, one for the father, one for accidents and one for increase" (Riley 2004). However, some countries have been quicker than others to develop policies to address this issue (see McDonald 2000a; Demeny 2004). But is there really any need for concern?
1.2 Implications of fertility trends
In earlier times, concerns about the declining fertility rate tended to focus on the need to increase the population - needs that could also be addressed through immigration. After World War II, the message, "populate or perish" was widely promoted. In recent times, however, attention has turned to the fact that Australia's population is ageing as a result of the combined effects of a falling fertility rate and increasing life expectancy. Empirical analysis by McDonald and Kippen (1999) suggests that the capacity for immigration to affect the age structure is quite limited. While the first 80,000 migrants affect age structure, these authors show that as levels of net immigration continue to increase above 80,000, the magnitude of their effect on the age structure of the population diminishes. But what are the consequences of an ageing population?
An important question relating to population ageing is whether or not there will remain a sufficient labour supply to support the elderly, taking into account the fact that the proportional representation of the other main dependent group (those too young to work) is shrinking. The issue is becoming increasingly critical, given that that the first of the baby boomers (defined by the ABS 2001 as those born between 1946 and1966) will turn 60 years old in 2006.
Regarding this issue, the Australian Government's Intergenerational Report (2002) estimates that the net costs to the Government of an ageing population will increase, with today's taxpayers probably subjecting tomorrow's taxpayers to a heavier tax load. Some social commentators have argued that such circumstances will create growing resentment between the generations (see Encel 2002).
Demand for services will also change, given the different needs of the burgeoning elderly population and younger generations in such areas as housing, health care, leisure, and education. And while there is considerable evidence that families are the most significant sources of support for the elderly, increasing rates of childlessness coupled with family breakdown and children pursuing jobs overseas, will mean that many elderly parents will be either "functionally" or "actually" childless (see Rowland 2003; Weston, Qu and Soriano 2003).
In relation to young children, Mackay (2001) has noted that little attention has been given to the difficulties that children may face in the middle of this century, when one quarter of the population will be over the age of 65.
The workforce itself will age, if policies directed towards encouraging later retirement are effective. Thus any wisdom shaped by an accumulation of knowledge will increase, while there will be a relative loss of young adults whose age-related talents often produce important technological advancements (McDonald 2002).3
But how will Australia fare if its labour force stagnates or falls in absolute size? According to McDonald and Kippen (2000), this issue has received insufficient attention. Allied to this problem, there is the concern that, if the fertility rate falls below 1.6 and Australia's current net immigration levels are sustained, then the absolute size of Australia's population will shrink - a trend that will spiral over time (ABS 2002b; McDonald 2000b). Of course, for those concerned with the impact of Australia's current population on environmental sustainability, this might seem a welcome prospect.
Another issue, often overlooked in discussions of the implications of the fall in the fertility rate, is that women appear to be experiencing dashed hopes and unfulfilled expectations and intentions: they initially want to have, and expect and intend having, more children than they achieve (Fisher 2002; McDonald 1998; Qu and Soriano 2004; Quesnel-Valee and Morgan 2002).4 However, there is some evidence from overseas countries that the fertility aspirations of future generations of young adults will be lower than those of young adults today, for it appears that aspirations are eventually affected by fertility trends. For instance, Goldstein, Lutz and Testa (2003) found that the average family sizes considered to be personally ideal by young men and women in German-speaking parts of Europe has fallen to as low as 1.7 children. Nevertheless, the evidence available so far suggests that fertility aspirations are not being met by many people in many developed countries. Why is this so?
The following section examines reasons for the declining fertility rate. Some of these reasons are clearly evident, and others are more speculative. Furthermore, some of the clearly evident ones, such as postponement of births, require their own explanations - explanations that in turn have causes that need deciphering. At the base of these layers of explanations is interesting speculation.
1.3 Reasons for the decline in fertility
The search for reasons for the low fertility rate is by no means a recent phenomenon - a case in point being the above-noted "Mackellar Commission" that was established around the turn of the 20th century. One very early theory, which came to be known as the "demographic transition theory" in the 1940s, explained the decline in fertility in terms of the move from one level of equilibrium in which fertility levels were high to compensate for high mortality, to another in which fertility levels fall as mortality levels falls so that population replacement is achieved (see McDonald 2001a). However, fertility is now well below replacement level in many countries. As McDonald notes, homeostatic explanations involve such a flexible time frame that they verge on tautology: they suggest that corrections to imbalances via fertility change will eventually occur, but "who knows when?" McDonald thus argues that generalised frameworks are needed to explain current fertility changes - changes that will nonetheless be influenced by the specific social, economic and institutional contexts in which they occur.
Many interacting factors underpin the fall in the fertility rate - a complexity that makes the choice of where to begin this review somewhat arbitrary. As noted above, some of these factors are transparent and certain and relate specifically to contextual factors; others are not. Perhaps the most obvious are the development of modern fertility control measures and the related changing patterns of family formation, including couple formation. The review thus begins with these issues.
1.3.1 Advances in reproductive technology
A key explanation for the fall in fertility is that first births have increasingly been postponed thereby shortening women's total childbearing years and increasing their chances of not having any children (Jain and McDonald 1997). While some women attempt to extend their reproductive life through assisted reproductive technology, such procedures account for only 2 per cent of all births (McDonald 2001a).
As noted above, it appears that women today end up having fewer children than they want, expect and intend to have. Such trends are in marked contrast to those of some 40 years ago when couples often had more children than they expected because of relatively inefficient means of contraception (Petersen 1961). Clearly, the effects of the development of the contraceptive pill and its widespread acceptance have been revolutionary.
In Australia, the contraceptive pill became available in 1961 for distribution via medical prescriptions from those practitioners who approved of its use. In 1972, sales tax on all contraceptives was removed and the pill was placed on the Pharmaceutical Benefits List, thereby lowering the price substantially, increasing its use, and leading to widespread acceptance. Other advances in contraception that contributed to the modern fall infertility include new versions of the intra-uterine device from the mid-1960s, developments in sterilisation procedures in the 1970s and 1980s, and liberalisation of abortion laws (Cica 1998; Carmichael 1998).
However, the average age of women giving birth to their first child continued to increase well after the pill became readily available. The median age of married women giving birth to their first child of the union of the time was 25.3 in 1981, 29.3 in 1991, and 29.8 in 2001, although some of these women would have had children from previous relationships. As outlined below, advances in reproductive technology facilitated a number of other life course changes that combined to accentuate the delay in first births and fall in fertility (ABS 2001, 2002a).
1.3.2 Life course trends
Life course changes affecting fertility include delays in those transitions that typically precede the family formation process, most particularly leaving home and forming partnerships, an overall fall in the formation of partnerships and an increase in their rate of breakdown, consequent diverging reproductive histories of potential partners, and women's increased financial independence.
Delayed transitions preceding having children
Although leaving the parental home remains an important transition in life, it is no longer quite the symbol of adulthood it once was. Young adults are taking this step at an older age than in the past, and the first move is likely to be temporary rather than permanent. Between 1979 and 2000, the proportion of those in their early twenties living with their parents increased from 46 per cent to 52 per cent for men and from 25 per cent to 39 per cent for women. In two surveys conducted by the Australian Institute of Family Studies in 1981 and 1998, the proportion of those in their early twenties who had returned after leaving home increased from 52 per cent to 67 per cent for men and from 44 per cent to 57 per cent for women (McDonald 1995; Weston, Stanton, Qu and Soriano 2001).
While marriage used to be the main reason for leaving home, these days young adults leave for a variety of reasons, and form their first (living-together) union later in life than previously (Qu and Weston 2001). Furthermore, their first union is unlikely to start with marriage - in 2001, for example, 69 per cent of marriages that were first marriages for both the bride and groom were preceded by cohabitation (or de facto relationships). Yet couples still typically wait until they are married before having children, although this trend is weakening. While the proportion of babies born outside marriage has been increasing progressively, a trend that probably largely reflects the increase in cohabitation, more than two-thirds of babies are born within marriage (69 per cent in 2001, compared with 90 per cent in 1976) (ABS 1995, 2002a).
Research in the United States reported by Barber and Axinn (1998) suggests that, while some individuals opt for cohabitation rather than marriage because they do not want to have children, the experience of cohabitation itself may lower intentions of having children. Although such research is by no means definitive, it is possible that one partner may opt for cohabitation because he or she does not want to have children and, over time, changes the other partner's views about having children.
More broadly, individuals' life decisions are usually influenced by general societal trends, and these decisions can then perpetuate these trends. Delayed milestones that precede having children represent an example of this process (ABS 2001). In turn, as marriage becomes increasingly delayed, people who eventually wish to marry can increasingly afford to wait because the pool of eligible partners remains large at a later point in the life span (Kohler, Billari and Ortega 2001).
Nevertheless, the rate of overall partnering has fallen. In essence, while cohabitation rates have increased, this increase is not large enough to offset the fall in marriage rates (Birrell and Rapson 1998; Birrell, Rapson and Hourigan 2004) - a trend that would contribute to the increased rate of childlessness.
While partnering rates have fallen, the majority who do enter unions are faced with the prospect that their relationship may break down. The fragility of relationships, coupled with postponement of childbearing, increases the chances of not having children, or of smaller than intended families. These issues are considered below.
Those with partners
Despite delays in the timing of partnering and falls in the overall rate of partnering for different age groups, the majority of men and women in their early thirties were living with a partner in 2001 (59% and 55% respectively). Of those in their late twenties, just over half the women (53%) but only 41 per cent of the men had partners (Birrell et al. 2004). Given the decline in fertility overall and various apparent constraints in having children (outlined below), it is increasingly likely that at least one partner will either want to remain childless or will want to defer having children. What happens when couples disagree?
As Greene and Biddlecom (1997) note, most discussion of fertility trends ignore men and the couple dynamics. There is thus scant information about the reasons for, or consequences of, divergent preferences of partners regarding total family size, whether or not to have a first or additional child, or the timing of the next child. Little is also known about the ways in which couples resolve their differences.
The few studies that have taken into account the views of each partner suggest that men's preferences or expectations do influence childbearing outcomes. For instance, Thomson (1997b) found that when couples disagree about having children, intentions tend to shift towards not having a child, while Greene and Biddlecom (1997) cite evidence suggesting that a difference in opinion over the timing of the (next) birth are particularly influential in determining whether or not they have a child.
Fragility of relationships
As noted above, cohabitation is now the dominant pathway to marriage. To outsiders, the period of cohabitation might thus be seen as an "engagement" or at least a symbol that the partners are committed to each other. But for some couples, the meaning of cohabitation may be uncertain, may differ for each partner, or change with time. In the meantime, with the delay in the establishment of this union, the woman's "biological clock" is ticking. There is some evidence that first unions that begin with cohabitation are increasingly likely to end in separation and that relationship breakdown is an important reason for women losing opportunities of having the children they once intended to have (Qu and Weston 2001; Qu, Weston and Kilmartin 2000).
Like cohabitation, the fragility of marriage can also limit opportunities for having children. The divorce rate rose dramatically following the Family Law Act 1975, as the backlog of long-term separations were formalised and some divorces were brought forward. The divorce rate then subsided but has remained at a much higher level than prior to the Act. In the mid to late 1980s, the rate varied between 10.6 and 10.9 divorces per 1000 married women, and fluctuated between 12.0 and 12.9 divorces per 1000 married women during the period of 1995 to 2000.
While relationship separation may disrupt opportunities for childbearing, there is also evidence to suggest that unhappily married couples are less likely than other couples to have a (further) child (Lillard and Waite 1993). This may be more likely in contemporary marriages given that their survival is often under threat when emotional, sexual and companionship needs are not being met (Wolcott 1999). That is, currently intact but unhappy marriages may also result in lowering fertility.
Parents without partners
In a context of high relationship breakdown, there are also many parents without partners, some of who may have hoped for more children. But their status as parents appears to lower their likelihood of forming new partnerships and may also lower their likelihood of having more children should they partner (Greene and Biddlecom 1997; Stewart 2002; Thomson 1997a, 1997b).
However, Stewart (2002) points out that few fertility studies have taken into account the impact of stepchildren, and most of those that do, have not only ignored their "step" status (by combining biological children with stepchildren), but have also limited their attention to the children of the mother who are living with her and her partner.
Little is known about the extent to which parenting responsibilities of fathers without partners (including the cost of supporting non-resident children) affect their views about, and their likelihood of, partnering and having further children. In the United States, where child support regimes vary across states, research by Bloom, Conrad and Miller (1998) suggests that child support enforcement reduces the likelihood of marriage for low-income men. On the other hand, if marriage does occur, fathers (low income or otherwise) are just as likely as other husbands to have a child in this relationship.
Women's growing financial independence
Women's increased workforce participation and financial independence appear to be centrally linked with fertility trends. Women now have access to a wider range of job types than in the past, have more opportunities to earn high incomes, and are no longer as reliant on finding a partner for financial support as in the past. Furthermore, women's opportunities to remain in paid work after they marry have increased over the past 35 years. It was not until 1966 that women were permitted to be appointed or to remain as permanent officers of the Commonwealth Public Service upon their marriage and to return to their jobs after the birth of their children. Since this period, participation in the labour force has increased dramatically for married women in all age groups (Weston et al. 2001).
Such a major social change inevitably requires other adjustments within the home, workplace and community to facilitate the new way of life. But as Moen and Yu (2000) point out, some of these adjustments take time to occur. A number of explanations for low fertility relate to such time lags. These include inflexible workplace practices; women's "double burden" and men's reluctance to share this load; limited access to affordable, high quality child care; financial, career and other work-related costs linked with giving up work partially or fully to care for children; and potential clashes in values, attitudes or beliefs about family and paid work responsibilities.
Summary
In short, child bearing depends largely on the formation and continuation of "live-in" partnerships, most particularly marriage. But partnerships are occurring later in life, their rate has fallen overall, and the risk of their breaking down within the first few years of their formation is considerable.
Furthermore, the presence of children from previous relationships may lower chances of partnering and of having additional children. Finally, women now have opportunities for financial independence and career success - opportunities that may interfere with partnership formation or their plans to have children.
As explained above, life course changes affecting fertility involve their own set of causes. What is behind them?
1.3.3 Labour market, economy and other broad structural forces
Several authors maintain that trends in the labour market and the economy in general influence fertility rates, in part through their impact upon life course patterns. Not surprisingly, there is strong historical evidence that Australia's economic circumstances have played a major role in influencing fertility rates since well before modern methods of birth control were introduced. Indeed, the sharp fall in fertility in the 1890s has been explained in terms of the sudden economic collapse that occurred in 1893 (Caldwell 1982; Ruzicka and Caldwell 1982), while the Great Depression of the 1930s saw the total fertility rate falling to 2.1 babies per woman in 1934, then rising as the economic outlook improved. Smaller observable oscillations have also been linked with Australia's economic circumstances (Martin 2003).
But if the economic outlook is so important to the fertility rate, why has the rate continued to fall in recent times, when the outlook has been relatively positive?
Several authors have implicated the globalisation of the economy and associated labour market changes of the last two decades. Low-skilled yet relatively highly paid and secure jobs available to early school leavers have virtually disappeared, having been replaced by jobs entailing fixed-term contracts and part-time or casual hours, thereby providing limited economic security (Kohler et al. 2001; McDonald 2000c, 2001c; Saunders 2001).
McDonald (2001a) also argues that this era of job insecurity has been accompanied by a strong economic cycle of "booms and busts" and rising or fluctuating house prices which combine to encourage continuing dual employment amongst couples as insurance against dual joblessness, and to lead young people to invest in their own "human capital" (their education and career development) before considering having children. As Birrell et al. (2004) and McDonald (2001a) point out, the economy has generated increasing inequity between "winners" and "losers". Furthermore, Birrell and colleagues conclude that men with limited employment prospects are reluctant to take on the responsibilities of marriage and parenting, while women may also be reluctant to accept them as partners.
The pressure to invest in education is strengthened by the fact that the stakes are very high. Investment in education, in turn, increases debts, which may lead to further postponement of childbearing (Jackson 2002). According to McDonald (2000b, 2001d), childbearing is also discouraged by the limited financial, child care and other supports available to couples when mothers wish to participate in the labour force.
Inextricably linked with these broad structural forces are the considerable costs of having and raising children. These costs and their interplay are likely to cast a shadow on the benefits of having children and reinforce the need for educational and career investment.
1.3.4 Are the benefits of having children decreasing?
Schoen, Kim, Nathanson and colleagues (1997) point out that explanations for modern fertility trends can often be reduced to the argument that the fall in fertility has resulted not only from increasing costs of having children but also from decreasing benefits. Is there any evidence that this might be the case? The following discussion focuses on arguments in the literature about links between fertility trends and the nature of the benefits and costs of having children.
While much of the literature has focused on costs of having children, relatively few studies have attempted to assess perceived benefits. Perhaps the most well known is the large-scale study on the Value of Children, conducted in the 1970s in nine countries that varied in terms of development (for example, the Philippines and the United States). Benefits included economic, practical and psychosocial gains such as receiving help with household chores or economic support in old age, experiencing pride, love and companionship, deriving pleasure from watching the children grow up, making life more purposeful, and carrying on the family name (Hoffman and Manis 1979). More recently, Schoen and colleagues (1997) emphasise the importance of children in expanding and strengthening social ties, which in turn provide avenues to many other resources.
In developing countries young children are often relied upon to contribute financially to the family. However, in countries (like Australia) where child labour laws virtually eliminate children's direct contribution to the household economy, child-related benefits are mainly psychosocial. Some authors argue that these benefits do not accumulate with increasing family size. Kagitcibasi (1997) concludes that parents can derive all the love they need from one or two children. Similarly, Schoen and colleagues (1997) argue that few children are required to strengthen family and friendship networks, and Kohlmann (2002) maintains that restricting family size may even increase the chances of receiving some benefits. According to this argument, in countries where economic benefits of children only apply in old age, it is more efficient for parents to have few children thereby allowing strong investment in their education. Indeed, for some parents, such investment may be seen as a ticket to "winning" in a free market economy in which the losses of the "losers" are severe.
In short, while having children can be very rewarding, several researchers maintain that such rewards do not accumulate as family size increases. In fact, the chances of receiving some benefits may decrease as family size increases. The financial costs, on the other hand, can be a force by themselves - as can the many non-financial costs of children.
1.3.5 Are the costs of having children increasing?
The fall in fertility rate has been attributed to a number of rising costs of having children, most particularly direct and indirect financial costs, but also emotional costs relating to giving up paid work and costs that might never eventuate but that nonetheless encourage couples to "think twice" about having children.
Financial and work-related costs
Over time, material living standards have increased in modern societies, with many of yesterday's perceived luxuries becoming today's perceived necessities - thus highlighting the importance of values in shaping considerations about whether or not a couple can afford to have children. Indeed, divergent views about the material necessities in life and associated expenditure patterns may partly explain the fact that the people who can least afford it are having the largest families (see de Vaus 2004).
In addition to the direct financial costs of having and raising children (for example, food, clothing, housing, education and possibly child care) are the indirect costs such as reduced earnings and potentially curtailed careers when caring for children takes precedence over paid work. While it appears that the foregone earnings of women who have children have diminished somewhat since the 1980s, when cohorts with the same level of education are compared (Gray and Chapman 2001), women's improved career opportunities mean that increasing numbers have a great deal to lose should they decide to relinquish full-time work to raise a family. Such losses are emphasised by McDonald (2000b, 2001a) as a central reason for the fall in fertility.
The deprivations are not only monetary, but can be felt in relinquishment of work-related prestige and diminished opportunities for social relationships, job skill development, and mental stimulation and challenge (see Barnes 2000; Perry-Jenkins, Repeti and Crouter 2000). Thus, while the labour market and economic context may encourage the accumulation of educational and career-based accomplishments, the benefits of this pathway may compete with having children as alternative avenues for self-fulfilment (Quesnel-Valee and Morgan 2002).
Parents may, of course, use non-parental child care to enable each partner to remain in full-time work, but this introduces other monetary and time costs, with women typically carrying most of the child care and other domestic responsibilities (Bittman and Pixley 1997; Bittman and Matheson 1996; Moen and Yu 2000). These costs, along with potential difficulties in accessing high quality child care and worries about the suitability of child care for very young children, may contribute to couples' decisions to have few if any children, or to continue to defer decision-making.
The above issues relate to the "gender equity" explanation for low fertility (which will be discussed further below). Basically, McDonald (2000c, 2001b) argues that gender equity has progressed well in those institutions that are oriented to the individual, such as education and employment, but family-oriented institutions have lagged behind by continuing to assume a male breadwinner model of family life. Under these circumstances, women's opportunities are seriously diminished if they have children, thereby discouraging them from having the number of children many would like to have. The potential for indirect discrimination around pregnancy and family commitments are also work-related costs that may influence fertility decisions. (For incidence of complaints, see Human Rights and Equal Opportunity Commission Annual Report, 2002-2003).
While several policies have been introduced to facilitate workers' achievement of their caring responsibilities, access to such work benefits appears to vary both between and within organisations (Gray and Tudball 2001). Furthermore, workers with family responsibilities may be reluctant to take advantage of existing benefits if they believe that doing so is likely to cause major disruptions at work, or jeopardise either their career advancement or their relationships with others in the workplace (Judiesch and Lyness 1999; Galinsky 1999; Marshall and Barnett 1993). The prevalence of such hidden barriers in Australia and their relevance to decisions about having children remains uncertain.
But how much value do women attach to paid work? Some authors argue that McDonald (2000a, 2001a) gives undue emphasis to the importance of paid work in women's lives (Hakim 2001; Manne 2001). In the United Kingdom, Hakim (2000) concludes that, while some women are career-centred (giving priority to work rather than raising children) and others are home-centred (giving priority to family and thus preferring not to work), the majority try to achieve a balance between the two. This debate highlights the relevance to fertility trends of values and beliefs about children's needs, and has sparked lively discussions about the appropriateness of some policies directed towards supporting women (or couples) in their roles as paid workers and parents.5
In summary, it seems quite easy to identify many potential financial and work-related costs that may contribute to the falling fertility rate. Most of those discussed above are tangible costs, but the spectre of the intangible may also deter couples from having children, encourage them to postpone starting a family, or defer making decisions about having children.
Dealing with the "unknowns"
McDonald (2000a) points out that economic and non-economic (psychosocial) costs of having children can be difficult to decipher, and that negative "unknowns" may encourage individuals to err on the side of caution. For instance, people may decide against having children because of uncertainties about job stability, housing prices, interest rates, or about chances of returning to paid work should they take time off to care for a child. Some couples may worry about the possible disruptive effects of a child on their relationship, the possibility that this child may follow worrying pathways through life or be harmed in some way, and the difficulties in coping with raising a child.
Kohler et al. (2001) point out that postponing having children can reduce some of the uncertainties, such as those relating to financial and relationship stability. They further note that starting a family is irreversible while planning or lack of planning is not. In their view, this situation encourages couples to postpone the decision to have children. Over time, choices thereby become increasingly restricted to having few if any children - and for those who postpone too long, there is no choice.
Costs linked with societal norms and personal values
Some authors have argued that people have increasingly emphasised "post-materialist values" and that such values are incompatible with parenting (see Coleman 1999; McDonald 2001a). These values include achieving self-realisation, autonomy, and freedom from the bonds of traditional forces, including religion. But in a similar, though more moralistic vein, the above-noted "Mackellar Commission" that was established around the turn of the 20th Century, concluded that the fall in the birth rate was ultimately caused by "growing selfishness", as reflected in part by "a love of luxury and of social pleasures" (Hicks 1978: 23). Furthermore, McDonald (2000b) questioned the notion that post-materialist values explain low fertility rates on two grounds: among industrialised countries, more liberal societies have higher fertility rates compared with traditional societies, and surveys suggest that women want to have more children than they end up having. In his view, low fertility can be explained in terms of the combined forces of costs, uncertainty, and social institutions that make it difficult for women to combine work and family life.
Perceptions of the financial costs of children are also inextricably linked with people's values. Allan, Hawker and Crow (2001) maintain that today's parents (in Britain and Europe) express greater concern about the quality of their children's everyday experiences, their emotional development and educational achievement compared with parents in earlier times. Consistent with these observations, Australian time use surveys suggest that parents are investing more time in fewer children (Bittman 2002). Given these issues, children are expensive in terms of time, money and energy. In an era in which there is growing economic inequity involving "winners and losers" (see Birrell et al., 2004), it is understandable that parents may invest more heavily in fewer children.
These and other macro-level forces may also contribute to a possibly growing emphasis on the part of young people to be reluctant to commit to a pathway of no return. Mackay (1997) suggests that, as a consequence of having grown up in an era of relatively constant and rapid technological, social and cultural change, men and women born in the 1970s are bent on keeping their options open. Ironically, as Kohler et al. (2001) also noted, a consequence of "drifting" is that the doors of having children are closing.
Changing values attached to children and parenting may also add to the costs of having children. King (2002) argues that Australian society has become increasingly intolerant of children and that parents tend to be disparaged, while in the United States, Crittenden (2001) maintains that a job devoted to nurturing a child full-time tends to be equated with "doing nothing". The diminishing importance of motherhood in women's lives is revealed in three Australian surveys. The proportion of married women under the age of 35 who agreed with the statement, "Whatever career a woman may have, her most important role in life is still that of becoming a mother" fell from 78 per cent in 1971 to 46 per cent in 1982 (McDonald 1983), and to 26 per cent in the 1991 Family Formation Project conducted by the Australian Institute of Family Studies.
Also potentially relevant to decisions about starting a family are prospective parents' beliefs about whether young children need full-time parenting and, if not, whether they can access suitable child care. Research by Evans and Kelley (2002) suggests that most Australians believe that mothers should stay home full-time to care for children under school age. Under these circumstances, the psychological costs of using non-parental child care for children under school age may be high for some parents. The psychological costs might also be high for working parents who reject the notion that young children need full-time parenting, but who are unhappy about the suitability of services available. According to Wise (2002), parents' judgments of "suitability" of child care are based on a range of issues, including the warmth displayed by carers, and health and safety issues. She also notes that some of the issues emphasised by parents vary according to their cultural background.
Drago, Scutella and Varner (2002) have specifically linked fertility with clashes in values. According to these authors, the trend towards part-time work for mothers in Australia reflects the presence of two beliefs that have a negative impact on fertility: that responsible mothering cannot be achieved with full-time work, and that ideal workers are committed to uninterrupted employment involving long work hours. These authors maintain that such beliefs lead many career-oriented women to opt out of having children.
As mentioned above, the fall in fertility may itself generate social norms that further reinforce the fall - norms that would not necessarily increase the costs of having children. This issue, along with other social effects and personal beliefs that might contribute to the fall in fertility, will be considered next.
1.4 Other social influences and personal beliefs
Changing life course patterns that result in smaller families and childlessness themselves lead to greater tolerance and eventually become "norms", shaping the expectations and preferences of those entering adulthood. Increasingly, partnering and having children have become "choices" rather than inevitable pathways in life. Furthermore, as family size falls, those who decide to have children will be increasingly likely to restrict their choice between having only one or two children. Indeed, above-noted evidence from Europe suggests that the size of a family that young adults consider to be ideal may fall below two children, if it has not already (Goldstein et al. 2003).
The decision to delay having a family may also be influenced by beliefs about the success of assisted reproductive technology as women (and men) age. Successes, not failures, tend to be publicised. Little is known about the prevalence of such beliefs, how they may have shifted with technological advances, and their impact on fertility decision-making.
The experiences of personal friends and other associates are also likely to play a major role in influencing family formation decisions. In fact, Kohler et al. (2001) argue that the tendency of prospective parents to draw on the experiences of others in their social networks has contributed to the postponement of decision-making and, consequently, low fertility rates. They maintain that prospective parents prefer to wait until they get a good idea of how others fare. But this takes time thus further delaying the decision.
1.5 Drawing some threads
In this discussion so far, attention has been paid to a complex and multi-layered set of factors that may help explain the decline in fertility. McDonald (2000b; 2001a) has attempted to integrate some of this literature by categorising the explanations for low fertility provided by Coleman (1998) into four theoretical perspectives. These have already been mentioned above, but will be restated here, given their relevance to the Fertility Decision Making Project.
One of these perspectives focuses on "post-materialist values". It assumes that people have become increasingly concerned about achieving self-realisation, autonomy and freedom from the bonds of traditional forces including religion. Arguments that women are selfish in not having children fit within this category of explanations. According to McDonald, low fertility is better explained in terms of the combined forces of costs, uncertainty, and the difficulties women face in attempting to combine paid work and family life.
According to the "rational choice" (or "demand") theory, people weigh up the costs and benefits of having a first or additional child. Economic consequences represent costs only, while psychological repercussions may include costs and/or benefits. McDonald proposed that there may be several psychological benefits associated with having the first child, including achieving the status of being a parent and being a "family", and meeting the expectations of other people. However, he argued that increasing age might deter couples from having additional children, because psychological costs may rise or psychological benefits may fall.
Financial costs include direct expenses incurred by having children as well as lost earnings resulting from the need to care for the child ("indirect costs" or "opportunity costs"). According to McDonald, indirect costs are particularly salient in decisions about having a first child, while direct costs are more important in decisions about having additional children.
In his discussion of the "rational choice" perspective, McDonald mostly focused on psychological benefits and financial costs. Women who feel that having a child would interfere with their pursuit of a personally rewarding career would be confronted not only with indirect financial costs but also with direct psychological costs.
Whereas the "rational choice" perspective assumes that people are aware of the rewards and costs of having children and weigh these up in arriving at a decision, McDonald noted that the existence of uncertainties is at the core of another set of explanations, called "risk aversion theory" or "theory of risk and opportunity". This perspective maintains that there are many uncertainties surrounding the impact of having children. If people feel unsure about what the future may hold, then they will avoid the insecurities associated with having children and invest in any security that is within their reach, such as education and employment.
The fourth perspective, called "gender equity", focuses on the difference in women's opportunities relative to men's opportunities before and after they have a child. McDonald maintains that, in countries where educational and work opportunities for women are similar to those for men but are seriously diminished for women if they have a child, then women will have fewer children than otherwise. In McDonald's view, lack of "family-friendly" work policies, high cost child care and tax benefits that operate as disincentives for taking up part-time work combine to encourage women to have fewer children than they wish to have. However, it seems very likely that these various considerations would also help shape men's views about having children. Indeed, McDonald argued that surveys suggest that most couples want to remain dual income earners.
Thus, in some form or another, all four explanations take into account the costs of having children - with the "post-materialist" perspective emphasising the loss of personal freedom and impediments to self-interested goals (which are likely to require two incomes for couples); the "rational choice" perspective suggesting that the decision to have a child is an outcome of a cost-benefit analysis; the "risk aversion" perspective focusing on concerns about uncertain costs; and the "gender equity" explanation taking into account curtailment of employment opportunities and thus income for women, along with direct financial costs of having children.
1.6 Conclusion
Australia's total fertility rate is well below replacement level, at an all-time low, and may continue on a downward slide. This trend has created considerable angst, given its impact on the ageing of the population and the projection that, if the rate falls below 1.6, the population will decline this century (ABS 2000a).
Of course, not everyone agrees that the economic and social consequences for Australia of this scenario are necessarily dire. For example, Hamilton (2002: 1) argues that: "Population growth will not make us richer in economic terms and it will almost certainly make us poorer in terms of environmental amenity".
Nevertheless, if the master plan is to prevent total fertility from falling below 1.6, a good understanding of the factors at play that are driving the birth rate down are required. These factors appear to be complex and often mutually reinforcing, with the most fundamental being postponement of first births and consequent shortened childbearing years, and increased risk of having no children at all. The factors appear to include broad technological, structural, cultural and social changes, shifting pathways of friends and associates, changes in personal financial and life course circumstances, and shifts in the beliefs and values of prospective parents.
However, there is a great deal of controversy about the existence or relative importance of some issues, such as increasing selfishness and the significance of women's employment in decisions about having children. Little is also known about other issues, such as men's contribution to childbearing decisions and the impact on future childbearing of disagreements between partners. Furthermore, the nature and relative importance of forces deterring couples from having children will vary somewhat for different sub-groups in the population, and understanding some of these sub-group differences and why they may be changing is a long way off.
Under these circumstances, it is little wonder that governments are struggling to develop policies that might curtail the falling birth rate. Perhaps the greatest hope stems from the fact that, despite all the forces operating against having children, most people want to become parents (Fisher 2002; Qu and Soriano 2004) and it appears that prospective parents want and expect to have more children than they end up having (McDonald 2001a; Quesnel-Valee and Morgan 2002). As noted above, there is evidence to suggest that in some European countries, the number of children considered personally ideal has already fallen below replacement (Goldstein et al., 2003).
1.7 The Fertility Decision Making Project
The Fertility Decision Making Project, a collaborative project of the Office for Women and the Australian Institute of Family Studies, was designed to examine ways in which some of the broad social forces suggested in this review are translated into the decisions individuals make about having children - the "micro-level" dynamics of their everyday choices. The broad aim of the study was to enhance understanding of the reasons underlying the fertility decisions of men and women aged 20-39 years, both as individuals and couples.
Key issues examined included the nature of fertility aspirations and expectations, ways in which aspirations and expectations are related, and the importance individuals attach to various costs, benefits and risks (including employment-related and financial issues) when considering having children. The extent to which these views vary according gender, age, relationship status, educational level and employment status was explored.
The project thus led to examination of a number of policy-relevant specific questions, for example:
- To what extent are "decisions" about having children deliberate choices or outcomes of external constraints, such as an inability to find a partner or limited "human capital"?
- Do adults change their views about having children and if so, what are their reasons?
- Given the widespread availability of birth control, to what extent are births unplanned?
- Have young adults even thought about having children - and if they have, do they hope or expect to have fewer children than older adults, many of whom will have "completed" their families?
- How close are personal ideals and expectations about family size?
- Do views vary systematically according to relationship status, educational level and employment status?
- By the time they are approaching their forties, what proportion of respondents have had the number of children they ideally wanted?
- How many approach their forties without having had a very much wanted child?
- Under what circumstances is this situation most likely to occur?
- Are men's views very different from women's views, and which partner in couples is likely to have the greater influence on expectations about having a child?
- In making decisions about having children, how important is it to feel secure in a job?
- How important is it to feel secure in one's relationship?
- How important is it to have the "right" gender mix of children?
- How important are issues regarding the impact of children on the couple relationship and on other aspects of family lifestyles?
As de Vaus (2003) has pointed out, adding this subjective dimension will help us gain a better understanding of the factors behind declines in the fertility rate. The Fertility Decision Making Project was designed to achieve this aim and thereby provide policy with a greater evidence base.
However, research into the subjective dimension is beset with difficulties in defining and measuring psychological concepts. This problem is apparent in the research into key issues that are examined in this report: aspirations and expectations.
Interpreting "aspirations" and "expectations"
The concepts, "ideals", "preferences", "desires", "expectations" and "intentions" are related cognitions and have been variously examined in theories and studies of decision-making. The concepts "expectations" and "intentions" are often used synonymously (see Quesnel-Valee & Morgan 2002). Regardless of the possible inaccuracy in this approach, these two concepts are certainly closer in meaning to each other than to "preferences", "desires" or "ideals". (Throughout this report, the terms "preferences" and "desires" are used interchangeably.)
In the Fertility Decision Making Project, the question on respondents' ideal number of children was designed to tap into inclinations that, as much as possible, are removed from individual circumstances and other life goals. It seems likely that "desires" for another child are more influenced by current circumstances (including competing goals), compared with personal ideals. On the other hand, "expectations" are likely to be the most influenced by such circumstances.
These arguments diverge somewhat from those of Miller (1994). In his model of fertility decisionmaking, Miller focused on "intentions" (rather than "expectations") and "desires". He argued that "desires" refer to what one wants, whereas "intentions" refer to decisions made based on personal desires that are constrained by reality (with partner's views representing one potential constraint). To Miller, reproductive behaviour is influenced by "intentions".
Azjen (1985, 1988, 1991) also emphasises that intentions are influenced by perceived constraints. According to his theory of planned behaviour, intentions shape behaviours that are under volitional control - with such circumstances applying to most everyday behaviours. Intentions are thus seen as instigating behaviour when the opportunity to engage in that behaviour arises.
However, life is more complex than that suggested above. Although "ideals" may be the most removed from the practical realities of life and thus the least predictive of behavioural outcomes, they are not necessarily divorced from constraints. Firstly, it can be difficult to envision possibilities that are very remote from personal life experiences - an issue relevant to the "structure versus agency" debate. Secondly, "ideals" may not only be strongly affected by societal norms to some extent but are also likely to be influenced by personal life experiences. Thirdly, perceived constraints may help shape ideals and preferences through a process of defensive reappraisal or dissonance reduction (Festinger 1957; Lazarus & Folkman 1994).
Indeed, the extent to which personal circumstances and alternative aspirations are taken into account when establishing ideal or desired family size is likely to vary across individuals. For instance, some individuals may view two children as ideal for them because it is no longer possible for them to have a larger family or because they would not be able to afford private education for more than two children. Others may take less account of their competing goals and practical constraints when establishing their "ideal" family size, while acknowledging that this ideal is unachievable. In other words, "ideals" may not mean the same thing to all respondents in a survey.
Nevertheless, there is evidence to suggest that "ideals" and "desires" are further removed from, and thus less predictive of, behaviour compared with intentions or expectations (see Van Peer 2000). This does not mean, of course, that measurement of ideals and preferences has little policy relevance. Of those who do not intend having children (at least in the near future), some will want children and others will not. Of the latter, there will be some who have never wanted children, but not all of these people may continue to feel this way.
In the following chapter, design and sample of the Fertility Decision Making Project is outlined. Chapter 3 then provides a socio-demographic snapshot of the current situation of our respondents in terms of the following key factors: gender and age, relationship status, educational level and employment status. The next three chapters focus on fertility aspirations (Chapter 4), fertility expectations (Chapter 5), and the relationship between the two (Chapter 6). In Chapter 4, the extent to which respondents' views about having children had changed over time is explored. The final set of analyses (Chapter 7) examines the extent to which various potential costs, risks and benefits are taken into account when considering having children.
In each chapter, the extent to which the views of respondents about having children vary systematically according to the above-noted five factors (gender and age, relationship status, educational level and employment status) is assessed. Many other factors no doubt play an important role, but their examination is beyond the scope of this report. The final chapter draws together all these sets of analysis to address the key issues that formed the basis of this study and associated policy implications.
1. The total fertility rate is a synthetic measure that refers to the number of children a woman would have if she experienced the current age-specific fertility rates across her reproductive life.
2. While the distinction between "voluntary" and "involuntary" childlessness is at times difficult to draw given that some women voluntarily postpone having children until they reach an age when fecundity problems develop, for others external circumstances hinder their chances of having children. Nevertheless, McDonald (2001a) estimated that 7 per cent of people are infertile, although this trend increases with age.
3. See edited transcript of interview by Kerri Phillips for the ABC's The Europeans program, printed in Family Matters, No.63, pp.50-59.
4. So far, little attention has been paid to men's aspirations and how they may change.
5. See Family Matters 2002, No. 63, for edited transcript of Keri Phillips' interview with McDonald and Hakim for the ABC's Europeans program.
2. Method and sample
In this chapter the process by which the sampling and fieldwork were conducted is set out, and the rationale for defining the parameters of the population from which the Fertility Decision Making Project sample was drawn. The major steps involved in the process of designing the interview schedule and the recruitment and interviewing of the participants are described. Response rates are presented and the demographic characteristics of the sample are then compared with the population.
2.1 Development of the interview schedule
The interview schedule was developed over a period of several months, at first in consultation with officers from the Office for Women and subsequently in collaboration with both the Office for Women and the Wallis Consulting Group, the fieldwork company awarded (through a competitive tendering process) the contract to undertake the fieldwork for the Fertility Decision Making Project.
Research themes and questions relevant to the investigation of issues related to fertility decision making were generated by both the Office for Women and the Australian Institute of Family Studies. Institute researchers then collated a range of instruments designed to measure the concepts and issues of concern to each agency. Through an extensive period of consultation, the amount and nature of the information required by each agency in relation to particular domains of fertility behaviour were discussed, clarified and finalised.
Australian Institute of Family Studies researchers then worked with the fieldwork company to refine the content of the interview to allow maximum information to be gathered in the time available. The fieldwork company recommended the interview be structured to be no longer than 30 minutes. Within this constraint, extensive revision of the content of the interview was undertaken. The content areas covered by the interview were:
- Relationship and childbearing status and history;
- Other sociodemographic characteristics such as age, education, labour force participation, income, and religion;
- Family background, health and wellbeing, quality of relationships;
- Fertility aspirations and expectations of respondents and their partners;
- Employment conditions, work values, job-related perceptions and stress; and
- Level of importance attached to various issues that may influence fertility decision making behaviour.
2.2 Overview of the sampling procedure and fieldwork
Two samples were selected: a primary sample comprising those who were initially contacted for interview, and a secondary sample formed by recruiting the partners of those primary respondents in committed relationships who provided contact information.
2.2.1 Sampling
The primary sample was a national simple random sample of people between the ages of 20 and 39 years who lived in a private dwelling with a telephone. Thus the sample could include boarders and those in group households but not those residing in shared accommodation such as university Halls of Residence where there was no private phone access. Where several members of a household were eligible to participate in the survey, the sample member with the next birthday was chosen. This approach improves the chances of the sample resembling the target population in terms of gender and age (Salmon and Nichols, 1983).
Much of the fertility literature is biased to the extent that researchers have tended to restrict their attention to the views of women, as though they alone make the decisions (Greene & Biddlecom 2000). There is also a tendency to gather data from only one member of a couple, yet it appears that men's fertility preferences are also important in shaping couples' decisions about having children (Barber & Axinn 1998; Miller & Pasta 1995; Thomson 1997a, 1997b). Yet, as Greene and Biddlecom (2000) point out, the individual reproductive histories of the partners and the level of agreement between partners regarding fertility preferences and decisions can have important effects on reproductive behaviour (Greene & Biddlecom 2000; Stewart 2002; Thomson 1997a).
The Fertility Decision Making Project has addressed this bias by recruiting a primary sample of both men and women so that the similarities and differences in factors that influence men's and women's fertility preferences and expectations can be examined. An additional feature of this project is its capacity to explore some of the dynamics of fertility-related decisions in couples via the collection of data from the respondent regarding their partner's fertility histories and preferences. However, there are three issues to consider with respect to obtaining information about their partner's fertility preferences and intentions from the respondent:
- respondents may not be prepared to indicate their partner's views,
- the information provided by respondents about their partners may not be accurate, and
- evidence suggests that the views of each partner are independently important in shaping reproductive behaviour (Miller and Pasta, 1995).
For these reasons, primary respondents in committed relationships (married, de facto, or committed but not living together) were asked to provide contact details for their partners. These partners formed a secondary sample, which was subsequently mailed a self-completion questionnaire asking for information about their personal fertility aspirations and expectations, as well their general demographic characteristics. The data provided by this secondary sample enables the assessment of the extent to which couples share similar aspirations and expectations regarding having children, and the relative influence of each partner's aspirations in shaping their fertility expectations.
2.2.2 Target population
The population from which the sample was drawn was restricted to those aged between 20 and 39 years - the years in which women are most likely to have children. Current fertility rates (expressed as the number of babies per 1000 women) indicate that relatively few women under 20 and over 40 have children. In 2002, the fertility rate for women under 20 was 17.1 and for women aged 40-44 it was 9.7. By contrast, the fertility rates for women aged in their early and late twenties were 55.5 and 104.2 respectively, while those for women aged in their early and late thirties are 111.2 (30-34 year olds) and 52.2 (35-39 year olds). While there could be merit in exploring the fertility intentions of younger people, given the implications of their views for future fertility intentions and patterns, their intentions may be too fluid to yield reliable information about likely future fertility patterns.
Surveying people aged 20-39 also allows us to gain an understanding of ways in which fertility expectations differ across the primary childbearing years. This aspect of the study design was based on the proposition that fertility preferences and expectations can change, often in response to changes in life circumstances and the accumulation of life experiences (McDonald 2000c, 2000e). Many preferences and expectations are likely to be contingent rather than absolute, being re-framed in the light of job or career opportunities, partnership formation and quality, experiences with an earlier child, and so forth.
2.2.3 Fieldwork
Computer-Assisted Telephone Interviewing (CATI) was used to conduct interviews with respondents enlisted via random digit dialling (RDD). In random digit dialling, telephone numbers to be contacted are based on the first five digits of the series of telephone numbers known to be allocated to a given postcode in the various metropolitan and regional areas of the country. The last three digits are unknown and are generated randomly by the CATI system. Interviews lasted on average 34.3 minutes and required an average of 4.4 calls to the residence. Almost ten per cent of interviews were achieved only after ten calls to the dwelling or the selected resident.
Fieldwork began on 10 December 2003 and concluded on 22 March 2004. The final primary sample of 3,201 respondents comprised 1,250 men (39%) and 1,951 (61%) women. Male respondents were unexpectedly difficult to recruit, particularly in NSW/ACT and Victoria, even when the "last birthday" method of selection was abandoned. Up to 10 callbacks were made to secure an interview. Initial non-contacts were called back one hour later and if contact still not established a further callback was scheduled for the following day. If four of these attempts were unsuccessful, callbacks were re-scheduled to take place in a different time frame - for example, a weekend rather than an evening. In this way successive attempts to enlist a respondent or make contact with the selected household member were spread across daytime and evening periods, weekdays and weekends.
Piloting of the CATI interview on a sample of 70 primary respondents was conducted by the fieldwork company to identify any inadequacies of the questions, clarify interviewer protocols, and to check the routing of respondents into correct subgroups.
2.3 Response rates
2.3.1 Response rates - Primary sample
Table 2.1 provides a summary of outcomes of the random digit dialling process used to derive the sample. In total, calls were made to 140,547 separate phone numbers, with 12 per cent turning out to be business numbers. In addition, 37 per cent failed to result in a contact. Where a private dwelling was contacted, the nature of the study was described to the person answering the telephone, and this person was then asked whether there was anyone in the household aged 20 to 39 years. In 76 per cent of cases, the person to whom the fieldwork company spoke indicated that there was no one in the household aged 20 to 39 years (here called ineligible households). Some of these people may have falsely claimed that their household was ineligible as a polite way of refusing contact. It appears that around 60 per cent of private households in most capital cities and around 65 per cent in the rest of the States/Territories would have been "out of scope".6
Where it was known that an eligible person lived in the private dwelling, 45 per cent agreed to participate, 21 per cent refused, and the remaining 34 per cent were not available for interview during the survey period. Some of these people may, in fact, have not wished to participate, while others are likely to have been genuinely absent at the time of the survey. In total, 68 per cent of interviews were achieved where the eligible person was contacted. However, if it is assumed that 40 per cent of refusers at the household level contained an eligible person, then only 26 per cent of interviews were achieved of the total sample of assumed refusers, known refusers, eligible respondents who were unavailable, and survey participants.
In other words, the best scenario is a response rate of 68 per cent (based on the sample of refusers and participants). The second best scenario is a response rate of 45 per cent (based on the sample of known eligibles who refused or were not contacted, and those who participated). It is more likely, however, that the response rate based on eligible households was closer to the lower bound estimate of 26 per cent.
The table can also be viewed on page 24 of the PDF.
| N | % | Outcomes for known private dwellings | % (all refusers 3 + interviews) | Outcomes for known eligibles | % (eligible but refused + interviews) | Eligible N if assume 40% of "Household refusers" are eligible | % if assume 40% of "Household refusers" are eligible | |
|---|---|---|---|---|---|---|---|---|
| Non-contact/unresolved calls 1 | 51749 | 36.8 | ||||||
| Definitely ineligible | ||||||||
| Business numbers | 16794 | 11.9 | ||||||
| Ineligible (no-one in HH 20-39 yrs) | 51531 | 36.7 | 71.6 | |||||
| Sub-total | 68325 | 48.6 | 71.6 | |||||
| Eligibility unknown | ||||||||
| Refused at household level 2 | 13272 | 9.4 | 18.4 | 73.7 | 5309 | 42.4 | ||
| Eligible resident | ||||||||
| Unavailable during survey period | 2467 | 1.8 | 3.4 | 34.3 | 2467 | 19.7 | ||
| Refused to participate | 1533 | 1.1 | 2.1 | 8.5 | 21.3 | 32.4 | 1533 | 12.3 |
| Interview archived | 3201 | 2.3 | 4.4 | 17.8 | 44.5 | 67.6 | 3201 | 25.6 |
| Sub-total | 7201 | 5.1 | 10.0 | |||||
| Total | 140547 | 99.9 | 100.0 | 100.0 | 100.0 | 100.0 | 12510 | 100.0 |
1 Non-contact/unresolved calls consisted of: number out-of-order, misdialed or not connected (70.1%); "no answer" (23.5%); "busy", engaged or answering machine (5.7%); and unresolved callbacks (0.7%).
2 No indication of eligibility was provided.
3 "All refusers" include refusers at household level where eligibility is unknown.
2.3.2 Response rates - secondary (partner) sample
At the end of each telephone interview, respondents in committed relationships (married, de facto, and exclusive but non-cohabiting; n = 2129) were asked whether they thought their spouse or partner would also be willing to participate in the study. Partner contact details were obtained from almost 50 per cent of these, and questionnaires subsequently mailed to the partners of 1,057 respondents. Of these, 64 were returned marked "return to sender". Completed questionnaires were received from 313 partners of primary respondents, a response rate of 30 per cent. The secondary sample of 313 partners comprised 173 men (55%) and 140 (45%) women.
2.4 Comparison of sample and population characteristics - Primary sample
In order to gain insight into the extent to which the sample represents the Australian population aged 20-39 years, several sociodemographic characteristics were compared with the ABS one per cent sample from the 2001 Census. These included age, social and registered marital status, the number of children, labour force participation, education and religion.
Age:
The proportions of Fertility Decision Making Project respondents in the age ranges used in this project compare favourably to those found in the general population. However the sample does comprise more women than men (61% vs 39%), which will potentially bias any analysis in which gender is not taken into account.
| 2001 Census (one per cent sample) a | FDMP Survey Primary sample (2003-2004) b | |||||
|---|---|---|---|---|---|---|
| Men (%) | Women (%) | Men (N) | Men (%) | Women (N) | Women (%) | |
| 20-24 | 23.1 | 21.9 | 305 | 24.4 | 379 | 19.4 |
| 25-29 | 24.4 | 24.8 | 316 | 25.3 | 508 | 26.1 |
| 30-34 | 26.0 | 26.5 | 347 | 27.7 | 574 | 29.4 |
| 35-39 | 26.4 | 26.7 | 275 | 22.0 | 473 | 24.3 |
| Not provided | 8 | 0.6 | 16 | 0.8 | ||
| Total | 100.0 | 100.0 | 1251 | 100.0 | 1950 | 100.0 |
| a Excludes overseas visitors and persons in non-private dwellings. b Some respondents did not provide data. | ||||||
Social Marital Status:
In the Fertility Decision Making Project sample, the proportions of currently married and unmarried women are roughly similar to those in the general population. However, de facto relationships and currently unmarried men are slightly over-represented in the Fertility Decision Making Project sample, and married men slightly under-represented.
| Men | Women | |||
|---|---|---|---|---|
| N | % | N | % | |
| 2001 Census (one per cent sample) a | ||||
| Married in a registered marriage | 35.6 | 43.3 | ||
| Married in a de facto marriage | 12.2 | 12.4 | ||
| Not married | 45.1 | 38.4 | ||
| Not applicable b | 7.1 | 5.9 | ||
| Total | 100.0 | 100.0 | ||
| FDMP Survey (2003-2004) Primary Sample | ||||
| Married and living with spouse | 379 | 30.3 | 889 | 45.6 |
| In a de facto marriage | 208 | 16.6 | 327 | 16.8 |
| Not married - In a committed relationship but not living together | 144 | 11.5 | 182 | 9.3 |
| Not married - Seeing someone casually | 87 | 7.0 | 70 | 3.6 |
| Not married - Single not seeing anyone | 433 | 34.6 | 482 | 24.7 |
| Total | 1251 | 100.0 | 1950 | 100.0 |
| Total Not Married | 664 | 53.1 | 734 | 37.6 |
| a Excludes overseas visitors and persons in non-private dwellings. b Persons living in a non-classified household or visitors from within Australia. | ||||
Registered Marital Status:
There are more never married and fewer married men in the Fertility Decision Making Project sample compared to the Australian population, however the proportions of the other categories for men and all categories for women are very similar.
| 2001 Census (one per cent sample) a | FDMP Survey (2003-2004) Primary Sample | |||||
|---|---|---|---|---|---|---|
| Men (%) | Women (%) | Men (N) | Men (%) | Women (N) | Women (%) | |
| Married | 38.3 | 46.0 | 379 | 30.3 | 889 | 45.6 |
| Separated | 2.6 | 3.9 | 30 | 2.4 | 89 | 4.6 |
| Divorced | 3.4 | 5.2 | 41 | 3.3 | 82 | 4.2 |
| Widowed | 0.1 | 0.4 | 0 | 0.0 | 5 | 0.3 |
| Never married | 55.5 | 44.5 | 801 | 64.0 | 885 | 45.4 |
| Total | 100.0 | 100.0 | 1251 | 100.0 | 1950 | 100.0 |
| a Excludes overseas visitors and persons in non-private dwellings. | ||||||
Number of children ever born:
Overall, the sample of women represented the population well in terms of the number of children they already had. Compared to the general population, slightly more women in the Fertility Decision Making Project sample already had one child, while the proportions in the sample without children and with two, three, four or more children were similar to those in the population. The 2001 Census did not ask women how many children they had, thus the 1996 Census is used here. The Census only asked this question of women.
| 1996 Census (one per cent sample) a | FDMP Survey (2003-2004) Primary Sample b | ||||
|---|---|---|---|---|---|
| Women (%) | Men (N) | Men (%) | Women (N) | Women (%) | |
| None | 45.2 | 851 | 68.4 | 840 | 43.3 |
| One | 15.7 | 162 | 13.0 | 387 | 19.9 |
| Two | 22.6 | 150 | 12.0 | 449 | 23.1 |
| Three | 11.5 | 58 | 4.7 | 184 | 9.5 |
| Four or more | 5.0 | 24 | 1.9 | 81 | 4.2 |
| Total | 100.0 | 1245 | 100.0 | 1941 | 100.0 |
| a Excludes women who did not state the number of children ever had. b Some respondents did not answer the question on number of children ever had. | |||||
Labour force participation:
Compared to the general population there were slightly fewer employed men and women in the Fertility Decision Making Project sample, and more men and women who are not in the labour force at all. Proportions of unemployed men and women in the sample and in the general population were similar.
| 2001 Census (one per cent sample) a | FDMP Survey (2003-2004) Primary Sample b | |||||
|---|---|---|---|---|---|---|
| Men (%) | Women (%) | Men (N) | Men (%) | Women (N) | Women (%) | |
| Employed | 79.0 | 64.0 | 931 | 74.4 | 1106 | 56.7 |
| Unemployed | 7.4 | 4.9 | 72 | 5.8 | 111 | 5.7 |
| Not in labour force | 10.1 | 27.8 | 248 | 19.8 | 732 | 37.6 |
| Not stated | 3.5 | 3.3 | ||||
| Total | 100.0 | 100.0 | 1251 | 100.0 | 1949 | 100.0 |
| a Excludes overseas visitors and persons in non-private dwellings. b The category "not in labour force" includes 2 men on paternity leave (1 paid and 1 unpaid) and 69 women on maternity leave (20 paid, 48 unpaid, and 1 unclear if the leave was paid or not). | ||||||
Family Type:
Compared to men in the general population, approximately half as many male Fertility Decision Making Project sample respondents were living with a partner and children. Women with partners and children were also underrepresented in the sample, but not to the same extent. Slightly more men in the Fertility Decision Making Project sample were living with a partner and no children, and there were fewer single fathers in this sample than in the general population.
| Men | Women | |||
|---|---|---|---|---|
| N | % | N | % | |
| 2001 Census (one per cent sample) | ||||
| Couple with children | 46.8 | 48.9 | ||
| Couple without children | 17.1 | 17.2 | ||
| One parent with children | 6.4 | 13.1 | ||
| Other family | 2.2 | 1.6 | ||
| Not applicable b | 27.6 | 19.3 | ||
| Total | 100.0 | 100.0 | ||
| FDMP Survey (2003-2004) Primary Sample | ||||
| Couple with children | 314 | 25.1 | 835 | 42.8 |
| Couple without children | 267 | 21.3 | 373 | 19.1 |
| One parent with children | 34 | 2.7 | 251 | 12.9 |
| Single without children: | ||||
| - not living at home | 426 | 34.1 | 315 | 16.2 |
| - living with one parent | 58 | 4.6 | 45 | 2.3 |
| - living with both parents | 145 | 11.6 | 120 | 6.2 |
| Insufficient information | 7 | 0.6 | 11 | 0.6 |
| Total | 1251 | 100.0 | 1950 | 100.0 |
| a Excludes overseas visitors and persons in non-private dwellings. b Persons who are non-family members or visitors from within Australia or persons in lone-person households, group households, or non-classifiable households. | ||||
Highest Level of Education Completed:
The Fertility Decision Making Project sample is, overall, more highly educated than the general population. A lower proportion of participants in the study had less than Year 12 schooling while there was an over-representation of respondents at most other levels of education, most notably graduates and postgraduates.
| Men | Women | |||
|---|---|---|---|---|
| N | % | N | % | |
| 2001 Census (one per cent sample) a | ||||
| Post-graduate (Diploma, Masters, PhD) | 2.9 | 3.5 | ||
| Bachelor Degree Level | 12.5 | 16.6 | ||
| Advanced Diploma and Diploma Level | 5.7 | 8.1 | ||
| Certificate Level | 25.7 | 12.3 | ||
| Level of education inadequately described | 1.0 | 1.7 | ||
| Year 12 | 20.0 | 22.1 | ||
| Year 11 or less | 24.2 | 27.7 | ||
| Not stated b | 8.0 | 8.0 | ||
| Total | 100.0 | 100.0 | ||
| FDMP Survey (2003-2004) Primary Sample | ||||
| Post-graduate (Diploma, Masters, PhD) | 131 | 10.5 | 185 | 9.5 |
| Bachelor Degree | 288 | 23.0 | 517 | 26.5 |
| Diploma (not post-graduate) | 120 | 9.6 | 218 | 11.2 |
| Other certificate | 110 | 8.8 | 229 | 11.7 |
| Trade/apprenticeship | 103 | 8.2 | 30 | 1.5 |
| Year 12 | 324 | 25.9 | 435 | 22.3 |
| Year 11 or less | 164 | 13.1 | 329 | 16.9 |
| Other | 5 | 0.4 | 5 | 0.3 |
| Not stated | 6 | 0.5 | 2 | 0.1 |
| Total | 1251 | 100.0 | 1950 | 100.0 |
| a Excludes overseas visitors and persons in non-private dwellings. b Includes (1) level of education/qualification not stated and (2) no qualification or highest level of schooling stated. | ||||
Religion:
Although the proportions of Catholics were similar both between the sample and the Australian population, and between men and women, respondents in the Fertility Decision Making Project sample was much more likely to report subscribing to a non-Christian religion or to having no religion at all. In the Australian population these proportions are affected by those who refused to answer or provided answers that could not be classified, making comparison difficult.
| Men | Women | |||
|---|---|---|---|---|
| N | % | N | % | |
| 2001 Census (one per cent sample) a | ||||
| Catholic | 25.8 | 26.9 | ||
| Anglican | 17.3 | 19.2 | ||
| Christian - unspecified | 17.3 | 18.9 | ||
| Other | 6.2 | 6.1 | ||
| No religion | 20.1 | 17.2 | ||
| Religion b | 13.2 | 11.7 | ||
| Total | 100.0 | 100.0 | ||
| FDMP Survey (2003-2004) Primary Sample | ||||
| Catholic | 301 | 24.1 | 513 | 26.3 |
| Anglican | 157 | 12.5 | 321 | 16.5 |
| Christian - unspecified | 190 | 15.2 | 301 | 15.4 |
| Other | 180 | 14.4 | 291 | 14.9 |
| No religion | 406 | 32.5 | 520 | 26.7 |
| Refused or don't know | 17 | 1.4 | 4 | 0.2 |
| Total | 1251 | 100.0 | 1950 | 100.0 |
| a Excludes overseas visitors and persons in non-private dwellings. b Religious belief not fully defined, inadequately described, or not stated. | ||||
Region:
The distribution of female Fertility Decision Making Project respondents across geographic regions was very similar to that found in the general population. However, there tended to be a slightly smaller proportion of male respondents in Sydney and Melbourne, and a slightly larger proportion from Adelaide.
| Men | Women | |||
|---|---|---|---|---|
| N | % | N | % | |
| 2001 Census (one per cent sample) a | ||||
| Sydney | 23.1 | 22.9 | ||
| Other NSW/ACT | 12.0 | 12.3 | ||
| Melbourne | 19.6 | 19.3 | ||
| Other VIC | 5.9 | 5.8 | ||
| Brisbane | 9.2 | 9.5 | ||
| Other QLD | 9.4 | 9.7 | ||
| Perth | 7.4 | 7.4 | ||
| Other WA | 2.5 | 2.5 | ||
| Adelaide | 5.6 | 5.5 | ||
| Other SA/NT | 3.0 | 2.8 | ||
| Tasmania | 2.2 | 2.1 | ||
| Total | 100.0 | 100.0 | ||
| FDMP Survey (2003-2004) Primary Sample | ||||
| Sydney | 246 | 19.7 | 457 | 23.4 |
| Other NSW/ACT | 161 | 12.9 | 258 | 13.2 |
| Melbourne | 218 | 17.4 | 357 | 18.3 |
| Other VIC | 60 | 4.8 | 127 | 6.5 |
| Brisbane | 144 | 11.5 | 169 | 8.7 |
| Other QLD | 109 | 8.7 | 176 | 9.0 |
| Perth | 110 | 8.8 | 148 | 7.6 |
| Other WA | 21 | 1.7 | 51 | 2.6 |
| Adelaide | 104 | 8.3 | 123 | 6.3 |
| Other SA/NT | 48 | 3.8 | 44 | 2.3 |
| Tasmania | 30 | 2.4 | 40 | 2.1 |
| Total | 1251 | 100.0 | 1950 | 100.0 |
| Note: refused or don't know responses were excluded for each variable. a Excludes overseas visitors and persons in non-private dwellings. | ||||
2.5 Description of secondary (partner) sample.
The characteristics of the sample of partners are largely similar to those of the respondent sample.
Partner's age:
Since the partner sample was not constrained by screening procedures, the distribution of partner ages extends beyond that of the primary sample. As women tend not to form relationships with younger men and men tend to form relationships with younger women, there are no men aged less than 20 years and very few women aged over 40 years in the partner sample. In Australia married men are, on average, approximately two years older than their partners (ABS 2003). In the Fertility Decision Making Project, female respondents were 2.5 years younger, and male respondents approximately 9 months older than their partners. The proportion of men and women in their early 20s in the partner sample is lower than that in both the general population and the Fertility Decision Making Project primary sample, probably because of the later age at which they tend to form committed relationships. The comparatively small number of women partners aged 35 to 39 years is likely to be strongly influenced by the absence of men aged in their forties in the primary sample.
| FDMP Survey Partner Sample | ||||
|---|---|---|---|---|
| Men | Women | |||
| N | % | N | % | |
| Under 20 | 0 | 0 | 1 | 0.7 |
| 20-24 | 12 | 6.9 | 21 | 15.0 |
| 25-29 | 36 | 20.8 | 32 | 22.9 |
| 30-34 | 46 | 26.6 | 56 | 40.0 |
| 35-39 | 47 | 27.2 | 25 | 17.9 |
| 40-44 | 24 | 13.9 | 4 | 2.9 |
| 45 and over | 8 | 4.6 | 1 | 0.7 |
| Total | 173 | 100.0 | 140 | 100.0 |
Social marital status:
Completed questionnaires were received from a slightly higher percentage of the married male partners and a lower percentage of the men in de facto relationships than would be expected based on the proportions of each in the primary sample. Thus, analyses of couple data were representative of both married and de facto couples.
| FDMP Survey Primary Sample | FDMP Survey Partner Sample a | |||||||
|---|---|---|---|---|---|---|---|---|
| Men | Women | Men | Women | |||||
| N | % | N | % | N | % | N | % | |
| Married, living with spouse | 379 | 64.6 | 889 | 73.1 | 84 | 72.4 | 77 | 72.0 |
| De Facto | 208 | 35.4 | 327 | 26.9 | 32 | 27.6 | 30 | 28.0 |
| Total | 587 | 100.0 | 1216 | 100.0 | 116 | 100.0 | 107 | 100.0 |
| a 83 respondents did not supply this data. Excludes partners in non-cohabiting relationships. | ||||||||
Registered marital status:
Due to the nature of the secondary sample, far fewer partners had never been married, and far more were currently married, than in the primary sample. Only a very few of the partners had been divorced.
| FDMP Survey Primary Sample | FDMP Survey Partner Sample | |||||||
|---|---|---|---|---|---|---|---|---|
| Men | Women | Men | Women | |||||
| N | % | N | % | N | % | N | % | |
| Married | 373 | 52.8 | 883 | 64.0 | 134 | 77.5 | 103 | 73.6 |
| Separated | 10 | 1.4 | 16 | 1.2 | ||||
| Divorced | 15 | 2.1 | 36 | 2.6 | 3 | 1.7 | 2 | 1.4 |
| Widowed | ||||||||
| Never married | 308 | 43.6 | 444 | 32.2 | 36 | 20.8 | 34 | 24.3 |
| Refused/don't know | 1 | 0.7 | ||||||
| Total | 706 | 100.0 | 1379 | 100.0 | 173 | 100.0 | 140 | 100.0 |
Number of children:
As would be expected in a sample consisting of partnered respondents, more male partners had one, two, three, four or more children than had male primary respondents and less than one third were childless. Women partners with two or three children were slightly more common in the secondary than the primary sample, although fewer of them had four or more children.
| FDMP Survey Primary Sample | FDMP Survey Partner Sample | |||||||
|---|---|---|---|---|---|---|---|---|
| Men | Women | Men | Women | |||||
| N | % | N | % | N | % | N | % | |
| None | 851 | 68.4 | 840 | 43.3 | 54 | 31.2 | 56 | 40.0 |
| One | 162 | 13.0 | 387 | 19.9 | 32 | 18.5 | 23 | 16.4 |
| Two | 150 | 12.0 | 449 | 23.1 | 56 | 32.4 | 39 | 27.9 |
| Three | 58 | 4.7 | 184 | 9.5 | 22 | 12.7 | 20 | 14.3 |
| Four or more | 24 | 1.9 | 81 | 4.2 | 9 | 5.2 | 2 | 1.4 |
| Total | 1245 | 100.0 | 1941 | 100.0 | 173 | 100.0 | 140 | 100.0 |
Highest level of education completed:
Postgraduate qualifications were more common in the partner than the respondent sample, although there were fewer women with Bachelor degrees. When categories of tertiary qualifications were combined, however, the proportions of university-educated respondents and partners were very similar. There were more tradesmen and fewer men who had completed Year 12 in the partner sample.
| FDMP Survey Primary Sample | FDMP Survey Partner Sample | |||||||
|---|---|---|---|---|---|---|---|---|
| Men | Women | Men | Women | |||||
| N | % | N | % | N | % | N | % | |
| Post-graduate (Diploma, Masters, PhD) | 131 | 10.5 | 185 | 9.5 | 26 | 15.0 | 23 | 16.4 |
| Bachelor Degree | 288 | 23.0 | 517 | 26.5 | 36 | 20.8 | 29 | 20.7 |
| Diploma (not post-graduate) | 120 | 9.6 | 218 | 11.2 | 17 | 9.8 | 17 | 12.1 |
| Other certificate | 110 | 8.8 | 229 | 11.7 | 20 | 11.6 | 15 | 10.7 |
| Trade/apprenticeship | 103 | 8.2 | 30 | 1.5 | 29 | 16.8 | 5 | 3.6 |
| Year 12 | 324 | 25.9 | 435 | 22.3 | 25 | 14.5 | 29 | 20.7 |
| Year 11 or less | 164 | 13.1 | 329 | 16.9 | 19 | 11.0 | 20 | 14.3 |
| Other | 5 | 0.4 | 5 | 0.3 | 0 | 0.0 | 2 | 1.4 |
| Not stated | 6 | 0.5 | 2 | 0.1 | 1 | 0.6 | 0 | 0.0 |
| Total | 1251 | 100.0 | 1950 | 100.0 | 173 | 100.0 | 140 | 100.0 |
Religion:
The overall proportions of non-religious and Christian men and women (whether Catholic, Anglican or unspecified) were similar for primary respondents and their partners, although Anglican men and women were over-represented in the partner sample. There were also fewer male partners subscribing to a non-Christian religion, and fewer women partners whose religion was an unspecified Christian faith compared to primary sample.
| FDMP Survey Primary Sample | FDMP Survey Partner Sample | |||||||
|---|---|---|---|---|---|---|---|---|
| Men | Women | Men | Women | |||||
| N | % | N | % | N | % | N | % | |
| Catholic | 301 | 24.1 | 513 | 26.3 | 36 | 20.8 | 29 | 20.7 |
| Anglican | 157 | 12.5 | 321 | 16.5 | 37 | 21.4 | 38 | 27.1 |
| Christian (unspecified) | 190 | 15.2 | 301 | 15.4 | 27 | 15.6 | 13 | 9.3 |
| Other | 180 | 14.4 | 291 | 14.9 | 12 | 6.9 | 22 | 15.7 |
| No religion | 406 | 32.5 | 520 | 26.7 | 57 | 32.9 | 37 | 26.4 |
| Refused or don't know | 17 | 1.4 | 4 | 0.2 | 4 | 2.3 | 1 | 0.7 |
| Total | 1251 | 100.0 | 1950 | 100.0 | 173 | 100.0 | 140 | 100.0 |
2.6 Summary
Apart from being comprised of more women (61%) than men (39%), the Fertility Decision Making Project sample was reasonably representative of the Australian population. The use of CATI technology to conduct the interviews may be part of the reason there are fewer employed respondents (Steel, Vella & Harrington 1996; Trewin & Lee 1988), but it is likely that other deviations are due to the restriction of the Fertility Decision Making Project sample to those aged between 20 and 39 years. It would be reasonable to expect there to be fewer married and more unmarried (including de facto) respondents in a sample aged under 40 years, and with more young Australians completing secondary and university education it should not be surprising that the Fertility Decision Making Project sample is more highly educated than the general population. The restricted age range may also explain why the proportion of respondents indicating "no religion" was much higher for the Fertility Decision Making Project sample than the general population.
Response rates for the primary sample, while difficult to determine exactly, probably ranged somewhere between 30 and 40 per cent, which is on a par with many other telephone surveys of this kind. The fieldwork company noted that potential male respondents were especially reluctant to discuss the subject matter, reflected in the lower percentage of interviews achieved for men, particularly in NSW/ACT (36.3%), Victoria (36.5%) and Western Australia (39.7%). A further contributing factor may have been the length of the interview. Upon contacting a potential respondent the interviewer explained that the interview would take approximately 30 minutes to complete (the average was 34.3 minutes), which may have been sufficient to deter respondents. With respect to the partner sample, the response rate of 30 per cent is within the range expected for mailout surveys (Neuman 1997).
6. These estimates were provided by various fieldwork companies, including the Wallis Consulting Group, which conducted the FDMP fieldwork.
3. Current parenting circumstances and aspirations
This chapter first outlines "parenting status" (that is, whether respondents have children or not) and the number of children men and women in their early and late twenties and thirties have had.7 It then focuses on the extent to which "parenting status" varies according to their circumstances regarding relationships, education and employment.
A number of reasons were behind the decision to focus on these particular socio-demographic variables. As noted in Chapter 1, delays in forming partnerships and increases in relationship breakdown are clearly important factors contributing to the declining total fertility rate. Secondly, while the development of "human capital" in terms of educational level and attachment to paid work can delay partnering and family formation, research noted in Chapter 1 suggests that men with limited resources in the spheres of educational qualifications and paid work were more likely than other men to be unpartnered.
This situation would obviously restrict their chances of having a child or more children. On the other hand, compared with other women, those with high educational qualifications typically have greater opportunities to pursue a well-paid career. As McDonald has emphasised (e.g. McDonald 1998, 2002), such women tend to have the most to lose by reducing or severing their attachment to the paid labour force.
While educational status is a better indicator of career opportunities than current employment status for young adults, the relationship between aspirations and hours of paid work is examined. For women in particular, such employment circumstances are often shaped by the ages of their children, particularly the age of their youngest child (de Vaus 2004), although many women working less than full-time if at all may have limited "human capital" that might enable them to pursue careers. This was demonstrated in Chapter 3, particularly for those in their thirties.
Before parenting status and family size is examined, it is important to point out that 6 per cent of men and 10 per cent of women indicated that they could not have, or were unlikely to be able to have, a child in the future. Some had had a sterilization procedure (5% of all men and 6% of all women); others who had not been sterilized felt that they were unable to have children even with fertility treatments such as in-vitro fertilization (IVF) (less than 1% of all men and women, taken separately), and still others felt that they were unlikely to have children but may achieve this with fertility treatment (less than 1 per cent of all men and 3 per cent of all women). Most of these respondents who indicated that conception were not possible or unlikely already had children (71% of men and 78% of women).
Of respondents with partners, 15 per cent indicated that either they or their partner had been sterilized, 1 per cent felt that, owing to their own or their partner's fecundity problems, conception was unlikely even with fertility treatment, and 4 per cent felt that conception may be achievable with fertility treatments. However, 86 per cent of these already had children.
3.1 Parenting status and age
Given the higher proportion of single men than women in the sample, and the fact that men tend to be older than their partners, it is not surprising that men were considerably less likely to have had a child at the time of the interview (34% vs 59%). Figure 3.1 shows that this gender difference was apparent across the four five-year age groups (those in their early and late twenties and thirties), while Table 3.1 presents details about family size.
Figure 3.1: Proportion of men and women ever had children by age
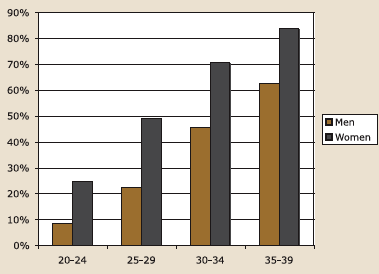
| 20-24 Per cent | 25-29 Per cent | 30-34 Per cent | 35-39 Per cent | All a Per cent | |
|---|---|---|---|---|---|
| Men | |||||
| None | 91.7 | 77.8 | 54.8 | 37.3 | 66.1 |
| One | 5.6 | 13.8 | 19.5 | 15.6 | 13.7 |
| Two | 2.3 | 6.4 | 17.1 | 27.4 | 12.9 |
| Three | 0.0 | 1.6 | 6.3 | 14.4 | 5.3 |
| Four or more | 0.3 | 0.3 | 2.4 | 5.3 | 2.0 |
| Total | 99.9 | 99.9 | 100.1 | 100.0 | 100.0 |
| Number of respondents | 301 | 311 | 334 | 263 | 1216 |
| Women | |||||
| None | 75.3 | 51.2 | 29.6 | 16.4 | 41.0 |
| One | 15.7 | 20.9 | 25.1 | 17.7 | 20.3 |
| Two | 7.2 | 18.9 | 26.9 | 40.2 | 24.2 |
| Three | 1.6 | 6.4 | 13.3 | 17.0 | 10.1 |
| Four or more | 0.3 | 2.6 | 5.2 | 8.7 | 4.4 |
| Total | 100.1 | 100.0 | 100.1 | 100.0 | 100.0 |
| Number of respondents | 376 | 502 | 558 | 470 | 1922 |
a "All" includes those respondents with missing age.
In total, around two thirds of all men and just over 40 per cent of all women had no children - a situation that applied to three quarters or more men under 30 years old and women under 25 years old. Only in the age group 35-39 years were men more likely to have, than not have, children. For women, this likelihood cuts in earlier (at 30-34 years). By their late thirties, men and women had, on average, 1.3 and 1.9 children.
Despite the effectiveness of contraceptive methods and their widespread availability, along with increased availability of abortion since the 1970s, it is worth noting that close to 30 per cent of births were seen as resulting from unexpected pregnancies (men's report: 28%; women's report: 30%).
3.2 Parenting status and relationship status
In this report, the variable "relationship status" has the following categories: married, cohabiting, or single, but in this section, the "single" category is further unpacked. Although cohabitation may be treated as "social marriage", "unregistered marriage" or "de facto marriage", for succinctness, only those who were in a registered marriage (and living with their spouse) are described as "married", while the term "unmarried" is used to encompass all those who were either cohabiting or single. The single groups included those who reported that they were in a committed relationship, in a casual relationship, or in no relationship. The latter are classified as "single and seeing no-one".
| 20-24 Per cent | 25-29 Per cent | 30-34 Per cent | 35-39 Per cent | All a Per cent | |
|---|---|---|---|---|---|
| Men - Relationship status | |||||
| Married and living with spouse | 5.3 | 25.0 | 40.2 | 53.8 | 30.5 |
| Cohabiting | 15.6 | 18.6 | 17.9 | 9.8 | 15.8 |
| In a committed relationship but not living together | 20.6 | 12.5 | 7.7 | 4.9 | 11.5 |
| See someone casually | 13.0 | 6.1 | 3.6 | 4.9 | 6.8 |
| Single and seeing no-one | 45.5 | 37.8 | 30.7 | 26.7 | 35.4 |
| Total | 100.0 | 100.0 | 100.1 | 100.1 | 100.0 |
| Men - Whether ever married | |||||
| Yes | 5.3 | 26.9 | 50.6 | 64.7 | 36.3 |
| No | 94.7 | 73.1 | 49.4 | 35.3 | 63.7 |
| Number of respondents | 301 | 312 | 336 | 266 | 1222 |
| Women - Relationship status | |||||
| Married and living with spouse | 12.0 | 40.0 | 58.9 | 64.3 | 45.8 |
| Cohabiting | 23.7 | 21.3 | 13.2 | 9.5 | 16.4 |
| In a committed relationship but not living together | 19.7 | 9.5 | 6.2 | 4.0 | 9.3 |
| See someone casually | 7.7 | 3.2 | 2.0 | 2.5 | 3.6 |
| Single and seeing no-one | 37.0 | 26.0 | 19.8 | 19.7 | 25.0 |
| Total | 100.1 | 100.0 | 100.1 | 100.0 | 100.1 |
| Women - Whether ever married | |||||
| Yes | 13.3 | 43.3 | 70.6 | 81.2 | 54.9 |
| No | 86.7 | 56.7 | 29.4 | 18.8 | 45.1 |
| Number of respondents | 376 | 503 | 562 | 473 | 1930 |
a "All" includes those respondents with missing age.
As noted in Chapter 2, most men and women were either in a registered marriage and living with their spouse (30% and 46% respectively) or in no live-in relationship (here defined as "single": 53% versus 38%). More men than women were single, more women than men were in a registered marriage, and equal proportions were "cohabiting" (that is, in a "de facto" or "social" marriage: 16% and 16% respectively).
Of course, there may be considerable uncertainty about whether or not a couple is "cohabiting", or whether each "partner" is even committed to the other. One partner may hold different ideas about such issues than the other. However, research by Qu (2003) suggests that most people who are cohabiting expect to marry their partner, and amongst couples, there is a high level of agreement about their likelihood of marriage (with nearly half the cohabiting couples agreeing that they would marry).
Table 3.2 uses two of the three main relationship status categories but further unpacks the "single" category. Not surprisingly, this table shows that relationship status was strongly related to age. For instance, the proportion of men who were married increased from 5 per cent of those in their early twenties to 54 per cent of those in their late thirties; for women, the proportions who were married increased from 12 per cent to 64 per cent respectively. It is therefore important to take into account the age of respondents (as well as the number of children they have) when assessing links between fertility aspirations and relationship status (Table 3.2).
Figure 3.2 shows that, while those who were married were most likely to be parents, most women in their thirties in each relationship status group were parents - here defined as having a biological or adopted child. Given that men tend to be older than their partners, it is not surprising that they were generally less likely than their female counterparts to be parents. Around one quarter of single men in their thirties were parents.
These trends highlight the strong link between relationship status and childbearing. Of course, some couples may marry after (and because) they have decided to have a child. Other couples may only begin to seriously entertain the idea of having children after they have married. Whatever the direction of any causal relationships, marriage and children certainly go together.
Figure 3.2: Proportion of men and women who ever had children by current relationship status and age
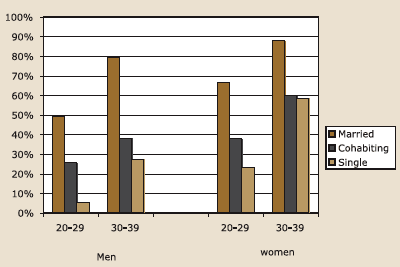
3.3 Parenting status and educational level
In a cross-sectional study that involves many respondents who are in the process of preparing for their future work life, it is more difficult to assess career-related opportunity costs of having children. The measure of education used throughout this report covers highest educational qualifications achieved or being pursued. Achieved qualifications were used for those not currently enrolled in a course of study or training. Hakim (2003b) argues that home-centred, work-centred, and adaptive women may all pursue educational qualifications but for different reasons. Nevertheless, there is ample evidence that family size tends to be greater amongst women with limited education than amongst those with higher education, although the gap is narrowing because the rate of fall in fertility has been faster for those with limited education (de Vaus 2004; McDonald 2000d).
Table 3.3 shows that patterns of educational status were similar for men and women. Around 44 per cent had or were studying for a degree or higher qualification, just over one quarter had or were seeking other post-school qualifications (e.g., a trade certificate or non-graduate diploma), and the remainder had achieved either Year 12 only or a lower educational level. (Very few were currently enrolled in secondary education.)
| 20-24 Per cent | 25-29 Per cent | 30-34 Per cent | 35-39 Per cent | All Per cent | |
|---|---|---|---|---|---|
| Men | |||||
| Year 11 or less | 10.0 | 11.4 | 12.3 | 14.7 | 12.0 |
| Year 12 only | 14.3 | 19.2 | 14.2 | 16.6 | 16.0 |
| Post-school qualification | 27.0 | 27.6 | 31.0 | 26.4 | 28.1 |
| Degree or higher | 48.7 | 41.9 | 42.5 | 42.3 | 43.8 |
| Total | 100.0 | 100.0 | 100.0 | 100.0 | 100.0 |
| N | 300 | 308 | 332 | 265 | 1205 |
| Women | |||||
| Year 11 or less | 14.9 | 11.8 | 13.6 | ***21.0 | 15.2 |
| Year 12 only | 12.5 | 16.6 | 16.1 | 16.9 | 15.7 |
| Post-school qualification | 24.5 | 26.2 | 26.7 | 24.6 | 25.6 |
| Degree or higher | 48.1 | 45.4 | 43.6 | 37.5 | 43.5 |
| Total | 100.0 | 100.0 | 100.0 | 100.0 | 100.0 |
| N | 376 | 500 | 559 | 472 | 1907 |
*** p<.001 (Chi-square)
Not surprisingly, parenting status varied significantly with educational status for both men and women in their twenties and thirties (taken separately) (Figure 3.3). Those with no post-school qualifications were the most likely to be parents, while those with or pursuing a degree or higher qualification were the least likely to be in this position. These differences were particularly marked for women in their twenties: 65 per cent of those with no post-school qualifications were parents, compared with only 19 per cent of those with or pursuing a degree or higher qualification. This is not surprising given that pursuit of education typically requires postponement of childbearing. Interestingly, across both age groups, men with no post-school qualifications were more likely to be parents, while those in their thirties with no post-school qualifications were less likely to be partnered (46% vs 35%-39%). A relatively higher proportion of these men with lower qualifications may have experienced difficulties in maintaining relationships - a point noted by Birrell et al. (2004) regarding men with limited financial resources or low socio-economic status. It is noteworthy that the current sample of single men with no post-school qualifications were more likely than other single men to be parents (26% vs 7%-12%).
However, of all groups represented in Figure 3.3, those most likely to be parents were women in their thirties with no post-school qualifications - in fact, almost all such women were parents (91%). It is noteworthy that parents were almost equally represented amongst women in their thirties who had or were pursuing degrees and women in their twenties with no post-school qualifications (64% and 65%), as well as men in their thirties with no post-school qualifications (62%).
Figure 3.3. Proportion of men and women who ever had children by educational qualification (achieved or pursued) and age
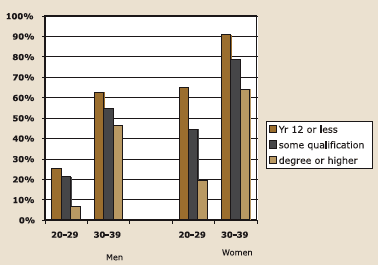
3.4 Parenting status and employment status
The final set of analyses in this section on current circumstances focused on employment status, where those in paid work were sub-divided according to whether they usually worked 35 or more hours per week (here called "full-time", regardless of whether these total hours were generated from one or more jobs), up to 34 hours (here called "part-time"), or not at all. While current educational pursuits or achievements would be a better indicator of career opportunities than current employment status for young adults, lack of full-time paid work amongst men in their thirties is likely to be associated with relatively poor financial circumstances (although a few may have given up full-time paid work voluntarily in order to devote more time to caring for their children).
For women in their late twenties and early thirties, current employment circumstances are often shaped by the ages of their children, particularly the age of their youngest child (de Vaus 2004). At the same time, engagement in full time paid work may to some extent reflect a current emphasis on developing or improving their finances and perhaps "human capital" instead of, or perhaps in preparation for, having children. It is not surprising that, for both women in their twenties and in their thirties, those with part-time work or no paid work were less likely to have degrees than those with full-time work (women in their 20s: 26%-28% vs 47%; women in their 30s: 32%-35% vs 50%). However, a number of women in their twenties who were working part-time or not at all were studying. In total, the proportions of women in their twenties who were either pursuing or had achieved degrees were as follows: 39 per cent who were not in paid work, 50 per cent who had part-time paid work, and 53 per cent who had full-time paid work.
Table 3.4 shows that full time work applied to just under half (48%) of men in their early twenties, around two-thirds in their late twenties and early thirties (67% and 64% respectively), and around three quarters (74%) of those in their late thirties. On the other hand, the proportions in part-time paid work decreased with increasing age from 22 per cent to only 5 per cent. Between 21 per cent and 30 per cent in each age group had no paid work.
| 20-24 Per cent | 25-29 Per cent | 30-34 Per cent | 35-39 Per cent | |
|---|---|---|---|---|
| Men | ||||
| Full-time | 47.5 | 66.7 | 63.9 | ***73.7 |
| Part-time | 22.1 | 10.3 | 8.1 | 4.9 |
| Not employed | 30.4 | 23.1 | 28.1 | 21.4 |
| Total | 100.0 | 100.1 | 100.1 | 100.0 |
| N | 299 | 312 | 335 | 266 |
| Women | ||||
| Full-time | 34.1 | 41.4 | 30.5 | ***22.6 |
| Part-time | 27.2 | 16.3 | 23.2 | 32.3 |
| Not employed | 38.7 | 42.2 | 46.3 | 45.0 |
| Total | 100.0 | 99.9 | 100.0 | 99.9 |
| N | 375 | 502 | 560 | 473 |
*** p<.001 (Chi-square)
Given that parenting status, which is age-related, has such a strong impact on women's employment status it should not be surprising that trends for women differed markedly from those of men. Those most likely to be in full-time work were women in their late twenties (41%) - the age when pursuit of education has typically ceased, while childbearing may continue to be postponed. Between 39 per cent and 46 per cent of women in each age group were not in paid employment.
Figure 3.4 shows considerable diversity in the representation of parents in these groups. Not surprisingly, the strongest relationships between parenting and employment statuses occurred for women.8 Not surprisingly, the vast majority of women in their thirties who were not in full-time paid work were mothers (79% - 91%) - a situation that applied to less than half the women in full-time paid work (44%).
Figure 3.4: Proportion of men and women who ever had children by employment status and age
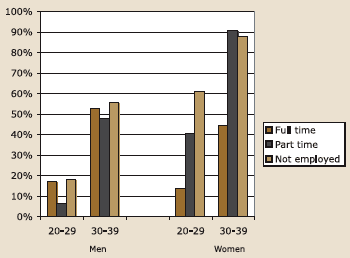
While virtually the same proportion of women in their thirties with part-time or no paid work were mothers (88% and 91% respectively), of the women in their twenties, a higher proportion of those women without any paid work than with part-time paid work were mothers (61% vs 40%). For each age group, women who were in full-time paid work were less likely than their counterparts with part-time or no paid work to be mothers (women in their twenties: 13% vs 40% - 61%; women in their thirties: 44% vs 88% - 91%). Only 13 per cent of women in their twenties who were in full-time paid work were parents.
For men in their thirties, similar proportions in the three employment status groups were fathers (48% - 55%). And while only a small proportion of men in their twenties were fathers, men with part-time work were the least likely to have a child (6% vs 17% - 18%).
3.5 Summary and conclusions
This chapter has shown that half of the respondents were parents. A higher proportion of women than men were parents and the majority of men in their late thirties and women in their early and late thirties had achieved this status. Relationship status varied with age and parenting status in understandable ways. Married men and women in their twenties and thirties were the most likely of the three relationship status groups to be parents. For these two age groupings, men and women with no post-school qualifications were the most likely to be parents, while their counterparts with or pursuing a degree or higher qualification were the least likely to be in this position.
For men in their twenties, those with full-time or no paid work were more likely than those with part-time paid work to be fathers, but for men in their thirties, there was little difference in the proportions who had fathered a child in each of these three groups. Marked differences applied to women in their twenties and thirties: those in full-time paid work were considerably less likely than other women to be parents. In fact, almost all women in their thirties who were not in fulltime paid work were parents.
7. Throughout this report, we use the term "family size" to refer to the number of children respondents have had or adopted, thereby avoiding the more technical term "achieved fertility". However, it is important to recognise that family size, as defined here does not include stepchildren or foster children, but does include any of the respondents' children living elsewhere. For succinctness in describing trends, we use the term "parents" to refer exclusively to those who have given birth to, fathered, or adopted a child.
8. p<.001 for women in their twenties and thirties; p<.05 for men in the twenties; NS for men in their thirties.
4. Aspirations about having children
The search for reasons for the decline in fertility rates has generated a number of international investigations into whether or not women want children, and if so, their preferred family size (e.g., see Alber and Fahey 2004; Goldstein et al. 2003; van de Kaa 1998; McDonald 2002b). So far, the various studies suggest that most women want children and that they typically want more children than they end up having. Under these circumstances, policies have at least some chance of being effective.
Nevertheless, as noted in Chapter 1, there is also evidence of a downward movement in aspirations that lags behind falling fertility rates (see Goldstein et al. 2003; McDonald 2002). This is not surprising, for aspirations are likely to be influenced by the number of children other people are having, although they may also be tempered by the size of one's family of origin and perceived opportunities and constraints.
In Australia nowadays, the most common number of children women have had by the time they are in their forties is two, followed by three or more (de Vaus 2004). Consistent with these trends, a 1996-97 Australian survey tapping family size suggested that families of two children were the most popular, followed by families of three children, then four. The most unpopular were no children, or five or six children, followed by having only one child (Evans and Kelley 1999). However, these results represent the views of adults of a wide range of ages including those well past their childbearing years who were asked to reflect on the issue with hindsight.9 The question may be viewed differently by those who are still in their "childbearing years".
McDonald (2000b) argues that there is a small group of women who wish to remain childless and for whom government policies relating to families, such as access to child care, taxation and so on will hold little relevance. In his view, policy should be directed towards helping those who want children achieve their ambition.
However, for some people, even seemingly entrenched views about having children may change as circumstances change - for example as a partnership forms or dissolves. Although there are always exceptions, people tend to adjust to their circumstances (Cummins and Nistico 2002). Ways of achieving this include changing aspirations or downplaying their importance (see Festinger 1957; Lazarus and Folkman 1984).
Thus, it might be expected that aspirations about family size that have not been met would be modified as a woman or female partner approaches the end of her potential childbearing years - or as those without partners reach a stage in life when opportunities for having a child are considerably diminished. Some childless individuals who wanted at least two children may set their sights on having an only child and focus on the personal and child-related advantages of raising only one child. Others may decide that the advantages of being childless outweigh those of having a family.
The Fertility Decision Making Project examined the aspirations of men and women about having a first or additional child, the number of children they would ideally like to have, and the age at which they would have ideally liked to have children. While no causal connections can be established with cross-sectional data, such data can be used to identify the extent to which aspirations vary according to socio-demographic factors. As in other chapters, this chapter focuses on respondents' age, the number of children they have had, their relationship status, educational level, and employment status.
Respondents were asked the following questions:
How much would you like to have a (or another) child in the future?
Just to clarify then, ideally, how many would you like to have in total (including the ones you already have)?
Response options to the former question were: "Definitely do want a/another child"; "Sort of do want a/another child"; "Not sure"; "Sort of don't want a/another child"; and "Definitely don't want a/another child". Where the respondent or partner was definitely or possibly pregnant (as indicated by responses to a preceding question), the question tapping desire to have a child was prefixed with "Apart from the one you're expecting...". Reasons underlying their responses were sought and recorded verbatim.
In addition, respondents aged 22 years or more were asked to indicate the number of children they wanted when they were 20 years old:
Looking back to when you were around 20, can you recall how many children you wanted?
Those whose current ideal family size differed from the family size they previously wanted were asked to explain why their views had changed. Their responses were recorded verbatim.
Finally, parents and childless respondents were also asked different questions to tap their personal ideals regarding the age of starting a family. The following alternative questions asked of parents and childless respondents respectively were:
Looking back, do you now wish you had started your family earlier than you did, later than you did, or did you start at about the right time?
Looking back, do you now wish you had started a family already?
Those who indicated that they wished they had started their family earlier or later than they had, were asked:
What do you think would have been the ideal age for YOU to start your family?
4.1. Ideal family size of men and women according to age and gender
This section focuses on the number of children respondents indicated that they would ideally like to have. Figures 4.1a and 4.1b present the proportions of men and women in total and across the four age groups who nominated as their ideal either no children, one child, or two, three, or four or more children, along with the mean ideal family size. The charts include parents as well as those without children.10
Consistent with the research findings of Evans and Kelley (2001), Figures 4.1a and 4.1b show that two-child families were the most popular, followed by three-child families. A preference for two children was reported by 53 per cent of all men and by 46 per cent of all women, while another 21 per cent of men and 26 per cent of women said they would like to have three children. In other words, around three quarters said they would like to have two or three children.
A family of four or more children was more popular than having one child or no children. Indeed, each of these latter two alternatives (no children or one child - taken separately) was considered to be ideal by less than 10 per cent of men and women in all age groups.
Figure 4.1a: Ideal number of children by age: men
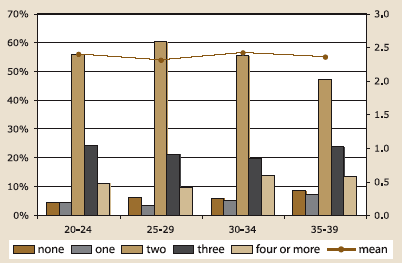
Figure 4.1b: Ideal number of children by age: women
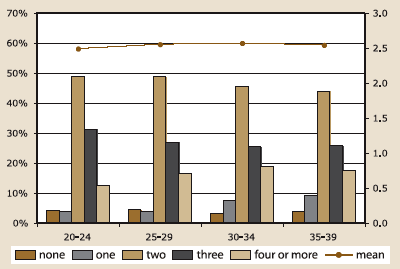
Although two-child families were the most popular of all family sizes for both men and women, this preference applied to less than half the women in all age groups and the men in their late thirties. In fact, across all age groups, women tended to be less inclined than men to opt for two children, and more inclined than men to prefer three or more children. This gender difference in preferences appears to be a true gender effect rather than a gender-related life course stage effect.11 For each age group, a preference for at least three children was reported by 43 per cent to 44 per cent of women and by 31 per cent to 37 per cent of men.
While Australia's total fertility rate has been 1.73 to 1.75 between 2000 and 2002 (ABS 2003), the mean fertility ideal in our sample was above the replacement level of 2.1 for all men and all women (2.4 and 2.5 respectively), and for all age groups (2.3 to 2.4 for men and 2.5 to 2.6 for women). There was also no significant difference in the mean ideals reported by men and women in each age group (gender differences ranged from 0.1 to 0.2).
Figure 4.2a: Ideal number of children by age: childless men
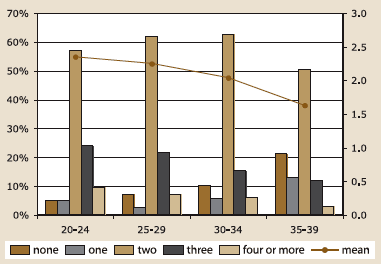
Figure 4.2b: Ideal number of children by age: childless women
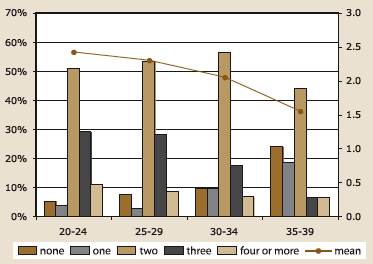
Figures 4.2a and 4.2b refer to childless men and women in each of the four age groups. It shows that the proportion of respondents who wished to remain childless increases with age. Nevertheless, the ideal to remain childless was held by no more than one quarter of those in the oldest age group. Across all age groups, the most common preference of childless respondents was for two children. This applied to at least half the men in each age group, and at least half the women under 35. The averages derived for ideal family size for childless men and women (taken separately) ranged from 2.4 for the youngest group to 1.6 for the oldest group.
Some childless individuals whose chances of having a child are become increasingly remote given their advancing age may consider the prospect of having an only child or remaining childless increasingly attractive. While cross-sectional data do not enable us to examine the extent to which such a process occurs, the data in Figures 4.2a and 4.2b are at least consistent with this hypothesis: an only child was preferred by considerably higher proportions of childless respondents in their late thirties than in younger age groups.
4.2. Aspirations regarding having a first or additional child according to achieved fertility, age and gender
As noted above, ideal family size represents one of the two ways in which fertility aspirations were examined. The other focused on whether respondents wanted a child in the future. In this section, the aspirations of childless respondents regarding starting a family are outlined. This is followed by an examination of the aspirations of respondents who were already parents regarding having another child.
Childless respondents
Although two thirds of the men and more than 40 per cent of the women were childless, most of those without children indicated that they "definitely" wanted to have a child (60% of men and 65% of women respectively), while another 17 per cent of men and 13 per cent of women reported a vague desire to have a child (that is, they said they "sort of" wanted a child). In other words, just over three quarters of childless men and women were favourably disposed to becoming parents.
Figure 4.3: Desire for children by age and gender: childless respondents
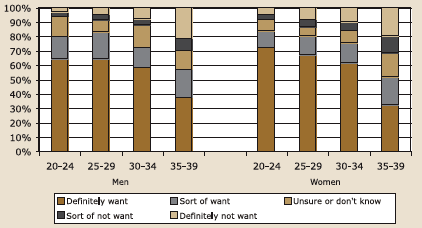
Not surprisingly, patterns of aspirations varied with age (Figure 4.3). Unlike their younger counterparts, only a minority of childless men and women in their late thirties indicated that they "definitely" wanted a child (38% of men and 33% of women), although in total more than half leaned towards the idea (57% of men and 52% of women said they "definitely" or "sort of" wanted a child). By contrast, close to 60 per cent or more of the childless men and women under 35 "definitely" wanted a child, and 73 per cent or more of the men and women in this age group were at least favourably disposed to the idea. Of all age groups of childless respondents, women in their early twenties were the most likely to indicate that they "definitely" wanted a child, while women in their late thirties were the least likely to do so (72% and 33% respectively).
The differences between the oldest respondents and younger groups are understandable, given that the former would consist of the greatest concentration of those who had never wanted children. Previous research suggests that some people who want children when they are young adults are likely to change their minds for a variety of reasons as they approach their forties. Reasons include being single or having a partner who already has children, feeling too old to cope with raising children, or the presence of fecundity problems for themselves or their partner (see Weston & Qu 2001).
It is also interesting to note that the oldest group were the least likely of all these childless men and women to hold definite ideas about having children (whether positive or negative). This age-related difference in clarity of views was greater for women than men.
In summary, around two-thirds of men and over 40 per cent of women did not have any children. Although applying to only a minority of respondents in their late thirties, childlessness was the most common situation of those examined for men of this age (Table 3.1), while women of this age were most likely to have two children. However, most childless men and women under 35 years old reported that they "definitely" wanted to have a child in the future, while more than half aged 35 to 39 indicated that they at least leaned towards the idea of having a child (i.e., they "definitely" or "sort of" wanted a child). While more than half the childless men and women in all age groups expressed definite ideas about whether or not to have a child, those in their late thirties were the least likely to do so - a trend that was stronger for women than men.
Figure 4.4: Desire for a(nother) child by current family size and gender
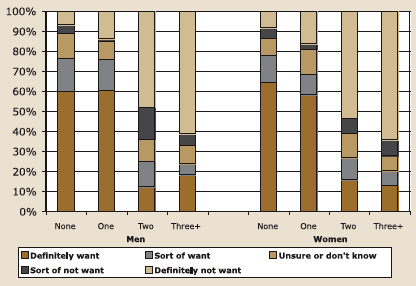
Parents' aspirations for more children
Figure 4.4 sets out the proportions of parents with different family sizes, who held different views about having another child. For comparison, the equivalent data for childless respondents are also shown. Because pregnant women (n = 98) along with men whose partner's were pregnant to them (n = 53) were asked about whether they wanted a child other than the one they were expecting, the family size of these respondents takes into account the child they were expecting. For example, a woman who was pregnant with her first child is classified as having one child.
Like the childless respondents, most parents with one child "definitely" wanted another. However, only a minority of those with two children, or three or more children, felt this way. Further, while roughly 60 per cent of parents with one child "definitely" wanted another child (61% of fathers and 58% of mothers), much the same proportion of parents with three or more children were "definitely" against the idea of having another child (61% of fathers and 64% of mothers).
Nevertheless, it is interesting to note that, of all parents, those least likely to hold definite views about having another child (either for or against) were men with two children, while those most likely to hold definite views were men with three or more children (60% vs 80%). This trend was not as strong for women (69% with two children and 77% with three children expressed definite views).
Not surprisingly, aspirations about having another child were related to parents' age, with parents in their late thirties being less supportive of the idea of having another child than their younger counterparts (refer to Figures 4.5a and 4.5b). For example, while most parents under 35 years old with one child "definitely" wanted another, such aspirations applied to only a minority of such parents who were in their late thirties (42% of fathers and 37% of mothers). In fact, most of these older mothers with one child were equally divided in terms of "definitely" wanting and "definitely" not wanting another child (37% and 39% respectively). Likewise, the most common responses of fathers in their late thirties with one child were at the extremes: 42 per cent expressed a "definite" desire for another child and 22 per cent indicated that they were "definitely" against this idea.
While aspirations of some parents in their late thirties who had only one child may have been dampened by age-related circumstances, it is also likely that, compared with younger parents with one child, this group contained a higher concentration of those who never wanted more than one child (given that a number of those of the same age who wanted more than one child would have already achieved this ambition). The same applies to parents with larger families. By their late thirties, there would be a relatively high concentration of those who had already achieved their long held ambitions about family size.
McDonald (1998) points out that the fall in the total fertility rate can be explained more by the decline in the proportions of large families than the increase in childless or one-child families. It is thus useful to consider the proportions of parents with two children who were at least favourably disposed to having another child (that is, they "definitely" or "sort of" wanted a third child). Although some of the numbers on which these percentages are based are small, such positive views were expressed by nearly half the mothers in their early twenties (48%) and 35 to 38 per cent of the mothers in their late twenties and fathers who were under 30 years old. Furthermore, 28 to 32 per cent of mothers and fathers in their early thirties and 18 to 24 per cent of those in their late thirties with two children leaned towards having a third child.
Even amongst parents with at least three children, a substantial minority were favourably disposed to having another child. Those most and least likely to feel this way were mothers under 30 years old and mothers in their late thirties (29% vs 14% respectively).
Figure 4.5a: Desire for a(nother) child by number of existing children and age: men
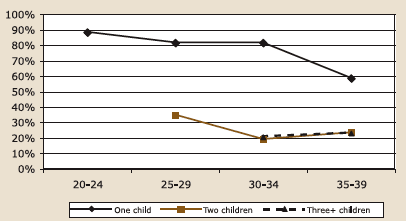
Figure 4.5b: Desire for a(nother) child by number of existing children and age: women
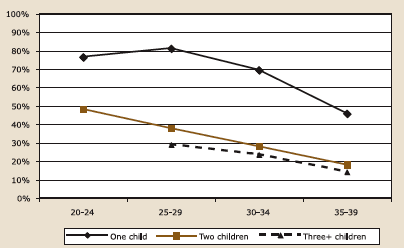
Thus, while most parents of two or more children were definitely against the idea of having another child, a substantial minority held favourable views. While these trends for those with two children are not surprising, given that three-child families are the second most common of family sizes for women in their early forties in Australia today, these parents and others with larger families who were inclined towards the idea of having another child may well be responsive to policies that make it easier for them to have and raise a larger family.
Interestingly, most parents who were against the idea of having another tended to be definite in their views. With the exception of fathers over 30 years old who had two children, no more than 10 per cent of parents indicated that they were "sort of" against the idea of having another child.
A small group of men and women indicated a strong desire to remain childless. But depending on the reasons for this motivation, even strong views may be amenable to policy intervention. Childless respondents were thus asked to explain their reasons for not wanting children. The nature of issues that they raised is set out in the next section.
4.3. Reasons for not wanting children
Various reasons were given for preferring to remain childless. As in two previous surveys conducted at the Australian Institute of Family Studies (Weston & Qu 2001), these included practical considerations (including age, partnering, health and fecundity); a dislike of children; work, financial and lifestyle choices; concerns about being a good parent; the belief that the world is not good for children; and concerns about overpopulation. Because respondents often provided a combination of reasons, some of the statements listed below under one category may also apply to one or more other categories. For example:
Money, work and time issues
Financially I don't know if I could support a child. It's a hard thing to choose between work and family (Male, 35, single).
One reason is we are still career-involved. There are plenty of kids around us in the family so we don't think we have to populate the world (Male, 29, single).
They are too much responsibility. I have my own goals. I want to have a career and financially it's too hard (to have children) (Female, 26, cohabiting).
It's time-consuming, I'm not patient, and I don't want to give up work (Female, 31, married).
I'm too career-focused and I wouldn't be able to juggle both a career and children (Female, 22, single).
I think a lot of people have kids and then find that they aren't as easy to look after as they figured ... I guess I'm holding back on having kids for selfish reasons. I'm thinking about my happiness and my career - I'm into music and wouldn't mind making a career out of it. With kids I wouldn't see that happening. I don't want to compromise my goals. I've got nothing against kids - it's just that if I had kids I'd want to give them everything and right now I'm being a bit selfish. If you have kids you have to be prepared to be completely selfless and compromising, and sacrifice a lot of your time and life - and there there's also the money reasons (Male, 28, cohabiting).
Dislike of children and/or desire for freedom
They are too dependent on you. I like my freedom (Male, 25, single).
We are not the type of couple that wants children - we have a fear of teenagers - we don't want to go through that stage. My partner used to work with teenagers and I am deterred from her experiences (Male, 24, cohabiting).
Lots of reasons - selfish reasons. The fact that once you have kids you have to think of them, first. Life changes. Everything changes. I've always wanted to do my own thing (Female, 35, cohabiting).
I'm too selfish to care for a child. I like my lifestyle too much - this includes money and free time (Female, 32, cohabiting).
Because we like our independence. We want to travel more and we move around a lot. We like our freedom. Kids cost a lot of money. I don't think I have the patience and I'm selfish (Female, 33, married).
Pain of pregnancy/childbearing
Because of the pain of pregnancy. I don't like children - they scream and they're noisy and irrational. I find it hard to relate to children (Female, 25, single).
Because every time I run into my boyfriend's sister she always spends 20 minutes telling me about the pain involved in childbearing. Also, I find kids irritating and disgusting (Female, 21, single).
Partner does not want children/partner has children
Before now, I would have said fear - not knowing whether I could cope and also seeing the number of sacrifices my parents made for me and my sisters - and I was too damn selfish to make them, though I would if I had to. I like having money to spend on myself. Now I have grown accustomed to my lifestyle and my partner doesn't want children. Having a kid would rock the boat a bit much as far as my relationship is concerned. But if an accident happened, I would have the kid (Female, 38, cohabiting).
My partner has three beautiful children and they are great (Female, 29, cohabiting).
Concerns about parenting skills/emotional problems
I'm just too selfish. I think I'd be a bad parent, and my lifestyle has changed. Your attitudes change. I see kids and they drive me nuts (Male, 31, single).
I don't think I'm very good with them (Male, 26, single).
I don't think I'm emotionally stable enough to impart good principles and values to a child (Male, 21, single).
I don't want to change my lifestyle. I think it's a very big responsibility and I'm not sure if I'm willing to accept it. I'm not sure if we would be good parents (Female, 37, married).
If I really wanted a child I'd probably adopt one from a third world country, I think of my own personal issues and I wouldn't want to share or inflict them onto a child. Another part of my reason is because I'm quite career orientated and busy. There are already enough children in the world (Female, 38, single).
Age
I think I'm a bit too old now. If I was going to have children I would have preferred to do it at a younger age where, when my children were teenagers, I was still sort of young. I think I'd be a better Dad if I was younger and it's also expensive raising children (Male, 38, single).
I'm too old to start a family (Female, 38, cohabiting).
Overpopulation concerns
The world is over-populated already (Male, 39, single).
There are enough children in the world and if I decide to have children I would choose to foster or work in early childhood (Female, 31, single).
The world is not a good place for children
I don't like children and the world is not a place to bring up a child - we both decided we don't want one (Male, 35, married).
Because I'm selfish. There are too many things I'd like to do for myself. And then the state of the world is pretty stuffed up - why would you want to bring a child into it? (Male, 35, single).
Because once you have children, they tie you down. It's a commitment. It's a financial commitment. It's very different to how I live at the minute. I don't really want to change my lifestyle at the moment to include children. I like to travel and it's quite hard to do that with children, and I don't know if I want to bring a child into this world the way it's going. Everything is so fast and cruel. Sometimes I think about my own existence, because if I had a choice I think I wouldn't have wanted to be brought into this world (Female, 31, single).
Some respondents indicated that they might change their mind. For example:
I just don't want children - they are too much responsibility, but I might change my mind in five years or so (Male, 29, cohabiting).
They limit our freedom. I don't want any now - I don't have a strong desire to have a child. I'm thinking that possibly my hormones might kick in the future and change my views but at this stage in my life it just isn't something I want. I'm happy now as I am in my relationship (Female, 30, married).
I don't see myself having children. I would probably prefer to pursue my career. I have thought about this and depending on the circumstances, I might think about it again - but in general, I wouldn't have kids (Female, 21, single).
This range of reasons highlights the fact that policies directed towards helping couples have children need to be multi-pronged. Strategies aimed at easing the difficulties of juggling of work and family are clearly important, as are those directed towards providing parents with financial and practical support to improve their confidence and competence as parents, and to ease the burdens associated with fulfilling their parenting responsibilities regardless of whether or not they are working.
The word "selfish" appears quite a lot in these responses. Rather than taking this at face value (by concluding that people are in fact selfish), this could be interpreted as a learned discursive response. That is, due to the expectations that society places on people to have children, those who want to remain childless feel guilty and learn to talk about this aspiration in ways that others have suggested: it represents a sign of 'selfishness' rather than a valid social choice.
4.4 Fertility aspirations according to other key variables
So far, family size aspirations and views about having a first or additional child have been examined according to age, gender and current family size (that is, the number of children respondents have already had). These three variables are fundamental to any analysis of fertility aspirations, given that women's fertility is so strongly age-related, childbearing affects the lifestyles of women more than men, and aspirations about having a child in the future are obviously dependent on how many children one already has. The following discussion focuses on the extent to which fertility aspirations vary according to the three other factors that are considered throughout this report (partnership status, educational level, and employment status), taking into account age, gender and family size.
4.4.1 Fertility aspirations and relationship status
This section first examines the aspirations of childless men and women about having a child according to their relationship status. (Women who were pregnant with their first child, and men whose partners were pregnant were omitted from this analysis). Attention is then directed to personal ideals of all men and women in the different relationship status groups.
Aspirations of childless respondents regarding having a child
Figures 4.6a and 4.6b present the patterns of aspirations of older and younger childless men and women in the three relationship status groups. Aspirations varied significantly with relationship status for each of the four "gender by age" groups. Furthermore, the patterns are similar for men and women: for both age groups, married men and women were the most likely to "definitely" want a child and those who were single were the least likely to feel this way. Nevertheless, across each of the three relationship status groups, the majority in their twenties were "definitely" in favour of having a child, and higher proportions in their twenties than thirties felt this way. Indeed, less than half of the single men and women in their thirties were "definitely" in favour of having a child, although even for these respondents, such views were more commonly advanced than any of the alternatives (applying to 45% of the men and 39% of the women).
While some of the older childless respondents who were not living with a partner may have always preferred a lifestyle free from a partner and children, it seems likely that some people have adjusted to their single, child-free lifestyle by accepting that they are unlikely to have a partner and family, despite earlier hopes of doing so. It is noteworthy that 11 to 16 per cent of these older single men and women were "definitely" against having a child, while 61 to 65 per cent were at least favourably disposed to having a child.
The fact that married childless respondents were the most likely of all these childless groups to "definitely" want a child is not surprising. Many couples may decide to marry when they plan to have children. However, it is interesting to note that a higher proportion of married men than women in their thirties indicated that they were "definitely" against having a child (16% vs 4%).
Figure 4.6a: Desire for children by relationship: childless men
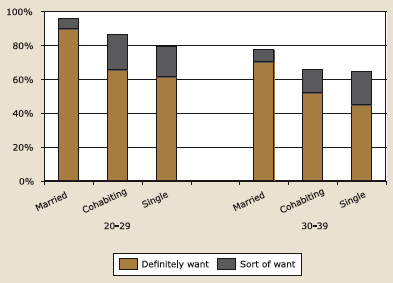
Figure 4.6b: Desire for children by relationship: childless women

Personal ideals about family size
Compared with answers to the question tapping aspirations for a child in the future, those regarding personal ideals about family size are likely to be far less dependent on the number of children respondents already have. Thus, this section focuses on all respondents, regardless of the number of children they already had. Personal ideals about family size varied significantly with relationship status for all except men in their twenties - although the results for this group approached significance (refer to Figures 4.7a and 4.7b).
Figure 4.7a: Ideal number of children by relationship status and age: men
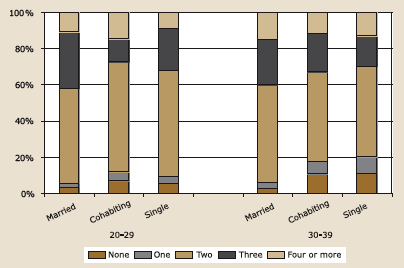
Figure 4.7b: Ideal number of children by relationship status and age: women
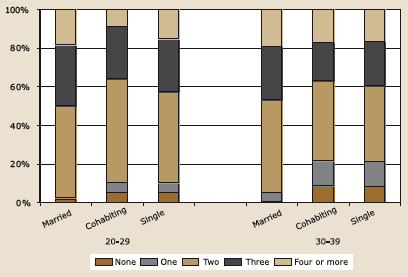
Once again, two-child families were the most popular for all groups examined, particularly for unmarried men in their twenties (nominated by 61% of those who were cohabiting and 59% of those who were single). Unmarried women in their late thirties were the least likely to state that they would ideally like two children (close to 40%). These women, along with their male counterparts, were the most likely of all groups to nominate one child as their ideal (around 13% of cohabiting and single women in their thirties and 8% of their male counterparts).
With the exception of cohabiting men in their twenties, three-child families were the second most popular choice, particularly amongst married respondents in their twenties (around 31% of men and women). Families of four or more children tended to be preferred over having one child or no children (taken separately), although only marginally so for unmarried respondents in their thirties (especially men). Interestingly, there was virtually no difference in the proportions of married and unmarried women in their thirties who saw four or more children as their ideal (close to 18%).
Having no children was not popular for any group. This situation was nominated by no more than 3 per cent of all groups of married respondents, by 5 to 7 per cent of unmarried respondents in their twenties, and by 8 to 11 per cent of unmarried respondents in their thirties.
4.4.2 Fertility aspirations and education
This section examines the extent to which the aspirations of childless men and women regarding having a child and the family size ideals of all men and women vary according to educational status. As in Chapter 3, educational status encompasses qualifications that have either been achieved or are being pursued.
Aspirations of childless respondents regarding having a child in the future
Figures 4.8a and 4.8b show that, with one exception (men in their twenties), aspirations of the childless respondents did not vary according to educational status. There was certainly no evidence that those with/pursuing a degree were less likely to want a child. Indeed, the results although typically non-significant tended to be in the opposite direction - especially for the men in their twenties and women in their thirties. For instance, of the men in their twenties, the proportions definitely wanting a child ranged from 62 per cent of those with Year 12 or less to 67 per cent of those with/pursuing a degree or higher qualification, while less than 1 per cent of the latter group and 6 per cent of the former group were "definitely" against having a child.
Together, these results on fertility aspirations and the results on the number of children respondents already had (noted in Chapter 3) reflect the fact that while men and women with/pursuing a degree are by no means less likely to want children than those with limited education, pursuit of tertiary education delays starting a family. But do those with or pursuing tertiary education want the same number of children as those with lower qualifications? This issue is examined below.
Figure 4.8a: Respondents wanting children, by education and age: childless men
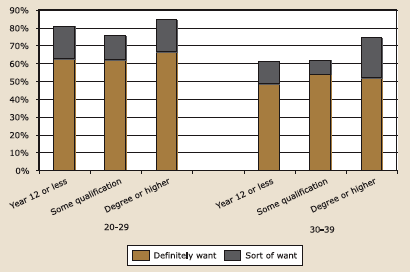
Figure 4.8b: Respondents wanting children, by education and age: childless women
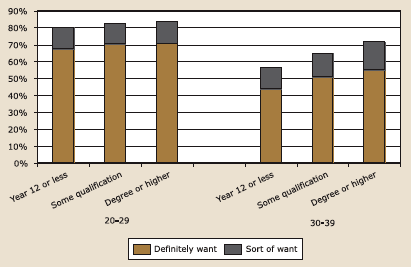
Personal ideals about family size by educational status
This section examines the personal family size ideals of all respondents according to their educational status and age. Once again, the most popular choices for all groups were two children, followed by three children, with at least four children being more popular than one child or no children (taken separately) (Figures 4.9a and 4.9b).
Patterns of responses varied significantly with educational status for one group only: women in their thirties - although patterns for men in their thirties almost reached the conventional 5 per cent level of significance. Of those in their thirties, women with/pursuing degrees and male nongraduates with/pursuing non-graduate post-school qualifications were the most likely of the three educational status groups to prefer two children and the least likely to prefer four or more children.
Figure 4.9a: Ideal family size by education and age: men
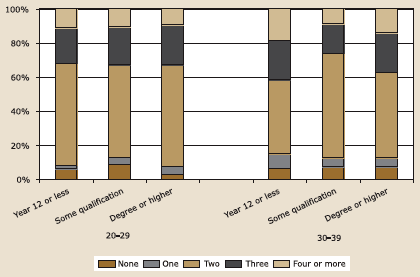
Figure 4.9b: Ideal family size by education and age: women
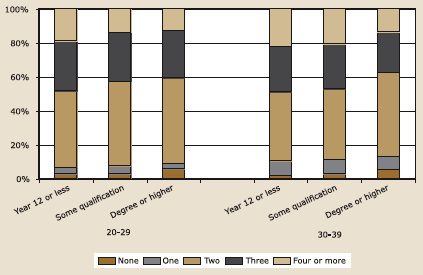
While explanations for these trends for men are not readily apparent, at least three are available for the trends for women. First, delays in childbearing of female graduates restrict the number of children they can have. Such women may thus adjust their ideals to better fit reality. In addition, women with degrees have a potentially higher earning capacity and thus face greater opportunity costs should they give up work or reduce their work hours to care for a single child, let alone a large family (McDonald 2000). Third, at the outset, women who pursue tertiary education may tend to be less interested than other women in having a family of more than two children.
However, despite statistical significance (or near significance), differences between educational status groups regarding ideal family size for those in their thirties were by no means very strong. Of women in this age group, 50 per cent with/pursuing a degree or higher preferred two children, compared with around 41 per cent of those with lower qualifications or no post-school qualifications, while 14 per cent of the former women and around 21 per cent of the latter groups of women preferred four or more children. Of the men in their thirties, a preference for two children was reported by 62 per cent of non-graduates who had or were pursuing qualifications other than a degree, 50 per cent of those with/pursuing a degree and only 44 per cent of those with Year 12 or less. On the other hand, a preference for four or more children was reported by only 9 per cent of the first group of men (non-graduates with/pursing qualifications other than a degree), 14 per cent of those with/pursuing a degree, and 19 per cent with Year 12 or less.
4.4.3 Fertility aspirations and employment status
This final section on family size ideals and aspirations of childless men and women regarding having a child compares the views of those in full-time, part-time, or no paid work.
Aspirations of childless respondents regarding having a child in the future
For those without children, aspirations for having a child did not vary significantly with employment status (Figures 4.10a and 4.10b). Across the three employment status groups, a desire for children was expressed by 79 per cent to 87 per cent of men and women in their twenties. Of those in their thirties, only 21 men and 27 women were working part-time. While only around half these men and women expressed a desire for children, percentages based on such a small number of respondents are likely to be highly unreliable. Of the other men and women in their thirties (those working full-time or not at all), between 64 per cent and 73 per cent wanted a child.
Figure 4.10a: Childless men who want children, by employment status and age
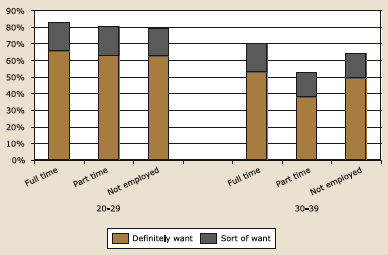
Figure 4.10b: Childless women who want children, by employment status and age
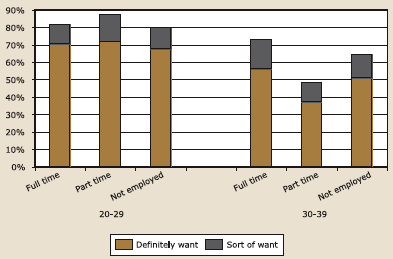
Personal ideals about family size
As noted in Chapter 3, the number of hours women worked was heavily dependent on whether or not they had children. The age of the youngest child is also a key determinant of women's attachment to the labour force (McDonald 2001d). Nevertheless, it might also be expected that a disproportionate number of women working part-time or not at all may be more interested in having a larger family than those who are more strongly attached to the work force. This was borne out.
Figures 4.11a and 4.11b show that, while those in each employment status group most commonly preferred to have two children (36% to 60% of men; 43% to 54% of women), women without paid work were the least likely of women to prefer two children (40%-43%), while those in full-time work were the most likely to indicate this preference (53%-54%). On the other hand, those most likely to express a preference for four or more children were older men who were not in paid work and older and younger women who were not in paid work (21%-24% vs 7%-15%).
Figure 4.11a: Ideal family size by employment status and age: men
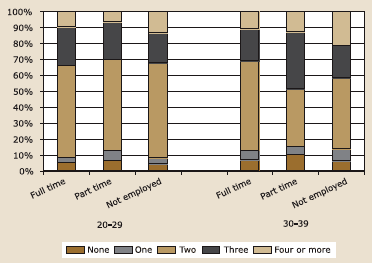
Figure 4.11b: Ideal family size by employment status and age: women
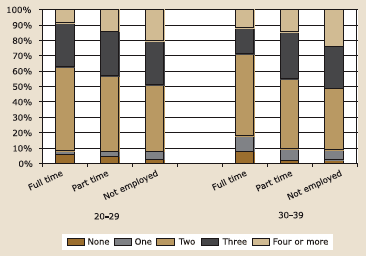
The analysis so far has provided a snapshot of aspirations and men and women held at the time of the survey. For some people, these aspirations may have undergone considerable revision over the years. The following section thus examines the apparent extent of change in aspirations regarding family size, as recalled by the respondents.
4.5 Current versus past views on having children
As noted in Chapter 1, previous research in low fertility countries suggest that women's family size aspirations, expectations or intentions tend to be revised downwards with advancing age. Reasons mentioned in the literature include women's increasing appreciation of the difficulties surrounding partnership formation and stability, the juggling of work and family life, and the opportunity costs they are likely to experience by having children. There has been scant attention to ways in which men's views might change, although there has been considerable discussion of the notion that many young men may be "commitment phobic" in relation to family formation (e.g., Szego 2002; Whitehead and Popenoe 2004).
In the present study, respondents who were 22 years or older at the time of the interview were asked about the number of children they would ideally like to have, and the number they had wanted when they were 20. If they indicated that their views now differed, they were also asked to explain reasons underlying this discrepancy. Their answers were recorded verbatim.
In this analysis, it was assumed that perceptions of views at these two points in time reflect overall level of change with no significant oscillation in the intervening period. This may not be correct. Two sets of analysis were undertaken: firstly, views about having a child at all were compared for these two periods, and secondly, for those who indicated that they wanted to be parents at age 20, the proportions who said they currently wanted fewer children, the same number of children, or more children than when they were 20 were examined. Trends for men and women across the four five-year age groups were derived.
In total, around two thirds of the men (68%) and three quarters of the women (77%) indicated that they wanted children during both periods, while 23 per cent of men and 17 per cent of women said that, while they did not want children when they were 20 years old, they had changed their mind (in fact, many of them already had children). Only 3 per cent of men and 2 per cent of women indicated that they wanted children at 20, but not currently, while 6 per cent of men and 5 per cent of women indicated that they neither wanted them at age 20 nor currently.
Thus, assuming that any oscillation of views during the interim period is uncommon and recollections of respondents are reasonably accurate, then it appears that most men and women consistently wanted children. Figures 4.12a and 4.12b suggest that this picture applied to all age groups. That is, the proportions of men and women who indicated that they wanted children at age 20 and currently ranged from 65 per cent to 77 per cent for men, and from 74 per cent to 77 per cent for women. Less than 10 per cent in any group indicated that they neither wanted children at age 20 nor currently.
Figure 4.12a: Men – Views about having children - now vs age 20 by current age
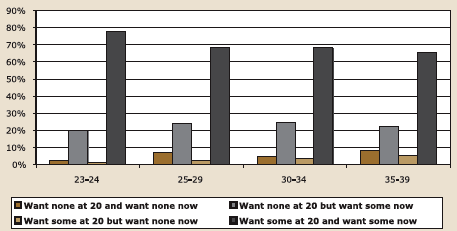
Figure 4.12b: Women – Views about having children - now vs age 20 by current age
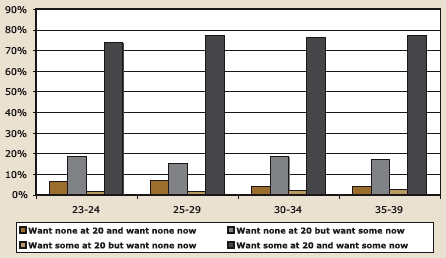
Across all age groups, those who reported a change in views were more likely to indicate a conversion from not wanting a child to wanting a child (a "positive conversion") rather than the reverse (a "negative conversion"). Positive conversions were indicated by 19 to 24 per cent of all men and by 15 to 19 per cent of all women. Negative conversions, on the other hand, were indicated by no more than 5 per cent of respondents in any group.
It thus seems reasonable to suggest that most respondents believed that they wanted to have children at least from early adulthood and continued to feel that way (with most men in their late thirties and most women in their early and late thirties having achieved this).
Figure 4.13a: Men who wanted to have a child at age 20: change in number of children that they wanted
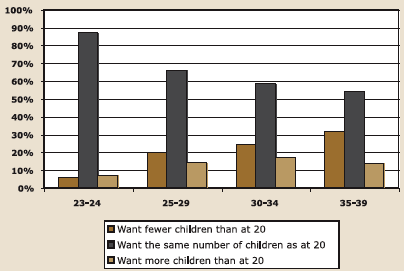
Figure 4.13b: Women who wanted to have a child at age 20: change in number of children that they wanted
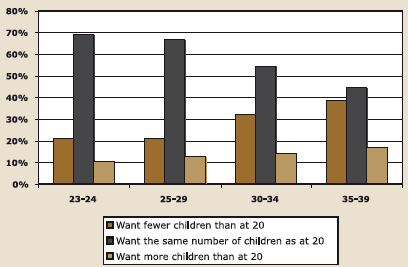
However, as suggested in other research, amongst those who wanted children at age 20, the tendency to revise family size downwards appeared to increase with increasing age (Figures 4.13a and 4.13b). For instance, a revision downwards was indicated by 20 per cent of men in their late twenties and by 32 per cent of men in their late thirties. For women, the proportions were 21 per cent and 39 per cent. With the exception of men in their twenties, downward revision was more common than upward revision, although with the exception of women in their late thirties, more than half the respondents indicated no change in desired family size. Of course, cross-sectional data cannot show the actual extent of change that might occur with age.
In the eyes of the respondents themselves, how important are relationship and work/family issues (including opportunity costs for women and female partners), and commitment phobia for men, in shaping their revisions in family size? And why did some people convert from not wanting to wanting children? The next section provides some interesting insights on these issues.
4.5.1 Reasons for changes in views: respondents' explanations
Explanations for the fall in the total fertility rate are often sought through macro-level analysis of differences between countries in employment rates, couple formation trends, family- and work-related government policies and so on (e.g., Castles 2002; McDonald 2000a, 2000b). Another extremely important means of identifying likely answers to questions on declines in fertility rates is through examination of ways in which parenting status and family size vary for different socio-demographic groups - the approach that is largely used in this report. While both these approaches are very informative, much can be learned from the voices of those who speak from experience - our survey respondents themselves. This section provides examples of the reasons respondents gave for changing their views about the number of children since they were 20 years old.
Reasons for currently wanting fewer children than in the past
Not surprisingly, respondents often provided several reasons for changing their aspirations about family size. Thus, some of the comments included as reflecting one theme listed below also reflect other themes. As expected, financial and work-related issues were commonly mentioned, as were age and partnering issues, fecundity and other health-related problems. Problems experienced in raising existing children, and perceptions that the current state of the world is unsuitable for raising children were also mentioned.
The comments highlight the tendency for people to adjust their aspirations to better fit perceived reality. While some respondents may have been referring to changed expectations about the number of children they would have rather than changed aspirations (i.e. preferences) about family size, the question asked on current views about family size was: "Ideally, how many children would you like to have in total?"
Financial and work-related
Because I realised how unrealistic it is financially to have five kids now. At the time I had no idea. My parents were crazy. (Woman aged 33, married)
Because it's too expensive these days and I realise this; there has to be two people at work and that's why I think people leave kids until later. Unless the husband is on $90,000 plus salary you end up with too much of a debt. If it was like my grandparents who could pay off their mortgage in one year, we'd all have six kids! (Woman aged 26, married)
Because of being more realistic. The cost of living now is not like before. What is the point of having more children if you won't be able to look after them - because of financial pressure you will have to go back to work. (Woman aged 35, married)
I came from a family of four and it was nice but jobs aren't as secure anymore, and things cost more these days, and I want to be able to provide things for both us and our kids comfortably. (Woman aged 35, married)
Because I've come to realise that it's hard having two, let alone ten. The pregnancy puts a strain on your body. And financially it's difficult. Especially we want to take them through private education. We want to give them as much as you can. The more you have, you wonder if you can give them the same opportunities. (Woman aged 24, married)
Because of the financial strain of having children. I work full-time, so it would be just too hard to fit it in with work. I would love to have more children but it isn't possible. (Woman aged 35, single)
Probably because things have changed over the years - the cost of education and bringing up children - and because I don't want to go back to work and put them in day care. (Woman aged 33, married)
I didn't have the experience in the work force at that stage. I had no experience with real estate at that stage as well so I had no understanding of the pressures of having a mortgage. (Woman aged 32, married)
Because I'm now more realistic about my finances. (Man aged 29, single) I just realised how hard and costly it is to cope these days. (Man 36, married) I think we're being more practical. In considerations about cost of living and lifestyle. I think it's fairly difficult unless you start out on a family fairly early. (Man aged 39, married)
I came from a family of four and always wanted that, but now I have realised the cost of living, education, and housing. (Woman aged 33, single)
Because of the value of money and because I want my kids to have private schooling. (Woman aged 27, married)
Mainly financial pressures - needing to go to work and then raising the children. I have to work and to add another baby on to that would be too much, I think. (Woman aged 38, married)
Age and relationship status issues
We didn't have our first child until I was 29. I don't want to have children when I am over 35. (Woman aged 30, married)
Having kids is costly and I'm running out of time. I'm in my thirties now so to have a lot I would have to pop them out one straight after the other. (Woman aged 32, single)
If I were involved in a relationship, I think I would have liked to have a large family, but now I'm almost 40, time has kind of run out. (Woman aged 37, single)
I did not feel that my relationship at the time would end. As I am getting older, I feel that I have less time in which to have kids and would only be able to fit in two maximum. (Woman aged 32, single)
Partner's wishes
My husband at the time didn't want any other children after our first child so the decision was more his and not mine. We then left it and now she is grown up and past all those stages so it's very unlikely now. (Woman aged 30, single)
My husband didn't want any more than two. He was from a family of six and never got anything, so wanted to give his two everything. (Woman aged 34, married)
Experience of having children
Because I've had them. No one realises what it's like until you have them . . . like giving birth ... they're a lot of work. I think it's more that I don't want to run the risk of getting unhealthy. (Woman aged 34, married)
Just the experience of having a child. I wasn't prepared for the amount of work that it was. (Woman aged 30, married)
I've actually had them. They're a lot of work. (Woman aged 26, married)
Health and fecundity
I found out I was unable to have children due to a medical condition. (Woman aged 36, single)
The reality of life and all the problems that come along that you don't expect when you're younger. Having to cope financially with a family affects one's thinking. My wife's health has changed my views ... and her difficulties during pregnancy have impacted on my thinking. Because we can't have another child (I've been sterilised) and my views have changed in accordance with what's possible. (Man aged 38, married)
The state of the world
With what's going on in the world - [there are] too many people in the world. Also educational reasons: even if they're qualified/under qualified to get a job, the way kids are these days... (Woman aged 39, married)
The world is going to s*** at the moment and as a result I'm not as idealistic as before, and also finances [are a consideration]. (Man aged 36, cohabiting)
Reasons for currently wanting more children than in the past
Interestingly some of the same general domains of issues that were raised for reasons for downward revision of views were also mentioned as reasons for upward revisions (which typically involved conversion from not wanting to wanting children). Reasons included financial and work-related matters, age and relationship status issues, partner's wishes, and the experience of parenting. One commonly-mentioned reason centred on the respondents changing their priorities in life as they matured. Some also wanted the "right" gender mix of children, or decided they wanted to give their child a sibling. Others referred to the influence of their friends, or of their own or their partner's experiences growing up in a family of a certain size.
Financial and work-related reasons
My husband earns enough money that we can afford more than two. They're lovely to have around. More than two would be nice. (Woman aged 34, married)
I think because I have found the person I want to be with, and now we are more able to afford it as well. (Woman aged 32, cohabiting)
Because I settled down and have a steady job. (Man aged 28, single)
I had just left university and was looking to get a job. Now I have one, things are different. (Woman aged 24, single)
I have a good partner and good job. (Woman aged 29, cohabiting)
Age and relationship status issues
Being happy in a relationship. I wanted to start a family with my partner and became maternal. (Woman aged 32, cohabiting)
I suppose I'm in a stable relationship now and have matured a bit. I have a partner, a secure job, and I have security I suppose. (Woman aged 25, cohabiting)
I am in a better relationship - our house is so full of love and is a better environment for raising children. It is a much more loving relationship than my previous relationship and I wanted more children with [current partner]. (Woman aged 26, married)
Because I am in a happy stable relationship - in a married relationship. I had never assumed that I would marry. (Woman aged 33, married)
In a marriage you get a better understanding of what you want. (Man aged 38, single)
Because I've found the woman I love and I think that, in a marriage, children are important. (Man aged 30, married)
I've matured a little. I've got someone I'd like to start a family with. (Man aged 30, cohabiting)
I found someone I wanted to spend the rest of my life with. I feel having a family with her is important. (Man aged 26, cohabiting)
Partner's wishes
Since meeting [partner] my views have changed. He loves having a family of his own that he can care for and support, whereas I'm from a small family. All I had was my sister, so since meeting [partner], it's rubbed off on me a bit in wanting a family. (Woman aged 27, married)
I think I've just gotten older and I have met someone I love who wants to have children. (Woman aged 23, cohabiting)
Experience of having children
Because my first child was a home birth and I was there, helping to deliver her. She was a girl and you know what they say about a father and his daughter, it was just indescribable the feeling I had seeing her. The love you have for your kids and being part of the delivery is unbelievable, it's as strong as hate and all other extreme emotions. The bond the father and his daughter have is incredible. (Man aged 33, married)
Now I have been exposed to them and realise how much respect and love I have for them. Since I had one, it changed my world. (Man aged 24, cohabiting) I had not had kids when I was in my early twenties. Now that I've had two kids I know how much I enjoy having kids and would like to have more. (Woman aged 28, single)
Because my children have added so much quality to my life. They have enriched my life, and I wouldn't want to live without them. (Woman aged 34, single) I moved in with my wife not long after we met and she already had the boys, and probably about six months after that I started to have the urge to have a child of my own. (Man aged 29, married)
Because they're not as scary as I thought they were, I hated kids when I was younger. (Woman aged 24, cohabiting)
I didn't realise how easy it would be to be a mother. (Woman aged 30, married) Having one child, and knowing that it is a wonderful thing and how it makes you grow up and change, and is fulfilling, so would want to have more. (Woman aged 27, single)
The joy of having fathered a child has made me realise how special it is to have a child and I therefore want more. (Man aged 33, single)
I enjoyed being a Dad. (Man aged 38, married)
"Growing up"
I matured and realised there's more to it. I never associated children with such love and joy. I was more materialistic when I was younger. (Man aged 37, married)
When you get older you want children because your priorities change a bit and you understand the bigger picture. When I was 20 - you kind of think you're indestructible and you can do anything, you don't really want children. When you get older, your priorities change and you understand the bigger picture and for me, I want to have children to fill that picture. (Woman aged 33, single)
Maturing - your whole thought process changes, particularly after you turn 30. I ended up wanting a child. (Woman aged 37, married)
I've settled down a bit and meeting [partner] changed my mind. (Man aged 31, cohabiting)
I've settled down; I have different values. (Man aged 24, cohabiting)
I think I've grown up a bit; the social circles I'm now in - they all have children, so if they can do it, so can I. It's like living proof that I can do it. (Woman aged 32, single)
You get stable - at 20 you just want to go out and get drunk. (Woman aged 35, married)
Because I've become a father in the meantime, and when I was twenty I wanted to have fun. (Man aged 28, married)
Maybe growing up wiser and I can cope with the responsibility now. (Woman aged 28, single)
Possibly because I've gotten older and more interested in those sorts of things now. When you're 20, having children is not the kind of responsibility you want at that age. (Man aged 32, single)
When I hit 27, I suddenly realised that something was missing. (Woman aged 32, married)
Kids are good for you - they add meaning to your life. I'm older and wiser and more patient than I was back then. (Man aged 39, married)
I guess when you get older you start to think about families and settling down. (Man aged 25, single)
I grew up. I didn't want the responsibility at 20 - I wanted to see the world. (Man aged 32, married)
It's just a different phase in your life. Your views change when you meet a stable partner and decide to have a stable life and that involves having children. (Man aged 34, married)
I think I found the right person and I got to an age when I was ready - but at 20 it was the last thing on my mind. (Woman aged 38, married)
Your attitude changes and you grow up and think of life in the future. When I was young I didn't want responsibilities or commitments and I didn't think of my future like I do now. Your views just change with age and maturity. (Woman aged 35, married)
Having the right gender mix; giving child a sibling
I've always wanted a girl and had a boy first - so I tried again and got the girl I originally wanted. (Woman aged 38, married)
Because we had two girls, we thought we'd try for a boy. (Woman aged 30, married)
I have one child and I see how happy she is with other kids. (Woman aged 23, single)
[After] having the first, then you realise that your child needs a brother or sister. I wouldn't want my child growing up as an only child. (Woman aged 36, cohabiting)
Size of family of origin; being with others with children
Family becomes more important the older you get. My girlfriend comes from a big family and my sister has three kids and all my mates have got them. My parents are quite old now and it's nice to have someone looking out for you. (Man aged 38, cohabiting)
I wasn't thinking about children then. My friends are doing it; it's in my life; it is all around me - my desire, my urge to have kids is now there. (Woman aged 27, married)
I know people with families now. Being exposed to them has changed my views. (Man aged 30, single)
I guess just being older, and being surrounded by friends and associates who have those things, then outside influences. (Woman aged 23, single)
4.6 Actual and ideal age for starting a family
As noted in Chapter 1, the increasing age for starting a family appears to be a major factor contributing to the decline in average family size (Jain & McDonald 1997). As later ages become normative, then views about the most appropriate time to start a family are likely to shift and thereby drive further macro-level changes. However, such changes may be tempered by messages in the media and elsewhere that for women in their thirties in particular, the "biological clock" is ticking.
To what extent, then, do current views about the appropriate age of starting a family correspond with current societal trends in childbearing? Alternatively, is there much evidence that men and women are postponing having children beyond an age that they consider ideal? As noted earlier, respondents were asked to nominate the ideal time for them to start, or to have started, a family. The precise questions are listed in the introductory section of this chapter.
Two issues are examined in this section. The first analysis focuses on the extent to which views about the personally ideal age for starting a family is related to the respondents' actual age at the time of the survey, along with their parenting status (that is, whether or not they were parents). Attention is then directed to parents in different age groups. The age parents had their first child is compared with the age they nominated as ideal for them to have had their first child.
4.6.1 Ideal age for starting a family
Figure 4.14 (below) shows that, on average, the age considered personally ideal for starting a family tends to increase with respondents' age at the time of the survey (here called "interview age") for both the childless and for those with children. Secondly, parents in general nominated significantly lower ideal ages for starting a family than their counterparts without children (men: 27.3 years vs 28.6 years; women: 26.0 years vs 28.1 years). This tendency for parents to nominate a lower age than non-parents was also apparent for each "survey age" group taken separately: parents tended to nominate a lower average age to start a family than non-parents. For example, the average ideals derived for fathers and mothers aged in their early twenties were 23.7 years and 22.2 years, while the averages for non-parents of this age were 27.5 years and 26.8 years respectively. At the other extreme, the ideal ages for starting a family nominated by parents and non-parents who were in their late thirties when interviewed were, on average, as follows: men: 28.9 years and 29.8 years respectively; women: 27.2 years vs 29.0 years respectively. Of all these groups, the smallest difference between parents and non-parents in average ideals emerged for men in their late thirties, while the largest emerged for women in their early twenties.
Figure 4.14: Ideal age to start family, by parenting status and gender
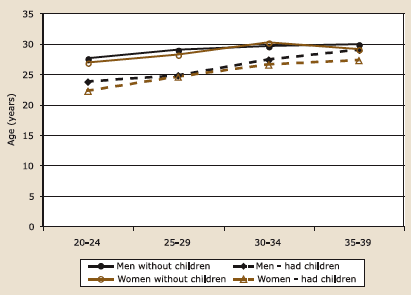
4.6.2 Parents: Ideal versus actual age for starting a family
Interestingly, the average age that women considered to be ideal for them to start, or have started, a family was 26.8 years - an average age that is only marginally below that for first-time mothers in 2000 (27.3 years) (de Vaus 2004). Figure 4.15 shows that fathers and mothers who were in their early twenties when interviewed had their first child when they were, on average, younger than they considered ideal (for fathers: 20.9 years vs 23.4 years; for mothers: 19.8 years vs 22.2 years). However, for parents in their late twenties or older, there was little difference between their ideal and actual ages for starting a family. For instance, the average personal ideal age for starting a family was 27.2 years for fathers who were in their thirties at the time of interview, while they had their first child when they were, on average, 27.4 years.
Figure 4.15: Ideal vs actual age at birth of first child, by age: parents
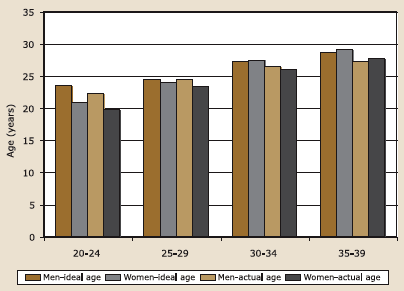
4.7 Summary and conclusions
This chapter has examined a number of different aspects of men's and women's aspirations about having children, specifically: respondents' views about having a first or additional child in the future; the family size they considered personally ideal; the extent to which their family size aspirations had changed since they were 20 years old; and their views about the ideal age for them to start, or to have started, a family. In addition, this chapter outlined key themes running through the reasons for not wanting children provided by relevant childless respondents, and the reasons for changes in family size aspirations offered by those who indicated that they would like fewer or more children than they wanted when they were around 20 years old.
Regardless of age and gender, two-child families were the most likely to be considered the ideal family size, followed by three-child families. One-child families and childless families were relatively unpopular. In fact, roughly half the respondents in the survey indicated that they would ideally like to have two children. These trends are consistent with the prior research noted earlier. Furthermore the average number of children that men and women would ideally like to have was 2.4 to 2.5 - averages that are above the replacement level (2.1 babies per women).
Respondents' views about having a child in the future were consistent with those noted above concerning ideal family size. Most men and women without children indicated that they "definitely" wanted a child in the future. Parents with one child were just as likely as those without children to feel this way. A substantial minority of parents with at least two children wanted another child.
Not surprisingly, desires for a first or additional child were related to men's and women's age, with those in their late thirties being the least likely to definitely want a child in the future. This trend not only applied to parents who already had two children, but also to childless respondents and to parents with one child. Given that two children were typically seen as the ideal family size, these trends for those with no children or only one child may to some extent reflect an adjustment to their diminishing opportunities. On the other hand, the trends may simply arise from the greater representation in the older than younger age group of those whose preferences were for no children or one child.
Although two-child families were mostly preferred by married, cohabiting and single people alike, views about having children varied according to relationship status. A larger family was preferred by those who were married. In addition, married childless men and women were the most likely to definitely want children, while their counterparts who were single were the least likely to feel this way. Such trends were stronger among respondents in their thirties than among those in their twenties. Nevertheless, the majority of men and women in their thirties who neither had a partner nor children wanted to have a child. In other words, the fact that they did not have children more commonly related to a lack of partner than to a preference for remaining childless.
For those in their twenties and thirties (taken separately), childless men and women with or pursuing tertiary or higher qualifications were as likely, or more likely, as those without any post-school qualifications to definitely want a child in the future. Furthermore, educational status did not appear to be strongly linked with ideal family size for either men or women. Yet Chapter 3 showed that men and women who had or were pursuing a degree or higher qualification were less likely to be parents than their counterparts who neither had nor were pursuing any post-school qualifications.
While aspirations for a child did not vary significantly according to the employment status of men and women without children, women in full-time paid work appeared to have stronger preferences for two children compared with women who either worked part-time or were not in paid work. Although applying to a minority, those who were not in paid work were more inclined than others of the same age to prefer four or more children.
Childless respondents who did not want children tended to give more than one reason for their views. Those mentioned commonly centred on money, work and time issues and associated difficulties in balancing work with family life; personal age; dislike of children; desire for freedom; pregnancy/childbirth worries; partner's views on his/her having children; concerns about parenting skills or personal emotional problems; overpopulation; and concerns that the world is not a good place for children. Some of these reasons would be amenable to policy intervention. And some respondents volunteered that they might change their mind.
Most respondents reported that they had not changed their views on the number of children they wanted since they were 20 years old. However, of those who had changed their views, a downward revision of aspirations was more apparent than an upward revision.
Reasons for respondents revising their family size aspirations downward and upward often related to the same domains, thus suggesting that there may be avenues for stemming downward revisions and perhaps encouraging upward revisions. For instance, while financial and work-related reasons were often seen as constraints that led to a downward revision, a few respondents who revised their family size upward mentioned that they had experienced improved financial or work circumstances. But as noted in Chapter 1, many of today's perceived "necessities" in life are linked with values. It was therefore not surprising that downward revisions sometimes involved considerations about private education for children.
For some people, difficulties they had experienced in parenting led them to revise their views downwards; for others, the sheer joy they encountered in becoming parents led them to want more children. This highlights the importance of effective strategies that help reduce the considerable stress experienced by some parents, not only to make parenting more enjoyable but also to remove a potential obstacle to having another child. Again, while lack of a partner and relationship breakdown led to revisions downwards, finding a partner and feeling secure in this relationship was often mentioned as a reason for upward revision.
Those who were already approaching their forties without yet achieving their ideal family size often saw their age and fecundity issues as reasons for downward revisions, while a common theme amongst others who wanted more children, was that they had "grown up". Interestingly, while in the 1950s and 1960s, men and women tended to leave home at age 20 to 22 in order to marry and raise a family (McDonald 1995), the comments of many of these respondents who had "grown up" highlight the prolonging of adolescence these days. In addition, some respondents who wanted fewer children than previously felt that the world was an unsuitable place for raising children, while some who wanted more children than previously were wishing to achieve a certain gender mix of children or to give their existing child a sibling.
The final analysis in this chapter focused on respondents' views about the ideal age for them to start, or to have started, a family. The older the respondents were at the time of the interview, the older was their ideal age for embarking on parenting. Compared with childless respondents, parents tended to nominate a younger age to take on these responsibilities. On the other hand, the average age that parents in their early twenties considered to be ideal was older than the average age at which they became parents.
It is worth noting that the ideal age nominated by women was, on average, marginally lower than that for first-time mothers in Australia in 2000. Thus, the respondents' views were consistent with changing family formation patterns in Australia. Societal changes influence personal aspirations and behaviour, which then feed back to influence social norms.
9. In this survey, respondents indicated how they would feel about having different numbers of children (from 0 to 6) if they could "start over", by rating each alternative family size (taken separately) from "Yes definitely" to "No, definitely not" (Evans and Kelley 1999).
10. Before these percentages on ideal family size were derived, those who indicated that they did not know their ideal family size or who refused to answer this question were omitted. These "non-respondents" represent 2 per cent to 3 per cent of men and about 2 per cent of women in the four age groups.
11. A gender-related life course stage effect would derive from the fact that men tend to be older than women when they start to have children.
5. Expectations of having children
While Chapter 4 focused on men's and women's personal ideals about family size and the desire to have a first or additional child, this chapter examines their expectations about having a child in the future, and where appropriate, the number and timing of children expected.
As noted in Chapter 1, expectations are likely to be strongly influenced by perceived constraints against, and opportunities for, realising aspirations. Constraints may include not only practical hurdles but also competing goals. However, aspirations themselves are unlikely to be divorced from perceptions of constraints and opportunities. Indeed, modifying aspirations to better fit likely achievements may be an important means of adjusting to circumstances and maintaining a positive sense of wellbeing.
McDonald (2000b) points out that policy needs to be directed towards helping those who would prefer to have a first or additional child but decide not to do so given their current circumstances. However, some people who have resolved not to have children may be unaware of just how strongly current barriers to having a child are shaping their decisions.12 While in a cross-sectional study it is not possible to identify such people, a key issue that can be examined is the extent to which current ideals and preferences match current expectations.
5.1 Expectations about having a first or additional child and about the total number of children
Chapter 4 showed that the vast of majority of men and women were either parents or reported that they definitely wanted to have a child (73% of men and 86% of women). Only 3 per cent to 5 per cent who had no children said that they definitely did not want children. Responses regarding the ideal family size for the respondents themselves mirrored this pattern of results: only around 5 per cent of men and women nominated no children as their personal ideal, while nearly half indicated a preference for two children and around one quarter reported that a family of three children would be ideal for them. In line with these trends, non-parents along with parents of one child were the most likely to want a child (or another child) in the future, while those with four or more children were the least likely to feel this way.
However, as noted above, aspirations are probably less affected by perceived constraints than are expectations. To what extent, then, do patterns of expectations of respondents regarding having a first or additional child resemble those that emerged for ideal family size and aspirations about having a first or additional child?
5.1.1 Expectations by number of children ever had13
Figure 5.1 shows that most men and women with no children or with one child held positive expectations about having a child in the future (that is, they stated that this was "likely" or "very likely"), while most of those with two or more children held negative expectations (that is, they described their chances of having another child as "unlikely" or "very unlikely"). Of all groups, those with three or more children were the most unanimous: more than three-quarters expressed negative expectations, with close to two-thirds reporting that a child in the future was "very unlikely". Furthermore, total uncertainty (expressed as a 50:50 chance of having a child) declined progressively as the number of children respondents had increased from no children to three or more children (for men: from 20% to 10%; for women: from 17% to 12%).
Positive expectations were expressed by 64 per cent of men and 69 per cent of women without children and by 64 per cent of men and 57 per cent of women with one child. Whereas a higher proportion of women without children than those with one child considered they were "very likely" to have a child in the future (54% vs 46%), the reverse applied to men: 55 per cent of men with one child and 43 per cent of those with no children described their chances of having a child in the future as "very likely". Thus, slightly more men than women with one child expressed considerable confidence that they would have another child (55% vs 46%), while a slightly lower proportion of men than women without children felt this way (43% v 54%). While only a minority of respondents with fewer than two children held negative expectations, such expectations were expressed by a higher proportion of those with one child than of those with no children (for men: 22% vs 16%; for women: 27% vs 14%).
Figure 5.1: Fertility expectations for respondents at various levels of parity

In general, these patterns of expectations were consistent with those that emerged regarding aspirations and ideals: two-child families were most commonly seen as the ideal family size (although applying to only 46% of women and 53% of men) and while most respondents with no children or only one child wanted a first or additional child, most of those with two children or three or more children, did not.
However, it is noteworthy that the proportions of respondents who reported that they were very likely or somewhat likely to have a child were lower than the proportions indicating that they "definitely" or "sort of" wanted a child (men: 54% vs 66%; women: 45% vs 55%).
5.1.2 Expectations by age
Not surprisingly, expectations about having a first or additional child were also related to respondents' age, although for each age group taken separately, those with no children or one child were more likely than those with two or more children to expect a child in the future. These results are depicted in Figures 5.2a (for men) and 5.2b (for women), where the sub-sample size was at least 19.14
Figure 5.2a: Likelihood of having a child or more children by age and parity: men
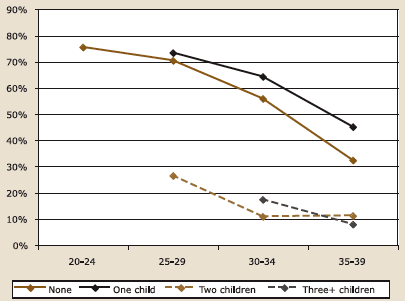
Figure 5.2b: Likelihood of having a child or more children by age and parity: women
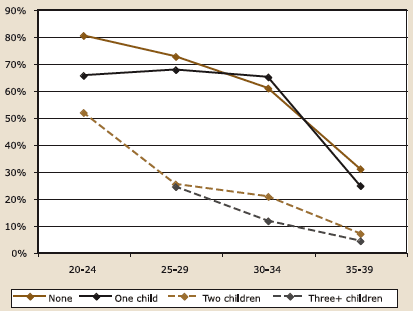
Of men with no children or only one child, the proportions expecting a first or additional child decreased progressively with increasing age (from 75% to 32% of the childless and from 73% to 45% of those with one child). Although very similar proportions of men in their late twenties with no children or one child expected a first or additional child, for other age groups, men with one child were more inclined than those with no children to expect a child in the future.
Like their male counterparts, the proportions of women without children who expected a child fell as age increased (from 80% of women in their early twenties to 31% of women in their late thirties). However, this fall in the proportions expecting a child was particularly marked for women between their early and late thirties (61% vs 31%) - a trend that is likely to be influenced by women's declining fecundity during their thirties (regardless of the fact that the concentration of women who never wanted children will be greater amongst those in their late rather than early thirties). A marked fall in expectations between these age groups was also apparent for women with one child. In fact, results for women aged between 20 and 34 years with one child varied little according to age: between 65 per cent and 68 per cent indicated that they expected another child. However, only 25 per cent of 35-39 year old women with one child expected another child.
Thus, for women with one child, those in their early thirties were more than 2.5 times as likely as those in their late thirties to expect another child. Of women with no children, those in their early thirties were around twice as likely as those in their late thirties to expect a child.
There were too few men in their early twenties with two children to adequately assess their expectations. But, despite the strong popularity of two child families noted earlier, just over half the women in their early twenties who already had two children indicated that they expected to have another child (52%), and one quarter in their late twenties felt this way (25%). For the older women with two children, expectations to have another child fell from 21 per cent of those in their early thirties to only 7 per cent of those in their late thirties. These trends are consistent with reality - given that fecundity is age-related, those who begin their families at a relatively early age are, of course, the most likely to have the more than two children (Meyer 1999).
Only a minority of men and women in each age group with three or more children expected another child - and again, expectations were heavily age-dependent - with men in each age group being more likely than their female counterparts to expect another child.
When the analysis was restricted to those who wanted a child, the pattern of falling expectations with increasing age persisted, suggesting that both men and women lower their expectations of having children as they age even when they want children.
Respondents who indicated that they were "likely" or "very likely" to have a child in the future were asked how many (more) children they expected to have. In the following analysis, the number of future children expected was added to the number of children they already had (including adopted children). For those who felt that they had a 50:50 chance or lower chance of having a first or additional child, the expected number of children represents the actual number they have already had. Where the female respondent or female partner was pregnant, this pregnancy was included in the estimation of total children expected, for respondents were asked to exclude any current pregnancy in estimating their expected number of future children.
Figure 5.3 summarises the total number of children that men and women expected to have, including the number of children that they had already had.15 Not surprisingly, a family of two children was the most commonly expected by both men (37% to 47%) and women (41% to 46%). Whereas three child families were the second most commonly expected family size across gender and age groups, higher proportions of men in the four age groups expected to have no children than to have three children. Indeed, the proportion of men expecting to remain childless did not vary at all with age (26%, taken separately), although the proportion of men who expected to have one child increased with increasing age (from 3% to 10%).
In all age groups, men were more likely than women to expect to remain childless (26% vs 12% to 16%). For women, the proportion expecting to have no children and the proportion expecting one child fluctuated among the four age groups, with the youngest being the most likely to expect no children and the oldest being the most likely to expect one child. Unlike the men, women were more likely to expect three children (20% to 24%) than no children (12% to 16%).
However, for both men and women, the proportions expecting no children were higher than the proportions who considered no children to be their ideal (5% to 8% of men and 3% to 4% of women nominated no children as their ideal). The difference in the proportions expecting to have no children and aspiring to have no children was thus greater for men than women. It is unclear whether this arises from men being more cautious about having children compared with women. The fact that women generally begin their families at an earlier age than men is likely to at least partly explain these results, for current family size will carry considerable weight in shaping expectations.
Figure 5.3: Total expected number of children by age and gender
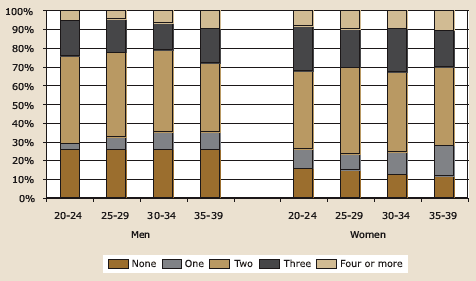
5.1.3. Expectations by relationship status
Figures 5.4a and 5.4b depict the proportions of childless men and women who reported that they were "very likely" or "somewhat likely"' to have a child. These respondents are subdivided according to relationship status (married, cohabiting, single) and age (in their twenties or thirties).
Like aspirations regarding having a child, expectations of having a child changed significantly with relationship status regardless of age and gender. For both age groups, married men without children were the most likely to expect a child (94% for the 20-29 year-olds and 70% for the 30- 39 year-olds) and single childless men were the least likely to hold such expectations (69% and 37% respectively for the two age groups). The childless men who were cohabiting were less likely than those who were married but more likely than the single men to report being likely to have a child (80% for 20-29 years olds and 56% for the 30-39 year-olds).
Similar patterns emerged among the childless women. That is, married women without children were most likely to expect that they would have a child (87% of women in their twenties and 64% of women in their thirties), followed by women who were cohabiting (85% of women in their twenties and 61% of women in their thirties), and the single women were the least likely to expect to have a child (71% of women in their twenties and 40% in their thirties). However, the difference between married women and cohabiting women was very small for both age groups.
Furthermore, for both men and women, the difference between the single and the married in the proportions expecting to have a child was greater among those in their thirties than it was among those in their twenties. For instance, the difference between single women and married women in their twenties was 24 per cent (64% vs 40%), compared with 16 per cent (87% vs 71%) for those in their thirties.
Figure 5.4a: Likelihood of having a child by relationship status and age: childless men
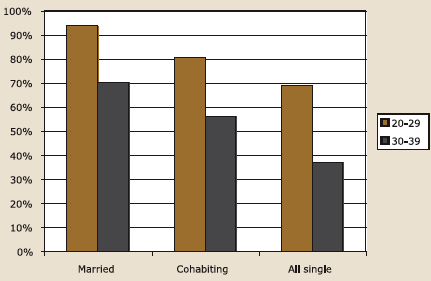
Figure 5.4b: Likelihood of having a child by relationship status and age: childless women
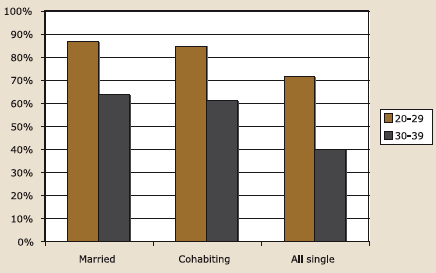
While most men and women either had children or expected to have children, not surprisingly, Figures 5.5a and 5.5b show that the number of children that men and women expected to have varied with relationship status - both for those in their twenties and thirties (taken separately).
Very few married men and women expected to have no children at all (4% to 6% of men; 4% to 5% of women) or one child (4% to 9% of men; 5% to 10% of women). About half of married men and married women expected to have two children in total (53% to 55% of men; 49% to 50% of women). In addition, 21 per cent to 30 per cent of married men and 25 per cent to 28 per cent of married women expected to have three children. And slightly higher proportions of married respondents expected four or more children than no children (men: 9% to 10% vs 4% to 6%; women: 12% to 13% vs 4% to 5%).
Of the three marital status groups, those who were single were the most likely to expect to have no children - a trend that was particularly marked for men (men: 32% to 47%; women: 22% to 27%). Thus, even when in their twenties, close to one third of single men did not expect to have children. For all groups except single men and women in their thirties, two children represented the most common expectations. For single women in their thirties, much the same proportions expected two children or no children (29% and 27% respectively), while for single men in their thirties, a lower proportion expected two children than no children (26% vs 47%).
Thus, although most men and women had either had at least one child or expected to have at least one child, being single appeared to dampen this expectation, especially for those in their thirties. Of course, some single men and single women might remain single because they had no desire for a child and thus saw no need to be in a relationship. Nevertheless, the proportion of single men and women who were not expecting to have any children was higher than the proportion who considered no children to be their ideal. Of single men in their thirties, only 11 per cent reported no children to be their ideal, while 47 per cent expected no children. Of single women in their thirties, the proportions ideally wanting no children and expecting no children were 8 per cent and 27 per cent respectively. It appears that the inability to find a suitable partner represents an important factor explaining unfulfilled aspirations for having children. These results are consistent with those of Qu, Kilmartin and Weston (2000). These authors also found that the instability of existing relationships coupled with delays in having children during the relationship often resulted in changing expectations about having children.
In short, relationship status appeared to be an important factor influencing the number of children that men and women expected to have.
Figure 5.5a: Expected number of children by relationship status and age: men
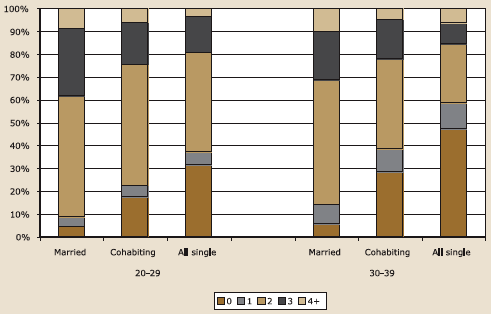
Figure 5.5b: Expected number of children by relationship status and age: women
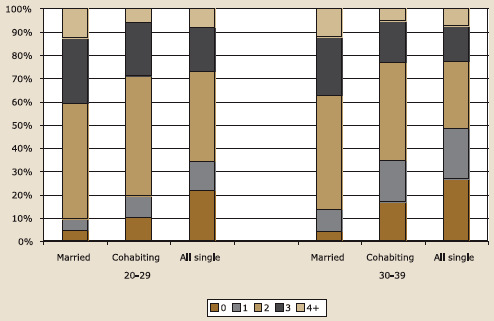
5.1.4. Expectations by education
As noted earlier, both men and women with or pursuing a degree or higher qualification were more likely than others to delay having children and thus were more likely to have no children. Nevertheless, of those who had no children, the majority of men and women in their twenties who had or were pursuing a degree or higher qualification wanted to have children. A lower proportion in their thirties felt this way - but the extent to which this reflects an increasing concentration of people who never wanted children or changing aspirations with age cannot be determined. Consistent with these aspirations, the likelihood of having a child declined with increasing age, but not with increasing education qualifications for both childless men and childless women (Figures 5.6a and 5.6b).
There is no evidence to suggest that these childless respondents who had or were pursuing higher qualifications were any more likely than others to be placing their career paths ahead of having children. However, these trends may reflect selectivity amongst the childless: as indicated in Chapter 3, those with low education were more likely than those with higher education to already have them.
Overall the total number of children respondents expected to have did not appear to vary with men's education level for either age group (Figure 5.7a). Regardless of men's educational status, two children were the most commonly expected, followed by no children.
However, the number of children that women in their twenties expected to have was significantly linked to their educational status (Figure 5.7b). Of those in their twenties, women with or pursuing any post-school qualifications were more likely than other women to expect to have no children at all (16% to 17% vs 9%), and less likely to expect to have three or more children (28% to 31% vs 37%).
For women in their thirties, the higher the educational qualifications achieved or being pursued, the more likely they were to expect to remain childless (from 5% to 17%) and the less likely they were to expect three or more children (applying to 25% of those with or pursuing a degree or higher qualification and 36% of those with no existing or pursuit of post-school qualifications).
Figure 5.6a: Likelihood of having children by education qualification and age: childless men
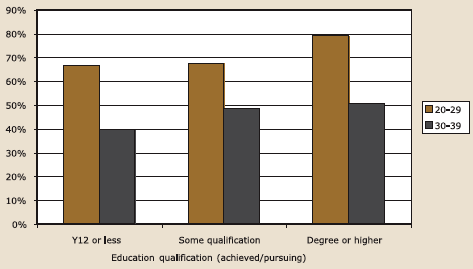
Figure 5.6b: Likelihood of having children by education qualification and age: childless women
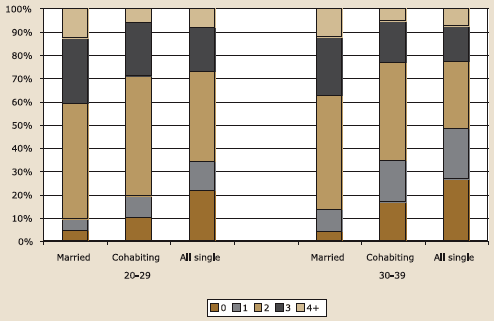
Across both age and educational groups, the proportions of men expecting no children were considerably higher than the proportions who considered no children to be their ideal - as outlined in chapter 4 (23% to 27% expected no children while less than 10% preferred no children). A lower proportion of women than men in each age and educational status group expected no children. Furthermore, while higher proportions of all these female groups expected than wanted no children, the difference was only marginal for those without post-school qualifications (women in their twenties: 9% vs 3%; women in their thirties: 5% vs 2%). (Of those with or pursuing degrees or higher, the differences were 16% vs 6% for those in their twenties and 17% vs 6% for those in their thirties. Of those with or pursuing other post-school qualifications, the differences were 17% vs 3% and 13% vs 3% respectively.)
Figure 5.7a: Expected number of children by education and age: men
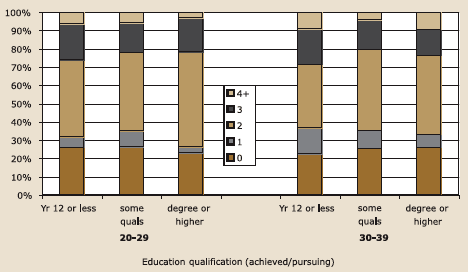
Figure 5.7b: Expected number of children by education and age: women

5.1.5. Expectations by employment status
Consistent with their aspirations, fertility expectations of those without children did not vary significantly with employment status for those in their twenties and thirties (Figure 5.8). Once again, however, it is important to point out that there were only 21 men in their thirties and 26 women in their thirties working part time, so percentages for these groups are likely to be unreliable. All other groups comprised more than 50 respondents.
For men, no significant relationship was apparent between the number of children expected and employment status for those in their twenties, while for those in their thirties, a marginally significant trend emerged (Figure 5.9a). However, it should be noted there were only 37 men in their thirties who were in part-time work represented in Figure 5.9a. Percentages for this group are likely to be unreliable.
Figure 5.8: Likelihood of having children by employment status and age: childless men and women
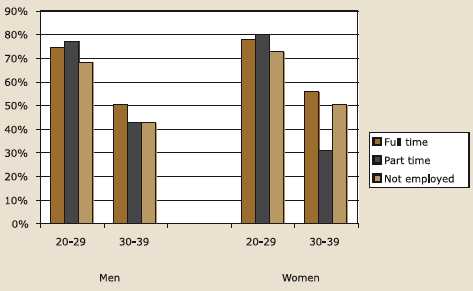
The relationship between expected number of children and employment status for men in their thirties was complex. Those who were working full-time were the most likely to expect two children, while those who were not in paid work were the least likely to expect this (44% vs 32%). Conversely, those not employed were the most likely to expect four or more children while those working part-time were the least likely to do so (12% vs 3%). Finally, those working part-time were the most likely of all groups to expect one child, while those working fulltime were the least likely (19% vs 8%). Nevertheless, as for the women, a family of two children represented the most common expectation of these younger and older men in each of employment status.
Figure 5.9a: Expected number of children by employment status by age: men
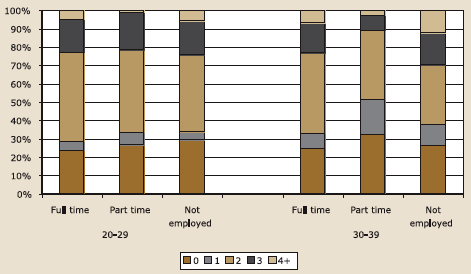
Figure 5.9b: Expected number of children by employment status by age: women
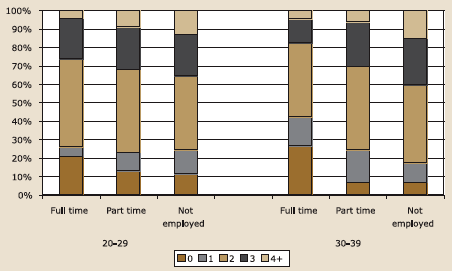
For women in both their twenties and in their thirties, expectations about family size varied significantly with employment status (Figure 5.9b). Women in full-time work were considerably more likely than those with no paid work or those working part-time to expect to remain childless (21% vs 11% to 13% of women in their twenties; 27% vs 7% of women in their thirties). Conversely, those who were not in paid work were the most likely to expect four or more children while those in full-time work were the least likely to do so (13% vs 4% of women in their twenties; 15% vs 5% of women in their thirties).
While for women in their twenties much the same proportions in each employment status group expected three children (22% to 23%), for those in their thirties, three children was expected by only 13 per cent who were in full-time paid work, compared with 24 per cent and 25 per cent of those who worked part-time or who were not in paid work. Thus, of women who were working full-time, those in their twenties were more likely than those in their thirties to expect three children (22% vs 13%).
However, the differences between the views of the younger and older women who worked fulltime do not necessarily reflect changing views with age for those working full-time work. As noted in Chapter 4 many of those in their twenties who were working part-time or not at all were pursuing higher education. Some of these women are likely to move to full-time work when in their thirties, while some of the younger women currently working full-time may convert to parttime work or give up paid work when in their thirties.
Furthermore, it must be pointed out that employment status was linked with current family size, and respondents' expected total number of children refers to current family size plus any extra children expected. As noted in Chapter 3, both younger and older women who were in full-time work were the most likely to be childless (89% and 61% respectively), while those not in paid work were the least likely to be in this position (11% and 7% respectively). While very few women in their twenties already had four or more children, those who were not employed were more likely than those working full-time to have at least three children (8% vs 2%, cf. 7% with part-time paid work). Of women in their thirties, those not employed were the most likely to have four or more children (11%), followed by those working part-time (4%), then full-time (3%). Thus, most in the small group of women who were not working who expected to have a family of four already had this number of children, which may explain their not working. But with cross-sectional data, it is not possible to tease out the existence of causal links, nor the direction of causation, should it exist.
In summary, respondents in all employment status groups most commonly expected two children. While a somewhat complex but weak relationship was apparent between the expectations and employment status for men in their thirties, strong relationships between expectations and employment status were apparent for both younger and older women. As might be anticipated, women with full-time paid jobs were the most likely to expect to remain childless and the least likely to expect to have four or more children, while those not in paid work were the most likely to expect to have four or more children. Of course, although applying to a minority, the latter women were also the most likely to have families of this size already.
To what extent do these results reflect different aspirations about family size for women in the three employment status groups? Chapter 4 suggested that only 6 per cent of women who worked full-time in fact considered childlessness to be their ideal. Women in full-time work were the most likely to expect to remain childless, while those not in paid work were the least likely to do so (30% vs 11% of women in their twenties; 27% vs 7% for women in their thirties).
5.2. Expected timing of first or next child
As noted above, Azjen (1985, 1988, 1991) emphasises the close link between intentions and perceived constraints. According to his theory of planned behaviour, behaviour to achieve goals is initiated when the opportunity to engage in it arises. However, for a variety of reasons, not all intentions are followed through with action. Ajzen (1985) argues that the longer the time frame established for carrying out intentions, the lower their predictability, other things being equal. Secondly, he notes that vague intentions are less likely to result in action than intentions involving strong commitment. Intentions may also be revised in the light of changing circumstances, new information, or changing importance attached to rewards and costs. For instance, Ajzen points out that as the time of taking action draws near, the likely negative repercussions of such action may loom large and appear to outweigh the perceived rewards. Furthermore, some people change their minds more readily than others.
In the Fertility Decision Making Project, respondents who indicated that they were "very likely" or "somewhat likely" to have a first or additional child were asked to nominate the year in which they expected this (next) child.
Figure 5.10 shows that women expected to have their child sooner than did men: nearly half the men (49%) and nearly two thirds of the women (64%) reported that they expected to have this child within the next three years, with most of these respondents expecting to have within the next two years, rather than within the next two to three years. One third of the men (34%) and just over one quarter of the women (27%) felt that they would have their child within the next four to six years while 14 per cent of men and 7 per cent of women felt that they would not have this first or next child within the next six years.
Figure 5.10: Likelihood of having (more) children within specific timeframe
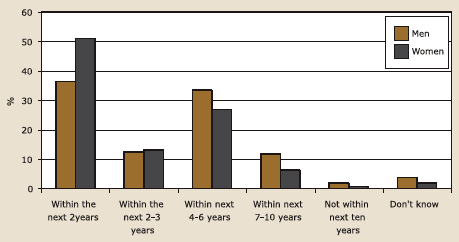
Parents were more likely than those without children to expect another child within the next three years (men: 78% vs 33% in their twenties and 82% vs 67% in their thirties; women: 77% vs 46% in their twenties and 91% vs 82% in their thirties). This difference is likely to reflect the fact that, compared with parents, those without children tended to be younger and were more likely to be single. The difference in the time frame for having children reported by parents and non-parents was greater for men and women in their twenties than it was for those in their thirties (Figures 5.11a and 5.11b).
Figure 5.11a: Likelihood of having (more) children by expected timeframe, parental status and sex: respondents aged 20-29
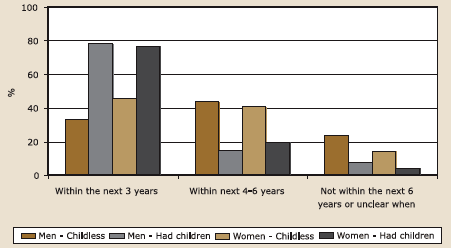
Figure 5.11b: Likelihood of having (more) children by expected timeframe, parental status and sex: respondents aged 30-39
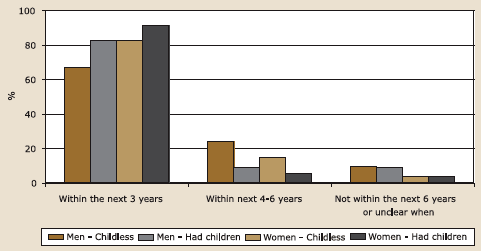
Figures 5.11a and 5.11b also show that non-parents in their twenties were less likely than nonparents in their thirties to expect a child within the next three years (men: 33% vs 67%; women 45% vs 82%). This is hardly surprising given that non-parents in their twenties were considerably more likely than their counterparts in their thirties to be single. Of the parents, much the same proportions of men in their twenties and thirties expected a child within the next three years (78% and 82% respectively), but mothers in their twenties were less likely than mothers in their thirties to expect to have their child within this time frame (77% vs 91%). These trends for mothers are probably influenced by the fact that some of the older women would have been approaching the end of their childbearing years.
Figure 5.12 depicts the proportions of childless men and women in four age groups who reported that they would have their expected child within the next three years. These proportions increased with increasing age for men, but levelled out for women during their thirties. However, women in each age group were more likely than their male counterparts to expect to have a child within this time frame. More than 80 per cent of the women in their thirties expected to have a child within the next three years - suggesting that they had become very mindful of their "biological clock". Of course, men too may have become increasingly mindful of their partner's "biological clock" as they age. However, other considerations may also influence these trends - such as concerns about the width of the "generation gap", ability to cope with parenting when older, the possibility of retiring while the child is still dependent and so on. The perceived importance of various considerations that enter into decisions about having children are outlined in Chapter 7.
As for women without children, the proportions of mothers reporting that they would have their expected child within the next three years increased progressively from 32 per cent of those in their early twenties to 82 per cent of those in their early thirties, then levelled out (82% in their late thirties expected to have their child within the next three years). It was not possible to identify related trends for fathers given the small numbers in some age groups who expected to have a child.
Figure 5.12: Likelihood of having child within three years: childless men and women16
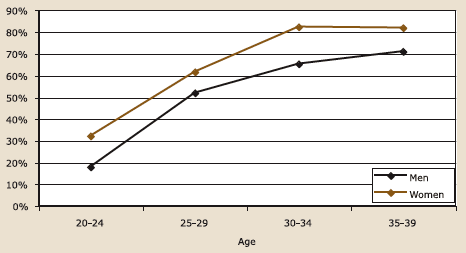
5.3 Summary and conclusions
This chapter has focused on three sets of expectations held by respondents: how likely they were to have a child in the future, how many they were likely to have, and (where appropriate) the year in which they were likely to have their first or next child. In this analysis, the number of children they expected in the future was added to the number they already had, thereby yielding the total "family size" they expected.
5.3.1 Expectations about having a child and expected family size
Like aspirations, expectations were consistent with the current "two-child family" norm. Most men and women with one child or no children expected to have a child in the future, while most of those with two or more children did not. Consistent with these trends, both men and women most commonly indicated that they expected a family of two children.
Nevertheless, sizeable minorities deviated from these trends. Some respondents with fewer than two children did not expect a child in the future, and some with at least two children expected another. Furthermore, men with one child were more likely than their female counterparts to expect another child. Nevertheless, the proportions of respondents who expected a first or additional child were lower than the proportions indicating that they would like to have such a child.
Expectations by age
While the proportions expecting a first or additional child tended to decrease progressively with age, to some extent this link varied according to gender and the number of children respondents already had. Between their early and late thirties, the apparent "fall" in the proportions expecting a child was particularly marked for women with no children or only one child. Indeed, unlike their male counterparts, the proportion of mothers with one child who expected another did not fall until age 35. These trends for women highlight the growing importance of their "biological clock" during the thirties and the fact that men's partners tend to be younger than the men themselves.
However, it is also important to note that the overall fall in the proportions expecting a child that occurs with increasing age would partly result from the increasing concentration in the older age groups of those who either never intended having children, or who had achieved their preferred family size at a relatively young age.
Furthermore, whereas a family of three was more popular than childlessness for both men and women in all five-year age groups, a higher proportion of men in each age group expected to be childless than to have three children. Women, on the other hand, were more likely to expect a family of three children than no children.
Relationship status
Fertility expectations were strongly related to relationship status in understandable ways: married men and women without children were the most likely to expect to have a family, while their counterparts who were single were the least likely to feel this way. (However, for women, there was little difference in the patterns of responses for those who were cohabiting and those who were married.) These trends held for those in their twenties as well as those in their thirties.
In other words, the link between relationship status and expectations could not be explained in terms of systematic differences in the age of people in these different relationship status groups. Not surprisingly, expectations about starting a family were strongly linked with both age and relationship status, with married respondents in their twenties being the most likely to expect to start of family, and single respondents in their thirties being the least likely to expect this. Such trends highlight the importance of relatively early marriage and relationship stability for fertility.
With the exception of single men and women in their thirties, respondents in all marital status groups most commonly expected to have two children. For single women in their thirties, much the same proportions expected two children or no children, while for single men in their thirties, a higher proportion expected no children than two children.
While some of these childless respondents may have never wanted either marriage or children, it is noteworthy that the proportion of single men and women in their thirties who expected to remain childless was greater than the proportion who indicated no children as their personal ideal. Once again, then, relationship circumstances emerge as important issues explaining fertility expectations.
Education
Pursuit of higher education is another factor that delays family formation and increases the risks of remaining childless. Nevertheless, there was no evidence to suggest that childless respondents who had or were pursuing a degree were any less likely than others to expect that they would start a family. Indeed, childless men in their twenties who neither had nor were pursuing post-school qualifications were significantly less likely than those with or pursuing degrees to expect to have children (although the majority did expect children). A similar direction of results, though not statistically significant, applied to men in their thirties. Thus, it would appear that those with no post-school qualifications were more likely than men who were pursuing or had achieved a degree to be pessimistic about achieving their aim of having a family.
The total number of children expected varied significantly with the education level of women but not men. Compared with women with no qualifications, higher proportions of women who had or were pursuing some form of post-school qualifications expected to have no children and lower proportions expected to have a family of three children. This is not surprising. Regardless of whether or not women who start a family early are more "family-oriented" than other women, their child care responsibilities would limit their opportunities for obtaining post-school qualifications.
Nevertheless, the difference between ideals and expectations about having a first child was greater for childless women who had or were pursuing post-school qualifications than for their counterparts with no post-school qualifications. These trends highlight the difficulties some women face in achieving higher education while hoping to have children. Some of these difficulties may relate to competing career or work/family goals; others may relate to concerns about the diminishing chances of ever having children incurred by their postponement of partnership or family formation.
Employment status
Unlike their expectations about having a first or additional child, expectations concerning total family size varied significantly with employment status (but only weakly so for men in their thirties, and not for men in their twenties). Women in their twenties and thirties (taken separately) with full-time paid work were more likely than their counterparts with part-time or no paid work to expect to remain childless. Conversely, those women without paid work were the most likely to expect to have four or more children. Nevertheless, compared to their counterparts with no paid work, higher proportions of childless women in full-time paid work expected than wanted to remain childless (as measured by ideal family size). Of course, for some of these women, competing work/family goals may contribute to their unfulfilled family formation ideals, but for others, lack of opportunity to start a family is likely to be a central factor.
5.3.2 Expected timing of next child
According to Azjen's (1985, 1988, 1991) model of decision-making, the time frame established for carrying out intentions is an important determinant of whether or not such intentions will be carried out. The shorter the time frame, the more likely it is that the intended action will be initiated. While both men and women who expected to have a child in the future most commonly expected that they would have this child within two years, men were more likely than women to suggest that they would not have a child until four or more years time. This partly reflects the tendency for men to start a family at a later age than women.
Men and women who were parents - especially those in their twenties - tended to expect a child sooner than did their childless counterparts of the same age. Of those in their thirties, the longest time frame was nominated by men who were childless, and the shortest by mothers. These differences were influenced by partnership status. Non-parents were more likely to be single and thus their chances of having a child in the near future were more remote.
Of the childless respondents who expected to have a child, more than 60 per cent of women from age 25 onwards and of men in their thirties expected to have a child within the next three years. However, women in all age groups were more likely than their male counterparts to expect this, with more than 80 per cent of women in their early and late thirties expecting a child within this time frame. These trends highlight women's acknowledgement of their diminishing fecundity in their thirties.
The analysis in this chapter once again points to the importance of the interacting links between views on having children and age, relationship status, education and employment status. There was considerable evidence that lower proportions of older single respondents, women with or pursuing post-school qualifications, and women in full-time work expected than wanted children. The next chapter examines the latter issue in more detail. It focuses on personal matches or mismatches between fertility aspirations, fertility expectations, and the number of children respondents already had.
12. For instance, Qu, Kilmartin and Weston (2000) found that single people who later partnered often converted from not expecting children to expecting them, while the opposite applied to partnered respondents whose partnerships ended.
13. Family size takes into account any current pregnancy. For example, where the respondent or partner is pregnant with their first child, the respondent is considered to have one child. This decision is consistent with the question wording tapping expectations about having a/another child, which was preceded by "Apart from the child you are already having..." where applicable.
14. The smaller the size of these groups, the less reliable are the derived percentages.
15. Two per cent of men and women did not estimate the number of children they expected. The non-response rate on this question was higher among the younger age groups (3-4% of men and women aged 20-24) than the older age groups (1 per cent of men and women aged 35-39).
16. Percentage for women aged 35-39 was based on a sample of 22 women.
6. Comparisons of fertility aspirations, expectations, and achievements
The search for effective policies to stem the declining total fertility rate requires a good understanding of the reasons underlying these trends. One debate on this issue concerns the extent to which trends reflect personal preferences or constraints on lifestyles. While much of the debate has focused on women (e.g. Hakim 2000; McRae 2003), the potential impact on Australia's total fertility rate of men's fertility preferences and experiences of constraints has generated considerable discussion in recent years (e.g. Arndt 2004; Birrell et al. 2004; Horin 2002; Szego 2002). These issues are addressed in this chapter. While in Chapter 5 reference was made to broad trends in aspirations in the analysis of expectations, the present chapter focuses specifically on the extent to which men and women have met, or expect to meet, their fertility aspirations, and the nature of possible constraints upon achievement of aspirations.
Of course, as mentioned in Chapter 5, aspirations influence and are influenced by sociodemographic circumstances. Furthermore, respondents may not be aware of the extent to which their aspirations about having children are influenced by constraints imposed upon them. Again, it is important to note that competing preferences can be understood as constraints - some of which may well relate to social norms and to economic and labour market forces. For instance, as noted in Chapter 1, McDonald (2001b) argues that labour market forces and the strong economic cycle of "booms and busts", along with increases or fluctuations in housing prices, have encouraged young people to focus on developing their own "human capital" (their education and career development) and couples to remain dual earners to avoid "dual joblessness".
While McDonald (2001b) refers to decision-making of couples, most discussions in the literature on fertility decision-making focus on individuals and fail to take into account the possible impact of one partner's views on the other partner - a point noted by Greene and Biddlecom (1997). Given their potential importance, links between the aspirations and expectations of each partner in couples are examined.
This chapter, then, focuses on both objective socio-economic factors that may help to explain relationships between aspirations and expectations, and some of the reasons respondents provide when they expect fewer children, or more children, than they ideally want. The first two sets of analysis focus on desires about having a first or additional child in the future and the size of the gaps between averages derived for ideal family size, expected family size and achieved family size. Of central concern is the extent to which these gaps appear to narrow with advancing age. (Here, the terms "achieved family size", "expected family size" and "ideal family size", are used as replacements for the more technical terms "achieved fertility", "expected fertility" and "ideal fertility". They refer to the number of children the respondent has had, expects to have, or considers to be personally ideal.)
Attention is then directed to the prevalence of a mismatch between aspirations and expectations. Two approaches are adopted to throw light on the nature of constraints on achievement of aspirations: first, the level of variation in the prevalence of an apparent mismatch across different socio-demographic groups is examined, and second, respondents' own explanations for mismatches are outlined. Finally, using data collected from couples, the apparent relative influence of each partner's fertility aspirations on their own and their partner's expectations is examined.
6.1 Fertility desires versus expectations of those without children
Figure 6.1a presents the patterns of fertility expectations of respondents without children who indicated that they "definitely" or "sort of" wanted a child. Figure 6.1b on the other hand provides the same information for those who already had at least one child. The percentages for men in their early twenties with at least one child are not presented, given that there were only 19 such men who indicated both their preferences and expectations. The next smallest group were women in their late thirties who had not had any children (n = 35).
Figure 6.1a: Childless respondents who wanted (definitely or sort of) a child: proportions expecting a child, by age and gender
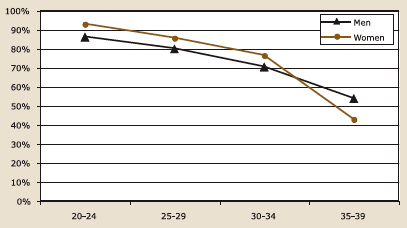
Figure 6.1b: Respondents who had children and wanted (definitely or sort of) more: proportions expecting a child, by age and gender
[[{"fid":"2691","view_mode":"full","fields":{"format":"full","field_file_image_alt_text[und][0][value]":"Figure 6.1b. Respondents who had children and wanted (definitely or sort of) more: proportions expecting a child, by age and gender, described in text\" width=\"428\" height=\"215\" />","field_file_image_title_text[und][0][value]":""},"type":"media","attributes":{"alt":"Figure 6.1b. Respondents who had children and wanted (definitely or sort of) more: proportions expecting a child, by age and gender, described in text" width="428" height="215" />","class":"media-element file-full"}}]]
Across all age groups of childless respondents who wanted children, higher proportions of women than men considered that they were "very likely" to have a child. However, the gender difference is not as strong if the two groups with positive expectations are combined (that is, those who considered that they were "very likely" or "somewhat likely" to have a child). Not surprisingly, expectations declined with increasing age, with the greatest fall occurring between the early and late thirties, especially for women. Only 43 per cent of women and 54 per cent of men in their late thirties (who wanted children) expressed positive expectations, while around 31 per cent of these men and women considered that they had an even chance of having a child. Thus, 26 per cent of these older women and 15 per cent of these older men who were childless but wanted children indicated that they were "somewhat unlikely" or "very unlikely" to have a child - a situation that applied to only 9 per cent of men and 6 per cent of women in their early thirties who wanted a child.
Similar patterns were apparent for parents who wanted another child - with the exception that, unlike other groups, the proportions expressing positive expectations (regardless of confidence level) did not decline with age for mothers who where under 35 (Figure 6.1b). Most fathers and mothers under 35 held positive expectations, while such expectations applied to just over half (54%) the fathers in their late thirties and 41% of their female counterparts. While around one third of those in their late thirties who were childless considered that they had an even chance of having another child, this expectation applied to only 17 per cent of fathers in their late thirties and 24 per cent of mothers of this age. Thus, parents in their late thirties who wanted a child were more likely than non-parents to be pessimistic about achieving this preference (for men: 29% vs 15%; for women: 35% vs 26%).
Helping both non-parents and parents to have (more) children is important for stemming the decline in the fertility rate. On the basis of fertility trends apparent between 1986 and 1996, McDonald (1998), argued that the 27 per cent of women with more than two children contribute to more than 50 per cent of total fertility.
6.2 Family size ideals, expectations and current achievements: a comparison of derived averages
Figures 6.2a and 6.2b show the average (mean) number of children respondents in the four age groups had, the number they expected, and the number they considered to be ideal for them. It is important to note that the number expected includes the number already achieved.
For both men (Figure 6.2a) and women (Figure 6.2b), the average ideal number of children was similar for each age group and was above the replacement level (2.1). In total, women's average ideal number of children was slightly higher than that for men (2.5 vs 2.4).
Figure 6.2a: Men: current, expected and preferred number of children
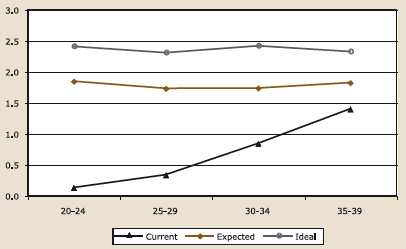
Figure 6.2b: Women: current, expected and preferred number of children
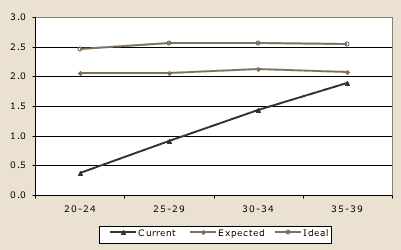
The average expected number of children was also similar across the four age groups for both men and women, and once again, women, on average, expected a slightly larger family than men (2.1 vs 1.8). Men's average expectation was thus very similar to Australia's total fertility rate (1.75 in 2002), while women's average expectation was roughly the same as the "replacement level" rate.
Furthermore, across all age groups, the average family size that men and women expected to have was lower than their average ideal family size. This is not surprising, given that expectations are likely to be more strongly influenced than personal ideals by perceived constraints - a point noted in Chapter 5.
These trends across age do not necessarily suggest the ideals and expectations regarding family size apparent in respondents' early twenties remain stable as they reach their forties. Rather, it could well be that men and women who are currently in their late thirties held much higher expectations (and perhaps ideals) when they were young adults than they currently hold. Indeed, as Chapter 4 showed, of the respondents aged 22 or more who wanted children when they were 20 years old, 23 per cent of men and 30 per cent of women reported wanting more children at this earlier age than at the time of the interview. Similarly, young adults today may also change their views as they mature. In the light of Australia's generally declining fertility rate since the mid-1960s, a significant proportion of young adults are unlikely to achieve their ambitions - unless key perceived barriers to having children are overcome. These barriers include a mix of competing goals and practical considerations such as finding a partner. Likewise, their ideals are likely to fall if the total fertility rate falls, given that ideals tend to be strongly influenced by societal norms, including the increased tolerance of diverse lifestyles, and trends in partnership formation, family size and age at childbearing.
How closely does the actual number of children born approximate ideals and expectations as these respondents approach their forties? It has already been shown above that, on average, the gap between achieved and expected family size was relatively small for those in their late thirties. It seems likely that, as people approach their forties, they may adjust their aspirations (as well as expectations) to better fit reality. As noted above, the retrospective information derived in this survey suggested that this was the case.
On average, men tend to be two years older than their partners. It is thus not surprising that men in their late thirties had, on average, fewer children than their female counterparts (1.3 vs 1.9), and that the gap between the expected and actual number of children for men in their thirties was greater than that for women of the same age (men: 1.8 vs 1.3 respectively; women: 2.1 vs 1.9 respectively). Some of these women in their late thirties will, in fact, have a child in the future, so the gap between expectations and reality will narrow. Nevertheless, neither the women nor the men were expecting or having the number of children they said they ideally wanted.18
6.3 Prevalence of match between ideals and expectations across socio-demographic groups
The previous section showed that the means derived for expected family size were lower than the means derived for ideal family size. While means are useful summary statistics, they "hide" a great deal of other useful information. For instance, the same mean scores could be derived if almost everyone expected that that they would not have the number of children they ideally wanted, or if most people expected that they would achieve these "ambitions", but of those who did not, higher proportions believed they would have fewer rather than more children than they ideally wanted. This section examines the proportions of respondents who expected to achieve their ideal family size, and the proportions who expected fewer or more children than they considered ideal.
The results for the total sample suggest that personal ideals were not typically seen as unrealistic. Rather, 61 per cent of men and 64 per cent of women indicated that they expected to achieve (or had already achieved) the family size they considered ideal. The means derived for expectations were lower than those derived for ideals because most of the other respondents believed that that they would have fewer children than they considered ideal. This was indicated by 34 per cent of all men and by 32 per cent of all women. The remaining 6 per cent of men and 4 per cent of women believed that they would have more children than they ideally wanted.
Of course, it is not possible to examine the extent to which such trends arise from earlier adjustments of ideals to fit expectations. It should also be kept in mind that "expected family size" includes the number of existing children as well as the number expected. The high level of consistency between ideals and expectations partly arises from the high proportion having already fulfilled their ambitions regarding family size - a trend that appears to be somewhat stronger for women than men. Sixty-one per cent of women who expected to achieve their ideal number of children had already had children compared with 50 per cent of their counterparts who did not expect to be able to achieve their ideal number of children, whereas the proportions of men expecting and not expecting to achieve their ideal family size who were parents were 34 per cent and 28 per cent respectively.
6.3.1 Trends according to age
Figures 6.3a and 6.3b depict the proportions of men and women in their early and late twenties and thirties who indicated the belief that they will achieve their ideals, or will have fewer or more children than they ideally wanted. Clearly, these beliefs did not vary significantly with age for either men or women. The patterns emerging for each group are much the same as those for the total sample of men and women outlined above.
Figure 6.3a: Ideal vs expected number of children, by age, all men
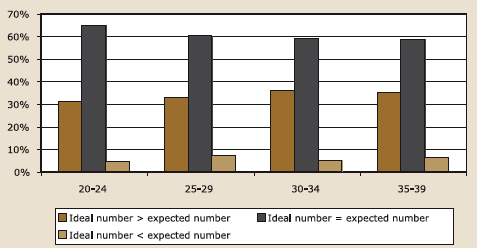
Figure 6.3b: Ideal vs expected number of children, by age, all women
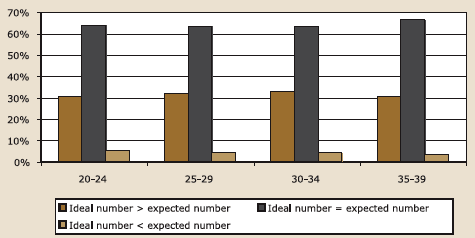
However, as might be expected, the extent of match between ideals and expectations varied significantly with age for women who did not have children. While the same general direction of results emerged for men, the results did not quite reach the conventional five per cent level of statistical significance.18 These results are depicted in Figures 6.4a and 6.4b. While two thirds of the childless men and women in their early twenties appeared to believe they would achieve their ideal family size (66% and 67% respectively), under half of those in their late thirties felt this way (49% and 43% respectively). In fact, a higher proportion of women in their late thirties felt that they would under-achieve rather than achieve their ideal family size (56% vs 43%), while men were evenly divided on this issue. It is noteworthy that even in their early twenties, around 30 per cent of men and women without children felt they would not achieve their ideal family size.
Figure 6.4a: Childless men: ideal vs expected number of children, by age
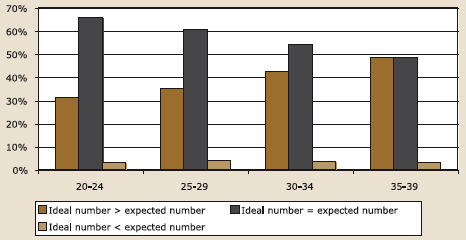
Figure 6.4b: Childless women: ideal vs expected number of children, by age
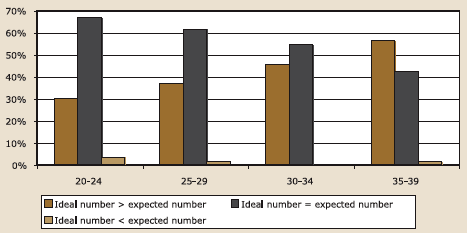
6.3.2 Trends according to relationship status
The proportions of respondents expecting to achieve their ideals was strongly related to relationship status for men and women in their twenties and thirties (taken separately). The results are set out in Figures 6.5a and 6.5b.
Figure 6.5a: Ideal vs expected number of children by relationship status and age, all men
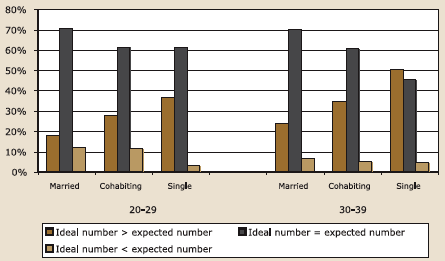
Figure 6.5b: Ideal vs expected number of children by relationship status and age, all women
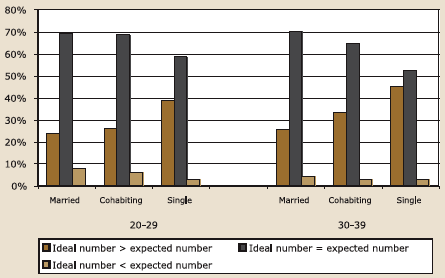
Married men and women appeared to be the most likely to believe that their "ambitions" would be fulfilled, with equal proportions of those in their twenties and thirties feeling this way (men: 70%; women: 69% and 70% respectively). In addition, virtually the same proportion of cohabiting women in their twenties (68%) as married women expected that they would achieve their expectations.
The groups who were next most likely to believe that they would achieve their ambitions were cohabiting women in their thirties (64%), cohabiting men in their twenties and thirties (61% for each age group), and single men and women in their twenties (61% and 59% respectively). Not surprisingly, those least likely to expect that they would achieve their ambitions were single men and women in their thirties. Indeed, a slightly higher proportion of these older single men felt that they would "underachieve" than meet their ambition (50% vs 45%) while the reverse applied for women in their thirties (45% vs 52%).
Of course, married respondents were more likely than single respondents to already have the number of children they ideally wanted (men in their twenties: 13% vs 7%; men in their thirties: 46% vs 21%; women in their twenties: 21% vs 12%; women in their thirties: 50% vs 39%).
While few respondents felt that they would have more children than they considered ideal, it is interesting to note that a higher proportion of married and cohabiting men in their twenties felt this way (12% and 11% respectively vs 3% of single men in their twenties, and 5% to 7% of all men in their thirties). (The proportions of women indicating this ranged from 3% to 8%). As will be seen later, partner's views, a desire to give their only child a sibling, or a desire to have both a boy and a girl were some of the reasons given for expecting more children than they ideally wanted.
In short, those most likely to indicate that they had or expected to achieve their ideal family size were married respondents both in their twenties and thirties, although cohabiting men and women were not very far behind. Those who were most likely to expect that they would not have as many children as they ideally wanted were single respondents in their thirties. Although applying to a small minority, married and cohabiting men in their twenties were the most likely to expect that they either had or expected to have more children than they ideally wanted.
6.3.3 Trends according to education
The prevalence of a match between family size ideals and expectations did not vary significantly with the educational status of men and women in their twenties or thirties (refer Figures 6.6a and 6.6b). Of men in their twenties, 58 per cent of those with no post-school qualifications expected to have their ideal number of children, compared with 66 per cent of those with or pursuing degrees. In addition, 10 per cent of the former group and 3 per cent of the latter group expected (or already had) more children than they considered ideal.
Although the overall patterns of results for these men were not significant, when the two groups with or pursuing post-school qualifications are combined, then differences emerged for both men in their twenties and thirties (taken separately). Those with no post-school qualifications were less likely than other men to expect to achieve their ideal family size.
Figure 6.6a: Ideal vs expected number of children by education and age, all men
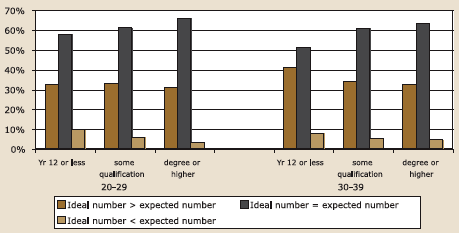
Figure 6.6b: Ideal vs expected number of children by education and age, all women
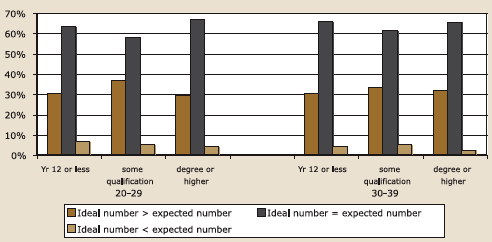
6.3.4 Trends according to employment status
The final set of analyses in this general section focus on employment status (see Figures 6.7a and 6.7b). The relationships between the incidence of match or mismatch of ideals and expectations and employment status were significant for men and women in their thirties, but not for those in their twenties.
Of men in their thirties, those in full-time paid work were the most likely to believe that they had or would achieve their ideal family size, while men in part-time work were the least likely to feel this way (62% vs 42%). Men in part-time work were more likely to believe that they would "underachieve" than achieve their ambition (58% vs 42%). As the previous sets of analyses suggest, this was an unusual situation. Reasons for this trend emerging for men in part-time work but not for men without employment are not readily apparent. However, it is worth noting that a total of 44 per cent of men in their thirties who were not employed also felt that they would not achieve their ambition, with 39 per cent feeling that they would "under-achieve" their ideal family size, and 5 per cent feeling that they had or would have more children than they ideally wanted.
Figure 6.7a: Ideal vs expected number of children by employment status and age, all men
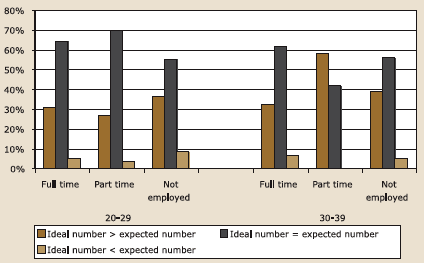
Figure 6.7b: Ideal vs expected number of children by employment status and age, all women
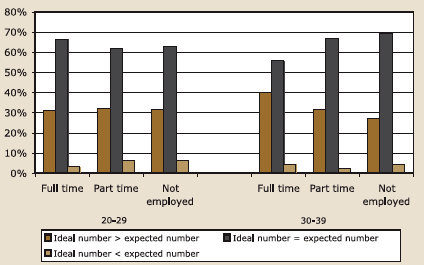
These trends seem generally consistent with the argument that men with potentially sound financial prospects are the most likely to be able to marry and establish families, while those with poor financial prospects are the least likely to be able to do so (Birrell et al. 2004). According to Birrell and colleagues either the latter groups are reluctant to assume the responsibilities of marriage and parenting or women are reluctant to see them as suitable partners.19 However it was shown in Chapter 3 that men without paid work were just as likely as men with full-time paid work to have at least one child.
An understandably different pattern of results emerged for women in their thirties than for men of this age. Women in their thirties with full-time paid work were the least likely of all women to indicate that they had achieved or expected to achieve their ideal family size. On the other hand, women without paid work were the most likely to indicate a match between current or expected family size and ideal family size (69% vs 56% of those in full-time paid work). This is hardly surprising, given that most of those not in paid work would be caring for the children they wanted to have.
Of greater importance than this comparison is the relatively high proportion of women in their thirties in paid work who did not expect to have the number of children they wanted (40%, compared with 27% of women who were not employed). Some of these women may be working full-time because they are no longer physically able to have children, because they lack a partner, or their partner is against having children. Others may be doing so because they need the money, because they find that they cannot juggle both work and (more) children, and/or because work happens to be even more important to them. In other words, full-time paid work may be operate as a contributor to apparent unfulfilled fertility ambitions and as a result of other factors that interfere with the ability to fulfil fertility ambitions.
Thus, relationships between the expectations-ideals match and socio-demographic factors raise many questions worth exploring in future analysis. To throw further light on the possible reasons for a mismatch between ideals and expectations, respondents in the current study were asked to explain the reasons for expecting fewer children (or more children) than they ideally wanted. Their comments are outlined in the next section.
6.4 Perceived reasons for a mismatch between ideals and expectations
As noted above, 34 per cent of all men and 32 per cent of all women indicated that they would have fewer children than they considered ideal, while only 6 per cent of men and 4 per cent of women suggested that the number of children they had or expected was greater than the number they considered ideal. Most respondents gave a variety of reasons for these views, although some reported they did not know the reason for the mismatch between ideals and expectations. This uncertainty was mentioned by nearly one quarter (22% of men and 22% of women) of those who felt they would not have as many children as they wanted, and by around one third (36% of men and 33% of women) who had or expected more children than they considered ideal.
The examples of explanations provided by respondents are divided into four sets, with the first two referring to those who expected that they would not achieve their ideal family size: (a) where respondents were not expecting a first or additional child or another, and (b) where they were expecting such a child. The second two sets refer to those who had or were expecting more children than they considered ideal: (a) where respondents did not want any (more) children, and (b) where they wanted a first or additional child in the future.
Some of the quotations below cover more than implied by the category under which they are placed.
6.4.1 Reasons for wanting but not expecting to have a/another child
The reasons mentioned for not expecting to have a child or more children mainly centred on financial or work-related issues, partnerships, age, and fecundity or health issues. Some felt they were too young yet - they had other goals such as career goals that they wished to achieve before thinking of having children. There was thus a sense that they might change their minds. Others felt they were too old to have children - or would be too old by the time they found a partner.
Health and fecundity
Just because of a lot of health issues involved, and I'm not really IVF-minded which takes that option away from happening. (Woman aged 34, married)
I had to get my tubes tied because of complications during pregnancy, so a future pregnancy is extremely dangerous for my health. (Woman aged 25, married)
I am on the IVF program. I'm not having any success with it. My [partner] and I are finding it very difficult to conceive. It took us a long time to conceive [first child]. We are unable to have children now. I really want two more children. (Woman aged 35, married)
My wife has back problems that prevent her from having children. She probably wouldn't be able to carry the child through the pregnancy, and the risk associated with her becoming pregnant isn't worth it. (Man aged 33, married)
Lack of partner (and age or work)
Because I'm not in a relationship and it's unlikely at present that I'll be in one for the future. (Woman aged 37, single)
I'm single at the moment. It takes two to tango, and I have no prospects in the immediate future. (Man aged 28, single)
I'm not actively looking for a partner. I don't really want a child when I'm in my forties and I can't see myself getting into another relationship that quickly. (Woman, aged 38, single)
I'm too shy now. I work too much and seem to get nowhere. I work six days a week and only get one day off. I'm not really interested in getting serious with anyone. You don't know until you meet the right person and I'm unlikely to meet someone at the moment. (Man aged 29, single)
Partner's wishes (and age)
I don't think my partner would like another one. (Woman aged 36, married)
My current partner does not want one, but if I was to get into another relationship with a guy that had no kids and he wanted one then I would have another child. (Woman, 35, cohabiting)
There are time constraints for me because of my age. When my partner becomes ready to have children there is only a small window of time in which I can still physically have them. (Woman, aged 38, cohabiting)
It's [partner's] fault. She's done all the hard work of nappies and crying and she doesn't really feel like doing it all again. (Man aged 28, married)
Financial or/work-related issues
Finances - I would lose my job and we could not cope as a family unit. (Woman aged 33, cohabiting)
We would need a new house and car, and the educational costs would be huge. Financial concerns are huge factors that prevent us from expanding. It would be too much. (Woman aged 33, married)
In the next five years or so I will be focusing on my career. I do some work that is not your average day-to-day stuff. I am just not ready to settle down. For me, my job is a lifestyle. (Man aged 28, single)
6.4.2 Reasons for expecting to have fewer children than considered ideal
Not surprisingly, those expecting to have fewer children than they ideally wanted also commonly mentioned fecundity and other health issues, lack of a partner, and partner's wishes.
Health and fecundity
I feel I might have some problems with my fertility. I don't have any hard evidence to back these feelings up or any medical abnormalities or problems as such. It's just that my grandmother had problems with her fertility. (Woman aged 21, single)
I'm not well. I've been told I might not be able to have kids. (Woman aged 26, cohabiting)
Lack of partner and age
I would like to have three children altogether but two would be enough. I'm getting on, age-wise, and would need to be in a committed relationship of at least one year before going into having children together. Time-wise I'm running out and could end up being too old. (Man aged 33, single)
I am 38 yrs old and haven't yet met anyone I would like to spend the rest of my life with. That is the only situation in which I would want to have children. I think after early 40's it's too late. (Man aged 38, single)
Because I am not in a relationship at the moment and have been single for over five years - so it's really hard to say what will happen. (Woman aged 28, single)
Depends whether I get married or not. I believe children should be in a family situation with both parents present. (Man aged 29, single)
Partner's wishes
My partner doesn't really want to have any more, but we're compromising. (Woman aged 23, married)
Because [partner] would prefer to have two. He grew up with just one brother, and that is his ideal family size. That is more affordable than my three-child family size. (Woman aged 28, married)
Financial and/or job-related reasons
Purely because of the financial circumstances. I'd want to be able buy more for my kids and life seems so much more expensive than it was when I was growing up - computers, sports stuff, clothing labels etc. The pressure now is more intense than before. (Woman aged 27, single)
The economics of it. It's too expensive to have more than two children. Also, I find it difficult to find a job that's flexible enough for family commitments. Also, childcare is too expensive and too hard to find. (Woman aged 32, married)
I expect to have fewer kids than five purely because of financial reasons. I'd have to marry a millionaire to be able to afford five children. (Woman aged 32, single)
6.4.3 Reasons for expecting to have a child/more children despite not wanting this
Amongst those who expected a(nother) child but did not want to do so, a number of people indicated that they may later change their mind. Once again, financial and work-related concerns were commonly mentioned, along with partnership issues. But predominantly, these people saw their aspirations about having children as contingent on their circumstances or increasing maturity.
Personal views about having children may well change
As I feel now I don't want to have any children but I expect my attitudes to change with age or in time. I think possibly the hormones will kick in and I'll really want to. I don't know. It's like an expectation of life that people end up having kids. (Woman aged 30, married)
I might change my attitudes and opinions when I get older. (Man aged 26, single)
My circumstances may change; I might become stable in a relationship. I may want to have a child with a future partner. (Woman aged 30, single)
It is not that I don't want to have children, just that at the moment my situation is not child-friendly. It may change or it may not change; my lifestyle is open to change. (Man aged 28, single)
Chances are I might end up changing my mind. Depending on relationship chances I might change my mind about having children. I guess it just depends on what happens, if I meet someone and things are right you never know! (Woman aged 22, single)
Partner's wishes
It comes down to my partner. She has never had children before and she may want to have one, so it's quite possible. I think therefore we would talk about it. (Man aged 30, in a committed relationship but not living with partner)
Because I love my husband, and I know how much he wants a boy so I guess we would try one more time. (Woman aged 20, married)
I only have a one year old and do not want to go through the infant stage again with another child, but my partner would like to try for a boy (Woman aged 30, married)
Financial and work-related issues
It's not really that I don't want to have a child - it's whether the timing is right or not financially for me because at present I'm not working, so I wouldn't consider it now. (Man, 32, single)
If my current situation improved in terms of financial stability, I would re-evaluate my willingness to father a child or children. (Man aged 21, single)
I just want to get a job first, and do study before I think about having another child. (Woman aged 25, cohabiting)
6.4.4 Reasons for expecting to have more children than considered ideal
Unlike the respondents who expected to have fewer children than they ideally wanted, a number of those who indicated that they had, or would have, more children than they considered ideal often referred to their partner's wishes, to children's issues, and/or existing family issues. Financial and work-related issues along with lifestyle issues received relatively little mention.
Partner's wishes
Because my partner is so keen on having kids. (Man aged 20, cohabiting)
It is (partner's) choice. But we have agreed upon it. It is something we have talked about extensively. (Man aged 26, married)
I guess I'm not really that strongly opinionated when it comes to family size, so I expect to have as many as (partner) wants because she feels a lot more strongly about it than I do and her ideal family size is three. (Man, aged 34, in a committed relationship but not living together)
Because (partner) would like to have more children. He would like to have four. (Woman, age 21, in a committed relationship but not living together)
Subsequent children provide company for first child
If you only have one it's a little selfish as the child is brought up on its own without siblings. (Woman aged 24, cohabiting)
Because (partner) has more of a convincing argument, and also for the benefit of the first child. (Man aged 24, cohabiting)
To have a gender mix of children
Because I would really like to have a little girl as well as the little boy I already have. If I had another child and it was a boy I suspect we might try again so I could have a little girl as well. (Woman aged 35, married)
Because my partner would probably want more, and I would like to have a boy and a girl and if that didn't happen I would keep going. (Woman aged 27, cohabiting)
In summary, financial and work-related reasons seemed to be a more common issue amongst those who believed they would not reach their ideal family size, than those who believed they had or would have more children than they wanted. Age, fecundity and other health problems were commonly mentioned by those who expected to have fewer children than desired, including those who did not expect any (more) children. Finally, amongst respondents who did not want children but expected they might do so, there was a common sense that they may change their preferences with age or with changing circumstances. Such comments highlight the fact that fertility decision-making often changes with time - but some of the comments of those who did not expect to achieve their ideal family size highlight the fact that time may well run out before any change of heart can be accommodated.
Like the socio-demographic analysis, partnership issues were clearly important in all four scenarios. Lack of a partner was seen as a barrier to having children, and some who did not want (more) children believed that they might change their mind if they found a suitable partner. However, the partner's wishes were often seen as a reason for a mismatch between ideals and expectations, highlighting the fact that having children is a couple decision rather than personal decision, where one partner may be prepared to submit to the wishes of the other partner. Possible gender effects in the contribution of one partner's aspirations on the other's expectations are explored in the next section.
6.5 Links between each partner's aspirations and expectations
Much of the research into fertility decision-making has failed to take into account couple dynamics. However, as might be expected, there is some evidence to suggest that, when couples disagree about having children, intentions tend to shift towards not having a child (Thomson 1997a, 1997b). To what extent did couples in the current study share the same expectations about the total number of children they would have?
While some partners would have already had a different number of children each, 5 per cent shared the expectation that they would not have children, and 71 per cent nominated the same number of children. Nearly two thirds of these couples (64%), expected two children and more than one quarter (28%) expected three.
For the same proportions of couples, the female partner expected more children than the male partner (9%) and the male partner expected more children than the female partner (9%). In most of these cases of disagreement, one of the partners expected two children and the other expected three.
This level of agreement regarding expectations is higher than that regarding aspirations: in only 2% of couples, both partners viewed no children as their ideal, while in 64% of couples, both partners wanted the same number of children. Like the patterns for expectations, most of these couples wanted two children (61%) and a substantial proportion wanted three (31%).
To what extent do the aspirations of one partner influence the other partner's expectations? Which partner (male or female) is likely to have the stronger influence? Partial correlations were applied to the data to address this question. With this approach, the correlation between two sets of variables is derived after removing the effect of a third variable. Here the five-point rating scales were used as interval data, ranging from "definitely want" a child to "definitely do not want" a child, and from "very likely" to have a child to "very unlikely" to do so. The four sets of partial correlations derived are presented in Table 6.1.
The coefficient of 0.51 refers to the correlation between the female partner's personal aspirations and her personal expectations about having a child. This is the strongest of all correlations. The second strongest is that between the male partner's personal aspirations and his personal expectations (0.45), while the third strongest is that between "her" aspirations and "his" expectations (0.23). This is quite weak, for it suggests that only five per cent of the variance in his expectations is predictable from the variance in "her" aspirations. The correlation between "his" aspirations and "her" expectations is the weakest (0.14).
| Her expectations | His expectations | |
|---|---|---|
| Her aspirations | 0.51 | 0.23 |
| His aspirations | 0.14 | 0.45 |
If these correlations imply causal connections between variables, then it would appear that, while personal aspirations have the strongest impact on personal expectations for each partner, "her" aspirations may be playing some role in explaining "his" expectations, albeit minor according to this analysis, while "his aspirations" play an even lesser role in explaining "her" expectations.
However, for many couples, a great deal of influence between partners is likely to have occurred in the past, not only in terms of expectations, but also in terms of aspirations. Longitudinal studies and in-depth qualitative approaches represent more appropriate means of assessing the influence of one partner's views (both preferences and expectations) on those of the other partner.
Consistent with the general direction of trends suggested by the correlations, Figure 6.8 suggests that, when each partner wants a child, then not surprisingly, each is particularly likely to expect such a child (91% of men; 86% of women). When one partner does not want a child or is quite uncertain about this, then the other partner is less likely than otherwise to expect a child.
Figure 6.8: Congruence between respondent's and partner's fertility expectations20
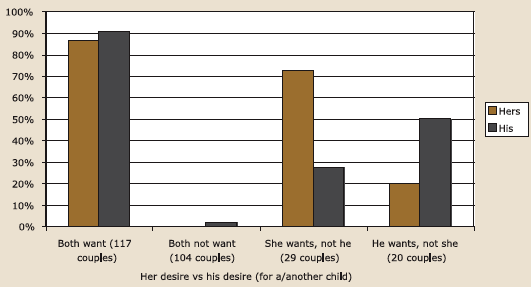
As Thomson (1997a, 1997b) concluded from her USA research on fertility desires and intentions, it appears that a partner's negative views "dampen" the expectations of the other partner. This "dampening" effect appears to be more the case when it is the female partner who is against having, or feels quite uncertain about having, a child (where 50% of the men and 20% of the women expect a child). Where the male partner alone feels negative or quite unsure about having a child, then 28 per cent of the men and 72 per cent of the women expect to have a child).
However, it should also be noted that disagreement also appeared to raise the expectations of having a child of the partner who did not want or was unsure about having a child - an effect that seemed slightly stronger for men than women. This effect, which is also apparent in explanations provided by respondents for expecting more children than they considered ideal, tends to be ignored in the literature.
While the numbers of couples in "disagreement" are very small, the results are consistent with the partial correlation analysis and with similar analysis conducted by Qu and Weston (2003) of data from the Household, Income and Labour Dynamics in Australia (HILDA) Survey.21 It appears that, while each partner's views play an important role in expectations, it is the female partner's aspirations that typically carry the greater weight.
6.6 Summary and conclusions
This chapter examined the level of consistency between expectations and preferences or personal ideals. Issues examined covered: (a) the fertility desires compared with expectations reported by those without children; (b) the extent to which the gap between averages derived for ideal, expected and achieved family size narrows with advancing age, (c) ways in which the prevalence of a match between ideals and expectations varies across different socio-demographic groups, (d) reasons offered by respondents for their perceived mismatch between ideals and expectations, and (e) links between the aspirations and expectations of each partner in couples. Key results and comments on them are summarised below.
6.6.1 Fertility desires versus expectations of those without children.
While more women than men believed that they were "very likely" to achieve this ambition, expectations declined with age, particularly between the early and late thirties. In fact, only a minority of women in their late thirties, and just over half the men of this age, who wanted children believed they would achieve their ambition. Similar patterns in expectations occurred for parents who wanted another child. Such trends highlight the fact that the decline in the fertility rate is by no means a rejection of family life.
6.6.2 Family size ideals, expectations and current achievements: a comparison of derived averages
The second section compared the averages (means) that were derived for ideal number of children, expected number of children, and actual (achieved) number of children. The averages for ideal number of children were similar across all age groups, were above the replacement level of 2.1 children per woman, and tended to be slightly higher for women than men. The averages for the expected number of children were also similar across age groups but were consistently lower than those for ideal number of children. Women, on average, expected a slightly larger family than men, and women's expectations were, on average, close to the replacement level of 2.1, while those of men were close to Australia's actual total fertility rate (1.75 in 2002). Thus, while the gap between expectations and achievements narrowed significantly with age, expectations remained lower than achievements. Similar average expectations and ideals across age may mask a great deal of change in these cognitions. For instance, the ideals and expectations of the oldest cohort may have been higher when they were younger. Indeed, retrospective data reported in Chapter 4 suggests that preferred family size is more likely to fall rather than rise as people age. This is consistent with a number of other Australian and overseas studies (see McDonald 2002).
6.6.3 Prevalence of match between expectations across socio-demographic groups
Most respondents believed that they had already achieved, or would achieve, the number of children they considered to be personally ideal, although some of these people may have modified their ambitions to fit their circumstances. Most of the remaining respondents who experienced a mismatch between ideals and expectations felt that they would have fewer children than they wanted. The analysis examined the extent of match across the four age groups of men and women (taken separately), and the extent of match across relationship status, education and employment status for men and women in their twenties and thirties (again, taken separately).
Patterns for age
For the sample as a whole, the proportions of men and women indicating that they had either achieved or expected to achieve their ideal family size did not vary significantly with age. However, for childless women in particular, expectations of achieving their ideal family size declined with advancing age, while expectations of under-achieving this ideal increased. In fact, a higher proportion of childless women in their late thirties appeared to believe they would under-achieve rather than achieve their ideal family size. The general direction of trends for men without children also suggested increasing pessimism with advancing age, but this pattern of results did not quite reach the conventional level of statistical significance.
Relationship status patterns
Expectations about the achievement of ideals were strongly related to relationship status for men and women in both age groups (those in their twenties and thirties). In general, married men and women were the most likely to believe that they already had or would achieve their ideals, while single women were the least likely to feel this way. This is consistent with the fact that most couples wait until they are married before they have children. Single respondents are more likely than cohabiting respondents to consider this to be a remote chance, for it appears that many couples in cohabiting relationships expect to marry (Qu 2003).
Education level patterns
The proportions who had achieved, or expected to achieve, their ideal family size did not vary significantly across the three educational status groups for men and women (taken separately). However, significant trends emerged for men when the data for all those with some sort of postschool qualification were combined. These men were significantly more likely to indicate that they either had achieved or expected to achieve their ideal family size. While these results seem to be consistent with the arguments put forward by Birrell et al. (2004) regarding the difficulties men with limited human capital have in establishing families, Chapter 3 showed that the men most likely to have at least one child were those with no post-school qualifications. Men without post-school qualifications were also the least likely of all men to have a partner. It may therefore be that some of these fathers wanted more children but had lost the opportunities for doing so.
Employment status patterns
The extent of match between ideals and expectations varied significantly with employment status for those in their thirties - but in contrasting ways for men and women. Firstly, men working full-time were the most likely of all men to expect that they would have the number of children they considered ideal and the least likely of all men to expect that they would have fewer than they considered ideal. For the most part, these men would have been in relatively better financial positions to achieve their ambitions than the other men.
Interestingly, men who worked part-time were even less likely than men who had no paid work to expect that they would have fewer children than they considered ideal. In fact, more men in the former group seemed to be "pessimistic" (that is, they felt they would have fewer than they considered ideal) rather than "optimistic" about achieving their ideals - a situation that was unusual in these various sets of analyses.
Unlike their male counterparts, women in their thirties who were working full-time were the least likely of all women of this age to believe that they would achieve their ideals, and the most likely to believe that they would have fewer children than they ideally wanted. Those most likely to feel they had achieved, or would achieve, their ideal family size were those who were not in paid work.
Such trends are not surprising. Firstly, women who were not in paid work were likely to be caring for the child or children they hoped to have. Secondly, a financial need for, or competing desire to pursue, full-time work may be seen as a barrier to achieving fertility ambitions. Difficulties in gaining access to high quality and affordable child care, along with difficulties in balancing work and family life, may well enter into these considerations. On the other hand, some women would have been in full-time paid work because they had no family-related reasons for giving up such work. They may lack a partner, their partner may not want any (more) children, they may have health problems, or they may have found a partner too late in life to be able to have children.
In an attempt to throw further light on the reasons underlying any mismatch between ideals and expectations, respondents were asked to provide explanations for any perceived mismatch.
6.6.4 Perceived reasons for a mismatch between ideals and expectations
Those expecting to have fewer children than they wanted tended to focus mainly on practical barriers including age, fecundity and other health problems, lack of a partner, partner's wishes, and financial or work-related issues. Some felt they were already too old, or would be too old by the time they found a suitable partner, while others felt they were too young to be considering having a family - their circumstances or competing needs operated as a barrier, although they acknowledged that these aspects of their lives may change.
Similarly, those not wanting, but nonetheless expecting, to have a first or another child often considered that they might change their minds with changing circumstances or increasing maturity. A change of mind was variously contingent on such factors as improvements in financial or work-related issues and changes in partner's views or in personal priorities. In addition, some respondents who expected they would have more children than they wanted referred to their current family structure: the desire for a gender mix of children and the desire to provide company for their only child. Such comments highlight the way in which competing personal goals can pose constraints on the achievement of fertility aspirations.
Thus, as suggested in the socio-demographic analyses undertaken, partnership issues were clearly important. Difficulties in finding a partner often seemed to be a primary factor for those not currently in a relationship, while for others who were in a relationship the partner's views were often considered important. This highlights the fact that fertility decision-making needs to be understood as decision-making of couples. The final issue examined, then, involved analysis of data on couples.
6.6.5 Links between each partner's aspirations and expectations
Analysis of the links between each partner's aspirations and expectations suggested that the most common response was that both partners either agreed in wanting children or agreed in not wanting (or at least feeling unsure about having) children. Where there was disagreement, a "dampening" effect appeared to occur for the partner who wanted children and an "elevating" effect appeared to occur for the partner who was at best unsure about having a child. At the same time, there was evidence that it was the female partner's aspirations that carried the greater weight.
In short, this chapter suggests that the vast majority of respondents wanted children, their ideal family size tended to be above the "replacement level" of 2.1 children per woman, but average family size expectations fell considerably short of this level. Nevertheless, most men and women expected to achieve their ideal family size, but those who did not were more likely to expect to under-achieve than over-achieve their ambition. Delays in having children meant that significant numbers were missing out on having the number of children they ideally wanted. These delays were often linked with partnering issues, education level (for men), and paid work status. Men with limited "human capital" as measured by education and weekly hours of paid work appeared to be more pessimistic than other men, but women working full-time were more likely to indicate pessimism than other women.
The next chapter focuses more closely on the issues that men and women consider important in making decisions of whether or not to have a child. These issues include perceived costs and benefits of having children.
17. While it is noteworthy that women in their late thirties had more children than Australia's current TFR (1.75), it should be borne in mind that the TFR is based on the number of live births for different age groups of women per 1000 women of the same age in the population. Thus, the TFR takes into account births across all childbearing ages. In the current samples, the average numbers of children men and women had were 0.60 and 1.14 respectively. These averages, however, do not take into account the different numbers of respondents in each age group. The average of the averages for each age group is 0.62 for men and 1.09 for women.
18. p<.10 for men and p<.001 for women.
19. It is not possible to assess whether one of these alternatives is the more likely, for some of those who wanted more children than they expected may have voluntarily decided not to have such children (the first alternative mentioned above); others may not have been able to find a partner; and of those with partners, some may have found their partners were reluctant to have a first or additional child.
20. Those expecting to have a child represent those who indicated that it was "likely" or "very likely" that they would have a child. Those "wanting" to have a child represent those who indicated that "definitely" or "sort of want". Those "not wanting" to have a child represent those who "definitely" or "sort of" did not want a child.
21. The HILDA survey is an indefinite life household panel survey funded by the Australian Government, through the Department of Family and Community Services. The survey is being designed and managed by a consortium led by the Melbourne Institute of Applied Economic and Social Research University of Melbourne). Other partners are the Australian Council for Educational Research and the Australian Institute of Family Studies.
7. Issues influencing fertility decisions
As noted in Chapter 1, fertility behaviour is likely to be an outcome of a wide range of life course, social and psychological forces. The present chapter focuses on the extent to which forces that have been proposed as key explanations for fertility trends, outlined in Chapter 1, are translated into issues that are seen as important by individuals in the process of deciding whether or not to start a family or have another child.
One set of explanations for the fall in fertility concerns the increasing age at which women attempt to start a family, and the consequent abbreviation of their potential child bearing period and heightened risk of childlessness. Such postponement of childbearing results from several other factors including delays in leaving home, forming partnerships and marrying. In addition, partnership rates have declined across all ages. Chapter 1 outlined several interacting forces that have been suggested as major drivers of these trends. The present chapter examines the extent to which such forces are reflected in the conscious considerations that enter into the decisions about having, or not having, children.
Delays in achieving the typical milestones that precede having children have been explained partly in terms of trends in the labour market and the economy. For example, McDonald (2001b) argues that the cycle of economic "booms and busts" and the concomitant rise in job insecurity and uncertainties about housing costs have led young people to prioritise investing in their education and career development and couples to remain dual earners as a hedge against dual unemployment. This focus on promoting employment and/or economic security has also been linked with the direct and indirect financial costs of raising children. Consistent with these explanations, Chapters 4 and 6 showed that some of the respondents in the present study referred to job insecurity, emphasis on career development, and/or financial costs of raising children as reasons for not having children, for revising family size aspirations downward, or for expecting fewer children than desired. On the other hand, new-found job security and financial wellbeing were nominated by some respondents as reasons for revising their family size aspirations upward.
Other costs mentioned both in Chapter 1 and by respondents, as outlined in other chapters, relate to lifestyle issues such as the desire for freedom and independence and the difficulties of parenting. However, Chapter 4 suggests that some individuals may only become aware of how difficult parenting can be after they have a child, while others find parenting a far more enjoyable experience than they had earlier imagined.22
Another set of explanations for the fall in the fertility rate concerns the decline in partnership rates. This decline was apparent across all ages. Consistent with this explanation, previous chapters in this report suggest a strong link between relationship status and fertility, with married individuals in their twenties and thirties being the most likely of all respondents to want, expect and have children. It appears that the decline in partnership rates is linked with both the difficulties in establishing partnerships and in maintaining them. One likely explanation for this, suggested by several authors, is that the formation and continuation of a relationship have become increasingly contingent on the ability of the relationship to meet emotional needs rather than to meet financial or practical needs or to conform to social pressure (see Qu and Soriano 2004). Allied to this issue, one of the legacies of almost three decades of access to no-fault divorce is an increasing awareness of the potential fragility of relationships (Parker 2002) and of the pain caused to children when their parents' relationship breaks down. These considerations, along with the impact of children on the couple's relationship, may have an important role in decisions about having children.
These are but a few of the considerations examined in this chapter. Others include issues surrounding the means of combining work with family life, the age of each partner, lifestyle matters, affective incentives for having children, and family composition. As outlined in previous chapters, all these considerations have been variously mentioned by respondents as reasons behind their fertility aspirations or expectations. However, these reasons were derived from open-ended questions. The present chapter delves more systematically into the importance respondents attached to a set of considerations that may enter into decisions about having or not having children. The chapter begins by identifying the items that were most commonly considered to be important by men and women. It then examines the patterns of similarities and differences in views on these issues according to age, parental status, relationship status, education level, and employment status.
| Men % | Women % | Men Rank | Women Rank | |
|---|---|---|---|---|
| Afford support child | 65 | 67 | 1 | 1 |
| Female partner makes a good parent | 65 | 58 | 1 | 3 |
| Male partner makes a good parent | 63 | 60 | 3 | 2 |
| Having someone to love | 57 | 46 | 4 | 7 |
| Male partner's job security | 53 | 57 | 5 | 4 |
| Female partner's age | 49 | 56 | 6 | 5 |
| Uncertain that relationship will last | 47 | 47 | 7 | 6 |
| Add purpose/meaning to life | 45 | 39 | 8 | 11 |
| Male partner's age | 42 | 42 | 9 | 9 |
| Male partner established in job/career | 41 | 37 | 10 | 13 |
| Giving child(ren) a brother/sister | 40 | 37 | 11 | 13 |
| Finding good affordable child care | 40 | 46 | 11 | 7 |
| Child would make partner happier | 37 | 23 | 13 | 23 |
| Female partner's job security | 34 | 38 | 14 | 12 |
| Child would be good for relationship | 32 | 27 | 15 | 19 |
| Ability to buy/renovate/move home | 32 | 30 | 15 | 17 |
| Time/energy for male partner's career | 30 | 40 | 17 | 10 |
| Suitable world for children | 30 | 29 | 17 | 18 |
| Female partner established in job/career | 29 | 37 | 19 | 13 |
| Time for leisure & social activities | 27 | 24 | 20 | 21 |
| Time/energy for female partner's career | 26 | 24 | 21 | 21 |
| Stress & worry of raising child | 24 | 34 | 22 | 16 |
| Have at least one/another boy | 23 | 12 | 23 | 28 |
| Ability to make major purchases | 22 | 22 | 24 | 24 |
| Too much stress on relationship | 22 | 26 | 24 | 20 |
| Other children would miss out | 19 | 22 | 26 | 24 |
| Have at least one/another girl | 18 | 16 | 27 | 26 |
| Child difficult to raise | 11 | 15 | 28 | 27 |
7.1. Factors important when considering whether to have or not have a child
A set of 28 items was constructed to tap into the main themes discussed in the fertility literature as contributing to the choices and decisions individuals and couples make about having and not having children. For each item, respondents were asked to indicate, on a scale of 0 to 10, how important each factor was when thinking about having or not having a child. High scores (8-10) indicated that the factor was considered to be particularly important to the respondent. The different sets of analysis below focus on the proportions of respondents who attach this level of importance to the various item.23
7.1.1 Men versus women
Table 7.1 sets out the 28 items contained in the survey and lists them from "most important" to "least important" according to the proportion of men who provided ratings of 8 to 10 on the various items. The proportion of women who provided such ratings is also shown. In order to highlight gender similarities and differences, this set of results is depicted in Figure 7.1. Whilst the rankings of men and women across the 28 items were broadly similar, there were notable differences as well.
Figure 7.1. Percentage of respondents rating item as important: men vs women
Of all items, the seven that were most commonly seen as important by men and women were the same, although the precise rank order of these items was not necessarily the same. However, the top three items were identical for men and women. These were whether they could afford to support a child (considered important by around two thirds of men and women), and whether the male and female partners would be good parents (considered important by 58 to 65 per cent). All three of these considerations relate to the overall ability to provide support to the child, either financially or in terms of quality of parenting. For both men and women, the male partner's job security ranked fourth or fifth in Table 7.1, and was rated as important by 53 per cent of men and 57 per cent of women. "Having someone to love" was considered important by 57 per cent of men and 46 per cent of women, and ranked fourth for men and seventh for women.
The largest gender difference emerged for the item concerning whether a child would make the partner happy, with more men than women considering this to be important (37% vs 23%). This can be interpreted in different ways. For example, men may be more likely than women to discount their own feelings about having children where they perceive their partners' preferences for having children to be particularly strong. Alternatively, this result may reflect a perception by men that women's personal fulfilment is more closely tied to having children than is their own sense of fulfilment.
Also notable was the relatively stronger inclination of women than men to indicate concern about the male partner having the time and energy to put into their career. Forty per cent of women emphasised this issue, compared with 30 per cent of men.
Finally, a higher proportion of women than men saw the stress and worry associated with having a child as important (34% vs 24%), perhaps because women felt they would bear more of the brunt of the difficulties of raising children than would their male partners. On the other hand, a lower proportion of men than women considered having a son to be an important issue in their decision-making (12% vs 23%).
Some other smaller differences between men and women were also interesting and not unexpected. For instance, the female partner's age was more likely to be an issue for women than men (56% compared to 49%). In addition, women were more inclined than men to emphasise access to good affordable child care (46% vs 40%) and the female partner being established in her job/career (37% vs 29%).
7.1.2 Parents versus those without children
Considerable differences emerged between the views of parents and those without children, with most issues being more likely to be emphasised by childless respondents than parents. There are at least two possible explanations for this trend: the experience of parenting may lead people to decide that the issues were not as important as they once thought, and/or those who place less emphasis on such issues may be more inclined than others to become parents. These results are shown in Figures 7.2a and 7.2b.
Figure 7.2a. Percentage of respondents rating items as important: parental status by gender
Figure 7.2b. Percentage of respondents rating items as important: parental status by gender
In several cases, the difference in importance between parents and childless respondents is quite large, including:
- ability to afford to support a child
- uncertainty that the relationship would last
- whether the female partner would make a good parent
- whether the male partner would make a good parent
- whether the male partner was established in his job/career
- the female partner's job security.
In most cases, the difference between fathers and other men was greater than the difference between mothers and other women. The items relating to the "male partner's job security" and the "time/energy for the male partner's career" were less important for fathers than childless men, but not for mothers compared with childless women. Importantly, all of these items concerned parenting, the stability of the relationship, or the security of employment for one or other of the partners.
However, there were a few items that were more likely to be considered important by parents than by those without children. Two of these concerned whether a first or additional child would place "too much stress on the relationship" and whether "other children would miss out" as a result of having another child. In particular, mothers were more likely than childless women to see these issues as important.
Mothers were also more inclined than childless women to view their own age and that of their partner as important. This is not surprising given that parents tended to be older than those without children. However, there was virtually no difference in the proportions of fathers and childless men who considered their own or their partner's age to be important. This may be a reflection of men's propensity to partner younger women. The female partner's age, however, is more critical than the men's age in determining whether or not the couple can have children.
Earlier it was shown that men were more likely than women to attach importance to "whether a child would make their partner happy" (men: 37%; women: 23%) and "having someone to love" (men: 57%; women: 46%). This difference is primarily driven by childless men, for the views of fathers were similar to those of mothers and childless women.
We also saw earlier that men were more likely than women to see as important "having at least one/another boy" (23% compared to 12%, respectively). Figure 7.2b reveals that fathers were less likely than childless men to express concern about this issue. This may simply reflect the fact that some of the men who were parents would have already had at least one son.
Overall then, parents seemed less inclined than childless respondents to attach importance to many of the considerations listed. This may suggest that the issues may lose their salience when couples become parents and a number of "unknowns" thus become "knowns". On the other hand, these issues may be less important at the outset for those who decide to become parents than for others who have decided against having children or who are delaying parenthood. Both these explanations for the results may apply to some extent.
7.2 Simplifying the issues
Clearly, the issues considered important in fertility decision making varied systematically with gender and parenting status. The extent to which respondents' views varied according to age, education, employment, and relationship status was also examined. In order to facilitate interpretation of these results, the 28 items were first statistically manipulated to form four groups of related items in order to facilitate interpretation of results. The individual components of each group of items are shown in Table 7.2.
| Factor 1: "means of combining work & family" |
|---|
| Whether the partner is sufficiently established in his/her job/career The partner's job security The respondent's job security The partner having sufficient time and energy for his/her career The respondent having sufficient time and energy for his/her career Having access to good quality, affordable child care Whether the respondent is sufficiently well established in his/her job/career. |
| Factor 2: "age, affordability and lifestyle" |
| Ability to make major purchases Stress and worry of having a(nother) child Ability to buy/renovate/move house Time for leisure and social activities Partner's age Whether the child is difficult to raise Respondent's age Ability to afford to support a(nother) child Suitability of this world for raising children. |
| Factor 3: "parenting and couple relationship" |
| Whether the respondent thinks their partner would make a good parent Whether the respondent thinks they themselves would make a good parent Whether a(nother) child would be good for the couple relationship Uncertainty about the stability of the couple relationship Whether a(nother) child would place too much stress on the couple relationship Whether a(nother) child would make the partner happier Whether having another child would reduce the opportunities available to other children. |
| Factor 4: "affective incentives for having children, and family composition" |
| Having at least one boy Having at least one girl Adding purpose and mening to one's life Having someone to love Giving an existing child a sibling. |
The first factor contains 7 items and pertains to issues that might be seen as the means to combine work and family and to invest in "human capital" - items relating to job/career and financial security and being able to access child care. The second factor (9 items) encompasses age, affordability, and lifestyle items, and includes the respondent's and their partner's age, whether they could afford to support a first or additional child, and whether having such a child would interfere with the time available for leisure and social activities. Factor 3 (7 items) relates to the respondents' perceptions of their own and their partner's capacity to be a good parent and the impact of having a child on the couple relationship. The fourth factor (5 items) taps into the affective reasons for having children (such as adding purpose and meaning to life) and family composition (giving a existing child a sibling and having at least one boy or girl).
7.3 Comparisons of other socio-demographic groups
This section first compares the views of respondents regarding the work/family set of items, according to respondents' age, relationship status, education, and employment status. The analysis is then repeated for the other three sets of items (age, affordability and lifestyle; parenting and couple relationship; and affective incentives and family composition).
7.3.1 Work/family items
As noted above, work/family items cover issues relating to the ability to combine work and family life and to invest in "human capital". Some of the differences in the proportions of younger respondents (aged 20-29) and older respondents (aged 30-39) who attached importance to particular issues were quite marked (Figure 7.3a). In all cases, younger respondents were more likely than older respondents to emphasise these matters. A higher proportion of younger than older men and women attached importance to the security of the male partner's job (men: 61% vs 44%; women: 64% vs 52%), the male partner being established in his career (men: 50% vs 32%; women: 45% vs 31%), the female partner's job security (42% vs 25%; women: 48% vs 30%), and the female partner being established in her career (men: 36% vs 22%; women: 37% vs 22%). Younger men were also more likely than older men to regard as important the time and energy available for their own career (38% vs 23%) and for their partner's career (33% vs 20%).
Figure 7.3a: Work/family items: per cent rating as important by age and gender
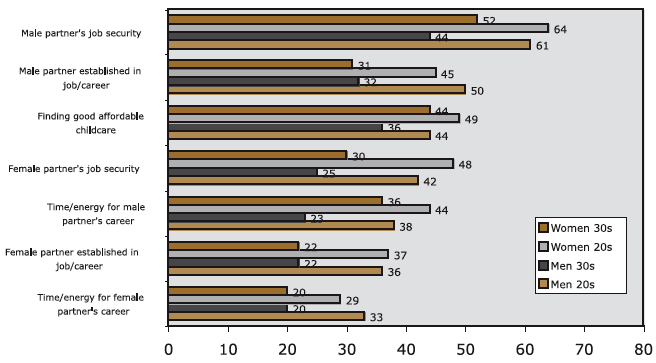
The importance attached to work and family items also tended to vary according to relationship status (Figure 7.3b). In general, married respondents were less likely than other respondents to regard these various issues as important. Compared with cohabiting and single respondents, a lower proportion of married men and women attached importance to the male partner being established in his (men: 28% vs 46%-47%; women: 32% vs 42%), the security of the female partner's job (men: 24% vs 35%-38%; women: 30% vs 40-47%), the female partner being established in her career (men: 22% vs 31%-33%; women: 22% vs 32%-35%), and the time and energy available for the female partner's career (men: 20% vs 29%-31%; women: 19% vs 27%-30%). Married men were also less likely than other men to regard their own job security (40% vs 58%-59%) and the time and energy available for their career (23% vs 33%-34%) as important.
Figure 7.3b: Work/family items: per cent rating as important by relationship status and gender
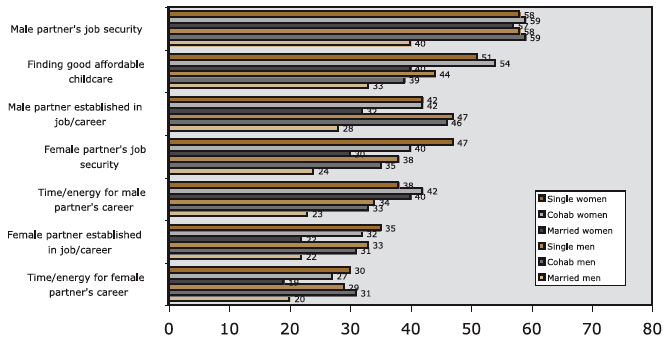
Differences were apparent across the range of educational qualifications held by respondents (Figure 7.3c). For men, the greatest differences in views emerged for those without post-school qualifications and those with or pursuing a degree or higher qualification. Higher proportion of the former than latter group emphasised the security of their own job (58% vs 44%), their being established in their career (46% vs 36%), finding good affordable child care (45% vs 34%), and the security of their partner's job (40% vs 24%). Women's responses tended to be rather more similar across the categories of qualifications, although women with or pursuing tertiary qualifications were the least likely of the three groups to attach importance to the security of their partner's job (54% vs 58%-62%), his being established in his career (33% vs 40% respectively), and the time and energy he had available for his career (35% vs 42%-44%).
Figure 7.3c: Work/family items: per cent rating as important by education and gender
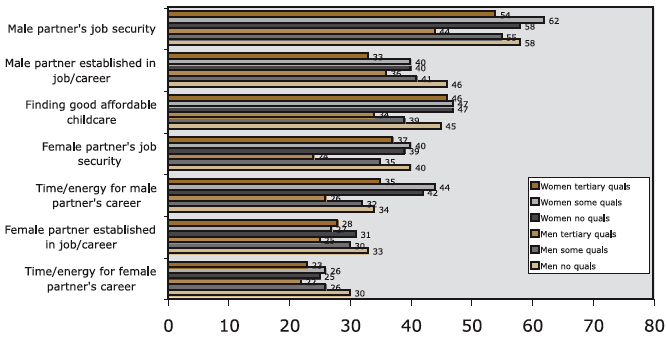
Men in part-time employment responded rather differently to this group of items compared with other men, especially those working full-time (Figure 7.3d) - a trend that may result from the relatively young age of most of the men with part-time paid work.24 A higher proportion of men working part-time than full-time considered as important their being established in their career (50% vs 38%), their partner's job security (42% vs 30%), and the time and energy that the men had for their career (42% vs 28%), and the time and energy their partner had available for a career (34% vs 24%). The patterns for women were more uniform than those for men, with the exception that women working full-time were more likely than other women to attach importance to finding good affordable child care (53% vs 43%).
Figure 7.3d: Work/family items: per cent rating as important by employment status and gender
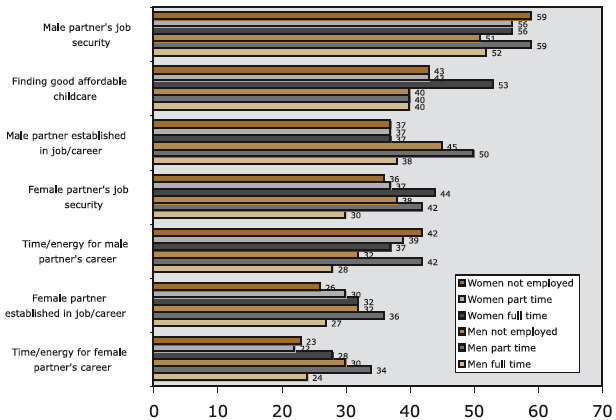
7.3.2 Age, affordability, & lifestyle items
With respect to age, affordability, and lifestyle issues, the largest differences between younger (aged 20-29) and older (aged 30-39) men and women emerged for items relating to the ability to afford to support a child and the ability to buy/renovate or move home, with younger respondents being more likely than older respondents to emphasise these issues (Figure 7.3e). The ability to support a child was emphasised by 76 per cent and 55 per cent of younger and older men respectively, and by 74 per cent and 62 per cent of younger and older women respectively, while the ability to buy/renovate or move home was emphasised by 38 per cent and 26 per cent of younger and older men respectively and by 36 per cent and 25 per cent of younger and older women respectively. In addition, men aged in their twenties were more likely than older men to consider their own age to be an important issue (47% vs 38%). In contrast, similar proportions of younger and older men rated the female partner's age as important (51% vs 47%). As would be expected, women in their thirties were more likely to see their own age as an important factor in decisions about having children than women in their twenties (61% vs 49%). Possibly, younger men were focusing on whether or not they were old enough to start a family, while older women were focusing on whether or not they were too old to have a first or additional child.
Figure 7.3e: Age, affordability, and lifestyle items: per cent rating as important by age and gender
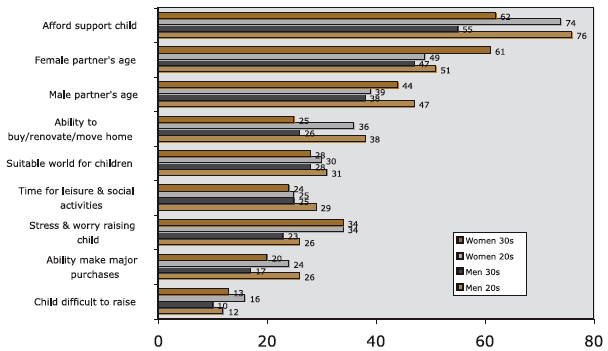
Single and cohabiting men were more likely than married men to consider as important issues relating to financial and material living standards, including housing, and lifestyle (Figure 7.3f p. 137). More than two thirds of single (71%) and cohabiting (67%) men rated being able to afford to support a child as important, compared to just over half of the married men (55%). Single and cohabiting men were also more likely to regard as important the ability to buy/renovate or move house in comparison to married men (35% and 37% vs 23% respectively). The ability to make major purchases was also more commonly an important factor for single (24%) and cohabiting (27%) men compared to those who were married (16%).
Fairly similar proportions of married, cohabiting and single women tended to consider affordability and lifestyle issues important. However, just over half of the single and cohabiting women attached importance to their own age compared to 61 per cent of married women. In addition, a lower proportion of single and cohabiting women than married women emphasised their partner's age (37%-38% vs 47%).
Views about the importance of age, affordability and lifestyle issues did not vary greatly according to educational qualifications (Figure 7.3g). A notable difference was found between men with no qualifications and those with or pursuing tertiary or other qualifications with respect to the ability to buy/renovate or move home, with 39 per cent of men without post-school qualifications attaching importance to this item compared to men with or pursuing tertiary qualifications (26%) or other (29%) qualifications. With respect to the world being a suitable place to bring up children, only 21 per cent of men with or pursuing tertiary qualifications regarded this as important compared to 33 per cent of men with other post-school qualifications and 34 per cent of men without post-school qualifications.
Figure 7.3f: Age, affordability, and lifestyle items: per cent rating as important by relationship status and gender
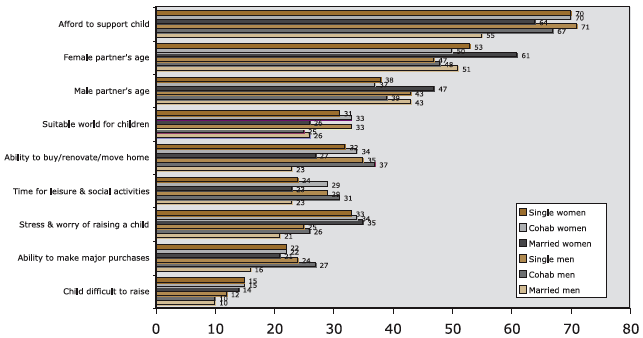
Of interest was the finding that over half of the tertiary-educated men (54%) rated the female partner's age as important, compared to 45 to 46 per cent of other men. Partner's age was also an issue for tertiary-educated women, with 48 per cent rating this issue as important compared to 36 per cent of those without post-school qualifications. On the other hand, the importance attached to personal age varied little across the educational status groups (men: 39%-43%; women: 55%-58%).
Figure 7.3g: Age, affordability, and lifestyle items: per cent rating as important by education and gender
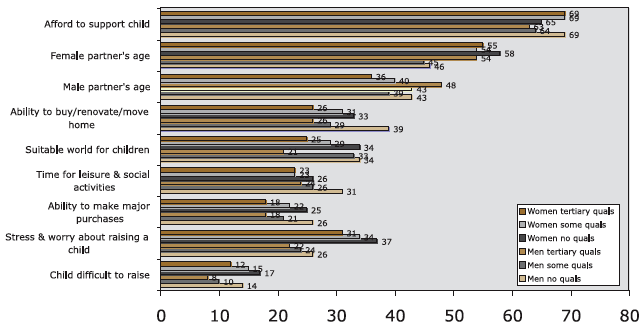
Views about these issues tended to be fairly consistent across employment status groups, although a few slight differences were apparent (Figure 7.3h). The ability to afford to support a child was of concern to almost three quarters of men (71%) in part-time employment but to less than two thirds of unemployed men (62%). The ability to buy/renovate or move to another home was emphasised by 39 per cent of men working part-time compared to 30 per cent of those working full-time. Nearly three quarters of women in full-time work (72%) attached importance to the ability to afford to support a child, compared to 64 per cent of unemployed women.
Figure 7.3h: Age, affordability, and lifestyle items: per cent rating as important by employment status and gender
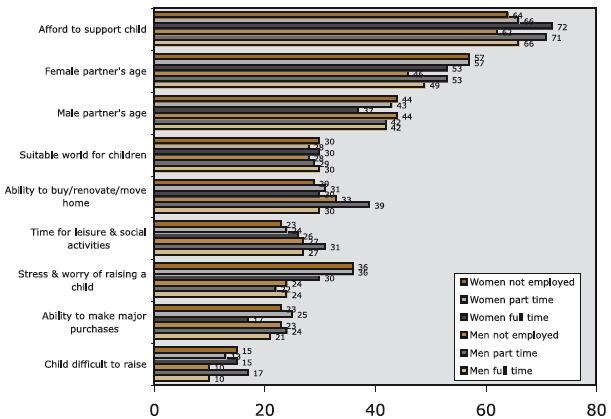
7.3.3 Parenting/couple items
Differences between respondents in their twenties and thirties were most notable for items concerned with whether respondents or their partners would be good parents (Figure 7.3i). Younger men and women were more likely than their older counterparts to regard as important the capacity of men to be a good parent (men: 69% vs 57%; women: 64% vs 56%), as well as the capacity for women to be a good parent (men: 72% vs 59%; women: 63% vs 54%). Whether the child would be good for the relationship was also regarded as important by more men in their twenties (38%) than men in their thirties (26%).
Married men (57%) were less likely than both cohabiting (67%) and single men (70%) to consider the capacity for the female partner to be a good parent as important (Figure 7.3j). In relation to their own capacity to parent, a similar pattern emerged: 54 per cent of married men attached importance to this compared to 64 per cent of cohabiting men and 68 per cent of single men. For women also, the greatest difference emerged between those who were married and those who were single, with married women reporting less concern about the parenting capacities of either partner. Just over half of the married women (53%) and 64 per cent of the single women regarded their own capacity to parent as important, while with 53 per cent of married women and 67 per cent of single women emphasised to the capacity of the male partner to be a good parent.
Both married men and women were also considerably less likely to attach importance to relationship stability than were cohabiting or single men and women (men: 34% vs 50% and 54% respectively; women: 37% vs 45% and 59% respectively). Married and single men also differed with respect to whether a child would make their partner happier (29% of married vs 41% of single men) and whether a child would be good for the couple relationship (25% of married vs 37% of single men). The other items reflecting concern for parenting and couple relationship issues were emphasised by similar proportions of married, cohabiting and single respondents.
Figure 7.3i: Parenting and couple items: per cent rating as important by age and gender

Figure 7.3j: Parenting and couple items: per cent rating as important by relationship and gender

Few notable differences were found across categories of education (Figure 7.3k). The biggest difference occurred between men with no qualifications (52%) and men with or pursuing tertiary qualifications (42%) with respect to uncertainty that the relationship will last. Slightly smaller differences point to tertiary-qualified men being less likely to have concerns regarding their own or their partner's capacity to parent and the stability of the relationship.
Figure 7.3k: Parenting and couple items: per cent rating as important by education and gender
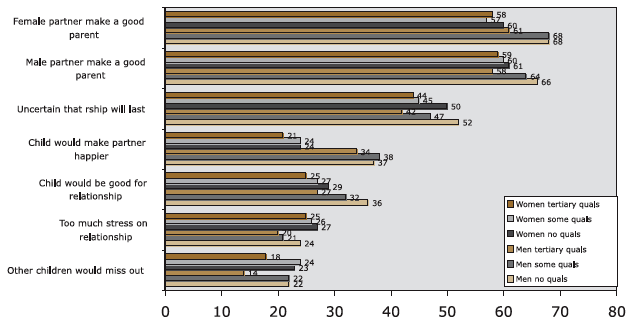
Figure 7.3l: Parenting and couple items: per cent rating as important by employment status and gender
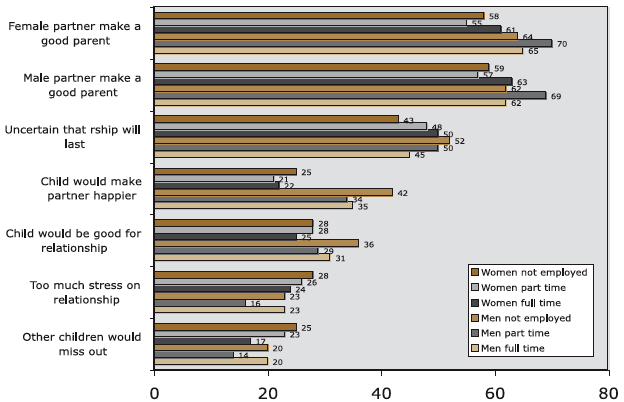
Respondents in the three employment status categories differed little with respect to parenting and couple relationship items, although unemployed men tended to be somewhat more likely to consider important the notion that a child would make their partner happier (42%), compared with men working full- or part-time (34%-35%) (Figure 7.3l).
7.3.4 Affective incentives for having children and family composition items
Figure 7.3m indicates that men and women in their twenties were marginally or considerably more likely than their older counterparts to attach importance to the five issues relating to affective incentives and family composition when thinking about having children. The largest age-related difference emerged for the item "having someone to love". Nearly two thirds of younger men (64%) compared to just over half of the older men (53%) considered this matter to be important, as did 52 per cent of younger women compared to 42 per cent of older women. Younger men and women were also more likely than their older counterparts to attach importance to giving an only child a sibling (men: 44% vs 37%; women: 45% vs 31%). Of all male and female groups, having a son was most likely to be emphasised by men in their twenties (30% vs 10%-16%). Finally, younger respondents were marginally more likely than older respondents to attach importance to having a daughter (men: 22% vs 15%; women: 19% vs 13%).
Figure 7.3m: Affective incentives and family composition items: per cent rating as important by age and gender
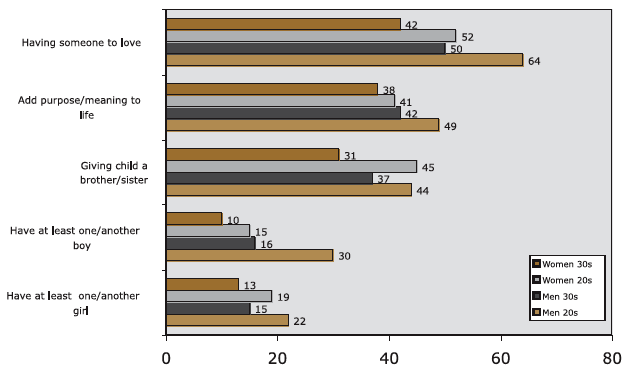
Married men were the least inclined of the three relationship status groups to place emphasis on these various issues, while the views of women in these three groups tended to be fairly similar (Figure 7.3n). The proportions of married and single men differed notably in the importance attached to having someone to love (married 49% vs single 62%) and to the notion that having a child adds purpose and meaning to one's life (married 39% vs single 49%). Fewer married (37%) than cohabiting (47%) men indicated that giving an existing child a sibling would be an important consideration for them. And married men (16%) were less likely than both cohabiting (26%) and single (26%) men to stress the importance of having a son.
Figure 7.3n: Affective incentives and family composition items: per cent rating as important by relationship and gender
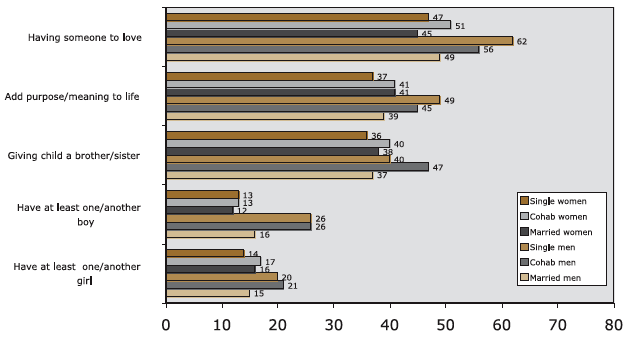
While women's views about these issues were not strongly related to educational status, clear differences emerged for men (Figure 7.3o). Compared with other groups of men, higher proportions of those with or pursuing tertiary qualifications emphasised the various issues in this set. For example, having someone to love was important to only 48 per cent of tertiary-educated men compared with 61 to 63 per cent of other men. Having a son was emphasised by 14 per cent of tertiary-educated men, 20 per cent of men with or pursuing other post-school qualifications, and 31 per cent of the men with no post-school qualifications. Similarly, having a daughter was of concern for 11 per cent of the tertiary-educated group, 16 per cent of those with or pursuing other qualifications, and 25 per cent of those with no post-school qualifications.
Figure 7.3o: Affective incentives and family composition items: per cent rating as important by education and gender
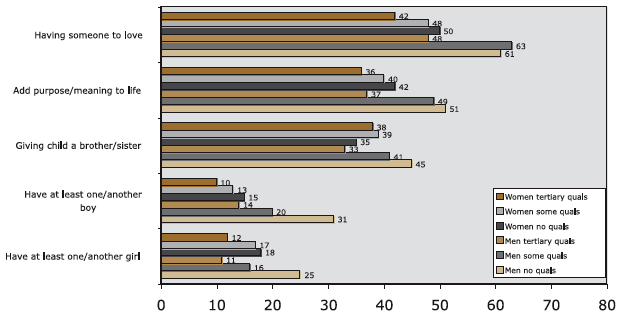
The importance attached to items addressing the affective incentives for having children and the composition of the family varied little across employment status groups (Figure 7.3p).
Figure 7.3p: Affective incentives and family composition items: per cent rating as important by employment status and gender
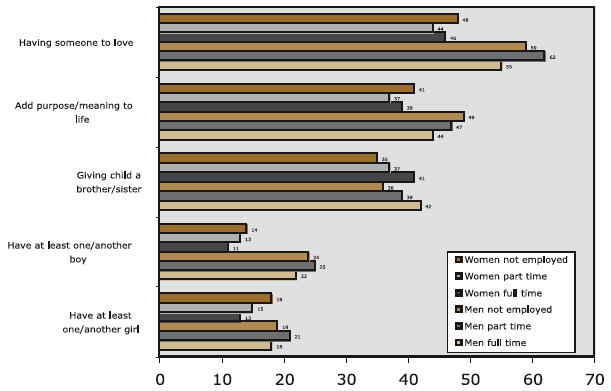
7.4 Conclusions
First, it is noteworthy that respondents emphasised a variety of issues in addition the perceived costs of having children. As Table 7.1 shows, the emotional benefits to respondents were high on the list of issues feeding into the process of deciding about having children. Nevertheless, it is important to note that most respondents emphasised the importance of the ability to support a child. By contrast, only one quarter of men and women emphasised concerns about having time for leisure and social activities, and the ability to make major purchases. Despite some respondents reporting that they felt selfish in not wanting children (Chapter 4), the analysis in Chapter 7 suggests that individualistic concerns were not high on the agenda for the majority of respondents.
Overall, fertility-related issues appeared to be less commonly emphasised by parents than by those without children, by married respondents than by those who were not married, and to a lesser extent, by those with or pursuing tertiary qualifications than by others, especially those with no post-school qualifications. In contrast, men with part-time paid work were more inclined than other men to emphasise these issues. However, men who worked part-time tended to be in their twenties (especially early twenties). While age, parental status, and relationship status are also closely inter-related, it is beyond the scope of this report to identify the relative importance of each of these factors in explaining the results.
The issues that most notably varied with age, for both men and women, were those relating to parenting and the emotional benefits of having children, along with job security and becoming established in a job or career. The latter two issues are key drivers of the capacity to provide adequate housing and financial support - issues that were highlighted as important by most respondents across all the socio-demographic groups examined. Compared with their older counterparts, all of these issues were more likely to be salient to the younger respondents, a lower proportion of whom would have achieved these milestones.
Perhaps because married men and women were more likely than others to have achieved at least some of these milestones, these respondents were less likely than unmarried respondents to emphasise the capacity to parent, relationship stability, employment security, and becoming established in a job or career establishment. Furthermore, married men were less likely than other men to express concern about their capacity to support and house a family, the specific structure of that family, the impact of a first or additional child on the couple relationship, and the emotional rewards of having a child.
These findings may suggest that some of the importance attached to fertility-related issues is entwined with the knowledge that comes from having already started a family and/or having gone some way towards creating the kind of "human capital" that will support a family in the future. Another possible explanation is that those who marry or who become parents and those who pursue tertiary education tend to place less emphasis on these various issues at the outset. However, it should be pointed out that the patterns noted above were typically more apparent for men; for a number of issues, the proportions of women indicating an item was important were similar regardless of their age, parental or relationship status, qualifications or employment situation.
For men without post-school qualifications, employment security of each partner was an important consideration when thinking about having a first or additional child, as was finding good quality affordable child care. On the other hand, men with or pursuing degrees were more likely than those with other qualifications or no post-school qualifications to label one issue as important - their partner's age. In addition, men working part-time (most of whom were in their twenties) were more likely than other men to express concern their employment security, becoming established in a career, and having the time and energy available for a career. Although women who were unemployed or working full- or part-time tended to respond in similar ways to most issues, as would be expected, child care was an issue of concern for women working fulltime.
22. Specifically, Chapter 4 showed that, while some childless respondents who did not want children questioned their capacity to be good parents, some parents who had revised their family size aspirations downwards since they were 20 years old indicated that they had not appreciated how much work was involved in parenting until they had a child. On the other hand, revision of family size aspirations upwards was sometimes linked with far greater than expected enjoyment in having and raising children.
23. In the discussion of results, we describe ratings of 8 to 10 as an indication that the issue in question is "emphasised" or "stressed" or considered "important" by respondents.
24. Chapter 3 showed that men who were working part-time were most likely to be in their early twenties, followed by their late twenties (Table 3.4).
8. Summary and conclusions
Australia's fertility rate has fallen dramatically since the 1960s. It is now at an all-time low and well below replacement level. With the first of the baby boomers turning 60 in 2006, the economic and social challenges of an ageing population loom large. Strategies to meet these challenges are being implemented, including the encouragement of later retirement, changes to superannuation laws, and the promotion of retirement savings.
Unless this decline in fertility is stemmed, however, Australia will face not only an ageing population but also one whose numbers diminish. The search has thus begun for strategies to help stem the decline. Such a search necessarily entails an understanding of the reasons for fertility trends, at both the macro and micro levels.
This report has largely focused on the latter. Within the micro level, the focus was on the aspirations and expectations of men and women in their prime childbearing years (age 20-39 years) and the issues that they considered important when thinking about having children. Particular attention has been given to the ways in which such views on having children vary according to age, gender, parenting status, relationship status, educational level, and employment status.
The aspirations examined included the family size respondents considered to be personally ideal; whether or not they wanted a first or additional child in the future; whether or not those aged 22 or more had changed their family size preferences since they were 20 years old, and reasons for any change; the reasons leading some of the childless respondents to prefer not to have children; and views about the ideal age for the respondents themselves to start, or to have started, a family. Respondents were also asked to indicate how likely it was that they would have a child in the future. Those who thought they would have a child in the future were asked to indicate the year in which they were likely to have this child and the total number of children they were likely to have. Reasons for any mismatches between aspirations and expectations were sought. Respondents were also asked to rate the importance of a number of issues when thinking about having children.
8.1 Aspirations
To the extent this sample is representative of the Australian population, it seems clear that Australians in their primary childbearing years want to have children; "childlessness" was not a popular choice. Indeed, most respondents were either parents or wanted to be parents. While it appears that around one quarter of women who are in their reproductive years will never have children (ABS 2002b), less than 10 per cent of childless men and women in the present survey reported that they did not want children. Even among childless men and women in their late thirties, more than half wanted to have a child.
The small minority who preferred to remain childless tended to offer a combination of reasons for this preference. Consistent with two previous surveys conducted at the Australian Institute of Family Studies (Weston & Qu 2001), these included practical considerations (such as age, partnering status, health and fecundity); partner's views and reproductive history; a dislike of children; work, financial and lifestyle choices; the difficulties of childbearing; concerns about the capacity to be a good parent; the belief that the world is not good for children; and concerns about overpopulation. Some of these obstacles are amenable to policy intervention.
For childless men and women, views about having a child varied significantly with age and relationship status. Although most childless younger respondents in all relationship status groups "definitely" wanted to have a child, married respondents were the most likely to feel this way and single respondents were the least likely to do so. However, even for those in their late thirties, the most common response of single respondents without children was that they "definitely" wanted a child. Few seemed to be definitely against having a child. Lack of a partner thus seems more a barrier to having children than a reflection of any strong desire to avoid family life.
For those in their twenties and thirties (taken separately), childless men and women with or pursuing higher qualifications were as likely, or more likely, as those without any post-school qualifications to definitely want a child in the future. Furthermore, educational status did not appear to be strongly linked with ideal family size either for men or women. Nevertheless, men and women who had or were pursuing a degree or higher qualification were less likely to be parents than their counterparts who neither had nor were pursuing any post-school qualifications. Although men with no post-school qualifications were more likely to be parents, they were less likely to be partnered compared with other men.
Across all ages (early and late twenties and thirties), men and women most commonly indicated that they would ideally like to have two children. While families of at least three children are becoming less common, a family of three children was the second most popular choice of the respondents in this study. Furthermore, around one in five men and women with three children wanted a fourth child. Relatively few respondents wanted one child or no children.
The average family size considered personally ideal was 2.4 children for men and 2.5 children for women - averages that are well above replacement level (2.1). While most of those in their twenties had not yet started a family, there was no indication that men and women of this age currently wanted fewer children than men and women in their thirties. Nevertheless, according to the recollections of respondents aged 22 or more about their family size preferences at age 20, the tendency to have revised their preferences downwards appeared to increase with increasing age.
A preference for two children dominated regardless of relationship status. Nevertheless, unmarried respondents in their late thirties were more likely than married respondents of this age to consider no children or only one child to be ideal for them. However, the cross-sectional design of this study does not allow an assessment of the extent to which this difference in views reflects adjustment to relationship status circumstances or the impact of fertility preferences on relationship status decisions (where those who want larger families are particularly likely to get married and to remain married). Finally, despite the popularity of two-child families, a substantial minority of respondents (especially women) in their thirties who were single, cohabiting or married indicated a preference for four or more children.
Most parents who were against the idea of having another child indicated that they were "definite" in their views. It thus seems likely that any policies that could be introduced in the future to make it easier for parents to have larger family sizes would have little impact on those who are already against such an idea.
8.2 Stability of preferences
Regardless of their current age, most childless men and women aged 22 or more indicated that they wanted children when they were 20 years old and at the time of the survey. Furthermore, family size preferences did not appear to change over time for most men in each age group and most women aged under 35. Nevertheless, as noted above, the proportions indicating a downward revision of family size preferences increased with increasing age and became progressively more common than upward revision.
Interestingly, the reasons for respondents revising their family size aspirations downward and upward often related to the same domains. While financial and work-related reasons were often seen as constraints that led to a downward revision, a few respondents who wanted more children than when they were 20 years old mentioned their improved financial resources or job situation. Perceptions of financial resources were sometime couched in issues related to the desire to give children a good start in life, including educationally. For some, personal values and beliefs about how to maximize children's life chances led to perceptions of financial constraints.
Once again, partnership issues, along with age and fecundity, emerged as reasons for changing family size aspirations. While lack of a partner and relationship breakdown led to revisions downwards, finding a partner and feeling secure in this relationship was often mentioned as a reason for upward revision. And while some of those who were already approaching their forties saw their age and fecundity problems as reasons for downward revisions, upward revision of family size was sometimes explained in terms of having "grown up".
The pressures of parenting sometimes appeared to trigger downward revision while for some, the joys experienced in parenting led them to think about having more children. Clearly, improving access to strategies that help those who are finding the task of parenting a stressful one is important. There also needs to be a change in the way in which parenting is perceived by many of those who are yet to have children. As noted in Chapter 1, parenting has been devalued, while the present project suggests that the positive aspects of having children tend to be overlooked.
8.3 Expectations
Like aspirations, expectations were consistent with the current "two-child family" norm for both men and women. Nevertheless, the proportions of respondents who expected a first or additional child were lower than the proportions indicating that they would like to have such a child. Amongst the childless, those who were the most likely to expect to have a family were married, while those in their thirties without cohabiting or married partners were the least likely to expect to have a family.
Childless men (especially those in their twenties) who neither had nor were pursuing post-school qualifications were significantly less likely than those with or pursuing degrees to expect to have children - a trend that is consistent with the argument that men with limited financial resources are either reluctant to take on the financial responsibilities of parenting or pessimistic about their opportunities for doing so (see Birrell et al. 2004). Nevertheless, a definite desire for a child was expressed by much the same proportions of childless in each of the three educational status groups (over 60 per cent of those in their twenties and close to half of those in their thirties). Interventions that successfully help such men develop their "human capital" potential may well remove an important barrier to marriage and family life.
The total number of children expected varied significantly with the educational level of women but not men. Compared with their counterparts with no qualifications, higher proportions of women who had or were pursuing some form of post-school qualifications expected to have no children and lower proportions expected to have a family of three children.
8.4 Ideals compared with expectations
As noted above, the vast majority of respondents wanted children. But while their ideal family size tended to be above the "replacement level" of 2.1 children per woman, average family size expectations fell considerably short of this level. However, these averages hide the fact that most men and women expected to achieve their ideal family size. The direction of difference in the averages for ideal and expected family size was driven by the fact that a higher proportion of those who reported a mismatch between expectations and ideals indicated that they expected fewer rather than more children than they considered ideal.
One of the key reasons for people expecting to have fewer children than they wanted is the delay in starting a family. Both men and women without partners (especially those in their thirties), and men with limited "human capital", as measured by education and weekly hours of paid work, were less likely than their counterparts to expect to achieve their family size aspirations. Older women in full-time paid work were less likely than other women to expect to have the number of children they ideally wanted.
While most research focuses on individuals rather than couples, the importance of a partner's views or reproductive history featured in some of the explanations for not wanting or expecting children, for revising family size preferences upward or downward, or for expecting more or fewer children than preferred. This highlights the fact that, in most cases, having children is a couple decision - and a decision that is lost to those who feel they have little prospect of finding a partner. In relation to couples, there was some evidence to suggest that the female partner's aspirations about having a child were more influential in shaping the expectations of the male partner than vice versa. However, because this conclusion is based on correlational data and the magnitude of the correlations is quite small, this conclusion is best viewed as an hypothesis.
8.5 Issues rated as important when thinking about having children
The issues that were most likely to be considered particularly important when thinking about having children were the capacity to support a child financially and the capacity of each partner to be good parents. The male partner's job security was also a key issue for most men and women. Other matters rated highly important by close to 50 per cent or more of men and women were having someone to love, the female partner's age, and uncertainty that the relationship will last. By contrast, only one quarter of men and women emphasised concerns that may reflect an emphasis on individualism: having time for leisure and social activities, and the ability to make major purchases.
However, the respondents' views tended to vary according to the various socio-demographic characteristics examined. These characteristics themselves were closely inter-connected. Most particularly, age, marital status, and parenting status interacted. In general respondents without children (who are, of course, more likely to be younger and unmarried) were more prone than those with children to emphasise many of the issues examined - perhaps suggesting that the "unknowns" become less formidable when they become "knowns". On the other hand, it may be that those who become parents are less prone than others to emphasise these concerns at the outset. Both processes may well occur.
The patterns of results suggested the importance of each partner's work and parenting roles as considerations entering decisions about having a child. As noted above, the parenting capacity of each partner and the male partner's job security were clearly important to most respondents. In addition, women were more likely than men to express concern about the male partner's having the time and energy to put into his career and about the stress and worry associated with having a first or additional child. The latter concern in particular may be more commonly an issue for women than men because women are more likely to assume most of the responsibility for the everyday care of the children (see for example Baxter 2002; Bittman 2004; Morehead 2001).
For men without post-school qualifications, employment security was an important consideration when thinking about having a(nother) child, as was finding good affordable child care (an issue that was emphasised by almost half the women regardless of qualifications). More men without qualifications than men with tertiary qualifications rated as important the security of the male partner's job, the male partner being established in his career, finding good affordable child care, and the security of the female partner's job. Women's responses tended to be rather more similar across the categories of qualifications, although fewer tertiary qualified women than women with some or no post-school qualifications had concerns about the male partner being established in his career, or the time and energy available for the male partner's career.
8.6 Other issues to be examined
As noted in Chapter 1, there are many other factors that are not systematically addressed in this report that are likely to be linked with fertility aspirations and expectations. Some have already been mentioned by the respondents, including financial wellbeing, job conditions, and the quality of the relationship with one's partner. These and other issues, such as respondents' confidence in achieving conception through assisted reproductive technologies, will be explored in future research, thereby filling out the picture that is presented in this initial report.
8.7 Final word
This initial report clearly suggests that most Australians in their primary childbearing years either have or want children, with two-child families being the most popular, followed by families of three children. While most respondents expected to achieve their preferred family size, for some this had come about by a downward revision of aspirations to better fit personal circumstances. Furthermore, sizeable numbers did not expect to achieve their aspirations. On average, the family size considered to be ideal by both men and women was higher than replacement level, but also higher than the family size that respondents expected. The proportions of childless respondents who expected to have children were clearly higher than ABS estimations of the proportion of women who will remain childless.
A core set of issues appeared to shape aspirations and expectations. This set was evident in both the quantitative analysis (which identified differences in views across socio-demographic groups) and the qualitative analysis (which elicited from the respondents their reasons underlying their fertility aspirations and expectations). These issues included those that are commonly mentioned in the literature, such as concerns about "human capital" development and maintenance; achievement of an adequate income stream and ongoing secure employment; the perceived difficulties in having the time for both work and family life; and for older respondents, age and fecundity problems. Importantly, this report clearly suggests that people are very concerned about their capacity to be a good parent and to provide the emotional security for their children that comes from a secure relationship, most notably in marriage.
Despite Australia's economic prosperity, people remain concerned about their capacity to create and maintain a family environment in which children can be nurtured and supported financially and emotionally. Such concerns, real or perceived, reflect macro-level trends in economic and employment security and in relationship stability, as well as micro-level concerns about personal capacities to be a good parent. Strategies directed towards helping people achieve their childbearing aspirations need to tackle people's sense of security in each of these three domains. The data presented in this report suggest that these strategies should target forces both at the macro- and micro-levels - for neither level acts in isolation. In short, governments need to use a combination of approaches that is based on the recognition that the low fertility rate is not due to a "lack of wanting children".
References
- ABS (1995), Australian Social Trends 1995, Australian Bureau of Statistics, Catalogue No. 4102.0, Canberra.
- ABS (1998), Australian Social Trends 1998, Australian Bureau of Statistics, Catalogue No. 4102.0, Canberra.
- ABS (2001), Australian Social Trends 2001, Australian Bureau of Statistics, Catalogue No. 4102.0, Canberra.
- ABS (2000a), Births Australia, 1999, Australian Bureau of Statistics, Catalogue No. 3301.0, Canberra.
- ABS (2000b), Population Projections Australia 1999-2101, Australian Bureau of Statistics, Catalogue No. 3222.0, Canberra.
- ABS (2002a), Births Australia, 2001, Australian Bureau of Statistics, Catalogue No. 3301.0, Canberra.
- ABS (2002b), Australian Social Trends 2002, Australian Bureau of Statistics, Catalogue No. 4102.0, Canberra.
- ABS (2003), Births Australia, 2002, Australian Bureau of Statistics, Catalogue No. 3301.0, Canberra.
- AIHW (2004), Australia's mothers and babies 2001, National Perinatal Unit, Australian Institute of Health and Welfare, Sydney.
- Alber, J. & Fahey, T. (2004), Quality of life in Europe: Perceptions of living conditions in an enlarged Europe, European Foundation for the Improvement of Living and Working Conditions, Dublin, Ireland.
- Allan, G., Hawker, S., & Crow, G. (2001). "Family diversity and family change in Britain and Western Europe", Journal of Family Issues, Vol. 22, no.7, pp. 819-836.
- Arndt, B. (2004), "The great Australian social divide", The Age, 28 March.
- Azjen, I. (1985), From intentions to actions: A theory of planned behaviour, in J. Kuhl and J. Beckman (eds), Action control: from cognition to behavior, Springer-Verlag, New York.
- Azjen, I. (1988), Attitudes, Personality and Behavior, The Dorsey Press, Chicago, IL
- Azjen, I. (1991). "The Theory of Planned Behavior," Special Issue: Theories of Cognitive Self- Regulation, Organizational Behavior and Human Decision Processes, Vol. 50, no. 2, pp. 179-211.
- Barber, J., & Axinn, W. G. (1998), "Gender differences in the impact of parental pressure for grandchildren on young people's entry into cohabitation and marriage", Population Studies, Vol. 52, no. 2, pp.129-144.
- Barnes, A. (2001), Low fertility: A discussion paper, Occasional Paper no. 2, Department of Family and Community Services, Canberra.
- Baxter, J. (2002), "Patterns of change and stability in the gender division of household labour in Australia 1986-1997" Journal of Sociology, Vol. no. 4, pp 399-424.
- Becker, G. (1991), A treatise on the family, Harvard University Press, Cambridge.
- Berrington, A. (2003), Change and Continuity in Family Formation among Young Adults in Britain, S3RI Applications and Policy Working Papers, A03/04, Southampton Statistical Sciences Research Institute, Southampton.
- Berrington, A. (2004), Perpetual postponers? Women's, men's and couples' fertility intentions and subsequent fertility behaviour, SRI Applications and Policy Working Papers, A04/09, Southampton Statistical Sciences Research Institute, Southampton.
- Birrell, B., & Rapson, V. (1998), A not so perfect match: The growing male/female divide, Centre for Population and Urban Research: Monash University.
- Birrell, B., Rapson, V., & Hourigan, C. (2004), Men + women apart: Partnering in Australia, The Australian Family Association and Centre for Population and Urban Research, Melbourne.
- Bittman, M. (2004), "Parenting and employment: What time use surveys show", in N. Folbre & M. Bittman (Eds), Family time: The social organisation of care. London, Routledge.
- Bittman, M. (2002), "The effects of time pressures on mothers' health", Paper presented at the Seminar Series, Australian Institute of Family Studies, 19 September.
- Bittman, M., & Matheson, G. (1996), All else confusion: What time use surveys show about changes in gender equity, Discussion Paper no.72, Social Policy Research Centre, University of New South Wales, Sydney.
- Bittman, M., & Pixley, J. (1997), The double life of the family: Myth, hope and experience, Allen and Unwin, St Leonards, Sydney.
- Bloom, D. E., Conrad, C., & Miller, C. (1998), Child support and fathers' remarriage and fertility. In I. Garfinkel, S. McLanahan, D. Meyer, & J. Selzter, Fathers under fire: The revolution in child support enforcement. Russell Sage Foundation, New York.
- Carmichael, G. (1998), "Things ain't what they used to be! Demography, mental cohorts, morality and values in post-war Australia.", Journal of the Australian Population Association, Vol.15, no. 2, pp. 91-113.
- Carmichael, G., & McDonald, P. (1999), "Fertility trends and differentials", Paper presented to the Transformation of Australia's Population 1970-2030 Conference, Australian National University.
- Castles, F. G. (2002), "Three facts about fertility: Cross-national lessons for the current debate", Family Matters, No. 63, pp. 22-27.
- Cica, N. (1998-1999), Abortion Law in Australia, Research paper 1, Department of the Parliamentary Library, Australian Parliament, Canberra.
- Coleman, D. A. (2000), "Reproduction and survival in an unknown world", People and Place, Vol. 8, no. 2, pp. 1-6.
- Commonwealth of Australia (2002), Intergenerational Report 2002-2003, 2002-2003 Budget Paper no.5, Canberra.
- Crittenden, A. (2001), The price of motherhood: Why the most important job in the world is still the least undervalued, Henry Holt and Company, New York.
- Cummins, R.A., & Nistico, H. (2002), "Maintaining life satisfaction: The role of positive cognitive bias", Journal of Happiness Studies, Vol.3, pp. 37-69.
- de Vaus, D. (2002), "Fertility decline in Australia: A demographic context", Family Matters, No. 63, pp.14-21.
- de Vaus, D. (2004), Diversity and change in Australian families: A statistical profile, Australian Institute of Family Studies, Melbourne.
- Demeny, P. (2004), "Policy challenges of Europe's demographic changes: Cross-cutting issues", Paper presented to the European Population Forum, Population Challenges and Policy Responses, Geneva, Switzerland, 12-14 January.
- Drago, R., Scutella, R., & Varner, A. (2002), "Fertility and work/family policies, Australia and the U.S.", Paper presented at 2002 Economic and Social Outlook Conference. Melbourne Institute of Applied Economic and Social Research, Melbourne.
- Eberstat, N. (2000), "Last one to leave turn off the lights? Contemplating a depopulating world", Marriage, Family and Society Issues, Summer, pp. 20-24.
- Eckersley, R. (1998), "Redefining progress: Shaping the future to human needs", Family Matters, no. 51, pp. 7-9.
- Encel, S. (2002), Voodoo demographics: the 'threat' of an ageing population, Social Policy Research Centre, University of New South Wales, Sydney.
- Evans, M. D. R., & Kelley, J. (1999), "Small families or large? Australia in international perspective", Australian Social Monitor, Vol. 2, no. 1, pp.13-19.
- Evans, M. D. R., & Kelley, J. (2002), "Changes in public attitudes to maternal employment: Australia, 1984-2001", People and Place, vol.10, no.1, pp. 42-56.
- Fah, E. L. E., & Fang, Y. Y. (2002), Singapore's demographic trends in 2002, Population Statistics Section, Department of Statistics, Singapore.
- Festinger, L. (1957), A theory of cognitive dissonance, Stanford University Press, Stanford.
- Fisher, K. (2002), Fertility pathways in Australia: Relationships, opportunities, work and parenting, Commonwealth Department of Family and Community Services, Canberra.
- Galinsky, E. (1999), Ask the children: What America's children really think about working parents, Morrow, New York.
- Garbarino, J. (1995), Raising children in a socially toxic environment, Jossey-Bass, San Francisco.
- Giddens, A. (1976), New rules of sociological method, Basic Books, New York.
- Goldstein, J., Lutz, W., & Testa, M.R. (2003), "The emergence of Sub-Replacement Family Size Ideals in Europe", Population Research and Policy Review, Vol. 22, no. 5-6, pp. 479-496.
- Grant, J., Hoorens, S., Sivadasan, S., van het Loo, M., DaVanzo, J., Hale, L., Gibson, S., & Butz, W. (2004), Low fertility and population ageing: Causes, consequences, and policy options, Rand Corporation, Santa Monica.
- Gray, M., & Chapman, B. (2001), "Foregone earnings from child rearing: Changes between 1986 and 1997", Family Matters, no. 58, pp. 4-9.
- Gray, M., & Tudball, J. (2001), Family-friendly work practices: Differences within and between workplaces, Research Report no. 7, Australian Institute of Family Studies, Melbourne.
- Greene, M. E., & Biddlecom, A. E. (1997), Absent and problematic men: Demographic accounts of male reproductive roles, Population and Development Review, vol. 26, no. 1, pp. 81-115.
- Guest, R. S., & McDonald, I. M. (2002), "Would a decrease in fertility be a threat to living standards in Australia?", The Australian Economic Review, vol. 35, no.1, pp. 29-44.
- Hakim, C. (2000), Work-Lifestyle Choices in the 21st Century: Preference Theory, Oxford University Press, Oxford.
- Hakim, C. (2001), "Taking women seriously", People and Place, vol. 9, no. 4, pp. 1-7.
- Hakim, C. (2003a), Models of the Family in Modern Societies: Ideals and Realities, Ashgate: Aldershot, England.
- Hakim, C. (2003b), "A new approach to explaining fertility patterns: Preference theory", Population and Development Review, vol. 29, no. 3, pp. 349-374.
- Hamilton, C. (2002), "Population growth and environmental quality: Are they compatible?", People and Place, vol. 10, no. 2, pp. 1-5.
- Hicks, N. (1978), 'This Sin and Scandal': Australia's Population Debate 1891-1911, Australian National University Press, Canberra.
- Hoffman, L. M., & Manis, J. D. (1979), "The value of children in the United States: A new approach to the study of fertility", Journal of Marriage and the Family, vol. 41, no. 3, pp. 583-596.
- Horin, A. (2002), "Men commit to staying single", Sydney Morning Herald, 27 June.
- Hugo, G. (2001) "A century of population change in Australia". in Year Book Australia 2001, Catalogue No. 1301.0, Australian Bureau of Statistics, Canberra.
- Human Rights and Equal Opportunity Commission, Annual Report 2002-2003, Sydney: Human Rights and Equal Opportunity Commission.
- Irwin, S. (2000), "Reproduction regimes: Changing relations of inter-dependence and fertility change" Sociological Research Online vol. 5, no. 1. Online: [http//:www.socresonline.org.uk/5/1/irwin.html]
- Jackson, N. (2002), "The Higher Education Contribution Scheme: A HECS on the family", Journal of Population and Research and New Zealand Population Review, Special issue, September, pp. 105-120.
- Jain, S. K., & McDonald, P. F. (1997), "Fertility of Australian birth cohorts: Components and differentials", Journal of the Australian Population Association, vol. 64, no. 1, pp. 31-46.
- Jones, G. W. (2003), The 'Flight from Marriage' in South-East and East Asia, Asian Meta Centre Research Paper Series No.11, Australian National University.
- Judiesch, M., & Lyness, S. (1999), "Left behind?: The impact of leaves of absence on managers' career success", Academy of Management Journal, vol. 42, no. 6, pp. 641-651.
- Kagitcibasi, C. (1997), "The value of children: A key to gender issues", International Pediatric Association Journal (INCH), vol. 9, no. 1. Online: [http:www.ipa-france.net/pubs/inches/inch9_1/kag.html].
- King, J. M. (2002), "Society forever cursed for ignoring the foetal attraction" Sydney Morning Herald, 25 July.
- Kohler, H., Billari, F. C., & Ortega, J. A. (2001), "Towards a theory of lowest-low fertility", MPIDR Working Paper WP 2001-032, Max Planck Institute for Demographic Research, Rostock, Germany. Online: [http://www.demogr.mpg.de/Publications/working.htm]
- Kohler, H. P., & Ortega, J. A. (2001), Parity progression ratios with continued fertility postponement: Assessing the implications of delayed childbearing for cohort fertility, MPIDR Working Paper, Max Planck Institute for Demographic Research, Rostock, Germany. Online: [http://www.demogr.mpg.de/Publications/working.htm]
- Kohlmann, A. (2002), Fertility intentions in a cross-cultural view: The value of children reconsidered, Working Paper WP 2002-002, Max Planck Institute for Demographic Research, Rostock, Germany. Online: [http://www.demogr.mpg.de/Publications/working.htm]
- Krieger, H. (2004), "Family life in Europe: Results of recent surveys on qualify of life in Europe", Paper presented at the Irish Presidency Conference, Dublin, 13-14 May.
- Lazarus, R., & Folkman S. (1984), Stress, Appraisal and Coping, New York, Springer.
- Lillard, L., & Waite, L. (1993), "A joint model of marital childbearing and marital disruption", Demography, vol. 30, no. 4, pp. 653-682.
- Mackay, H. (1997), Generations: Baby Boomers, their Parents and their Children, Macmillan, Sydney.
- Mackay, H. (2001), "Suffer the children? They will", The Age, 11 August.
- Manne, A. (2001), "How to breed Australians: It's not as simple as you think", The Age, 15 December.
- Marshall, N., & Barnett, R. (1993), "Work-family strains and gains among two-earner couples" Journal of Community Psychology, vol. 21, pp. 64-78.
- Martin, J. (2003), "The ultimate vote of confidence. Fertility rates and economic conditions in Australia, 1975-2002", Paper presented to the 8th Australian Institute of Family Studies Conference, "Steps forward for families: research, practice and policy", Melbourne, 12-14 February.
- McDonald, P. (1983), Can the Family Survive?, Discussion Paper No. 11, Australian Institute of Family Studies, Melbourne.
- McDonald, P. (1995), Families in Australia: A Socio-Demographic Perspective, Australian Institute of Family Studies, Melbourne.
- McDonald, P. (1998), "Contemporary fertility patterns in Australia: First data from the 1996 census", People and Place, vol. 6, no. 1, pp 1-13.
- McDonald, P. (2000a), "The new economy and its implications for Australia's demographic future", Paper presented to the 10th Biennial Conference of the Australian Population Association, 29 November.
- McDonald, P. (2000b), "Low fertility in Australia: Evidence, causes and policy responses", People and Place, vol. 8, no. 2, pp. 6-20.
- McDonald, P. (2000c), "The "toolbox" of public policies to impact on fertility - A global view", Paper presented at the seminar "Low fertility, families and public policies", organised by the European Observatory on Family Matters, Sevilla.
- McDonald, P. (2000d), "Fertility, family type and labour force participation: Socio-economic differences in Australia", Paper prepared for Commonwealth Child Care Advisory Council, Department of Family and Community Services, Canberra.
- McDonald, P. (2000e), "Gender equity, social institutions and the future of fertility", Journal of Population Research, vol.17, no.1, pp.1-15.
- McDonald, P. (2001a), "What do we know?" The Sunday Age, 17 June.
- McDonald, P. (2001b), "Theory pertaining to low fertility", Paper presented at International Union for the Scientific Study of Population Working Group on Low Fertility; International Perspectives on Low Fertility: Trends, theories and policies, Tokyo, 21-23 March.
- McDonald, P. (2001c) "Fertility and the three types of women: It's not that simple", OzPop - Australian Population Futures. Online: [http://www.knowledge-services.com.au]
- McDonald, P. (2001d), "Family support policy in Australia: The need for a paradigm shift", People and Place, vol. 9, no. 2, pp. 14-20.
- McDonald, P. (2002), "Low fertility: Unifying the theory and the demography", Paper prepared for the meeting of the Population Association of America "Future of fertility in low fertility countries", Atlanta.
- McDonald, P., & Kippen, R. (1999), The impact of immigration on the ageing of Australia's population, DIMA Discussion Paper, May 1999, Department of Immigration and Multicultural Affairs, Canberra.
- McDonald, P., & Kippen, R. (2000), "The implications of below replacement fertility for labour supply and international migration, 2000-2050", Paper presented to the Annual Meeting of the Population Association of America, Los Angeles, California, March 23-25.
- McRae, S. (2003), "Constraints and choices in mothers' employment careers: A consideration of Hakim's preference theory", British Journal of Sociology, vol. 54, no. 3, pp. 317-338.
- Merlo, R., & Rowland, D. (2000), "The prevalence of childlessness in Australia", People and Place, vol. 8, no. 2, pp. 21-32.
- Meyer, R. (1999) "Which Australians are having three or more children?" People and Place, vol. 7, no. 3, pp. 31-38
- Miller, W. B. (1994), "Childbearing motivations, desires, and intentions: A theoretical framework", Genetic, Social, and General Psychology Monographs, vol. 120, no. 2, pp. 223-258.
- Miller, W.B. & Pasta, D.J. (1995), "Behavioral intentions: which ones predict fertility behavior in married couples?", Journal of Applied Social Psychology, vol. 25, no 6, pp. 530-555.
- Moen, P., & Yu, Y. (2000), "Effective work/life strategies: Working couples, work conditions, gender and life quality", Social Problems, vol. 47, no. 3, pp. 291-326.
- Morehead, A. (2001), "Synchronizing time for work and family: Preliminary insights from qualitative research with mothers". Journal of Sociology, Vol. 37 no. 4, pp. 355-369.
- Neuman, L. (1997), Social Research Methods: Qualitative and Quantitative Approaches, Allyn and Bacon, Boston.
- Parker, R. (2002), Why marriages last: A discussion of the literature, Research Paper No. 28, Australian Institute of Family Studies, Melbourne.
- Perry-Jenkins, M., Repeti, R. L., & Crouter, A. C. (2000), "Work and family in the 1990s" Journal of Marriage and the Family, vol. 62, pp. 981-998.
- Peterson, W. (1961), Population, Macmillan, New York.
- Qu, L. (2003), "Expectations of marriage among cohabiting couples", Family Matters, no. 64, pp. 36-39.
- Qu, L., & Weston, R. (2001), "Starting out together through cohabitation or marriage", Family Matters, no. 60, pp. 76-79.
- Qu, L., Weston, R., & Kilmartin, C. (2000), "Children? No children? The effect of changing personal circumstances on decisions about having children", Family Matters, no. 57, pp. 44-49.
- Quesnel-Valee, A., & Morgan, S. P. (2002), "Do women and men realise their fertility intentions?", Paper presented at the Annual Meeting of the American Sociological Association, Chicago, Illinois, 16-19 August.
- Riley R. (2004) "And another thing", Sunday Herald, 26 September.
- Rowland, D. (2003), "An ageing population: Emergence of a new stage of life?" in S. Khoo and P. McDonald, (eds) The Transformation of Australia's Population: 1970 - 2030, University of New South Wales, Sydney.
- Ruzicka, L. T., & Caldwell J. C. (1982), "Fertility", in Economic and Social Commission for Australia and the Pacific, Country Monographic series no. 9, Population of Australia, vol. 1, pp. 199-229, United Nations, New York.
- Salmon, C.T, and Nichols, J.S. (1983), "The next-birthday method of respondent selection", Public Opinion Quarterly, vol. 47 no.2, pp.270-276.
- Saunders, P. (2001), The changing social security policy context: Implications for the CDEP Program, the Indigenous Welfare Economy and the CDEP Scheme, CAEPR Research Monograph no. 20, Centre for Aboriginal Economic Policy Research, Australian National University, Canberra.
- Schoen, R., Kim, Y. J., Nathanson, C. A., Fields, J., & Astone, N. M. (1997), "Why do Americans want children?" Population and Development Review, vol. 23, no. 2, pp. 333-358.
- Smart, D. (2002), "Relationships, marriage and parenthood: Views of young people and their parents", Family Matters, no. 63, pp. 28-35.
- Social Development Unit. (2002), Annual Report 2002, Ministry of Community Development and Sports, Singapore.
- Steel, D., Vella, J. & Harrington, P. (1996), "Quality issues in telephone surveys: Coverage, nonresponse and quota sampling", The Australian Journal of Statistics, vol. 38, no 1, pp.15-34.
- Stewart, S. D. (2002), "The effect of stepchildren on childbearing intentions and births" Demography, vol. 39, no. 1, pp. 181-197.
- Szego, J. (2002), "More men don't want children: study", The Age, 28 October.
- Thomson, E. (1996), Couple childbearing desires, intentions and births, NSFH working paper, no. 67, Centre for Demography and Ecology, University of Wisconsin-Madison.
- Thomson, E. (1997a), Her, his and their children: Influences on couple childbearing decisions, NSFH working paper no. 76, Centre for Demography and Ecology, University of Wisconsin-Madison.
- Thomson, E. (1997b), "Couple childbearing desires, intentions, and births" Demography, vol. 34, no. 3, pp 343-354.
- Thomson, E., & Brandreth Y. (1995), "Measuring fertility demand" Demography, vol. 32, no. 1, pp. 81-96.
- Van Peer, C. (2000), "Desired and realized fertility in selected FFS-countries", Paper presented to the FFS flagship conference, Brussels.
- Weston, R., & Parker, R. (2002), "Why is the fertility rate falling? A discussion of the literature", Family Matters, no. 63, pp. 6-13.
- Weston, R., & Qu, L. (2001), "Men's and women's reasons for not having children", Family Matters, no. 58, pp. 10-15.
- Weston, R., Stanton, D., Qu, L., & Soriano, G. (2001), "Australian families in transition: Some socio-demographic trends 1901-2001" Family Matters, no. 60, pp. 12-23.
- Weston, R., Qu, L., & Soriano, G. (2003), "Australia's ageing yet diverse population", Family Matters, no. 66, pp. 6-13.
- Whitehead, B. D., & Popenoe, D. (2004), "Why men won't commit", Threshold, no. 81, pp. 12-13.
- Winter, I & Stone, W. (1999), Reconceptualising Australian housing careers, Working Paper no. 17, Australian Institute of Family Studies, Melbourne.
- Wise, S. (2002), "Parents expectations, values and choice of child care: Connections to culture", Family Matters, no. 61, pp. 48-55.
- Wolcott, I. (1997), "The influence of family relationships on family life", Family Matters, no. 48, pp. 20-26.
In collaboration with the Australian Government Office for Women, Department of Family and Community Services, the Australian Institute of Family Studies conducted a major survey to explore the decisions that Australian men and women are making about having children. The project was completed in November 2004.
The Institute thanks the Office for Women for the opportunity to be involved in this important project. The report has been prepared for a wide audience including policy makers, practitioners, researchers, and the general public. It is hoped that this work will provide a better understanding of the reasons for the total fertility rate in Australia being at an all-time low.
This work was undertaken by the Australian Institute of Family Studies in partnership with the Australian Government Office for Women, Department of Family and Community Services. As always, a report of this nature is the result of the combined efforts of many people. We would particularly like to thank our colleagues at the Office for Women, especially Leonie Campbell and Louise Falconer, for their efforts in launching the project and for their continued support during the challenging process of constructing a survey of this magnitude and standing.
Since the project began, we have benefited from the encouragement of David Stanton, the former Director of the Institute (2000-2003) who set us off on this journey, and from the guidance of Professor David de Vaus who, in his previous capacity as Senior Research Advisor at the Institute, provided invaluable expertise in the design and development of the project. Institute researcher Anna Ferro provided invaluable assistance with setting up and maintaining the reference database and preparing the qualitative data incorporated into this report.
During the intense stage of report writing, Professor Alan Hayes, Director of the Australian Institute of Family Studies, and Deputy Director, Dr Alison Morehead provided valuable comments and insights, and were a source of enormous support and encouragement.
While many contributed to this work, it is the authors who are responsible for any errors or omissions.
Finally, we are grateful to the participants in the Institute's Fertility Decision Making Project for their generous contribution of time and, above all, their sharing of myriad details about deeply personal aspects of their lives.
Director's statement
The decline in fertility in Australia and beyond is increasingly seen as a crisis. The total fertility rate is cited almost daily, like a procreative Dow Jones Index. Prognostications and predictions of the likely impacts on all aspects of Australian life have become an industry. While the figures are of concern to many, to others they are not.
The decline is beyond doubt, while the cause remains a matter of great conjecture. What lies behind the statistics? Are fertility decisions merely a matter of lifestyle choices, as some would wish to trivialise it? How do individuals make decisions about whether to have children or not? When it comes to having children, is there a gulf between what people expect and what they would ideally want? How diverse are the patterns of aspirations, expectations? These are questions of fundamental importance for the nation and for those who frame public policy.
The Office for Women is to be congratulated in commissioning the Australian Institute of Family Studies to undertake the groundbreaking research that has resulted in this publication. "It's not for the lack of wanting kids..." reports the findings of the Fertility Decision Making Project and provides the first indepth analyses of the aspirations, expectations and ideals of Australians as related to the question of whether to have children, or not. It succeeds in going beyond the statistics by putting a human face to the numbers. Finally, it challenges some of the widely-held misconceptions, inappropriate assumptions and enduring myths that surround the topic of fertility decision-making.
The Institute's research team, so ably led by Ruth Weston, included Robyn Parker, Lixia Qu and Michael Alexander. They are to be applauded for making such a landmark, substantial and readable contribution on this topic.
I am delighted that the Australian Institute of Family Studies has been able to be involved in a project that will be of such widespread interest, immediate value and signal relevance to social policy.
Professor Alan Hayes
Director
Australian Institute of Family Studies
Weston, R., Qu, L., & Parker, R. A. (2005). "It's not for lack of wanting kids ..." A report on the Fertility Decision Making Project (Research Report No. 11). Melbourne: Australian Institute of Family Studies.
0 642 39520 9