Living alone and personal wellbeing
You are in an archived section of the AIFS website
Overview
This paper examines the consequences of living alone, particularly its impact on a person’s social connection, health and subjective wellbeing. It finds that while living alone has some effect on these factors, the effects are limited and cannot necessarily be attributed to living alone.
Key messages
- Those living alone have a higher level of connection with others outside the household than those who live with others. A third of those living alone see friends and relatives at least a few times a week, while only a fifth of those living with others do the same.
- Compared to those living with others, people living alone displayed higher levels of boredom (38% of those living alone versus 31% of those living with others) and loneliness (25% versus 15%).
- Life satisfaction declined for many people when they commenced living alone, particularly:
- women who commenced living alone when they were over 60; and
- men who started living alone when they were over 30.
- However, women who start solo living in their 30s and 40s had no comparable loss of life satisfaction, probably because the move to living alone was less often associated with loss of contact with their children following a break-up.
Introduction
Previous papers in this series on living alone in Australia have described the demographic trends of living alone both in Australia and internationally and the nature of living alone (de Vaus & Qu, 2015a, 2015b). These papers outlined the growth of this living arrangement and its more recent stability, the characteristics of those who live alone, and some of the drivers behind living alone. The papers also focused on the nature of living alone, including the duration of periods for which people live alone, where living alone fits into people's life course and so on. These papers provided clues as to why people choose to live alone and why they stop doing so.
This paper investigates living alone through a different lens. It seeks to shed light on some of the consequences. It focuses on three sets of possible outcomes in the areas of:
- social connection;
- health behaviours; and
- subjective wellbeing.
A three-pronged approach is used to detect any impact of living alone on these dimensions of people's lives.
First, it asks whether those who live alone are different on the outcome measures from those who do not live alone. But one cannot simply attribute any observed differences to living alone. Differences in outcomes between those who live alone and those who do not live alone may have predated the commencement of living alone and may be due to other differences between the two groups (e.g., age differences).
The second and third approaches therefore focus more on changes in the outcome measures as people move into and out of living alone arrangements. The second approach tracks people before they begin to live alone and then looks at whether there are changes in the outcome measures while they are living alone. The third approach looks at people who stop living alone and examines whether there is any change after they live with others.
Living alone and social connection
One interpretation of living alone is that it represents the failure of modern social life. According to this view, the status of living alone reflects an unhealthy loss of social networks and heralds the rise of loneliness and isolation in the contemporary world. This view is based on the belief that the most important social relationships are those that take place within households.
Are those living alone more disconnected than those living with others?
Comparing those living alone with those living with others provides a mixed picture (Table 1). Those living alone have a higher level of connection with others beyond the household than do those who live with others. For example:
- Thirty-five per cent of those living alone see friends and non-household relatives at least a few times a week while just 21% of those living with others have this much contact.
- Similarly, women living alone are more involved in community-based organisations than those living with others (39% vs 30%), although this pattern is not apparent for men.
| Living arrangements | Men | Women | All |
|---|---|---|---|
Notes: Percentages are based on weighted data and sample sizes are unweighted. The unweighted sample sizes vary slightly across indicators due to indicator specific missing responses. For each indicator, association between living arrangements and the indicator is tested using a Chi-square test (design-based, ** p < .01; *** p < .001). a The scale is derived from 10 items. | |||
| Gets together socially with friends/relatives (living elsewhere) a few times a week or every day | |||
| With others (%) | 19.0 *** | 22.4 *** | 20.7 *** |
| Living alone (%) | 31.7 | 37.9 | 34.8 |
| An active member of a sporting, hobby or community-based club or association | |||
| With others (%) | 37.7 | 29.9*** | 33.7*** |
| Living alone (%) | 37.2 | 39.1 | 38.2 |
| A high sense of social support (scores 5-7 on a score range 1-7, higher score meaning greater sense of social support) a | |||
| With others (%) | 67.3 *** | 74.3 ** | 70.9 *** |
| Living alone (%) | 56.2 | 69.4 | 62.9 |
| Agrees that "I often feel lonely" (ratings 5-7 on a scale 1 "strongly disagree" to 7 "strongly agree") | |||
| With others (%) | 14.2 *** | 17.1 *** | 15.7 *** |
| Living alone (%) | 26.6 | 24.5 | 25.5 |
| Sometimes or more often feels that has spare time that does not know what to do with | |||
| With others (%) | 35.5*** | 27.2*** | 31.3*** |
| Living alone (%) | 44.2 | 33.8 | 38.9 |
| No. of respondents | |||
| With others | 5,454-5,499 | 6,172-6,204 | 11,626-11,747 |
| Living alone | 981-1,002 | 1,236-1,265 | 2,217-2,276 |
While the higher level of contact with non-household family members and friends among those who live alone is hardly surprising, these figures certainly do not paint a picture of greater social disengagement among those living alone - quite the opposite.
However, other things do indicate that those living alone are somewhat more isolated than those living with others (Table 1). For example:
- Fewer of those living alone have a sense of high social support (63% of those living alone compared to 71% among those living with others).
- Those living alone are more likely to feel lonely (26% compared to 16%).
- Those living alone are more likely to get "bored" (39% compared to 31%).
In general, these differences in social connection between those living alone and those living with others hold consistently for both men and women (Table 1). Although not reported in Table 1 the patterns outlined above generally held in each age group. There were some exceptions:
- The level of social connection of those in their 20s who were living alone was generally indistinguishable from that of people the same age who were living with others.
- This pattern also applied to women in their 30s and 40s.
Do people become more disconnected when they start living alone?
While there are some clear differences in social connection between those who live alone and those living with others, this does not mean that these differences are due to living alone. Does beginning to live alone result in changes of social connection?
Table 2 reports levels of social connection on a number of different measures in the year before people began living alone and in the year after they commenced living alone. There is not much evidence that beginning to live alone leads to a loss of social connection. For example:
- When people (especially women) begin to live alone they increase the rate at which they get together regularly with non-household relatives and friends (42% while living alone compared to 35% before living alone). (Nevertheless, people who began living alone may stay connected with those they previously lived with.)
- The proportion having involvement in community organisations for women increased somewhat (35% were active members before living alone and 38% after living alone). The reverse pattern applied to men (39% vs 34%).
- People did not experience any loss of feelings of social support once they began to live alone.
However, there was some evidence of increased loneliness and boredom after beginning to live alone. Once people began to live alone they were more likely to indicate:
- feelings of loneliness (31% felt lonely while living alone compared to 24% prior to living alone); and
- boredom (40% felt bored while living alone compared to 35% prior to living alone).
But even these changes represent only a low level of change following living alone. Only about 6% of those living alone report being lonelier or more bored.
| Living arrangements | Men | Women | All |
|---|---|---|---|
Note: The sample sizes vary slightly across indicators due to indicator-specific missing responses. For each indicator, association in responses before and after living alone is tested using McNemar's test (** p < .01; *** p < .001). a The social support scale is derived from 10 items. | |||
| Getting together socially with friends/relatives not in the household a few times a week or every day | |||
| Pre-living alone (%) | 33.4 ** | 36.3 *** | 34.8 *** |
| While living alone (%) | 38.5 | 45.0 | 41.7 |
| An active member of a sporting, hobby or community-based club or association | |||
| Pre-living alone (%) | 38.7 *** | 35.1 | 36.9 |
| While living alone (%) | 34.1 | 37.5 | 35.8 |
| A high sense of social support (scores 5-7 on a score range 1-7, higher score meaning greater sense of social support) a | |||
| Pre-living alone (%) | 56.3 | 71.6 | 63.8 |
| While living alone (%) | 57.7 | 71.7 | 64.6 |
| Agreeing that "I often feel lonely" (ratings 5-7 on a scale 1 "strongly disagree" to 7 "strongly agree") | |||
| Pre-living alone (%) | 24.4 *** | 23.5 *** | 24.0 *** |
| While living alone (%) | 32.9 | 28.5 | 30.7 |
| Sometimes or more often feeling "you have spare time that you don't know what to do with" | |||
| Pre-living alone (%) | 38.1 *** | 31.1 *** | 34.6 *** |
| While living alone (%) | 44.4 | 35.9 | 40.2 |
| No. of spells | 1,274-1,300 | 1,237-1,263 | 2,511-2,563 |
In general, the presence or absence of any changes in social connection and support following the transition to living alone was much the same for men and women (Table 2). However, there were some gender-based differences in the way in which social connections changed once people began to live alone. For example:
- Women increased the involvement with friends and family more sharply than men did when they began to live alone, though it is possible that they increase their contact with those they previously lived with. For women, the rate of high involvement increased from 36% prior to living alone to 45% after they began to live alone. Among men, the increase was more modest (from 33% to 39%).
- Active membership in community organisations fell for men when they began to live alone, while the level of involvement by women rose slightly.
- Loneliness increased more for men (24% to 33%) when they commenced living alone than it did for women (24% to 29%).
- The link between gender and social involvement upon living alone was generally consistent across age groups (not reported in the table). The main exceptions to this:
- The increase in loneliness of women on living alone was confined to those in their 50s.
- The increased boredom of women when they commenced living alone was restricted to those aged 60 and older.
Longer-term impact of living alone
The findings reported above focus on short-term changes in social connection within the first year of people beginning to live alone. But it may take longer for any effects of living alone to be detected. For example, it may take time for social connections to be affected. Alternatively, living alone may have an immediate effect, which disappears over time as people adapt to living alone. What happens in the longer term? This section examines changes in regular contact with family and friends and in levels of loneliness in the 6 years after people begin to live alone. It focuses on patterns for men and women and distinguishes between those aged under 50 and those aged 50 and older.
Consistent with Table 2, Figure 1 shows that in the year following the commencement of living alone, both older and younger men and women increased the level at which they got together (daily or several times weekly) with family and friends. Figure 1 also shows what happens after that initial year:
- Among older men and women (aged 50 years and over), this increased level of contact was maintained over an extended period.
- Among younger men and women (aged under 50), the trend is less clear-cut and may reflect a slight decline in contact with family and friends over time.
- Even with these younger men and women, the level of contact with family and friends 6 years after living alone was quite similar to the level immediately prior to living alone.
How does living alone affect loneliness in the longer term?
Figure 2 reflects the observation in Table 2 that in the short term (the year following the commencement of living alone) levels of loneliness increased. It shows that this initial impact is most pronounced for older men and least evident among younger women (aged under 50).
Figure 2 also shows the longer-term effect of living alone on loneliness and reveals important differences in the effect on men and women. It shows that:
- Among both younger and older men, the increased loneliness experienced when they begin to live alone persists for the next 6 years.
- Among women under the age of 50, beginning to live alone leads to only a relatively small immediate increase in loneliness and this effect disappears over the following 6 years.
- Among older women, beginning to live alone leads to a sharper increase in loneliness but, unlike men, this effect dissipates over the next 6 years. After 6 years, the loneliness levels of older women living alone have recovered to the same levels as before living alone.
In other words, living alone leads to a sustained increase in loneliness among both older and younger men. Among women, it leads to a short-term increase in loneliness for older women but this effect disappears over time.
Figure 1: Contact with family and friends living elsewhere following commencement of living alone, by gender and age
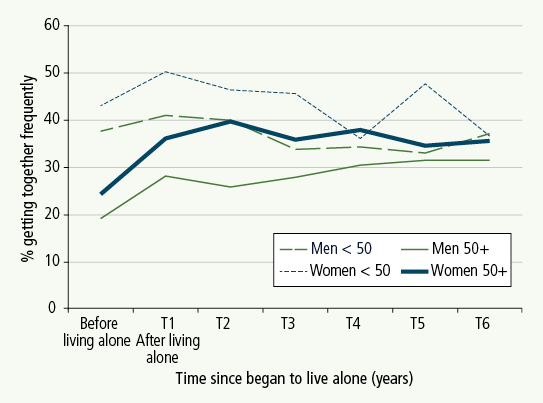
Note: "getting together frequently" refers to getting together socially with friends/relatives living elsewhere a few times a week or every day.
Source: HILDA W1-W12
Figure 2: Mean loneliness following commencement of living alone, by gender and age
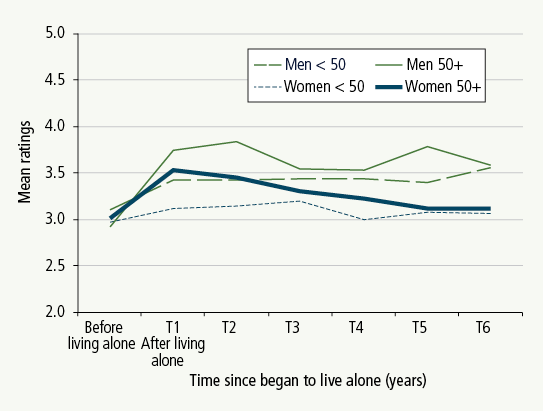
Note: Response options to the statement "I often feel lonely" range from 1 "strongly disagree" to 7 "strongly agree".
Source: HILDA W1-W12
Do people become more connected when they stop living alone?
When people stopped living alone, some of the changes observed when they began living alone were reversed (see Table 3). For example, in the year after which people stopped living alone:
- The proportion who got together socially with friends and relatives living elsewhere at least a few times a week declined from 42% while living alone to 30% afterwards. This held for both men and women. It is possible that some may have moved in with those with whom they had frequent contact beforehand.
- Among women, the proportion involved in community organisations declined slightly once they stopped living alone (from 33% to 28%).
- Feeling socially supported increased once people stopped living alone (from 66% to 71%). This increase occurred amongst both men and women.
- Among men, the proportion feeling lonely declined when they stopped living alone (from 26% to 19%)
Living alone and health behaviours
It is plausible to think that living alone may result in less healthy behaviours. Without needing to take fellow householders into account and without the constraining influence of others, living alone may result in less healthy behaviours. Here, we focus on just two behaviours: smoking and alcohol consumption. This section compares the smoking and drinking behaviours of those who live alone with those who do not live alone. It then looks at changes in these behaviours as people transition between living alone and living with others.
Do people living alone engage in less healthy behaviours than those living with others?
Men who live alone are more likely than those living with others to smoke and to drink fairly heavily, here defined as consuming at least five to six standard drinks at a time (Table 4).1 Among women, there is no difference in the smoking and drinking levels of those who live alone and those who live with others.
- Men who live alone are more likely to smoke than those living with others (27% compared to 20%).
- Men who live alone are more likely to drink heavily than those living with others (39% compared to 31%).
Among men, the higher levels of smoking and heavy drinking of those who live alone is most evident among those in their thirties and those aged over 50 (not reported in Table 4).
| Living arrangements | Men | Women | All |
|---|---|---|---|
Note: The sample sizes vary slighted across indicators due to indicator-specific missing responses. For each indicator, association in responses before and after living alone is tested using McNemar's test (** p < .01; *** p < .001). a The social support scale is derived from 10 items. | |||
| Getting together socially with friends/relatives not in the household a few times a week or every day | |||
| While living alone (%) | 39.3 *** | 45.6 *** | 42.2 *** |
| Post-living alone (%) | 26.6 | 33.1 | 29.6 |
| An active member of a sporting, hobby or community-based club or association | |||
| While living alone (%) | 37.6 | 33.1 ** | 35.5 ** |
| Post-living alone (%) | 36.2 | 28.1 | 32.5 |
| A high sense of social support (scores 5-7 on a score range 1-7, higher score meaning greater sense of social support) a | |||
| While living alone (%) | 60.0 *** | 73.1 *** | 66.1 *** |
| Post-living alone (%) | 65.4 | 77.3 | 71.0 |
| Agreeing that "I often feel lonely" (ratings 5-7 on a scale 1 "strongly disagree" to 7 "strongly agree) | |||
| While living alone (%) | 26.1 *** | 24.4 | 25.3 *** |
| Post-living alone (%) | 18.8 | 21.5 | 20.0 |
| Sometimes or more often feeling "you have spare time that you don't know what to do with" | |||
| While living alone (%) | 37.6 | 35.2 | 36.5 |
| Post-living alone (%) | 35.6 | 34.1 | 34.9 |
| No. of spells | 1,000-1,010 | 867-889 | 1,867-1,898 |
| Living arrangements | Men | Women | All |
|---|---|---|---|
Note: Percentages are based on weighted data and sample sizes are unweighted. The unweighted sample sizes vary slightly across the first two indicators due to indicator-specific missing responses. For each indicator, association between living arrangements and the indicator is tested using a Chi-square test (design-based ** p < .01; *** p < .001). a Regular drinking refers to those who drink 2 or 3 days a month and more often. Excludes about 30% of respondents who either do not drink or drink occasionally. | |||
| Currently tobacco smoking | |||
| With others (%) | 20.4 *** | 15.0 | 17.6 * |
| Living alone (%) | 26.9 | 13.2 | 19.9 |
| Usually drinking at least five or six standard drinks, those who drink regularly a | |||
| With others (%) | 30.7 ** | 16.0 | 24.3 ** |
| Living alone (%) | 39.4 | 14.2 | 28.7 |
| No. of respondents | |||
| With other | 5,488-5,496 | 6,182-6,199 | 11,678-11,687 |
| Living alone | 988-955 | 1,259-1,261 | 2,247-2,256 |
Does commencing and stopping living alone lead to changes in unhealthy behaviours?
While men who live alone have higher levels of smoking and heavy drinking, this does not mean that this is due to living alone. Do people increase their rate of smoking and drinking when they begin to live alone? What happens when they stop living alone?
Commencing to live alone
Table 5 shows that both overall, and for men and women separately, there is no evidence that moving into a solo living arrangement makes any difference to these health behaviours in the short term.
- For both men and women, the rate of smoking in the year after commencing to live alone shows no increase from when they lived alone.
- The rate of heavy drinking shows no increase in the year after people began to live alone (38% both before and while living alone).
While beginning to live alone has no apparent link with rates of smoking or heavy drinking, is there any link over the longer term? Figure 3 tracks the level of heavy drinking across the 6 years after people begin to live alone. It reinforces the finding above that beginning to live alone is not linked with rates of heavy drinking. With the possible exception of women aged under 50, there is no increase in heavy drinking in the year after beginning to live alone. Figure 3 also shows that in the following 6 years after beginning to live alone:
- The levels of heavy drinking either remain basically stable (younger men and older women) or declines (older men and younger women).
- The most notable change is the sharp reduction in heavier drinking by women aged under 50 in the 6 years after they commence living alone. For these women, heavy drinking declines from 17% prior to living alone to 6% 6 years after beginning to live alone.
- Essentially, regardless of age and gender, beginning to live alone has no discernable negative longer-term effect on levels of heavier drinking.
| Living arrangements | Men | Women | All |
|---|---|---|---|
Note: The sample sizes vary slightly across the first two indicators due to indicator-specific missing responses. For each indicator, association in responses before and after the transition is tested using McNemar's test (** p < .01). a Regular drinking refers to those who drink 2 or 3 days a month and more often, excluding respondents who either do not drink or drink occasionally. | |||
| Currently tobacco smoking | |||
| Before living alone (%) | 35.6 | 26.3 | 31.0 |
| Living alone (%) | 37.1 | 26.0 | 31.6 |
| Usually drinking at least five or six standard drinks, those who drink regularly a | |||
| Before living alone (%) | 46.1 | 27.6 | 38.2 |
| Living alone (%) | 44.3 | 29.4 | 37.9 |
| No. of spells | 1,284-1,285 | 1,245-1,247 | 2,530-2,531 |
Figure 3: Percentage of those consuming five to six drinks at a sitting at least weekly, by gender and age
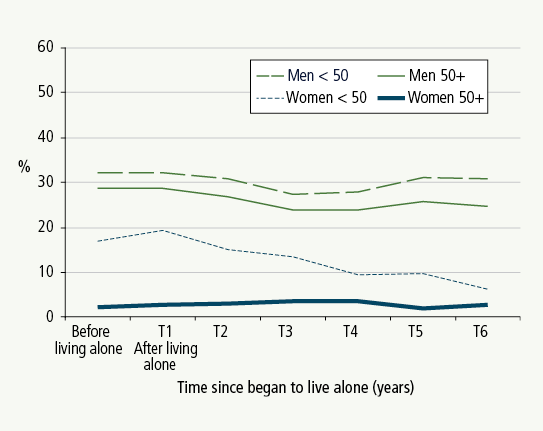
Source: HILDA W1-W12
Stopping living alone
What happens when people stop living alone? Do they adopt healthier behaviours? Overall, ceasing to live alone makes no difference to smoking rates. While living alone, 35% smoked and when these same people stopped living alone, 34% still smoked (Table 6).
There was some reduction in rates of heavy drinking among women when they stopped living alone. Of women who stopped living alone, 28% were drinking heavily while living alone but when they ceased living alone the rate of heavy drinking dropped to 23%.
In summary, while men who lived alone were more likely to smoke and drink heavily than men living with others, there is no evidence that this behaviour is the product of living alone. The rate of smoking or heavy drinking among men does not increase when they begin to live alone and does not decrease when they stop living alone. The absence or presence of others in the household appears to make no difference to these behaviours among men. The reason for the high levels of smoking and drinking among solo-living men is more likely to be due to the characteristics of men who live alone than to living alone itself.
The only apparent evidence of living alone affecting health behaviours is for women, where stopping living alone was linked with a decline in rates of heavy drinking.
Living alone and subjective health and wellbeing
In addition to any impact on social connection and health behaviours, living alone can potentially affect a person's sense of wellbeing - their sense of feeling well both physically and mentally as well as their overall sense of satisfaction with life. In this section we examine four measures of subjective health and wellbeing: whether people rate their health as fair or poor; the scores of a measure called vitality; the scores of the mental health scale; and the percentage scoring high on the life satisfaction scale. The vitality and mental health measures are components of the SF-36 scale (Wares et al., 2000). The vitality scale was formed on four items, with lower scores indicating feeling tired and "worn out", and high scores indicating feeling "full of life" and "having lots of energy" (a four-item scale). "Mental health" (a five-item scale) focuses on "affective" (emotional) wellbeing, with lower scores suggesting feeling nervous and unhappy, and high scores tapping a sense of peace and happiness.
Do people living alone have poorer or better subjective health and wellbeing than those living with others?
Overall, those living alone displayed lower subjective health and wellbeing, as measured here, than those living with others (Table 7). In particular:
- Almost a quarter of those living alone (24%) rated their health as fair or poor compared to 17% of those living with others.
- Fewer people living alone were highly satisfied with life (62%) than were those living with others (68%),with the pattern being mainly driven by men.
- Despite statistically significant differences, those living alone had similar levels of vitality and mental health as those living with others.
The poorer subjective health ratings of those living alone were evident among both men and women. But there was an important difference between men and women in terms of overall life satisfaction. For example:
- Men living with others were considerably more satisfied with life compared to men living alone (69% compared to 56%).
- Women living with others were no more satisfied than women living alone (68% for both women living alone and women living with others).
- Women living alone were considerably more satisfied than men living alone (68% compared to 56%).
In other words, when comparing men and women who were living alone and living with others, men who lived alone stood out has having low life satisfaction.
The poorer subjective wellbeing among men who live alone is more evident among those aged 50 and older (Table 8). The lower life satisfaction of men living alone, observed above, is seen across all age groups of men from young adults to those over 60 but is most pronounced among those aged 50 and over.
Among women, any effects of living alone were mainly restricted to those in their fifties. While Table 7 showed poorer subjective health for women who live alone, Table 9 shows that this was only statistically significant for those in their 50s. Similarly, while Table 7 showed no differences in the life satisfaction of women living alone and those living with others, Table 9 shows that among women in their 50s, those living alone were less satisfied with life than those living with others.
| Living arrangements | Men | Women | All |
|---|---|---|---|
Note: The sample sizes vary slightly across the first two indicators due to indicator-specific missing responses. For each indicator of each gender (or all), association in responses before and after the transition is tested using McNemar's test (* p < .05; ** p < .01). a Regular drinking refers to those who drink 2 or 3 days a month and more often, excluding respondents who either do not drink or drink occasionally. | |||
| Currently tobacco smoking | |||
| Living alone (%) | 37.5 | 31.1 | 34.5 |
| Post-living alone (%) | 36.6 | 29.8 | 33.5 |
| Usually drinking at least five or six standard drinks, those who drink regularly a | |||
| Living alone (%) | 43.9 | 28.4 ** | 37.5 ** |
| Post-living alone (%) | 40.4 | 22.7 | 33.1 |
| No. of spells | 1,006-1,007 | 887-888 | 1,893-1,895 |
| Living arrangements | Men | Women | Total |
|---|---|---|---|
Note: Percentages and means are based on weighted data and sample sizes on unweighted data. For each indicator of each gender (and total), association between living arrangements and the indicator is tested using a Chi-square test for categorical indicators and t-test for continuous indictors (design-based * p < .05; ** p < .01; *** p < .001). | |||
| Ratings of general health as fair or poor | |||
| With others (%) | 16.3 *** | 16.6 *** | 16.5 *** |
| Living alone (%) | 22.8 | 24.6 | 23.8 |
| Mean score of vitality (0-100, higher score = greater vitality) | |||
| With others | 63.0 * | 58.7 * | 60.8 ** |
| Living alone | 61.4 | 57.1 | 59.2 |
| Mean score of mental health (0-100, higher score = better mental health) | |||
| With others | 75.9 *** | 73.6 | 74.7 * |
| Living alone | 73.4 | 73.8 | 73.6 |
| High satisfaction with life overall (ratings 8-10 on a scale from 0 "completely dissatisfied" to 10 "completely satisfied") | |||
| With others (%) | 68.6 *** | 67.8 | 68.2 *** |
| Living alone (%) | 56.3 | 67.9 | 62.0 |
| No. of respondents | |||
| With other | 5,509-6,266 | 6,214-6,965 | 11,723-13,231 |
| Living alone | 996-1,242 | 1,273-1,455 | 2,269-2,697 |
| Living arrangements | 20-29 | 30-39 | 40-49 | 50-59 | 60+ |
|---|---|---|---|---|---|
Note: Percentages and means are based on weighted data and sample sizes on unweighted data. For each indicator of each age group, association between living arrangements and the indicator is tested using a Chi-square test for categorical indicators and t-test for continuous indicators (design-based * p < .05; ** p < .01; *** p < .001). | |||||
| Ratings of general health as fair or poor | |||||
| With others (%) | 5.7 | 9.1 | 13.5 | 20.4 * | 29.6 * |
| Living alone (%) | 7.3 | 9.2 | 16.7 | 29.1 | 36.8 |
| Mean score of vitality (0-100, higher score = greater vitality) | |||||
| With others | 65.1 | 63.3 | 62.3 | 63.2 | 61.5 |
| Living alone | 62.7 | 64.4 | 61.9 | 60.8 | 59.3 |
| Mean score of mental health (0-100, higher score = better mental health) | |||||
| With others | 74.4 | 75.7 | 74.9 | 75.6 * | 78.4 * |
| Living alone | 70.7 | 73.5 | 72.3 | 72.0 | 75.9 |
| High satisfaction with life overall (ratings 8-10 on a scale from 0 "completely dissatisfied" to 10 "completely satisfied") | |||||
| With others (%) | 67.5 * | 63.5 ** | 63.7 * | 63.1 *** | 81.6 *** |
| Living alone (%) | 58.6 | 49.4 | 52.8 | 46.3 | 66.7 |
| No. of respondents | |||||
| With other | 1,091-1,351 | 959-1,149 | 1,066-1,178 | 1,006-1,088 | 1,387-1,500 |
| Living alone | 182-270 | 134-187 | 177-213 | 177-202 | 326-370 |
| Living arrangements | 20-29 | 30-39 | 40-49 | 50-59 | 60+ |
|---|---|---|---|---|---|
Note: Percentages and means are based on weighted data and sample sizes unweighted data. For each indicator of each age group, association between living arrangements and the indicator is tested using a Chi-square test for categorical indicators and t-test for continuous indicators (design-based * p < .05; ** p < .01; *** p < .001). | |||||
| Ratings of general health as fair or poor | |||||
| With others (%) | 8.6 | 10.0 | 13.7 | 20.3 * | 29.3 |
| Living alone (%) | 5.4 | 5.6 | 18.4 | 26.9 | 32.2 |
| Mean score of vitality (0-100, higher score=greater vitality) | |||||
| With others | 60.6 | 58.0 | 57.9 | 58.9 ** | 58.4 |
| Living alone | 60.4 | 60.2 | 58.4 | 53.9 | 56.4 |
| Mean score of mental health (0-100, higher score=better outcome) | |||||
| With others | 71.9 | 73.5 | 72.8 | 73.7 *** | 75.8 |
| Living alone | 70.9 | 73.2 | 71.5 | 67.7 | 76.4 |
| High satisfaction with life overall (8-10 on a scale from 0 "completely dissatisfied" to 10 "completely satisfied") | |||||
| With others (%) | 67.8 | 66.2 | 62.7 | 65.3 * | 76.3 |
| Living alone (%) | 61.1 | 58.3 | 57.7 | 55.9 | 75.3 |
| No. of respondents | |||||
| With other | 1,255-1,497 | 1,195-1,349 | 1,319-1,467 | 1,142-1,233 | 1,303-1,419 |
| Living alone | 189-229 | 87-100 | 95-114 | 203-221 | 699-791 |
Does subjective wellbeing improve or decline when people start living alone?
As outlined in relation to other issues examined above, while differences in subjective health and life satisfaction exist between those living alone and those not living alone, this does not mean that these differences are due to living alone. The better test of the impact of living alone is to examine whether subjective health and life satisfaction changes when people begin to live alone and when they begin to live with others.
Overall, Table 10 shows that self-rated health, vitality and mental health are unchanged as people move from living with others to living alone.
- Before living alone, 18% rated their health as fair or poor. After they commenced living alone, 17% rated their health in this way.
- Before living alone, the mean score of the vitality scale was 60 and it was 59 after they commenced living alone.
- Before living alone, the mean score on the mental health scale was 71 and it was 70 after beginning to live alone.
| Living arrangements | Men | Women | Total |
|---|---|---|---|
Note: For each gender (and total), association in responses before and after transition into living alone is tested using McNemar's test for categorical indicators and paired t-test for continuous indicators (* p < .05; ** p < .01; ***p < .001). | |||
| Ratings of general health as fair or poor | |||
| Before living alone (%) | 15.8 | 19.2 | 17.5 |
| While living alone (%) | 15.9 | 18.0 | 17.0 |
| Mean score of vitality (0-100, higher score = greater vitality) | |||
| Before living alone | 61.3 | 57.5 | 59.5 |
| While living alone | 60.9 | 57.3 | 59.1 |
| Mean score of mental health (0-100, higher score = better mental health) | |||
| Before living alone | 71.5 ** | 70.0 * | 70.8 ** |
| While living alone | 70.0 | 68.9 | 69.5 |
| High satisfaction with life overall (ratings 8-10 on a scale from 0 "completely dissatisfied" to 10 "completely satisfied") | |||
| Before living alone (%) | 54.3 *** | 61.1 * | 57.4 *** |
| While living alone (%) | 48.2 | 57.5 | 52.5 |
| No. of spells | 1,280-1,882 | 1,232-1,599 | 2,532-3,481 |
The one measure where there was an appreciable (but still modest) change following the move to solo living is overall life satisfaction. On this general measure, rates of high satisfaction dropped from 57% while living living with others to 53% once they commenced living alone. This change in life satisfaction following the move to solo living occurs among both men and women.
Focusing on the changes to life satisfaction following the move to live alone, there are some age-related differences in the way in which living alone affects life satisfaction (Table 11). Among both men and women, the proportion of those aged 60 and over who reported high satisfaction declined when they began to live alone. In particular:
- Among older men (aged 60 years and over) 69% were highly satisfied before living alone. A year after beginning to live alone, only 58% were highly satisfied.
- Among the older women, the same pattern occurs: 73% were highly satisfied before living alone compared to 62% a year after they began to live alone.
| Living arrangements | Age at the start of living alone | ||||
|---|---|---|---|---|---|
| 20-29 | 30-39 | 40-49 | 50-59 | 60+ | |
Note: For each age group, association in responses before and after transition into living alone is tested using McNemar's test for categorical indicators and paired t-test for continuous indicators (* p < .05; ** p < .01; *** p < .001). | |||||
| High satisfaction with life overall (ratings 8-10 on a scale from 0 "completely dissatisfied" to 10 "completely satisfied") | |||||
| Men | |||||
| Before living alone (%) | 59.2 | 47.8 *** | 44.6 * | 47.6 | 69.0 * |
| While living alone (%) | 56.0 | 37.2 | 38.2 | 44.6 | 57.6 |
| No. of spells | 499-821 | 268-395 | 234-314 | 138-168 | 141-184 |
| Women | |||||
| Before living alone (%) | 63.4 * | 54.3 | 47.7 | 54.1 | 73.1*** |
| While living alone (%) | 58.9 | 49.1 | 54.8 | 55.6 | 62.0 |
| No. of spells | 463-620 | 120-173 | 149-199 | 213-257 | 287-350 |
The likely reason for this loss of life satisfaction among the older age group is that the move to solo living for this group is usually due to either the death or the institutionalisation of their partner. Thus, the fall in the proportion of those reporting high life satisfaction among the older age group may have more to do with the loss of a spouse or partner rather than the transition into solo living.
Other marked, age-related changes in life satisfaction are seen among men aged in their 30s and 40s. Among these men there is a significant decline in the proportion expressing high life satisfaction when they commence living alone.
- Among men experiencing a spell of living alone in their thirties, 48% had high life satisfaction before living alone but this dropped to 37% when they commenced living alone.
- Of those men experiencing a spell of living alone in their 40s, the percentage who were highly satisfied dropped from 45% before living alone to 38% when they began to live alone.
It is likely that this drop in life satisfaction among these men is because the most common reason for beginning to live alone at this age is the ending of a relationship. For many men, this relationship ending can be a difficult time, especially when it involves less contact with their children. Given these turbulent times in the relationship with their former partner, the decline in the proportion expressing high satisfaction is likely to result in part from reasons other than the experience of living alone.
No such loss of life satisfaction is evident among women who transition to solo living in their thirties and forties. This is probably because the move to living alone among women of this age is less often associated with loss of contact with children following a relationship breakdown. Indeed, the previous research shows that men were more likely than women to move from living with a partner and children to living alone (de Vaus & Qu, 2015b). In addition, women who moved into living alone were more likely to do so from a relationship separation without children than from a relationship separation with children. This was not the case for men who moved into living alone.
Longer-term impact on life satisfaction
Table 11 has shown the immediate negative impact on life satisfaction of beginning to live alone. This negative impact was evident among both men and women but not among all age groups.
What happens to life satisfaction over a longer period? Does life satisfaction continue to decline the longer people live alone or does it stabilise or even recover as people get more used to living alone?
Figure 4 shows the mean level of life satisfaction both prior to living alone and for up to 6 years after people commence living alone. This figure confirms the immediate decline in life satisfaction when people start living alone. It shows an immediate decline for both younger and older men and older women and the absence of an effect among women aged under 50 who begin to live alone.
Looked at over a longer period of 6 years, some interesting trends emerge.
- Among women aged under 50, living alone has no immediate or longer-term effect on life satisfaction.
- Among both older men and older women, there is a clear recovery in life satisfaction following the initial decline. Three years after living alone, life satisfaction has recovered to pre-living alone levels.
- After 3 years of living alone, life satisfaction of the older men and women continues to increase and exceeds pre-living alone levels.
There is one group where beginning to live alone has a sustained negative impact on life satisfaction. Men under the age of 50 who begin to live alone experience an immediate loss of life satisfaction and this is sustained and, indeed, declines further over the following 6 years.
Figure 4: Mean life satisfaction following the commencement of living alone, by age and gender
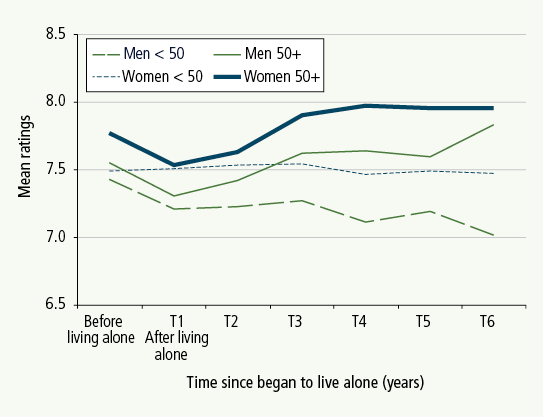
Note: Life satisfaction ratings are on a 0-10 scale from 0 "completely dissatisfied" to 10 "completely satisfied".
Source: HILDA W1-W12
| Living arrangements | Men | Women | Total |
|---|---|---|---|
Note: For each indicator of each gender (and total), association in responses before and after transition out of living alone is tested using McNemar's test for categorical indicators and paired t-test for continuous indicators (* p < .05; ** p < .01; *** p < .001). | |||
| Ratings of general health as fair or poor | |||
| While living alone (%) | 12.0 | 18.0 | 14.8 |
| After living alone (%) | 11.5 | 17.6 | 14.3 |
| Mean score of vitality (0-100, higher score = greater vitality) | |||
| While living alone | 61.9 | 58.5 | 60.3 |
| After living alone | 62.8 | 57.7 | 60.4 |
| Mean score of mental health (0-100, higher score = better mental health) | |||
| While living alone | 72.2 | 70.3 | 71.3 |
| After living alone | 73.9 | 71.6 | 72.8 |
| High satisfaction with life overall (ratings 8-10 on a scale from 0 "completely dissatisfied" to 10 "completely satisfied") | |||
| While living alone (%) | 54.1 *** | 58.5 *** | 56.1 *** |
| After living alone (%) | 60.1 | 63.9 | 61.8 |
| No. of spells | 992-1,430 | 876-1,136 | 1,868-2,566 |
Does subjective wellbeing improve or decline when people stop living alone?
This section focuses on changes in subjective wellbeing when people stop living alone. The general picture is similar to that observed when people begin to live alone. That is, the transition from living alone appears to have very little effect on subjective wellbeing (Table 12).
- Health is rated the same while living alone and after ceasing to live alone.
- Vitality remains unchanged following the transition from living alone.
- Mental health scores after ceasing to live alone are much the same as when living alone.
The only measure on which there is any statistically significant (albeit very modest) change in subjective wellbeing once people stop living alone is in the realm of overall life satisfaction. While living alone, 56% of people reported high levels of life satisfaction compared to 62% of the same people once they stopped living alone. This modest level of change was evident for both men and women once they stopped living alone. The rise in the proportion reporting high life satisfaction may be partly the result of living with a partner rather than simply ceasing living alone.
Table 13 reports the proportion expressing high life satisfaction while living alone and after ceasing to live alone by age groups of men and women. Again, there is an age dimension to changes to life satisfaction once people stop living alone - especially among men.
- Among older men (aged 60 and over) stopping living alone led to an increase in the proportion expressing high life satisfaction. While living alone, 54% were highly satisfied but when these men stopped living alone, 69% were highly satisfied with life.
- No such change in life satisfaction is seen among older women (aged 60 years and over) who stop living alone. Older women were relatively highly satisfied both while living alone and once they ceased living alone (72% compared to 68%).
- The figure that stands out among older people living alone is the relatively low level of life satisfaction among men in their forties while they live alone (only 46% are highly satisfied).
- When both men and women in their 20s and 30s stop living alone, they experience some increase in life satisfaction. This is likely to be due to these men and women partnering and building a family.
| Living arrangements | Age at the end of living alone | ||||
|---|---|---|---|---|---|
| 20-29 | 30-39 | 40-49 | 50-59 | 60+ | |
Note: For each indicator of each age group, association in responses before and after transition out of living alone is tested using McNemar's test for categorical indicators and paired t-test for continuous indicators (* p < .05; ** p < .01; *** p < .001). | |||||
| High satisfaction with life overall (ratings 8-10 on a scale from 0 "completely dissatisfied" to 10 "completely satisfied") | |||||
| Men | |||||
| While living alone (%) | 60.3 * | 51.5 * | 45.8 | 50.0 | 54.3 * |
| After living alone (%) | 65.2 | 57.5 | 50.2 | 58.6 | 69.1 |
| No. of spells | 363-589 | 255-367 | 196-253 | 113-140 | 65-81 |
| Women | |||||
| While living alone (%) | 57.9 * | 54.0 ** | 51.7 | 61.9 | 72.0 |
| After living alone (%) | 63.6 | 65.5 | 56.6 | 66.4 | 68.2 |
| No. of spells | 390-525 | 157-200 | 115-145 | 109-134 | 105-132 |
In summary, while there is some evidence that living alone is linked with a decline in life satisfaction for some groups of men (and for fewer groups of women), the strongest message from the analysis of changes in subjective wellbeing as people move into and out of solo living arrangements is the absence of an effect. Even in examples where subjective wellbeing changes as people move into and out of these arrangements, the extent of change is fairly modest.
Where the changes on wellbeing are evident, the patterns suggest that this is likely because the transition to and from living alone is linked to other changes. It appears that the impact of living alone on life satisfaction occurs when living alone results from relationship breakdown or widowhood or when living alone ends because of the formation of a new relationship.
Main points
While living alone appears to have some effect on social connections, health behaviour and subjective wellbeing, these effects were modest, specific to particular subgroups and only detected on a limited range of wellbeing indicators.
While some differences were detected between those living alone and those living with others, often these differences could not be attributed to living alone - rather they were likely to be due to the different characteristics of people who lived alone.
The most effective way to detect an effect of living alone is to look at changes in behaviour and feelings as people move into and out of living alone arrangements.
When using a variety of indicators of wellbeing and ways of detecting the effect of living alone, the following threads emerged.
- Involvement with friends and family members who live elsewhere increased and certainly was not negatively affected by beginning to live alone. This increased involvement with friends and family was sustained both in the short and medium term and declined when people stopped living alone. It is unclear to what extent this may reflect people staying connected with those they previously lived.
- Participation in community organisations was unaffected by living alone.
- Those who lived alone displayed higher levels of boredom and loneliness and lower feelings of social support than those who lived with others.
- Feelings of loneliness and boredom increased when people began to live alone.
- There were some gender-based differences in the link between subjective wellbeing measures and living alone.
- Among women who began to live alone the elevated levels of loneliness upon beginning to live alone declined over time so that in the medium term, levels of loneliness returned to pre-living alone levels.
- Among men, beginning to live alone led to sustained increase in loneliness.
- When people stopped living alone:
- regular contact with friends and family living elsewhere declined;
- among women, there was some decline in participation in community organisations;
- feelings of social support increased; and
- loneliness among men declined.
- Living alone had no negative impact on the health behaviour of either men or women (as measured by smoking and levels of drinking). Although men who lived alone drank and smoked more than those not living alone, this was not due to living alone.
- Commencing to live alone did not result in any increase in drinking or smoking. If anything, levels of drinking and smoking declined in in the medium term.
- Women who commenced living alone exhibited a decline in drinking.
- Stopping living alone resulted in no change in smoking or drinking except among younger women who reduced their levels of drinking.
- Living alone had no apparent effect on self-rated health, reported mental health or "vitality".
- Living alone negatively affected levels of life satisfaction.
- Life satisfaction declined when people commenced living alone.
- The loss of life satisfaction among women was restricted to those who commenced living alone when they were over 50.
- The loss in life satisfaction among men was evident among those who commenced living alone in their thirties, forties and when they were aged 60 or older.
- The loss of life satisfaction upon beginning to live alone recovered for both older men and women who began to live alone.
- Beginning to live alone led to a loss in life satisfaction among men aged under 50 but not among similarly aged women.
- The loss in life satisfaction among these men endured in both the short and medium term.
- The effect of living alone on life satisfaction can also be observed with men who stop living alone.
- Life satisfaction improved among older men who stopped living alone.
- Life satisfaction did not improve for older women who stopped living alone.
Overall, living alone appears to have some negative effects on levels of loneliness and life satisfaction. These effects are generally reasonably modest and are most evident among men who live alone. While living alone has some negative effects on women, they typically adjust more quickly than men.
References
De Vaus, D. & Qu, L. (2015a). Demographics of living alone (Australian Family Trends No. 6). Melbourne: Australian Institute of Family Studies.
De Vaus, D. & Qu, L. (2015b). The nature of living alone in Australia (Australian Family Trends No. 9). Melbourne: Australian Institute of Family Studies.
Ware, J. E., Snow, K. K., Kosinski, M., & Gandek, B. (2000). SF-36 Health survey: Manual and interpretation guide. Lincoln, R.I.; QualityMetric Inc.
1 In the National Health and Medical Research Council's 2009 Australian Guidelines to Reduce Health Risks from Drinking Alcohol, a standard drink is equivalent to 100 ml of wine (13.3% alcohol) or 375 ml of beer (3.5% alcohol).
Media releases
At the time of writing, Professor David de Vaus was a Senior Research Fellow at the Institute. He is currently Emeritus Professor at Queensland and La Trobe universities. Dr Lixia Qu is a Senior Research Fellow at the Australian Institute of Family Studies.
Feature image © istockphoto/FredFroese
Qu, L., & de Vaus, D. (2015). Living alone and personal wellbeing (Australian Family Trends No. 10). Melbourne: Australian Institute of Family Studies.
978-1-76016-056-2
Download Research report
Related publications

The nature of living alone in Australia
What is the nature of living alone and what does it means to the individuals involved?

Life satisfaction across life course transitions
Does life satisfaction improve or decline as people grow older? What happens to people's outlook as they pass through…
Demographics of living alone
People living alone now account for a quarter of all Australian households.