Preschool participation among Indigenous children in Australia
You are in an archived section of the AIFS website
Learning begins long before formal school enrolment, and research demonstrates the positive impact of quality preschool programs. The early childhood years are formative in setting the framework for later educational achievement (Elliot, 2006; Magnusson, Ruhm, & Waldfogel, 2004; Sylva, Melhuish, Sammons, Siraj-Blatchford, & Taggart, 2009) with the benefits of preschool magnified for those from disadvantaged backgrounds (Lynch, 2005; Schweinhart et al., 2005). These advantages are recognised in government policy through a range of Council of Australian Governments (COAG) programs. The $970 million National Partnership on Early Childhood education program, for example, commits to providing every Australian child with access to a quality preschool program in the year before fulltime school (Productivity Commission, 2013). The particular preschool needs of Indigenous children living in remote communities are also central to the Closing the Gap Indigenous policy framework targets (Department of Families, Housing, Community Services and Indigenous Affairs [FaHCSIA], 2009). Since 2008, consecutive Closing the Gap Prime Minister's Reports (Department of the Prime Minister and Cabinet, 2010; 2014) have noted substantial enrolment growth, with the 2014 report estimating that 88% of Indigenous children in remote areas are enrolled in preschool, up from around 55% in 2006 (Australian Bureau of Statistics [ABS], 2006).
Children from remote areas make up only about 22% of the Indigenous preschool-age population, however, and enrolment increases have not occurred at the same rate across all areas. During 2005-08, when Indigenous preschool enrolments increased by 31% in remote areas and 12% among all Australian children,1 the increase was only 9% for Indigenous children in metropolitan areas. These differentials are reflected in current figures. In 2011, 63% of Aboriginal and Torres Strait Islander children in major cities, 76% of those in inner/outer regional centres and 91% in remote/very remote areas were enrolled in a preschool program the year before fulltime schooling. On these figures, between one-quarter and one-third of non-remote Aboriginal and Torres Strait Islander children are currently not accessing preschool (Baxter & Hand, 2013; Productivity Commission, 2013).
Understanding the factors contributing to Indigenous children's preschool participation is hampered by a paucity of research. While literature detailing lower rates of Indigenous preschool enrolment and attendance exists (see, for example, Kronemann, 2007; White & Wood, 2009), little research investigates the factors influencing enrolment (see Biddle, 2007; Grace & Trudgett, 2012, as exceptions). The current article adds to the evidence, asking: What factors are associated with Indigenous children's preschool enrolment across areas? To do this, the first two waves (in 2008 and 2009) of the Longitudinal Study of Indigenous Children (LSIC) are explored.
Literature review
Preschool is non-compulsory but has become a social norm for Australian children. Preschool or kindergarten is available to most children from around age 4, with some variation on the starting criteria between states. For example, in New South Wales a child can enrol in preschool at the beginning of the school year if they turn 4 years of age by 31 July of that year, but in Tasmania, their fourth birthday must have occurred by 1 January to be eligible (Dowling & O'Malley, 2009). Preschool programs are also offered outside the school setting by some private or community-based programs and within some long day-care programs (Harrison, Ungerer, Smith, Zubrick, & Wise, 2009).
The value of preschool is supported by Australian and overseas studies identifying a range of specific preschool attendance benefits. Better language, literacy, numeracy, cognitive and problem-solving skills at the start of formal schooling are just some of the established individual gains (see Harrison et al., 2009; Sylva et al., 2009; Schweinhart et al., 2006) and these benefits carry over into later academic achievement. Children from disadvantaged backgrounds are even more likely to reap the educational benefits (see Collins et al., 2000; Elliot, 2006; Lynch, 2005; Magnuson et al., 2004; Mukherjee, 1999; Sylva et al., 2009). Harrison et al.'s (2009) Longitudinal Study of Australian Children-based study confirms higher receptive vocabulary and school-readiness capacities among children who participated in preschool, and a set of factors related to lower participation. Children from households with lower maternal education; with more financial stress; with more children in the household; living in a less advantaged neighbourhood; who speak a language other than English; and who have a mother with higher levels of psychological distress or poorer parenting behaviour were less likely to be enrolled. ABS (2006) data reveal that children of lone parents, low employment and lower income families are less likely than their counterparts to attend preschool.
We know that Indigenous families are over-represented among families with many of these characteristics. What we do not know is how applicable and influential these factors are for Indigenous families. Neither do we know if other family, socio-demographic, neighbourhood and cultural aspects are likely to be important. There is a dearth of research, particularly quantitative research, in this area, and as the varied rate of preschool enrolment across areas demonstrates, grouping diverse Indigenous peoples together as one evidence base can create a flawed picture. Engagement with the preschool system occurs in specific social, cultural and physical environments for the 78% of Aboriginal and Torres Strait Islander children and their families living in urban and regional areas. For children in remote areas, preschool will be a primarily Indigenous social and cultural environment, with the majority of classmates and teachers also Aboriginal or Torres Straits Islander people. Although some Indigenous preschools exist outside remote areas, most urban and regional Indigenous children will attend preschools where they are racially, socially and culturally a minority.
Of the existing research in the field, Biddle's (2007) two-model analysis, using 2001 Census socio-demographic data,2 shows Indigenous preschool participation rates influenced by the same factors as non-Indigenous households. Higher parental education and higher equivalised household income influenced participation positively and remoteness influenced participation negatively. The influence of these variables, however, was greater in Indigenous households. Grace and Trudgett's (2012) recent qualitative study identifies three key barriers to Indigenous families engaging with preschool. These were the practical difficulties of transporting children to school; a cultural barrier of families feeling shame at their own low literacy and/or not always being able to provide appropriate clothing, footwear and food; and the complexities of community division on decisions of which preschools it was appropriate for their children to attend.
The interconnections between children and their family and school, community, social and cultural environments are highlighted by Martin (2007) when she contends that many current early childhood participation programs are based around culturally non-neutral expectations and presumptions. These conclusions are supported by studies in the allied field of school readiness. Dockett, Perry and Kearney (2010) find Indigenous children's school readiness is also influenced by the schools' readiness for the children, manifested by employment and valuing of Indigenous school staff and positive school involvement for the children's families.
The substantial group of urban and regional Indigenous children not currently participating in preschool suggests many of these already disadvantaged children will face additional educational disadvantage. The current study, therefore, has the capacity to add to our knowledge in this important area, and contribute to the development of family and education policy in relation to closing the gap between Indigenous and non-Indigenous Australians.
Methods
The LSIC survey collects a comprehensive range of measures on family background, household composition, school attendance and cultural and attitudinal values. Factors relating to family background include: English as a second language; family and household stability; family experience of child removal; current educational activities of the primary carer; family and life stressors; and primary carer's health/disability. Available socio-economic variables include: household income; sources of income; employment status of primary carer; education of the primary carer; housing security and quality; number of household occupants. Other broader structural factors that may be important include neighbourhood safety and geographical remoteness. Cultural and attitudinal factors include: parent's educational aspirations for their child, availability of children's books in households; activities undertaken with children, particularly reading. Finally there is information available on child health/disability; child's social-emotional assessment; child development; education resources and deployment within household.
Data and analytic sample
The data come from the first two waves of the Longitudinal Study of Indigenous Children. Wave 1 (2008) comprised 1,687 children and their families. A non-representative purposive sampling design was used and Indigenous children were recruited from 11 sites around Australia, including: Northern Territory Top-End (14%); South-East Queensland (12%); South Coast NSW (10%); Mount Isa, Mornington, Doomadgee, Normanton (10%); Western Sydney (10%); Dubbo (9%); Greater Shepparton (8%); Torres Strait and Northern Peninsula Area (8%); Kimberley Region (7%); Adelaide (6%); and Alice Springs (4%). These sites were selected on the basis that they covered a range of socio-economic and community environments where Aboriginal and Torres Strait Islander children live. It should be noted that LSIC was not designed to be nationally representative, nor representative of different remote areas. The study comprises two cohorts: a Kid cohort born between December 2003 and November 2004 (n = 727); and a Baby cohort born between December 2006 and November 2007 (n = 960). The Kid cohort was aged 3.5 to 4.5 in Wave 1 and 4.5 to 5.5 years in Wave 2. Wave 2 (2009) had a 90% response rate (n = 1,524, Kid cohort = 655, Baby cohort = 869) (FaHCSIA, 2009).
Information on the Kid cohort from Waves 1 and 2 was combined into a longitudinal data file. Each state and territory has slightly different rules of eligibility for preschool attendance and naming conventions for the year prior to formal schooling (Dowling & O'Malley, 2009). For the purposes of this research, the definition of the preschool year was restricted to the "year before formal schooling", consistent with Dowling and O'Malley (2009). Therefore, the sample was limited to children aged 4 and over who are not attending school. These restrictions resulted in a sample of 543 children. A small number of cases (n = 24) who have missing data on key variables were excluded; and the final analytic sample comprised 519 children (with 246 children in scope in Wave 1, 151 in scope in Wave 2, and 122 in scope for both waves). Note some children may have been in scope (i.e., aged 4 and over and not attending school) over both waves of data collection, depending on when their family was interviewed relative to their birth date and when compulsory formal schooling starts in their state or territory.
Preschool attendance
Following Baxter and Hand (2013) the measure of preschool for this study is derived from three questions that were asked identically in Waves 1 and 2. The first question asks: "Does [study child] go to preschool, kindergarten or school?" For those respondents who replied "Yes" to this question, the sample was further delimited using a second question: "Does [study child] go to:
- Year 1 in school?
- pre-Year 1 program in a school (prep, kindergarten, reception, transition, pre-primary)?
- preschool program in a school?
- preschool program in a non-school centre?
- mobile preschool?"
If the study child's parent answered 3, 4 or 5 to the above question, they were further asked: "Does [study child] go to child care, day care or family day care?"; and "What type of programs do you now use for [study child]?" If that parent responded: "Day care centre where the child goes to a pre-school program", then that child was considered to be attending preschool.
The variable for preschool attendance indicated whether the child attends preschool: 1 = yes, with a referent of 0 = no.
Independent variables
The factors selected as independent variables were grouped into four areas: region characteristics; household and family characteristics; primary parent characteristics;and study child characteristics. The analysis concentrated on variables where there were identical measures in both waves, or on time invariant measures measured only at one wave (such as whether a family member was part of the Stolen Generations). The descriptive statistics for all model variables are presented in Table 1.
| Variable | % a | Mean (SD) b | Variable | % a | Mean (SD) b |
|---|---|---|---|---|---|
| Study child attends preschool | Parent living elsewhere: | ||||
| Yes | 57 | Yes (ref.) | 42 | ||
| No | 43 | No | 54 | ||
| Region characteristics (LORI) | Refused | 4 | |||
| None (ref.) | 25 | Primary parent characteristics | |||
| Low LORI | 57 | Female (1 = yes) | 97 | ||
| Moderate LORI | 8 | Age (years) | 31.88 (7.5) | ||
| High/extreme LORI | 10 | Highest level of education: | |||
| Household/family characteristics | Bachelor degree or higher (ref.) | 3 | |||
| Household income (week): | Diploma/certificate | 19 | |||
| Low (< $249) | 22 | Completed Year 12 | 15 | ||
| Medium ($250-599) | 33 | Completed Year 10 | 37 | ||
| Medium/high ($600-999) | 21 | Less than Year 10 | 16 | ||
| High ($1,000+) | 17 | Missing | 10 | ||
| Missing | 7 | Employed (1 = yes) | 32 | ||
| Wages the main source of household income c | 44 | Dominant language: | |||
| Government benefits the main source of household income | 69 | Bilingual (Indigenous/English) | 10 | ||
| English | 83 | ||||
| Problems with house (1 = yes) | 35 | Indigenous | 7 | ||
| Housing tenure (years) | 4.8 (5.0) | Study child characteristics | |||
| Missing housing tenure (1 = yes) | 2 | Female (1 = yes) | 53 | ||
| Number of people in household | 1.9 (1.0) | Age of study child (months) | 55.2 (5.0) | ||
| Number of books in household: | Concerns about learning and development: | ||||
| 51+ (ref.) | 6 | No | 88 | ||
| 41-50 | 6 | Yes | 9 | ||
| 31-40 | 32 | Missing/refused | 3 | ||
| 21-30 | 12 | General health: | |||
| 11-20 | 12 | Excellent | 14 | ||
| 6-10 | 14 | Very Good | 28 | ||
| 0-5 | 18 | Good | 45 | ||
| Family member read to study child in last week: | Fair | 11 | |||
| Yes (ref.) | 80 | Poor | 2 | ||
| No | 19 | Study child has ear problems (1 = yes) | 17 | ||
| Missing/don't know | < 1 | Study child has eye problems (1 = yes) | 4 | ||
| Family member part of Stolen Generations: | Parent 1 has concerns about study child behaviour (1 = yes) | 19 | |||
| Yes (ref.) | 27 | Parent 1 concerns how child gets along with others (1 = yes) | 10 | ||
| No | 20 | Study child attends cultural events (1 = yes) | 74 | ||
| Don't know | 8 | Study child identifies with clan (1 = yes) | 52 | ||
| Refused | 37 | Study child has connection to country (1 = yes) | 56 | ||
| Missing | 8 | ||||
| Wave observations | 619 | ||||
| Number of children | 519 | ||||
Notes: a Proportion reported only for categorical measures. b Mean and standard deviation reported only for continuous measures. c Some participants answered "Yes" to both wages and government benefits being the main source of income.
The only regional information available to us was the Level of Relative Isolation (LORI) classification. This is an indicator based on geocoding of the home address of participants. Four categories of isolation have been defined, ranging from: 1= none (i.e., the Brisbane metropolitan area); 2 = low (i.e., Shepparton); 3 = moderate (i.e., Derby), 4 = high or extreme (e.g., Doomadgee or Moa Island).
For household and family characteristics, income measures were included that capture the amount and source of income. First, a categorical measure was included for the amount of weekly household income received, with the groups: 1 = low (< $249); 2 = medium ($250-599); 3 = medium/high ($600-999); and 4 = high ($1,000+). Low income was the reference group. Second, two indicators were included for the source of household income. The first indicates whether wages or salary are the main source (1 = yes, 0 = no), and the second indicates whether government benefits are the main source (1 = yes, 0 = no). A measure of housing quality was included, indicating whether the dwelling had any major things that needed fixing (1 = yes, 0 = no). Also included was a continuous measure of housing tenure, indicating the number of months in the current dwelling, this ranged from 0 to 407 months. There were 11 missing values on housing tenure. These were coded to the mean value of 55.76 months and a dummy for missing was included in all models. A continuous measure was included for the total number of relatives in the household, ranging from 0-9. The total number of books in the household was a categorical measure indicating: 1 = 0-5; 2 = 6-10; 3 = 11-20; 4 = 21-30; 5 = 31-40; 6 = 41-50 7 = 50+. "50+" was used as the reference. Also included was a measure of whether a family member read a book to the study child in the last week (1 = yes, 0 = no). A measure of whether or not the study child has a family member who was part of the Stolen Generations was also developed. Due to the large number of non-responses to this question, the following categories were developed: 1 = yes; 2 = no; 3 = don't know; 4 = refused; 5 = missing. "Yes" was taken as the reference. Finally, an indicator of whether the study child has a parent living elsewhere was included. This was coded: 1 = yes; 2 = no; 3 = missing.
A range of characteristics of the primary parent that may be important for preschool attendance were identified. Note, the primary parent (caregiver) is not necessarily the biological parent of the study child. Gender of the primary parent is coded: 1 = female. A continuous measure of age in years is also included, ranging from 18 to 66 (mean age 32). The 10 missing cases on age were given the mean score of 32, and a dummy for missing was included in all models. The measure of education of the primary parent included: 1 = bachelor degree or higher; 2 = diploma/certificate; 3 = completed Yr 12; 4 = completed Year 10; and 5 = less than Year 10. "Bachelor degree or higher" was used as the reference. A measure for whether or not the primary parent is employed was used: 1 = yes and 0 = no. Finally, a measure for the dominant language spoken by the primary parent was included, with the categories: 1 = bilingual (Indigenous/English); 2 = English; 3 = Indigenous.
All measures of the study child were reported by the primary parent. The characteristics of study children included gender (1 = female, with a referent of 0 = male) and their age in months, ranging from 48 to 64 months. There was a measure included of whether the primary parent has any concerns about how the study child is learning preschool and school skills (1 = yes, 0 = no). A measure of general health, indicating: 1 = excellent; 2 = very good; 3 = good; 4 = fair and 5 = poor. Excellent was the reference category. Indicators were included for whether the study child has had any problems with their ears or hearing (1 = yes, 0 = no), or with their eyes or sight (1 = yes, 0 = no). Finally, two measures of social adjustment were included. One indicated whether the primary parent has any concerns in relation to how the study child behaves (1 = yes, 0 = no); the other indicated any concerns about how the study child gets along with others (1 = yes, 0 = no).
Analytic approach
The analysis proceeded in two stages. First, the descriptive statistics of preschool attendance and preschool attendance by remoteness were examined. Second, multivariate regression analysis was undertaken to investigate which characteristics are associated with preschool attendance. Given that the dependent variable was a binary measure indicating preschool attendance; 1 = yes and 0 = no, a logistic regression for binary data was conducted. In the study design, however, the data were clustered by area and included some repeated measures on the same individuals and, therefore, observations were not independent. Rather, the responses were correlated, and a standard logistic regression model that assumes independent observations was not appropriate. Using MLwiN software, a two-level multilevel logistic model was estimated, which takes into account area level clustering (level 2) and multiple observations of individuals (level 1). Consistent with best practice, the MCMC3 estimation procedure was used (Browne, 2012).
Results
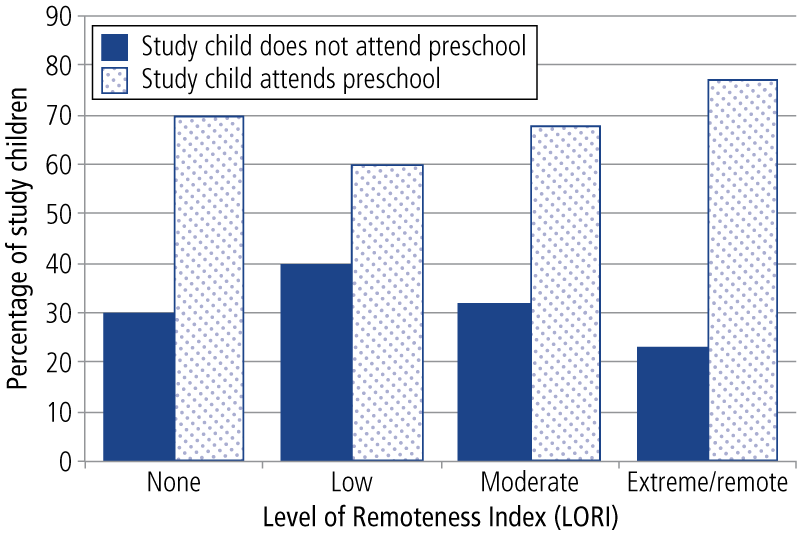
Table 1 shows that overall around 57% of the sample attended preschool, and the remaining 43% did not attend preschool. We further investigated whether that varied by remoteness. These results are presented in Figure 1. This graph shows that preschool attendance is highest in extreme/remote areas and lowest in areas of low remoteness.
Figure 1: Study child preschool attendance, by remoteness
The multilevel regression model results are presented in Table 2. Odds ratios, log odds (coefficients) and standard errors (SE) of the log odds are reported. For the odds ratios, a coefficient greater than 1 means the odds go up, while a coefficient less than 1 means the odds go down. The log odds are interpreted like regular coefficients where a minus sign indicates a negative association. Results indicate that the level of remoteness was not significantly associated with preschool attendance. In further analysis (not reported), it was found that the inclusion of the measure for the dominant language of the primary parent in the models rendered the area measure non-significant. This suggests that any difference in the preschool attendance of study children by remoteness is largely related to differences in the dominant language of the primary parent.
| Variable | Odds ratio | Log odds | SE | Variable | Odds ratio | Log odds | SE | |
|---|---|---|---|---|---|---|---|---|
| Region characteristics (LORI) | Primary parent characteristics | |||||||
| None (ref.) | 1.00 | - | Female (1 = yes) | 0.81 | -0.21 | 1.36 | ||
| Low LORI | 0.85 | -0.16 | 0.89 | Age (years)> | 0.99 | -0.01 | 0.03 | |
| Moderate LORI | 2.77 | 1.02 | 1.46 | Highest level of education: | ||||
| High/extreme LORI | 1.03 | 0.03 | 1.45 | Bachelor degree or higher (ref.) | 1.00 | - | ||
| Household/family characteristics | Diploma/certificate | 0.25 | -1.40 | 1.53 | ||||
| Household income (week): | Completed Year 12 | 0.27 | -1.31 | 1.58 | ||||
| Low (< $249) | 1.00 | - | Completed Year 10 | 0.88 | -0.13 | 1.57 | ||
| Medium ($250-599) | 1.43 | 0.36 | 0.63 | Less than Year 10 | 0.17 | -1.78 | 1.59 | |
| Medium/high ($600-999) | 0.31 | -1.16 | 0.72 | Employed (1 = yes) | 0.42 | -0.85 | 0.63 | |
| High ($1,000+) | 0.47 | -0.75 | 0.93 | Dominant language: | ||||
| Wages main source of household income (1 = yes) | 1.27 | 0.24 | 0.99 | Bilingual (Indigenous/English) | 1.57 | 0.45 | 1.06 | |
| English (ref.) | 1.00 | - | ||||||
| Goverment benefits main source of household income (1 = yes)> | 0.21 | -1.57 * | 0.76 | Indigenous | 20.90 | 3.04 * | 1.51 | |
| Study child characteristics | ||||||||
| Problems with house (1 = yes) | 0.72 | -0.33 | 0.47 | Female (1 = yes) | 0.92 | -0.08 | 0.47 | |
| Housing tenure (years) | 1.14 | 0.13 * | 0.06 | Age (months) | 1.42 | 0.35 *** | 0.05 | |
| Missing housing tenure (1 = yes) | 0.07 | -2.69 | 1.80 | Concerns about learning and development: | ||||
| Number of people in household | 0.98 | -0.02 | 0.29 | No | 1.00 | - | ||
| Number of books in household: | Yes | 0.10 | -2.35 ** | 0.90 | ||||
| 51+ | 6.17 | 1.82 | 1.19 | General health: | ||||
| 41-50 | 6.05 | 1.80 | 1.16 | Excellent (ref.) | 1.00 | |||
| 31-40 | 1.01 | 0.01 | 0.67 | Very good | 0.93 | -0.07 | 0.77 | |
| 21-30 (ref.) | 1.00 | - | Good | 0.70 | -0.35 | 0.74 | ||
| 11-20 | 0.33 | -1.11 | 0.83 | Fair | 0.41 | -0.90 | 0.95 | |
| 6-10 | 0.24 | -1.41 * | 0.86 | Poor | 0.03 | -3.46 * | 1.77 | |
| 0-5 | 1.11 | 0.10 | 0.97 | Study child has ear problems (1 = yes) | 4.05 | 1.40* | 0.65 | |
| Family member read to study child in last week | Study child has eye problems (1 = yes) | 2.29 | 0.83 | 1.08 | ||||
| Yes (ref.) | 1.00 | P1 has concerns about study child behavior (1 = yes) | 1.57 | 0.45 | 0.66 | |||
| No | 0.59 | -0.52 | 0.61 | |||||
| Family member part of Stolen Generations: | P1 concerned study child doesn't get along with others (1 = yes) | 2.89 | 1.06 | 0.81 | ||||
| No (ref.) | 1.00 | |||||||
| Yes | 1.27 | 0.24 | 0.81 | Study child attends cultural events (1 = yes) | 2.10 | 0.74 | 0.70 | |
| Don't know | 1.63 | 0.49 | 1.13 | Study child identifies with clan (1 = yes) | 1.19 | 0.17 | 0.63 | |
| Refused | 1.19 | 0.17 | 0.75 | Study child has connection to country (1 = yes) | 0.61 | -0.49 | 0.66 | |
| Parent living elsewhere: | ||||||||
| Yes (ref.) | 1.00 | |||||||
| No | 1.14 | 0.13 | 0.55 | |||||
| Refused | 0.24 | -1.44 | 1.35 | |||||
| Fixed | -15.59 *** | 3.50 | ||||||
| Random (area) | 26.05 ** | 11.11 | ||||||
| Wave observations | 619 | |||||||
| Number of children | 519 | |||||||
Notes: * p < .05, ** p < .01, *** p < .001.
In relation to household and family characteristics, our results indicated that the amount of household income received each week was not significantly associated with preschool attendance. In households where government benefits were the main source of household income, Indigenous children were significantly less likely to attend preschool. In additional analysis (not reported), examining the relationships between household income received and the source of the income, we found that the inclusion of either wages or benefits in the models resulted in the association between weekly household income and preschool attendance becoming non-significant. This suggests that the main source of household income is strongly related to the amount of household income received. When all income measures are included, study children in households with benefits as the main source of income, which are also more likely to be low income households, are significantly less likely to be attending preschool. Results also suggested that the longer the study child and their family have lived in their current dwelling, the more likely they were to attend preschool. There is some suggestion that the number of books in the household was important. Overall, it was found that study children in households with more books were more likely to attend preschool than those with less books, although this was only statistically significant for households with 21-30 books compared to households with 6-10 books.
The only characteristic of the primary parent significantly associated with preschool attendance was when parents were dominant in an Indigenous language. Here, the child had a higher likelihood of attending preschool. Note, this result should be viewed with some caution. The odds ratio for the association between Indigenous language and preschool attendance is very large (20.90), this reflects the very small number of study children who are in this group. For the children themselves, the results indicate that the older the child in months, the more likely they are to attend preschool. All children in our sample were aged over 4, but the older they were, the more likely they were to attend preschool. Parents' concerns over the child's learning and development were negatively associated with preschool attendance. If parents reported the study child was in poor health, compared to excellent health, the study child was less likely to be attending preschool. Finally, study children who had problems with their ears or hearing were more likely to be attending preschool.
Discussion
In this paper, the association between a range of regional, household and family, primary parent and child characteristics and preschool attendance in a sample of 4-year old Indigenous children in Australia was investigated. As would be expected, the age of the study child has a strong influence on preschool attendance, as children get closer to the age of 5, they have a much greater likelihood of attending preschool than when they have just turned 4. Contrary to what we expected from the empirical data on the current spread of preschool enrolment by area, we did not find level of remoteness to be significant. This result may be an artefact of the timing of its collection, in 2008 and 2009, when enrolments in remote areas were rising, but had not reached their current levels. Analysis of data from LSIC Waves 4 and 5 (2011, 2012), when the Baby cohort reached preschool age, may produce different results. Also, the results indicate that the language spoken and remoteness are highly correlated, reducing the influence of the remoteness variable in the model when Indigenous language is also included.
At the household level we found that stability of housing and exposure to learning resources such as books in the household were both positively associated with preschool attendance. Research consistently shows that a majority of Indigenous households, regardless of location, are in rental accommodation, the least stable housing tenure (Walter, 2008). That stability of housing is linked with risk factors for non-enrolment could explain the strong association found between enrolment and housing stability. Moving residences reduces families' capacity to know and learn about the quality and cultural sensitivity of local preschool options. The disruption to household functioning from moving between residences also reduces a family's ability to move through the various bureaucratic and practical processes involved in enrolling a child in preschool.
The finding that household income was not significantly associated with preschool attendance contrasts with Biddle (2007) who found that in Indigenous households with lower income, children aged 4-5 years are significantly less likely to be attending preschool. Nevertheless, it was found that households who have government benefits as a major source of income are less likely to have their children attend preschool. This suggests that it is not necessarily the amount of household income, but also the source that might influence preschool attendance. In line with the qualitative findings from Grace and Trudgett (2012), those reliant on a government benefit may be more likely to experience, or fear the experience of, days or weeks when money is not available to buy the clothes or appropriate food to enable them to send their child to preschool.
It is interesting that the social and economic characteristics of the primary parent were not significantly associated with preschool attendance in our sample. As shown in Table 2, the majority (97%) of primary parents were female. This finding may reflect the fact that it is the socio-economic position of other household members, or of the total household, that is more important for children's preschool attendance (Bainbridge, Meyers, Tanaka, & Waldfogel, 2005; Biddle, 2007). Detailed data on other household members were not available to fully investigate whether or not this was the case.
Children were much less likely to be attending preschool if their primary parent had concerns over their learning preschool and school skills. Arguably, the most intuitive explanation for this finding is that these parents fear their child may not cope in a preschool environment. This result requires some further investigation. The health of study children is also important. Those study children whose primary parents reported that they had poor health were significantly less likely to attend preschool than children who had excellent health. Somewhat counter-intuitively, our results indicate that children with hearing problems were more likely to be attending preschool. This may be because many school and preschool programs also have health programs, and ear and hearing problems may be more likely to be picked up at preschool.
Study limitations
The study has a number of notable limitations. First, the data available did not enable us to take into account the specific area in which the study child is located. With only 11 regions under consideration, it is likely that area differences, particularly in remote areas, have influenced the findings. A second limitation is the relatively small amount of information about the people in the study child's family and household. For example, in his study, Biddle (2007) found that having a family member with a high level of education increased the likelihood of preschool attendance in his sample. As indicated above, this study did not find that the level of education of the primary parent, usually the mother, was associated with preschool attendance. The educational characteristics of the total household, however, may be more influential for the educational outcomes of children than just the mother's (Biddle, 2007).
Implications for policy
Our results indicate that Aboriginal and Torres Strait Islander children in households where housing is unstable, where a major source of income is government pensions or benefits and where there are fewer books are less likely to be enrolled in preschool. Parental concerns about the child's development or health are also significant. The link between the dominant language of the parent and enrolment likelihood also support the empirical data of a widening enrolment gap between those in remote areas and those in regional and especially urban areas. These results have policy implications.
An unanswered question in the literature is why preschool enrolments have improved so dramatically in remote areas. Is it fundamentally related to the provision of services that were not present before, or are other factors involved? We need to know what is working, and why, in remote area preschool enrolment, to establish if these strategies could be effectively translated to policy in urban and regional areas.
What is clear, from a policy perspective, is that the facilitation of preschool participation, and the opportunity for all Indigenous children (rather than just those in remote areas) to access its attendant benefits is a policy prerequisite. However, simply widening the remote area goal would be an inadequate response. As noted in the literature, the social, cultural and physical circumstances of engagement with preschool are different for urban and regional parents. Distances needed to get the child to school, the likely social and cultural dominance of non-Indigenous children and teachers, as well as the lack of everyday familiarity between school staff and families require a different policy framework. Moreover, policy documents from state education departments already list a plethora of Aboriginal engagement programs. The Department of Education, Tasmania (n.d.) for example, has an Early Learning Team whose role is to build connections between schools and families with young children.
The results suggest that the targeting of these programs to families who have moved in recent times, who rely on government pensions and benefits, and whose children are in poorer health could increase their efficacy. The development of explicit programs that address the unique needs of families with these characteristics is likely also required. While locating and engaging with such families can be challenging, Centrelink offices, Aboriginal community centres and Aboriginal health centres could provide an avenue for, at least, initial contact.
Another policy option is the provision of more Indigenous preschools. While making up only a small proportion of the population in urban or regional areas, Indigenous families tend to be concentrated in low socio-economic pockets in towns and cities (Atkinson, Taylor, & Walter, 2010). The relatively high proportion of Indigenous households with dependent children indicate Indigenous-focused preschools could be a viable option in this area. There are a number of successful examples already in existence. For example, the Little Yuin Aboriginal Preschool at Wallaga Lake in New South Wales has been operating for over 20 years (Bermagui Portal, 2013). Aboriginal preschool programs are also run in Dubbo and Grafton among other places. All aim to not only provide a culturally and community appropriate learning environment for children but to aid in making this first formal learning experience a positive one for children and their families. Evaluation of what is working in existing schools could provide a policy foundation to support more Aboriginal preschools and to inform program development within mainstream preschools.
Endnotes
1 This estimate is calculated minus data from Queensland because that state introduced a preparatory year of schooling in 2007, which reduced the proportion of children attending preschool.
2 Biddle's (2007) first model includes seven independent variables: age; ethnicity; education level; presence of other children; household income; state of residence; and remoteness. The second model uses nine with child's age and the presence of an Indigenous preschool worker in the area added to these seven.
3 MCMC refers to Markov chain Monte Carlo estimation.
References
- Andersen, C., & Walter, M. (2010). Indigenous perspectives and cultural identity in education. In M. Hyde (Ed.), Diversity and inclusion in Australian schools (pp. 63-87). Melbourne: Oxford University Press.
- Atkinson, R., Taylor, E., & Walter, M. (2010). Burying indigeneity: The spatial construction of reality and Aboriginal Australia. Social and Legal Studies, 19(3), 311-330.
- Australian Bureau of Statistics. (2008). Childhood education and care (Cat. No. 4402.0). Canberra: ABS.
- Australian Bureau of Statistics. (2006). Population characteristics: Aboriginal and Torres Strait Islander Australians (Cat. No. 4713.0). Canberra: ABS.
- Bainbridge, J., Meyers, M., Tanaka, S., & Waldfogel, J. (2005). Who gets an early education? Family income and the enrolment of 3-5 year olds from 1968 to 2000. Social Science Quarterly, 86(3), 724-745.
- Baxter, J., & Hand, K. (2013). Access to early childhood education in Australia (Research Report No. 24). Melbourne: Australian Institute of Family Studies.
- Bermagui Portal. (2013). Bermagui: Little Yuin Aboriginal Pre-School. Bega, NSW: The Bega Valley. Retrieved from <thebegavalley.org.au/littleyuin.html>.
- Biddle, N. (2007). Indigenous Australians and preschool education: Who is attending? Australian Journal of Early Childhood, 32(3), 9-16.
- Browne, W. J. (2012). MCMC estimation in MLwiN version 2.25. Bristol, UK: University of Bristol.
- Department of Education Tasmania. (n.d.). Aboriginal Education Services. Hobart: Aboriginal Education, Department of Education. Retrieved from <www.education.tas.gov.au/documentcentre/Documents/Aboriginal-Education-Services.pdf>.
- Department of Families, Housing, Community Services and Indigenous Affairs. (2009). Footprints in Time: The Longitudinal Study of Indigenous Children. Key summary report from Wave 1. Canberra: FaHCSIA.
- Dockett, S., Perry, B., & Kearney, E. (2010). School readiness: What does it mean for Indigenous children, families, schools and communities? (Issues Paper No. 2). Canberra & Melbourne: Australian Institute of Health and Welfare & Australian Institute of Family Studies.
- Dowling, A., & O'Malley, K. (2009). Preschool education in Australia. Camberwell, Vic.: Australian Council for Educational Research. Retrieved from <research.acer.edu.au/cgi/viewcontent.cgi?article=1000&context=policy_briefs>.
- Elliott, A. (2006). Early childhood education: Pathways to quality and equity for all children. Camberwell, Vic.: Australian Council for Educational Research.
- Department of the Prime Minister and Cabinet. (2010). Closing the Gap: Prime Minister's report 2010. Canberra: Commonwealth of Australia.
- Department of the Prime Minister and Cabinet. (2014). Closing the Gap: Prime Minister's report 2014. Canberra: Commonwealth of Australia.
- Grace, R., & Trudgett, M. (2012). It's not rocket science: The perspectives of Indigenous early childhood workers on supporting the engagement of Indigenous families in early childhood settings. Australian Journal of Early Childhood, 37(2), 10-18.
- Harrison, L. J., Ungerer, J. A., Smith, G. J., Zubrick, S. R., & Wise, S. (2009). Child care and early education in Australia: The Longitudinal Study of Australian Children (Social Policy Research Paper No. 40). Canberra: Department of Families, Housing, Community Services and Indigenous Affairs.
- Kronemann, M. (2007). AEU briefing paper: Universal preschool education of Aboriginal and Torres Strait Islander children. Melbourne: Australian Education Union.
- Lynch, R. G. (2005). Early childhood investments yields big payoff (Policy Perspectives). San Francisco: WestED.
- Magnuson, K. A., Rhum. C. J., & Waldfogel, J. (2004). Does prekindergarten improve school preparation and performance (Working Paper No. 10452). Cambridge, MA: National Bureau of Economic Research.
- Martin, K. (2007). Here we go 'round the broombie tree: Aboriginal early child realities and experiences in early childhood services. In J. Ailwood (Ed.), Early childhood in Australia: Historical and comparative contexts (pp. 18-34). Frenchs Forest, NSW: Pearson Education.
- Mukherjee, D. (1999). Socio-economic status and school system enrolments. Melbourne: Australian Centre for Equity through Education. Retrieved from <www.aeufederal.org.au/Publications/DMukherjeepaper.pdf>.
- Productivity Commission. (2013). Report on government services 2013. Canberra: Steering Committee for the Review of Government Service Provision (SCRGSP) & Australian Government. Retrieved from <www.pc.gov.au/gsp/rogs/2013>.
- Schweinhart, L. J., Montie, J., Xiang, Z., Barnett, W. S., Belfield, C. R., & Nores, M. (2005). Lifetime effects: The HighScope Perry preschool study through age 40 (Monographs of the HighScope Educational Research Foundation No. 14). Ypsilanti, MI: HighScope Press.
- Sylva, K., Melhuish, E., Sammons, P., Siraj-Blatchford, I., & Taggart, B. (2009). Early childhood matters: Evidence from the effective pre-school and primary education project. London: Routledge.
- Walter, M., (2008). Lives of diversity: Indigenous Australians (Occasional Paper No. 4/2008; Census Series No. 2). Canberra: Australian Academy of the Social Science.
- White, N., & Wood, F. (2009). Setting the up for strong futures: Education as a key to social and human capacity building for indigenous people. Brisbane: Department of Education and Training.
Dr Belinda Hewitt is a Senior Research Fellow at the Institute for Social Science Research, University of Queensland and Professor Maggie Walter is Pro-Vice Chancellor of Aboriginal Research and Leadership at the University of Tasmania.
Hewitt, B., & Walter, M. (2014). Preschool participation among Indigenous children in Australia. Family Matters, 95, 41-50.
11 December 2014