National Elder Abuse Prevalence Study: Final Report
Executive summary
Policy context
Elder abuse has gained significant attention in Australia in recent years as a serious problem requiring increased policy focus. Five abuse subtypes are commonly recognised: financial abuse, physical abuse, sexual abuse, psychological abuse (otherwise known as emotional abuse), and neglect.
The increasingly older age profile of the Australian population makes it particularly important to address elder abuse effectively. The 65 and over age group is expected to more than double from 3.8 million to 8.8 million in the next 25 years.
In Australia, research on elder abuse has been limited to studies looking at particular types of elder abuse (e.g. financial abuse), qualitative studies and those based on administrative data from services who provide support to older people. Such studies are unable to shed light on the proportion of older people aged 65 and over who experience elder abuse or which subtypes are most common. Nor are they able to assess other important issues, such as the extent to which elder abuse is under-reported.
As part of the National Plan to Respond to the Abuse of Older Australians, the Attorney-General's Department commissioned the most extensive empirical examination of elder abuse in Australia to date, the National Elder Abuse Prevalence Study. This report presents the findings of that research program.
Acronyms
| Term | Description |
|---|---|
| ABS | Australian Bureau of Statistics |
| ADL | Activities of Daily Living |
| AGD | Australian Government Attorney-General's Department |
| AIFS | Australian Institute of Family Studies |
| CALD | Culturally and Linguistically Diverse |
| IADL | Instrumental Activities of Daily Living |
| POA | Power of attorney |
| RDD | Random digit dialling |
| SD | Standard deviation |
| SEIFA | Socio-economic Indexes for Areas |
| SGC | Survey of the General Community |
| SOP | Survey of Older People |
| SRC | Social Research Centre |
Glossary
| Term | Definition |
|---|---|
| Ageism | Attitudes that are prejudicial and discriminatory towards people because of their age (Swift et al., 2018). Measured in this research through a scale that comprised attitudes relating to benevolent and hostile ageism (see Box 12.3). |
| Back-coding | Where the verbatim responses to questions with an 'Other' (specify) response option were coded to the original response options or additional categories. |
| Bi-variate analysis | Analysis involving two variables. |
| CALD | In this report, CALD (Culturally and Linguistically Diverse) refers specifically to participants in the Survey of Older People who reported speaking a language other than English at home. |
| Co-occurrence | The presence of two or more forms of abuse in the previous 12 months. |
| Community dwelling | Residing in a private dwelling or self-care retirement village as opposed to residing in institutional care including hospitals, nursing homes or other homes. |
| Confidence interval | Confidence intervals relate to the level of confidence we have that the estimates calculated based on the sample are a true reflection of the Australian population of interest for this study. That is, the Australian population aged 65 years and older living in the community. An interval is calculated using a mathematical formula that produces upper and lower bounds. The value for the population is expected to fall between these bounds with a certain degree of confidence. A 95% confidence interval means that we can be 95% confident that the true population value is between the upper and lower bounds of the interval.
In reporting the prevalence of elder abuse overall and the six subtypes, 95% confidence intervals are provided. The ABS online Basic Survey Design (2020a) explains confidence intervals in this way: 'Assuming that the target population is distributed normally for the characteristic being measured (or, if estimating the mean, the sample is sufficient to assume the sample mean is distributed normally), the interval which contains the true value is usually calculated as being one, two, or three standard errors above and below the survey estimate. This interval is usually referred to as a confidence interval … There is a 95% chance that the confidence interval which extends to two standard errors on either side of the estimate contains the "true value". This interval is called the 95% confidence interval and is the most commonly used confidence interval.' |
| Correlation | A statistical measure (expressed as a number) that describes the size and direction of a relationship between two or more variables (ABS, 2013). |
| Enduring power of attorney | A legal document that enables a person to nominate a person or organisation to make decisions about financial and/or personal matters, if the person is unable to make these decisions for themselves. The person appointed to make the decision is the 'attorney' and their power to make decisions is 'enduring' because it endures or continues when the person granting the power is no longer able to make their own decisions. |
| Family agreement | A family agreement is defined as an agreement to provide care to an older person in return for financial support or benefit (e.g. transfer of assets, property or finances) or a bequest in a will. |
| Intimate partner | Defined in this report as a current partner or spouse. |
| Logistic regression | Logistic regression is a statistical method used to assess the association between a dependent variable and one or more independent (or explanatory) variables. The dependent variable is a binary variable (with two values). Logistic regression can be bivariate (one independent variable and one dependent variable) or multivariate (many independent variables and one dependent variable). In this report, logistic regression analysis is used to assess whether a specific variable is correlated with a specific abuse type, taking into account any other variables in the analysis. While the results can provide an indication of correlation (the extent to which these variables have a linear relationship) between a specific variable and an abuse type, the results do not indicate a causal relationship. |
| Mean | The sum of the value of each observation in a dataset divided by the number of observations (ABS, 2013). |
| Older person | As defined for this research, a person aged 65 years or over. |
| Perpetrator | Defined in this report as a person who has committed the behaviour(s) against the older person. |
| Prevalence | In this report, prevalence refers to the proportion of participants who were classified as having an experience of elder abuse (a specific subtype or overall, depending on the context). The terms 'prevalence', 'rate' and 'proportion' are used interchangeably in describing the occurrence of elder abuse for the whole sample or specific subgroups. For the technical analytic definition applied in deriving prevalence estimates, see chapter 5. |
| Prevalence of abuse | The proportion of people in the population who have experienced abuse (as defined in this report) within a specified time period. The prevalence period for this report is 12 months prior to the survey. |
| Sample weights | As surveys involve a sample (subset of the population) rather than the whole population, sample weights are used to reduce any biases arising from some groups in the population not being adequately represented in a sample. In this report, it is specified where data are reported with sample weights and without sample weights (unweighted). |
| Service provider | Service provider refers to a professional or paid worker that provides a service. For the analysis of perpetrators of abuse, service provider is a new category created following back-coding (refer to footnote 14 in chapter 7). For this report, service provider excludes professional carers (included as a separate category). |
| SEIFA (Socio-economic Indexes for Areas) | ABS product that ranks areas in Australia according to relative socio-economic advantage and disadvantage, and is based on information from the Census of Population and Housing (see ABS, 2018a). |
| Standard deviation | Measures the spread of data around the mean (ABS, 2013). |
| Standard error | Measure of the variation between any estimated population value that is based on a sample rather than true value for the population (ABS, 2013). |
| Statistical significance | Statistical significance relates to how likely the observed effect is due to chance or the specific sample. Results of a statistical test are statistically significant if the p-value of the result is lower than a specified significance level. The p-value represents the probability of obtaining results at least as extreme as the ones observed, assuming that there is no effect or association. In this report, statistical significance is reported for multiple levels in the relevant tables, at significance levels of 5%, 1% and 0.1% (or expressed as *p < .05; **p < .01; ***p < .001). |
| Definitions of abuse used in this report | |
| Elder abuse | The conceptual definition of elder abuse applied in this research was developed for the Australian context. The definition is: a single or repeated act or failure to act, including threats, that results in harm or distress to an older person. This occurs where there is an expectation of trust and/or where there is a power imbalance between the party responsible and the older person. |
| Neglect | Neglect is determined based on a score that takes into account the level of need for support and the extent to which these needs were not met by a defined carer or carers (who participant reported was/were responsible for a specific daily activity that he/she needed assistance with for some or all of the time) in the 12 months prior to the survey. Scores above three were counted as neglect. (See the section 'Technical definitions and measures' in chapter 5 for how scores were generated.) |
| Financial abuse | Financial abuse is defined as the experience of one or more specified incidents, by family member, professional carer, other professional or other known person in the 12 months prior to the survey. Frequency was not taken into account in the definition. |
| Psychological abuse | Participants were asked about their experience of specific behaviour(s) by family member, professional carer, other professional or other known person in the 12 months prior to the survey, and the frequency with which they had experienced those behaviours. Scores were derived based on the frequency of experiencing specific behaviours. Scores above three were counted as psychological abuse. (See the section 'Technical definitions and measures' in chapter 5 for how scores were generated.) |
| Physical abuse | Physical abuse is defined as the experience of one or more specified incidents, by family member, professional carer, other professional or other known person in the 12 months prior to the survey. Frequency was not taken into account in the definition. |
| Sexual abuse | Sexual abuse is defined as the experience of one or more specified incidents, by family member, professional carer, other professional or other known person in the 12 months prior to the survey. Frequency was not taken into account in the definition. |
| Abuse relating to language or culture | Participants who spoke a language other than English were asked if they had experienced specific behaviours (e.g. mis-translated between English and your preferred language on purpose, denied you access to important information in your preferred language, etc.), by family member, carer, carer worker, other professional, other known person in the 12 months prior to the survey and the frequency with which they had experienced those behaviours. Scores above three were counted as abuse relating to language or culture. (See section 'Technical definitions and measures' in chapter 5 for how scores were generated.) |
Introduction
Elder abuse has gained significant attention in Australia in recent years as a serious problem requiring increased policy focus. Five abuse subtypes are commonly recognised within the overarching term elder abuse: financial abuse, physical abuse, sexual abuse, psychological abuse (otherwise known as emotional abuse), and neglect. This report presents findings from the most extensive study on elder abuse in Australia to date.
The core of the three-part research program involved assessing prevalence - that is, the proportion of the population affected in a nationally representative sample of 7,000 community dwelling individuals - of elder abuse (the Survey of Older People (SOP)). A supporting part of the research program - a survey involving 3,400 Australians aged between 18 and 64 years - sheds light on attitudes to older people and awareness of and concerns about elder abuse in the general community (the Survey of the General Community (SGC)). The third part of the research program focuses on examining prevalence and attitudes among culturally and linguistically diverse (CALD) groups through a CALD-focused analysis of the SOP and the SGC (the CALD substudy). The research has been commissioned and funded by the Australian Attorney-General's Department (AGD).
The 65 and older age group is a significant and growing proportion of Australia's population. It is expected to more than double in the next 25 or so years.
In response to recognition of the need to strengthen responses to elder abuse, the then Council of Attorneys-General (CAG) committed to the National Plan to Respond to the Abuse of Older Australians (Elder Abuse) 2019-2023 (the National Plan; [CAG], 2019). A significant component of this plan is recognition of the need to improve the evidence base on elder abuse in Australia to pave the way for more targeted and effective practice and policy responses.
The development of a national response to elder abuse in Australia aligns with the emergence of a focus on national approaches to other complex problems in the past decade, most notably child abuse (the National Framework for Protecting Australia's Children) and family violence (the National Plan to Reduce Violence Against Women and their Children).
Background
Population dynamics
According to the most recent population estimates by the Australian Bureau of Statistics (ABS, 2020b), about 4.1 million Australians are aged 65 and over, representing 16% of the population. Projections show that the size of the age group will continue to increase, both in total numbers and as a proportion of the population. The population projections by the ABS (2018b) indicate that by 2066, this group will increase to 8.6-10.2 million people and represent 21-23% of the population.
These population dynamics underline the significance of understanding the prevalence of elder abuse. With greater numbers of people in the relevant age group, the incidence (the number of people affected) of elder abuse will also increase. Unless effective prevention measures are implemented, this will necessitate an expansion in the agencies and services needed to identify, address and respond to elder abuse. Developing the evidence base on prevalence, dynamics and risk and protective factors will improve the ability of policy makers and practitioners to assess 'what works' in preventing and addressing elder abuse and to tackle the challenges posed by these population dynamics.
From the perspective of culturally and linguistically diverse (CALD) communities, the make-up of the population aged 65 and over also underscores the necessity to understand elder abuse through a CALD lens. As of 2016, more than one third (37%) of the population aged 65 and over were born overseas (ABS, 2017a, 2017b). The majority of this group (20% of the total population aged 65 and over) were born in countries where English is not the primary language, most commonly Italy (3%), Greece (2%) and Germany (1%). People born in the United Kingdom and Ireland account for a further 10% of the population. International evidence indicates that the nature and prevalence of elder abuse is influenced by culture (e.g. Williams, Davis, & Acierno, 2017), with one meta-analysis showing higher prevalence in non-Western countries compared to Western countries (Ho, Wong, & Ho, 2017).
The prevalence of elder abuse needs to be considered in different contexts, including whether the older person is residing in a community or non-community dwelling. This study focuses on community dwelling people. The ABS (2019a) found that the majority of older people aged 65 and over in Australia were residing in a household, including a private dwelling or self-care retirement village (95%), with 5% (or 181,200 people) living in care accommodation, which included hospitals, nursing homes, aged care hostels and other homes. Further data on aged care services from the Australian Institute of Health and Welfare ([AIHW], 2018) indicated that over 1.2 million people received aged care services in 2016-17, with the majority (77%) accessing some form of support or care at their home or a community-based setting. The AIHW also identified that the proportion of older people receiving care at home has steadily increased over the last 10 years.
The risk of dementia poses a significant challenge to the health and welfare of older Australians. Although the exact proportion of people with dementia is not known; in 2018, the AIHW estimated that approximately 9% of the population aged 65 and over in Australia have dementia. The number of people with dementia is also expected to increase over time, from 400,000-459,000 to 550,000-590,000 in 2030 (AIHW, 2018). The increased dependence that may follow from a decline in cognitive functioning can be a significant risk factor for the experience of elder abuse.
Policy context
In Australia, elder abuse has received increasing attention in the past 10 years, with a range of inquiries at state, territory and Commonwealth levels highlighting the complex nature of elder abuse as a social, legal and human rights problem. In 2016, the NSW Parliament concluded that 'a great deal more needs to be done to prevent the complex, hidden and pernicious problem of elder abuse' (New South Wales Parliament, Legislative Council. General Purpose Standing Committee No 2., 2016). In 2017, the Australian Law Reform Commission ([ALRC], 2017) observed that the fragmentation of responsibility for elder abuse across all three levels of government meant 'responding to elder abuse is a complex issue - both from the perspective of laws, but also in terms of practical responsibility' (p. 48). In 2018, a report by the Western Australian Parliament observed that '[a]geism is widely acknowledged to be at the heart of the problem of elder abuse' (p. 13). Common themes in these and other reports include a need for a better evidence base, a national, co-ordinated approach, and a greater emphasis on prevention, in addition to a strong recognition of elder abuse as a breach of human rights.
The National Plan (CAG, 2019) sets out strategic objectives in five key areas. Priority One under the National Plan is Enhancing Understanding, with a national prevalence study the primary strategy under this priority. The plan notes that the expanding range of responses to elder abuse in Australia has been 'developed without a robust body of evidence to make the case that one response works better than any other' (p. 13). The National Plan endorses the need for an evidence base to inform better and more targeted efforts to address elder abuse.
The other four priority areas under the National Plan are:
- Improving community awareness and access to information
- Strengthening service responses
- Planning for future decision making (improving frameworks governing the use of powers of attorney and advanced health or care directives)
- Strengthening safeguards for older adults.
The development of a National Plan was a recommendation of the Australian Law Reform Commission report, Elder Abuse - A National Legal Response (Rec 3-1, ALRC, 2017). In addition to establishing a national policy framework, a further rationale for this recommendation was to support 'future planning and policy development [for elder abuse to take place] in an integrated way'. As with other areas concerned with complex problems such as child abuse and family violence, policy and legislative responsibility in relation to elder abuse is spread between state, territory and Commonwealth governments and among portfolio areas including those relating to justice, policing, human rights, human services and health (Kaspiew, Carson, & Rhoades, 2016).
Alongside (or in some cases ahead of) the National Plan, states and territories have also developed their own policy frameworks and strategies. The AGD's (2019) Stocktake of Elder Abuse Awareness, Prevention and Response Activities in Australia provides an overview of key policy and program responses across the country up to that date.
Elder abuse is one of a number of areas where the age profile of the Australian population creates policy challenges (e.g. Piggott, 2016). Another such area is aged care, with the Royal Commission into Aged Care Quality and Safety delivering its final report in February 2021. This report placed significant focus on shortcomings in the aged care system, including in relation to the quality of care provided to residents in aged care and their exposure to abuse and neglect (Royal Commission into Aged Care Quality and Safety, 2021a, 2021b). It outlined a need for wide-ranging reforms to the aged care system and made 148 recommendations for reform. A research paper by the Royal Commission estimated that 39.2% of aged care residents experience emotional abuse, physical abuse and/or neglect (Royal Commission into Aged Care, 2020). Commonwealth-funded home care services are also included in the Royal Commission's Terms of Reference.
With a focus on the community dwelling population aged 65 and over, this research has very limited overlap with the Royal Commission's area of concern. However, concerns about family and friends in aged care settings examined in the SGC are set out in chapter 6. The findings also consider service providers both as possible perpetrators of elder abuse (chapter 7) and as supports for those experiencing elder abuse (chapter 11).
Australia's National Elder Abuse Research Agenda
The Australian evidence base on elder abuse is recognised to have significant limitations as a robust platform for policy development (e.g. ALRC, 2017; Dow & Brijnath, 2019). From 2016, the AGD has funded a National Research Agenda on Elder Abuse to improve empirical knowledge. As a centrepiece of the agenda, the National Elder Abuse Prevalence Study has been in development for three years. Preparatory work included the development of a scoping paper on methodology options (Qu et al., 2017, unpublished), a paper considering how elder abuse should be defined (Kaspiew et al., 2019) and a technical paper on survey design (Australian Institute of Family Studies [AIFS] and the Social Research Centre [SRC], 2019, unpublished).
Alongside these pieces of work, two further studies were commissioned to build relevant insights from existing datasets. One study assessed elder abuse in existing ABS datasets (Hill & Katz, 2019). The study concluded that existing datasets were not able to provide a robust estimation of abuse of older people. Its analysis yielded some relevant insights, including some from the Personal Safety Survey (PSS), the Australian prevalence study on interpersonal violence. Relevant findings from the PSS were that 2% of people aged 55 and over had experienced physical violence in the preceding 12 months and between 0.1 and 0.4% of women aged 55 and over reported sexual violence. Analysis of the National Aboriginal and Torres Strait Islander Survey showed 16% of survey participants aged 45 and over had experienced physical violence in the past 12 months.
The second commissioned study assessed the vulnerabilities of Aboriginal and Torres Strait Islander people aged over 50 (AIHW, 2019a), in the context of acknowledging that elder abuse dynamics in the Aboriginal and Torres Strait Islander population are 'even more complex than in non-Aboriginal Australia' (Dow et al., 2020 p. 567), for a range of reasons. In addition to cultural, demographic, health and economic issues, these reasons include the legacy of 'separation from land and culture and the forced removal of children from families' (Dow et al., 2020, p. 567). The AIHW (2019a) report highlighted the proportionately lower number of Aboriginal and Torres Strait Islander people aged 50 and over (2% of the total population) and their proportionately greater representation in hospitalisations for non-fatal assault (17%), as victims of family and domestic violence assault (11%) and as victims of homicide (5%) (AIHW, 2019a, Table 9.1).
National Elder Abuse Prevalence Study
The National Elder Abuse Prevalence Study includes three elements. An overview is provided here, with a more detailed Methodology in chapter 4 and a full methodological explanation in Appendix B. The SOP assesses the extent to which a nationally representative, community dwelling sample of Australians aged 65 and older reports experiencing elder abuse. By comparison with international studies, this study is one of a few with a large sample size at 7,000. Only Japan (n = 26,229), Korea (n = 10,184) and Canada (n = 8,163) have prevalence studies based on larger samples.
The SOP examines the prevalence of the five elder abuse subtypes and the extent to which different subtypes occur together. It also provides a socio-demographic profile of the people who report experiencing elder abuse and those who are reported to perpetrate it. Additionally, it examines the impact of elder abuse, risk and protective factors, and what people who experience elder abuse do about it.
The aims of the SOP as defined by the commissioning agency (AGD) were to:
- Measure the national prevalence of elder abuse, including the five main subtypes of abuse and the co-occurrence of subtypes.
- Describe the characteristics and contexts of abuse, including the characteristics of perpetrators and how people who experience elder abuse respond to it.
- Assess the extent to which older people have adopted advance planning behaviours that may protect them against elder abuse.
- Identify risk and protective factors associated with the experience of elder abuse overall, and for each individual form of abuse, if the data permits.
In the context of international approaches to elder abuse prevalence research, the National Elder Abuse Prevalence Study is unique in including a companion study designed to examine the community context for the SOP. This second study, the SGC, surveyed 3,400 Australians, aged between 18 and 64, about attitudes and concerns relevant to elder abuse. It covered attitudes to older people, perceptions of elder abuse, concerns about elder abuse in connection with people known to survey participants and whether action was taken in response to such concerns. The SGC provides important insights into the social context for the findings of the SOP, including awareness of elder abuse in the community and the extent to which elder abuse prevalence may be linked with negative attitudes to older people.
The aims of the SGC, as defined by the commissioning agency, were to:
- Describe knowledge and awareness about elder abuse and attitudes towards older people and examine how they may contribute to social and environmental norms that allow elder abuse to occur.
- Measure the proportion of people who provide assistance to older family members or friends and the types of assistance they provide that could potentially enable abusive practices to occur, particularly in relation to financial transactions and decision making.
- Indirectly estimate the prevalence of elder abuse by asking participants about whether they have any concerns about the abuse of their older family members or friends.
The third element of the National Elder Abuse Prevalence Study focuses on CALD groups. Given the substantial representation of people born overseas in the Australian population, in combination with research and analysis suggesting that the experience of elder abuse in these groups may differ from the experience of non-immigrant populations, the CALD substudy assesses the experience and attitudes of CALD participants in the SOP and the SGC separately from the experiences of the population not born overseas. In addition, the SOP included four questions aimed at measuring specific types of abuse that may be related to language and culture.
The aims of the CALD substudy as defined by the commissioning agency were to:
- Describe the characteristics and contexts of elder abuse, including the prevalence and frequencies of specific abusive behaviours, characteristics of the people who have engaged in abuse, and actions taken by people who have been impacted by abuse in response to their experiences.
- Assess the extent to which older CALD Australians have adopted advance planning behaviours that may protect them against elder abuse.
- Identify risk and protective factors associated with the experience of CALD elder abuse overall, and for each individual type of abuse, if the data permits.
- Identify the prevalence of elder abuse among people with a CALD background compared to non-CALD people.
Summary
The policy context for this research is an intention on the part of governments at Commonwealth and state and territory levels to improve policy and practice responses to elder abuse (CAG, 2019). A critical aspect of this policy agenda is a recognition that better evidence on elder abuse - including who experiences it, who perpetrates it, what its impacts are and how people seek help - is needed.
An important part of the impetus for this policy agenda is the increasing age profile of the Australian population, with the 65 and over age group expected to double from 3.8 million to 8.8 million in the next 25 years (AIHW, 2018).
With very limited systematic empirical evidence on elder abuse in Australia, the National Elder Abuse Prevalence Study represents a substantial contribution to the evidence base. The SOP based on a representative sample of 7,000 people aged 65 and older, together with the SGC based on a sample of 3,400 and the CALD substudy, provides extensive insight into elder abuse in Australia.
Evidence on elder abuse
This chapter provides an overview of key insights from international and Australian research on elder abuse. Prevalence studies have been conducted in many countries in the past 20 years, with findings from Norway, Korea, Sweden and Turkey being published in the past five years. In Australia, the evidence to date has been limited, largely consisting of analyses of data from helplines and qualitative studies.
Empirical evidence
International prevalence studies
In the past 20 years, international research on elder abuse has grown exponentially. Many countries have implemented prevalence studies based on representative population level samples. Among the larger earlier studies, were those from the UK (O'Keeffe et al., 2007), Ireland (Naughton et al., 2010), the United States of America (e.g. Acierno, Hernandez, & Kilpatrick, 2010) and Canada (National Initiative for the Care of the Elderly, 2016). In the past five years, prevalence studies from Norway (Sandmoe, Wentzel-Larsen, & Hjemdal, 2017), Korea (Jeon, Cho, Choi, & Jang, 2019), Sweden (Ahnlund, Andersson, Snellman, Sundström, & Heimer, 2020), Japan (Koga, Hanazato, Tsuji, Suzuki, & Kondo, 2019) and Turkey (Kulakçı Altıntas & Korkmaz Aslan, 2020) have been published.
Methodological differences, including sample age ranges, measures and analytic definitions, mean that comparability among these studies is very limited (e.g. Dong, 2015; Williams et al., 2017). However, meta-analytic studies can provide some indications of global prevalence benchmarks. Yon, Mikton, Gassoumis, and Wilber's (2017) meta-analysis of 52 prevalence studies across 28 countries demonstrated an overall prevalence rate of 15.7%, including 11.6% for psychological abuse, 6.8% for financial abuse, 4.2% for neglect, 2.6% for physical abuse and 0.9% for sexual abuse.
Another meta-analysis, by Ho and colleagues (2017), was based on 34 population-based studies from around the world published in English. It found a pooled elder abuse (the age group was 60 and over) prevalence rate of 10% (Ho et al., 2017). The most common subtype of abuse was emotional abuse (47.5%), followed by financial abuse (34%), neglect (32%), physical abuse (19.1%) and sexual abuse (3.1%). There was a greater likelihood of women being abused (15%) compared with men (10.6%) and non-Western countries had a higher prevalence than Western countries (17.4% cf. 7.3%).
The meta-analysis by Ho and colleagues also examined the prevalence of elder abuse according to reports of caregivers or other third parties, based on 17 studies from different countries. The studies that the analysis is based on largely involved groups with specific roles in relation to older people, including paid and unpaid caregivers, aged care workers and medical professionals including nurses and doctors. Rather than being based on representative, population level samples, these studies reflect the reports of particular groups of informants in relation to particular groups of older people. Their analysis produced a prevalence rate of 34% as reported by study informants in these groups.
Several explanations may be relevant for the higher rate of prevalence indicated by these study informants compared to prevalence rates reported directly by older people. They include the possibility that older people under-report their own experiences. Further, the studies this aspect of the analysis was based on included older people with cognitive decline and residents in care settings. The population level studies exclude older people with cognitive decline and mostly focus on community dwelling samples, and thus did not capture prevalence among a particularly vulnerable subgroup in the older population.
Another meta-analysis specifically examined women's experiences of elder abuse and was based on 50 prevalence studies and focused on community-dwelling women aged 60 and over (Yon, Mikton, Gassoumis, & Wilber, 2019). It found a pooled prevalence rate of 14.1%, with a reference period of one year prior to the survey being conducted. The most common abuse subtype was psychological abuse (11.8%), followed by neglect (4.1%), financial abuse (3.8%), sexual abuse (2.3%) and physical abuse (1.9%).
Supported by prevalence studies, the international literature on elder abuse sheds light on a range of other issues, including perpetrator profiles, risk and protective factors, the impact of elder abuse and whether or not those who experience it seek help or report it.
This body of literature also establishes that the phenomenon of elder abuse is context and culture specific, as Ho and colleagues' finding of higher prevalence in non-Western compared to Western countries indicates. An analysis of the evidence on prevalence by Williams and colleagues (2017, p. 62) concluded that 'wild' variations in estimates 'across region, culture, socio-political, and domestic situations' were due not only to methodological differences in the approaches taken to measure elder abuse in different studies but to variations in social and cultural conditions: 'that which is considered rudeness in one culture may well be considered severe emotional abusiveness in another culture'.
Risk factors
The body of international literature that has been developed in the past decades has supported the development of insight into risk factors for elder abuse. A recent synthesis of this evidence by Storey (2020) has highlighted eight victim-related factors that are associated with greater susceptibility to experiencing elder abuse and eight factors related to perpetrators.
According to Storey's analysis of the evidence base, the eight victim-related factors are:
- Problems with physical health are associated with greater vulnerability to not only experiencing elder abuse but also more severe experiences.
- Similarly, mental health problems, particularly depression and cognitive decline, are risk factors not only for elder abuse but elder abuse of greater severity.
- Problems with substance misuse, including alcohol.
- Dependence is associated with elder abuse experiences but is not a predominant cause of elder abuse.
- Problems with stress and coping can be both precursors to and consequences of elder abuse. The stress may be caused by the perpetrator or come from other sources. It can also inhibit help seeking and lead to more sustained and possibly severe experiences of elder abuse.
- Attitudes such as self-blame, excusing the abusive behaviour of family members, protecting perpetrators, self-depreciation, stoicism and apathy are risk factors for sustained experiences of elder abuse.
- Previous experiences of abuse, including abuse in childhood and neglect and intimate partner violence as an adult.
- Problems with relationships, including with adult children, conflictual relationships with family and friends and social isolation.
The perpetrator-related characteristics according to Storey (2020) are:
- Physical health problems for all abuse subtypes and particularly neglect
- Mental health problems, particularly depression and cognitive impairment
- Substance misuse problems have been identified as having the strongest connection to elder abuse. Conrad and colleagues (2019) point to a particularly strong link between substance misuse and financial abuse, as well as the commission of multiple types of abuse.
- Dependence of the perpetrator on the victim. Particularly strong associations are evident in the area of financial and housing dependence.
- Experiencing stress on the perpetrator's part, particularly where the perpetrator has limited mechanisms for coping with stress. Stress associated with the victim (e.g. arising through caregiving responsibilities) or stress arising from unrelated circumstances may each be risk factors.
- Negative attitudes, such as ageism, resentment of the older person and the caregiving role and lack of empathy and understanding toward the older person
- Being a witness to or victim of family violence. Situations where a perpetrator has been the victim of abuse in childhood by a parent and circumstances where other experiences of childhood abuse have occurred are each identified in the literature as risk factors.
- Problems with relationships, including histories of conflict or family violence in relationships and social isolation.
Barriers to help seeking
Insights from international research suggest that help seeking for elder abuse is low. This is consistent with evidence on help seeking in a range of other areas; for example, for legal problems and for family violence. In relation to legal problems broadly, advice is only sought for about half (Coumarelos et al., 2012 p. xvii). In relation to family violence, among a large sample of separated parents who experienced family violence, just under half had not disclosed the violence to any service or professional including police (Kaspiew et al., 2016, p. 88). Specifically, in relation to concerns about experiences in aged care settings, only half of the concerns residents had were brought to the attention of anyone at all, either through informal (family and friends) or formal (official) channels, according to research published by the Royal Commission into Aged Care Quality and Safety in 2020 (Batchelor et al., 2020, p. 43).
A range of personal and systemic barriers to help seeking for elder abuse have been identified. At a personal level, these include fear of the consequence of disclosure. Such feared consequences include retaliation, abandonment, institutionalisation or ostracisation (Burnes, Lachs, Burnette, & Pillemer, 2019a; Dominguez, Storey, & Glorney, 2019). A qualitative study based on interviews with 28 people who had been assisted by Seniors Right Victoria demonstrated that for some participants, the consequence of help seeking did involve a change in living arrangements in order for the abuse to stop (Vrantsidis, Dow, Joosten, Walmsley, & Blakey, 2016).
Further personal barriers include shame and embarrassment, self-blame and low self-esteem (Dominguez et al., 2019; Storey, 2020). A desire to keep the abuse secret, particularly where it involved friends or family members was nominated as the reason for not disclosing by more than a quarter of participants who experienced financial abuse and emotional mistreatment in a study focusing on perpetrator identity and disclosure patterns (Acierno et al., 2020).
Fear of the consequences of disclosure for the perpetrator is also among the personal drivers of non-disclosure (Acierno et al., 2020; Dominguez et al., 2019; Storey, 2020; Vrantsidis et al., 2016). In Acierno and colleagues' (2020) study, even larger proportions nominated not wanting to get the perpetrator into trouble as reasons for non-disclosure (52% financial and 39% emotional) than wanting to keep the abuse hidden.
Victims have revealed concern about disclosure worsening their relationship with the perpetrator, fear of exposing the perpetrator to punishment and being worried about worsening the perpetrator's circumstances that might be associated with the abuse (Dominguez et al., 2019; Storey, 2020; Vrantsidis et al., 2016).
Some research has also shown that social isolation on the part of the victim, and a broad social network on the part of the perpetrator, are associated with lower help seeking (Burnes, Acierno, & Hernandez-Tajada, 2019b; Vrantsidis et al., 2016).
Among the broader level barriers to disclosure are lack of knowledge about services and concern about whether services have the capacity to provide adequate and appropriate help, particularly in the context of the personal concerns outlined above (Dominguez et al., 2019).
For some groups, including those from Aboriginal and Torres Strait Islander and CALD backgrounds, a fear of authority and a reluctance to engage with criminal justice processes have been identified as barriers to help seeking in other contexts and are also likely to be relevant in relation to elder abuse (Family Law Council, 2012a & b).
There is limited research that provides insight into the factors that facilitate help seeking. The circumstances in which help seeking appears more likely to occur are those where the victim has a good social network, emotional and familial ties with the perpetrator are not strong and the victim has a sense of being betrayed by the trusted person (Acierno et al., 2020, Dominguez et al., 2019). Situations in which the abuse is particularly severe, including where it involves physical abuse or multiple types of abuse, are associated with higher levels of help seeking (Burnes et al., 2019a, 2019b). Burnes' (2019b) study also demonstrated higher levels of help seeking where the perpetrator had previous engagement with police.
Australia
In Australia, the empirical evidence base on the scope and nature of elder abuse has to date been limited. In large part, it has consisted of analyses of data to elder abuse hotlines, assessments of the capacity of administrative datasets to provide insight into the extent and nature of elder abuse, and qualitative research focusing on particular subtypes of abuse or particular populations.
Helpline data
A recent analysis of data from a helpline operated by Seniors Rights Victoria (SRV) (Joosten, Gartoulla, Feldman, Brijnath, & Dow, 2020) demonstrates that the numbers of calls to the helpline increased by 63% over seven years, with a distinct rise in 2016, which the report attributes to the awareness raised following the release of the reports by the Royal Commission into Family Violence in Victoria. The analysis shows that most calls were from women (72% compared with 28% from men) and mostly concerned psychological abuse (63%) or financial abuse (62%). The majority (91%) of abuse discussed in the calls involved family members, mostly sons (39%) or daughters (28%). Most calls were in relation to people aged 70 or over (72%).
A similar analysis of data from calls to the Queensland Elder Abuse Prevention Unit (EAPU) published in 2015, and covering the preceding five years, shows similar patterns in relation to gender and abuse types (Spike, 2015). Most calls were in relation to women experiencing abuse (68%, cf. men: 31%). The most common form of abuse across the period covered was psychological abuse (65%), with financial abuse becoming increasingly common and reaching parity with psychological abuse. The majority of abuse was committed by adult children (31% sons and 29% daughters). The age profile was older than the SRV analysis, with 80-84 years the most common victim age bracket represented in the analysis.
Another analysis of EAPU data comparing the characteristics of clients with and without cognitive impairment found they differed in their characteristics, types of elder abuse, perpetrators and relationship factors (Gillbard, 2019). In particular, those with a cognitive impairment had more complex care and support needs, were older, were more likely to be dependent on perpetrators, and were more likely to experience neglect and social abuse and less likely to experience physical or psychological abuse than older people in the non-cognitive impairment group.
Perpetrator characteristics differed between the two groups, with perpetrators more likely to have a history of interpersonal issues, mental illness and substance abuse in the non-cognitive impairment group, whereas perpetrators in the cognitive impairment group were more likely to exhibit inheritance impatience and taking responsibility for their abuse-related behaviours. Barriers to change for victims also differed as victims without a cognitive impairment most frequently identified fear of further abuse as a barrier whereas a lack of capacity was most frequently identified for those with a cognitive impairment.
Other administrative datasets
In recent years, there have been some state-based efforts to assess the extent of elder abuse. These analyses have involved gathering information on the nature and specifications of datasets in agencies and services that provide support to older people and may hold information of relevance to elder abuse. One of the main limitations in relying on a telephone helpline and other administrative datasets is that this strategy will only yield insight into elder abuse when someone (a victim or other concerned person) chooses to engage with a service or agency. In light of the well-established insight that elder abuse is under-reported (e.g. Acierno et al., 2020; Ho et al., 2017), these sources will inevitably only reveal part of picture.
A 2017 study focusing on Queensland included interviews and focus groups with professionals working with agencies concerned with older people generally and elder abuse in particular. In addition to considering the scope of elder abuse on the basis of administrative data, the study concluded that existing data sources were unable to support prevalence estimates (Blundell, Clare, Moir, Clare, & Webb, 2017). On the basis of the information they were able to obtain, the researchers concluded that elder abuse was under-reported and costly.
A similar exercise was undertaken by researchers in South Australia (Lacey, Middleton, Bryant, & Garnham, 2017). This study focused on assessing administrative datasets through interviews with key agencies and included six interviews with older people who had experienced abuse. This study concluded that improvements to consistency and collection of administrative data could support better understanding of trends in abuse cases and build a better understanding of the extent and depth of the problem.
Qualitative research
In the past 15 years, qualitative research in Australia has examined a range of issues including financial abuse among CALD and non-CALD populations (e.g. Bagshaw, Wendt, Zannettino, & Adams, 2013; Wainer, Owada, Lowndes, & Darzins, 2011; Wainer, Darzins, & Owada, 2010) and sexual abuse among older women (Mann, Horsley, Barrett, & Tinney, 2014).
One of the more recent studies examined experiences of older people (sample size 28) who sought assistance in relation to elder abuse from Seniors Rights Victoria (Vrantsidis et al., 2016). The interviews revealed that all perpetrators were family members, mostly adult sons and daughters living with the older person when the abuse occurred, and that abuse was most frequently in the form of psychological (n = 21) and financial (n = 19) abuse, with physical abuse also experienced by some participants (n = 7). Most older people reported the abuse had stopped or resolved following a range of interventions and support to varying extents provided by Senior's Rights Victoria. Following the interventions, perpetrators had often left the older person's home or the older person had moved homes but stopping contact was also a frequent outcome. The interviews did not directly ask older people about cultural experiences; however, some themes described by participants from culturally and linguistically diverse backgrounds included experiencing negative views about women associated with particular cultures and strong views about parental and family obligations (including caring for grandchildren).
The need for a prevalence study
Although the sources outlined above may provide useful insights into the nature of elder abuse, they are unable to describe prevalence, which is 'the proportion of persons in a given population (i.e. older adults) who have a particular attribute [i.e. has experienced elder abuse] over a specified period of time' (Williams et al., 2017, p. 45).
The size and scope of a problem such as elder abuse, including the relative prevalence of abuse subtypes, can only be measured through a prevalence study based on a sample representative of the population that is of concern. Understanding population level prevalence is critical for a number of reasons (see e.g. Dow & Brijnath, 2019), including the development of:
- targeted and proportionate response and prevention efforts based on a rigorous understanding of the scope and nature of elder abuse
- screening and assessment tools for use in community and clinical settings to better identify elder abuse
- estimates of the future size of the problem in the context of an expansion in the proportion of the population aged 65 and over.
Further, detailed systematic insights into important questions such as perpetrator profiles, risk and protective factors and patterns in reporting are vital to informing better policy and practice strategies. These insights include:
- how proportionate and effective responses to the different abuse subtypes may be developed, including understanding the co-occurrence of different subtypes and the extent to which some subtypes may lead to the occurrence of other subtypes
- how risk factors for experiencing elder abuse may be decreased and protective factors increased
- how safe and effective interventions may be designed, given the evidence that elder abuse is frequently committed by family members and that this can lead to complex emotional and physical dynamics, particularly if the victim and perpetrator live together (e.g. Burnes et al., 2019b)
- how perpetrator-related risk factors can be better managed.
The findings from the SGC, together with the findings from the SOP, will be particularly important in designing efforts to prevent elder abuse and raise community awareness of how to identify and respond to elder abuse in Australia. In particular, the findings will allow the:
- examination of the extent to which the occurrence of elder abuse may be linked to views and attitudes that condone elder abuse
- development of strategies to raise awareness of elder abuse and assist the community to identify it
- development of measures to increase knowledge in the community of how to respond to elder abuse, including which authorities to report it to.
The focus on CALD groups in the research program is also critical to developing evidence-based responses. Given the significant representation of people from CALD backgrounds in the Australian population, the findings of the CALD substudy will support:
- understanding whether elder abuse is different in form and extent among CALD groups compared with non-CALD groups
- whether perpetrator profiles and risk and protective factors and responses are different for CALD compared to non-CALD groups
- identifying whether awareness of and responses to elder abuse differ between CALD and non-CALD groups.
Findings in these areas will be important in assessing the extent to which tailored responses to elder abuse are necessary for CALD individuals and communities.
Summary
Elder abuse prevalence studies have been conducted in more than 50 countries around the world in the past two decades, as governments attempt to develop better policy and practice responses to the issue. Variations in methodology between studies limit international comparisons but the largest meta-analytic study available indicates a global prevalence rate of 15.7%, with psychological abuse being most common at 11.6% (Yon et al., 2017).
The international evidence establishes that elder abuse is a complex phenomenon that is influenced by social, cultural and socio-economic factors.
In Australia, the empirical evidence base on elder abuse has been limited to studies looking at particular types of elder abuse (e.g. financial abuse), qualitative studies and those based on administrative data from services who provide support to older people. Such studies are unable to shed light on the proportion of older people aged 65 and over who experience elder abuse and the relative prevalence of the different subtypes of abuse. Nor are they able to assess other important issues, such as the extent to which elder abuse is under-reported.
The evidence provided by the National Elder Abuse Prevalence Study will support better policy and practice responses to address elder abuse across Australia, in line with the National Plan.
Definition and concepts
This chapter explains the conceptual definition of elder abuse applied in the study and introduces the theoretical frameworks that have informed the development of the methodology and the analysis and interpretation of the findings. The measures used and the technical, operational definitions applied to the six subtypes of elder abuse are set out in chapter 5.
Conceptual definition
The preparatory work for this study (see chapter 1) included the development of a working conceptual definition informed by the international literature, existing conceptual frameworks and stakeholder consultations (Kaspiew et al., 2019). This definition is:
a single or repeated act or failure to act, including threats, that results in harm or distress to an older person. These occur where there is an expectation of trust and/or where there is a power imbalance between the party responsible and the older person.
The definition involves five elements that informed the development of measures in this study:
- A single or repeated act or failure to act. The measures applied in this study captured varied forms of physical, sexual, financial, psychological abuse, and neglect. (An additional concept of abuse relating to language and culture was developed for the CALD substudy.) The measures are described in detail in chapter 5.
- An older person (defined for this study as a person aged 65 and older).
- A person who is responsible for the act or omission. The operational definition included family members, friends, neighbours, acquaintances and professionals but excluded strangers.
- The consequence of harm or distress. This was measured by asking the older person how serious the abuse was. Further discussion of the influence of these measures on the technical analytic definition is set out in chapter 5.
- A situation where the connection between the older person and the perpetrator of the act or omission involves an expectation of trust and/or a power imbalance. For the purpose of this study, this was inferred from the relationships between the older person and the person who was the source of the act/omission. Further discussion is in chapter 5.
The working definition adopts an approach that is broader than the World Health Organization definition but is still widely accepted in referring to a power imbalance as well as an expectation of trust (Bagshaw, Wendt, & Zannettino, 2009; Clare, Clare, Blundell, & Clare, 2014; EAPU, 2019; Hightower, Smith, & Hightower, 2006; Joosten, Vrantsidis, & Dow, 2017; Mysyuk, Gerardus, Westendorp, & Lindenberg, 2016).
In the development of this working definition, it was recognised that two aspects of it - the consequence of harm or distress and the relationship of trust and/or power imbalance - may be assessed subjectively (from the perspective of the older person) or objectively (from the perspective of a reasonable bystander). The implications of this for the technical analytic definition applied in deriving prevalence estimates is set out in chapter 5.
As the working definition demonstrates, elder abuse involves a varied range of acts or omissions and a significant range of relationship types, including intimate partners, intragenerational relationships (siblings), intergenerational family relationships (parents and children, grandparents and grandchildren) and non-family relationships such as those involving professionals, carers, neighbours and acquaintances. This establishes that elder abuse is a complex phenomenon and underlines the importance of explanatory theoretical and conceptual frameworks.
Conceptual and theoretical frameworks
A varied range of theories and concepts are applied in the field of elder abuse. Theories are recognised to be integral in 'making sense' of empirical evidence in that they provide a way of generating explanations for the patterns seen in that evidence (e.g. Burnight & Mosqueda, 2011). In the context of elder abuse, theories support insight into how and why elder abuse occurs to inform effective intervention and prevention strategies (Burnight & Mosqueda, 2011).
Theoretical frameworks have been slow to develop in the area of elder abuse but it is increasingly being recognised that theoretical sophistication is important in developing understanding of the diverse forms and dynamics of elder abuse and that different theories may be required to explain different subtypes of abuse (e.g. Jackson & Hafemeister, 2013; Naughton et al., 2010). For example, dynamics may be quite different in these three situations: financial abuse committed against a father by a son; sexual abuse committed by a friend against an older woman; psychological abuse committed against a female partner by a male partner.
For this reason, three main perspectives have informed this research: ecological approaches, theories relevant to family violence, and a human rights perspective. To some extent, these perspectives are complementary and have some common elements.
With elder abuse prevalence research in Australia in its early stages, limitations in the scope of data collection possible in the context of a 28-minute survey (see further Appendix B) have placed significant constraints on the capacity to extensively examine some issues of theoretical relevance. For this reason, an additional theory, outlined below (the life course perspective), has had limited influence on the methodology but is considered to be important for future research.
This section outlines relevant theories and their influence on the methodology and interpretation of findings.
Ecological approaches
Increasingly important approaches in both the elder abuse and family violence fields are multi-systemic theories. These models understand an individual's experience in the context of several levels of intersecting influence, the narrowest being the family and the broadest being social norms and values. The ecological theory was first developed by Bronfenbrenner (1986) and has since been adapted for various contexts including elder abuse (e.g. Acierno, Hernandez-Tejada, Muzzy, & Steve, 2009) and family violence (e.g. Our Watch, ANROWS & VicHealth, 2015). Elder abuse and family violence are recognised as 'adjacent areas of inquiry' (Burnight & Mosqueda, 2011).
Adapting an applied ecological model to elder abuse in Australia, the National Ageing Research Institute (NARI) has developed a model that focuses on the relationship between the older person and the perpetrator of the abuse (the person who is in a 'relationship of trust') in the context of relevant community dynamics and, more widely, relevant cultural norms and beliefs (Joosten et al., 2017). The model reflects relevant individual-level factors for the person who experiences the abuse (e.g. dependency based on a requirement for care, frailty, physical or mental health problems, cognitive impairment) and the perpetrator of the abuse (e.g. dependency on the older person, financial problems, substance abuse problems, social isolation) that have been identified as important in research on elder abuse. Community-level issues include the care setting (e.g. hospital, residential care, community-based care). At the broadest level, the model refers to cultural norms and beliefs concerning ageism, intergenerational conflict and wealth distribution and family violence.
The application of multi-systemic approaches in research entails collecting data and conducting analyses that will enable examination of the different levels of influence and their associations with the experiences of elder abuse. In practical terms, this approach involves a focus on the older person and their social, economic and cultural circumstances, as well as consideration of the nature and circumstances of abuse, including the characteristics of the perpetrator. More broadly, it also requires a focus on social factors - such as attitudes to ageing and older people - that shed light on societal factors that may influence the occurrence of, and responses to, elder abuse. Socio-ecological approaches explicitly informed the Canadian research on attitudes and awareness (EKOS Research Associates Inc., 2011) and the Portuguese prevalence study (Gil et al., 2015). This theoretical approach is also compatible with the prevalence studies conducted in New York (Lifespan of Greater Rochester Inc., 2011) and the UK (O'Keeffe et al., 2007).
In applying a three-part methodology based on a focused prevalence study (the SOP), a study examining social attitudes and awareness in a population sample (the SGC) and a CALD substudy, this research represents the most expansive application of a socio-ecological approach to date. This methodology means that the experiences of abuse reported in the SOP can be considered not only in terms of the characteristics of the victims (chapter 6) and perpetrators (chapter 7) but also in their wider social context on the basis of the findings of the SGC (chapter 11 and chapter 12). Further, the findings of the CALD substudy, combining findings of the SOP and SGC and measuring an additional subtype of elder abuse based on abuse relating to language and culture, provide insight into the cultural dimensions of elder abuse in the context of Australia's immigrant population (chapters 5, 6 and 7).
Family violence
The question of whether elder abuse should be regarded as a form of family violence has been the subject of some debate, locally (e.g. Joosten, Dow, & Gally, 2019) and internationally (e.g. Roberto & Teaster, 2017). When there is elder abuse between spouses in later life, the overlap is clear, even though questions arise as to whether the behaviour has been sustained over time or whether it has newly arisen. However, elder abuse that is intergenerational (e.g. perpetrated by a child against a parent) potentially involves 'unique dynamics' (Joosten et al., 2019) not adequately addressed by the emphasis on gendered dynamics of power in family violence theory.
Australia's family violence prevention strategies are premised on a socio-ecological model that emphasises the role of gender inequality in creating the conditions for family violence (Our Watch et al., 2015). In this model, four levels of influence interact to create family violence. At the broadest level, societal-level norms support rigid gender roles and condone violence against women. The second level is comprised of systemic barriers to the achievement of gender equality. The third level involves community practices that perpetuate gender inequality and discrimination. At the fourth, individual level, rigid gender roles, male dominance and controlling behaviours create the personal environment for violence.
The emphasis on gender inequality in the socio-ecological model aligns with the notion of a power imbalance in long-standing conceptualisations of family violence. Unequal power relationships between men and women are seen as underpinning family violence as a phenomenon committed by men against women (e.g. Pence & Paymar, 1993). Power imbalance has also been influential in some thinking about elder abuse (see e.g. National Clearinghouse on Abuse in Later Life [NCALL], 2011), with dependency arising from age-related needs creating a 'power advantage' that can be exercised to the detriment of the dependent (or older person) (Burnight & Mosqueda, 2011).
For this reason, the working definition applied in this research included the notion of a power imbalance, in addition to a 'relationship of trust' (EAPR). The analyses of the relationship contexts in which elder abuse occurs (chapter 6 and chapter 7) presented in this report explore dynamics of power to the extent that the data allow.
Human rights and ageism
Just as gender inequality is seen as a contributing factor to the occurrence of family violence, some approaches posit ageism as a contributing factor to elder abuse (National Plan, CAG, 2019). Ageism, or 'prejudicial attitudes held towards people because of their age' (Swift et al., 2018, p. 441), is central to a human rights approach to conceptualising elder abuse. A human rights approach to elder abuse has increasingly emerged in Australia in recent years (ALRC, 2017; Lacey, 2014) with the National Plan recognising that ageism:
can contribute to an environment in which individuals who abuse older people fail to recognise that their behaviour constitutes abuse; other members of society fail to notice these negative behaviours or take action to stop them; and older people experiencing elder abuse blame themselves and are too ashamed to seek assistance. (page 5)
A human rights model suggests that abuse of older people, rather than being exclusively 'located within personal relationships', (Biggs & Haapala, 2013) also arises out of relationships between the state and individuals as a consequence of the way that the state does or does not safeguard the human rights of older people.
A human rights approach has influenced this methodology in several important ways, including through examining attitudes to older people in the SGC. These findings are set out in chapter 12.
Life course perspectives
A further approach considered in the preparatory work for the Australian prevalence study was a life course perspective. A life course perspective is based on the view that vulnerabilities and strengths may manifest across an individual's life span and that the experience of adversity in later life can be linked to adversity in earlier life (see e.g. McDonald & Thomas, 2013). This perspective also seeks to understand social pathways in the context of socio-historical conditions across an individual's lifetime, and it was the theoretical underpinning for the 2015 Canadian study (see National Initiative for the Care of the Elderly, 2015, p. 11).
Research evidence on the experience of different forms of violence and abuse at different life stages - childhood, adolescence, young adulthood, middle age and later life - suggests some links between exposure in childhood and adolescence and experiences (potentially as a victim or perpetrator) at later life stages. A recent review of research evidence examining 'interconnections among different forms of violence that span the developmental life course' noted that the research evidence on elder abuse in this context, although not as well-developed as the literature on links between childhood, adolescence and mid-life experiences, indicated the existence of connections between earlier forms of violence and elder mistreatment (Herrenkohl et al., 2020, p. 9).
Australian evidence demonstrates a link between experiences of abuse in childhood and violence in adulthood. ABS data published in 2019 show that the 13% of adults who experienced physical or sexual abuse in childhood had increased risks of experiencing violence in adulthood (ABS, 2019b). Compared with adults who did not experience childhood abuse, those who did were twice as likely to experience violence as an adult (71%, cf. 31%) and three times as likely to experience partner violence (28%, cf. 8.9%).
Both the Canadian elder abuse prevalence study and the US one examined some life course influences on the experience of elder abuse. An experience of abuse as an adult, a youth or child was the second most important of nine factors correlated with an experience of elder abuse in the Canadian study (National Initiative for the Care of the Elderly, 2015). In the US study, participants who reported a prior traumatic event (defined as a situation involving a natural disaster, a serious accident or another situation, all involving fear of being killed or seriously injured) were at increased risk of emotional and sexual abuse, and financial abuse perpetrated by a stranger (Acierno et al., 2010).
In this current study, the capacity to implement a life course perspective was limited for two main reasons. First, the need to limit participant burden and not have an average interview time exceeding 28 minutes placed significant restrictions on the number of questions that could be asked. As the first prevalence study in Australia, the survey instrument prioritised core question areas needed to assess and understand prevalence and dynamics. Including questions on the previous experience of violence and abuse was not feasible in this context. Second, the cross-sectional (one survey conducted at a particular point in time) nature of the study does limit capacity to reliably examine causal influences, which would instead require a longitudinal research design (a survey that re-interviews the same participants over a number of years) (Herrenkohl et al., 2020).
Nonetheless, the findings set out in chapter 6, particularly those that highlight higher levels of elder abuse among those who are divorced or separated compared to those who are partnered, indicate that a life course perspective is important in understanding elder abuse and should be considered in future research (chapter 12).
Summary
The conceptual definition applied in this research was developed for the Australian context, following a literature review, an analysis of conceptual frameworks and consultations with stakeholders. This definition accommodates the measurement of five core subtypes of abuse: financial, physical, sexual and psychological abuse, and neglect.
To be operationalised in research, the definition requires five elements to be examined: the victim, the perpetrator, the relationship between them, the acts or omissions that constitute the abuse and the consequence of harm or distress to the older person. Characteristics of the relationship identified in the definition are a relationship of trust or a power imbalance.
Three theoretical frameworks have influenced the design of the research. An ecological approach is reflected in the aspects of the design that examine personal, family and community dynamics with the SGC focus on attitudes and awareness providing the broader social context for the SOP findings on the dynamics and prevalence of elder abuse.
The second theoretical framework overlaps to some extent with the first, in that family violence theory directs attention to power relationships at the individual and social level as an explanatory device for family violence. With international literature establishing that vulnerability can create a susceptibility to elder abuse, power imbalance is recognised alongside a relationship of trust as an element in the conceptual definition.
Finally, a human rights perspective, with an emphasis on ageism as an underlying driver of elder abuse and manifesting in a lack of care and respect for older people, is also relevant to the research design and compatible with an ecological approach.
A focus on another theoretical perspective - a life course perspective - was beyond the scope of this methodology. However, international evidence establishing links between adverse experiences and elder abuse, together with Australian evidence demonstrating heightened susceptibility to violence or intimate partner violence for people who experience abuse in childhood - indicates that this is an area that warrants attention.
Methodology
This chapter provides an overview of the methodology of the National Elder Abuse Prevalence Study, including a description of the sample characteristics for the SOP and the SGC.
Study outline
The National Elder Abuse Prevalence Study is comprised of two surveys: the Survey of Older People (SOP) and the Survey of General Community (SGC). The design of the SOP supports the estimates of the prevalence of elder abuse in the community-dwelling population aged 65 years and older. The SGC supports insight into the context for elder abuse in Australia by examining attitudes, knowledge and awareness relevant to elder abuse, as well as care-giving practices, among people aged between 18 and 64 years. The design of the two surveys was guided by the preparatory work, which included: the review of international prevalence studies with a particular focus on studies conducted in the last decade and on a large scale; examination of conceptual frameworks; and consultation with subject matter experts.
The key elements of the approach adopted for the two surveys include:
- A working definition was adopted that takes a broader approach than the World Health Organization definition (discussed in chapter 3).
- The SOP involved a probability sample of 7,000 older people aged 65 years and older who are living in private dwellings and have the cognitive capacity to successfully engage in a telephone interview of approximately 28 minutes on average. The survey was conducted from 12 February to 1 May 2020. This survey excludes older people without access to a telephone (landline or mobile), residents of institutional premises (e.g. prisons, nursing homes, military bases), people incapable of undertaking an interview due to a physical or health condition and people appearing to be under the influence of drugs or alcohol.
- The SGC comprised a probability sample involving 3,400 people from the general community who are living in private dwellings and have the cognitive capacity to successfully engage in a telephone interview of approximately 17 minutes on average. The SGC was conducted from 12 November to 15 December 2019.
- Both the surveys recruited participants through the random digit dialling sampling approach with a landline and mobile phone blend, and the survey data were collected through computer-assisted telephone interviews (CATI).
- Both the surveys were cross-sectional.
- A CALD subsample drawn from the SOP and SGC samples was included to provide insight into the experiences of certain abusive behaviours related to issues of language or culture.
Limitations
This section briefly discusses the main limitations of the methodology, including those arising from the survey response rate and the sample characteristics. It is important to appreciate that the prevalence findings apply to people aged 65 and older who live in the community and had capacity to complete the survey. As such, they likely represent an under-estimate of elder abuse because they do not include people with reduced capacity due, for example, to cognitive decline or those who live in residential care settings.
Response rate
The random digit dialling (RDD) approach produced a low response rate for the SOP at 15.5% and for the SGC at 11.6%. This was expected (see AIFS & SRC, 2019, Strengthening the Evidence Base, Component 2 - Final Report) given that the RDD approach screens the wider population in order to recruit an eligible sample by calling phone/mobile numbers generated at random.
Target population and exclusion
The target population for the SOP was defined as people aged 65 years and over who live in private dwellings (i.e. in community settings) and have the capacity to engage successfully in an interview. Consistent with international prevalence studies, people who live in non-private dwellings and who are in private dwellings but do not have the cognitive capacity to engage in meaningful interviews were excluded from the prevalence sample. Also excluded were older people who have no access to a telephone (landline and mobile). This limitation is particularly pertinent to Aboriginal and Torres Strait Islander people, particularly those in regional and remote areas. Issues surrounding elder abuse for these and other groups not adequately covered in this approach, such as LGBTIQ groups, would be more appropriately examined through more targeted research methods.
Several complex issues arise in relation to considering the feasibility of including and excluding specific groups of older people. First, in relation to those older people who rely on the formal or informal support of carers (including family members) to continue to live in private dwellings, securing interviews with these older people would require the cooperation and assistance of carers, including to be engaged on the phone. Older people experiencing physical frailty may be unwilling to acknowledge their experiences of abuse while in the presence of a third party.1 Indeed, there is potential that some of the carers of older people in private dwellings who are approached to participate may be the perpetrators of the relevant abuse.
Some mitigating strategies were employed to address these issues. The survey introduction was broadly framed, focusing on older people's wellbeing and the role of the research in supporting government policy development, so as to lower the likelihood of gatekeeping from other household members and limit the scope for awareness among perpetrators of the possibility of abuse disclosure. The fieldwork company employed experienced interviewers for this project, both to support greater potential for participant engagement and ensure the survey was administered sensitively.
Second, older people who rely on the support of carers due, at least in part, to their cognitive impairment, may not have the capacity to provide informed consent to participate. Assessing this capacity raises practical and ethical challenges in the context of a CATI data collection approach.
Third, for older people living in residential aged care, there would be challenges associated with their recruitment and with the conduct of the research, including addressing any concerns of the care organisations and making the necessary administrative arrangements to facilitate participation (e.g. the process of selecting participants, conducting private interviews with minimal interruption to carers' work and so on). Once again, assessing the capacity of older people living in residential aged care to provide informed consent to participate raises both practical and ethical challenges, and substantial numbers may be deemed to not have the capacity to consent or to participate. These exclusions mean that the estimates from this study likely represent under-estimates, even for the community dwelling population and especially so for those in residential care settings.
Sample size and subgroup analysis
Several considerations informed the sample size. According to the World Health Organization (2015), estimated prevalence rates regarding the experience of any abuse ranged from 2-14%, while those for specific forms of abuse range from 0-9%. Therefore, given the likely low numbers of participants reporting elder abuse, the large sample size of 7,000 was chosen to support better prevalence estimates and greater statistical power to detect factors associated with the experience of elder abuse. Moreover, the larger the sample, the greater the opportunity to derive reliable estimates of the prevalence of abuse in different subgroups. The CALD substudy depended on the subsamples from the SOP and SGC. A limitation of this approach is that it necessitated an analytic approach based on the CALD sample as a whole, with limited ability to work with specific subsamples (such as specific countries of birth).
This means that differences among different subsamples are not amenable to in-depth exploration (see further chapter 13).
Use of telephone interviewing
Different data collection methods (e.g. face-to-face interviews, telephone interviews and online or mailed self-complete surveys) have different cost implications, sampling designs and levels of complexity. Given the large sample size and characteristics of the target population, data collection through telephone interviews was considered the most feasible option. Telephone interviewing permits:
- a large number of interviews to be completed within a reasonably short time frame
- a greater number of questions to be asked
- relative anonymity, which can make it easier for participants to disclose any experience of abuse (Oltmann, 2016; Schober, 2018)
- an unintrusive way for older people to participate through direct discussion, which also allows any participant queries/concerns to be immediately addressed.
Dual-frame random digit dialling
To enable the Prevalence Study to make inferences about the populations of concern, it was crucial to derive a sample representative of the older population. A probability sample was obtained by screening the wider population using a dual-frame (landline and mobile) random digit dialling methodology (RDD). The RDD approach is a robust method that has been used in a number of international studies to provide research evidence on elder abuse. Dual-frame RDD refers to the method of obtaining a sample of the target population by random screening of the wider population.
Several disadvantages are associated with the dual-frame random digit dialling approach and include call screen out of unrecognised telephone numbers, likely lower response rates and greater non-response bias compared to the approach of using a database as the sampling frame. To address these limitations several methods were employed to improve sample precision for the Prevalence Study:
- Stratified random sampling was used to ensure an adequate representation of subgroups of the population.
- Pre-contact SMS messages were sent to potential mobile participants to alert them about the study prior to receiving a call.
- Data weighting was used to improve the representation of the study population.
Ethics
The AIFS Human Research Ethics Committee provided ethical review and clearance for this research. As the surveys involved engaging with older people and people from the community, it was acknowledged that during the course of their participation in a telephone interview and, in particular, when considering the potentially sensitive questions included in the instruments, some participants may reflect on experiences of violence/abuse and/or on complex family and other relationship dynamics, and that this may present risk issues. These circumstances raised significant ethical complexities for the research team to address, including the need for a sensitive approach to data collection and the development of appropriate interview protocols to support those participants who may become distressed as a result of participating. To address these complexities, consideration was also given to interviewer experience, pre-training and preparation and mandatory reporting obligations.
Data weighting
Data weighting was conducted to reduce the extent of any biases arising from potential non-coverage of population subgroups and consequent constraints on the ability to make inferences about the target population from the sample. This process takes into account that the sample may not be sufficiently representative of the population as some participants may have a lower likelihood of participating in the survey (e.g. men are less likely than women to participate in a survey).
Sample weights were generated for both the SOP and the SGC according to the current population, as estimated by the ABS, to make adjustment for differential representation of subgroups in the data.2 The variables used for weighting were: gender, state, country of birth, language spoken at home, highest education, home ownership status and telephone status (whether owns a landline phone). The sample weights are applied to all the analyses presented in this report except multiple regression analyses. Unweighted sample base numbers on which specific statistics are derived are also provided in relevant tables and/or table and figure notes.
Analysis reporting
When presenting overall prevalence of elder abuse (any subtype and overall), for the entire sample, 95% confidence intervals are provided in the main report, and are shown in Appendix A for prevalence figures relating to subgroups. For the bivariate analyses involving two categorical variables, a design-based F test is used to assess whether the two categorical variables (e.g. the prevalence of elder abuse by gender) were correlated. In relation to bivariate analysis involving the comparison of a scale between subgroups (e.g. ageism scale by gender), weighted regression (bivariate) is used to test whether the difference between a specific group and the reference group is statistically significant.
Statistical testing was not carried out in relation to the following areas:
- the relationship between older persons who experienced abuse and the perpetrators, or relationship between parties on other matters (e.g. financial assistance, power of attorney)
- sources of help that older participants sought for their experience of elder abuse (chapter 8)
- actions that older participants took to stop abusive behaviours (chapter 8)
- where some of the responses were back-coded based on verbatim responses provided by the participants (Note that a significant number of responses were back-coded. Statistical significance would be influenced by how detailed categories were presented and how back-coding categories were developed).
Unless otherwise indicated in the report, when reporting statistics by cross-tabulation, the general approach was to include only valid responses; that is, non-responses such as 'Do not know' or 'Refused' were excluded from the bivariate analysis. For the majority of variables analysed, the proportion of such responses was small (less than 5% of all responses). When reporting analysis results at a high level, non-responses were included in the table for deriving percentages, and this treatment of non-responses is indicated in table notes.
In general, results are not provided when a base sample involves fewer than 50 participants. However, in some instances, where it is important to provide insights on specific issues (e.g. the relationship between CALD participants who reported experiencing abuse relating to their language and culture and the perpetrators), results are provided with appropriate caveats even when the base sample is fewer than 50.
Sample characteristics
SOP
Table 4.1 describes the profile of the total adult interviews achieved for the survey of older people. The sample appeared to have a slight over-representation of those aged in their 70s. The data show over-representation of older people who are female, married or widowed, born in Australia, unemployed or retired, educated beyond Year 11 and who are homeowners. As expected, the sample includes an over-representation of older people with a non-Indigenous background, who were born in Australia and who speak English at home. In relation to family arrangements, older people lived as part of a couple or on their own. The sample also has a higher representation of older people who have an education level with certificates/diplomas, degrees or higher, as well as older people with an education level below Year 12. The weighted sample characteristics were largely similar to the 2016 Census.
| Characteristic | Total SOP (unweighted) % | Total SOP (weighted) % | 2016 Census (aged 65+ years) % |
|---|---|---|---|
| Total(N) | 7,000 | 4,037,333 | 3,235,486 |
| Gender | |||
| Male | 39.2 | 46.8 | 47.0 |
| Female | 60.6 | 53.2 | 53.0 |
| Age group | |||
| 65-69 years | 24.2 | 30.3 | 33.6 |
| 70-74 years | 27.5 | 26.2 | 25.0 |
| 75-79 years | 21.8 | 18.2 | 18.2 |
| 80-84 years | 15.8 | 16.1 | 12.4 |
| 85 years and over | 10.7 | 9.2 | 10.7 |
| Indigenous status | |||
| Non-Indigenous | 98.5 | 98.6 | 93.3 |
| Indigenous | 1.2 | 1.1 | 0.8 |
| Country of birth | |||
| Australia | 71.3 | 63.1 | 57.3 |
| Main English speaking countries excluding Australia a | 16.7 | 15.5 | 13.3 |
| Non-English speaking countries | 11.9 | 21.3 | 21.2 |
| Language at home | |||
| English | 91.1 | 82.5 | 76.8 |
| Language other than English | 8.7 | 17.5 | 16.9 |
| Not stated | 6.3 | ||
| Marital status | |||
| Married | 53.0 | 65.0 | 59.9 |
| Separated | 2.2 | 2.1 | 2.8 |
| Divorced | 12.4 | 10.3 | 12.3 |
| Widowed | 25.6 | 17.1 | 20.4 |
| Never married | 6.1 | 5.0 | 4.7 |
| Living arrangements | |||
| Couple with children | 5.6 | 7.4 | 8.2 |
| Couple only | 48.4 | 58.9 | 50.9 |
| Single person with children | 4.9 | 4.0 | 4.5 |
| Living alone | 38.0 | 26.3 | 25.4 |
| With grandchildren | 0.5 | 0.4 | 11.0 b |
| Other relatives with/without unrelated persons | 1.0 | 1.5 | |
| Unrelated persons | 1.0 | 1.0 | |
| Other | 0.1 | 0.2 | |
| Employment status | |||
| Employed | 12.4 | 13.0 | 13.2 |
| Not employed/retired | 87.4 | 86.8 | 80.0 c |
| Education | |||
| Degree or higher | 24.6 | 13.4 | 12.1 |
| Certificate/Diploma | 20.5 | 24.6 | 21.9 d |
| Trade/Other | 6.0 | 8.1 | |
| Year 12 | 10.9 | 12.9 | 9.6 |
| Below Year 12 | 34.9 | 37.9 | 38.8 |
| Not stated | 3.0 | 3.0 | 17.6 |
| Home ownership | |||
| Own outright | 77.7 | 78.1 | 66.8 |
| Own, paying off mortgage | 6.2 | 7.0 | 10.5 |
| Rent from private landlord | 5.8 | 5.6 | 7.3 |
| Rent from public housing authority | 3.2 | 3.0 | 3.6 |
| Other (boarding, living at home, etc.) | 5.9 | 4.9 | 3.9 |
| SEIFA Quintile (IRSD 2016) | |||
| 1 - Lowest socio-economic status | 15.2 | 16.2 | 18.8 |
| 2 | 19.6 | 20.6 | 19.2 |
| 3 | 19.2 | 19.4 | 20.0 |
| 4 | 19.1 | 19.0 | 18.9 |
| 5 - Highest socio-economic status | 26.9 | 24.8 | 23.2 |
| State | |||
| NSW | 31.7 | 32.7 | 33.4 |
| Vic. | 25.6 | 25.2 | 24.8 |
| QLD | 19.7 | 19.8 | 19.7 |
| SA | 8.5 | 8.1 | 8.3 |
| WA | 9.9 | 9.6 | 9.5 |
| Tas. | 2.7 | 2.5 | 2.6 |
| NT | 0.5 | 0.3 | 0.4 |
| ACT | 1.5 | 1.7 | 1.3 |
| Capital city/rest of state | |||
| Capital city | 59.5 | 60.2 | 60.3 |
| Rest of state | 40.5 | 39.8 | 39.7 |
Notes: 2016 Census data include population over 65 residing in a private dwelling. Refused/Don't know responses included in calculation of proportions for unweighted/weighted and 2016 Census data but not shown in the table above. This explains why the total proportions for some characteristics do not sum to 100.0%. Due to a high proportion of Don't know/Refused in 2016 Census for education, all information for this characteristic is reported (not stated/inadequately described). a The main English speaking countries comprise of the United Kingdom, Republic of Ireland, South Africa, Canada, the United States of America and New Zealand. b Proportion in 2016 census for categories: With grandchildren/Other relatives with/without unrelated persons/Unrelated persons/Other combined. c Proportion in 2016 Census for categories: 'Employed' includes 'employed but away from work'. d Proportion in 2016 census for categories: Certificate/diploma and trade/other combined. Other includes no educational attainment (Census 2016).
SGC
Table 4.2 describes the profile of adult interviews achieved for people from the general community. The results indicate a greater representation of people with the following characteristics: aged 55-64 years, being married, having a degree or higher qualification, and being employed. The weighted data adjusted the characteristics similar to the 2016 Census.
| Characteristic | Total SGC (unweighted) % | Total SGC (weighted) % | 2016 Census (aged 18-64 years) % |
|---|---|---|---|
| Total (N) | 3,400 | 15,506,360 | 14,517,100 |
| Gender | |||
| Male | 47.1 | 49.5 | 49.4 |
| Female | 52.7 | 50.2 | 50.6 |
| Age group | |||
| 18-24 years | 12.0 | 18.2 | 14.8 |
| 25-34 years | 16.1 | 21.2 | 23.2 |
| 35-44 years | 17.9 | 21.3 | 21.7 |
| 45-54 years | 22.9 | 20.5 | 21.4 |
| 55-64 years | 30.1 | 18.8 | 19.0 |
| Indigenous status | |||
| Non-Indigenous | 97.3 | 97.0 | 91.5 |
| Indigenous | 2.3 | 2.3 | 2.5 |
| Country of birth | |||
| Australia | 69.3 | 66.7 | 62.3 |
| Main English speaking countries excluding Australia a | 10.9 | 10.4 | 9.1 |
| Non-English speaking countries | 19.4 | 22.6 | 21.5 |
| Language at home | |||
| English | 77.3 | 75.2 | 70.4 |
| Language other than English | 22.6 | 24.8 | 23.1 |
| Not stated | 6.5 | ||
| Marital status | |||
| Married | 50.4 | 48.7 | 48.3 |
| Separated | 4.1 | 3.4 | 3.5 |
| Divorced | 8.6 | 5.8 | 8.2 |
| Widowed | 1.4 | 0.9 | 1.2 |
| Never married | 33.9 | 39.7 | 38.9 |
| Living arrangements | |||
| Couple with children | 34.9 | 37.3 | 37.11 |
| Couple only | 25.4 | 22.3 | 20.8 |
| Single person with children | 7.6 | 6.5 | 6.0 |
| Living alone | 13.0 | 10.1 | 8.9 |
| With grandchildren | 9.9 | 14.5 | 27.2 b |
| Other relatives with/without unrelated persons | 2.3 | 2.7 | |
| Unrelated persons | 5.5 | 5.3 | |
| Other | 0.1 | 0.1 | |
| Employment status | |||
| Employed (Full-time/part-time) | 74.1 | 75.9 | 65.4 c |
| Not employed | 25.5 | 24.1 | 24.8 d |
| Education | |||
| Degree or higher | 41.7 | 29.1 | 25.9 |
| Certificate/Diploma | 26.0 | 32.8 | 27.9 e |
| Trade/Other | 3.9 | 4.9 | |
| Year 12 | 14.8 | 20.7 | 17.9 |
| Below Year 12 | 12.6 | 12.5 | 16.8 |
| Not stated | 1.1 | 0.0 | 11.5 |
| Home ownership | |||
| Own outright | 24.1 | 22.0 | 20.1 |
| Own, paying off mortgage | 36.0 | 43.9 | 41.0 |
| Rent from private landlord | 25.6 | 20.0 | 26.8 |
| Rent from public housing authority | 3.9 | 3.3 | 2.7 |
| Other (boarding, living at home, etc.) | 8.6 | 9.1 | 2.7 |
| SEIFA Quintile (IRSD 2016) | |||
| 1 - Lowest socio-economic status | 14.4 | 15.2 | 16.2 |
| 2 | 16.5 | 18.4 | 16.7 |
| 3 | 19.3 | 19.1 | 20.8 |
| 4 | 21.0 | 21.0 | 20.9 |
| 5 - Highest socio-economic status | 28.6 | 26.2 | 25.4 |
| State | |||
| NSW | 27.4 | 31.8 | 31.8 |
| Vic. | 28.8 | 26.3 | 25.6 |
| QLD | 19.9 | 19.8 | 19.9 |
| SA | 7.5 | 6.8 | 7.0 |
| WA | 11.0 | 10.5 | 10.8 |
| Tas. | 2.1 | 1.9 | 2.1 |
| NT | 1.1 | 0.9 | 1.1 |
| Capital city/rest of state | |||
| Capital city | 69.2 | 69.4 | 68.6 |
| Rest of state | 30.8 | 30.6 | 31.5 |
Note: Refused/Don't know responses included in calculation of proportions for unweighted/weighted and 2016 Census data but not shown in the table above. This explains why the total proportions for some characteristics do not sum to 100.0%. Due to high proportion of Don't know/Refused in 2016 Census for education, all information for this characteristic is reported (not stated/inadequately described). a The main English speaking countries comprise of United Kingdom, Republic of Ireland, South Africa, Canada, the United States of America and New Zealand. b Proportion in 2016 Census for categories: With grandchildren/Other relatives with/without unrelated persons/Unrelated persons/Other combined. c Proportion in 2016 Census for categories: 'Employed' includes 'employed but away from work'. d Proportion in 2016 Census for categories: not employed and retired combined. e Proportion in 2016 Census for categories: Certificate/Diploma and trade/other combined. Other includes no educational attainment (Census 2016).
CALD substudy
The findings of the CALD substudy presented in this report, and summarised in chapter 13, are based on the CALD subsamples from the SOP and SGC. The analytic approach to identifying CALD groups was different in the SOP from the SGC. In the SOP, the CALD group analysis is based on all participants who reported speaking a language other than English at home (n = 608). This was to ensure that the questions concerning the construct of abuse relating to language and culture were fully relevant to this group. For this subgroup, 85% were born outside of Australia as well as speaking a language other than English at home. This approach meant that people who were born in English speaking countries outside of Australia were not included in the SOP CALD subgroup.
For the SGC CALD subgroup (n = 660), the analysis was based on participants who reported being born in a country where English is not the primary language (countries other than main English speaking countries). Additional analysis based on country of region of birth is also carried out where it is feasible.
The CALD substudy is unable to shed light on the experiences of elder abuse and attitudes to elder abuse and older people within particular CALD groups, except to a very limited extent (see chapter 13). The methodology applied in this study supports some broad insights into similarities and differences between the non-CALD sample and the CALD sample; however, further research (likely qualitative in nature) would be required to understand experiences and dynamics among different groups in greater depth.
For each CALD sample, the sample characteristics were compared with their subpopulation in the 2016 Census. The analysis indicated that the CALD sample in the SOP had a greater proportion of people with a higher socio-economic status: having a degree or higher qualification, owning their home outright, from areas with highest socio-economic status.
Compared to the population of older people aged 65 years and older who spoke a language other than English at home in the 2016 Census, the SOP CALD subsample had a greater representation of those who are a higher socio-economic status: having a degree or higher qualification, owning their home outright, from areas with highest socio-economic status (see Appendix A, Table A4.1 for the detailed comparison). The proportion living alone is higher in the CALD sample, compared to the census data. The weighted data largely reduced the differences.
Table 4.3 shows the number of participants in the SOP according to country/region of birth. The majority of participants were born in English speaking countries (Australia n = 4,991 and United Kingdom/Ireland n = 944) followed by Southern and Eastern Europe (n = 323) and North-West Europe (n = 238).
| Characteristic | Total N |
|---|---|
| Speak a language other than English at home | 7,000 |
| Speak English only at home | 6,392 |
| Speak a language other than English at home | 608 |
| Country/region of birth | 6,956 |
| Australia | 4,991 |
| New Zealand | 135 |
| UK/Ireland | 944 |
| North-West Europe | 238 |
| Southern and Eastern Europe | 323 |
| Middle East, North Africa | 36 |
| South-East Asia | 92 |
| Chinese Asia | 32 |
| Southern and Central Asia | 57 |
| North America | 46 |
| Africa | 62 |
1 This may be less of an issue if the discussion takes place over the phone rather than face-to-face at the older person's place.
2 Generalised regression (GREG) weighting method was used to generate the data weights. This method involves non-linear optimisation to minimise the distance between the design and adjusted weights subject to the weights meeting the benchmarks.
Prevalence

Introduction
This chapter sets out findings on the prevalence of elder abuse - the proportion of the community dwelling population aged 65 and over who reported experiencing elder abuse in the past year. Prevalence for three subtypes of abuse - physical, financial and sexual - is expressed as a single prevalence figure. For two subtypes of abuse (psychological abuse and neglect), the prevalence rates are expressed as a score across three bands: low, medium and high. This approach is also applied to abuse relating to language and culture.
This chapter addresses three elements of the research aims (chapter 1):
- It describes the prevalence of elder abuse in the community dwelling population aged 65 and over.
- It also describes the prevalence of elder abuse, including specific subtypes, for the CALD subsample.
- It sets out the extent to which participants in the SGC reported having concerns that someone they know aged 65 and over had experienced elder abuse.
This chapter has four further parts. The first part explains how the prevalence estimates are derived. The second part sets out the measures (i.e. the questions that were asked in the survey) used and the technical definition applied in the analysis along with the findings on overall prevalence and the prevalence of the five core subtypes of abuse. The third part sets out findings of prevalence among the CALD subsample, considering overall prevalence, prevalence of the five core subtypes and the prevalence of the CALD-specific subtype of abuse relating to language and culture. The extent to which participants report experiencing multiple types of abuse is considered in sections two and three. The final part considers the extent to which participants in the SGC expressed concerns about elder abuse in relation to someone known to them.
Deriving prevalence
This section sets out the technical analytic approach used to derive prevalence estimates For each type of abuse, the development of a technical analytic definition involves determining how the following issues influence whether a particular experience is or is not included in the prevalence estimate:
- the perpetrator of the experience (i.e. was there a power imbalance or a trust relationship?)
- the number of times an experience happened (frequency)
- self-assessed seriousness.3
Decisions on these aspects of the technical definition were informed by the conceptual definition (chapter 3). The following sections explain the approaches taken and their rationales.
Financial, physical and sexual abuse
In relation to three subtypes of abuse - physical abuse, financial abuse and sexual abuse - there is some variation among international studies as to the measures used. However, there is generally a consistent approach to applying a technical definition. Consequently, the technical definitions applied for these subtypes of abuse are consistent with most international studies. The definition requires one or more instance of abuse to be experienced in the past 12 months. Neither frequency nor impact are relevant for the technical definitions of these abuse subtypes.
A score for psychological abuse, neglect and abuse relating to language and culture
The technical definitions applied to psychological abuse, neglect and abuse relating to language and culture involve a scoring approach that produces a prevalence estimate distributed across three bands: low, medium and high. This approach accommodates the complexity of measuring these types of abuse, which occur across a continuum of severity (Burnes et al., 2018; Williams et al., 2017).
Some international literature demonstrates that in comparison with a binary present/not present approach, an approach involving 'a severity framework' (Burnes et al., 2018), such as a scoring approach, is particularly useful for two reasons (Burnes et al., 2018). First, it is a more sensitive measure for assessing whether change has occurred, as it can assess whether abuse has become more or less serious through changes in the range of scores. For example, if the proportion of the population that reports abuse in the most serious range declines and the proportion reporting abuse in the lower ranges increases, then that would suggest measures to address elder abuse are having an impact. Such an impact would not be detectable if a binary present/not present approach was applied. A binary approach can only measure an absolute reduction (or increase) in the proportion of the population reporting an experience of elder abuse.
Second, a scoring approach provides a more useful set of indications for policy, program development and practice (e.g. Burnes, Lachs, & Pillemer, 2018). In these contexts, different approaches may be required for experiences that fall into different score ranges. Experiences at the high end of the spectrum will require responses that are different in urgency and intensity from experiences in the lower score ranges.
In relation to psychological abuse, there is significant variation in international studies as to the measures used and the technical definitions applied. Further, the behaviours involved in psychological abuse are varied, and in some circumstances where they occur on an isolated or infrequent basis, it may be inappropriate to assess them as abuse (e.g. Williams et al., 2017). For these reasons, as set out below, a unique approach was developed for psychological abuse to reflect the context of this study - as the first Australian effort to assess prevalence in an environment where there is growing evidence of psychological abuse as a form of violence (e.g. AIHW, 2018). Frequency is relevant in this technical definition but impact is not.
Similarly, neglect, being based on omissions rather than actions, is particularly complex with very limited consistency in international approaches (e.g. Stodolska, Parnicka, Tobiasz-Adamczyk, & Grodzicki, 2020). As with psychological abuse, the behaviours involved may not of themselves be abusive if they are isolated or infrequent. Again, the approach adopted reflects the context of this study as the first Australian attempt to measure the prevalence of neglect. Frequency is relevant in this technical definition but impact is not.
Abuse relating to language and culture is a construct measured uniquely in this study. The technical analytic approach is the same as for psychological abuse.
Relationship of trust/power imbalance
A central aspect of the conceptual definition of elder abuse is a 'relationship of trust' or 'a power imbalance' (chapter 3). For this reason, the technical definition is based on actions and omissions committed by individuals whose connection with the older person could reasonably be expected to involve one or both of these elements. This includes family members, friends, acquaintances, neighbours, professionals and paid carers. It excludes strangers. However, a significant proportion of older people who reported experiencing neglect reported that this arose because they had no-one to help them. The experiences of this group are not included in the prevalence estimate for neglect. However, their experiences are described in chapter 6.
A detailed discussion about the perpetrators of elder abuse is in chapter 7.
Impact
In some international approaches, one element of the technical analytic definition for some abuse subtypes includes self-assessed impact in determining whether some experiences should or should not be considered elder abuse, particularly where the behaviours involved may be considered not serious or where they have occurred infrequently. This provides a way of narrowing the scope of behaviour that counts as elder abuse.
For this study, the research team made a decision not to include self-assessed impact in the calculation of the prevalence estimate. This is because international research demonstrates that in some circumstances, it is evident that seriousness assessments are lower (i.e. participants are more inclined to rate some behaviours as less serious), potentially because of complex psychological dynamics that can arise in relation to elder abuse (Burnes et al., 2019a). These circumstances include situations where the victim and perpetrator live together, where the victim needs care from the perpetrator and where the perpetrator is a child or grandchild of the victim. The analysis of Burnes and colleagues suggests that in these circumstances, lower subjective assessments reflect emotions such as a sense of internalised burden for requiring care, or embarrassment and shame that a child or grandchild could perpetrate abuse. This means that an emphasis on self-assessed impact could produce unreliable prevalence estimates.
In Australia, similar points have been raised in commentary about whether the definition of elder abuse should have a subjective element. The ALRC Elder Abuse Inquiry Discussion Paper (ALRC, 2016) noted that submissions cautioned against over-emphasising the presence of distress in assessing whether elder abuse had occurred. Similarly, the Elder Abuse: Research Definition Background Paper acknowledged the relevance of both subjective and objective assessments of harm and distress (Kaspiew at al., 2019).
Given that this is the first systematic attempt to assess the prevalence of elder abuse in Australia, the research team decided to exclude self-assessed impact from the technical approach to assessing elder abuse. In the absence of systematic evidence on self-assessed seriousness in Australia, and the risk that prevalence findings could be skewed by the inclusion of self-assessed seriousness, the research team decided this would be the most appropriate approach. Chapter 9 sets out findings on self-assessed seriousness, which remain important in understanding the dynamics of elder abuse, including in the context of whether action is taken in relation to elder abuse experiences.
Prevalence findings
This section sets out estimates on the overall prevalence of elder abuse and the prevalence of the five abuse subtypes (financial abuse, physical abuse, sexual abuse, neglect, psychological abuse). The reference period is the 12 months prior to the survey. Consistent with the discussion above, the prevalence estimates for financial abuse, physical abuse and sexual abuse are based on a single figure, reflecting the proportion of the sample that reported abusive experiences. The prevalence estimates for neglect and psychological abuse are based on a score with the overall prevalence assessment distributed across three bands: low, medium and high.
Overview
In the 12 months prior to being surveyed, 14.8% of the sample reported experiencing at least one form of elder abuse (Table 5.1). Psychological abuse was most commonly reported (11.7%), followed by neglect (2.9%), financial abuse (2.1%), physical abuse (1.8%) and sexual abuse (1%).
Women were more likely than men to report an experience of elder abuse (15.9% cf. 13.6%) (see Figure 6.1), but consistent with Yon and colleagues' (2017) international meta-analysis, which revealed no gender differences, these overall figures do not suggest particularly strong gender dimensions overall. However, gendered patterns are evident in some subtypes of abuse and in the profile of perpetrators (see further chapters 6, 8 and 9 in relation to gender).
| Elder abuse type | Prevalence | General population | ||
|---|---|---|---|---|
| Prevalence (%) | 95% confidence interval | Estimated number | 95% confidence interval | |
| Financial | 2.1 | 1.7-2.5 | 83,800 | 67,500-100,100 |
| Physical | 1.8 | 1.4-2.2 | 71,900 | 56,000-87,900 |
| Sexual | 1.0 | 0.7-1.3 | 39,500 | 28,600-50,300 |
| Neglect | 2.9 | 2.4-3.4 | 115,500 | 95,500-135,600 |
| Psychological | 11.7 | 10.8-12.5 | 471,300 | 432,500-510,100 |
| Any form in the previous 12 months | 14.8 | 13.8-15.9 | 598,000 | 555,000-640,900 |
| Number of participants (base) | 7,000 | |||
Notes: Based on weighted data. Participants who did not respond to relevant questions were included in the total in deriving estimates (1-2% across subtypes).
Box 5.2: How many people experience elder abuse?
The prevalence rates allow us to estimate the total numbers in the Australian population aged 65 and over that are affected by elder abuse. It should be noted that these figures are estimates based on the sample of the SOP, not the entire older population, and an estimate range (i.e. 95% confidence intervals) is shown in the table to reflect this. Confidence intervals relate to the level of confidence that the estimate range based on the sample contains a true reflection of the Australian population living in community settings, assuming the sample was representative of the target population; that is, a 95% chance that the range contains the actual prevalence of the Australian population aged 65 years.
Assessing confidence intervals involves applying a mathematical formula that produces upper and lower bound estimates of reliability. A 95% confidence interval means that we can be 95% sure that our prevalence estimates are in the range of the upper and lower bound estimates. On this basis, we estimate the numbers of people affected by elder abuse in Australia in the past 12 months are:
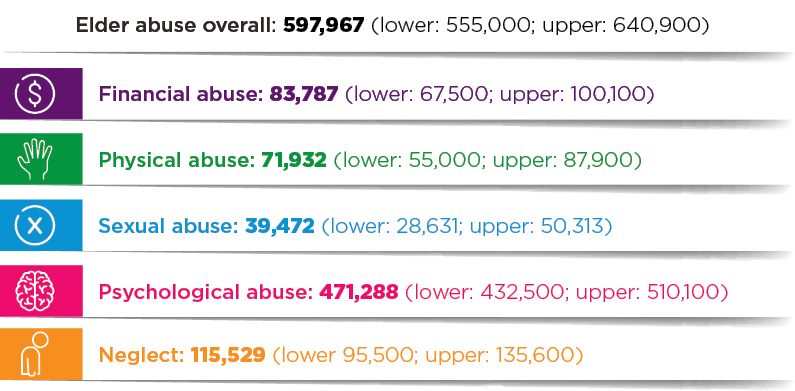
How does Australia compare with other countries?
Overall prevalence and the relative prevalence of the different abuse subtypes is broadly in line with international studies (shown in Table 5.2). Yon and colleagues' (2017) meta-analysis of 52 prevalence studies across 28 countries demonstrated an overall prevalence rate of 15.7%, including 11.6% for psychological abuse, 6.8% for financial abuse, 4.2% for neglect, 2.6% for physical abuse and 0.9% for sexual abuse. Neglect, financial abuse and physical abuse are marginally higher in the international estimate.
Table 5.2 sets out the prevalence findings in this study alongside those of Yon's meta-analysis and the findings from the prevalence studies from the UK, Ireland, Canada, New York and the USA. Notably, the measures and analytic approaches for financial, physical and sexual abuse are consistent between the latter studies and this study. However, sample age ranges differ, as do sample sizes and data collection techniques. Measurement and analysis of psychological abuse and neglect vary significantly among studies. Caution should be exercised when making comparisons between these findings due to the different methodologies used. It is worth noting that the estimates on financial abuse and neglect were lower than the international estimate by Yon and colleagues (2017) and this could the subject of further research.
| Australia (2021) (%) | UK (O'Keeffe et al., 2007) (%) | Ireland (Naughton et al., 2010) (%) | Canada (National Initiative for the Care of the Elderly, 2015) (%) | NY, USA (Lifespan of Greater Rochester, 2011) (%) | USA (Acierno et al., 2010) (%) | Global (Yon et al., 2017) (%) |
|---|---|---|---|---|---|---|
| AGGREGATE PREVALENCE (over past year/12 months) | ||||||
| 14.8 | 2.6 (4% when increased to incidents involving neighbours and acquaintances) | 2.2 (2.9% if mistreatment based on including neighbours and people known to the older person) | 8.2 | 7.6 (the authors noted that lower rates may be a result of using more restricted frequency and perceived seriousness threshold criteria on subtypes) | 11.4 | 15.7 |
| FINANCIAL ABUSE | ||||||
| 2.1 | 0.7 | 1.3 | 2.6 | 4.2 | 5.2 (current exploitation by family members) | 6.8 |
| PHYSICAL ABUSE | ||||||
| 1.8 | 0.4 | 0.5 | 2.2 | 2.2 (including sexual abuse) | 1.6 | 2.6 |
| SEXUAL ABUSE | ||||||
| 1.0 | 0.2 | 0.05 | 1.6 | 2.2 (including physical abuse) | 0.6 | 0.9 |
| PSYCHOLOGICAL ABUSE | ||||||
| 11.7 | 0.4 | 1.2 | 2.7 (unadjusted if one or more: 33%) | 1.6 | 4.6 | 11.6 |
| NEGLECT | ||||||
| 2.9 | 1.1 | 0.3 | 1.2 (unadjusted if at least one incident used: 5.7%) | 1.8 | 5.1 (potential neglect; caregiver neglect was 0.5%) | 4.2 |
Definition and measures: Financial abuse
The technical definition of financial abuse is one or more incidents of any item occurring in the last 12 months, by family member, carer, other professional or other known person. Frequency and self-assessment of impact are not taken into account in the definition.
Participants were asked the question 'In the past 12 months, has someone you know …' followed by the following items of financial abuse:
- Taken your money, possessions or property without your permission
- Deliberately prevented you from accessing or using your money, possessions or property
- Pressured you into giving or loaning them money, possessions or property
- Pressured you to make or change your will
- Made financial decisions for you without your permission
- Misused a power of attorney
- Not contributed to household expenses such as rent or food, or aged care/home service fees where this was previously agreed
- Done anything else to harm you financially.
Financial abuse
In relation to financial abuse, the most common experience involved one financial abuse item, reported by two-thirds of the financial abuse cohort, while just under one-third reported experiencing multiple types of financial abuse (Figure 5.1).
Gender differences were negligible in reports of financial abuse overall: 2% of women compared with 2.1% of men (see Figure 6.1 and see chapter 6 for detailed discussion).
The most common form of financial abuse was being 'pressured into giving or loaning money, possessions or property, (41.5%) (Figure 5.1). Behaviour amounting to theft (taking money or possessions without permission) was reported by just over a third (34%) of those who reported financial abuse. Almost as common (31.4%) was failing to provide financial contributions or assistance (rent, food, aged care/home service fees) as previously agreed. A catchall question - covering other actions causing financial harm - was affirmed by 28.1% of the sample.
Less common forms of financial abuse were 'pressure to make or change a will' (9.5%) and 'making financial decisions without permission' (6.6%). There was no participant reporting experience of misusing a power of attorney. This may reflect the limitations of the study as outlined in chapter 4; that is, the sample focused on the older population in the community who had the capacity to undertake an interview and excluded the older persons who were incapable of undertaking an interview due to physical or health conditions. The latter segment of the population would be more likely to use their power of attorney but was not covered in the study.
Figure 5.1: Survey of Older People: Participants who were classified as experiencing financial abuse - proportion reporting each financial abuse item and number of items reported
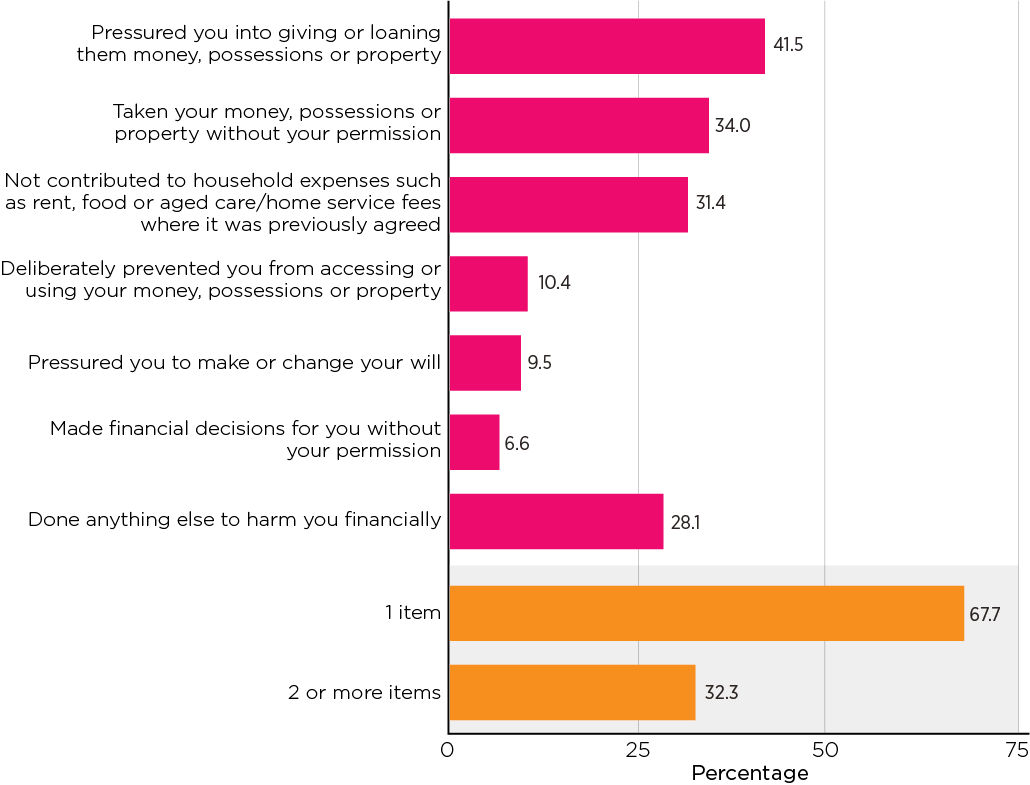
Notes: Weighted data. Unweighted sample size, n = 158. Item 'misused a power of attorney' is not shown because no participant reported experiencing it.
Definition and measures: Physical abuse
The definition of physical abuse is based on reports of experiencing one or more incidents of physical violence in the last 12 months, by family member, carer, other professional or service provider or other known person. Frequency and self-assessment of impact are not taken into account in the definition.
The questions asked to assess physical abuse were preceded by 'In the past 12 months, has someone you know …' followed by the following items:
- Tied or held you down, or restrained you in any other way, or locked you up
- Grabbed, pushed or shoved you
- Hit, punched, kicked or slapped you
- Threatened you with a weapon (e.g. knife, gun or any other objects)
- Injured you with a weapon (e.g. knife, gun or any other objects)
- Threatened to harm you in any way
- Given you drugs or too much medicine in order to control you/make you docile
- Hurt you physically in any other way.
Physical abuse
Like financial abuse, one type of physical abuse was most commonly reported by older persons who experienced physical abuse (57.1%), with 42.9% reporting multiple types (Figure 5.2).
Men were slightly more likely than women to report physical abuse (2% cf. 1.6%) (see Figure 6.1).
The most common form of physical abuse reported was threats to harm (60.7%). Almost half (46.6%) of those who reported physical abuse reported being grabbed, pushed or shoved. Just over one in five (22.3%) reported being hit, punched, kicked or slapped. Threats with a weapon were reported by 15.3%. Any other physical hurt was the next most common (14.3%) form of physical abuse.
Least common were the higher forms of physical abuse:
- Being tied, held down, restrained or locked up (7.1%)
- Being given too many drugs or other medicine to control you or make docile (4.1%)
- Being injured with a weapon (1.5%).
Figure 5.2: Survey of Older People: Participants who were classified as experiencing physical abuse - proportion reporting each physical abuse item and number of items reported
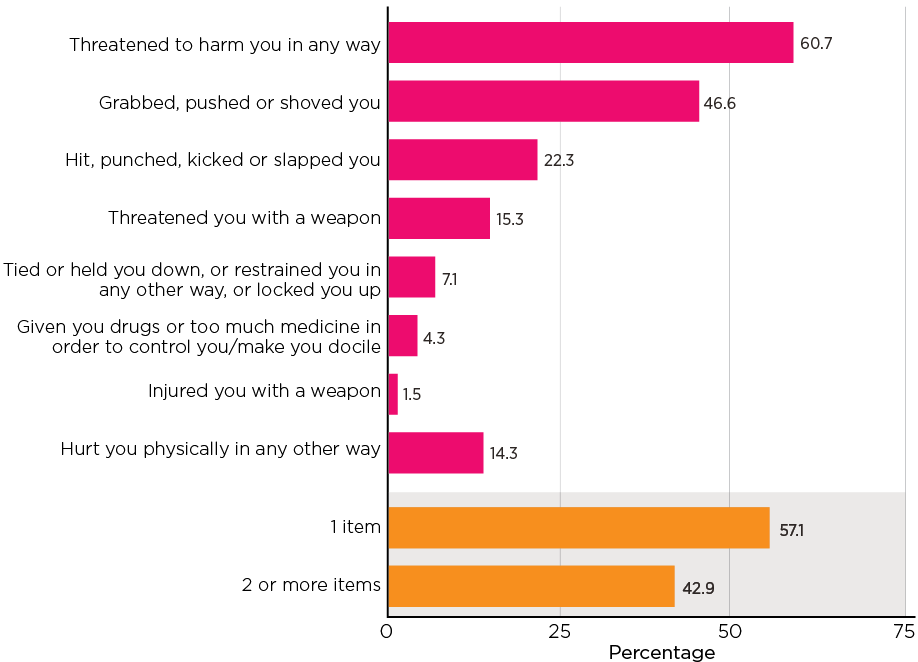
Notes: Weighted data. Unweighted sample size, n = 127.
Definition and measures: Sexual abuse
Sexual abuse is defined as the experience of one or more incidents in the last 12 months, by family member, carer, other professional or other known person. Frequency and self-assessment are not taken into account in the definition.
Participants were asked 'In the past 12 months, has someone you know …' followed by the following items:
- Touched you in a sexual way against your will
- Made you watch pornography against your will
- Forced you to engage in sexual acts against your will
- Talked to you in a sexual way when you did not want to
- Tried to engage you in any other unwanted sexual experience/s.
Sexual abuse
Among the 1% of the sample that reported sexual abuse, one type of sexual abuse was most commonly reported (65%), and about one-third experienced multiple sexually abusive behaviours (Figure 5.3).
Women (1.2%) were more likely to report sexual abuse than men (0.7%) (see Figure 6.1).
The most frequently reported form of sexual abuse was being spoken to in a sexual way when this was unwelcome (76.5%) (Figure 5.3). Nearly a third of the sexual abuse reported consisted of being touched in a sexual way against the participant's will (32.2%). Just over a third of sexual abuse experiences involved some 'other unwanted sexual experience/s'. Forced sexual acts accounted for 15.9% of sexual abuse experiences. No participants reported being made to watch pornography against their will.
Figure 5.3: Survey of Older People: Participants who were classified as experiencing sexual abuse - proportion reporting each sexual abuse item and number of items reported
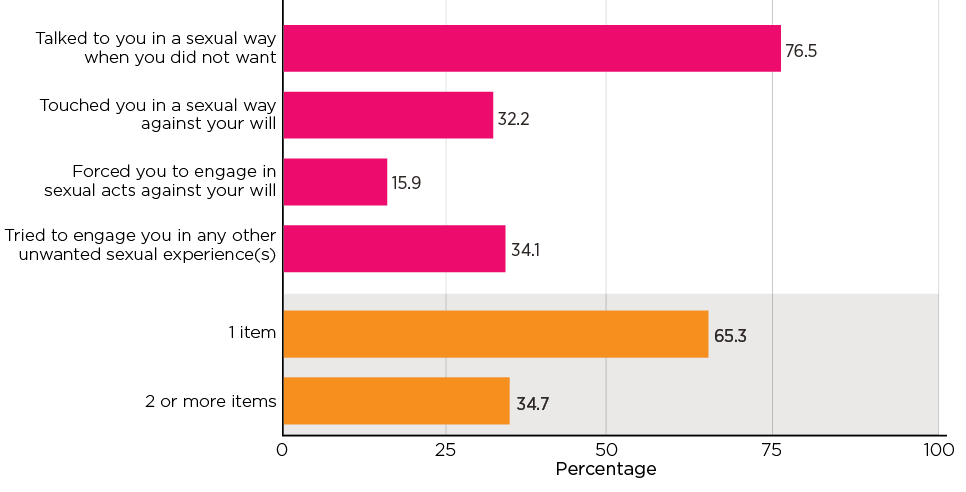
Notes: Weighted data. Unweighted sample size, n = 87. Item 'Made you watch pornography against your will' is not shown because no participant reported experiencing it.
Definition and measures: Psychological abuse
Psychological abuse is assessed by using a score based on the number and frequency of psychologically abusive acts reported.
This approach is similar to the scoring for neglect (see below). First, for each item (question about specific acts), a score was assigned: 0 if never experienced, 1 if experienced once, 3 if experienced a few times, 7 if experienced many times, and 10 if experienced every day or almost every day. Then, the sum of the scores across all the items is the overall score of psychological abuse. A higher score reflects experiences of a higher level of psychological abuse overall. The theoretical score range is 0-70, with a higher score indicating a higher level of experience of psychological abusive behaviours.
Experiences that are scored at three or above are counted as psychological abuse. The overall prevalence rate is distributed across three severity bands:
- Band 1: scores between 3 and 6: experiences of an act of psychological abuse 'a few times' in the last 12 months (low)
- Band 2: scores of between 7-9 (medium)
- Band 3: scores of 10 and over (high).
The experience of psychological abuse was assessed with reference to seven response options to the following question: 'In the past 12 months, has someone you know …'
- Insulted you, called you names or swore at you in a way you found offensive or aggressive
- Excluded you or repeatedly ignored you
- Undermined or belittled what you do
- Threatened to harm others that you care about (e.g. pets, children, relatives, friends)
- Threatened to harm themselves if you don't do what they ask
- Prevented you from seeing or contacting family members (e.g. grandchildren) or your doctor/nurse
- Done anything else to cause you emotional distress.
For each item, the participant was asked: a) whether they experienced it in the last 12 months, b) if yes, how often it happened to them with the response options: Once; Few times; Many times; Every day or almost every day. Participants who reported at least one incident of psychologically abusive behaviour were asked who did this/these to them.
Psychological abuse
For the 11.7% of the sample who reported psychological abuse, the distribution was concentrated in the low and high score ranges. Nearly half of older persons who were identified as having experienced psychological abuse in the previous 12 months were in the low score band, and 37% were in the high score band, while 14% were in the medium score range (Table 5.3). Table 5.3 also shows what these bands mean for the prevalence estimates of psychological abuse. Specifically, with 4.3% in the high score band and 1.7% in the medium score band, 6% of participants experienced psychological abuse in the medium and high score bands. Another 5.7% were in the low score band (i.e. low frequency).
Women were more likely (12.6%) to report psychological abuse than men (10.7%) (see data shown in Figure 6.1 and accompanying explanation about significance). The distribution of score ranges for women and men was similar, with a concentration of scores in the low and high ranges for both women and men.
| Psychological abuse | As % of the participants who experienced psychological abuse | Prevalence (as % of the full sample) | 95% Confidence interval |
|---|---|---|---|
| Band 1 (low) | 48.8 | 5.7 | 5.1-6.4 |
| Band 2 (medium) | 14.2 | 1.7 | 1.3-2.1 |
| Band 3 (high) | 37.1 | 4.3 | 3.8-5.0 |
| Total (all bands) | 100.0 | 11.7 | 10.8-12.6 |
| Number of participants (base) | 843 | 7,000 |
Note: Participants who did not respond to relevant questions were included in the total in deriving prevalence estimates (1.7% across subtypes).
In relation to the psychological abuse items, analysis of individual items is based on the medium and high groups being considered together because of the small sample size in the medium range. In relation to the individual abuse items, the findings for the types of psychological abuse reported (Figure 5.4) are as follows:
- Half (49.0%) the sample reported being insulted, called names or sworn at in a way they found offensive or aggressive. This behaviour was reported by 34.6% of the sample in the low range and 62.7% of the sample in the medium/high range.
- Just under half the sample (46.4%) reported being excluded or repeatedly ignored. This behaviour was reported by 26.7% in the low range and 65.2% in the medium/high range.
- Behaviour that was undermining or belittling was reported by the same proportion (46.4%). This was reported by 33.1% of the low band and 59.1% of the medium/high band.
- Actions that involved preventing the participant from seeing or contacting family members or medical professionals were reported by 14.5% of the participants who reported psychological abuse. This was much more common in the medium/high band (25%) than in the low band (3.5%).
- Threats to harm people that the participants cared about accounted for 10.2% of the psychological abuse types, again with a concentration in the medium/high band (15.5%) rather than the low band (2.1%).
- A catchall question concerning any other behaviours causing emotional distress was reported by 45.5% of the psychological abuse subsample. These participants fell into the low band in 37.4% of cases and into the medium/high band in 53.1% of cases.
Figure 5.4: Survey of Older People: Participants who were classified as experiencing psychological abuse - proportion reporting each psychological abuse item, by psychological abuse score (band)
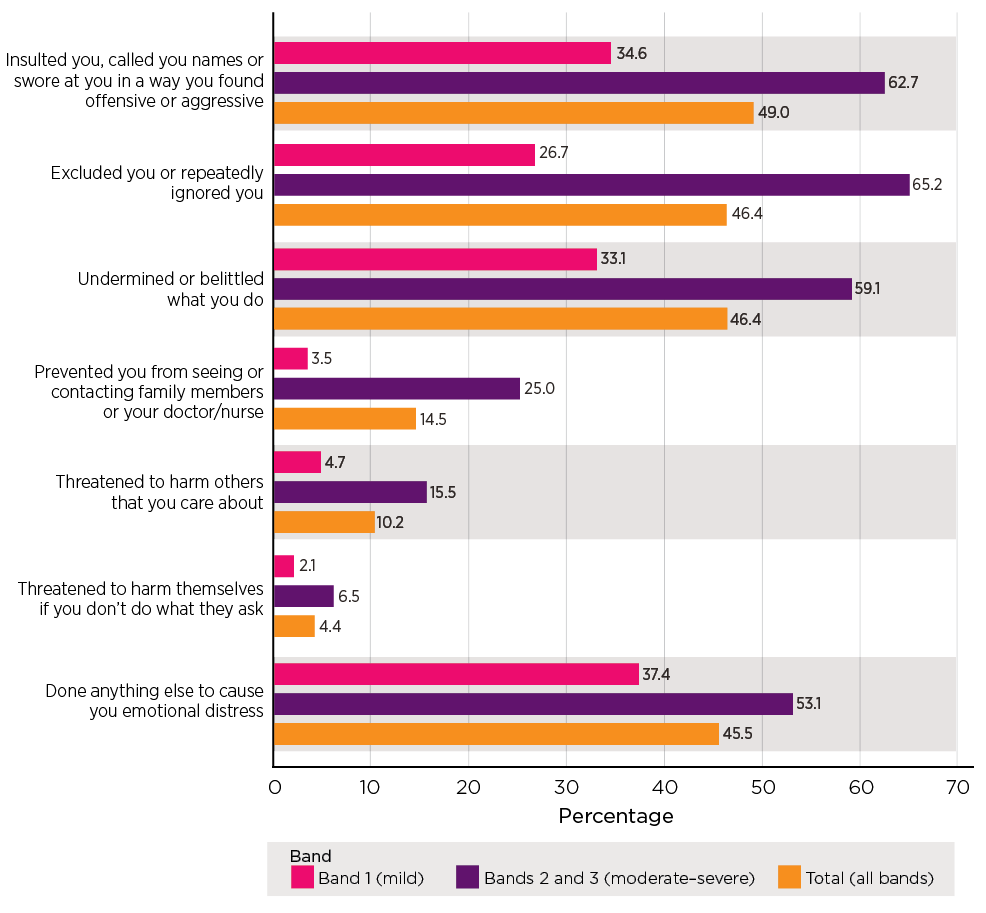
Notes: Weighted data for the statistics and unweighted sample sizes (in order of legend, n = 425, 418, 843).
Definition and measures: Neglect
The assessment of the prevalence of neglect is particularly complex (Stodolska et al., 2020). Potentially, the prevalence estimate could be based on analysis taking into account a variety of factors, including the older person's level of need, the frequency of the person's experience of not receiving help and the impact of the failure to receive help.
In the SOP, participants were asked whether they needed assistance for each of 10 Activities of Daily Living (ADL) and Instrumental Activities of Daily Living (IADL)4 in the past 12 months:
- Preparing meals
- Shopping for groceries or clothes
- Doing routine housework
- Travel or transport
- Personal care such as washing or bathing (including getting in and out of the bath or shower), dressing or undressing
- Getting to and using the toilet
- Getting in and out of bed
- Taking the right amount of medicine at the right times
- Eating, including cutting up food
- Any other day-to-day activity.
For each item, the survey measured how often help was needed, and the participant's relationship to the person responsible for providing that help:
- Whether participant required help with the activity: 1 None of the time; 2 Rarely; 3 Some of the time; 4 All of the time.
- [If any help required, including 'rarely'] Who provided help with this activity?5
- For each person nominated who provided help: whether participant always got the help when they needed in the last 12 months? If not, how many times participant did not receive help from this person? (Once; A few times; Many times; Every day or almost every day).
The prevalence assessment of neglect applied in this study is based on a score that takes into account the level of need for support and the extent to which these needs were not met by a defined carer or carers. The scoring is intended to assess the overall experience of an older person with support needs that should be met in order to function every day: it considers the experience of neglect across all the activities associated with support needs. Essentially, the neglect score range for a single activity is on a 0-10 scale, and the sum of neglect score would theoretically range from 0 to 100 (see Box 5.1 for how neglect score is scored).
This approach results in the allocation of a score between 0 and 100. Across the possible range of scores, a score above three is counted as neglect. For experiences that are counted as neglect, there are three severity bands:
- Band 1: scores between 3 and 6 (low)
- Band 2: scores between 7 and 9 (medium)
- Band 3: a score of 10 and above (high).
| Carer 1: frequency of not providing help as needed | Original rating | Carer 2: frequency of not providing help as needed | Original rating | Score |
|---|---|---|---|---|
| No carer to provide help as needed | 0 | |||
| Every day or almost every day | 4 | Every day or almost every day | 4 | 10 |
| Every day or almost every day | 4 | Many times | 3 | 10 |
| Many times | 3 | Every day or almost every day | 4 | 10 |
| Every day or almost every day | 4 | A few times | 2 | 10 |
| A few times | 2 | Every day or almost every day | 4 | 10 |
| Every day or almost every day | 4 | Once or never | 1, 0 | 10 |
| Once or never | 1, 0 | Every day or almost every day | 4 | 10 |
| Many times | 3 | Many times | 3 | 9 |
| Many times | 3 | A few times | 2 | 8 |
| A few times | 2 | Many times | 3 | 8 |
| Many times | 3 | Once or never | 1, 0 | 7 |
| Once or never | 1, 0 | Many times | 3 | 7 |
| A few times | 2 | A few times | 2 | 4 |
| A few times | 2 | Once or never | 1,0 | 3 |
| Once or never | 1,0 | A few times | 2 | 3 |
| Once | 1 | Once or never | 1, 0 | 1 |
| Once or never | 1, 0 | Once | 1 | 1 |
| Never | 0 | Never | 0 | 0 |
| No 2nd carer | ||||
| Every day or almost every day | 4 | N/A (Not Applicable) | 10 | |
| Many times | 3 | N/A | 7 | |
| A few times | 2 | N/A | 3 | |
| Once | 1 | N/A | 1 | |
| Never | 0 | N/A | 0 |
Neglect
Of participants who were considered as having experienced neglect in the previous 12 months, the majority (60%) were in the low score range, just under a quarter were in the medium score range, while 16% were in the high range (Table 5.4). Table 5.4 also shows these bands in the context of prevalence, with 1.2% being in the medium and high score bands (i.e. higher level of frequency of not having received assistance needed with specific daily activity/activities) and 1.7% in the low score band.
More women than men reported experiences of neglect (3.5% cf. 2.2%) (see Figure 6.1).6 The distribution of women's and men's experiences across the score range were different. More women than men were in the low (2.2% cf. 1.3%) and medium band (1% cf. 0.3%).
| Neglect | As % of the participants who experienced neglect | Prevalence (as percentage of the full sample) % | 95% Confidence interval |
|---|---|---|---|
| Band 1 (low) | 60.4 | 1.7 | 1.4-2.1 |
| Band 2 (medium) | 23.7 | 0.7 | 0.5-1.0 |
| Band 3 (high) | 15.9 | 0.5 | 0.3-0.7 |
| Total (all bands) | 100.0 | 2.9 | 2.4-3.4 |
| Number of participants (base) | 208 | 7,000 |
Notes: Weighted data for the statistics and unweighted sample sizes. Proportion of partial or all missing responses for neglect 1.8%.
In relation to neglect, the analysis of individual neglect questions was based on the low band, with the medium/high range being combined due to small sample sizes in the medium range (Figure 5.5). The most common form of neglect involved a failure to do routine housework (79.8% of the neglect group), with limited differences in occurrence between the low band (77.8%) and the medium/high band (83%). The next most common form of omission was a failure to assist with transport. This was reported by 69% of the neglect group, including 66% in the low band and 74% in the medium/high band. A failure to assist with 'any other day-to-day activity' was reported by 58% of the neglect group, spanning 59% in the low band and 56% in the medium/high band.
Otherwise, findings in relation to other experiences of neglect are:
- Omissions in relation to meal preparation were reported by 52% of the neglect group, reflecting 50.6% of the low band and 54.8% in the medium/high band.
- Personal care omissions amounted to 25.6%, with 25.8% in the low band and 25% in the medium/high range.
- Assistance with taking the right medicine at the right times was not provided in 25% of cases, with 27.6% falling into the low band and 20.9% in the medium/high band.
- Help getting in and out of bed was not provided in 18% of cases, with 17% in the low band and 19% in the medium/high band.
- Assistance with eating, including cutting up food, was reported by 16.9% of the neglect group, with 18.8% in the low range and 13.8% in the medium/high range.
- Support with toileting was not provided for 16% of the neglect group, with 14.9% in the low band and 18% in the medium to high band.
Figure 5.5: Survey of Older People: Participants who were classified as experiencing neglect - proportion reporting each neglect item, by neglect score (band)
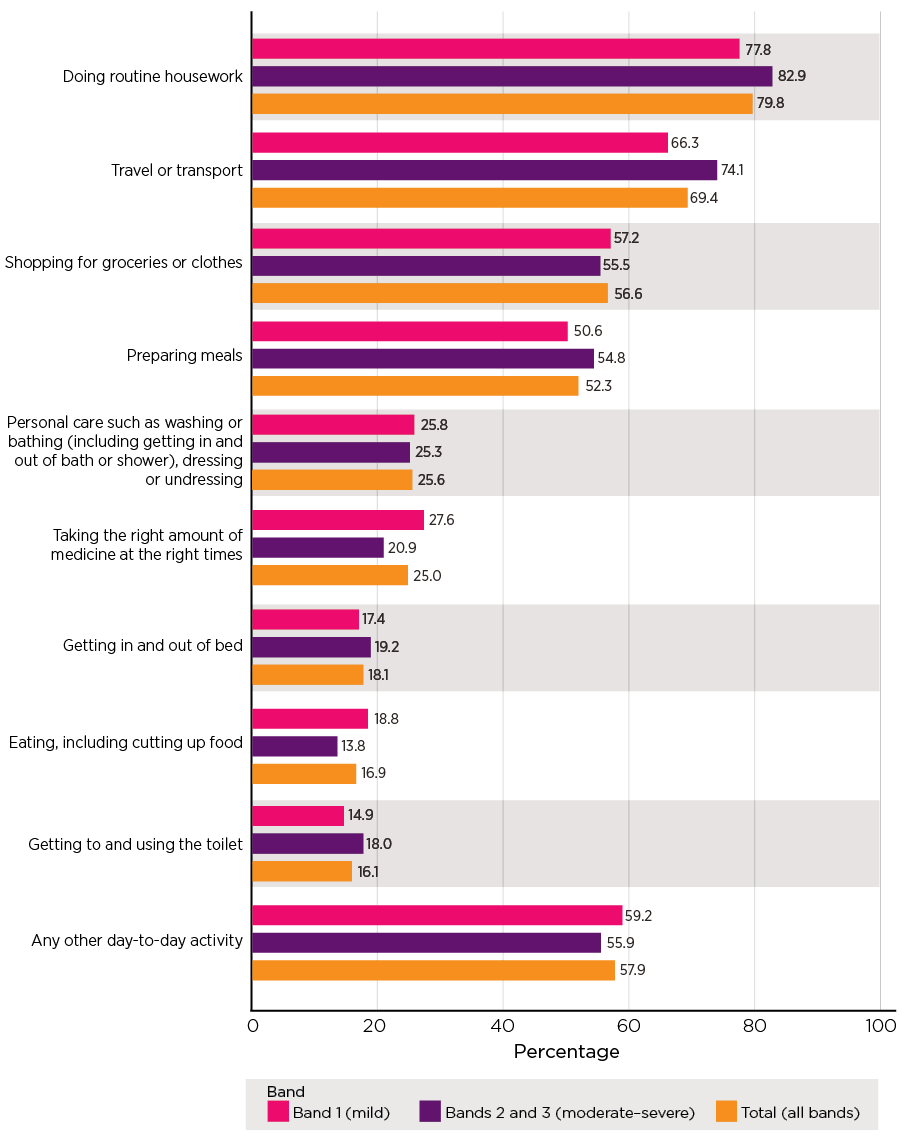
Note: Weighted data for the statistics and unweighted sample sizes (in order of legend, n = 138, 70, 208).
Co-occurrence of different subtypes
The majority of participants who reported experiencing abuse reported only experiencing one of the five subtypes in the previous 12 months, while about one-quarter experienced multiple subtypes (19% with two types, and 5% three or more types) (Table 5.5). It is worth noting that the 'co-occurrence' considers the extent to which older participants experienced multiple forms of elder abuse in the previous months that were not necessarily taking place at the same time or by the same perpetrators.
| No. of types of abuse | As % of the participants who experienced any form | Prevalence (as percentage of the full sample) % | 95% Confidence interval |
|---|---|---|---|
| One | 76.0 | 11.3 | 10.3-12.2 |
| Two | 18.5 | 2.7 | 2.3-3.2 |
| Three | 4.8 | 0.7 | 0.5-1.0 |
| Four or more | 0.8 | 0.1 | 0.0-0.2 |
| Total | 100.0 | 14.8 | |
| Number of participants (base) | 1,081 | 7,000 |
Note: Weighted data for the statistics and unweighted sample sizes.
Of participants who experienced one form of abuse, psychological abuse was the most common single form of abuse (74%, or 56% of those who experienced any form of abuse), followed by neglect (14%, or 11% of those who experienced any form of abuse). For the participants who experienced two or more subtypes of abuse, the most commonly co-occurring types were psychological abuse with:
- neglect (23% of those who experienced multiple subtypes)
- physical abuse (20.9% of those who experienced multiple subtypes)
- financial abuse (20.5% of those who experienced multiple subtypes).
| Abuse types | As % of participants who experienced 2+ types | As % of participants who experienced any form of abuse |
|---|---|---|
| Psychological and Neglect | 23.3 | 5.6 |
| Psychological and Physical | 20.9 | 5.0 |
| Psychological and Financial | 20.5 | 4.9 |
| Psychological and Sexual | 7.6 | 1.8 |
| Psychological, Physical and Financial | 6.1 | 1.5 |
| Psychological, Physical and Sexual | 4.6 | 1.1 |
| Psychological, Physical and Neglect | 3.6 | 0.9 |
| Psychological, Financial and Neglect | 2.6 | 0.6 |
| Psychological, Sexual and Neglect | 1.9 | 0.5 |
| Financial and Neglect | 1.5 | 0.4 |
| Psychological, Physical, Sexual, Financial and Neglect | 1.5 | 0.4 |
| Psychological, Physical, Sexual and Financial | 1.4 | 0.3 |
| Sexual and Neglect | 1.0 | 0.2 |
| Psychological, Sexual and Financial | 0.9 | 0.2 |
| Physical and Neglect | 0.7 | 0.2 |
| Sexual and Financial | 0.5 | 0.1 |
| Physical and Sexual | 0.4 | 0.1 |
| Physical and Financial | 0.4 | 0.1 |
| Physical, Sexual and Neglect | 0.3 | 0.1 |
| Psychological, Physical, Financial and Neglect | 0.3 | 0.1 |
| Psychological, Physical, Sexual and Neglect | 0.2 | 0.0 |
| One form of abuse | ||
| Psychological | .. | 55.9 |
| Financial | .. | 5.5 |
| Neglect | .. | 10.5 |
| Physical | .. | 2.3 |
| Sexual | .. | 1.8 |
| Total | 100.0 | 100.0 |
| Number of participants (base) | 271 | 1,081 |
Note: Weighted data for the statistics and unweighted sample sizes.
Culturally and linguistically diverse participants
This section sets out findings on the prevalence of elder abuse among participants who identified as being from CALD backgrounds. These findings relate to the group of 608 participants who identified themselves as speaking a language other than English at home. Findings on the five core abuse subtypes are presented first, followed by an explanation of abuse relating to language and culture and the prevalence of this subtype.
Overall, the findings presented in this section indicate that elder abuse prevalence among CALD subgroups is largely consistent with findings for the general population of those aged 65 and over. In total, 15.3% of the CALD participants reported experiencing elder abuse, including abuse relating to language and culture. Among CALD participants, 14% reported experiencing the five core subtypes and 4% reported abuse relating to language and culture.
In relation to psychological abuse, most of the CALD subsample who reported psychological abuse reported experiences in the low score range (6.9% of the CALD sample), with only 1.4% of the sample reporting experiences in the medium score range. The high score range was reported by 3.5% (data not shown). This concentration of participants in either the low score range or the high score range is consistent with the pattern in the non-CALD sample.
| Type of elder abuse | CALD sample (%) | Non-CALD sample (%) |
|---|---|---|
| Financial | 1.6 | 2.2 |
| Physical | 1.6 | 1.8 |
| Sexual | 1.0 | 1.0 |
| Psychological | 11.9 | 11.6 |
| Neglect | 2.6 | 2.9 |
| At least one form of abuse reported (excluding abuse relating to culture and background) | 14.0 | 15.0 |
| Abuse relating to language and cultural background | 4.0 | .. |
| At least one form of abuse (including abuse relating to language and cultural background) | 15.3 | .. |
| Number of participants (base) | 608 | 6,392 |
Notes: Weighted data for the statistics and unweighted sample sizes. None of the difference in the prevalence between the two groups is statistically significant.
Box 5.3: Abuse relating to language or culture
The approach for assessing psychological abuse informed the approach for CALD specific abuse. This entails a score based on the number of items reported and the frequency with which they are reported. With experiences scored at 3 or above being included in the prevalence estimate, the estimate is spread across three bands:
Band 1: a score range of 3-6 and lower severity
Band 2: a score range of 7-9 and mid-range severity
Band 3: the highest severity with scores 10 and over.
The development of the elder abuse questions relating to people from CALD backgrounds in the SOP was guided by a desktop literature review as well as advice and feedback from the National Ageing Research Institute (NARI).
Participants who spoke a language other than English at home were asked whether they had experienced any of the following specific behaviours by someone they know in the last 12 months:
- Not respected you when talking to you because of your culture, race or ethnicity.
- Mistranslated between English and your preferred language on purpose, when talking about financial or legal documents.
- Denied you access to important information in your preferred language.
- Made you feel that you are just free labour (e.g. doing most of the household work or providing child care, etc.).
- Limited or restricted your contact with your friends or others from the same cultural background, including friends and relatives overseas.
- Limited or restricted your access to culturally familiar activities (e.g. attending certain events, watching or listening to shows in your preferred languages).
For each item, if the participant reported that it had happened to them (in the previous 12 months), they were then asked how many times it had happened to them.
The response options were: Once; Few times; Many times; Every day or almost every day.
Following all the items, participants were asked about the person(s) who carried out those behaviour(s). If more than one person was selected, participants were asked to select the one that affected them the most.
Prevalence of abuse relating to language and culture
As noted, 4% of the CALD subsample reported abuse relating to language and culture in the previous 12 months, and the majority (57.6%) of these fell into the low score range (Table 5.8). Similar proportions were in the medium and high score bands (19-23%). This analysis is based on small numbers and the results should be treated with caution.
| As % of the participants who experienced abuse relating to their background | Prevalence (%) | 95% Confidence interval | |
|---|---|---|---|
| CALD: Abuse relating to their background | 4.0 | 2.5-6.2 | |
| Band 1 (low) | 57.6 | 2.3 | 1.3-4.0 |
| Band 2 (medium) | 23.1 | 0.9 | 0.3-2.6 |
| Band 3 (high) | 19.3 | 0.8 | 0.3-2.2 |
| Number of participants (base) | 27 | 608 |
Note: Weighted data for the statistics and unweighted sample sizes.
The most common form of abuse relating to language and culture was 'not respecting you when talking to you because of your culture, race or ethnicity' (67%) (data not shown, results based on small sample sizes and should be treated with caution). The next most common subtype was being 'made to feel like you are just free labour', reported by 45% of the language and culture abuse group.7
In relation to the other subtypes, the findings are (data not shown):
- 21% reported limitations or restrictions on access to culturally familiar activities
- 21% reported limitations or restrictions on contact with friends and relatives (including those overseas) from the same culture
- 7% reported denial of access to important information in a preferred language
- 2% reported mistranslation between English and a preferred language in connection with financial or legal documents.
Co-occurrence of different abuse types in the CALD subsample
As with the findings for the total sample, most of the CALD subsample who reported experiencing abuse reported experiencing only one abuse type (when including abuse relating to language or culture). Specifically, 70% of the CALD participants who were identified as having experienced one or more subtypes of abuse (including abuse relating to language or culture) experienced one type, and similar proportions experienced two subtypes or at least three subtypes (14-17%) (data not shown).
Consistent with the co-occurrence of different types for the non-CALD sample, among the CALD participants who reported experiencing more than one type of abuse, the most commonly co-occurring subtypes involved psychological abuse, with close to one-half of co-occurrences entailing the following:
- psychological abuse and abuse relating to language and culture
- psychological abuse, abuse relating to language and culture, and neglect
- psychological and physical abuse
- psychological, physical, and sexual abuse and abuse relating to language and culture (data not shown in any table).
Concerns about elder abuse in the Survey of the General Community
The Survey of the General Community (SGC) assessed how many people in the community have concerns about elder abuse in relation to a person known to them. They were asked whether they had concerns about someone aged over 65 being mistreated by someone in their family, a carer or another trusted person in the past 12 months. It is worth noting that the question was not limited to community dwelling people over 65 and answers may include concerns about older people with cognitive impairment and/or in residential aged care.
The questions covered the five subtypes of abuse but psychological abuse was referred to as emotional abuse (e.g. intimidating, threatening them, preventing access to family and others). The questions were framed differently to the SOP as the SOP involved questions about the experience of specific behaviours constituting abuse, whereas the SGC asked about the experience of each subtype of abuse. The responses to relevant questions in the SGC and SOP were from different perspectives (i.e. a concerned community member for the former and the direct victim for the latter) and are not intended to be used for direct comparisons.
The data presented in Figure 5.6 demonstrates that 17.4% of the SGC sample indicated they held concerns about elder abuse. This finding should be seen in the context of the discussion in chapter 11, which establishes that people who provide care and support to older people are more likely to become aware of elder abuse.
The most common concerns related to emotional abuse (10.5%) and financial abuse (10.1%), followed by neglect (7.4%). Physical abuse was a concern for 3.6% and a very small proportion (0.3%) had concerns about sexual abuse.
Of the people who had concerns, around half of those who had any concerns identified one type of abuse (or 8.4% of the whole sample, Figure 5.7) and half had concerns about two or more types of abuse (8.9% of the whole sample). Concerns about one type of abuse were almost as common (8.4%) as co-occurring types of abuse (8.9%).
Figure 5.6: Survey of the General Community: Concerns about older family members and friends
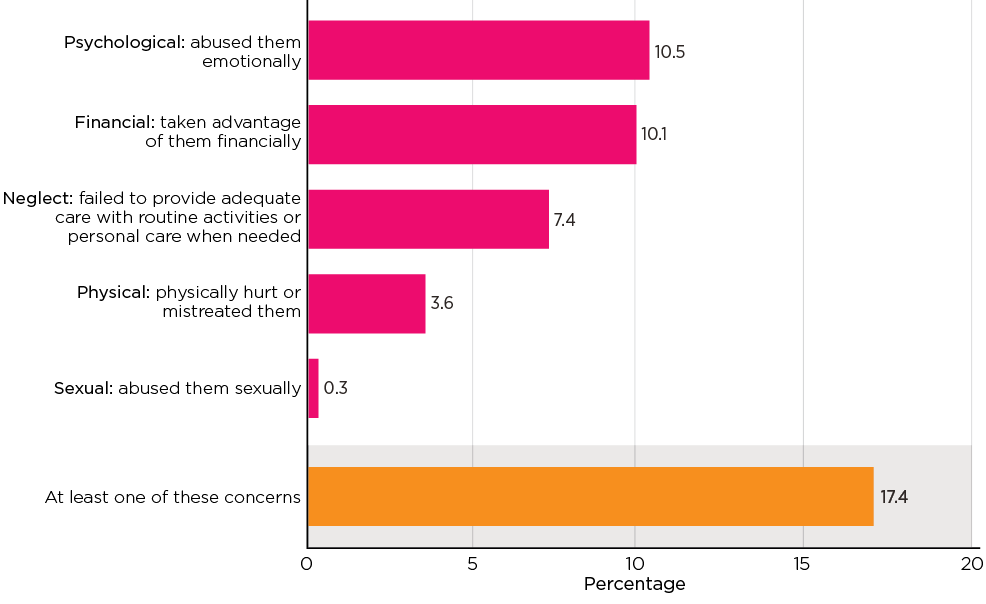
Notes: Weighted data. Unweighted sample size, n = 3,400.
Figure 5.7: Survey of the General Community: Number of concerns reported about older family members and friends
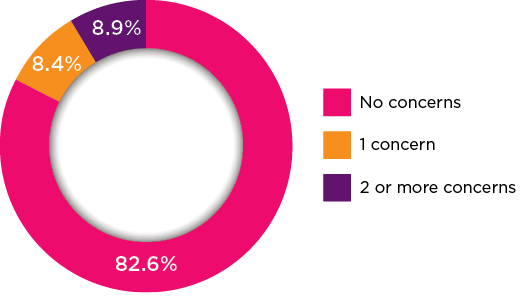
Notes: Weighted data. Unweighted sample size, n = 3,400. 'No concerns' includes a small number of participants who did not state (i.e. don't know or refusal).
Of participants who reported multiple concerns, the most commonly co-occurring concerns involved financial and psychological abuse:
- psychological and financial (26% of those with multiple concerns)
- psychological, financial and neglect (18%)
- psychological, physical, financial and neglect (12%).
These patterns of co-occurrence (Table 5.9) differ somewhat from the co-occurrence patterns reported by older people themselves, supporting the point that these reports are likely to reflect higher experiences of abuse that become discernible to people other than the victim and perpetrator. Here, co-occurrence of concerns refers to reports of having multiple concerns that may not take place at the same time or to the same older persons.
| Concerns about: | As % of participants who had 2+ concerns | As % of participants who had any concern(s) |
|---|---|---|
| Psychological and Financial | 25.8 | 13.3 |
| Psychological, Financial and Neglect | 17.6 | 9.1 |
| Psychological, Physical, Financial and Neglect | 11.9 | 6.1 |
| Psychological and Neglect | 10.5 | 5.4 |
| Financial and Neglect | 9.0 | 4.6 |
| Psychological, Physical and Neglect | 8.4 | 4.3 |
| Psychological, Sexual and Financial | 5.3 | 2.7 |
| Psychological and Physical | 3.6 | 1.9 |
| Physical and Neglect | 1.9 | 1.0 |
| Physical and Financial | 1.7 | 0.9 |
| Financial, Neglect and Physical | 1.2 | 0.6 |
| Financial, Neglect, Psychological and Sexual | 0.9 | 0.4 |
| Financial, Physical and Sexual | 0.6 | 0.3 |
| Psychological, Physical, Sexual and Financial | 0.5 | 0.2 |
| Psychological, Physical, Sexual and Neglect | 0.4 | 0.2 |
| Psychological, Physical, Sexual, Financial and Neglect | 0.3 | 0.1 |
| Financial, Neglect, Psychological and Sexual | 0.2 | 0.1 |
| Sexual and Neglect | 0.1 | 0.1 |
| One form of abuse | ||
| Psychological | .. | 16.6 |
| Financial | .. | 19.3 |
| Neglect | .. | 10.5 |
| Physical | .. | 2.1 |
| Total | 100.0 | 100.0 |
| Number of participants (base) | 323 | 618 |
Notes: Weighted data and unweighted sample size.
Summary
This chapter has presented findings from the SOP on the prevalence of elder abuse covering the time frame of the preceding 12 months. Overall, the prevalence rate of elder abuse reported in this chapter is 14.8%. The most common form of abuse is psychological abuse (11.7%), across three bands (low: 5.7%, medium: 1.7% and high: 4.3%). Neglect is the next most common abuse subtype at 2.9% (1.7% low, 0.7% medium and 0.5% high).
For the other subtypes, prevalence rates are 2.1% for financial abuse, 1.8% for physical abuse and 1% for sexual abuse.
At 15.3%, prevalence rates for the CALD subsample do not differ greatly from the overall sample. Abuse relating to language and culture is reported by 4% of the CALD subsample.
Experiences of multiple types of abuse were reported by a minority of the sample (3.5%) (data not shown), with the most common abuse combinations being psychological abuse and neglect.
Overall prevalence rates were higher for women than men; the distribution of different subtypes of abuse showed some variation according to gender. Women were more likely than men to experience psychological abuse, sexual abuse and neglect. These findings, and patterns of significance, are examined in more detail in chapter 6.
In the SGC, 17.4% of the sample indicated they had concerns that a person aged over 65 who they know is experiencing elder abuse. The subtypes most commonly referred to were emotional abuse and financial abuse. Aspects of these findings suggest that some subtypes of elder abuse - such as financial abuse - may be more obvious than others - such as sexual abuse. Further, given the rate of SGC participants reporting concerns about multiple types of abuse (more than half of those who had concerns), it is likely that higher level cases of abuse come to the attention of people other than those directly involved.
3 This refers to the older person's perceived seriousness for them of experiencing the treatment.
4 The ADLs refer to basic physical and self-care needs whereas IADLs include more complex activities that relate to a person's ability to live independently in the community (Lawton & Brody, 1969). Items 5-7 and 9 are classed as ADLs with items 1-4 and 8 classed as IADLs.
5 Participant could nominate two people.
6 The difference was statistically significant (p < .05).
7 Sample sizes were too small to sustain analysis of specific behaviours using the score band relating to language and culture.
Who experiences elder abuse?
Key messages
Introduction
This chapter sets out findings on the socio-demographic and economic characteristics of people who reported experiencing abuse. It also examines whether health status and social connection are different for those who experience abuse. The discussion in this chapter relates to the following aspects of the research aims:
- identify the characteristics and contexts of elder abuse, including in relation to specific subtypes of abuse8
- identify risk and protective factors associated with the experience of abuse.
The analysis examines the extent to which the experience of elder abuse (any form as well as each subtype) varied according to the following socio-demographic characteristics: gender, age, Indigenous status, country of birth, religion, whether the participant lives with their children (of any age), household composition, education, employment, household income, socio-economic index for areas (SEIFA), whether the participant lives in a major city, inner regional area or in outer regions, remote, very remote areas, and whether they have children (biological, adopted or step). Both bivariate analysis and multivariate analysis were carried out. Logistic regression was applied to each abuse subtype and overall (experience of any form of elder abuse). This chapter also examines the extent to which older people's health status and social connection was linked with elder abuse.
The chapter commences with an overview of the reports of elder abuse of any type and overall by gender and age. This is followed by findings for other demographic correlates with each abuse type. In order to simplify the reporting, the following discussion of the results focuses on those socio-demographic characteristics that emerged as significant in the regression analysis (except for age and gender). Findings in relation to the CALD subsample, overall and by gender, are set out after the findings for the sample overall. Finally, the chapter presents the findings in relation to people's health and their social connection and their experience of elder abuse.
Experience of elder abuse by gender and age
Figure 6.1 presents the proportions of men and women who reported experiencing each subtype of elder abuse as well as any form of abuse (i.e. overall experience of elder abuse). A higher percentage of women than men reported experiencing any form of abuse (15.9% cf. 13.6%) and this difference was statistically significant.
There were two abuse subtypes where women were more likely to experience abuse to a small but statistically significant extent: psychological abuse (10.7% cf. 12.6%); and neglect (3.5% cf. 2.2%). Reports of financial abuse were similar between men and women. Women were more likely to report sexual abuse (1.2% cf. 0.7%) and men were more likely to report physical abuse but these differences were not significant (2% cf. 1.6%).
Figure 6.1: Prevalence of elder abuse by gender
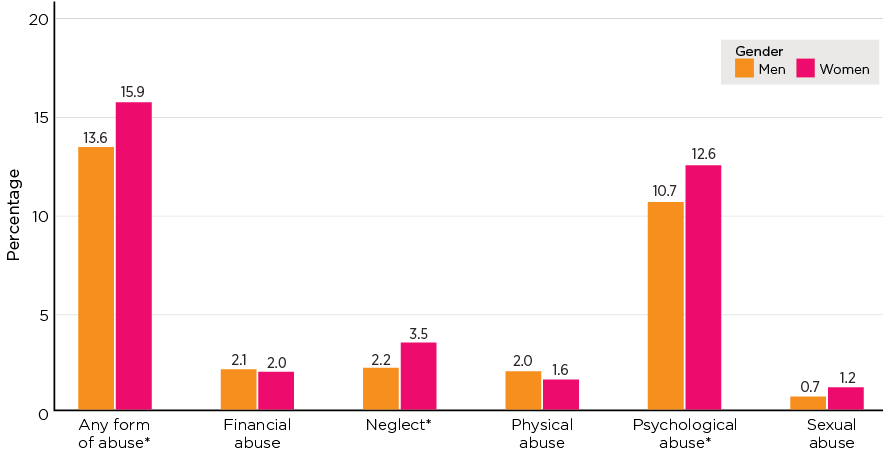
Notes: Weighted data for the statistics and unweighted sample sizes: men n = 2,716, women n = 4,146. The asterisks indicate that the difference between men and women is statistically significant at a 5% significance level.
Age
Figure 6.2 presents analysis of the experience of elder abuse by age group. The overall prevalence of elder abuse (at least one form of abuse) varied according to age, with the rate of elder abuse declining with increasing age - from 20.3% for the youngest group (65-69 years) to 9.4% for the older age group (85+ years). This age-related pattern was also evident for psychological abuse: the proportion of older people reporting this form of abuse fell from 16.8% for the age group of 65-69 years to 4.7% for the age group of 85 years and over. Age-related patterns for physical and sexual abuse were less pronounced but still significant. The prevalence of these two subtypes was higher among the age group of 65-69 years than the older age groups. However, financial abuse was not significantly related to age.
The patterns described may arise from the under-representation of people with cognitive decline and other conditions, such as frailty, in the sample (see further below), and this issue is likely more marked for older age groups given general decline in health with increasing age. See further below for more discussions on this issue.
Age-related patterns were different for neglect. Rather than decreasing with age, the prevalence of neglect is u-shaped, falling from 4.1% in the age range 65-69 years to 1.8% in the age range of 75-79 years and then increasing to 2.9 for those in the top age range. These age-related patterns generally applied to women, with men showing similar patterns in raw terms that were not statistically significant (Figure 6.3). These findings are particularly likely to reflect the limitations of the sample and should be regarded with caution.
Figure 6.2: Prevalence of elder abuse by age
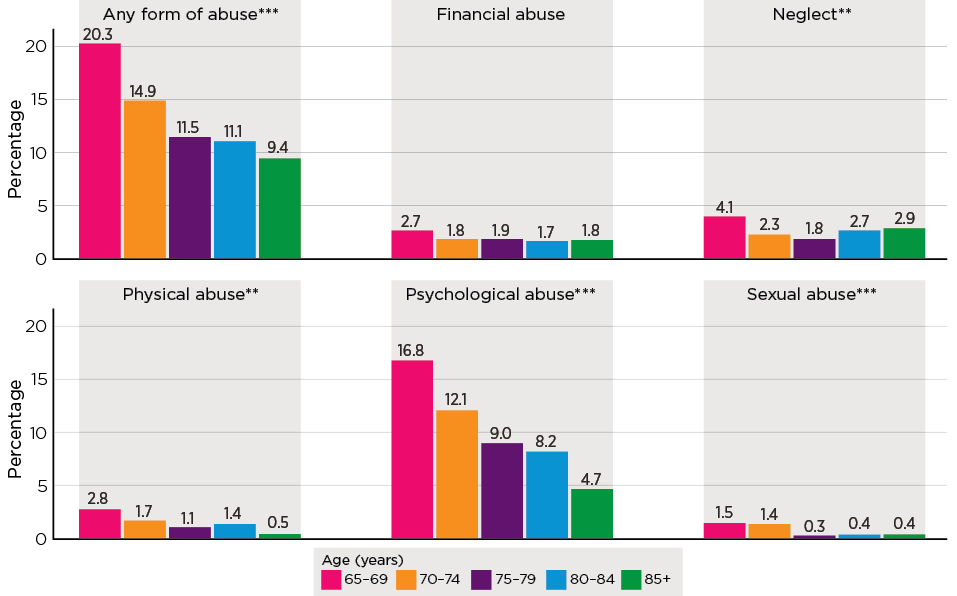
Notes: Weighted data for the statistics and unweighted sample sizes: in order of age n = 1,697, 1,927, 1,525, 1,105, 946. The asterisks indicate that the differences across the age groups are statistically significant based on design-based F test (**p < .01; ***p < .001).
Figure 6.3: Prevalence of elder abuse by age and gender
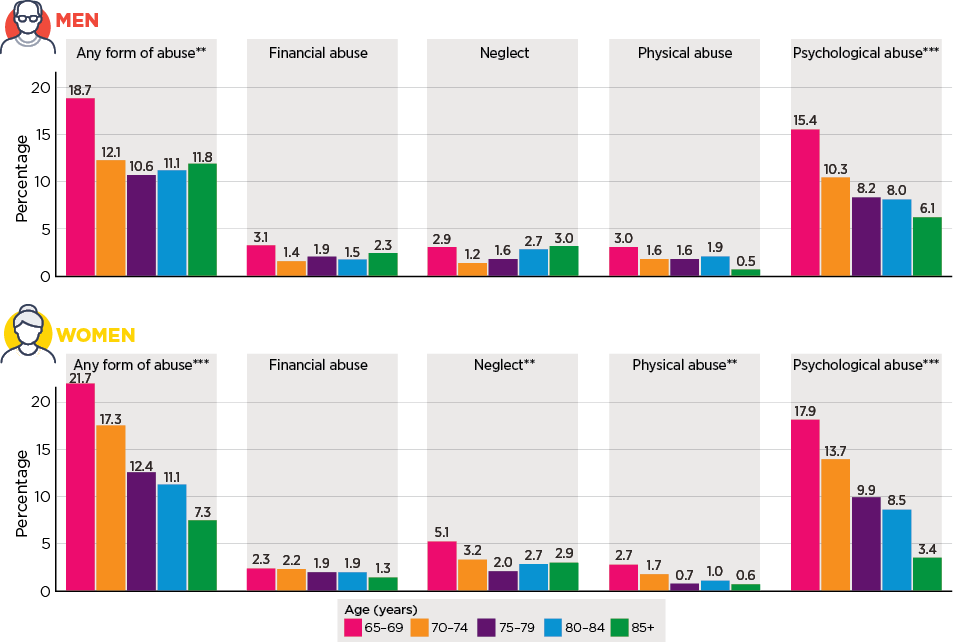
Notes: Weighted data for the statistics and unweighted sample sizes: men, in order of age n = 725, 763, 589, 404, 266; women, in order of age n = 959, 1,161, 934, 699, 478. The asterisks indicate that the differences across the age groups are statistically significant based on design-based F test (**p < .01; ***p < .001).
Characteristics most likely to be associated with abuse
The following discussion focuses on the findings of regression analysis that assesses links between socio-demographic characteristics and elder abuse. Logistic regression modelling was applied to each form of abuse as well as an overall experience of abuse.9 The model results are provided in Appendix A, Table A6.1. Table 6.1 provides a summary of the regression results.10 Table 6.2 provides bivariate analysis of the overall prevalence of elder abuse (at least one form) by socio-demographics (see Appendix A, Tables A6.2-A6.6 for bivariate analyses by socio-demographics for each of the subtypes).
These findings provide an assessment of the important socio-demographic characteristics linked with elder abuse. The main points are:
- Compared to men, women were at a higher risk of experiencing any form of abuse, sexual abuse,11 psychological abuse and neglect. The patterns were consistent with the discussion above on the bivariate analysis results.
- The likelihood of experiencing physical, sexual and psychological abuse falls with increasing age. This pattern also applied to the overall experience of elder abuse (any form).
- A higher level of education was associated with a higher likelihood of experiencing sexual and psychological abuse but not the three other subtypes. This association suggests that older people with a higher level of education were more likely to identify behaviours relating to these two subtypes. This is consistent with findings on attitudes towards elder abuse in chapter 12 that demonstrate that a higher level of education was associated with less condoning attitudes towards elder abuse and a greater tendency to identify elder abuse behaviours. In combination, these findings suggest that the correlation between higher education levels and the greater prevalence of sexual and psychological abuse are related to greater recognition of certain behaviours as abuse among this group.
- Being divorced is associated with a higher likelihood of experiencing abuse overall (any form) and all subtypes. Those who are widowed and never married are also at an elevated risk of experiencing some subtypes (sexual and physical for never married people). The bivariate analysis shows that participants who were divorced or separated were twice as likely as married participants to report experiencing at least one form of abuse (26.4% cf. 13.1%).
- Having a step-child is associated with a higher likelihood of experiencing abuse overall and physical and psychological abuse in particular. This finding does not necessarily imply that step-children perpetrate abuse but it is consistent with complex family dynamics and histories of conflictual relationships being a risk factor for elder abuse (chapter 2).
- Socio-economic status is associated with abuse overall, and some subtypes of elder abuse. Specifically:
- Low socio-economic status (as indicated by the SEIFA relative disadvantage index) is associated with a higher likelihood of experiencing abuse overall and the subtypes of financial abuse, sexual abuse and psychological abuse.
- Similarly, owning a home with debt and renting accommodation (including public housing) are associated with a higher likelihood of experiencing abuse overall and the subtypes of physical abuse, psychological abuse, and neglect.
The table can also be viewed on page 58 of the PDF.
| Characteristic | Any form | Financial | Physical | Sexual | Psychological | Neglect |
|---|---|---|---|---|---|---|
| Gender | Female | - | - | Female | Female | Female |
| Age | Younger old | Younger old | Younger old | Younger old | - | |
| Marital status | Divorced, never married | Divorced, widowed | Divorced | Divorced, widowed, never married | Divorced | Divorced |
| Education | High level of education | - | - | High level of education | High level of education | |
| Biological children | - | - | - | - | - | - |
| Step-children | Step-children | - | Step-children | - | Step-children | - |
| Housing | Owning with a mortgage, rental (incl. public housing) | - | Owning with a mortgage | - | Owning with a mortgage, rental (incl. public housing) | Owning with a mortgage, rental (incl. public housing) |
| SEIFA | Disadvantaged areas | Highest likelihood: disadvantaged areas | - | Disadvantaged areas | Disadvantaged areas | - |
| Region | - | - | - | - | - | Major cities (cf. Outer region) |
Note: a The regression coefficient is statistically significant at 5%.
Age-related patterns: further discussion
The age-related patterns in relation to elder abuse overall and some subtypes may appear surprising, considering a higher rate of disability is associated with increasing age among older people and hence greater vulnerability. The patterns may reflect a variety of factors, although further research would be required to examine these issues in more depth. First, the survey focused on the older population in the community who had the capacity to undertake an interview and excluded older persons who were incapable of undertaking an interview due to physical or health conditions, including incapacity to consent, which may be associated with cognitive decline. Inability to participate in the study for such reasons rises with increasing age. The lower prevalence of elder abuse for the older age groups in the SOP is likely to reflect the lack of representation of those who could not participate in the study due to their physical and health incapacity.
Second, the findings may reflect age-related differences in attitudes, awareness and recognition. The findings on attitudes towards elder abuse outlined in chapter 12 indicated that older people in the top age ranges were more likely to condone elder abuse and less likely to recognise elder abuse behaviours compared to older people in the lower age ranges. Some international research is consistent with this. Using data from the New York Mistreatment Prevalence Study conducted in 2009, Burnes and colleagues (2019a) found that the older emotional abuse victims were, the more likely they were to downplay the experience as serious for them. This suggests that any under-reporting of elder abuse may be disproportionally higher for the oldest age group.
Finally, with increasing age, general health status declines (AIHW, 2018), and the need for support increases. This dependency on family members and others may have discouraged the disclosure of their experience of elder abuse in the survey.
The table can also be viewed on pages 59–60 of the PDF.
| Characteristic | % having experienced any form | Number of participants (base) | ||||
|---|---|---|---|---|---|---|
| Males | Females | All | Males | Females | All | |
| Indigenous status | ||||||
| Non-Indigenous | 13.5 | 15.8 | 14.7 | 2,705 | 4,179 | 6,892 |
| Indigenous | 23.3 | 29 | 53 | 85 | ||
| Country of birth | ||||||
| Australia | 13.4 | 16.0 | 14.8 | 1,909 | 3,076 | 4,991 |
| English speaking countries | 15.9 | 14.3 | 15.1 | 480 | 689 | 1,171 |
| Non-English speaking countries | 12.4 | 16.8 | 14.7 | 358 | 470 | 832 |
| Education | ** | * | ||||
| Degree or higher | 15.4 | 21.5 | 18.2 | 816 | 907 | 1,725 |
| Certificate/Diploma/Trade/Other | 14.3 | 17.9 | 16 | 856 | 998 | 1,857 |
| Year 12 | 13.6 | 13.7 | 13.7 | 289 | 474 | 764 |
| Below Year 12 | 12.6 | 13.9 | 13.4 | 716 | 1,721 | 2,441 |
| Living arrangements | ||||||
| Living with a partner | 12.3 | 15.1 | 13.6 | 1,918 | 1,858 | 3,781 |
| Living alone | 16 | 16.7 | 16.4 | 691 | 1,965 | 2,660 |
| Other | 24.2 | 18.4 | 20.2 | 138 | 418 | 559 |
| Marital status | *** | *** | *** | |||
| Married | 11.9 | 14.6 | 13.1 | 1,870 | 1,836 | 3,712 |
| Separated/divorced | 26.0 | 26.7 | 26.4 | 331 | 692 | 1,023 |
| Widowed | 12.7 | 13.1 | 13.0 | 330 | 1,456 | 1,790 |
| Never married | 13.5 | 16.0 | 14.8 | 199 | 230 | 430 |
| Whether living with any children (biological/step) | ||||||
| No | 13.4 | 15.5 | 14.5 | 2,447 | 3,786 | 6,243 |
| Yes | 14.7 | 19.3 | 17.2 | 300 | 434 | 736 |
| Any children (inside/outside HH) | ** | ** | ||||
| Biological or adopted children | 13.0 | 15.5 | 14.3 | 2,128 | 3,453 | 5,590 |
| Step-children | 14.1 | 19.5 | 16.2 | 61 | 62 | 123 |
| Both biological/adopted AND step-children | 20.5 | 25.2 | 22.9 | 177 | 211 | 388 |
| None | 14.0 | 13.9 | 13.9 | 374 | 504 | 881 |
| Before tax or deductions, household annual income quintile | * | |||||
| Lowest household income quintile (including neg./zero income) | 18.7 | 20.2 | 19.6 | 363 | 767 | 1,134 |
| 2 | 9.3 | 16.8 | 12.9 | 221 | 337 | 558 |
| 3 | 14.4 | 17.4 | 15.8 | 494 | 540 | 1,035 |
| 4 | 11.9 | 14.4 | 13.0 | 389 | 346 | 735 |
| Highest household income quintile | 13.2 | 19.2 | 15.1 | 475 | 248 | 724 |
| Housing | ** | *** | *** | |||
| Own outright | 12.2 | 14.3 | 13.3 | 2,160 | 3,269 | 5,436 |
| Own, paying off mortgage | 16.4 | 32.9 | 24.0 | 195 | 238 | 434 |
| Rent from private landlord | 23.6 | 17.9 | 20.6 | 160 | 248 | 409 |
| Rent from public housing authority | 12.1 | 27.4 | 20.5 | 73 | 150 | 225 |
| Other (boarding, etc.) | 21.6 | 14.5 | 17.4 | 134 | 278 | 412 |
| SEIFA Quintile (IRSD 2016) | * | ** | ||||
| 1 Lowest socio-economic status | 16.8 | 18.0 | 17.4 | 397 | 662 | 1,063 |
| 2 | 13.0 | 16.3 | 14.7 | 545 | 823 | 1,369 |
| 3 | 15.9 | 18.0 | 16.9 | 531 | 810 | 1,345 |
| 4 | 14.0 | 14.0 | 13.9 | 515 | 819 | 1,336 |
| 5 Highest socio-economic status | 9.9 | 14.2 | 12.2 | 759 | 1,124 | 1,884 |
| Region | ||||||
| Major city | 13.1 | 15.6 | 14.4 | 1,810 | 2,774 | 4,591 |
| Inner regional | 12.7 | 17.7 | 15.3 | 640 | 1,035 | 1,678 |
| Outer regional/Remote/Very remote | 18.3 | 14.0 | 16.1 | 297 | 432 | 731 |
Notes: Weighted data for the statistics and unweighted sample sizes. The asterisks indicate that the differences in the prevalence across categories in the variable are statistically significant based on design-based F test (*p < .05; **p < .01; ***p <.001)
Participants with an unmet need for help
The study identified a considerable group (6%, n = 412) of older people who had an unmet need for help with activities of daily living. This group required help for an activity (ranging from help with routine housework to toileting) some or all of the time but indicated that there was no one to help with that activity. As previously described in chapter 5, this group was not included in the prevalence estimate of neglect. This group was excluded as the unmet need for help did not relate to a person with whom the older person had a relationship of trust nor did it involve an imbalance of power. Consequently, they were outside the definition of neglect applied in this study (data not shown).
Although this research cannot shed light on the reasons why participants had no one to help, describing the extent of this unmet need and the characteristics of this group can provide important insights into the needs of older Australians. Further research would be required to understand why the needs of this group were unmet. From the survey data, it is not possible to draw conclusions as to the extent that systemic (e.g. gaps in service availability) or personal issues (such as a lack of knowledge or assistance in accessing support) are relevant.
How many people had an unmet need for help?
For the overall sample, just over one in 20 older persons reported needing help with at least one activity for some of the time and having no one to help with that activity (one activity: 4.5%, two or more activities: 1.5%) ('the unmet needs subgroup'). Significantly, this proportion exceeds the proportion included in the neglect estimate, which is 2.9%.
Type of activity
Participants in the unmet needs subgroup were most likely to report an unmet need for help with doing routine housework (1.3% of all participants), followed by taking the right amount of medicine at the right times (1.1% of all participants) and travel or transport (1% of all participants). More generally, 1.6% of participants indicated that there was no-one to help with 'any other day-to-day activity'.
Characteristics of participants needing help but having no-one to help
Male participants were more likely to indicate that they required help for an activity but had no one to help (6.4%; one activity: 4.9%, two or more activities: 1.5%) than female participants (5.6%; one activity: 4.1%, two or more activities: 1.5%).
Participants aged 80 years and over were more likely to report needing help with at least one activity and having no-one to help as compared with participants aged 65-79 years.
Of participants aged 85 years, 11.3% reported needing help with at least one activity and having no-one to help (one activity: 9.1%, two or more activities: 2.2%).
Health status, social connection and elder abuse
This section compares the health status of people who reported experiencing elder abuse with those who did not, on the basis of the whole sample. The discussion considers psychological health, physical health and disability in that order. It should be noted that these analyses describe health status in these areas for the groups who did and did not report experiencing elder abuse. These data describe correlations between elder abuse and poorer health outcomes and social connection, rather than establishing that elder abuse causes these outcomes. This is because cross-sectional data are unable to determine the direction of the influences they show - elder abuse may cause outcomes but, equally, poorer physical or psychological health, disability or social isolation may create a susceptibility to elder abuse.
As discussed in chapter 2, Storey's (2020) recent synthesis of evidence on the risk factors for experiencing elder abuse identifies problems with physical and mental health as predisposing factors.
Psychological health
Psychological health was assessed by applying the Kessler 6 Psychological Distress Scale. This scale includes six questions about anxiety and depressive symptoms experienced during the past four weeks. The scale has a score range of 0-30, with a higher score indicting a higher level of distress. This scale screens for general mental health in an adult population (Kessler et al., 2003). Based on the scores, participants were classified into two groups: no probable serious mental illness and probable serious mental illness (Kessler et al., 2010).
Even where elder abuse experiences were reported, most participants (91%) did not fall into the probable serious mental illness score range. However, it is notable that participants who did experience elder abuse were more than three times as likely to fall into this score range compared with those who did not (9% cf. 2%).
Consistent with this, the mean scores depicted in Table 6.3, show elevated levels of psychological distress for participants who experienced elder abuse, across all abuse types.
Mean scores for those who had experienced elder abuse were 11.8 compared with 8.9 for those who did not experience abuse.
Across all of the five subtypes of elder abuse, mean scores for those who had experienced a specific subtype of abuse were higher compared to those who did not experience the specific subtype (mean scores: 12.7-13.6 cf. 9.0-9.3), and the proportions of scores falling into probable serious mental illness were higher (14-17% cf. 2-3%). In other words, older people who experienced elder abuse were significantly more likely to also experience poor mental health.
| Abuse type | Kessler 6 scale | Number of participants (base) | |
|---|---|---|---|
| Mean score | Scores in the range of probable serious mental illness (19-30) (%) | ||
| Financial | |||
| No financial abuse | 9.3 | 3.0 | 6,830 |
| Financial abuse | 12.7*** | 16.5 | 157 |
| Physical | |||
| No physical abuse | 9.3 | 3 | 6,861 |
| Physical abuse | 12.8*** | 14.5 | 126 |
| Sexual | |||
| No sexual abuse | 9.3 | 3.1 | 6,900 |
| Sexual abuse | 12.7*** | 14.5 | 87 |
| Psychological | |||
| None | 9.0 | 2.4 | 6,146 |
| Psychological abuse | 11.9*** | 9.6 | 294 |
| Neglect | |||
| None | 9.2 | 2.9 | 6,779 |
| Neglect | 13.6*** | 15.2 | 35 |
| Any form of elder abuse reported | |||
| No | 8.9 | 2.3 | 5,909 |
| Yes | 11.8*** | 8.8 | 1,078 |
Notes: Weighted statistics and unweighted sample bases. The asterisks indicate that the difference in the mean scores between the two groups (whether experienced any specific type of abuse) was statistically significant based on bivariate regression analysis (***p < .001).
Physical health and disability
Table 6.4 shows the prevalence of elder abuse for each subtype and overall (any form of elder abuse) by participants' self-rated general health status (excellent/very good, good, and fair/poor). Table 6.5 presents the prevalence of elder abuse by whether participants had disability or long-term medical conditions.
There was an apparent association between older people's health and reports of experiencing elder abuse, with poorer health being associated with a higher likelihood of experiencing elder abuse. This applied to all the subtypes and overall abuse. For example, older people who rated their health as fair or poor were nearly twice as likely as those who considered their health as excellent or very good to report experiencing any form of elder abuse (20.8% cf. 11.3%). Likewise, older people with disability or long-term medical conditions were twice as likely as others without such health problems to report experiencing any form of elder abuse (20.6% cf. 9.8%).
Neglect was the abuse subtype most associated with poorer health conditions, reflecting the conditions that create the need for help involved when neglect occurs. The association between health and experiences of elder abuse was more marked for neglect than other subtypes. Specifically, the prevalence of neglect was three and half times as high for older people with a disability or long-term health conditions as for those without such health problems (4.7% cf. 1.3%). Neglect prevalence was 6.2% for older people who rated their health as fair/poor, compared to 2.6% for those who rated their health as good and 0.9% for those whose ratings were excellent/very good. (These patterns are consistent for men and women and results are shown in Appendix A.)
| General health | ||||
|---|---|---|---|---|
| Excellent/very good (%) | Good (%) | Fair/poor (%) | ||
| Financial abuse | 1.6 | 1.7 | 3.2 | ** |
| Physical abuse | 1.6 | 1.6 | 2.2 | |
| Sexual abuse | 0.8 | 0.7 | 1.5 | * |
| Psychological abuse | 9.2 | 11.8 | 15.4 | *** |
| Neglect | 0.9 | 2.6 | 6.2 | *** |
| Any form | 11.3 | 14.3 | 20.8 | *** |
| Number of participants (base) | 3,066 | 2,104 | 1,806 | |
Notes: Weighted statistics and unweighted sample bases. The asterisks indicate that the differences in the prevalence of the specific subtype across the three health groups were statistically significant (*p < .05; **p < .01; ***p < .001).
| Any disability or long-term condition | |||
|---|---|---|---|
| No (%) | Yes (%) | ||
| Financial abuse | 1.5 | 2.8 | ** |
| Physical abuse | 1.1 | 2.6 | *** |
| Sexual abuse | 0.7 | 1.4 | * |
| Psychological abuse | 7.6 | 16.4 | *** |
| Neglect | 1.3 | 4.7 | *** |
| Any form | 9.8 | 20.6 | *** |
| Number of participants (base) | 3,470 | 3,450 | |
Notes: Weighted statistics. The asterisks indicate that the difference in the prevalence of a specific subtype between the two groups of disability status was statistically significant (*p < .05; **p < .01; ***p < .001).
Social contact and support and elder abuse
This section discusses findings in relation to family support and connections with friends and community. As with health status, the cross-sectional nature of this study means that conclusions that elder abuse causes (rather than results from) weaker connections with family, friends and community cannot be drawn from these findings. However, given the significant proportions of people who deal with elder abuse by avoiding the perpetrator (chapter 8), and the smaller but not insignificant proportion who deal with it by withdrawing from social contact, some association between elder abuse and isolation may be inferred, even though the strength of it is uncertain.
Contact with family and friends
Participants were asked how often they spent time with family and friends outside of their household. Five responses were available: every day, several times a week, about once a week, two or three times a month, and once a month or less frequently.
Table 6.6 shows a consistent pattern across all subtypes of abuse. Lower levels of social contact with family and friends were associated with a higher prevalence of elder abuse. Overall, 13.7% of participants who had face-to-face contact with their family and friends a few times a week or more frequently reported any type of abuse, compared with 17.8% who saw their friends and family less often than once a week.
Across each of the abuse subtypes, the proportion who reported each abuse type was higher for those who reported less frequent contact with family and friends compared with those who had more frequent social contact. Although the results were not significant for some subtypes, the patterns were consistent.
| Seeing family members or friends living elsewhere | ||||
|---|---|---|---|---|
| At least a few times a week (%) | Once a week (%) | Less often (%) | ||
| Financial abuse | 1.9 | 2.2 | 2.5 | |
| Physical abuse | 1.4 | 1.9 | 2.6 | |
| Sexual abuse | 0.8 | 0.9 | 1.5 | |
| Psychological abuse | 10.8 | 11.4 | 14.1 | * |
| Neglect | 2.5 | 2.5 | 4.4 | * |
| Any form | 13.7 | 14.7 | 17.8 | * |
| Number of participants (base) | 4,132 | 1,450 | 1,328 | |
Notes: Weighted statistics and unweighted sample bases. The asterisks indicate that the differences in the prevalence of a specific subtype across the three groups were statistically significant based on design-based F test (*p < .05).
Social support
Social support was assessed with a series of statements concerning participants' feelings about the availability of people to provide support in a range of ways (four items), as well as feelings of loneliness. The items formed a scale with a score range of 0-100, with a higher score indicating a greater sense of support (see Box 6.2 for how this scale is scored). The responses were analysed by developing scores across three ranges, indicating low, medium and high levels of social support.
International research literature identifies level of social support as significant to the risk of experiencing elder abuse, with lower levels of social support associated with a higher likelihood of experiencing elder abuse (e.g. Wong et al., 2020). However, given that members of family and social networks are prominent among perpetrators of abuse, it is clear that there is a need to distinguish between positive social support and negative social support (Zheng, Li, Kong, & Dong, 2019).
Box 6.2: Social support scale
The social support scale is derived based on four items from HILDA:
- I often need help from other people but can't get it
- I don't have anyone that I can confide in
- I have no one to lean on in times of trouble
- I often feel lonely.
The response options include: strongly agree, agree, neither, disagree, strongly disagree.
Two steps are involved in generating scores for the social support scales. First, each item in a scale will be recoded so that the item score will be 0-100 (strongly agree = 0, agree = 25, neither = 50, disagree = 75 and strongly disagree = 100). Then the mean of recoded item scores forms the scale score. The scores range from 0-100, with higher scores indicating a greater sense of social support.
Table 6.7 demonstrates a correlation between all abuse subtypes and low social support.
Across all the five subtypes of elder abuse, the mean score of social support was lower for those who reported experiencing a specific subtype compared to those who did not have such an experience (mean scores: 56.5-63.9 cf. 77.1-78.4). The mean score was also lower for those who experienced any form of abuse compared to those who did not experience any form of abuse (66 cf. 78.9). In other words, people with a lower sense of social support were more likely to report experiencing elder abuse and this pattern was consistent across all abuse subtypes and overall abuse. Notably, the difference in mean scores between those who experienced abuse and those who did not have such an experience was larger for neglect and physical abuse (20-21) than financial, sexual and psychological abuse (13-17).
| Abuse type | Mean score | Number of participants (base) |
|---|---|---|
| Financial abuse | ||
| No financial abuse | 77.2 | 6,757 |
| Financial abuse | 63.9*** | 155 |
| Physical | ||
| No physical abuse | 77.3 | 6,786 |
| Physical abuse | 57.4*** | 126 |
| Sexual | ||
| No sexual abuse | 77.1 | 6,825 |
| Sexual abuse | 61.3** | 87 |
| Psychological | ||
| No psychological abuse | 78.4 | 6,076 |
| Psychological abuse | 61.8*** | 836 |
| Neglect | ||
| None | 77.5 | 6,706 |
| Neglect | 56.5*** | 206 |
| Any form of elder abuse reported? | ||
| No | 78.9 | 5,840 |
| Yes | 66.0 | 1,072 |
Notes: Weighted statistics and unweighted sample bases. The asterisks indicate that the difference between the two groups (whether experienced any specific type of abuse) was statistically significant based on bivariate regression analysis (*p < .05; **p < .01; ***p < .001).
Regression analysis
Regression analysis was applied to each of the abuse subtypes and overall (any form of abuse) to assess the strength of associations described above. Table 6.8 and Table 6.9 rank the relative importance of 15 variables to the experience of elder abuse. The first table sets out findings in relation to financial, physical and sexual abuse. Table 6.9 sets out findings in relation to psychological abuse and neglect, as well as the experience of elder abuse overall.
Box 6.3: Relative importance of associations between individual characteristics and elder abuse
For each abuse type, logistic regression analysis is employed to assess whether a specific characteristic variable is correlated with a specific abuse type, taking into account other variables in the logistic regression analysis. The regression results reveal which characteristics are significantly related to abuse, and the relative importance of each characteristic. In other words, relative importance is in the context of the variables included in the regression analysis. There are other characteristics and circumstances that could not be captured in the survey and may be important. Such variables could not be included in the regression analysis.
The logistic regression analysis result provides an indication of correlations between a specific explanatory variable and an abuse type being considered and does not indicate any direction of causality. Relative importance analysis is an indicator of strength for such associations relative to other explanatory variables being considered in the modelling and does not refer to any absolute correlation.
For example, the psychological distress variable is correlated with the experience of any form of abuse (the last set of columns in the table); however, the direction of this correlation cannot be established from this analysis. This correlation can go in either direction - a higher level of psychological distress can make the older person more vulnerable and increase the risk of experiencing elder abuse. Conversely, the experience of abuse can lead to a higher level of psychological distress. The relative importance (as set out in the table) indicates that this association is stronger than other explanatory variables (rank 1); the importance indicator is 33.7%, which means that the contribution of this to the overall logistic regression model is 35% among the 15 sets of variables being considered in the analysis.
The results confirm the associations described above continue to hold, taking into account demographic characteristics (regression results are in Appendix A, Table A6.7). More importantly, the further analyses reveal that social support and psychological distress are strong correlates across abuse subtypes and overall experiences (as shown in Table 6.8), though the pattern is somewhat weaker for sexual abuse.
For financial abuse, the top four correlates (in order) are psychological distress, social support, marital status, socio-economic status. For physical abuse, the top four correlates are social support, psychological distress, marital status and age. For sexual abuse, the top four correlates are marital status, age, psychological distress and social support.
In relation to psychological abuse, psychological distress, social support, age and disability status are the top four correlates. For neglect, the top four correlates are social support, psychological distress, disability status and marital status.
| Characteristic | Financial abuse | Physical abuse | Sexual abuse | |||
|---|---|---|---|---|---|---|
| Importance a (%) | Rank | Importance (%) | Rank | Importance (%) | Rank | |
| Gender | 0.1 | 13 | 1.5 | 10 | 7.2 | 6 |
| Age | 3.5 | 8 | 8.6 | 4 | 18.9 | 2 |
| Marital status | 11.3 | 3 | 12.3 | 3 | 22.7 | 1 |
| Education | 4.0 | 5 | 2.2 | 9 | 8.1 | 5 |
| Country of birth | 1.4 | 10 | 1.5 | 11 | 2.4 | 10 |
| Any biological children | 1.9 | 9 | 0.3 | 14 | ||
| Any step-children | 0.1 | 14 | 2.8 | 8 | ||
| Housing | 3.5 | 7 | 6.4 | 6 | 1.2 | 12 |
| SEIFA socio-economic index | 4.1 | 4 | 4.2 | 7 | 4.7 | 8 |
| Region | 0.2 | 12 | 0.7 | 13 | 3.4 | 9 |
| Disability status | 4.0 | 6 | 7.5 | 5 | 4.9 | 7 |
| Social contact b | 1.2 | 11 | 1.3 | 12 | 1.8 | 11 |
| Sense of social support | 29.8 | 2 | 30.4 | 1 | 10.5 | 4 |
| Psychological distress | 34.9 | 1 | 20.5 | 2 | 14.5 | 3 |
Notes: a Importance refers to standardised weight (contribution to the fitstat, pseudo R2 of the model estimates). b Social contact refers to frequency of seeing family members or friends living outside the households. The analysis of relevant importance of each variable in the regression was based on the module on dominance analysis for Stata.
| Characteristic | Psychological abuse | Neglect | Any form | |||
|---|---|---|---|---|---|---|
| Importance a (%) | Rank | Importance (%) | Rank | Importance (%) | Rank | |
| Gender | 0.8 | 10 | 2.7 | 8 | 0.6 | 12 |
| Age | 13.5 | 3 | 2.8 | 7 | 8.2 | 5 |
| Marital status | 7.8 | 5 | 5.9 | 4 | 9.1 | 4 |
| Education | 3.9 | 6 | 3.0 | 6 | 3.7 | 6 |
| Country of birth | 0.7 | 12 | 0.6 | 11 | 0.9 | 10 |
| Any biological children | 0.1 | 14 | 0.2 | 14 | 0.2 | 13 |
| Any step-children | 2.0 | 8 | 0.6 | 12 | 1.3 | 8 |
| Housing | 3.5 | 7 | 2.5 | 9 | 3.3 | 7 |
| SEIFA socio-economic index | 1.6 | 9 | 0.5 | 13 | 1.1 | 9 |
| Region | 0.1 | 13 | 3.1 | 5 | 0.1 | 14 |
| Disability status | 9.5 | 4 | 20.9 | 3 | 12.1 | 3 |
| Social contact b | 0.7 | 11 | 1.2 | 10 | 0.7 | 11 |
| Sense of social support | 21.6 | 2 | 28.3 | 1 | 25.2 | 2 |
| Psychological distress | 34.2 | 1 | 27.9 | 2 | 33.7 | 1 |
Notes: a Importance refers to standardised weight (contribution to the fitstat, pseudo R2 of the model estimates). b Social contact refers to frequency of seeing family members or friends living outside the households. The analysis of relevant importance of each variable in the regression was based on the module on dominance analysis for Stata.
Demographic characteristics and the CALD subsample
The analysis of the socio-demographic characteristics associated with experiencing elder abuse (all forms) for the CALD subsample is depicted in Table 6.10. The table shows the proportions of the CALD participants who report each type of abuse by gender, age, living arrangements and whether living with their children. For the purpose of comparison, the data for non-CALD participants are also presented. Owing to the small size of the CALD subsample and the low prevalence of elder abuse, it is not feasible to examine the prevalence of abuse by other characteristics.
The prevalence rate of elder abuse (any form, excluding abuse relating to language and culture) is lower for the CALD sample than the non-CALD sample (14% cf. 15%). For the CALD sample, none of the differences in the prevalence of elder abuse (at least one of the five subtypes) according to the selected characteristics was significant due to the small sample size. The following discussion focuses on whether specific patterns were similar to the non-CALD sample.
- The overall prevalence rate was slightly higher for women with a CALD background than their male counterparts (14.2% cf. 13.8%). The pattern was consistent with the non-CALD sample.
- Similar to the non-CALD sample, reports of elder abuse fall with age among the CALD sample, with 16.3% for the younger age range of 65-74 and 10% for the older age ranges of 75 years and older.
- Living alone is also associated with a higher likelihood of elder abuse for both CALD and non-CALD samples compared to living with a partner (CALD: 14.7% cf. 13.7%; non-CALD: 16.7% cf. 13.5%). While living with others is also associated with an elevated risk of experiencing elder abuse for the non-CALD sample (22.8%), this is not evident for the CALD sample (14.1%).
- For both the CALD and non-CALD samples, living with children is associated with a higher likelihood of experiencing elder abuse (CALD: 16.1% cf. 13.5%; non-CALD: 17.6% cf. 14.7%).
| Characteristic | Any form | Number of participants (base) | ||
|---|---|---|---|---|
| CALD | Non-CALD | CALD | Non-CALD | |
| All | 14.0 | 15.0 | ||
| Gender | * | |||
| Male | 13.8 | 13.5 | 272 | 2,475 |
| Female | 14.2 | 16.3 | 332 | 3,909 |
| Age | *** | |||
| 65-74 years | 16.3 | 18.2 | 334 | 3,290 |
| 75+ years | 10.8 | 10.9 | 228 | 2,402 |
| Living arrangement | *** | |||
| Couple | 13.7 | 13.5 | 338 | 3,443 |
| Living alone | 14.7 | 16.7 | 188 | 2,472 |
| Living with others | 14.1 | 22.8 | 82 | 477 |
| Whether living with children | ||||
| No | 13.5 | 14.7 | 487 | 5,756 |
| Yes | 16.1 | 17.6 | 119 | 617 |
Notes: Based on weighted data. Participants who could not be classified regarding experience of abuse due to item non-response were included in the total when deriving the prevalence figures. For the CALD and non-CALD groups (separately), the differences in the prevalence of elder abuse across categories of a specific characteristic variable were tested for statistical significance using design-based F test (*p < .05; **p < .01; ***p < .001).
Abuse related to language and cultural background
Table 6.11 sets out the extent to which CALD participants report experiencing abuse relating to language and their cultural background by the selected characteristics. Consistent with the pattern described above relating to overall experience of elder abuse, the CALD participants in the older age range (75+ years) are less likely than those in the younger age range (65-74) to report experience of this form of abuse (2.1% cf. 5.4%). Living with adult children is not correlated with a higher or lower likelihood of experiencing this type of abuse.
| Characteristic | CALD abuse | Number of participants (base) |
|---|---|---|
| Gender | ||
| Male | 3.9 | 272 |
| Female | 3.9 | 332 |
| Age | ||
| 65-74 | 5.4 | 334 |
| 75+ | 2.1 | 274 |
| Living arrangement | ||
| Couple | 3.5 | 338 |
| Living alone | 4.1 | 188 |
| Living with others | 6.5 | 82 |
| Whether living with children | ||
| No | 3.9 | 487 |
| Yes | 4.4 | 119 |
Note: Based on weighted data.
Summary
The analysis set out in this section provides insight into the socio-demographic characteristics of the participants in the sample that are associated with an experience of abuse. In addition to gender, some characteristics are salient across abuse types. These findings indicate elder abuse is tied to age, socio-economic status and family form.
Participants in the 65-69 years age group were more vulnerable to abuse compared with those in older age ranges and this pattern applied to overall elder abuse and all subtypes. However, the likelihood of neglect rises after age 80. The pattern of lower prevalences of elder abuse associated with older age groups is likely to reflect the sample for this study, in that older people without capacity to consent and those living in aged care settings were excluded. Further relevant factors in these patterns are the findings of an association among the older age groups of more condoning attitudes toward elder abuse and lower levels of recognition of elder abuse (chapter 12).
It also appears that low socio-economic status is associated with a greater risk of abuse overall, and especially financial, sexual and psychological abuse. Owning a home with debt and being in rented accommodation (including public housing) are associated with a higher likelihood of experiencing psychological abuse.
Marital status is a consistent influence across all abuse types, with those who are either separated or divorced being more vulnerable. Conversely, people with a partner are less likely to experience abuse.
Although the vast majority of SOP participants have good psychological and physical health, the findings indicate that elder abuse experiences are associated with poorer health ratings. Although causal direction of these outcomes and the experience of elder abuse is uncertain, the findings in relation to elevated levels of poor psychological and physical health and social isolation among those who experienced elder abuse are consistent with some risk factors identified in Storey's (2020) recent analysis (chapter 2).
In relation to psychological wellbeing, a higher level of psychological distress was associated with a higher likelihood of elder abuse. Participants who did experience elder abuse were more likely to fall into the score range for probable serious mental illness compared with those who did not. The patterns were consistent across abuse types.
A similar association between lower ratings of physical health and abuse experiences is evident, with 'poor' health ratings being associated with a high likelihood of experiencing elder abuse. Older people with disability or long-term medical conditions were twice as likely as others without such health problems to report experiencing any form of elder abuse.
Less frequent contact with family members and friends was associated with an elevated likelihood of experiencing elder abuse. A lower sense of social support was associated with a higher likelihood of experiencing elder abuse.
8 The characteristics of the participants in the SGC who had concerns about abuse are presented in the appendix and not discussed in the chapter for the sake of simplicity.
9 It is worth noting that sexual abuse involved a small number of occurrences. Although logistic regression would not normally be applied to such small sample sizes, research by Vittinghoff and McCulloch (2007) concluded that logistic regression can be applied where the number of events per predictor variable is fewer than 10 events per predictor variable; in particular, with adequate control of confounding. The ratio of events per predictor variable in this analysis is within the acceptable range of 5-9.
10 Some variables that were presented in the bivariate analysis are excluded from the regression analysis due to either high levels of missing data (e.g. household income) or small numbers (e.g. Indigenous status). The employment variable was excluded.
11 The gendered difference in the prevalence of sexual abuse was not statistically significant. The pattern was consistent with the Canadian study (National Initiative for the Care of the Elderly, Canada, 2015).
Who commits elder abuse?
Key messages

Introduction
This chapter sets out findings on who perpetrates elder abuse. The findings shed light on who the most common perpetrators of elder abuse are and expands the analysis on the diverse dynamics associated with the different subtypes of elder abuse. The discussion identifies who among three potential groups of perpetrators are the most common: family members; friends, acquaintances and neighbours; and professionals who come into contact with older people.
A limitation of these findings is that professional carers are likely to be under-represented as a potential perpetrator group given the requirements to participate in the survey, as previously explained in chapter 4.
The findings in this chapter address the following research aims:
- Examining the contexts of elder abuse
- Identifying the characteristics of people who have engaged in abuse
- Identifying whether the experience of CALD subgroups differs from that of non-CALD subgroups in these respects.
The discussion in this chapter starts with a profile of who the abuse perpetrators were according to the reports of the people who experienced elder abuse in the SOP. It then provides detailed insight into perpetrators according to the five subtypes of abuse, including an examination of the characteristics of perpetrators. These findings are then set out in relation to the CALD subsample. Finally, findings from the SGC, concerning perpetrators of abuse where participants had concerns about someone they know being abused, are outlined.
Relationship between perpetrators and older persons
Limited focus has been placed on perpetrator dynamics in the field of elder abuse, other than some focus on the characteristics associated with a tendency to commit abuse (De Liema, Yonashiro-Cho, Gassoumis, Yon, & Conrad, 2018) (see chapter 2). Among the challenges associated with examining perpetrator behaviour are the ethical and other complications of obtaining data from perpetrators themselves, given that elder abuse, in many instances, is likely to amount to criminal behaviour. There are also limitations on obtaining information about perpetrators from their victims, as they may fear reprisals, want to protect the perpetrator from adverse consequences or be unable to provide reliable information about key issues (De Liema et al., 2018).
Overview of perpetrators
Figure 7.1 sets out findings on the relationship of the person who perpetrated abuse with the participant who reported experiencing abuse and displays these perpetrator groups as a proportion of all identified perpetrators.12
Figure 7.1: Survey of Older People: Relationship of perpetrators to the participant, by subtypes and overall (as % of perpetrators)
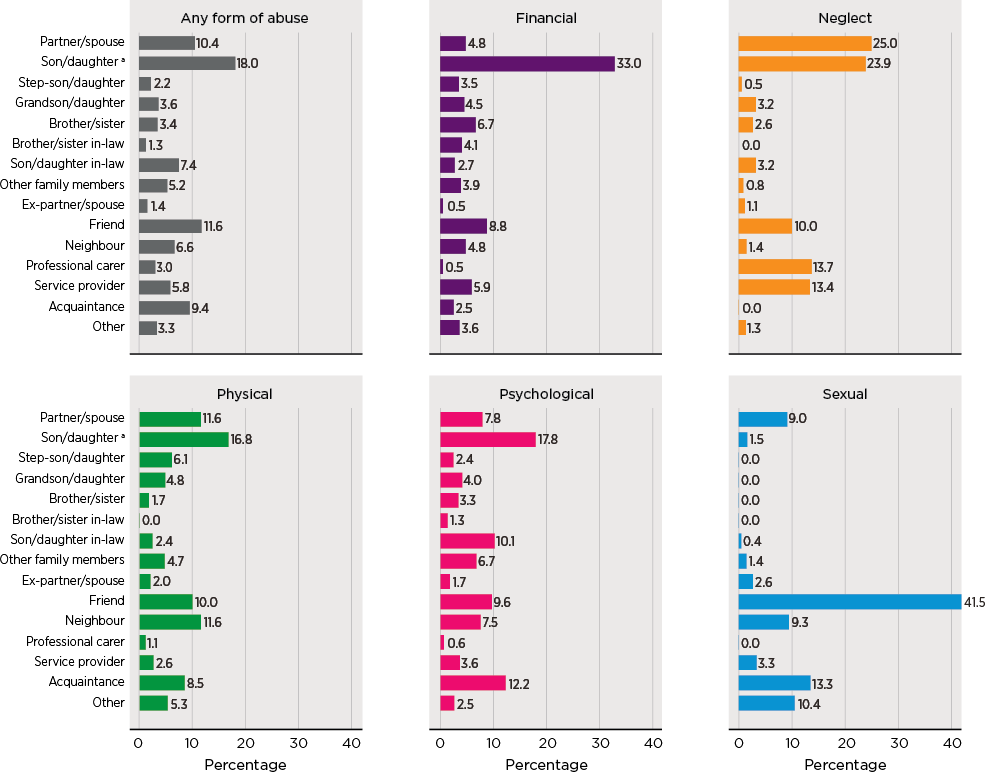
Notes: Weighted data and unweighted sample sizes in order of chart, n = 1,382, 168, 265, 132, 915, 89. Multiple perpetrators could be reported for each type of abuse. Values may not equal 100% due to rounding. a Includes biological/adopted children.
Where participants experienced abuse from more than one person (a quarter of participants who experienced abuse, data not shown), they were asked to identify who the perpetrators were, and which one had affected them the most (labelled as the 'main perpetrator'). Participants were then asked further questions about the characteristics of the person identified as the 'main perpetrator'. (The reports on the 'main perpetrator' are in Appendix A, Table A7.1).
The findings demonstrate that elder abuse has strong familial dynamics, with intergenerational and intimate partner relationships involved in victim-perpetrator dynamics to a very significant extent.
Intergenerational family relationships account for a substantial proportion of elder abuse experiences. The largest perpetrator group consists of children (including biological and adopted children), accounting for 18% of perpetrators. Based on the reports on main perpetrators, sons are slightly more likely than daughters to be the main perpetrator (9% cf. 7% of perpetrators). Partners of children (sons- and daughters-in-law) are also a significant perpetrator group at 7%. Intergenerational abuse involving grandchildren also occurs, with grandsons and granddaughters accounting for 4% of perpetrators.
Intimate partners are also one of the larger perpetrator groups at 10%. Abuse involving siblings and abuse involving in-laws (3% and 1% respectively) also reinforces the familial dynamic of elder abuse, as does 'other family members' accounting for 5%.
Friends and acquaintances account for a significant proportion of perpetrators at 12% and 9% respectively. Neighbours are also significant in the non-family, non-professional perpetrator group at 7%.
Abuse perpetrated by professionals, including service providers (6%) and professional carers (3%) is not as common as abuse perpetrated by family members and those known to an older person. However, this is likely to reflect the under-representation of people with a need for a higher level of care in this sample.
Perpetrators for the five subtypes of abuse
Figure 7.1 shows the patterns in perpetrator groups across the five subtypes of elder abuse.
- Children were the largest perpetrator group for financial abuse (33%). The main perpetrator analysis indicated that sons were twice as likely as daughters to commit financial abuse (21% cf. 11%, see Appendix A, Table A7.3). The next largest perpetrator type for financial abuse is friends (9%) with siblings the next most frequently nominated group (7%) followed by service providers (6%).
- Children were also the largest perpetrator group for physical abuse (17%) and psychological abuse (18%). Sons were more likely than daughters to be reported as the main perpetrator of physical abuse (11% cf. 3%).
- Other significant groups for physical abuse included partners/spouses (18%), neighbours (12%) and friends (10%).
- For psychological abuse, family members were well-represented in the perpetrator group, including sons- and daughters-in-law (10%) and spouses (8%). Friends (10%), acquaintances (12%) and neighbours (8%) were also perpetrators of psychological abuse.
- In relation to sexual abuse, the largest perpetrator group in this context was friends (42%), followed by acquaintances (13%) and partners/spouses (9%).
- For neglect, children and intimate partners were the two largest perpetrator groups (24-25%). Of participants who reported the main perpetrator being a son or daughter, 14% reported the main perpetrator was a son compared with 9% reporting the main perpetrator was a daughter (see Appendix A, Table A7.3). Neglect had the highest proportion of professionals as perpetrators, with professional carers at 14% and service providers at 13%.
Perpetrator characteristics
Table 7.1 sheds further light on the dynamics of elder abuse through an analysis of perpetrator characteristics, with the first column providing overall findings and the subsequent columns providing a breakdown by abuse type. These data were collected in relation to the 'main perpetrator' identified by the participant. The following aspects of the analysis are noteworthy:
- Men are more likely to commit abuse than women (55% cf. 45%), with widening disparity between men and women as perpetrators of financial (65% cf. 35%), physical (77% cf. 24%) and sexual (79% cf. 21%) abuse.
- People in the age groups most likely to be committing abuse are 45-54 years (20%) and 65-74 (23%).
- People committing abuse are more likely to be not employed than employed (53% cf. 47%), especially for physical abuse (75% cf. 25%).
- Overall, perpetrators are unlikely to be living with the older person (23% cf. 77%) but this is especially true of psychological abuse (18% cf. 82%) and sexual abuse (7% and 93%). In this respect, the pattern varies for neglect (42% live with cf. 58% do not) and financial abuse (32% and 68%).
| Characteristic | All | Financial | Physical | Sexual | Psychological | Neglect |
|---|---|---|---|---|---|---|
| Gender of main perpetrator | ||||||
| Male | 55.0 | 65.3 | 76.5 | 79.0 | 51.5 | 51.8 |
| Female | 45.0 | 34.7 | 23.5 | 21.0 | 48.5 | 48.2 |
| Number of participants (base) | 997 | 132 | 96 | 74 | 695 | 179 |
| Age of main perpetrator | ||||||
| Under 25 | 4.6 | 4.9 | 6.6 | - | 4.9 | 4.6 |
| 25-34 | 9.9 | 12.8 | 13.7 | 4.3 | 10.1 | 6.9 |
| 35-44 | 17.2 | 22.7 | 20.8 | 2.8 | 17.5 | 18.2 |
| 45-54 | 20.2 | 21.9 | 16.7 | 12.5 | 20.6 | 17.2 |
| 55-64 | 14.5 | 15.7 | 11.7 | 18.9 | 14.0 | 11.8 |
| 65-74 | 22.9 | 18.5 | 20.7 | 45.0 | 22.2 | 28.5 |
| 75 and over | 10.6 | 3.4 | 9.8 | 16.4 | 10.6 | 12.8 |
| Number of participants (base) | 1,023 | 133 | 101 | 74 | 715 | 158 |
| Employment of main perpetrator | ||||||
| Employed | 46.8 | 45.1 | 24.9 | 45.8 | 46.3 | 48.5 |
| Not employed | 53.2 | 54.9 | 75.1 | 54.2 | 53.7 | 51.5 |
| Number of participants (base) | 977 | 129 | 95 | 70 | 691 | 181 |
| Employment of main perpetrator (for persons aged under 65) | ||||||
| Employed | 58.8 | 53.8 | 30.8 | 67.7 | 60.7 | 66.8 |
| Not employed | 41.2 | 46.2 | 69.2 | 32.3 | 39.3 | 33.2 |
| Number of participants (base) | 663 | 106 | 68 | 27 | 470 | 118 |
| Whether main perpetrator living with the older person | ||||||
| Yes | 23.2 | 31.8 | 27.7 | 7.2 | 18.2 | 42.0 |
| No | 76.8 | 68.2 | 72.3 | 92.8 | 81.8 | 58.0 |
| Number of participants (base) | 1,004 | 138 | 101 | 75 | 728 | 190 |
Notes: Weighted data, unweighted sample sizes. Each characteristic excludes don't know and refused responses from the analysis. These proportions may include instances where the main perpetrator is 'unclear'. Data are not included separately for the CALD subsample owing to small sample sizes. The analysis does not include abuse relating to language or culture as data were not collected on perpetrator characteristics for this form of abuse.
Problems associated with perpetrators
Table 7.2 presents the extent to which perpetrators had the following problems, according to elder abuse victims: issues with alcohol, drugs, gambling, mental health or physical health; or financial, work, family or personal problems. The data were collected in relation to the 'main perpetrator' for each specific subtype and overall elder abuse.
| Perpetrator problem | All | Financial | Physical | Sexual | Psychological | Neglect |
|---|---|---|---|---|---|---|
| Alcohol | 14.8 | 16.7 | 23.4 | 35.2 | 15.3 | 4.8 |
| Drugs | 11.2 | 22.5 | 26.3 | 4.1 | 13.2 | 2.3 |
| Gambling | 3.8 | 10.0 | 9.0 | 8.5 | 4.3 | 2.1 |
| Mental health problems | 31.8 | 37.3 | 63.2 | 29.7 | 38.2 | 10.8 |
| Physical health problems | 19.5 | 24.3 | 28.7 | 28.1 | 18.2 | 24.8 |
| Financial problems | 21.3 | 54.6 | 28.9 | 16.2 | 22.0 | 11.4 |
| Other | 1.9 | 1.8 | - | 1.8 | 1.2 | 3.7 |
| Work issues | 1.3 | - | 0.6 | - | 0.7 | 4.1 |
| Family issues | 4.2 | 6.5 | 2.3 | 1.0 | 5.2 | - |
| Emotional/personal problems | 5.4 | 4.4 | 1.8 | 0.5 | 6.9 | 1.4 |
| None of these | 28.2 | 16.3 | 8.8 | 21.9 | 28.2 | 39.8 |
| Number of participants (base) | 1,081a | 139 | 102 | 75 | 729 | 208 |
| Having at least one problem | ||||||
| 1 problem | 46.4 | 40.2 | 36.6 | 56.4 | 45.8 | 75.8 |
| 2 problems | 25.7 | 20.7 | 21.9 | 11.1 | 27.4 | 12.6 |
| 3 problems | 16.6 | 21.7 | 25.2 | 29.2 | 16.6 | 8.2 |
| 4 problems | 6.5 | 9.7 | 12.3 | 0.8 | 6.1 | 1.8 |
| 5-7 problems | 4.9 | 7.7 | 4.0 | 2.6 | 4.0 | 1.6 |
| Mean no. of problems | 2.0 | 2.3 | 2.3 | 1.8 | 2.0 | 1.4 |
| Number of participants (base) | 618 | 107 | 78 | 46 | 458 | 90 |
Notes: Weighted data, unweighted sample sizes. Responses that indicated 'None of these', don't know and refused are excluded from number of problems. These proportions may include instances where the main perpetrator is 'unclear'. Problems relating to the categories of 'Work issues', 'Family issues' and 'Emotional/personal problems' were back-coded from verbatim responses. a This total for all forms of abuse does not include abuse related to language or culture as data were not collected in relation to this form of abuse.
Overall, the majority of elder abuse victims indicated they were aware that the perpetrator had one or more problems (72%). The most commonly reported problem was a mental health issue (32%), followed by financial problems (21%) and physical health problems (20%). The analysis shows that different problems are associated with different forms of abuse to varied extents, underlining again the complex dynamics involved.
- For financial abuse, physical abuse and psychological abuse: financial, mental health and physical issues were the most common problems the perpetrators had. Financial problems were more prominent for the perpetrators of financial abuse (55%), while mental health problems were more marked for the perpetrators of physical abuse (63%). Mental health problems were the leading problem for the perpetrators of psychological abuse (38%), and it was similarly common for the perpetrators of financial abuse (37%).
- A different pattern emerged for sexual abuse, with this being the only type of abuse associated with a high level of problems with alcohol among perpetrators (35% cf. 5-23% of other subtypes). For sexual abuse, the next most common perpetrator problems were mental health problems and physical health problems (28-30%).
- For neglect, the most commonly associated problems were physical health problems (25%), followed by financial problems and mental health problems (11% for each problem). The majority of main perpetrators had at least one problem reported (76%) at a much higher frequency than perpetrators of other abuse types. These findings suggest that for some neglect situations, these problems (particularly physical health problems) create an inability to meet care needs rather than a wilful neglect of care needs.
- Associations between alcohol and drug use and perpetrator problems were evident for financial, physical and psychological abuse.
Elder abuse and perpetrator dynamics: adult children and friends as perpetrators
The analyses in this chapter so far have presented a complex picture of perpetrator dynamics in relation to elder abuse, diverse relationships between elder abuse victims and perpetrators, and a range of problems reported for perpetrators. Further, these aspects of perpetrator dynamics varied according to abuse subtypes.
In order to gain a better understanding of perpetrator dynamics, this section presents the analysis of elder abuse committed by two perpetrator groups: adult children and friends. Adult children were the largest group among familial perpetrators, and friends were the largest group among non-familial perpetrators. The following analysis compares characteristics of older persons who experienced elder abuse committed by these two perpetrator groups, as well as the perpetrator problems of the two perpetrators groups, for each abuse subtype. Due to small sample sizes, this analysis excluded sexual abuse. The sample sizes for other perpetrator groups were in general too small.
For the sake of simplicity and clarity in the data, this analysis focuses on adult children and friend perpetrators who were identified as main perpetrators if a participant reported having experienced an abuse subtype from more than one perpetrator. In other words, older persons who experienced a subtype of abuse committed by adult children and/or friends were mutually exclusive groups for the purpose of this analysis.
It is important to note at the outset that although adult children and friend perpetrators were relatively larger groups, the sample size for each group was still very small and the results should be considered exploratory. Because of small numbers in the two groups across abuse subtypes, no statistical test was applied. The discussion below focuses on some general patterns.
Table 7.3 focuses on the selected characteristics of older persons who experienced specific abuse subtypes by whether the abuse was committed by adult children or friends.
- There were no consistent patterns in terms of the intersection between gender and the two perpetrator groups across the four abuse subtypes.
- Older people who experienced psychological abuse committed by adult children were more likely to be older women, as opposed to older people who experienced such abuse committed by friends.
- Financial abuse committed by friends was more likely to be experienced by older men, while financial abuse by adult children was somewhat more likely to be experienced by older women.
- Older people who experienced financial abuse committed by friends were older than those who experienced such abuse by adult children and came from non-English speaking backgrounds.
- It appeared that older people who experience psychological, financial and physical abuse subtypes committed by friends were more likely to be never married, compared to those who experienced such abuse by their adult children.
- Older people who experienced financial abuse, physical abuse and neglect by friends reported poorer health compared to those who experienced the same abuse subtypes committed by adult children.
The majority of friend perpetrators of psychological abuse, financial abuse and physical abuse were aged 65 years and older. This pattern suggests that friend perpetrators tended to be the peers of elder abuse victims.
| Psychological abuse | Financial abuse | Physical abuse | Neglect | |||||
|---|---|---|---|---|---|---|---|---|
| Abuse by adult children (%) | Abuse by friends (%) | Abuse by adult children (%) | Abuse by friends (%) | Abuse by adult children (%) | Abuse by friends (%) | Abuse by adult children (%) | Abuse by friends (%) | |
| Base n | 162 | 99 | 60 | 14 | 19 | 9 | 45 | 18 |
| Older persons | ||||||||
| Gender | ||||||||
| Men | 31 | 46 | 43 | 70 | 49 | 69 | 14 | 51 |
| Women | 69 | 54 | 57 | 30 | 51 | 31 | 86 | 49 |
| Age | ||||||||
| 65-74 | 71 | 71 | 61 | 63 | 84 | 82 | 74 | 65 |
| 75-84 | 23 | 26 | 35 | 15 | 16 | 11 | 14 | 20 |
| 85+ | 6 | 3 | 4 | 22 | 0 | 7 | 12 | 16 |
| Country of birth | ||||||||
| Australia | 72 | 54 | 77 | 68 | 82 | 61 | 72 | 54 |
| Other English speaking countries a | 16 | 12 | 11 | 6 | 18 | 3 | 16 | 12 |
| Non-English speaking countries | 12 | 34 | 12 | 26 | 0 | 37 | 12 | 34 |
| Marital status | ||||||||
| Married | 50 | 48 | 42 | 29 | 44 | 26 | 47 | 38 |
| Divorced/separated | 28 | 29 | 34 | 39 | 45 | 55 | 18 | 55 |
| Widowed | 20 | 13 | 24 | 16 | 12 | 14 | 33 | 7 |
| Never married | 2 | 10 | 0 | 16 | 0 | 6 | 2 | 0 |
| General health | ||||||||
| Excellent/very good | 35 | 34 | 52 | 22 | 48 | 7 | 23 | 17 |
| Good | 26 | 22 | 19 | 15 | 15 | 12 | 31 | 15 |
| Fair/poor | 38 | 44 | 29 | 63 | 37 | 81 | 46 | 68 |
Notes: Weighted data for the statistics and unweighted sample sizes. a Other English speaking countries include: United Kingdom, Republic of Ireland, United States of America, Canada, South Africa, New Zealand.
Table 7.4 shows whether the two perpetrator groups had problems, according to elder abuse victims.
- Adult children perpetrators were more likely than friend perpetrators to have at least one problem that the elder abuse victim was aware of. This pattern was evident across all of the four abuse subtypes.
- The following problems were more common for adult children perpetrators than friend perpetrators:
- drug problems and mental health issues across the abuse subtypes with one exception (neglect), where drug problems were similar between the two groups of perpetrators.
- financial problems and family issues in relation to psychological and financial abuse.
- In contrast, gambling problems were more common for friends than adult children perpetrators in relation to financial and physical abuse, and neglect.
| Psychological abuse | Financial abuse | Physical abuse | Neglect | |||||
|---|---|---|---|---|---|---|---|---|
| Abuse by adult children (%) | Abuse by friends (%) | Abuse by adult children (%) | Abuse by friends (%) | Abuse by adult children (%) | Abuse by friends (%) | Abuse by adult children (%) | Abuse by friends (%) | |
| Alcohol | 11 | 19 | 22 | 10 | 3 | 17 | 3 | 0 |
| Drugs | 24 | 3 | 37 | 8 | 65 | 0 | 3 | 10 |
| Gambling | 4 | 8 | 10 | 31 | 13 | 37 | 1 | 19 |
| Mental health | 40 | 26 | 59 | 22 | 88 | 46 | 17 | 3 |
| Physical health | 16 | 23 | 29 | 45 | 88 | 28 | 13 | 33 |
| Financial problems | 41 | 23 | 73 | 23 | 50 | 51 | 27 | 25 |
| Family issues | 14 | 1 | 13 | 0 | .. | .. | ||
| Any problem (at least one) | 75 | 56 | 83 | 70 | 94 | 82 | 54 | 44 |
| Base n | 162 | 99 | 60 | 14 | 19 | 9 | 45 | 18 |
Note: Weighted data for the statistics and unweighted sample sizes.
In summary, comparing adult children and friend perpetrators across the four abuse subtypes highlights the complex dynamics surrounding elder abuse. Drug problems, mental health, and financial problems were more common among adult children perpetrators than friend perpetrators, while gambling problems were more marked for friend perpetrators. In addition, elder abuse victims of friend perpetrators were older and more likely to be from non-English speaking backgrounds and have poorer health. Never having been married also appeared to be linked to elder abuse victims whose experience was inflicted by their friends.
The data appear to suggest that abuse by friends is linked with victim vulnerability to a greater extent than abuse by adult children. In contrast, adult children are more likely to have problems than friend perpetrators, to the extent the older person is aware of. This suggests that to some degree, victim-focused factors are important in abuse by friends and perpetrator-focused factors are important in abuse by adult children. Moreover, in some instances, problems, such as gambling, may have led friend perpetrators to target older persons who were particularly vulnerable.
Overview of perpetrators: CALD subgroup
This section examines the relationships between perpetrators and the participants who experienced elder abuse for the CALD subgroup in the SOP (here 'CALD' referred to those who spoke a language other than English at home). Given small sample sizes for specific subtypes of elder abuse, the analysis focuses on overall perpetrators of the five subtypes. The results are shown in Figure 7.2. The relationships between perpetrators of abuse relating to language or culture and the participant is shown in Table 7.5.
General patterns in the relationships between the perpetrators and the CALD victims were similar to those that emerged for the whole sample. Familial perpetrators account for the majority of perpetrators for the CALD subsample. Intergenerational dynamics are strongly evident with sons and daughters accounting for 13% of the perpetrators. Sons- and daughters-in-law are almost as significant a category as sons and daughters (11%).
Among the group of perpetrators known to the older person as a friend, neighbour or acquaintance, friends were the biggest group for the CALD subsample (18%), and they were also notably a bigger group than children. By comparison, children were a larger perpetrator group than friends for the whole sample (see Figure 7.1). Professional carers were a small group of perpetrators for the CALD subsample (2%).
Figure 7.2: Survey of Older People: Relationship of perpetrators to older people who experienced at least one type of abuse and are from a CALD background
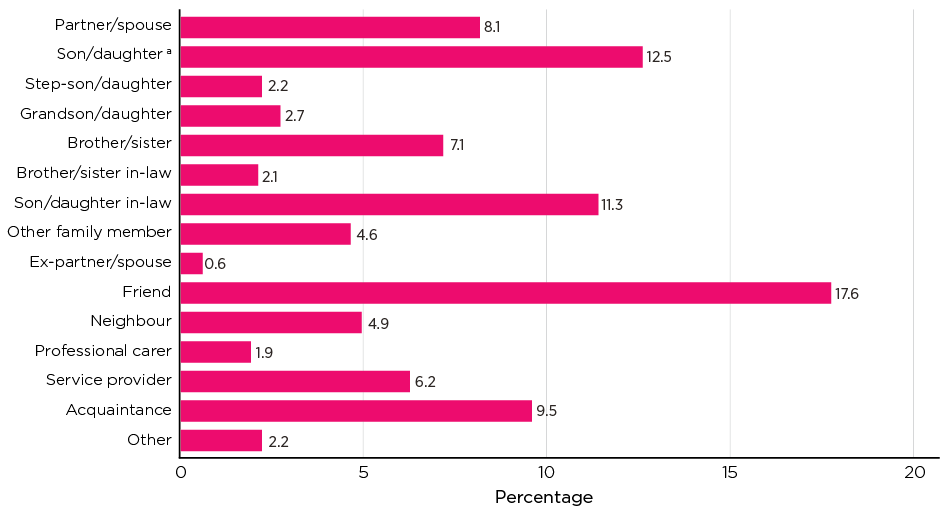
Notes: Weighted data and unweighted sample size (number of perpetrators (base) = 136). Multiple perpetrators could be reported for each type of abuse. Values may not equal 100.0% due to rounding. a Includes biological/adopted children.
Perpetrators of abuse relating to language and culture
Patterns in the perpetrators of abuse relating to language and culture differ substantially from the other types of abuse (Table 7.5). There was limited representation of family members (5% sons- and daughters-in-law and 9% other family members), with no children involved in this type of abuse.
The main sources of this type of abuse were friends (33%), acquaintances (18%) and neighbours (12%). Representation of professional carers (3%) and service providers (4%) was limited.
| Perpetrator | All (as % of participants) |
|---|---|
| Partner/spouse | 0.7 |
| Son/daughter in-law | 4.6 |
| Other family member | 9.4 |
| Friend | 32.6 |
| Neighbour | 11.9 |
| Professional carer | 2.9 |
| Service provider | 3.8 |
| Acquaintance | 17.7 |
| Other | 0.7 |
| Total | - |
| Base | 27 |
| Multiple perpetrators | 8.3 |
| 2 | 7.5 |
| 3 | 0.9 |
| Number of participants (base) | 22 |
Notes: Weighted data. Multiple perpetrators could be reported with only one reported as main perpetrator. Relationship categories with no proportions are not shown. Values may not equal 100.0% due to rounding.
Findings from the General Community Survey
This section sets out findings from the General Community Survey in relation to the perpetrators of elder abuse towards an older person who participants had revealed they were concerned about. It is important to note that the reports of participants were based on their perceived concerns, and the suspected abuse may not have happened or be committed by the specific perpetrator they identified.
Figure 7.3 demonstrates that for concerns about emotional abuse, participants reported a son was the person who mistreated the older person (26%). This was followed by another family member (24%) and a daughter (21%). A son was also the most frequently reported person mistreating older people by taking advantage of them financially (31%), again followed by another family member (28%) and daughter (23%). In contrast, for concerns about failure to provide adequate care with routine activities and physical hurt, professional carers were most commonly reported as a source of these concerns (27% and 23% respectively).
Figure 7.3: Survey of the General Community: Perpetrators identified for reported concerns by subtype
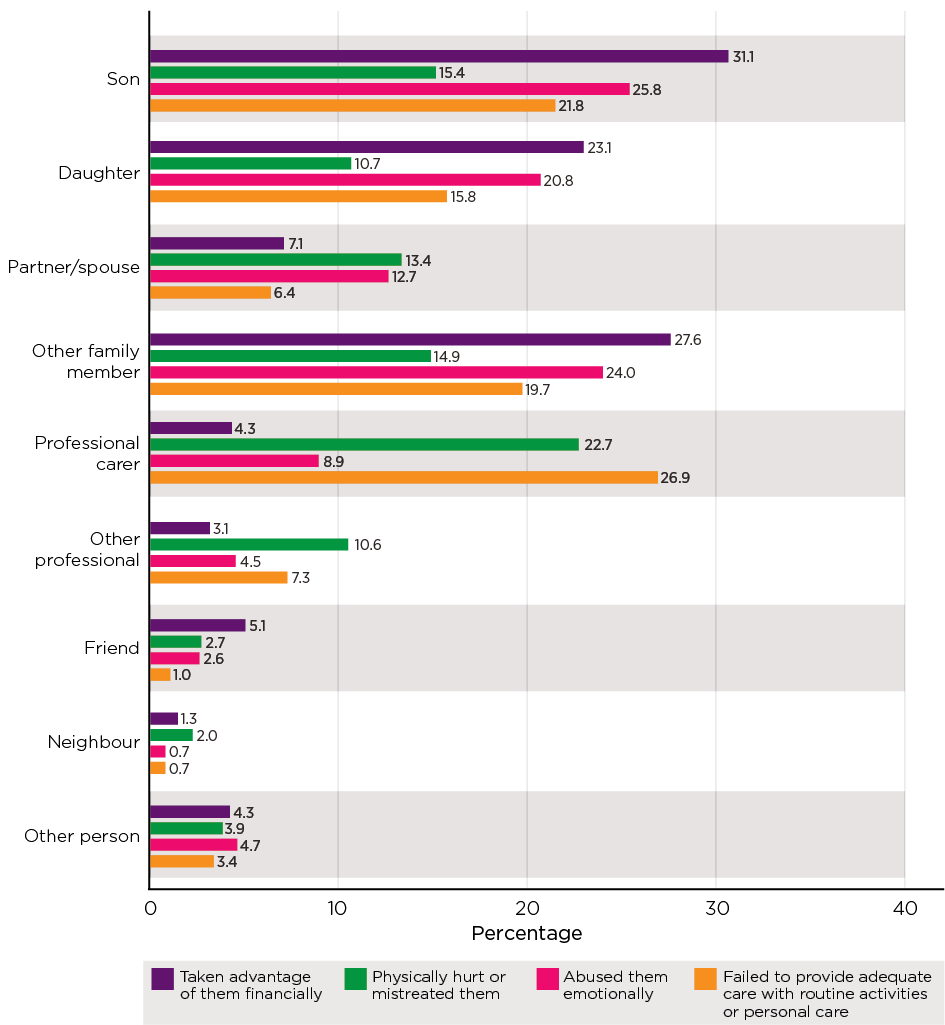
Notes: Weighted data and unweighted sample size (in order of bars n = 358, 128, 386, 258). Son and daughter (include step and in-law). Other person includes colleagues and ex-partner/spouse. Percentages do not sum to 100.0% as multiple options could be selected. Further analysis of concerns about sexual abuse and who mistreated them not reported due to small sample sizes (n = 11).
Where participants identified professional carers as causing concerns, they were asked an additional question to ascertain where the mistreatment occurred. This information is reported in Table 7.6 for concerns about emotional abuse and failure to provide adequate care only, due to small sample sizes in the other types (less than 30 observations).
The most commonly reported place of mistreatment was residential care (77% of participants who identified emotional abuse and 69% of participants who identified failure to provide adequate care with routine activities). The next most commonly reported place of mistreatment for each of these items was the older person's home, where the corresponding proportions were 27% and 25% respectively. Of note is that hospitals were identified by 6% of participants with concerns about failure to provide care.
| Location of mistreatment | Abused them emotionally (%) | Failed to provide adequate care with routine activities or personal care when needed (%) |
|---|---|---|
| Residential care | 77.0 | 69.2 |
| The older person's home | 27.3 | 24.5 |
| Someone else's home | 2.1 | - |
| Other | 1.3 | 1.9 |
| Hospital | - | 6.0 |
| Base | 35 | 69 |
Notes: Percentages do not sum to 100.0% as multiple options could be selected.
Summary
The findings in this chapter establish the predominant relationship dynamics in elder abuse are familial and intergenerational. For the overall sample, these relationships account for the largest perpetrator group, with children representing just under one-fifth of perpetrators, and partners of children and grandchildren around one-tenth taken together. The intergenerational relationship dynamic was particularly pronounced for financial abuse, with one-third of perpetrators in this group being sons and daughters. With the exception of sexual abuse and neglect, children are the biggest perpetrator groups for all the other abuse subtypes, though to lesser extents than for financial abuse.
Intimate partners are also significant perpetrators, particularly for physical abuse, sexual abuse and psychological abuse (around one-tenth for each). For neglect, intimate partners are almost on par with children (over one-fifth for each group).
Abuse perpetrated by neighbours, acquaintances and friends was also significant, with these groups accounting for approximately one-quarter of perpetrators combined. Together, this group of perpetrators was almost as large as the intergenerational familial group. Friends are particularly likely to be implicated in financial abuse. Neighbours and friends are also significant perpetrator groups for physical abuse. Friends (two in five) accounted for the largest perpetrator group in relation to sexual abuse, followed by a much smaller group of acquaintances. They were also well-represented as psychological abuse perpetrators (combined accounting for a little under one-third of perpetrators).
Professionals were the smallest overall perpetrator group, with service providers and professional carers combined accounting for around one-tenth. Service providers appeared to be especially likely to be associated with financial abuse. Nevertheless, neglect was the abuse type most likely to be associated with service providers and professional carers (over one-quarter taken together). However, the under-representation of people with a need for a higher level of care in this sample is a limitation to consider.
Overall, men outweigh women as perpetrators of abuse by 10 percentage points (55% cf. 45%). They account for more than three-quarters of abuse perpetrators for physical and sexual abuse and more than two-thirds for financial abuse.
Consistent with some of the perpetrator-related risk factors identified in Storey's (2020) systematic review (chapter 2), perpetrators in this study are reported to have a range of problems, with around half having two or more. Most commonly, they have mental health problems (more than a quarter) and financial problems (nearly one in five). The most common problems associated with financial abuse are financial problems. Mental health issues are the most commonly reported problems for physical and psychological abuse. For sexual abuse perpetrators, problems with alcohol predominate.
Neglect is different from the other abuse subtypes, with physical health problems being the most common issue associated with perpetrators.
Comparing adult children and friend perpetrators highlights the complex dynamics surrounding elder abuse. The data appear to suggest that abuse by friends is linked with victim vulnerability to a greater extent than abuse by adult children. In contrast, for abuse committed by adult children, perpetrator problems are a more significant factor. Moreover, in some instances, problems, such as gambling, may have led friend perpetrators to target older persons who were particularly vulnerable.
The findings from the SGC survey in relation to perpetrator identity are broadly in line with the patterns evident in the SOP, with many concerns focusing on sons as perpetrators of financial abuse. Similarly, professional carers are a significant source of concern about neglect.
CALD subsample
The pattern of elder abuse being familial and intergenerational generally also applied to the CALD subsample. Intergenerational dynamics remain significant for this subsample but sons- and daughters-in-law are almost as significant perpetrator groups as children.
Further, friends were the largest perpetrator group for this sample, while this was not the case for the overall sample. In addition, friends were by far the largest source of abuse relating to language and culture (nearly one-third).
Seeking help
Key messages

Introduction
This chapter examines the actions people take in response to elder abuse. It sets out the extent to which participants in the SOP who experienced abuse sought assistance in addressing it. A wide range of potential sources of help, from informal (family, friends) to formal (police, lawyers) is considered. The discussion sets out the nature of the assistance sought and whether or not the person considered it to be effective. This topic is also considered on the basis of the SGC findings, with the analysis examining whether the SGC participants who had concerns about elder abuse in relation to someone known to them had sought assistance.
The research aims that this chapter addresses are:
- to examine actions taken by people who have been impacted by abuse in response to their experiences
- to examine their views on whether these actions have been effective in stopping the abuse.
The first section in this chapter sets out SOP findings on the extent to which help and advice is sought in relation to elder abuse. The second section examines SOP findings on actions taken in relation to elder abuse and participants' assessments of the effectiveness of these actions. The last part of the chapter examines what actions SGC participants took to address concerns about elder abuse.
Responses to abuse: Survey of Older People
Prior research demonstrates that help seeking is uncommon among those who experience elder abuse (e.g. Acierno et al., 2020; Burnes et al., 2019b; Dominguez et al., 2019). A systematic review by Dominguez and colleagues (2019) concluded that 'some victims only seek help when the abuse is perceived as unbearable or they fear for their safety' (p. 1). Neglect is a particularly under-reported form of elder abuse (Storey, 2020), consistent with the findings set out in the following sections. This section examines the extent to which older people who experienced elder abuse sought help or advice from a third party (formal or informal) and took any actions to stop abusive behaviours. While seeking help and advice and taking actions to stop elder abuse were examined in separate questions in the survey, they may overlap to some extent in practical terms.
Seeking help and advice
Figure 8.1 sets out findings on the proportion of participants in the SOP who reported experiencing abuse in the previous 12 months and also reported that they sought help in relation to the abuse. The analysis demonstrates that the majority (62%) of people who reported experiencing abuse did not seek help or advice from third parties.
Just over one-third (36%) reported that they had sought help or advice from a third party in relation to their experience. An additional 8% experienced more than one subtype of abuse and sought help for one or more of the subtypes rather than all the subtypes (data not shown).
Figure 8.1: Survey of Older People: Whether help or advice sought by persons who experienced each subtype of elder abuse in the previous 12 months
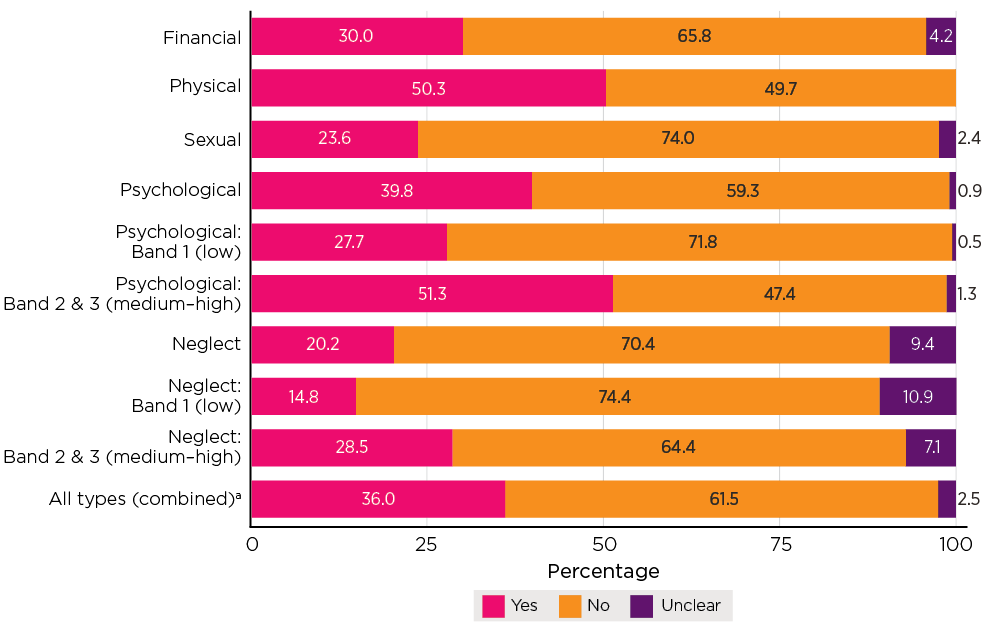
Notes: Weighted statistics and unweighted sample sizes (in order of bars, n = 158, 127, 87, 843, 425, 418, 208, 130, 78, 1,423). Excludes persons who answered the questions and who were not considered as having experienced a relevant type of abuse by definition (see chapter 5). a Where a participant experienced two or more subtypes of abuse, the report for each subtype was included; that is, a participant could have multiple records.
Responses for particular subtypes of abuse
Figure 8.1 shows the extent to which SOP participants sought help or advice from a third party in relation to specific subtypes of abuse. The findings indicate considerable variation in the extent to which help was sought for the various abuse subtypes.
Help was most likely to be sought in relation to physical abuse (50%) and least likely to be sought in relation to neglect (20%). For neglect in the low range, only 15% of those who experienced it sought help, compared with 29% in the medium to high ranges.
Two-fifths of the people who experienced psychological abuse sought help, with just over a quarter (28%) seeking help for psychological abuse in the low range and just over half (51%) in the medium-to-high range seeking help.
Three in 10 people who experienced financial abuse sought help. Help for sexual abuse was sought less often, with just under a quarter of those who reported experiencing sexual abuse also saying they sought help or advice. This contrasts with evidence showing that 50% of women in the general population who experienced sexual assault sought help and advice (AIHW, 2020).
What type of help was sought?
People who indicated seeking help for abuse experiences were asked which of a range of possible sources of help they turned to. These sources ranged from informal (family and friends) to formal, including police, medical professionals and lawyers. Table 8.1 shows the extent to which different types of help were sought, overall and according to different subtypes of abuse.
| Source of help/advice | Financial (%) | Physical (%) | Sexual (%) | Psychological (%) | Neglect (%) | All subtypesa (%) |
|---|---|---|---|---|---|---|
| A family member | 52.7 | 32.8 | 37.3 | 40.1 | 50.0 | 41.0 |
| A friend | 53.7 | 28.1 | 34.2 | 43.8 | 21.8 | 40.5 |
| Neighbour | 18.5 | 11.3 | 18.1 | 9.7 | 8.8 | 10.9 |
| Professional carer or social worker | 34.4 | 25.9 | 12.2 | 21.8 | 33.4 | 24.1 |
| Other care provider or community service | 0.0 | 4.4 | 0.0 | 1.0 | 11.3 | 2.2 |
| GP or nurse | 27.8 | 22.1 | 35.0 | 29.8 | 37.0 | 29.4 |
| Hospital emergency department | 5.2 | 4.1 | 0.0 | 2.6 | 12.3 | 3.7 |
| Other medical professional | 0.0 | 0.0 | 0.0 | 0.1 | 0.0 | 0.1 |
| Mental health professional | 2.7 | 8.9 | 10.2 | 16.6 | 2.0 | 12.9 |
| The police | 25.2 | 36.4 | 0.0 | 15.2 | 3.9 | 17.4 |
| Helpline | 6.4 | 5.4 | 0.0 | 5.7 | 1.9 | 5.3 |
| Local council or authority | 6.1 | 8.6 | 0.0 | 7.2 | 4.2 | 6.8 |
| Lawyer | 33.2 | 11.1 | 0.0 | 16.5 | 0.0 | 15.4 |
| Your religious group | 8.7 | 2.8 | 3.3 | 6.0 | 1.7 | 5.4 |
| Government department or service | 9.2 | 0.0 | 0.0 | 2.3 | 5.3 | 2.8 |
| Someone from work | 0.0 | 0.5 | 4.2 | 9.0 | 0.0 | 6.2 |
| Bank | 7.3 | 0.6 | ||||
| Other | 3.3 | 8.7 | 4.6 | 6.5 | 3.5 | 6.2 |
| Number of participants (base) | 59 | 65 | 20 | 331 | 41 | 516 |
Notes: Based on weighted data. Unweighted sample sizes. Multiple responses and sum may exceed 100.0%. Excludes persons who answered the questions and who were not considered as having experienced a relevant type of abuse by definition (see chapter 5). a Where a participant experienced two or more subtypes of abuse, a report for each subtype was included as a separate case; that is, a participant may have multiple records.
The seven most common sources of help overall were family members (41%) and friends (41%), followed by a GP or nurse (29%), a professional carer (24%), the police (17%) and lawyers (15%).
The type of assistance sought varied according to the abuse type, although help seeking from family and friends was consistently high compared to other sources (Table 8.1). The most common sources of help by abuse subtype was:
- With 30% of those experiencing financial abuse seeking help (Table 8.1), the most common forms of help sought were: friends (54%), family members (53%), lawyers (33%), a GP or nurse (28%) and the police (25%).
- With 50% of those experiencing physical abuse seeking help (Table 8.1), the most common forms of help were: the police (36%), family (33%), friends (28%), a professional carer or social worker (26%) and a GP or nurse (22%). It is notable that this is the only time police or any other source of help exceeded the proportion of family members or friends.
- With 24% of those who experienced sexual abuse (Table 8.1) seeking help, the main sources of help were: a family member (37%), a GP or nurse (35%) a friend (34%) and a neighbour (18%). It is notable that police were not a source of help at all for the sexual abuse group (see further chapter 14).
- With 40% of those who experienced psychological abuse seeking help, the most frequent sources of help were: a friend (44%), a family member (40%), a GP or nurse (30%), a professional carer or social worker (22%), a mental health professional (17%), a lawyer (17%) and the police (15%).
- With neglect the most under-reported form of abuse (20%, Table 8.1), the most common sources of help were: a family member (50%), a GP or nurse (37%), a professional carer or social worker (33%) and a friend (22%).
Actions to stop the abuse
Table 8.2 shows whether SOP participants who experienced elder abuse took any actions to stop the abuse from happening again, or had actions taken on their behalf, regardless of whether they reported seeking help or advice from a third party. The possible options for taking action ranged from informal (e.g. speaking to the person) to formal (e.g. seeking legal advice). The range of actions asked about mostly involved taking some form of positive action. Two actions involved more passive responses, either avoiding the person or withdrawing from social contact.
Across the board, actions were taken to address the abuse in the majority of cases (82%), with variations in the proportion who took action according to abuse subtypes (e.g. 63% in relation to neglect and 94% for physical abuse). Notably, informal direct action (speaking to the person) was the most common form of action (53%). In relation to financial abuse, this proportion was 59%. It was even lower in relation to neglect at 37%.
The proportions who took passive approaches (avoiding the person or withdrawing from social contact) raise some concerns given the frequency with which family members were identified as perpetrators (see chapter 6). Each of these actions could be seen to have adverse consequences that may compound the negative impact of the abuse, particularly if avoiding the perpetrator means loss of contact with other family and social connections. Avoiding the perpetrator was a frequent response, applying to 42%. Lower proportions indicated they withdrew from social contact more generally (13%), a response that raises even greater concerns about the impact of social isolation on wellbeing.
Table 8.2 details the actions taken according to the five abuse subtypes, with the final column depicting the proportion of people who took the particular actions across all abuse subtypes.
Key aspects of the findings are:
- For financial abuse, the proportions taking direct action by speaking to the person were among the highest (59%). Another common action is breaking contact with or avoiding the person (30%). Seeking legal advice was most common for this abuse type compared with other abuse types (14%).
- For physical abuse, speaking directly to the person (61%) and breaking contact with the person (54%) were the most frequent responses. The other passive response - stopping going out - was also highest for this abuse type at 20%. Notably, seeking formal assistance of various types was among the highest for this abuse type, with 21% indicating a professional spoke to the perpetrator, 13% seeking legal advice and 10% obtaining a personal protection order.
- For sexual abuse, direct action by speaking to the person was most common (58%) but breaking contact with the person was also very common at 48%. Seeking legal protection through advice (1%) or a personal protection order (1%) was rare.
- For neglect, speaking directly to the person was the most common action (48%). However, compared to other abuse subtypes, this action was taken less often. The passive approaches (stopping going out: 14% and breaking contact: 13%) were the next most common responses.
- For psychological abuse, the direct action of speaking to the person was also most frequent, but lower at 52% compared with the other abuse subtypes. Breaking contact with the person was almost as common at 49%. Seeking assistance from an intermediary to speak to the perpetrator was more common for psychological abuse than for any other abuse type (24%).
| Action taken | Financial (%) | Physical (%) | Sexual (%) | Psychological (%) | Neglect (%) | All subtypesa (%) |
|---|---|---|---|---|---|---|
| I spoke to the person | 59.3 | 60.5 | 57.9 | 51.6 | 47.7 | 53.0 |
| A family member or friend spoke to the person on my behalf | 15.3 | 20.1 | 4.6 | 24.0 | 11.5 | 19.9 |
| A professional (social worker, doctor, nurse) spoke to the person on my behalf | 8.4 | 21.0 | 2.4 | 9.5 | 5.1 | 9.4 |
| I sought mediation or counselling | 10.6 | 9.8 | 3.7 | 11.6 | 4.5 | 9.9 |
| I sought out a legal advice service | 14.1 | 12.8 | 0.7 | 10.0 | 0.8 | 8.9 |
| I broke contact with or avoid the person involved | 29.9 | 54.4 | 47.5 | 48.5 | 12.9 | 41.7 |
| I stopped going out or withdrew from social life in general | 6.0 | 20.3 | 9.0 | 13.7 | 13.7 | 13.3 |
| A restraining order or safety order was made against the person | 4.4 | 9.5 | 0.7 | 3.8 | 0.9 | 3.8 |
| At least one action taken | 78.6 | 93.3 | 84.1 | 85.2 | 62.9 | 81.9 |
| Number of participants (base) | 158 | 127 | 87 | 843 | 208 | 1,423 |
Notes: Based on weighted data. Unweighted sample sizes. Multiple responses and sum may exceed 100.0%. Excludes persons who answered the questions and who were not considered as having experienced a relevant type of abuse by definition (see chapter 5). a Where a participant experienced two or more subtypes of abuse, a report for each subtype was included as a separate case; that is, a participant may have multiple records.
Were the actions effective?
The SOP also assessed the effectiveness of actions taken in response to abuse in two ways. Participants were asked whether the action taken was effective, with yes or no response options (if the participant had taken multiple actions, the question was directed to one specific action, which was randomly selected). If they indicated that the action was ineffective, they were offered the opportunity to explain why and verbatim responses were recorded.
The findings based on the yes/no assessments of effectiveness are depicted in Figure 8.2. The majority of elder abuse victims who took actions felt their actions were effective in stopping their experience from happening again (55-66%) regardless of the subtype of abuse. The proportions of actions that were reported as being effective were similar across the five subtypes of abuse, though it appeared that effectiveness of actions taken was slightly lower for financial abuse than for other types of abuse (55% vs 58-66%).
The fact that substantial minorities indicated the actions were not effective also merits attention. Particularly high proportions provided negative responses for actions taken for financial abuse (37%), psychological abuse (35%) and physical abuse (34%). More than a quarter provided negative evaluations for neglect (29%) and sexual abuse (27%). The analysis of the qualitative data presented in the next section sheds light on the reasons behind these responses.
Figure 8.2: Survey of Older People: Proportion of participants reported action taken was effective by type of abuse
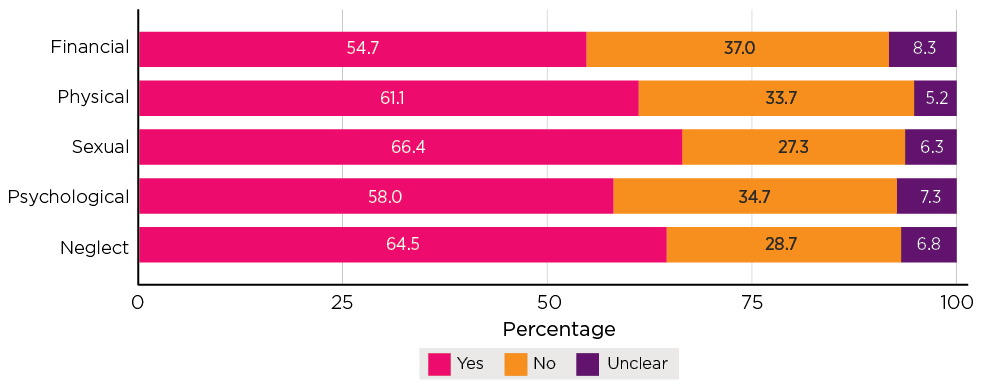
Notes: Based on weighted data. Unweighted sample sizes (in order of bars, n = 129, 115, 78, 717, 129). Excludes persons who answered the questions and who were not considered as having experienced a relevant type of abuse by definition (see chapter 5).
Qualitative insights
This section sets out further insights into participants' views of the effectiveness of their actions in stopping the abuse. This analysis is based on responses to an open-ended question that was asked of participants who said they had taken action to stop the abuse. The question was 'was/were the actions effective?' The responses provide insight into both effectiveness and lack of effectiveness. These are qualitative and reflect the responses of participants who chose to answer the question. They do not reflect the experiences of all participants.
Effective responses
Substantial proportions of participants in the SOP who had provided extended responses about the action taken following the experience of abuse, described the action as effective.
Around half of these participants described the action taken in response to financial abuse to be effective (n = 63/129, 49%).
Most of the participants described the action taken with respect to each of the other forms of abuse as effective (physical abuse: n = 71/115, 62%; sexual abuse: n = 44/78, 56%; psychological abuse: n = 34/71, 48%;13 neglect: n = 81/129, 63%).
The majority of the participants who described taking effective action with respect to sexual abuse were women (n = 36).
Discussions with the perpetrator
Some older people described how direct conversations with the perpetrator about the abusive behaviour were effective, often because the perpetrator was receptive to the concerns being raised (financial abuse: n = 29/63; physical abuse: n = 21/71; sexual abuse: n = 15/44; psychological abuse: n = 14/34; neglect: n = 54/81).
In relation to the raising of concerns about sexual abuse, in particular, some participants described undertaking these discussions with the perpetrators (or their partners) in a public setting, with the perpetrators' concern for their reputation identified as supporting the effectiveness of these direct discussions.
Raising concerns about neglect in direct discussions was also described by some participants as enabling any misunderstanding or underlying issues to be addressed. Some of these participants described how their discussions provided an opportunity to reach a compromise arrangement in relation to their care needs, with some also acknowledging constraints on the other party (n = 22).
Some participants described how other people or professionals had spoken with perpetrators on their behalf with positive effect (financial abuse: n = 5/63; physical abuse: n = 12/71; neglect: n = 9/54). In some instances, having another person raise the concerns with the perpetrator helped them to see the effect of their abusive behaviour.
The extended responses also highlighted the effectiveness of engaging in discussions where they provided an opportunity to identify and address underlying issues, including those requiring therapeutic or other support.
The data also indicate that older women were more likely to describe how they achieved an effective outcome when concerns related to financial abuse or physical abuse were raised in direct discussions with the perpetrator (financial abuse and physical abuse: n = 20) as compared to older men (financial abuse: n = 14; physical abuse: n = 13).
However, speaking directly with a perpetrator was not without risk. For example, one participant described their discussions with the perpetrator as leading to their assault and hospitalisation; albeit, that this event operated as the catalyst to stop the physical abuse that they had been experiencing.
Accessing services and supports
Some participants described how engaging in mediation, counselling or obtaining legal advice or support was an effective response to the abuse (e.g. financial abuse: n = 15/63; physical abuse: n = 13/71; neglect: n = 3/54).
In relation to counselling, participants described this as an effective step because it enabled them to receive therapeutic assistance to deal with their experience of abuse. Mediation was also described as effective where this provided an opportunity for facilitated discussions to address the older person's experience, and where perpetrators were described as genuinely engaging in the process and receptive to learning about and addressing their behaviour.
Obtaining legal advice and support was described as effective where it supported the older person to clearly communicate their views to the perpetrator and/or to take action to prevent further abuse. It is worth noting that the receipt of professional advice was also identified as an effective response when it clarified behaviour that had been interpreted as financial abuse. Taking legal action was also identified as an effective response where this involved obtaining restraining orders, prosecution for assault, evictions, a separation/divorce or legal action to prevent further access to financial accounts. Participants identified these actions as not only putting a stop to the abuse but also providing a deterrent going forward.
Withdrawing contact
Some participants described the withdrawal of their contact temporarily or permanently as an effective response to the abuse that they experienced (financial abuse: n = 15/63; physical abuse: n = 30/71; sexual abuse: n = 17/44; psychological abuse: n = 17/34; neglect: n = 10/54). For some, the withdrawal of contact operated as a circuit breaker, whereas for others, a complete withdrawal of contact was required to maintain the older person's safety.
Some participants taking this action described how this made them feel more comfortable as they no longer had to engage with the perpetrator. For other participants who described their withdrawal of contact as effective, this nevertheless also meant withdrawing from their social life, which may have had other negative consequences for the older person. Some participants who reported experiencing sexual abuse described, for example, how they would avoid close contact with the perpetrator in social settings. In these circumstances, avoiding close contact did not deprive them of their social engagement but was described as effective because the opportunity to perpetrate the abuse was no longer available.
Ineffective responses
A substantial number of participants providing extended responses in the SOP described the action taken in response to their abuse as ineffective (financial abuse: n = 49/129, 38%; physical abuse: n = 37/115, 32%; sexual abuse: n = 17/78, 22%; psychological abuse: n = 34/71, 48% neglect: n = 39/129, 30%).
In most of these cases, the participating older people reported speaking or attempting to speak with the perpetrator or that another person did so on their behalf (financial abuse: n = 39/49; physical abuse: n = 19/37; sexual abuse: n = 8/17; psychological abuse: n = 16/34; neglect: n = 26/39).
In these cases, the older participants described how these actions were not effective as the perpetrator was not receptive to the concerns being raised. Reasons included indifference or lack of understanding on the part of the perpetrator, perpetrators who were rigid in their views, who had unreasonable and undesirable personality traits or were suffering from substance abuse, mental health issues or cognitive conditions. In these circumstances, the perpetrators were not willing or able to acknowledge and address the concerns raised in the direct discussions, or to acknowledge or address underlying issues.
Participants also described attempts at counselling or mediation that were ineffective because the perpetrator would not listen, where this option did not address the pertinent issues or described unsatisfactory experiences obtaining legal advice and support or taking legal action (financial abuse: n = 10/49; physical abuse: n = 5/37; psychological abuse: n = 4/34).
In some cases, legal action was ignored or not understood by the perpetrator or restraining orders were flouted and did not prevent the perpetrator from reoffending.
For other participants, steps taken to withdraw from their relationship with the perpetrator or from their social engagement, more generally, were described as ineffective because they did not address the issues associated with the abuse or the abusive behaviour remained unchanged (financial abuse: n = 3/49; physical abuse: n = 12/37; sexual abuse: n = 9/17; psychological abuse: n = 14/34; neglect: n = 5/39). Attempts to withdraw were also described as ineffective where this led to estrangement from family or friendship groups and/or to social isolation, or where withdrawal of contact was unworkable in practice. Of note, where participants described their withdrawal from their social life as an ineffective response to physical abuse, this was, in fact, described as exacerbating their situation. In some instances, taking this action also meant that the older person did not receive the care that they required.
Responses to concerns about abuse: Survey of the General Community
As set out in chapter 5, 17% of participants in the Survey of the General Community indicated they held concerns for someone known to them in relation to elder abuse. These participants were also asked whether they took action in relation to the concerns and, if they did, what these actions were. A little over one half (53%) reported they took an action in response to these concerns (data not shown). Eight possible response options were provided, including a catchall response option (Figure 8.3). The response options are similar to those used in the Survey of Older People (above), though less detailed.
Consistent with the findings in the SOP, the most common responses are the informal ones. The SGC participants with concerns most frequently spoke to the person causing the concerns (67%), or another family member or friend spoke to the person causing the concerns (61%).
Passive responses - breaking contact with or avoiding the source of the concerns - were also common, at 38%.
Formal intervention was reported by higher proportions of SGC participants compared with SOP participants. In the SGC, 21% reported seeking legal advice, compared with 9% in the SOP. Mediation or counselling was also reported more often in the SGC compared with the SOP (14% cf. 10%). SGC participants were also more likely to report intervention by medical or social work professionals (24% in the SGC cf. 9% in the SOP).
These findings may indicate that abuse of a degree that comes to the attention of a third person may be of a greater severity. It may also suggest that third parties could be less cautious (or fearful) about seeking help.
Figure 8.3: Survey of the General Community: Where an action was taken in response to concerns, what action was taken, by gender
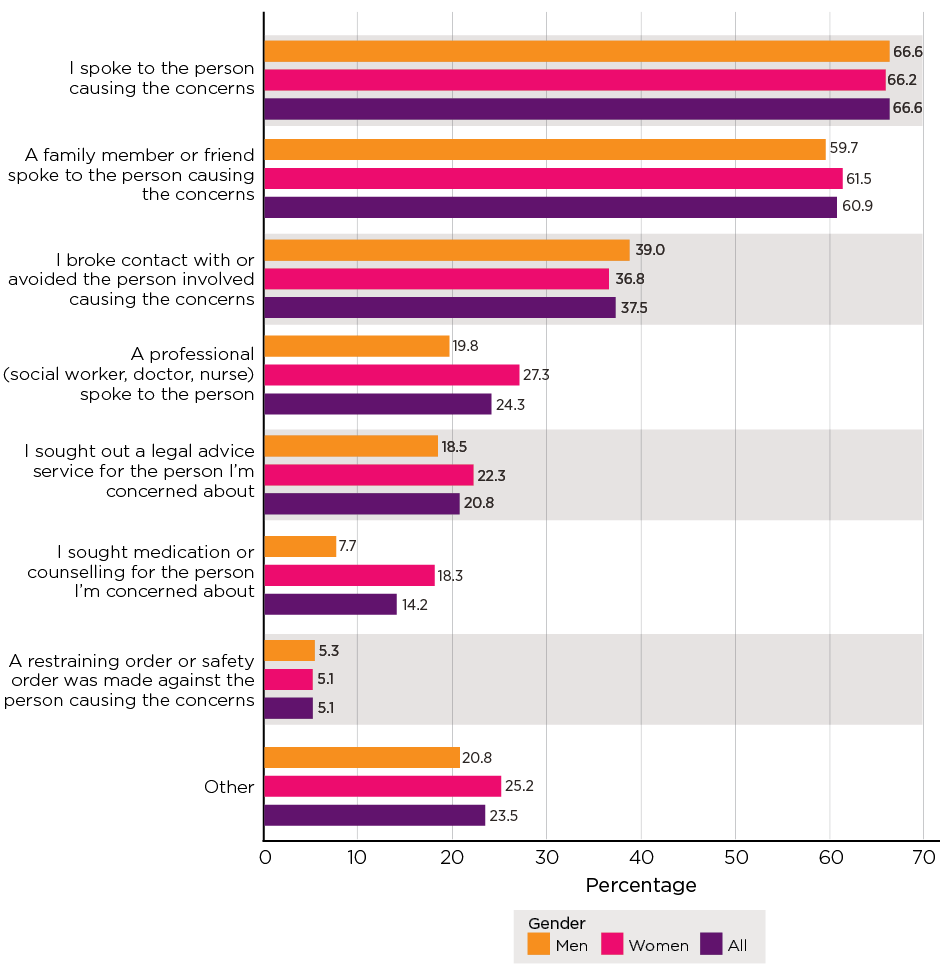
Notes: Percentages do not sum to 100.0% as multiple options could be selected. Four observations where gender was reported as 'Other' not reported.
Summary
This chapter has examined actions taken and help-seeking responses in relation to elder abuse. The findings indicate that help seeking from a third party was not a majority response on the part of older people who experience elder abuse, with six in 10 people who experienced elder abuse not seeking help.
The most common forms of abuse for which help was sought from a third party were physical abuse, financial abuse and psychological abuse. Help was least likely to be sought for neglect and sexual abuse. Notably, reliance on criminal justice responses for sexual abuse was almost absent.
Where either help or advice was sought, or actions were taken to stop the abuse, the most commonly reported avenues were informal. Help and advice was most commonly sought from family and friends. Older people most frequently took it upon themselves to stop the abuse by speaking to the perpetrator.
A common means of stopping the abuse was breaking contact with or avoiding the perpetrator (42%). In some cases, a more significant withdrawal from social life was reported (13%). These responses raise particular concerns, as they may have adverse consequences for the older person's contact with other family, friends and support networks. They also do not address perpetrator accountability.
Help and advice were sought more often from the helping professions (social workers, medical professionals) and less often from lawyers and police. Actions to stop abuse involving quasi-legal services (mediation or counselling: 10%), legal advice (9%) or personal protection orders (4%) were not particularly common.
Where a third party had concerns about elder abuse, the SGC findings confirm that informal options for addressing the abuse (speaking with the person causing the concerns) were the most common. Passive responses were also reported by more than one-third of SGC participants (38%).
Notably, substantial minorities of older people who did report taking action to stop the abuse considered these actions ineffective.
It is concerning that help and advice were sought only by a minority, that passive avoidant actions to stop abuse were adopted by more than half of those who experienced abuse and that actions to stop abuse are evaluated as ineffective by between a quarter and a third of older people who experience abuse.
These findings point to a need for an assessment of existing options for addressing elder abuse in general, as well as particular subtypes, and whether these options are accessible, appropriate and adequate.
Self-assessed seriousness
Key messages
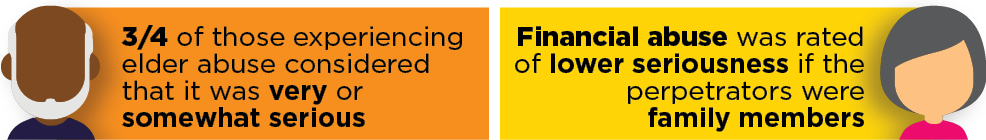
Introduction
This chapter further examines elder abuse from the perspective of whether people who experience it consider it is serious. First, the chapter sets out responses on how serious the abuse was from the perspective of those who experience it. Second, the extent to which older persons' assessments on seriousness varied according to selected characteristics is examined. This chapter also examines the link between self-assessed seriousness and help seeking.
Self-assessed seriousness
SOP participants who experienced abuse were asked to indicate how serious the abuse was for them. These ratings demonstrate the participant's subjective assessment of how serious the abuse was, based on their understanding of the term 'serious'. Response options were 'very serious', 'somewhat serious' and 'not serious'. As discussed in chapter 5, recent international research demonstrates that subjective seriousness ratings may be influenced by the complex psychological dynamics associated with elder abuse (e.g. Burnes et al., 2019a).
Table 9.1 and Figure 9.1 present findings on 'seriousness' assessments. Overall, most participants assessed the abuse as either very serious (28%) or somewhat serious (42%). Just over a quarter assessed the abuse as not serious. In relation to the five subtypes of abuse, noteworthy findings are:
- Physical abuse was most likely to be rated as very serious (39%) or somewhat serious (40%), with only 20% rating it as not serious.
- Psychological abuse was the next most likely to be rated as very serious (32%) or somewhat serious (46%), with only 21% rating it as not serious. Even at the low score (see chapter 5) range, nearly one in five participants indicate the abuse was serious, with half nominating it as somewhat serious. In the medium to high score range, 44% said the abuse was very serious and 41% somewhat serious.
- Financial abuse attracted the third strongest seriousness ratings, with 30% rating it as very serious and 35% as somewhat serious. Close to a third rated it as not serious.
- Sexual abuse was most likely to be rated as somewhat serious (39%) or not serious (41%).
- The lowest seriousness assessments were accorded to neglect, with almost half (48%) of participants indicating their experience was not serious. Not serious assessments were accorded to 57% of experiences in the low score band and 33% in the medium/high score band. Three in 10 participants in the low score band assessed their experience as somewhat/moderately serious and nearly four in 10 chose this assessment for experiences in the medium/high band.
Figure 9.1: Survey of Older People: Reports of seriousness of main perpetrator's behaviour, persons who experience each subtype of elder abuse in the previous 12 months
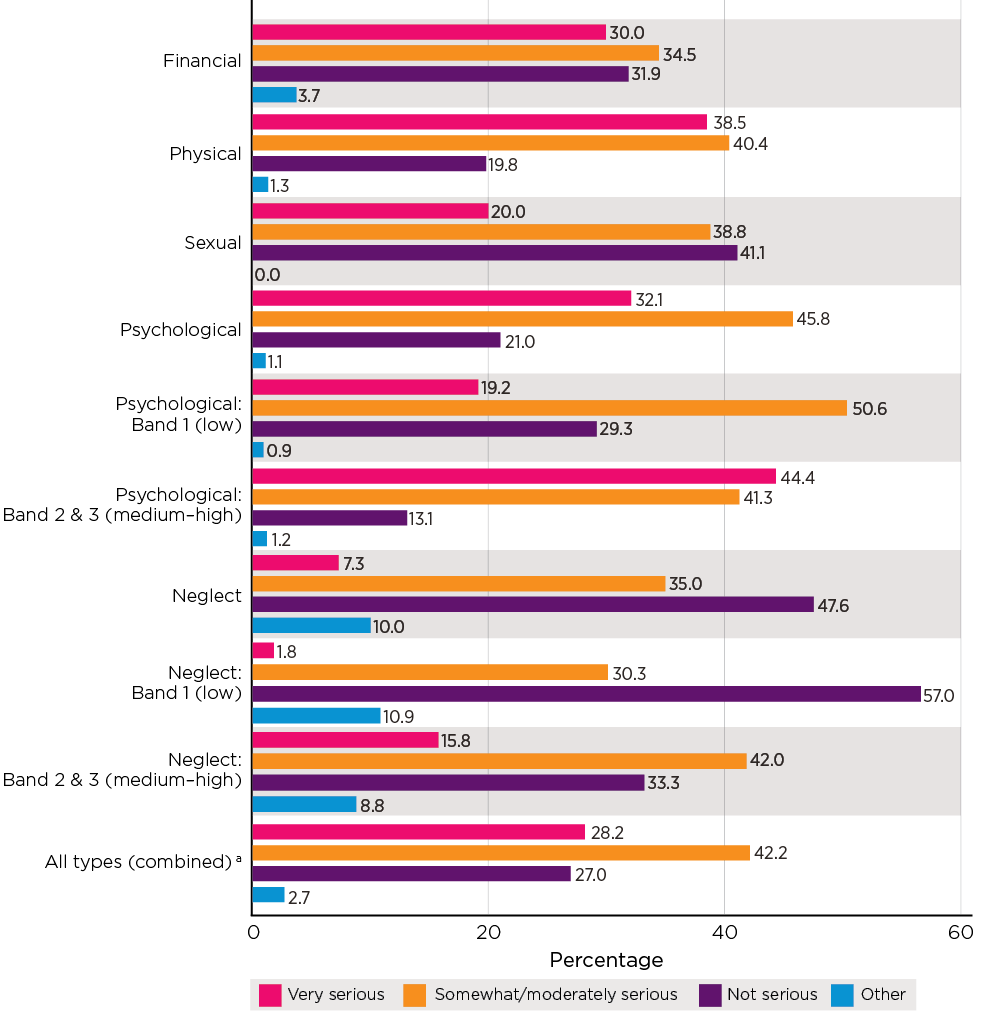
Notes: Weighted statistics and unweighted sample bases. a Where a participant experienced two or more subtypes of abuse, the report for each subtype was included; that is, a participant could have multiple records.
| Abuse type | Very serious (%) | Somewhat/moderately serious (%) | Not serious (%) | Other (%) | Total (%) | Number of participants (base) |
|---|---|---|---|---|---|---|
| Financial | 30.0 | 34.5 | 31.9 | 3.7 | 100.0 | 158 |
| Physical | 38.5 | 40.4 | 19.8 | 1.3 | 100.0 | 127 |
| Sexual | 20.0 | 38.8 | 41.1 | 0.0 | 100.0 | 87 |
| Psychological | 32.1 | 45.8 | 21.0 | 1.1 | 100.0 | 843 |
| Band 1 (low) | 19.2 | 50.6 | 29.3 | 0.9 | 100.0 | 425 |
| Band 2 & 3 (medium - high) | 44.4 | 41.3 | 13.1 | 1.2 | 100.0 | 418 |
| Neglect | 7.3 | 35.0 | 47.6 | 10.0 | 100.0 | 208 |
| Band 1 (low) | 1.8 | 30.3 | 57.0 | 10.9 | 100.0 | 130 |
| Band 2 & 3 (medium - high) | 15.8 | 42.0 | 33.3 | 8.8 | 100.0 | 78 |
| All types (combined) a | 28.2 | 42.2 | 27.0 | 2.7 | 100.0 | 1,423 |
Notes: Weighted statistics and unweighted sample bases. a Where a participant experienced two or more subtypes of abuse, the report for each subtype was included; that is, a participant could have multiple records.
Self-assessed seriousness and selected characteristics
This section sets out more detailed findings on how assessments of seriousness varied according to selected demographic characteristics, relationships with perpetrators and living arrangements. Table 9.2 shows findings on seriousness assessments for each of the five subtypes of abuse according to gender, age, whether the participants lived with the perpetrator and how the perpetrator was related to them. Responses of very serious and moderately serious were combined due to small numbers in subgroups across most abuse subtypes. It should be noted that this analysis was based on small sample sizes and findings are not statistically significant. However, the findings support further understanding of the dynamics of elder abuse, particularly comparisons of how participants view abuse perpetrated by family members as compared to friends. The main points of the analysis are:
- Women were more likely than men to rate their experience as serious in relation to financial abuse (73% cf. 55%), physical abuse (86% cf. 72%) and sexual abuse (64% cf. 48%) but women were slightly less likely to rate their experience of neglect as serious. The reports of psychological abuse as serious were similar between men and women.
- Older people aged 75 years and older were less likely than their younger counterparts to rate their experience as serious for two subtypes - financial abuse (58% cf. 68%) and physical abuse (64% cf. 84%). There were no apparent patterns in self-assessed seriousness by age for psychological abuse.
- For financial abuse, older persons who lived with the perpetrator were less likely than those who did not live with the perpetrator to rate their experience as serious (71% cf. 47%).
- In addition, older people were less likely to consider financial abuse as serious if the perpetrators were their spouse or adult children. Abuse by perpetrators who were other family members or friends (64%) attracted slightly higher seriousness ratings. Older people were most likely to rate financial abuse as serious if the perpetrators were not related to them (80%).
| Financial | Physical | Sexual | Psychological | Neglect | |
|---|---|---|---|---|---|
| Characteristics of older persons who reported abuse experience as serious | % | ||||
| Gender | |||||
| Males | 55.4 | 72.1 | 47.9 | 77.3 | 47.0 |
| Females | 72.8 | 85.9 | 64.0 | 78.4 | 39.9 |
| Age | |||||
| 65-74 | 68.2 | 84.4 | 57.7 | 79.3 | 42.2 |
| 75+ | 58.2 | 64.0 | 65.1 | 74.5 | 42.6 |
| Whether living with the perpetrator | |||||
| Yes | 46.6 | 76.0 | .. | 71.7 | 44.1 |
| No | 70.8 | 80.8 | .. | 81.1 | 48.4 |
| Relationship with the perpetrator | |||||
| Spouse/son, daughter a | 53.6 | 78.4 | .. | 81.2 | 41.7 |
| Other family member or friend b | 64.3 | 77.7 | 48.3 | 78.8 | 43.0 |
| Else c | 80.1 | 80.1 | 67.2 | 74.7 | 43.1 |
| Number of participants (base) | n | ||||
| Gender | |||||
| Males | 60 | 58 | 20 | 306 | 61 |
| Females | 98 | 68 | 66 | 535 | 146 |
| Age | |||||
| 65-74 | 94 | 86 | 68 | 551 | 118 |
| 75+ | 64 | 41 | 19 | 292 | 90 |
| Whether living with the perpetrator | |||||
| Yes | 40 | 30 | 4 | 131 | 75 |
| No | 96 | 80 | 76 | 623 | 115 |
| Relationship with the perpetrator | |||||
| Spouse/son, daughter | 67 | 34 | 9 | 227 | 99 |
| Other family member | 48 | 33 | 42 | 320 | 33 |
| Else | 43 | 60 | 36 | 296 | 76 |
Notes: Weighted statistics and unweighted sample bases. a Son and daughter refers to biological/adopted children. b Includes ex-partner/spouse, grandson/daughter, brother/sister, brother/sister (in-law), step-son/daughter, son/daughter (in-law), other family members, friend. c Includes neighbours, carers, service providers, acquaintance, others. Due to small numbers in the subgroups, data were not shown.
Self-assessed seriousness and help seeking
The discussion in chapter 8 showed that help seeking among victims of elder abuse varied according to elder abuse subtypes. The analysis set out in this section shows help-seeking behaviours are also linked to self-assessed seriousness. Table 9.3 shows the proportion of older people who reported having sought help according to their assessments of seriousness for each subtype of elder abuse.
Regardless of the subtype, participants' seriousness assessments were related to help seeking, with higher seriousness assessments related to greater help seeking from a third party. However, even when abuse was rated as very serious, sizable proportions of participants did not seek help. This was highest for sexual abuse and neglect, with almost three in 10 participants who assessed sexual abuse as very serious and almost four in 10 participants who assessed neglect as very serious not seeking help. The sample sizes for sexual abuse and neglect are not large and these insights should be considered exploratory.
In relation to the other abuse subtypes, the main points are:
- The majority of financial abuse victims who rated their experience as very serious had sought help (61%), while just over one-quarter (28%) of those who rated their financial abuse as somewhat serious had sought help. Conversely, almost four in 10 with very serious ratings and more than two-thirds with somewhat serious ratings did not seek help.
- Consistent with the findings in chapter 8, help seeking was most likely for physical abuse, with 66% of participants who rated the abuse as very serious, 39% as somewhat serious and 47% as not serious seeking help. It is notable, however, that one-third with very serious ratings and more than four in 10 with somewhat serious ratings did not seek help. In addition, the proportion of elder abuse victims with 'not serious' assessments who sought help from a third party was higher for physical abuse than for other subtypes. This may reflect general attitudes toward elder abuse behaviours, with behaviours relating to physical abuse more recognised as elder abuse than behaviours relating to other subtypes (see chapter 12). Therefore, the fact that it happened may cause concerns, even if it was not self-assessed as serious.
- For psychological abuse, about six in 10 participants with very serious ratings and four in 10 participants with somewhat serious ratings sought help.
| Abuse type | Very serious | Somewhat/ moderately serious | Not serious |
|---|---|---|---|
| Sought help from a third party | % | ||
| Financial a | 60.9 | 27.8 | 4.2 |
| Physical | 65.7 | 38.7 | 47.1 |
| Sexual | 28.8 | 16.1 | |
| Psychological a | 59.0 | 39.7 | 11.9 |
| Neglect | 36.9 | 9.7 | |
| Number of participants (base) | n | ||
| Financial | 53 | 54 | 47 |
| Physical | 52 | 48 | 25 |
| Sexual | 64 | 33 | |
| Psychological | 268 | 384 | 178 |
| Neglect | 84 | 104 | |
Notes: Weighted statistics and unweighted sample bases. a The differences in help seeking across self-assessed seriousness groups were statistically significant based on a design-based F test (p < .05)
Summary
This chapter has examined participants' views on whether their experience of elder abuse was serious, as well as setting out characteristics that were associated with higher or lower seriousness assessments. It also examined connections between self-assessed seriousness and help seeking.
Overall, most participants rate their experience of abuse as very serious (28%) or somewhat serious (42%). The relative distribution of seriousness ratings in this study is broadly consistent with those in the UK study, in which 33% rated the abuse as very serious, 43% as serious and 24% as not serious (O'Keeffe et al., 2007).
The two abuse subtypes most likely to be accorded a higher range of seriousness ratings are physical abuse (39%) and psychological abuse (32%). Seriousness ratings for financial abuse are relatively evenly distributed across the three seriousness bands.
Neglect attracts the lowest seriousness assessments with over half (58%) of participants rating their experience as not serious.
The analyses suggests that older age and living with the perpetrator were associated with lower self-assessed seriousness for financial and physical abuse. Older people were less likely to rate experiences of financial abuse as serious if they lived with the perpetrator, or if the perpetrator was a family member. Men were less likely than women to rate their financial, physical and sexual abuse as serious.
For all the subtypes of elder abuse, the more seriously older persons rated their elder abuse experience, the more likely they reported having sought help. This pattern was less apparent for physical abuse. Physical abuse victims with not serious assessment were more likely to seek help, compared to victims with not serious assessments of other subtypes. It is worth noting that the findings are based on small samples for all subtypes except psychological abuse, and these insights should be considered exploratory.
Legal arrangements
Key messages

Introduction
This chapter examines legal and financial arrangements involving participants in the SOP and the SGC. Specifically, it sets out findings in relation to wills, powers of attorney and family agreements (these involve arrangements where an interest in an asset, or another financial arrangement, may be exchanged for care, possibly including a shared property arrangement). The discussion considers the extent to which older people who adopted these legal mechanisms reported experiencing financial, physical, sexual or psychological abuse or neglect.
The discussion in this chapter relates to the following aspects of the research aims:
- Measure the proportion of people who provide assistance to older family members or friends and the types of assistance they provide in relation to financial transactions and decision making.
- Assess the extent to which older Australians have adopted advance planning behaviours.
The following socio-demographic characteristics are included in the analyses: gender; age; religion; marital status; whether the participant has children (biological, adopted or step); the participant's household composition; education; the applicable category according to the socio-economic index for areas (SEIFA); whether the participant lives in a major city, inner regional area or outer regional area; their health status and whether they require assistance some or all of the time for one or more activities. In this chapter, 'advance planning' is used as a general term to describe the three mechanisms considered rather than referring specifically to advance care directives (see e.g. ALRC, 2017, p. 162). It is noted that the findings based on the SOP do not reflect the experiences of older people who had insufficient cognitive capacity to participate in the survey, and who may be at greater risk of experiencing the abuse or misuse of legal instruments.
This chapter has four parts. The first part presents findings relating to wills; specifically, who has a will and the prevalence of abuse for people with and without wills. The second section presents data relating to enduring powers of attorney. It considers data on who has made an enduring power of attorney and who has been appointed as an attorney, record-keeping practices by appointees and the prevalence of abuse for those with an enduring power of attorney. The final section presents data relevant to family agreements. It looks at who enters these agreements and the prevalence of abuse for those with a family agreement. The final section sets out some relevant points from recent commentary and analysis in relation to proposals for greater protection for each of the three types of arrangements considered in this chapter.
Advance planning among older people
This section sets out the proportions of older people who reported having a will and the socio-demographic characteristics of the older people who reported having this advance planning mechanism in place. It is notable that chapter 5 reported findings that of the 2.1% of the sample who reported experiencing financial abuse, 9.5% reported being pressured to make or change a will. This discussion is followed by an analysis of data relating to the experience of abuse by those who have a will and those without a will.
What is a will and is it common for older people to have wills?
Making a will is a key mechanism when engaging in estate planning. A will is a legal document that details what a person would like to happen with their property upon their death and provides instructions for a nominated person or organisation to distribute the property in accordance with the will. Making a will may operate as a protective factor against elder abuse where an older person is supported with independent financial and legal advice and where there is informed consent on the part of the older person. However, there are circumstances where making or revising a will may involve financial abuse or other forms of elder abuse, including psychological abuse where the older person is unduly influenced or coerced in to making or revising the arrangements specified in their will (ALRC, 2017).
Participants in the SOP were asked whether they had executed a will. Consistent with the findings of Tilse, Wilson, Settlerlund, and Rosenman (2005), Table 10.1 shows that the vast majority of older people (88%) reported having a will at the time of interview. Slightly more women than men indicated having a will. Of note, three-quarters of these participants had discussed their will with someone in their family (data not shown in the table). Most older people who reported they did not have a will, nevertheless reported having had discussions with someone in their family about making a will (8% male; 7% female).
| Males (%) | Females (%) | Total (%) | |
|---|---|---|---|
| Whether currently have a will | |||
| Yes | 86.5 | 88.9 | 87.8 |
| No | 13.4 | 11.0 | 12.1 |
| No, but had a discussion with someone in family about making a will | 7.8 | 6.9 | 7.3 |
| No will and never had a discussion | 5.6 | 4.1 | 4.8 |
| Total a | 100.0 | 100.0 | 100.0 |
| Number of participants (base) | 2,747 | 4,241 | 7,000 |
Notes: Weighted statistics and unweighted sample bases. a Total includes a small number of not-stated cases (0.1%).
What is an enduring power of attorney and is it common for older people to appoint attorneys?
An enduring power of attorney is a legal document that enables a person to nominate a person or organisation that will make decisions about financial and/or personal matters if the person is unable to make these decisions for themselves. The person making the decision is the 'attorney' and their power to make decisions is 'enduring' because it endures or continues when the person granting the power is no longer able to make their own decisions.
Participants in the SOP were asked whether they had enduring powers of attorney in place. In this context, a noteworthy finding reported in chapter 5 was that of the 2.1% of the sample who reported financial abuse, none reported misuse of a power of attorney. Despite the absence of evidence of financial abuse being perpetrated this way in this study of community dwelling older people, concerns about abuse in this context are evident in some reports (see further below).
As noted above, the findings based on the SOP in this discussion do not reflect the experiences of older people who had insufficient cognitive capacity to participate in the survey, and who may be at greater risk of experiencing the abuse or misuse of legal instruments. For example, older people with dementia have been identified as particularly vulnerable to financial abuse perpetrated by people appointed under an enduring power of attorney (Miskovski, 2014).
Table 10.2 shows that just over half of older people (52%) indicated that they had granted an enduring power of attorney, with 49% of older males and 54% of older females answering in the affirmative. More than three-quarters of these participants reported that their current power of attorney was valid (i.e. can be used when needed) (86%), with the most common type of power of attorney dealing with both financial and medical matters (79%; 78% of male and 81% female). Of those older people who reported that they did not have a power of attorney, a minority reported having had discussions with their family about making a power of attorney (15%).
| Males (%) | Females (%) | Total (%) | |
|---|---|---|---|
| Whether have ever given an enduring power of attorney to someone? | |||
| Yes | 49.1 | 54.0 | 51.6 |
| No | 50.9 | 46.0 | 48.4 |
| No, but had a discussion with someone in family about making a power of attorney | 15.4 | 14.9 | 15.1 |
| No power of attorney and never had a discussion | 34.8 | 30.2 | 32.4 |
| No power of attorney, unclear discussion | 0.3 | 0.5 | 0.4 |
| Total a | 100.0 | 100.0 | 100.0 |
| Number of participants (base) | 2,747 | 4,241 | 7,000 |
| Persons with a power of attorney: Whether current power of attorney is valid (i.e. can be used if needed)? | |||
| Current power of attorney is active | 84.4 | 86.7 | 85.7 |
| Type of power of attorney b | |||
| Financial | 13.6 | 10.1 | 11.6 |
| Medical | 4.8 | 4.2 | 4.5 |
| Both | 77.7 | 80.5 | 79.3 |
| Has been used | 3.9 | 3.0 | 3.4 |
| Number of participants (base) b | 1,421 | 2,458 | 3,883 |
Notes: Weighted statistics and unweighted sample bases. a Includes a small number of participants who were unsure or non-responding (less than 1%). b A small proportion of participants (5%) did not know what type of power of attorney they had and these data are not shown in the table, and hence the sum of the three types is not 100%.
What are family agreements and how common are these agreements?
A family agreement is defined as an agreement to provide care to an older person in return for financial support or benefit (e.g. transfer of assets, property or finances) or bequest in a will. The ALRC reported a range of concerns about family agreements; in particular, that they can have 'serious consequences for the older person if the promise of ongoing care is not fulfilled, or the relationship otherwise breaks down' (ALRC, 2017, p. 203). Concerns have been raised in relation to family agreements as potential enablers of elder abuse, particularly where informal agreements and decisions are made typically without legal advice (Boersig & Illidge, 2018). In this context, it should be noted that of the 2.1% of the sample who reported experiencing financial abuse, 41.5% indicated they had been pressured into loaning or giving money, possessions or property (chapter 5). Further, chapter 11 reports an apparent association between receiving assistance with buying and selling a home as a form of assistance with financial activities and experiencing financial abuse for both men and women.
Participants in the SOP were asked whether they had a family agreement in place and whether the family agreement was written down. In contrast with the substantial proportions of older people who reported having a will or having an enduring power of attorney, Table 10.3 presents a markedly different picture in relation to family agreements, with only 3% of participating older people reporting that they had such an agreement. Just under two-thirds of these older people reported that their family agreement was in writing. No differences of note emerged for male or female older people; however, given the small numbers of participants with family agreements, the findings on this issue should be interpreted with caution.
| Family agreements | Males (%) | Females (%) | Total (%) |
|---|---|---|---|
| Family agreement a | |||
| Have a family agreement | 3.0 | 2.9 | 3.0 |
| Number of participants (base) | 2,747 | 4,241 | 7,000 |
| Persons with family agreements | |||
| The agreements were written down | 61.7 | 64.9 | 64.0 |
| Number of participants (base) | 86 | 125 | 213 |
Notes: Weighted statistics and unweighted sample bases. a Includes a small number of participants who were unsure or non-responding (approximate 1%).
Advance planning among the CALD subsample
It is notable that older people in the CALD subsample who reported speaking a language other than English at home were less likely to report having a will compared to those older people in the SOP who are not from a CALD background to a statistically significant extent (Table 10.4: 77% vs 90%). This finding is consistent with previous research relating to the use of wills as an advance planning mechanism (King, Wainer, Lowndes, Darzins, & Owada, 2011).
Consistent with the response pattern identified in relation to wills, older people in the CALD subsample were less likely to report having granted a power of attorney as compared to those in the non-CALD sample (see previous Table 10.2: 54% vs 41%). This difference was also statistically significant and is consistent with prior research focusing on intergenerational asset management that suggests a lack of knowledge or relevance, mutuality in asset management and informal financial arrangements among extended families as explanations for the lower uptake of formal advance planning mechanisms (King et al., 2011).
In contrast with the response pattern identified in relation to wills and powers of attorney, older people from the CALD subsample were more likely to report having a family agreement as compared to those participating in the SOP who spoke English only at home (Table 10.4: 4% vs 3%). However, this difference was not statistically significant.
| Type of advance planning, by gender | Speak English only at home (%) | Speak a language other than English at home (%) |
|---|---|---|
| Having a will | 90.2 | 76.5* |
| Having ever granted POA to someone | 53.8 | 41.2* |
| Having a family agreement | 2.7 | 4.2 |
| Number of participants (base) | 6,392 | 608 |
Notes: Weighted data and unweighted sample sizes. The asterisks indicate that the difference between the two groups is statistically significant based on a design based F-test (*p < 0.05)
Advance planning and socio-demographic characteristics
This section examines the extent to which older people in the SOP reported having a will, power of attorney or family agreement arrangement in place with regard to their socio-demographic characteristics, with a separate analysis for each of the three types of advance planning. As patterns in advance planning for men and women were largely similar, the following discussion focuses on patterns for all participants (men and women combined).
Who had a will?
Table 10.5 shows that the proportion of older people who reported having a current will rose with increasing age, from 80% of people in the 65-69 age group to 97% in the oldest age group of 85+ (97%). The extent to which older people reported having a will in place varied according to some other socio-demographic characteristics (see Appendix A, Table A10.4).
| Age (years) | Will (%) | POA (%) | Family agreements (%) | Number of participants (base) |
|---|---|---|---|---|
| *** | *** | *** | ||
| 65-69 | 80.2 | 32.8 | 1.1 | 1,697 |
| 70-74 | 88.5 | 42.2 | 3.2 | 1,927 |
| 75-79 | 90.5 | 48.0 | 2.8 | 1,525 |
| 80-84 | 92.9 | 55.5 | 4.2 | 1,105 |
| 85+ | 96.9 | 60.9 | 6.7 | 746 |
Notes: Weighted data and unweighted sample size. The asterisks indicate that the differences in reports of specific advance planning type across the age groups were statistically significant based on a design based F-test (*p < 0.05; **p < .01; ***p < .001)
Having a will in place appeared to be associated with cultural backgrounds. Indigenous people were less likely than the non-Indigenous groups to report having a will. A significantly lower proportion of older people who were born in non-English speaking countries had a will compared to those who were born in Australia or in English speaking countries (80% cf. 87-91%). Similar to this pattern, older people with no religion or a non-Christian religion were also associated with a lower proportion of having a will (data not shown). It is important to note that the religion variable is likely to reflect different cultural backgrounds rather than religiosity per se.
An older person's level of education also appeared to be associated with whether they reported having a will, with older people without a post-school education less likely to report having a will (Year 12: 85%; Below Year 12: 87%) than older people who had a certificate, diploma, trade (90%) or degree or higher (89%), to a statistically significant extent.
Older people who were either separated or divorced (77%) or had never married (76%) reported having a will in lower proportions than those who were married (90%), whereas older people who were widowed reported having a will to a greater extent (93%). These differences were statistically significant.
Older people living in inner or outer regional areas reported having a will in greater proportions than older people in major cities.
An older person's socio-economic status appears to be associated with whether or not they reported having a will. Those reporting the lowest socio-economic status are least likely to report having a will (80%) and those with the highest socio-economic status are most likely to report having a will (91%). The data show that reports of having a will increases with each socio-economic category to a statistically significant extent, although there were some variations in this pattern when the responses of male and female participants were analysed separately. Where older people reported owning their own home outright, they were also more likely to report having a will (93%) as compared with older people who owned their home with a mortgage (77%) and older people who rented private or public housing (62% and 48% respectively) or who had other housing arrangements (78%). The data also show an association between higher household income and having a will, with the increases in reports of having a will generally increasing with participants' household income, save for the highest income quartile. These variations associated with home ownership and household income were also statistically significant.
Who had a power of attorney?
Similar to the response pattern identified in relation to wills, the proportions of older people with an active power of attorney (i.e. can be used when needed) increases with each age category, to a statistically significant extent. There were greater proportions of people with an active power of attorney in the 70-74 years (42%), 75-79 years (48%), 80-84 years (56%) and 85+ (61%) age categories as compared to people in the 65-69 years age category (33%). (The extent to which older people reported having a power of attorney in place by other socio-demographic characteristics is shown in Appendix A, Table A10.5).
It appeared that advance planning involving a power of attorney was also associated with cultural backgrounds. A greater proportion of older people with an active power of attorney were born in Australia than overseas. A greater proportion of older people who were Christian reported having an active power of attorney (45%) as compared to those who observed no religion (41%) or were of non-Christian religions (44%) (data not shown). These differences with respect to country of birth and religion were statistically significant.
Consistent with the findings in relation to the association between level of education and reports of having a will, older people without a post-school education were also less likely to report having an active power of attorney than older people with a certificate, diploma, trade or degree.
In terms of living arrangements, consistent with findings relating to the living arrangements of older people with a will, older people who reported living in a household with any of their biological, step- or foster children were less likely to report having an active power of attorney (34% cf. 46%). Both male and female older people were more likely to report having an active power of attorney if they lived alone (49%) as compared to those living with a partner (43%), who were in turn more likely to have an active power of attorney than older people with other living arrangements (39%). Consistent with the response pattern for older people in relation to wills, both male and female older people who were either separated or divorced (35%) or had never married (37%) reported having an active power of attorney in lower proportions than those who were married (44%), whereas older people who were widowed reported having an active power of attorney to a greater extent (56%). These differences in relation to marital status were statistically significant.
In relation to geographical location, older people living in inner regional areas were more likely to report having an active power of attorney than older people in major cities (43% cf. 48%), with lower reports from older people in outer regional areas. The variations between inner regional areas and major cities were also statistically significant.
Consistent with the response patterns observed in relation to older people with wills, Table A10.5 shows that where older people indicated that they did not have children, they reported having an active power of attorney in greater proportions than those with biological or adopted children. A greater proportion of older people who reported having step-children also reported having an active power of attorney, which may reflect more deliberate advance planning among people with step-children, perhaps as a means of managing complex family dynamics.
Again consistent with the response patterns observed in relation to older people with wills, Table A10.5 shows that the older person's socio-economic status also appeared to be associated with whether they had an active power of attorney, with those reporting the lowest socio-economic status less likely (to a statistically significant extent) to report having an active power of attorney (41%) and those with the highest socio-economic status most likely to report having a power of attorney (47%). It is notable, however, that this pattern held for older women in the highest socio-economic status bracket (51%) rather than for older males in this bracket (41%).
Consistent with reports from older people with a will, where older people reported owning their own home outright, they were more likely to report having a power of attorney (48%) as compared with older people who owned their home with a mortgage (26%) and older people who rented private or public housing (28% and 22% respectively) or who had other housing arrangements (50%). The data also show an association between higher household income and having a power of attorney, with these reports generally increasing with participants' household income, save for the highest income quartile. These differences associated with home ownership and household income were also statistically significant.
Also consistent with the data relating to older people with wills (see Appendix A, Table A10.4), there was a negative association between poor/fair health (44%) or good health (42%) and reports of having an active power of attorney as compared to those in excellent/very good health (46%). By way of contrast, older people with a disability or long-term medical condition were more likely to report having an active power of attorney (47%) than those without a disability or long-term medical condition (42%), as were older people who reported needing help some or all of the time with one or more activities (50%) when compared with those who did not require this assistance (40%) (data relating to requirement for assistance not shown). This finding may reflect the differing nature of enduring powers of attorney, which are directed at facilitating decision making when a person no longer has the capacity to make decisions affecting their wellbeing during their lifetime, whereas wills are directed at implementing a person's wishes with regard to their estate upon their death.
Who had a family agreement?
The extent to which older people reported having a family agreement also varied according to the socio-demographic characteristics (see Appendix A, Table A10.8). Given the small numbers of participants with family agreements, the findings on this issue should be interpreted with caution.
Consistent with the response patterns identified in relation to wills and active powers of attorney, the proportions of older people with a family agreement increased with each age category. There were greater proportions of people with a family agreement in the 70-74 years (3%), 75-79 years (3%) 80-84 years (4%) and 85+ (7%) age categories as compared to people in the 65-69 years age category (1%).
In contrast with the response patterns for older people with wills and with enduring powers of attorney, a greater proportion of older people with family agreements were born in English speaking countries overseas (4%) as compared to those born in Australia (3%) or in non-English speaking countries (2%).
A similarly contrasting response pattern emerged in relation to the level of education of people with a family agreement. Older people without a post-school education were more likely to report having a family agreement than older people with a certificate, diploma, trade or degree.
Consistent with the response options for those with wills and with enduring powers of attorney, a greater proportion of older people who were Christian reported having a family agreement as compared to those who observed no religion or were from non-Christian religions.
In terms of living arrangements, older people were more likely to report having a family agreement where they lived alone or in another living arrangement as compared to those living with a partner. Older people who were either separated or divorced (2%) or who were married (3%) reported having a family agreement in lower proportions than those who were never married (4%) or widowed (4%).
Older people living in both outer regional areas (4%) and inner regional areas were more likely to report having a family agreement than older people in major cities (3%). These patterns are different in some respects with those emerging in relation to wills and enduring powers of attorney.
Also in contrast with the response patterns observed in relation to older people with wills and enduring powers of attorney, where older people indicated that they did not have children living in or outside of their household, they reported having a family agreement in higher proportions than those older people with children living outside of their household. This finding prevailed whether those children were biological, adopted or step-children. A smaller proportion of older people who reported having step-children (whether they lived in or outside the household) also reported having a family agreement, with this pattern also reflected in the reports of older people with biological or adoptive children.
The analysis suggested a different response pattern regarding socio-economic status and older people with family agreements than the pattern that emerged for those with wills and enduring powers of attorney. Rather than high socio-economic status being associated with the making of family agreements, those with mid-range socio-economic status were most likely to report having a family agreement (4%), and the group least likely to report having a family agreement were older people in the second highest socio-economic status (2%). It is notable, however, that the pattern was somewhat different for older women when analysed separately, with women in the lowest socio-economic status (rather than mid-range socio-economic status) having the highest reports of family agreements.
In contrast with reports from older people with a will or enduring power of attorney, older people who rented public housing (4%) or who had other housing arrangements (4%) were more likely to report having a family agreement than those who owned their own home outright (3%) or who owned their home with a mortgage (1%).
Also in contrast with reports from older people with a will or enduring power of attorney, the data show an association between lower household income and having a family agreement, with these reports generally decreasing with participants' household income.
Contrasting with the data relating to older people with wills and enduring powers of attorney, older people with poor/fair health (5%) and good health (3%) were more likely to report a family agreement than those in excellent/very good health (2%). Older people with a disability or long-term medical condition were more likely to report having a family agreement (4%) than those without a disability or long-term medical condition (2%), as were older people who reported needing help some or all of the time with one or more activities (5%) when compared with those who did not require this assistance (2%).
Power of attorney: Who was appointed?
Table 10.6 shows that older people with active powers of attorney most commonly reported that they appointed their sons and daughters to make decisions (older males: 64%; older females: 75%). Partners/spouses were the next most commonly reported party appointed pursuant to a power of attorney, with 16% of older women and 27% of older men reporting they had granted a power of attorney to their partner or spouse. Older people with an active power of attorney also reported appointing their siblings and other family members (4%) and their step-son/daughter (3%), friends (2%) and service providers (2%) as their attorneys.
| Person granted power of attorney | Males (%) | Females (%) | Total (%) |
|---|---|---|---|
| Partner/spouse | 26.5 | 15.6 | 20.4 |
| Son/daughter (biological/adopted) | 64.0 | 74.8 | 70.1 |
| Step-son/daughter | 3.7 | 1.6 | 2.5 |
| Grandson/daughter | 0.7 | 0.5 | 0.6 |
| Brother/sister | 4.2 | 4.5 | 4.4 |
| Brother/sister in-law | 0.6 | 0.5 | 0.6 |
| Son/daughter (in-law) | 1.7 | 1.6 | 1.7 |
| Other family member | 5.0 | 3.7 | 4.3 |
| Ex-partner/spouse | 0.2 | 0.1 | 0.2 |
| Friend | 2.3 | 2.5 | 2.4 |
| Neighbour | 0.1 | 0.1 | 0.1 |
| Professional carer | 0.0 | 0.1 | 0.0 |
| Other service provider | 2.9 | 1.6 | 2.2 |
| Other | 0.4 | 0.3 | 0.3 |
| Number of participants (base) | 1,202 | 2,133 | 3,339 |
Note: Weighted data and unweighted sample size.
When considering the data from the SOP regarding appointments by reference to the age of the older person, Table 10.7 shows that reports of appointments of biological and adopted children increase with the age of the older person. By way of contrast, appointments of siblings and spouses under powers of attorney decrease with the age of the older person. There is fluctuation in the age at which older people reported appointing other family members. These response patterns hold for both older men and older women participating in the SOP (data not shown, see Appendix A, Table A10.6).14
| Relationships | Age 65-69 (%) | Age 70-74 (%) | Age 75-79 (%) | Age 80-84 (%) | Age 85+ (%) |
|---|---|---|---|---|---|
| Partner/spouse a | 30.7 | 25.0 | 17.0 | 15.6 | 4.6 |
| Son/daughter (biological/adopted) a | 58.2 | 68.7 | 74.5 | 73.0 | 80.0 |
| Step-son/daughter | 2.9 | 1.8 | 2.5 | 3.3 | 3.0 |
| Grandson/daughter | 0.0 | 0.1 | 0.6 | 0.6 | 2.7 |
| Brother/sister | 8.1 | 5.0 | 3.6 | 1.2 | 1.2 |
| Brother/sister in-law | 1.3 | 0.9 | 0.7 | 0.3 | 0.2 |
| Son/daughter (in-law) | 1.6 | 1.5 | 1.5 | 2.2 | 1.8 |
| Other family member | 5.7 | 2.8 | 3.3 | 4.1 | 6.3 |
| Ex-partner/spouse | 0.6 | 0.2 | 0.1 | 0.0 | 0.0 |
| Friend | 2.4 | 2.2 | 2.4 | 2.4 | 3.2 |
| Neighbour | 0.0 | 0.1 | 0.0 | 0.2 | 0.4 |
| Professional carer | 0.0 | 0.0 | 0.1 | 0.0 | 0.1 |
| Other service provider | 2.6 | 2.0 | 1.8 | 3.1 | 1.6 |
| Other | 0.7 | 0.2 | 0.1 | 0.1 | 0.3 |
| Number of participants (base) | 691 | 1,012 | 891 | 741 | 548 |
Note: a Age-related patterns were statistically significant (p < .05). Acquaintances category had no responses. Financial planner is combined with other service provider.
With whom are family agreements made?
Figure 10.1 below shows that older people participating in the SOP who had a family agreement most commonly reported making these agreements with their biological or adopted children (41%), with this arrangement more common for older women (47%) than older men (33%). Older people also reported making family agreements with professional carers (11%) and other service providers (13%) as well as partners/spouses (17%). Interestingly, older men were more likely to report making these agreements with their partners/spouses (27% cf. 8%), while older women were more likely to report making family agreements with professional carers and other service providers (13% professional carers and other service providers 16%; cf.10% and 9%). The higher reports of older men making agreements with their spouses as compared to older women may, at least in part, reflect the higher likelihood for men to pre-decease their female partners (ABS, 2017a). Family agreements were also reported to be made with siblings (5%), friends (5%) and other family members (4%).
Figure 10.1: Survey of Older People: Older persons with whom the family agreement arrangements were made, by gender
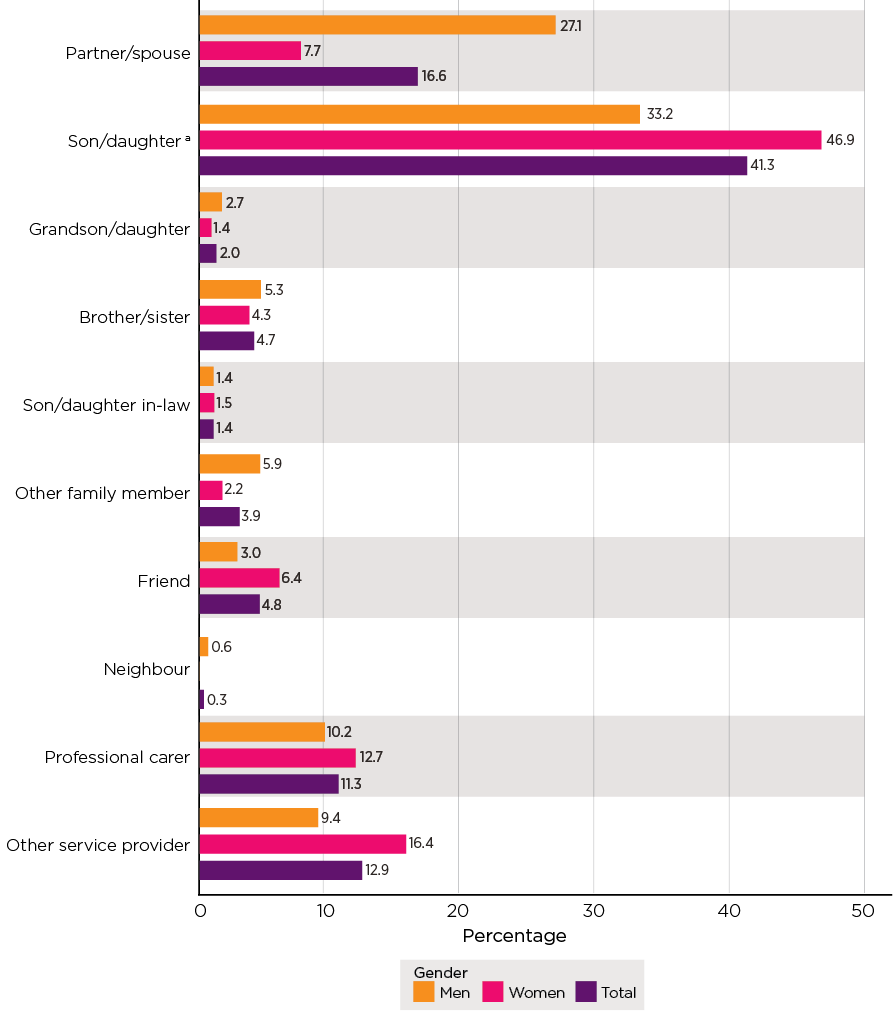
Notes: Weighted data and unweighted sample sizes (men n = 86, women n = 125, total n = 213). Multiple responses allowed so the sum may exceed 100%. a Includes biological/adopted children. Proportions for Other not shown (men = 0.4, women = 0.3, total = 0.4).
Prevalence of abuse where an older person has an advance planning arrangement
Table 10.8 presents data relating to the experience of elder abuse by older people who reported having a will, an enduring power of attorney or a family agreement, as compared to those who had not made an advance planning arrangement (see Appendix A, Table A10.9 for the data for men and women separately). Statistically significant differences are marked by an asterisk in this table.
| Advance planning type by gender | Financial (%) | Physical (%) | Sexual (%) | Psychological (%) | Neglect (%) | Total (any type) (%) | Number of participants (base) |
|---|---|---|---|---|---|---|---|
| Whether currently have a will | *** | ** | *** | *** | |||
| No | 5.0 | 3.6 | 1.6 | 16.4 | 4.2 | 20.2 | 664 |
| Yes | 1.7 | 1.5 | 0.9 | 11.1 | 2.7 | 14.1 | 6,312 |
| Whether have ever given an enduring POA to someone | ** | ** | * | ||||
| Yes, active | 1.3 | 1.3 | 0.8 | 10.3 | 2.9 | 13.4 | 3,339 |
| Yes, not active | 2.4 | 1.7 | 0.7 | 11.0 | 1.6 | 14.6 | 410 |
| None | 2.8 | 2.3 | 1.2 | 13.4 | 3.0 | 16.5 | 3,018 |
| Where have family agreements | ** | ** | |||||
| No | 2.0 | 1.7 | 0.9 | 11.7 | 2.8 | 14.7 | 6,709 |
| Yes | 4.7 | 3.3 | 4.0 | 13.8 | 3.5 | 20.5 | 213 |
Notes: Weighted data and unweighted sample size. The asterisks indicate that the differences in the prevalence of abuse (for each subtype and overall) and specific advance planning type were statistically significant based on a design-based F test (*p < .05; **p < .01; ***p < .001).
The data show that not having a current will was associated with the experience of 'any form of abuse' and with most abuse subtypes.
When considering reports of 'any form of abuse', a higher proportion (20.2%) of older people without a will reported experiencing abuse than older people with a current will (14.1%), with this difference being statistically significant.
More specifically, a higher proportion of older people without a will reported experiencing financial abuse or physical abuse (5.0% and 3.6% respectively) than older people with a will (1.7% in relation to financial and 1.5% physical abuse), to a statistically significant extent. A similar pattern emerged in relation to psychological abuse: 16.4% of older people without a will reported experiencing this form of abuse, compared with 11.1% with a will. Regarding sexual abuse and neglect, the patterns were also consistent, with a higher proportion of those without a will reporting the experience of abuse, although the results were not significant.
Consistent with the observations made in relation to wills, Table 10.8 shows that not having an enduring power of attorney was associated with the of experience of 'any form of abuse' and with most abuse subtypes.
Compared to older people with an enduring power of attorney (13%-15%) who reported experiencing 'any form of abuse', a higher proportion (17%) of older people without a power of attorney reported experiencing 'any form of abuse', to a statistically significant extent.
More specifically, 1-2% of older people with an enduring power of attorney reported experiencing financial abuse or physical abuse. In contrast, a greater proportion of older people without a power of attorney reported experiencing these forms of abuse. Older people with a power of attorney in place were also less likely to report experiencing psychological abuse than older people without an enduring power of attorney (10-11% cf. 13%), to a statistically significant extent. Older people with an enduring power of attorney were less likely to report experiencing sexual abuse and neglect than older people without an enduring power of attorney, the differences were not statistically significant.
In contrast to the findings with respect to older people with wills and enduring powers of attorney, Table 10.8 shows that reports from older people that they had a family agreement were associated with greater chances of experiences of abuse - each subtype and overall (any form), although the results were not significant for some subtypes owing to small numbers of reports of family agreements and of reports of abuse.
Among participants in the SOP with family agreements, 21% reported experiencing 'any form of abuse' compared with 15% who did not have family agreements. Findings about specific abuse types emerged in relation to financial abuse and sexual abuse. For financial abuse, 5% of people with family agreements experienced this form of abuse compared with 2% without. In relation to sexual abuse, 4% of people with family agreements experienced this form of abuse compared with 1% without family agreements.
Older people with a family agreement were also more likely to report experiencing physical abuse, psychological abuse and neglect than older people without a family agreement.
There are some complexities in interpreting these data, specifically in considering whether advance planning operates as a protective mechanism against abuse. It is likely that the lower reports of abuse among people who have wills or powers of attorney is tied to their socio-economic status, rather than related to the advance planning behaviours themselves. Chapter 5 establishes that people with lower socio-economic status are more susceptible to abuse than those in higher brackets. Since making a will or granting a power of attorney are more often the behaviours of those with higher socio-economic status, it may be this factor influencing the patterns reported in this chapter.
Proposals for greater protection
This section sets out some relevant points from recent or new commentary and analysis in relation to the three types of arrangements considered in this chapter. It is important to note that as a person's cognitive ability declines, their susceptibility to coercion may increase (ALRC, 2017). The SOP data in this context can also inform the assessment of correlations between advance planning mechanisms and the experience of elder abuse. Efforts to inform and educate professionals such as lawyers and financial advisors, when assessing the capacity of older clients and the dynamics of their familial relationships, are relevant in the context of data associating the absence of a will or power of attorney with higher reports of elder abuse (Boersig & Illidge, 2018; Ries, 2019; Wendt, Bagshaw, Zannettino, & Adams, 2015).
Wills
Broader community education to support older people to safely and effectively make a will is relevant in the context of these data (Boersig & Illidge, 2018; Ries, 2019; Wendt et al., 2015). With appropriate financial and legal advice and support, including for those from CALD backgrounds, more older people may take advantage of the protection that a will can provide (ALRC, 2017; Boersig & Illidge, 2018; Senior Rights Victoria [SRV], 2017). Research literature and case law evidences the impact of undue influence exerted upon people making a will (see e.g. Darzins, Lowndes, & Weiner, 2009). Consideration of the experience of abuse other than abuse with financial implications is also important because the exertion of pressure to make or change a will may not give rise to a financial loss on the part of an older person but it may involve infringing a person's right to choose how, and to whom, they wish to distribute their assets (State Trustees, 2017).
Power of attorney
It is also noteworthy that research and commentary have identified the risks associated with the use of a power of attorney to perpetrate elder abuse (Boersig & Illidge, 2018; Chesterman, 2016; Purser, Cockburn, Cross, & Jacmon, 2018; Ries, 2019).
Analyses of elder abuse helpline data in Victoria and Queensland identified substantial reports of the abuse or misuse or neglect of a power of attorney or enduring power of attorney (Vic. 11%; Qld 15%) (Elder Abuse Prevention Unit, 2020; Joosten et al., 2020). Reports of older people being required to appoint a power of attorney (Vic. 4%) or to modify an enduring power of attorney (Qld 5%) were also identified (Elder Abuse Prevention Unit, 2020; Joosten et al., 2020).
Also described as 'POA - facilitated financial exploitation', this abuse may occur where the appointed person uses their authority to access and use the assets for unauthorised, improper or illegal purposes (Jackson & Hafemeister, 2012; Purser et al., 2018; Ries, 2019). Ries (2019, pp. 2-3) observed that powers of attorney 'create a situation of heightened vulnerability' given that older people grant these powers in anticipation of future incapacity and confer substantial authority with regard to asset management on the part of the appointed person. Studies exploring the perpetration of abuse in this context have noted its frequency (see e.g. Clare, Blundell, & Clare, 2011) and that it is exacerbated by socio-demographic trends identified in our SOP sample, including wealth accumulation and the experience of disability or cognitive impairment (Ries, 2019).
Ready access to financial instruments such as bank accounts and credit cards by appointees (see further chapter 11) has been identified as a relevant factor in the perpetration of POA- facilitated abuse, particularly where appointees are family members with a sense of entitlement to the older person's assets or where there is a lack of knowledge of their responsibilities on the part of appointees (Darzins et al., 2009; King et al., 2011; Tilse, Wilson, White, Willmott, & McCawley, 2014; Tilse, Wilson, Settlerland, & Rosenman, 2005; Ries, 2019; Wainer et al., 2010; Webb, 2018; Wilson, Tilse, Setterlund, & Rosenman, 2009).
Situations where the appointee has been named as a beneficiary in the older person's will were also nominated as relevant to the misuse of powers (Caxton Legal Centre, 2007; Purser et al., 2018). A continuum of behaviour that depends on the existence of factors such as a lack of communication and planning, stress associated with taking on financial responsibilities for older people, stereotypical views about family and gender roles through to intentional predatory behaviour have been identified as relevant when considering abuse in the context of powers of attorney (Ries, 2019). The existence of an enduring power of attorney has also been identified as having the potential to create or exacerbate family tensions, which, in turn, may give rise to the perpetration of this abuse (Purser et al., 2018; Ries, 2019). Abuse or misuse of an enduring power of attorney has been identified in the analysis of elder abuse helpline data in Queensland as enabling the perpetration of other forms of abuse such as neglect; for example, where the appointed person cancels needed home care services or prevents visitations in residential aged care settings (Elder Abuse Prevention Unit, 2020).
To this end, recommendations have been made to educate and empower older people about powers of attorney and to inform and support appointees to fulfil their responsibilities and to discourage misuse of authority (e.g. ALRC, 2017; Boersig & Illidge, 2018; King et al., 2011; Purser et al., 2018; Ries, 2019; State Trustees, 2017; Tilse et al., 2005). Educating and supporting older people to obtain independent advice and to appoint trusted people who have the skill and capacity to appropriately undertake the role have been identified as important protective measures (Purser et al., 2018).
Measures that provide options for supported decision making rather than substituted decision making have also been identified as potentially safeguarding against elder abuse in the Australian and international context (Office of the Public Advocate Victoria, 2020; Roche, 2018). For example, the appointment of a supportive power of attorney enables the appointment of a trusted person to help the older person to make their own decisions while they still have decision-making capacity (Powers of Attorney Act 2014 (Vic.) Part 7).
The need for continuing professional education for financial and legal professionals to provide effective advice about powers of attorney has also been highlighted (Purser et al., 2018; Ries, 2019). Given that the lack of scrutiny of these legal arrangements has been identified as contributing to the vulnerability of older people using them (Purser et al., 2018; Perios & Smyth, 2018), the establishment of a monitoring system has been recommended as an important tool in mitigating abuse perpetrated in this context (ALRC, 2017; Darzins et al., 2009).
Specifically, the ALRC recommended the introduction of a national online register of enduring documents, together with nationally consistent laws governing enduring powers of attorney (ALRC, 2017, Rec. 5-3). In addition to improving access to legal remedies (ALRC, 2017, Rec. 5-2), the Commission recommended other safeguards against the abuse and misuse of enduring powers including the accommodation of supported as well as substituted decision making, enhancing witnessing requirements, clear articulation of obligations on appointed decision-makers and mandated record-keeping requirements (ALRC, 2017, Rec. 5-1). The Council of Attorney's General are pursuing a staged approach to enduring power of attorney reform to support the establishment of a mandatory national register and access to justice arrangements (Department of Prime Minister and Cabinet, 2019).
Family agreements
As foreshadowed in the previous section, similar concerns have been raised in relation to family agreements as potential enablers of elder abuse when exchanging assets for care, particularly where informal agreements and decisions are made typically without legal advice (ALRC, 2017; Boersig & Illidge, 2018). Where agreements are not in writing they may be unenforceable, with dire consequences for the older person. Where these agreements are in writing, they are likely to be executed without legal advice and dispute resolution clauses (ALRC, 2017; Boersig & Illidge, 2018). Dire consequences may include the older person not receiving the care that they were promised or expected or that they are rendered homeless if the relationship with the person to whom they transferred their home breaks down (ALRC, 2017; Board of Taxation, 2019; Boersig & Illidge, 2018; Elder Abuse Prevention Unit, 2020; Webb, 2018).
Factors that have been identified as deterring parties from executing formal family agreements include the potential for social security and tax implications to arise when transferring property from the older person to the party providing the care (Board of Taxation, 2019). The Board of Taxation in its Review of Granny Flat Arrangements made recommendations to the Australian Government to address the capital gains tax implications that arise in this context. These recommendations included exemptions for the capital gains tax events arising for the parties entering into family agreements, together with the potential for the transferee to lose their main residence capital gains tax exemption should they later sell their home (Recommendations 1, 3 and 4) and measures to address tax implications where the family agreement involves ongoing rental payments to the carer (Recommendation 2). In October 2020, consistent with the Board of Taxation's recommendations, the Australian Government announced that subject to the passage of legislation, capital gains tax will not apply to the 'creation, variation or termination of a formal written granny flat arrangement' where these arrangements are entered into due to familial or other personal relationships (Frydenberg & Sukker, 2020, p. 1).
Although formalising a family agreement can operate as a protective mechanism, it cannot remove all risks associated with entering assets for care arrangements. Boersig and Illidge (2018) observed that if older people are able to obtain early legal advice, this can support the provision of clearer and more timely explanations of the risks and consequences of entering family agreements. They identified how a socio-legal model of service delivery could reduce existing barriers by having social workers embedded in legal services and partnerships with health services and providing outreach services where older people are located in the community (Boersig & Illidge, 2018). This approach may support older people and their family members to give greater consideration to the detail of the agreement, including the nature and level of care to be provided in return for assets (usually registered legal title to real property) and mechanisms to be put in place to deal with potential changes in the older person's or family member's circumstances (ALRC, 2017).
In addition to steps to support informed decision making by older people who are considering entering family agreements and to encourage the execution of agreements in writing, access to effective dispute resolution options has also been identified as particularly important. The ALRC has recommended that tribunals be given jurisdiction to provide low cost, less formal and simpler, quicker and more flexible dispute resolution mechanisms for families involved in assets for care arrangements, in addition to the existing legal and equitable remedies (ALRC, 2017).15 A requirement for family agreements to be in writing in order to continue receipt of social security benefits was also recommended by the ALRC.
Summary
This chapter has presented findings on the extent to which older people have adopted advance planning mechanisms, specifically wills, powers of attorney and family agreements. It has also examined reports of experiences of financial abuse, physical abuse, sexual abuse, psychological abuse or neglect in this context.
The data indicate that the vast majority of older people participating in the SOP had a will, and this was particularly so for older people in the higher socio-economic status categories and for people from non-CALD backgrounds, with more women than men also reporting that they had a will. The data show that having a will is associated with lower levels of abuse, with differences between reports of those with and without a will in relation to financial abuse and physical abuse. These and other SOP data together suggest this association is likely to be as related to socio-economic status as it is to existence of the will itself.
In relation to enduring powers of attorney, the data show that just over half of the participants in the SOP had made an appointment pursuant to an enduring power of attorney, with more women than men doing so. Similar to having a will, having an enduring power of attorney was more likely for older people in the higher socio-economic status categories and for people from non-CALD backgrounds. Having an enduring power of attorney is associated with lower levels of abuse, with differences between reports of those with and without a power of attorney in relation to financial abuse, physical abuse and psychological abuse.
As with the findings in relation to having a will, these and other SOP findings also suggest that the association between lower reports of abuse and having a power of attorney is likely to be as related to socio-economic status as it is related to having the power of attorney. In this regard it was noted that other empirical research and commentary has illustrated the vulnerabilities of older people who have appointed enduring powers of attorney and how they can be used to facilitate financial abuse.
The findings in relation to family agreements contrast starkly with those relating to wills and enduring powers of attorney, with only a small proportion of participants in the SOP reporting that they had a family agreement. Of note, having a family agreement was more likely for older people from lower socio-economic status categories and for those from a CALD background, and it was more likely to be associated with the experience of elder abuse. When considered together with other SOP data, these findings are more likely to be associated with socio-economic status and to reflect other relationship dynamics than those related to the existence of a family agreement per se.
Giving and receiving support
Key messages

Introduction
This chapter examines the provision of help to older people. It focuses on help in two areas. The first is providing help in relation to financial matters, including the association between receiving such help and experiencing financial abuse. The second is the provision of care, help or assistance to family members or others due to old age or because of a disability, injury or illness. These findings provide further context for the findings in relation to the perpetration of financial abuse (chapter 5) and the characteristics of people who experience abuse in chapter 6.
The research aim that the discussion in this chapter addresses is:
- Measure the proportion of people who provide assistance to family members or friends, particularly in relation to financial transactions and decision making, which could potentially enable abusive practices to occur.
This chapter first considers assistance with financial matters on the basis of SOP and SGC findings. This discussion includes examining record-keeping practices. It then examines whether SOP participants who reported receiving assistance with financial matters also reported experiencing financial abuse. The last part of the chapter sets out findings on the extent to which SGC participants report providing care to others and the nature of this care.
Assistance with financial matters
This section focuses specifically on older people receiving assistance with financial matters. It sets out findings from the SOP on the extent and nature of assistance with financial matters that participants report receiving. The types of assistance considered range from day-to-day matters such as paying bills to more complex matters such as managing a business. The assistance may be informal from family and friends or formal from professionals such as financial planners. Following the SOP findings, the section sets out findings from the SGC on the provision of assistance with financial matters, including record keeping and other accountability practices.
Receiving assistance with financial matters: SOP findings
Figure 11.1 shows the proportion of participants in the Survey of Older People (SOP) who reported they had received one or more of the nominated types of assistance with financial matters within the last 12 months. Nearly half of the participants reported receiving help with financial matters. Around one-third reported receiving assistance with one or two of the listed financial matters, with smaller proportions receiving assistance with three or four listed tasks (7% each). The most common types of assistance were:
- assistance with tax (27% of all participants)
- managing investments such as shares, trusts or mutual funds (20% of all participants)
- managing a pension (or Centrelink-related matters) or superannuation (20% of all participants)
- paying bills, budgeting/accounting/monitoring finances (14% of all participants)
- banking (10% of all participants).
Figure 11.1: Survey of Older People: Proportion of participants who received each type of assistance with financial matters a
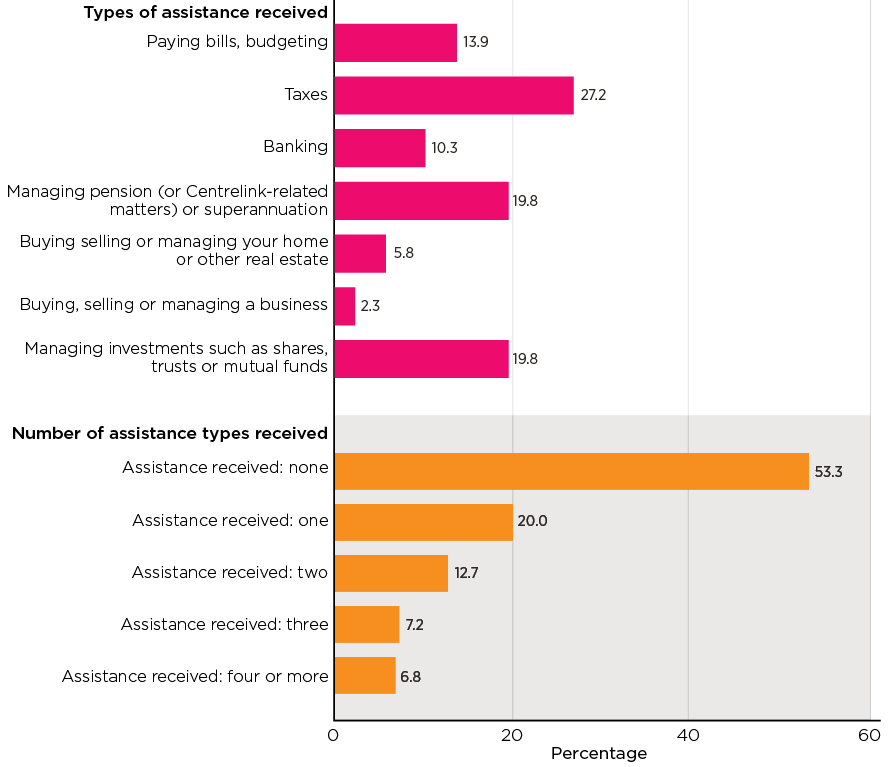
Notes: Based on weighted data. Unweighted sample size (n = 7,000). a For each item, a small number of cases who opted for 'don't know' or refused to answer were included in the total when deriving the percentages (0.4%-1.1% across all the items).
Figure 11.2 and Figure 11.3 show that patterns in receiving various kinds of assistance were similar for older men and women but varied according to the older person's age.
These data show that in relation to the payment of bills and budgeting and banking, reports of receiving assistance with these tasks increased as people aged, with higher reports in the 85 years and above age bracket than in the 65-69 years age bracket. Paying bills and other transactions have increasingly shifted towards digital formats and those in the higher age groups may have lower capability to manage this. There were some minor fluctuations in the intervening age brackets.
By way of contrast, reports of assistance with managing pension or superannuation, taxes and managing investments steadily declined with each age category. These response patterns generally held when the reports of older women and older men were analysed separately.
Figure 11.2: Survey of Older People: Proportion of participants who received each type of assistance with financial matters, by gender

Notes: Based on weighted data. Unweighted sample size (men n = 2,747, women n = 4,241).
Figure 11.3: Survey of Older People: Proportion of participants who received each type of assistance with financial matters, by age
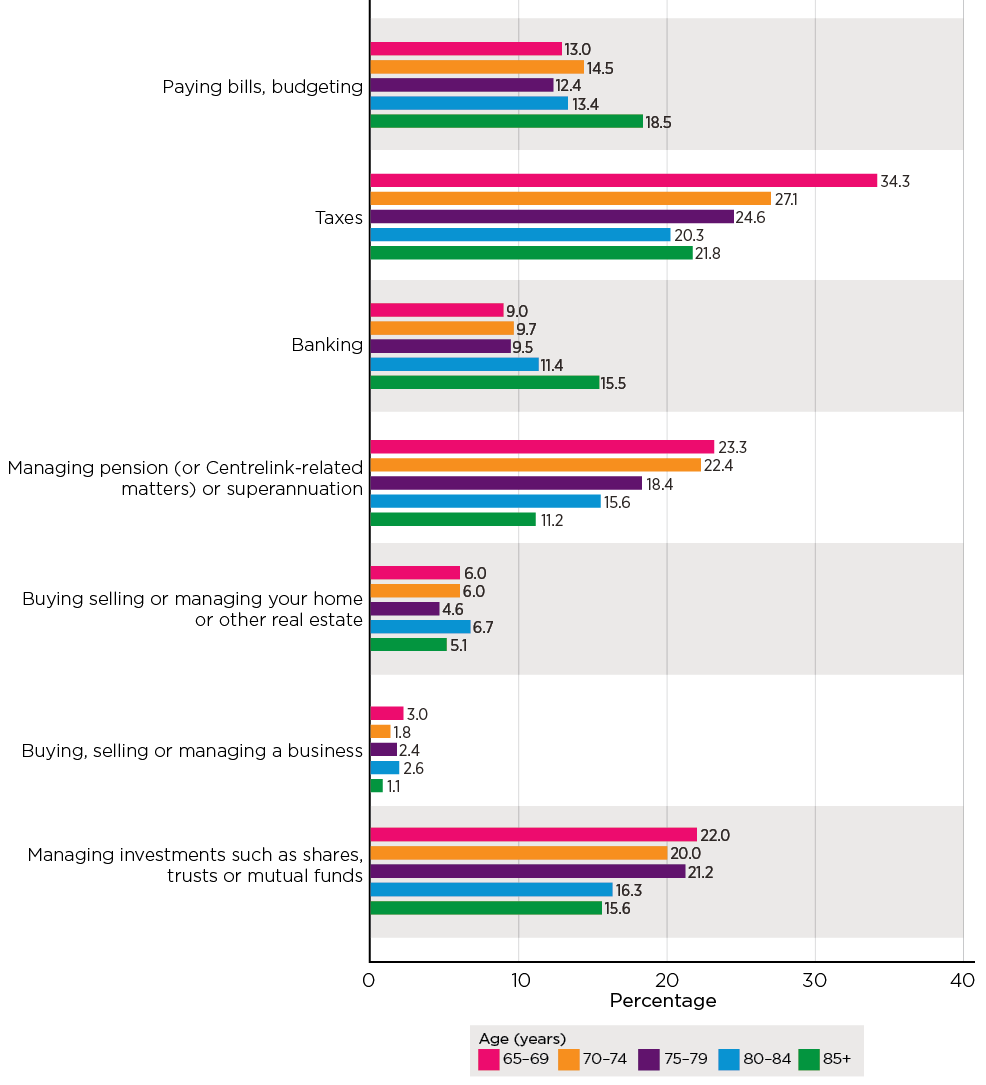
Notes: Based on weighted data. Unweighted sample size (65-69 years n = 1,697; 70-74 years n = 1,927; 75-79 years n = 1,525; 80-84 years n = 1,105; 85+ years n = 746).
Who provided the assistance?
Most participants in the SOP who reported receiving assistance with financial matters reported receiving this assistance from a financial planner (65%), with a slightly higher proportion of men than women reporting receiving this professional assistance (71% cf. 59%) (Figure 11.4 shows the six relationship types that were more likely to provide assistance, with all relationship types shown in Appendix A, Table A11.2). Participants' partners or spouses were the next most commonly nominated source of assistance (22%), with similar proportions of older men and older women identifying their spouse as providing this support. Of particular note, older women were significantly more likely to report receiving assistance from their children with financial matters (22%) than were older men (10%).
Figure 11.4: Survey of Older People: Older persons who received assistance in financial matters, who provided assistance with financial matters, by gender
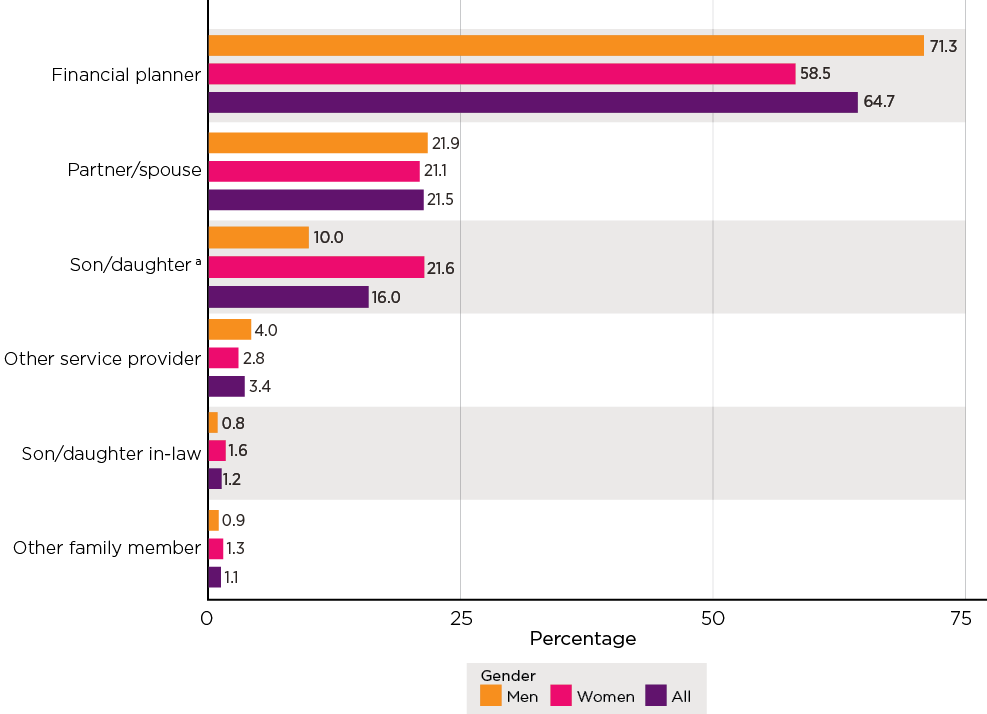
Notes: Weighted statistics and unweighted sample bases (men n = 1369, women n = 1,966, total n = 3,337). a Includes biological/adopted children.
Figure 11.5 shows that reports of assistance from both financial planners and spouses/partners reduces with each age category, with 71-72% of older people in the 65-69 years and 70-74 years age groups reporting that they received assistance from their financial planner as compared to 45% in the 85 years and over age group. Similarly, decreasing reports of assistance from spouses/partners with financial matters emerged, with 22% reporting that they received this support from their spouse/partner in the 65-69 years age group as compared to 11% in those 85 years and over. Of note, the data in Figure 11.5 also show that reports of assistance provided by children and other family members increase with age, with this response pattern present in both older men and older women who reported receiving assistance from their children and other family members.
Figure 11.5: Survey of Older People: Older persons who received assistance in financial matters, who provided assistance with financial matters, by age
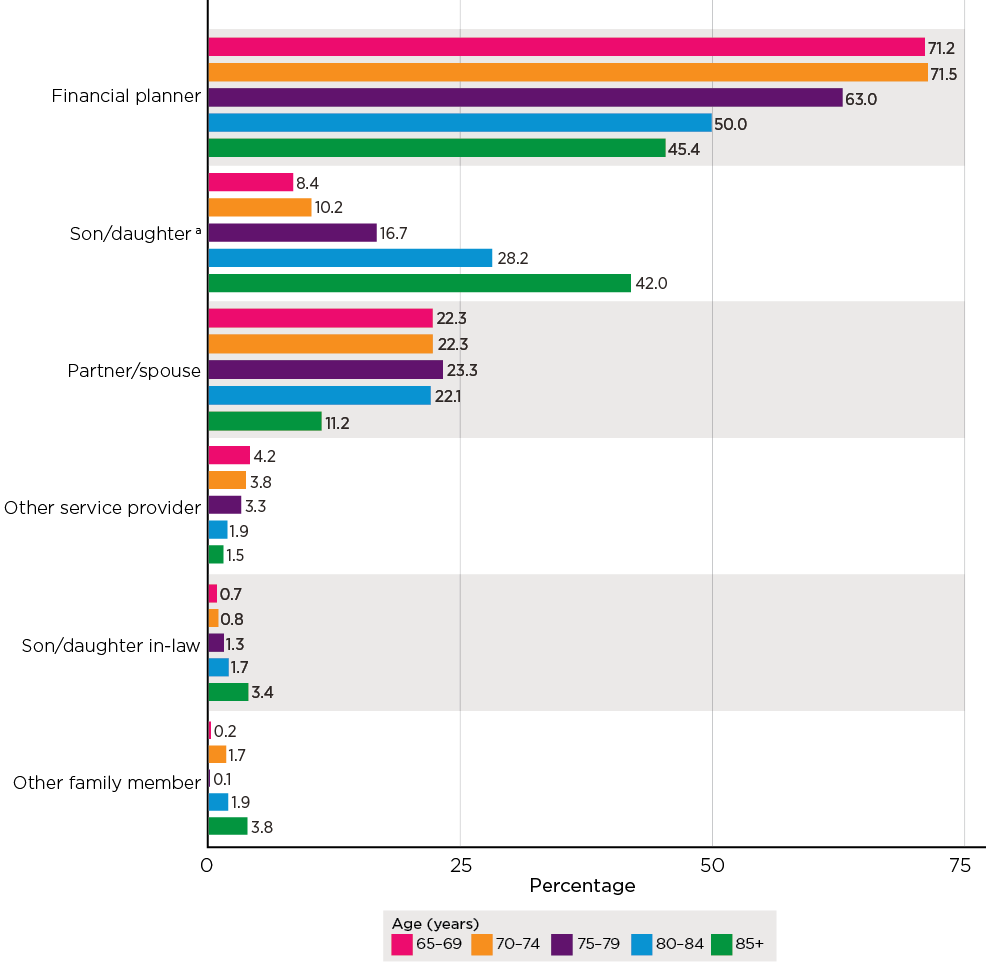
Notes: Based on weighted data. Unweighted sample size. a Includes biological/adopted children.
Access to bank accounts and credit cards
When asked whether other people (other than the account holder/s) had access to their bank account or credit card, just over a quarter of SOP participants (28%) reported that this was the case, with older women less likely than older men to report others having access to their bank accounts or credit cards (Table 11.1). The data in Table 11.1 do show, however, that reports by older women (and overall) of others having access to bank accounts and credit cards were at their highest in the oldest age category. This did not reflect the responses of older men who reported others having access to their bank account or credit cards in higher proportions in the 65-69 years and 70-74 years age brackets than in the 80-84 years and 85 years and older age brackets.
| Characteristic | % | Number of participants (base) |
|---|---|---|
| All | 27.5 | 7,000 |
| Males | 31.2*** | 2,747 |
| Females | 24.2 | 4,241 |
| All: age | ||
| 65-69 years | 27.4 | 1,697 |
| 70-74 years | 28.9 | 1,927 |
| 75-79 years | 25.4 | 1,525 |
| 80-84 years | 25.5 | 1,105 |
| 85+ years | 31.3 | 746 |
| Males: age | ||
| 65-69 years | 31.9 | 725 |
| 70-74 years | 35.1 | 763 |
| 75-79 years | 30.5 | 589 |
| 80-84 years | 26.9 | 404 |
| 85+ years | 27.5 | 266 |
| Females: age | *** | |
| 65-69 years | 23.6 | 969 |
| 70-74 years | 23.7 | 1,161 |
| 75-79 years | 20.9 | 934 |
| 80-84 years | 24.1 | 699 |
| 85+ years | 35.1 | 478 |
Notes: Based on weighted data. Unweighted sample size. The asterisks indicate that the differences in the proportions reporting that other people had access to a PIN across the categories were statistically significant (***p < .001). A small number of cases who opted for 'don't know' or refused to answer were included in the total when deriving the percentages (<1%).
Figure 11.6 shows that partners/spouses were the most likely nominated parties to have Personal Identification Number (PIN) access to the bank accounts or credit card accounts of participating older people (69%). A higher proportion of older male participants reported this arrangement (82%) than did older female participants (54%). Older women were more likely to report their children having access to their PIN (42%) than were older men (14%). The table of all relationship types is in Appendix A, Table A11.3.
Once again, as Figure 11.7 shows, while the reports of people regarding their spouse/partner's access to their PIN decreased with each age category (e.g. 65-69 years: 80%; 85+: 25%), the opposite response pattern is observable in relation to the reports of children having PIN access (for e.g. 65-69 years: 16%; 85+: 66%). Again, greater proportions of women in each age group reported their children having PIN access to their accounts (female 85+: 80%; male 85+: 47%), whereas nearly half of the older men in the 85 years and older category reported that their spouse had access to their PIN as compared to 9% of older women in this age bracket (see the list of all relationship types in Appendix A, Table A11.4). It is noted that these variations were statistically significant. The data also show that just under half of the children with PIN access to accounts were reported to keep records, whereas just over half of spouses/partners with PIN access did so.
Figure 11.6: Survey of Older People: Older persons whose PIN was accessible by someone else, who had access to PIN, by gender of participant
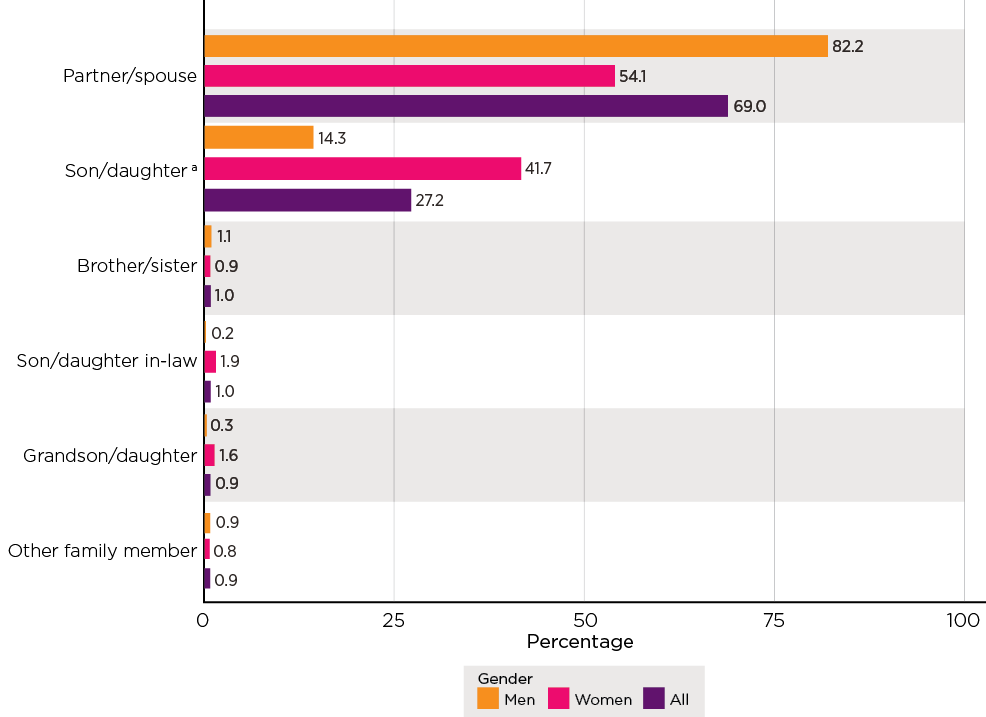
Notes: Weighted statistics and unweighted sample bases (men n = 844, women n = 978, total n = 1,825). a Includes biological/adopted children.
Figure 11.7: Survey of Older People: Older persons whose PIN was accessible by someone else, who had access to PIN, by age of participant
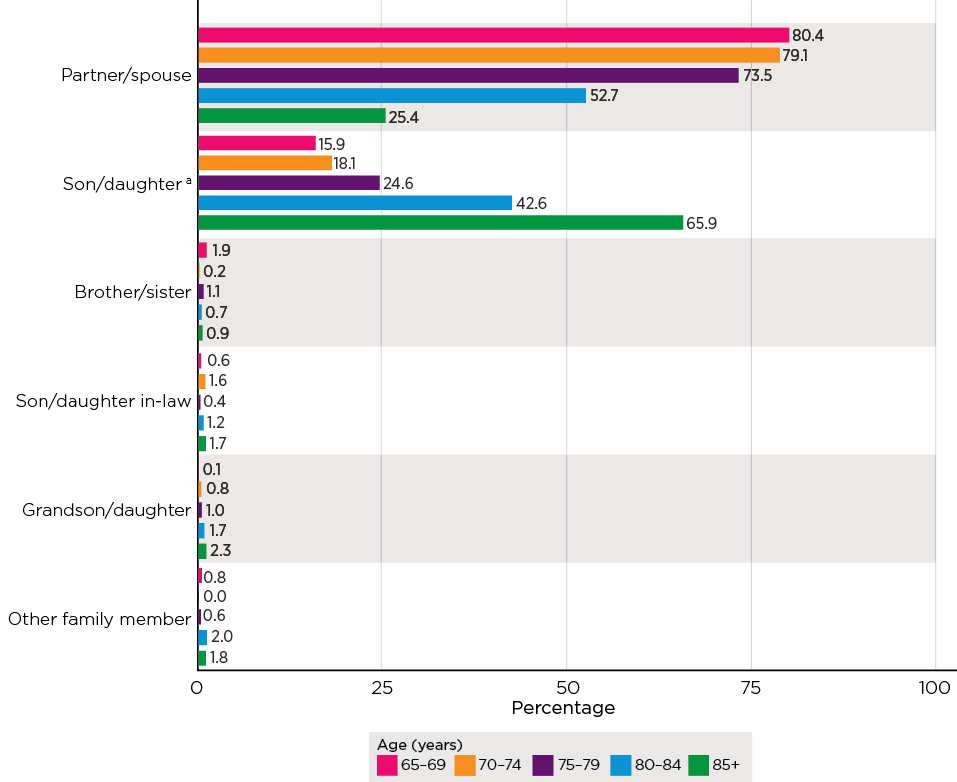
Notes: Based on weighted data. Unweighted sample size (in order of age, n = 438, 509, 367, 270, 241). a Includes biological/adopted children.
Providing help with financial matters: SGC findings
This section examines the dynamics of support with financial matters on the basis of the findings from the SGC. The discussion first considers the extent and nature of the assistance with financial matters that is provided by SGC participants. It then considers record-keeping and accountability practices reported by SGC participants.
Extent and nature of support with financial matters
Figure 11.8 shows the proportion of participants in the SGC who reported they had provided an older person with one or more of the nominated types of assistance with financial matters within the last 12 months. The data show that 42% of participants reported providing some assistance with one or more of the listed financial matters to any person in the last 12 months. On average, these participants provided assistance with at least two financial matters. The most common types of assistance were:
- paying bills, budgeting/accounting/monitoring finances (31% of all participants, or 73% of those who provided assistance)
- banking (27% of all participants, or 63% of those who provided assistance)
- managing a pension (or Centrelink-related matters) or superannuation (15% of all participants, or 35% of those who provided assistance).
Figure 11.9 shows that, of the 42% of participants who provided assistance with at least one financial matter, more than half (56%) provided this assistance to parents (including step-parents). A wide range of relationships formed the other recipients of assistance with financial matters, including parents-in-law (11%) and grandparents (13%), followed by other relatives and friends to a less frequent extent.
Figure 11.8: Survey of the General Community: Proportion of SGC participants who provided various types of assistance with financial matters in the past 12 months
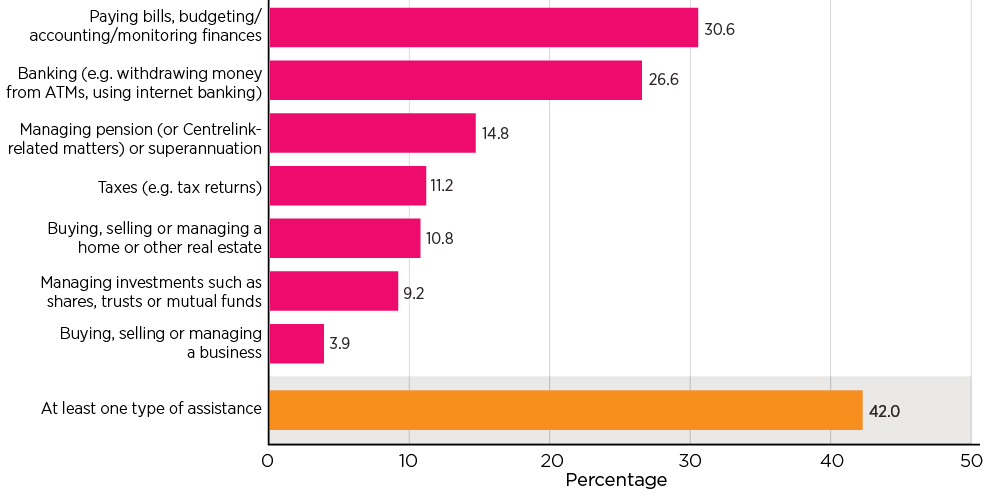
Notes: Based on weighted data. Unweighted sample size, n = 3,400. Multiple responses could be selected.
Figure 11.9: Survey of the General Community: Participants who provided assistance with financial matters, who received the assistance
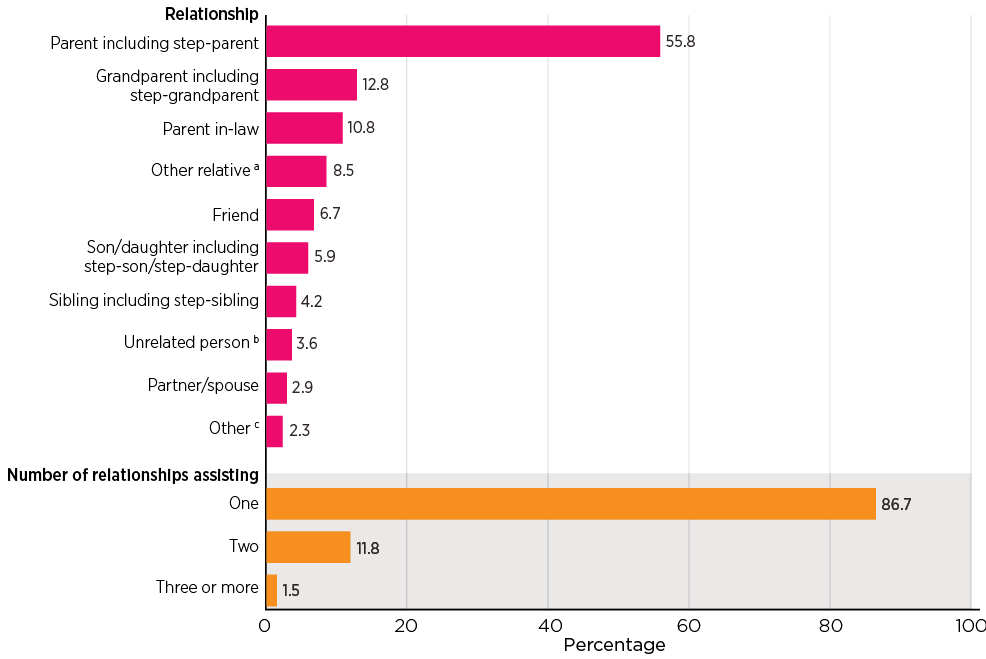
Notes: Based on weighted data. Unweighted sample size, n = 1,483 (relationship), 1,465 (number of relationships assisting), total n = 3,400. Percentages may not total 100.0% due to rounding. Multiple responses could be selected. Excludes don't know/refused responses. a This option includes aunt/uncle, son/daughter-in-law, other family member, brother/sister-in-law, grandparents-in-law. b This option includes neighbour, client/customer/patient, colleague. c This option includes all other including a small proportion of ex-partner/spouse.
Where participants reported the oldest person they had assisted was over the age of 30, they were asked if they had provided assistance with one or more specific financial matters within the last 12 months (as listed in Figure 11.10). Half of these participants had provided assistance specifically with 'electronic transactions such as internet or telephone banking' (52%) and 'paying for something with your money first and subsequently reimbursed' (51%). Around one-third of these participants also provided assistance with 'a financial form or financial document' (35%) and almost one-quarter reported needing to use someone else's PIN (24%). A small proportion (4%) 'acted as an appointed administrator or financial manager'.
Figure 11.10 provides further detail about the types of financial assistance provided according to three age groups of recipients the participants had helped: 30-64 years, 65-84 years and 85 years and older. Assistance recipients aged over 85 years were more likely than assistance recipients of other age groups to be helped with having a financial form/document signed and receiving authorisation to operate their bank account or credit card. The recipients aged 65-84 and 85 years and older were more likely than those aged 30-64 years to have been assisted with 'needing to make use of an existing power of attorney', and 'acting as an appointed administrator or financial manager'.
Figure 11.10: Survey of the General Community: Type of financial matter, by age of oldest person receiving assistance
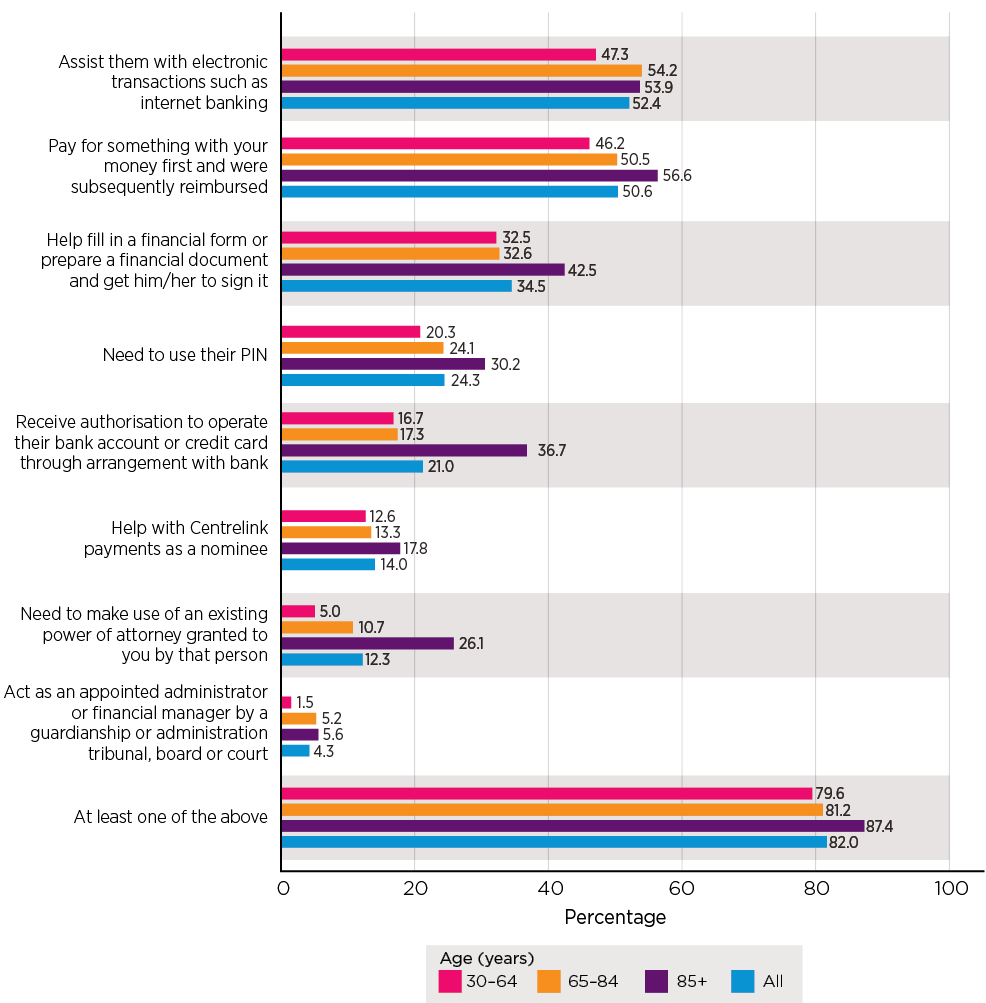
Notes: Based on weighted data. Unweighted sample size (30-64 years n = 293; 65-84 years n = 743; 85+ years n = 325; all n = 1,361. Percentages may not total 100.0% due to rounding. Excludes don't know/refused responses to either question.
Why do people need assistance?
Table 11.2 presents the main reason given by the participant as to why the person needed help with financial matters and the age group of the person who was assisted. The data show that 'lacks confidence in doing it themselves' (24%) was the most frequently nominated reason overall for the person needing help with financial matters, and this was the main reason for over one-quarter of recipients of assistance in the 65-84 years age group (27%). When looking specifically at recipients of help aged 85 years and older, 'dementia or confusion' (28%) was the most frequently nominated reason for assisting (and around three times or more frequently than for younger age groups), followed by 'lacks confidence in doing it themselves' (21%). 'Due to being old and frail' (16%) was the third most frequent reason within this age group, the highest across all age groups.
By way of contrast, needing help 'due to disability or poor health' (24%) was the most frequently nominated reason for assisting 30-64 year old people, and this was the highest frequency compared to other age groups for this reason. Although only a small proportion of participants nominated 'difficulties with reading or writing' and 'emotional and mental health concerns' as reasons for assisting, this was more frequent for 30-64 year old people than for older age groups.
| Main reason person needed help a | 30-64 years b (%) | 65-84 years (%) | 85+ years (%) | All (%) |
|---|---|---|---|---|
| Lacks confidence in doing it themselves | 17.6 | 27.3 | 21.2 | 23.7 |
| Due to disability or poor health | 23.9 | 17.2 | 13.0 | 18.0 |
| Due to dementia or confusion | 5.0 | 11.5 | 28.4 | 13.3 |
| Because English is not their first language | 12.1 | 9.7 | 8.4 | 10.0 |
| Difficulty with technology/technically incompetent | 6.6 | 7.9 | 5.8 | 7.2 |
| Difficulty with finances/budgeting | 9.1 | 7.0 | 1.2 | 6.4 |
| Due to being old and frail | 1.4 | 4.0 | 16.3 | 5.8 |
| Not interested in doing it themselves | 4.7 | 3.4 | 1.7 | 3.4 |
| Because of difficulty with reading or writing | 4.1 | 2.3 | 1.3 | 2.5 |
| Emotional/mental health | 2.5 | 0.5 | 0.2 | ^0.9 |
| Other reason | 13.1 | 9.1 | 2.7 | 8.8 |
| Total | 100.0 | 100.0 | 100.0 | 100.0 |
| Number of participants (base) | 287 | 735 | 325 | 1,347 |
Notes: Based on weighted data. Percentages may not total 100.0% due to rounding. a A small proportion of don't know/refused responses are excluded (1.5%, n = 21). b This question was only asked to those whose response to the question on the oldest person they assisted was over 30. Therefore, responses covering people under 30 are excluded from this analysis. Totals exclude 'don't know/refused' responses.
Record keeping and reporting arrangements
The SGC also provided information on the types of records that participants kept regarding the help provided and the types of reporting arrangements in place when assisting with any one of the specific financial matters discussed above. The data presented in Table 11.3 show that about of one-half of participants who reported providing financial assistance indicated that they had either kept records and or had reporting arrangements to inform the person they were helping or someone close to them of the assistance provided. Conversely one-half neither kept records nor had reporting arrangements. Of note:
- Forty-two per cent of the participants said that they had reporting arrangements in place.
- Just over one-quarter of participants who said they provided financial assistance reported that they keep records (27%).
- Around one-fifth of participants reported they did both.
Participants also reported keeping a range of records with more than two-thirds of participants keeping 'receipts or cash book' and 'bank statements, withdrawal slips or bank passport' and more than half indicated that they kept 'key documents'. Multiple reporting arrangements also tended to be identified for involving or informing the recipient or someone close to them about the assistance provided. Most participants said they answered questions if asked, gave regular verbal updates and included the recipient or someone close to them in decision making for key issues. Approximately three-quarters of these participants also indicated that they shared records if requested and asked for advice on key issues.
| Type of record kept or reporting arrangements | % |
|---|---|
| Record keeping or reporting arrangements | 49.1 |
| Record keeping | 27.3 |
| Arrangements for reporting | 41.8 |
| Both | 19.7 |
| If keeping records: types of records kept a | |
| Bank statements, withdrawal slips, bank passport | 68.2 |
| Receipts or cash book | 67.8 |
| Key documents (e.g. Centrelink, tax, insurance) | 57.3 |
| Information records (e.g. in a spreadsheet) | 46.0 |
| Other | 22.9 |
| If reporting arrangements: types of arrangements for reporting b | |
| Answer their questions if requested | 90.3 |
| Give regular verbal updates | 88.7 |
| Include them in decision making for key issues | 85.4 |
| Share my records if requested | 77.2 |
| Ask for their advice on key issues | 75.5 |
| Give regular written updates without records | 35.1 |
| Other | 8.3 |
| Number of participants (base): record keeping/reporting arrangements c | 1,124 |
| Number of participants (base): types of records kept | 348 |
| Number of participants (base): types of reporting arrangements | 489 |
Notes: Based on weighted data. a Multiple responses could be selected for types of records. This question was only asked of those who answered yes to assistance with any one specific financial matter in the past 12 months. b Multiple responses could be selected for types of arrangements. This question was only asked of those who answered yes to assistance with any one specific financial matter in the past 12 months. c Includes a small number of responses of 'Don't know' or refusal.
Table 11.4 shows that the reports of participants keeping records or having reporting arrangements in place for the person or someone close to them about the financial assistance provided, tended to increase with the age group of the person being assisted. It is notable that keeping records and/or reporting arrangements were most frequently in place when assisting people aged 85 years and older (cumulatively 49%). In contrast, neither records nor reporting arrangements were in place for 67% of people aged 30-64 years old and 52% of 65-84 years old people when participants had assisted them with financial matters.
| Records and/or arrangements | 30-64 years (%) | 65-84 years (%) | 85+ years (%) | All (%) |
|---|---|---|---|---|
| Records and arrangements | 11.4 | 17.9 | 35.7 | 20.1 |
| Arrangements but no records | 16.7 | 22.7 | 26.6 | 22.1 |
| Records but no arrangements | 5.3 | 7.8 | 7.1 | 7.1 |
| No records and no arrangements | 66.5 | 51.6 | 30.6 | 50.7 |
| Total | 100.0 | 100.0 | 100.0 | 100.0 |
Notes: Based on weighted data. Percentages may not total 100.0% due to rounding. This question was only asked of those who answered yes to assistance with any one specific financial matter in the past 12 months. Totals exclude 'don't know/refused' responses.
SGC participants were asked whether they were granted a power of attorney (POA) by someone. Table 11.5 focuses on whether record keeping and reporting arrangements differed among participants who provided assistance in the last 12 months by whether they have a POA appointment (It is worth noting that for those responses who were appointed pursuant to a POA, they may provide assistance with financial matters that are not related to their POA and their record-keeping practice may not be related to their appointment as POA. Also note that the large majority of participants who were appointed under a power of attorney indicated that they had not used their POA responsibility). Overall, the findings suggest power of attorney arrangements seem to encourage record-keeping arrangements; however, further encouragement of these practices is warranted.
- People appointed under a power of attorney are more likely to have kept records and/or made arrangements on behalf of older people than people who are not appointed under a power of attorney. Of the people who were appointed pursuant to a power of attorney and answered this question (n = 365), two-thirds reported that they either kept records and made arrangements for the older person, that they made arrangements but did not keep records or that they kept records but did not make arrangements (66%).
- As may be expected, the proportion of participants who reported that they did not keep records or make arrangements was lower for participants who were appointed pursuant to a power of attorney (34% cf. 58% of people not appointed under a power of attorney). It is noted that these data do not provide insight into the nature and content of these records. As such, no inference can be made as to their accuracy or whether they are sufficient in their coverage of all financial activities undertaken on behalf of the older person.
| Records and/or arrangements | POA | No POA | Total |
|---|---|---|---|
| Records and arrangements | 35.8 | 13.9 | 20.2 |
| Arrangements but no records | 23.9 | 21.1 | 21.9 |
| Records but no arrangements | 6.5 | 7.1 | 6.9 |
| No records and no arrangements | 33.9 | 57.9 | 51.0 |
| Total | 100.0 | 100.0 | 100.0 |
| Number of participants (base) | 365 | 720 | 1,085 |
Notes: Excludes don't know/refused responses for either category.
Links between receiving assistance and financial abuse
This section outlines the findings of analysis examining whether there are links between reports of experiencing assistance with financial matters and experiencing financial abuse in the SOP. In this context, it is noteworthy that of the 2% of SOP participants who reported experiencing financial abuse, 42% said they had been pressured into giving or loaning money, possessions or property and 34% said money, possessions or property had been taken without permission (chapter 5). It should also be noted that the findings in chapter 10 established an association between having a family agreement and reporting financial abuse in the SOP.
The findings presented in this section extend these insights and suggest that older women are more vulnerable to financial exploitation. Older women who received assistance with their financial matters were more likely to report experiencing financial abuse compared to those without such assistance.
Figure 11.11 shows the analysis examining the levels of financial abuse reported by people who received assistance with financial activities. Considering the data overall (men and women combined), there is no apparent association between reports of the experience of financial abuse and receiving assistance on financial matters, with similar proportions reporting experiencing financial abuse in both the group receiving financial assistance and the one not receiving such assistance.
However, slightly different patterns emerged for men and women. The prevalence of financial abuse is marginally lower for men receiving any assistance on financial matters, compared to those who did not receive any assistance (1.8% cf. 2.4%). For women, receiving assistance on financial matters is associated with a slightly higher likelihood of experiencing financial abuse (2.3% cf. 1.9%). It should be noted that these differences are small. These results were not significant.
Figure 11.11: Survey of Older People: Proportion of participants who reported experience of financial abuse by whether receiving assistance on financial matters
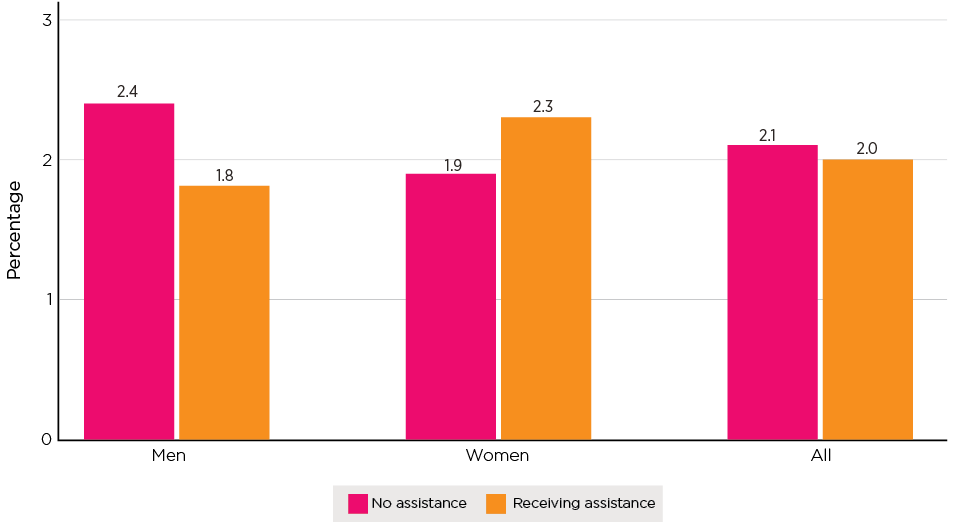
Notes: Weighted data and unweighted sample size (men no assistance n = 1,378, assistance n = 1,369; women no assistance n = 2,275, assistance n = 1,966; total no assistance n = 3,663, assistance n = 3,337).
Table 11.6 sets out more detailed analysis examining the extent to which receiving help with each of seven specific activities is associated with experiences of financial abuse. The table depicts findings from three sets of analysis: all participants, and men and women separately. It should be noted that some participants may receive assistance with multiple financial activities.
The analysis of patterns based on the reports of all participants shows one activity was associated with a higher likelihood of experiencing financial abuse: buying, selling or managing a home (4.7% cf. 1.9%).
Receiving assistance with the following financial activities was associated with a lower likelihood of experiencing financial abuse: banking (1% cf. 2.2%) and managing pension or superannuation (1.3% cf. 2.3).
For men, these patterns were consistent but more apparent. Specifically, receiving assistance with all the activities except buying, selling or managing their home or other real estate was associated with a lower likelihood of experiencing financial abuse (0.5%-1.7% cf. 2.2%-2.6%). Men who were assisted with buying, selling or managing their home or other real estate were three times more likely to experience financial abuse as men who did not receive assistance with this financial activity (6.7% cf. 1.9%). By contrast, patterns for women were less apparent.
| Type of financial assistance | Financial abuse (%) | Number of participants (base) | ||||
|---|---|---|---|---|---|---|
| Males | Females | All | Males | Females | All | |
| Paying bills, budgeting | ||||||
| Yes | 1.1 | 1.7 | 1.4 | 360 | 585 | 946 |
| No | 2.3 | 2.1 | 2.2 | 2,379 | 3,627 | 6,017 |
| Taxes | ||||||
| Yes | 1.3* | 2.3 | 1.8 | 848 | 1,092 | 1,941 |
| No | 2.5 | 1.9 | 2.2 | 1,880 | 3,099 | 4,990 |
| Banking | ||||||
| Yes | 0.8* | 1.2 | 1.0* | 262 | 417 | 680 |
| No | 2.3 | 2.1 | 2.2 | 2,479 | 3,799 | 6,289 |
| Managing pension (or Centrelink-related matters) or superannuation | ||||||
| Yes | 0.6*** | 2.0 | 1.3* | 615 | 795 | 1,411 |
| No | 2.6 | 2.1 | 2.3 | 2,117 | 3,411 | 5,539 |
| Buying, selling or managing your home or other real estate | ||||||
| Yes | 6.7** | 3.0 | 4.7** | 162 | 249 | 411 |
| No | 1.9 | 2.0 | 1.9 | 2,578 | 3,955 | 6,544 |
| Buying, selling or managing a business | ||||||
| Yes | 0.5 | 2.7 | 1.5 | 75 | 88 | 163 |
| No | 2.2 | 2.0 | 2.1 | 2,660 | 4,122 | 6,794 |
| Managing investments such as shares, trusts or mutual funds | ||||||
| Yes | 1.7 | 2.4 | 2.0 | 617 | 871 | 1,489 |
| No | 2.3 | 2.0 | 2.1 | 2,118 | 3,339 | 5,468 |
Notes: Weighted data and unweighted sample sizes. The asterisks indicate that the differences in the prevalence of financial abuse by whether or not receiving assistance for a specific activity was statistically significant based on a design-based F test (*p < .05; **p < .01; ***p < .001).
Providing care: SGC findings
This section sets out findings on care provided by SGC participants, who were asked whether they provided care to someone due to disability, injury or illness. The question not only captures data in relation to care for people aged 65 and older but also for other age groups who require care due to disability, injury or illness. This section sets out findings on the relationship between the carer and the care recipient and the types of care provided according to the age range of the care recipient. The discussion focuses on the provisions of care to those aged 65 and over.
Relationships and age ranges
Just over a third of the participants in the SGC reported that they provide care (this could mean incidental or regular care). Table 11.7 sets out findings on whether care is provided and the relationship between the care provider and the person they care for.
Care was most frequently provided in an intergenerational context. Parents (including step-parents) (47%) and grandparents (including step-grandparents) (23%) were the most frequent recipients of care. A wide range of relationships formed the remaining people participants reported caring for. The provision of care to older people, primarily assistance with daily activities, is common, with 80% of SGC participants who provided any care indicating they provided care to someone aged 65 or older.
| Recipient of care | % |
|---|---|
| Whether care is provided | |
| Yes | 36.6 |
| No | 63.2 |
| Total | 100.0 |
| If care provided, relationship between recipients and participants | |
| Parent incl. step-parent | 47.2 |
| Grandparent incl. step-grandparent | 22.5 |
| Parent-in-law | 11.0 |
| Other relative | 8.0 |
| Unrelated person (e.g. neighbour) | 4.8 |
| Friend | 4.6 |
| Son/daughter incl. step-son/step-daughter | 3.8 |
| Sibling incl. step-sibling | 3.6 |
| Partner/spouse | 3.5 |
| Other unspecified (incl. small proportion of ex-partner/spouse) | 1.3 |
| Age of care recipients a | |
| Care recipients aged 65+ | 79.5 |
| Number of participants (base), whether provided care | 3,400 |
| Number of participants (base), relationship with care recipients | 1,245 |
Notes: Based on weighted data. Multiple responses could be selected. a This refers to the oldest care recipients if participant provided care to multiple persons.
Types of care and age of person cared for
Table 11.8 sets out findings on the type of care provided, analysed according to age ranges of the person receiving care. Where SGC participants indicated that they provided care to more than one person, the analysis of age is based on the oldest person cared for. Recipients of care are divided into three age groups: 30-64, 65-84, and 85 years and older.
Most types of care were provided to a similar degree across the age groups of recipients. There was, however, a significant difference in relation to 'giving money to live on': this was more likely for recipients aged 30-64 (38%). Financial support to older generations is relatively frequent, with more than a quarter of SGC participants indicating they had provided money to live on to 65-84 year olds and 15% indicating they had provided this support to those aged 85 and over.
Providing 'help with day-to-day activities' was the most frequent type of care provided overall (75%), with similar patterns across age brackets. The next most common form of help was support with personal care, provided to around a quarter of all care recipients across age brackets.
| Type of care | 30-64 years (%) | 65-84 years (%) | 85+ years (%) | Total (%) |
|---|---|---|---|---|
| Help with day-to-day activities | 75.1 | 72.9 | 79.4 | 75.0 |
| Giving money for them to live on*** | 37.5 | 27.6 | 14.6 | 25.6 |
| Personal care | 28.7 | 23.0 | 25.2 | 24.4 |
| Emotional/social/mental health support | 12.2 | 11.5 | 17.0 | 13.1 |
| Help with making/getting to appointments | 8.8 | 8.8 | 6.9 | 8.3 |
| Financial/budgeting help and assistance unspecified | 6.7 | 7.3 | 5.5 | 6.7 |
| Administrative help or advice | 5.1 | 7.5 | 5.2 | 6.5 |
| Transport/drive | 6.4 | 4.8 | 9.1 | 6.2 |
| Other | 2.2 | 5.0 | 1.7 | 3.7 |
| Number of participants (base) | 153 | 646 | 355 | 1,154 |
Notes: For each type of care, statistically significant differences across the three age groups are noted: ***p < .001. Multiple responses could be selected.
Link between provision of assistance/care and concerns
Many participants in the SGC reported that they had provided assistance with financial matters and care to others due to old age, disability, illness or injuries. Involvement in financial assistance and care may make people more aware of how older people are treated. More importantly, by helping others, they have more opportunities to observe and notice circumstances where an older person may experience mistreatment or abuse.
Further analysis revealed that there were links between the provision of financial assistance and care and elder abuse concerns for older family members or someone they knew (results are shown in Table 11.9).
- Elder abuse concerns were more prevalent among people who provided assistance with financial matters than they were among people who did not provide such assistance (assistance to persons of any age: 25% cf. 12%; assistance to older persons: 24% cf. 15%).
- Elder abuse concerns were more prevalent among people who reported provision of care compared to others (care to persons of any age: 22% cf. 15%; care to older persons: 20% cf. 16%).
| Type of assistance | % had any concerns | Number of participants (base) |
|---|---|---|
| Assistance with financial matters to persons of any age | ||
| No | 11.9*** | 1,917 |
| Yes | 24.9 | 1,483 |
| Assistance with financial matters to persons 65+ | ||
| No | 14.8*** | 2,331 |
| Yes | 23.5 | 1,069 |
| Providing care | ||
| No | 14.8*** | 2,155 |
| Yes | 21.8 | 1,245 |
| Providing care to persons 65+ | ||
| No | 16.4* | 2,399 |
| Yes | 19.9 | 1,001 |
Notes: The asterisks indicate that the differences in having concerns by whether or not the participant provided specific assistance for a specific activity was statistically significant based on a design-based F test (*p < .05; **p < .01; ***p < .001).
Summary
The findings in this chapter show that assistance with financial matters and care, more generally, is commonly provided to people aged over 65. The findings indicate some gendered patterns in the management of financial affairs that are likely to be associated with women being more susceptible to financial abuse from their children. They also suggest that providing care affords opportunities to detect elder abuse.
In relation to financial matters, nearly half of SOP participants indicated receiving help to manage finances in the past 12 months. This was most commonly in relation to tax, superannuation or a pension and investments.
The sources of assistance most commonly identified were a financial planner (65%) and partners and spouses (22%). Older women were substantially more likely than older men to report receiving help with financial matters from their children (22% cf. 10%). Analysis examining associations between receiving financial assistance and experiencing financial abuse suggests that women appeared to be vulnerable to financial exploitation in this context to a greater extent than men when a third party is helping them manage financial matters except in matters relating to buying, selling and managing home or other real estates.
Furthermore, it appears that receiving assistance with buying or selling a home was associated with a higher likelihood of experiencing financial abuse, with 5% of SOP participants who received this type of assistance reporting financial abuse compared to 2% who didn't receive assistance. These findings provide further context for the findings reported in chapter 6 that show that compared with owning your own home outright, owning a home with debt is associated with a greater likelihood of experiencing elder abuse overall (Appendix A, Table A6.1) and financial abuse in particular (Appendix A, Table A6.2).
More than a quarter of all SOP participants indicated that a third party had access to bank accounts or credit cards. The most frequent third party with access was a partner/spouse, and women were substantially more likely than men to report that their children had access to their PIN. Around half of SOP participants indicated that records of transactions were kept by the third party with PIN access.
The SGC data confirm that the provision of assistance with financial matters is common, with four in 10 SGC participants indicating they had assisted someone aged 65 and over in this way. The most frequent types of assistance were in relation to paying bills, budgeting and monitoring finances (73% of those who provided assistance) and banking (63% of those who provided assistance).
Provisions of assistance with financial matters by SGC participants most commonly occurred in an intergenerational context, with parents being the largest group of those assisted (56%).
Around one-half of SGC participants indicated they kept records or had arrangements to report to the person they were assisting to keep track of their assistance with financial matters. Most commonly this involved reporting to the person they were assisting (42%) rather than keeping written records (27%).
Around a third of SGC participants reported providing care to someone aged 65 years or over, most frequently in an intergenerational context. Parents (47%) and grandparents (23%) were the most frequent receivers of care. The most frequent type of care provided was help with day-to-day activities. Financial support (giving money to live on) was not infrequent, with more than a quarter of SGC participants indicating they provided this assistance to those aged 65-85 and 15% providing it to those aged 85 and over.
The findings demonstrate that SGC participants who reported providing financial assistance or care to those aged 65 or over were also more likely to demonstrate concerns about elder abuse. These findings point to the importance of the awareness of elder abuse among people who provide care and assistance to older people, as means of supporting greater detection of elder abuse. They also reinforce a need to reduce social isolation, which chapter 6 demonstrates is a serious problem for the older population, particularly those who experience elder abuse.
Attitudes, awareness and understanding
Key messages

Introduction
This chapter sets out findings on the social context for elder abuse in Australia with a focus on views on elder abuse, attitudes towards older people and attitudes to intergenerational support. These insights provide a basis for understanding the wider social setting for elder abuse in Australia, consistent with the socio-ecological and human rights approaches outlined in chapter 3. Further, as set out in chapter 2, identified risk factors for experiencing and perpetrating elder abuse are attitudinal in nature.
The findings in this chapter address the following research aims:
- Describe knowledge and awareness about elder abuse and attitudes towards older people and examine how they may contribute to social and environmental norms that allow elder abuse to occur.
- Describe the contexts of elder abuse.
The discussion in this chapter begins with a brief overview of the measures used to assess acceptance and recognition of elder abuse, the prevalence of ageist attitudes and attitudes to intergeneration support. It then sets out findings in relation to these issues for the SOP and SGC, comparing the overall patterns in findings between these two studies. The third part of this chapter focuses on findings from the SGC to shed further light on the association between ageist attitudes, intergenerational support and a sense of entitlement, and their influence on the occurrence of elder abuse.
Attitudes towards elder abuse: findings (SOP and SGC)
This section sets out key findings from the SOP and SGC in relation to the acceptance and recognition of elder abuse. The similarities and differences arising from the findings provide a basis for greater understanding of socio-demographic and generational differences in views and understanding. (See Box 12.1 for the measures used in this section on attitudes towards older people.)
Box 12.1: Attitudes towards elder abuse
The Survey of Older People and the Survey of the General Community contained five statements to gauge participants' attitudes towards elder abuse. Participants were asked to select one of the following: 'Strongly agree', 'Somewhat agree', 'Neither agree nor disagree', 'Somewhat disagree' or 'Strongly disagree' in response to the following statements:
- Abuse of older people is common in our community.
- Most people turn a blind eye to or ignore abuse of older people.
- Abuse of older people is a private matter to be handled in the family.
- Abuse of older people can be understandable if the person committing the abuse is under a lot of stress in their lives.
- Abuse can be understandable if the older person is a difficult person to deal with.
The three items (items 3-5) form a scale, referred to as the Elder Abuse Acceptance scale. To generate the scale, the item responses were first recoded (0 as strongly disagree, 25 as disagree, 50 as neither, 75 as agree, and 100 as strongly agree); the mean of the recoded items formed the scale score. The scale has a score range of 0-100, with higher scores indicating greater acceptance or condoning of elder abuse.
Attitudes towards elder abuse: findings
This discussion draws together the information provided in Figure 12.1. SOP participants and SGC participants, for the most part, did not hold accepting or condoning views towards elder abuse. Around one half of SOP and SGC participants agreed with the statements 'Abuse of older people is common in our community' (43% cf. 54% strongly/somewhat) and 'Most people turn a blind eye to or ignore abuse of older people' (41% cf. 52%). Similarly, the large majority (78%) of older participants disagreed/strongly disagreed with the statement 'Abuse of older people is a private matter to be handled in the family', compared to 87% in the community sample.
The findings from the SOP and the SGC show divergence in responses to the two statements, demonstrating that SOP participants are more likely to hold elder abuse condoning attitudes than SGC participants. Twenty per cent of SOP participants somewhat/strongly agreed with the statement 'Abuse of older people can be understandable if the person committing the abuse is under a lot of stress in their lives', compared to 7% of SGC participants. Twenty-five per cent of older participants somewhat/strongly agreed with the statement 'Abuse can be understandable if the older person is a difficult person to deal with', compared to 7% of SGC participants.
Taken together, the findings in this section show that, overall, SGC participants are less accepting of elder abuse than SOP participants and:
- Social norms are changing over time.
- Understanding the social norms that underlie attitudes and behaviours is potentially a driver for reducing the occurrence of elder abuse.
- Given the low levels of acceptance of elder abuse in the SGC, the difference in views of SOP participants warrants further consideration.
Figure 12.1: SOP and SGC: Attitudes towards elder abuse
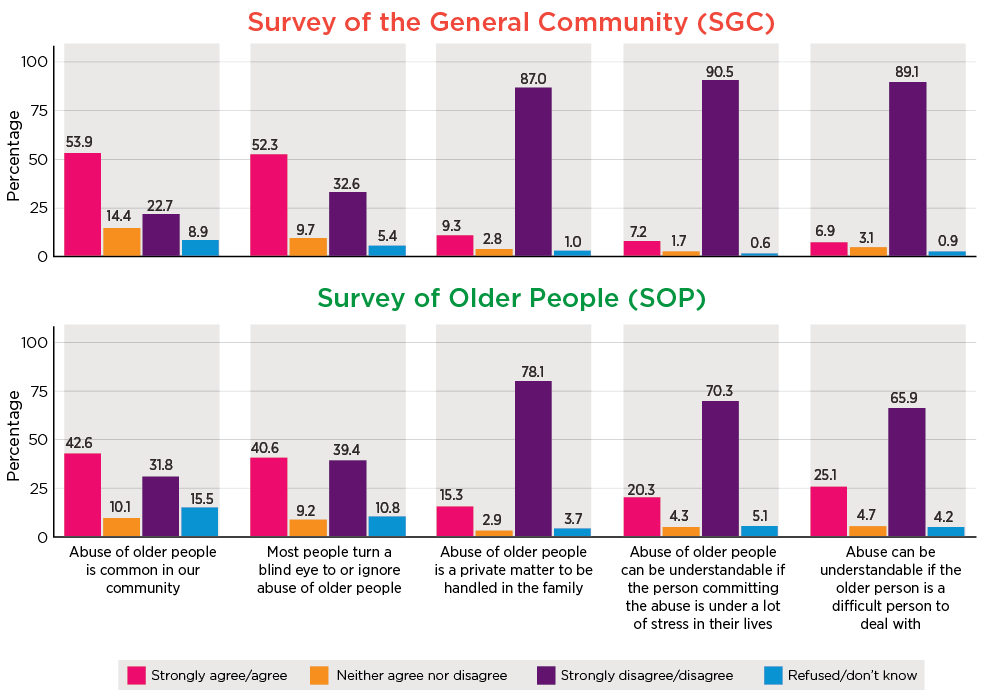
Notes: Weighted data and unweighted sample size. Mean rating (based on 1 = Strongly disagree, 5 = Strongly agree) for SOP in order of columns = 3.2, 3.1, 2.0, 2.1, 2.3). Non-responses ('Don't/know or refusal') were excluded in computing mean ratings.
Attitudes towards elder abuse and socio-demographic characteristics
This section sets out findings in relation to levels of acceptance of elder abuse by SOP participants and SGC participants and the associated socio-demographic characteristics that make them similar and set them apart.
Figure 12.2 shows male participants to be more accepting of elder abuse compared to females (SOP means: 30.6 cf. 26.2; SGC means: 12.7 cf. 8.4) (higher scores indicating more accepting or excusable views towards elder abuse).
Taken together, the findings from SOP participants and the SGC indicate that the youngest people in the SGC (aged 24 years or less) held more accepting views towards elder abuse compared to those aged 25-64 years (Figure 12.3). This is evidenced by SGC participants under 25 being significantly more accepting of elder abuse when compared to participants in the 25-64 age range (means: 14.8 cf. 8.9-10.3).
The SOP sample was more accepting towards elder abuse than the older SGC participants. People aged over 65 years had higher levels of accepting or condoning attitudes towards elder abuse as their age increased. SOP participants in the 65-69 years range had the lowest mean score of all the age groups (22.7) while the oldest age groups (85+ years) had the highest mean score (38.7).
Analysis also suggests that attitudes towards elder abuse were associated with socio-demographic characteristics (see Appendix A, Table A12.1).
Findings relating to country of birth show a uniform pattern among participants. People born in non-English speaking countries show higher acceptance of elder abuse (SOP mean = 32.2, SGC mean = 17.6) compared with those born in English speaking countries (SOP mean = 25.4, SGC mean = 8.7) or in Australia (SOP mean = 27.7, SGC mean = 8.6).
A noteworthy point of difference between the SGC and SOP groups born overseas is that levels of acceptance reduced significantly with longer periods of residence in Australia for general SGC participants. However, this pattern was not evident for SOP participants with levels of acceptance remaining constant despite duration of residence in Australia.
Examination of the findings relating to education levels also indicates a consistent association with levels of acceptance of elder abuse. SOP participants and SGC participants with an education below Year 12 showed higher levels of acceptance (SOP mean = 31.7, SGC mean = 13.4) compared to people who had a degree or higher (SOP mean = 22.1, SGC = 10.4). Similarly, unemployment is associated with higher levels of acceptance of elder abuse (SOP mean = 28.1, SGC mean = 13.6) when compared to those employed (SOP mean = 22.9, SGC = 8.9).
Figure 12.2: SOP and SGC: Mean scores of scale of acceptance attitudes, by gender
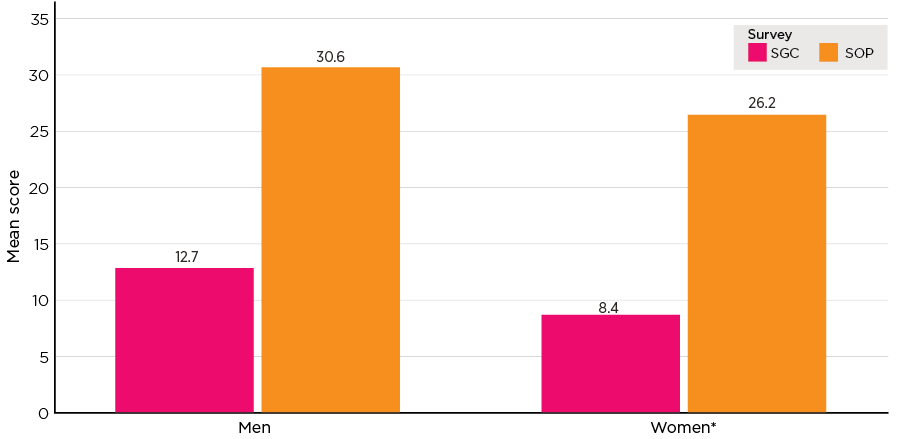
Notes: Weighted data and unweighted sample size (SGC men n = 1,563, women n = 1,760; SOP men n = 2,530, women n = 3,791). *The difference in mean scores between the category and the reference category (listed as the first category) is a statistically significant difference at the 5% level - for both surveys. Statistical significance test is based on bivariate regression.
Figure 12.3: SOP and SGC: Mean scores of scale of acceptance attitudes, by age
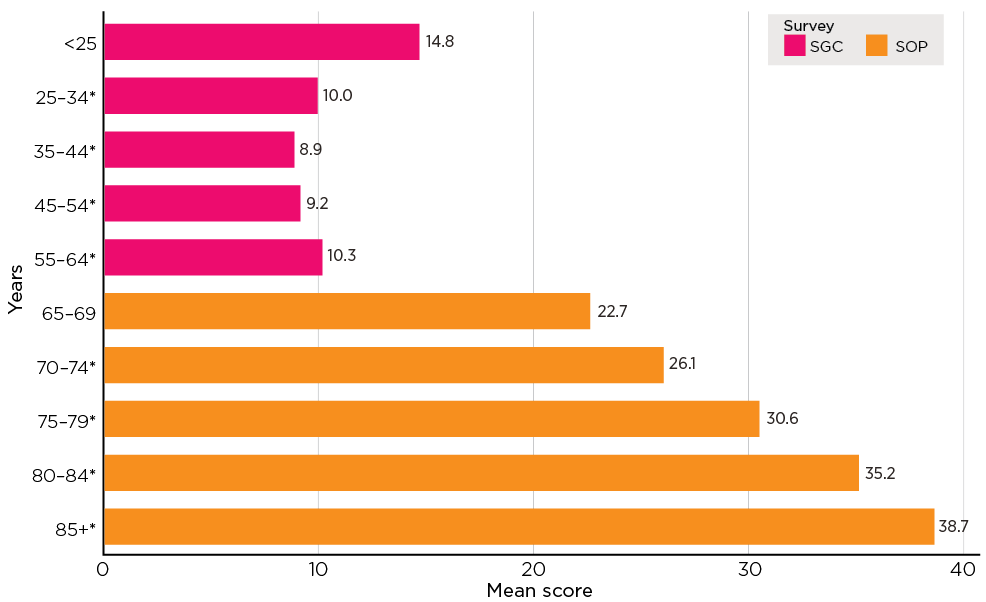
Notes: Weighted data and unweighted sample size (SGC in order of age category n = 405, 535, 591, 768, 1,000; SOP in order of age category n = 1,621, 1,781, 1,357, 955, 617). *The difference in mean scores between the category and the reference category (listed as the first category) is a statistically significant difference at the 5% level for both surveys. Statistical significance test is based on bivariate regression.
Lower levels of household income are also associated with higher levels of acceptance for SOP participants and SGC participants (SOP lowest household income quintile mean = 31.0 cf. middle quintile 27.9 and highest quintile: 22 and SGC lowest household income quintile mean = 13.3 cf. highest quintile mean = 6.6).
Taken together, these findings indicate that:
- Being male, older age, country of birth, identification with religion, low education level and low income are characteristics consistently associated with higher levels of acceptance of abuse for both SOP participants and the SGC sample.
- Living without a partner is associated with higher levels of acceptance of elder abuse and this could indicate a lack of awareness or identification of the behaviours associated with elder abuse for people living without a partner. An association with psychosocial influences such as loneliness and social isolation is also a noteworthy consideration.
Attitudes towards elder abuse and country of birth
As noted in chapter 3, elder abuse as a construct varies in different cultures (e.g. Williams et al., 2017). The process of acculturation can bring change to the norms an individual's attitudes and behaviour are guided by, through the interplay of familial and societal dynamics. To better understand the cultural and social norms that may influence attitudes and behaviours toward elder abuse, further examination of attitudes in the context of place of birth was undertaken (Table 12.1). Findings show that place of birth is associated with acceptance of elder abuse.
Findings from the SOP show attitudinal differences within and between groups from English and non-English speaking countries of birth. There are lower levels of acceptance of elder abuse among participants born in New Zealand compared to those born in Australia (mean 21 cf. 27.7). In comparison to the subsample born in Australia, older participants born in South, East and South-East Europe (mean = 34.9) and South-East Asia (mean = 36.9) were more accepting of elder abuse.
Similar to the findings from the SOP, findings from the SGC show associations between levels of acceptance of elder abuse and country of birth. SGC participants born in Chinese Asia (mean = 24.3) and South-East Asia (mean = 21.7) show higher levels of acceptance than those born in Australia (mean = 8.6). SGC participants born in Africa also reported higher levels of acceptance of elder abuse (mean = 15.0) compared to Australian-born participants. Consistent with the older people sampled, participants born in Australia are more accepting of elder abuse (mean = 8.6) when compared to those born in the United Kingdom or Ireland (mean = 5.7).
| Country of birth | SOP | SGC | ||
|---|---|---|---|---|
| Mean | Number of participants (base) | Mean | Number of participants (base) | |
| Australia | 27.7 | 4,561 | 8.6 | 2,319 |
| New Zealand | 21.0* | 128 | 13.1 | 94 |
| UK/Ireland | 26.2 | 850 | 5.7* | 196 |
| N&W Europe | 27.6 | 211 | .. | 36 |
| South, East, SE Europe | 34.9* | 260 | 8.5 | 66 |
| Middle East, North Africa | 29.0 | 28 | 13.1 | 57 |
| South-East Asia | 36.9* | 77 | 21.7* | 112 |
| Chinese Asia | 34.2 | 27 | 24.3* | 120 |
| South, Central Asia | 30.2 | 46 | 17.6* | 144 |
| North America | 24.0 | 45 | .. | 34 |
| Africa | 28.7 | 57 | 15.0* | 76 |
Notes: *The difference in mean scores between the category and the reference category (born in Australia) is a statistically significant difference at 5% level. Statistical significance test is based on bivariate regression.
Recognition of elder abuse behaviours: findings
This section sets out findings in relation to views toward various elder abuse related behaviours among SOP and SGC participants, together with findings on socio-demographic characteristics that draw attitudes in these two samples together and set them apart. (See Box 12.2 for measures used for this analysis.)
Box 12.2: Measures on recognition of elder abuse behaviours
To derive the level of recognition of elder abuse behaviours, older participants were asked whether 12 actions (or omissions) constitute elder abuse. SGC participants were asked 11 of these 12 items. The set of items were developed based on the survey by Tilse and colleagues (2005) from the University of Queensland and research by Wainer and colleagues (2010) on financial management practices and plans of older Victorians. Participants were asked to select one of the following responses: 'Yes, always', 'Yes, usually', 'Yes, sometimes', or 'No' in response to the statements:
- Selling an older person's home without their consent.
- Taking money from an older person without their consent.
- Not paying bills on the older person's behalf when you said you would.
- Deliberately embarrassing an older person.
- Calling an older person hurtful names.
- Pushing or shoving an older person.
- Not providing help with personal activities such as dressing, washing, feeding when this is normally expected or provided.
- Limiting contact with grandchildren.
- Preventing an older person having contact with the outside world.
- Talking to an older person in a sexual way when they do not want to.
- Threatening to send them to a residential aged care facility.
- Withholding money from the older person (SGC participants were not asked this item).
The responses were assigned to the score: 0 to 'No', 1 to 'Yes, sometimes', 2 'Yes, usually', 3 'Yes, always'. The sum of responses to all the items forms the scale score, and this score was recalibrated to a score range of 0-100, with a higher score indicating a higher level of recognition. The scale was divided into three groups based on quartiles: low recognition (lower quartile, scores of 0-79), moderate recognition (two middle quartiles, scores of 80-97), and high recognition (upper quartile, scores of 99-100).
Participants in both the surveys were asked if they regarded a series of behaviours as abuse of an older person using the following responses: 'Yes, always', 'Yes, usually', 'Yes, sometimes', 'No'. Their responses are presented in Figure 12.4. The following discussion focuses on the extent to which participants provided the response of 'Yes, always'.
Items describing physically abusive behaviours and sexually abusive behaviours had the strongest recognition. Pushing or shoving an older person was recognised as abuse of an older person most frequently ('Yes, always': SOP 86%; SGC 91%). This is consistent with the National Community Attitudes towards Violence against Women Survey (NCAS), which shows higher community recognition for physical violence compared with other types of family violence (Webster et al., 2018, p. 41)
Although 'talking to an older person in a sexual way when they do not want to' was strongly recognised by the general community (89%), a lower proportion of SOP participants (76%) recognised this as a form of elder abuse.
After physical and sexual abuse, the next strongest levels of recognition were accorded to financial abuse, indicated with taking money from an older person without their consent ('Yes always': SOP 81%; SGC 86%). Some variation in the recognition of other forms of financial abuse by SOP participants and the general community were evident, with 'Yes, always' being nominated by the following proportions to:
- selling an older person's home without their consent (SOP 76%; SGC 79%)
- not paying bills on the older person's behalf when they said they would (SOP 75%; SGC 67%).
Consistent levels of recognition for psychological abuse were evident for SOP and SGC participants. Highest recognition was accorded to calling an older person hurtful names (SOP 78%, SGC 79%), deliberately embarrassing an older person (SOP 73%; SGC 75%) and preventing an older person from having contact with the outside world (SOP 68%; SGC 73%). Lowest recognition was evident for limiting contact with grandchildren (SOP 58%; SGC 49%) and threatening to send the older person to a residential aged care facility (SOP 57%; SGC 60%).
In comparison with other forms of abuse, neglect was less well recognised by SOP and SGC participants but the level of recognition from both was similar. Sixty-four per cent of SOP participants and 64% of SGC participants answered 'Yes, always' to not providing help with personal activities such as dressing, washing, feeding when this is normally expected or provided.
Taken together these findings indicate:
- Behaviours relating to physical and financial abuse are more recognisable subtypes of abuse.
- Although psychological abuse has less recognition compared to physical and financial abuse, there is consistency among SOP participants and the general community in recognising the behaviours associated with psychological abuse.
- The social norms that guide the attitudes of SOP participants in relation to sexual abuse appear to differ from the SGC sample and may indicate changing social expectations of behaviours that are acceptable in the Australian community.
- Neglect is the least recognised form of elder abuse. One implication associated with this finding is that there is a likelihood of under-reporting in the community of neglect and, in turn, a lack of response and support for those older people experiencing this form of abuse, consistent with the discussion in chapter 8.
Figure 12.4: SOP and SGC: Views on various abusive behaviours
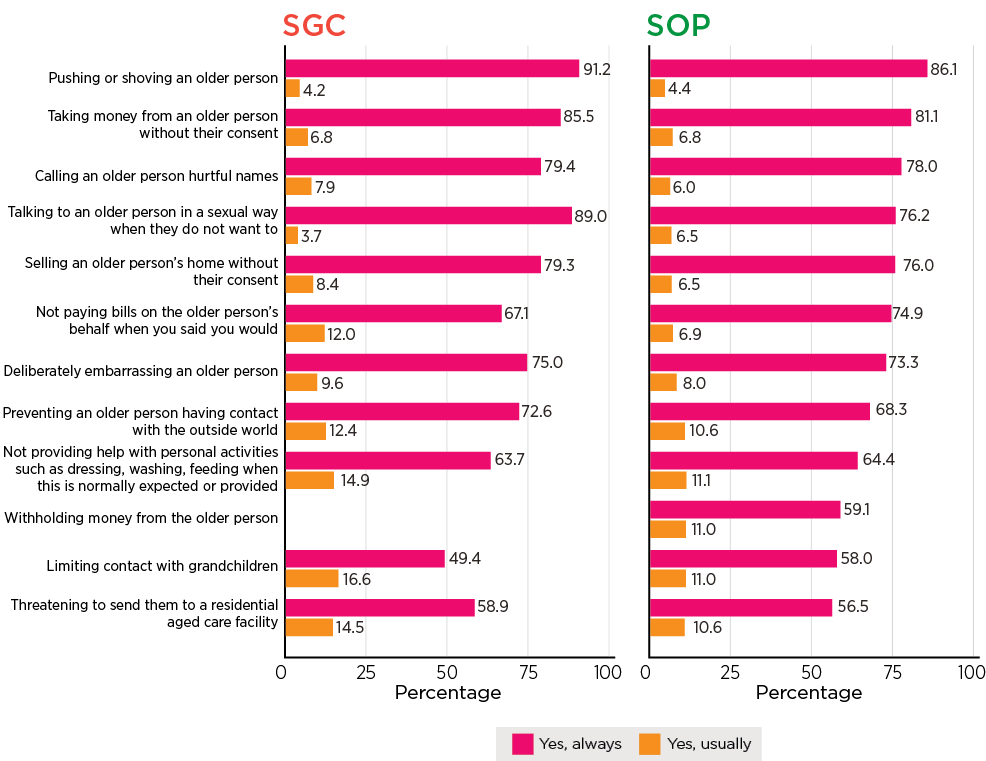
Notes: Weighted data and unweighted sample size (SGC n = 3,400; SOP n = 7,000). Data for 'Yes, sometimes', 'No' and 'Refused/Don't know' not shown.
Recognition of elder abuse behaviours and socio-demographic characteristics
This section sets out findings in relation to levels of recognition of elder abuse by SOP and SGC participants and their associated socio-demographic characteristics. The analysis examines elder abuse behaviour recognition scale scores (higher scores indicating higher levels of identifying abusive behaviours), according to socio-demographic characteristics.
Figure 12.5 shows that female participants are more likely to recognise elder abuse behaviours compared to male participants. In relation to age (Figure 12.6), there was greater recognition of elder abuse in the 65-69 age range (mean = 86.6) compared to older participants aged 75-79 years (mean = 82.2) and 85+ years (mean = 76.9). It is noteworthy that a similar pattern was evident with levels of acceptance of elder abuse by SOP participants. Elder abuse recognition tended to increase with the age of the community participant, ranging from a mean of 80.3 for those under 25 years to 88.5 for 55-64 year olds.
The findings indicate some other socio-demographic characteristics were also associated with views on elder abuse behaviours (full results in Appendix A, Table A12.2). Place of birth was associated with similar levels of recognition of elder abuse for SOP participants and the general community. Compared with those born in Australia (SOP mean = 84.1, SGC mean = 86.4), people born in English speaking countries show greater recognition of elder abuse (SOP mean = 86.8, SGC mean =89.5), whereas those born in non-English speaking countries show lower recognition (SOP mean = 81.7, SGC = 78.7). People living with a partner show higher levels of recognition of elder abuse (SOP mean = 84.4, SGC mean = 86.5) compared to those not living with a partner (SOP mean = 83.2, SGC mean = 82.8).
Some variation in levels of recognition of abuse are associated with education: lower recognition was evident among SOP participants with an education at Year 12 (mean = 82.8) or below Year 12 attainment (83.1) compared with those who had a degree or higher (86.5). In contrast, SGC participants who had a certificate/diploma/trade/other education showed higher levels of recognition compared to SGC participants with a degree or higher (mean = 87.4 cf. 84).
The findings in relation to income are similar. Older people and SGC participants in lower income households show lower levels of recognition of elder abuse compared to those in higher income households.
Figure 12.5: SOP and SGC: Mean scores of scale of recognising abusive behaviours, by gender
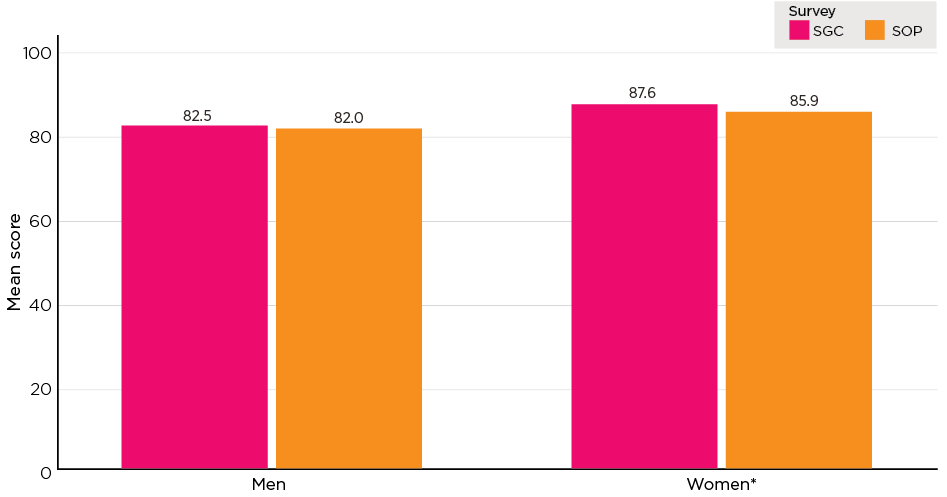
Notes: Weighted data and unweighted sample size (SGC men n = 1,587, women n = 1,778; SOP men n = 2,662, women n = 4,134). *The difference in mean scores between the category and the reference category (listed as the first category) is a statistically significant difference at the 5% level for both surveys. Statistical significance test is based on bivariate regression.
Figure 12.6: SOP and SGC: Mean scores of scale of recognising abusive behaviours, by age
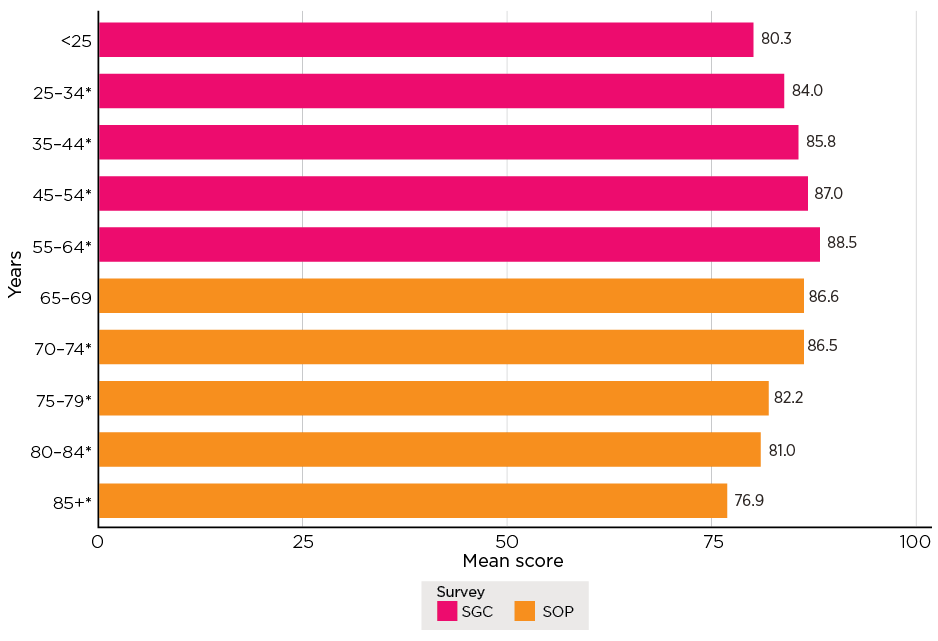
Notes: Weighted data and unweighted sample size (SGC in order of age category n = 409, 542, 603, 773, 1,013; SOP in order of age category n = 1,659, 1,891, 1,490, 1,066, 699. *The difference in mean scores between the category and the reference category (listed as the first category in each survey) is a statistically significant difference at the 5% level. Statistical significance test is based on bivariate regression.
Recognition of elder abuse behaviours and country of birth
Consistent with the findings in relation to acceptance of elder abuse and country of birth, the findings set out in Table 12.2 show that country of birth is associated with varied levels of recognition of elder abuse.
| Country of birth | SOP | SGC | ||
|---|---|---|---|---|
| Mean | Number of participants (base) | Mean | Number of participants (base) | |
| Australia | 84.1 | 4,869 | 86.4 | 2,338 |
| New Zealand | 88.3* | 132 | 88.9* | 95 |
| UK/Ireland | 86.5* | 923 | 90.5 | 197 |
| N&W Europe | 86.5 | 228 | .. | 36 |
| South, East, SE Europe | 82.8 | 308 | 86.6 | 70 |
| Middle East, North Africa | .. | 36 | 85.8 | 61 |
| South-East Asia | 67.7* | 78 | 76.4* | 117 |
| Chinese Asia | 62.0* | 29 | 69.6* | 120 |
| South, Central Asia | 82.5 | 56 | 81.3* | 147 |
| North America | 89.6* | 44 | .. | 34 |
| Africa | 85.5 | 60 | 83.8 | 78 |
Notes: *The difference in mean scores between the category and the reference category (born in Australia) is statistically significant difference at 5% level. Statistical significance test is based on bivariate regression.
Older participants born in Australia showed higher levels of recognition of abuse (mean = 84.1) when compared to older participants born in South-East Asia (mean = 67.7). However, older participants born in New Zealand (mean = 88.3) and the United Kingdom/Ireland (mean = 86.5) showed higher levels of recognition of elder abuse when compared to older participants born in Australia (mean = 84.1).
The findings for SGC participants show patterns generally consistent with the findings from the SOP. The highest levels of recognition of elder abuse reported was by SGC participants born in the United Kingdom/Ireland (mean = 90.5). Compared to SGC participants born in Australia (mean = 86.4), those born in Chinese Asia, South-East Asia and South, Central Asia showed less recognition of elder abuse (69.6, 76.4 and 81.3 respectively).
Ageism, intergenerational support and sense of entitlement
Understanding the range of attitudes that may directly or indirectly influence the occurrence of and experience of elder abuse is of significance from an intervention perspective. The dynamic interplay between social, cultural and psychological influences contributes to the construction of ageist attitudes towards different age groups (Swift et al., 2018). Understanding how ageist attitudes are constructed increases the capacity to deconstruct the associated negative aspects of ageist attitudes and, in turn, their influence on the occurrence of and experience of elder abuse.
A report recently released by the World Health Organization ([WHO], 2021) found that ageism is widespread in many parts of the world and it extends to various institutions and sectors of society. Attitudes towards older people vary across countries and cultures. The WHO report found that regions such as the South-East Asian and Western Pacific regions held the most negative attitudes towards older people, while those in anglophone cultures and the European region hold the most positive views towards older people of the regions examined (pp. 32-33).
This section expands on the attitudinal findings previously presented by setting out findings from the general community sample relating to attitudes of ageism, intergenerational support and sense of entitlement. (See Box 12.3 for measures used in this analysis.)
Box text 12.3: Measures on ageism
The Ageism scale was used to measure attitudes (i.e. prejudiced or discriminatory views) of the general community sample towards older people. The first six items are selected from the ambivalent ageism scale that was developed and tested by Cary, Chasteen, and Remedios (2017). The original scale contained 13 items. Due to limitations associated with the survey length, the SGC could only accommodate six items - three items that measure benevolent ageism (items 1, 2 and 5 as listed below) and three that measure hostile ageism (items 3, 4 and 6 as listed below).16 For each of the following items, participants could select a response option ranging from 0-10 where 0 indicated 'Strongly disagree' and 10 indicated 'Strongly agree':
- It is helpful to repeat things to older people because they rarely understand the first time.
- Older people need to be protected from the harsh realities of society.
- It is good to tell older people that they are too old to do certain things; otherwise they might get their feelings hurt.
- Most older people interpret innocent remarks or acts as being ageist.
- Even if they want to, older people shouldn't be allowed to work because they have already paid their debt to society.
- Older people are a drain on the health care system and the economy.
The ratings to items 1, 2 and 5 were reversed. The mean of responses to the six items formed composite scales as a continuous variable and this score was then recalibrated to a score range of 0-100. Higher scores indicate higher levels of ageism towards older people.
Ageism
Table 12.3 presents findings in relation to the items used to derive understanding of the extent of prejudiced and discriminatory attitudes towards older people in the SGC sample. The majority of general SGC participants reported low levels of ageist attitudes towards older people. An attitude of ageism towards older people was indicated by a minority of general SGC participants who provided ratings of 7-10 (8-33%). Mean ratings across all six items ranged from 2.2 to 4.9 (on a 0-10 scale) and the overall mean score of the ageism scale was 37.4 out of 100 (with higher ratings indicating higher levels of ageism towards older people).
The findings show that the highest level of agreement was in response to the statement 'It is helpful to repeat things to older people because they rarely understand the first time' (mean = 4.9) and the lowest level of agreement showed in response to the statement 'Older people are a drain on the health care system and the economy' (mean = 2.2).
Slightly less than one-third of SGC participants expressed agreement with 'It is helpful to repeat things to older people because they rarely understand the first time' and 'Older people need to be protected from the harsh realities of society'. Twenty-five per cent of SGC participants agreed 'It is good to tell older people that they are too old to do certain things; otherwise they might get their feelings hurt.'
| Ageism scale | Mean rating a | Disagree (ratings 0-3) (%) | Neither (ratings 4-6) (%) | Agree (ratings 7-10) (%) | Don't know/ Refused (%) | Total (%) | Number of participants (base) |
|---|---|---|---|---|---|---|---|
| Individual items (0-10, higher rating = high level of ageism) | |||||||
| It is helpful to repeat things to older people because they rarely understand the first time | 4.9 | 36.6 | 29.9 | 32.7 | 0.8 | 100.0 | 3,400 |
| Older people need to be protected from the harsh realities of society | 4.4 | 45.7 | 22.9 | 30.0 | 1.3 | 100.0 | 3,400 |
| It is good to tell older people that they are too old to do certain things; otherwise they might get their feelings hurt | 4.1 | 44.8 | 28.4 | 25.1 | 1.6 | 100.0 | 3,400 |
| Most older people interpret innocent remarks or acts as being ageist | 3.9 | 41.5 | 39.0 | 14.0 | 5.4 | 100.0 | 3,400 |
| Even if they want to, older people shouldn't be allowed to work because they have already paid their debt to society | 2.9 | 66.4 | 18.0 | 14.9 | 0.7 | 100.0 | 3,400 |
| Older people are a drain on the health care system and the economy | 2.2 | 72.9 | 17.6 | 7.8 | 1.6 | 100.0 | 3,400 |
| Total scale score (0-100, higher ratings = higher level of ageism) | 37.4 | N/A | N/A | N/A | N/A |
Note: a 'Don't know' or 'Refused' were excluded when calculating means.
Ageism and socio-demographic characteristics
Analyses indicated that a range of demographic, socio-economic characteristics were associated with ageist attitudes. Figure 12.7 and Figure 12.8 show mean scores on the ageism scale for men and women and different age groups. (Mean scores by other socio-economic characteristics are shown in Appendix A, Table A12.3).
Although the overall level of ageism evident in the SGC sample was low, some differences across these characteristics were evident:
- Higher ageist levels present among male participants (mean = 39.2) compared with females (mean = 35.7).
- Younger SGC participants showed higher ageism levels than older participants with the highest being for participants in the youngest age group (<25, mean = 39.9) and the lowest ageism level being for the oldest age group (55-64 years, mean = 35.9). The 35-44 age group (mean = 36.9) and the 45-54 age group (mean = 36.7) also showed lower levels of ageism when compared to SGC participants under 25 years of age.
- SGC participants born in non-English speaking countries showed higher levels of ageism (mean = 51) than those born in Australia (mean = 33.3) and English speaking countries (mean = 34.9).
- Higher ageism levels were present for people not living with a partner (mean = 39) than those living with a partner (mean = 36.3).
- SGC participants with no partner or children (mean = 39.8) showed higher ageism levels compared to those partnered and with child/ren (mean = 37).
- SGC participants with an education below Year 12 (mean = 42.5) showed higher levels of ageism than participants with a degree or higher (mean = 35.7).
- SGC participants not employed (mean = 41.8) showed higher levels of ageism than people employed full-time (mean = 35.9).
- Ageism levels were significantly higher as participants' levels of personal income lowered (lowest personal income quintile 40.2 cf. highest personal income quintile 30.2).
- Ageism levels were significantly higher as participants' levels of household income lowered (lowest household income quintile mean = 40.8 cf. highest household income quintile mean = 29.6).
- Higher ageism levels also showed for SGC participants who rented from a public housing authority (mean = 49.4), rented from a private landlord (mean = 40.3), or lived in other housing arrangements (boarding, living at home, etc.) (mean = 39.8) compared to those who owned their home outright (mean = 35.4).
- SGC participants in the lowest socio-economic quintile (mean = 40.5) showed the highest levels of ageism compared to those in the highest socio-economic quintile (mean = 33.7).
- Higher levels of ageism showed for SGC participants who lived outside of a capital city (mean = 35.8 cf. 38.1 for capital city).
The patterns in the attitudes towards older people in relation to age and gender were consistent with the research on ageism based on an online survey conducted by The Benevolent Society (2017). This research showed that men were less likely to hold positive attitudes towards ageing and older people than women (p. 26). Further, negative views towards ageing and older people declined with the increasing age of the participants (p. 111).
Figure 12.7: Survey of the General Community: Bivariate analysis of the Ageism scale by gender - Mean score

Notes: Weighted data. Unweighted sample size (men n = 1,597, women n = 1,783). * The difference in mean scores between the category and the reference category (listed as the first category) is a statistically significant difference at the 5% level. Statistical significance test is based on univariate regression.
Figure 12.8: Survey of the General Community: Ageism scale by age - Mean score
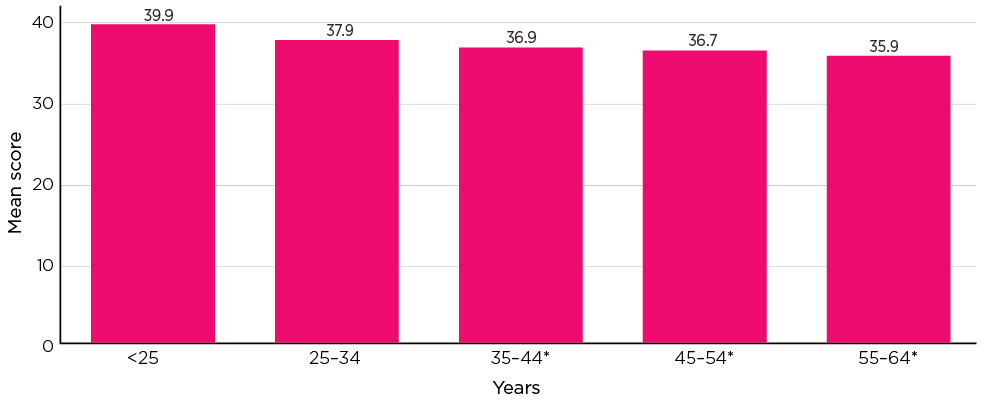
Notes: Weighted data. Unweighted sample size (In order of age category n = 408, 545, 606, 775, 1,021). * The difference in mean scores between the category and the reference category (listed as the first category) is a statistically significant difference at the 5% level. Statistical significance test is based on univariate regression.
Ageism and country of birth
This section extends understanding of attitudes of ageism and country of birth. Findings in Table 12.4 show that the highest levels of ageism were reported by those born in Asian countries. Those born in Chinese Asia and South, Central Asia showed a higher level of ageism (mean score = 56) than those born in Australia (mean = 33). In addition, over half of all SGC participants born in Asia scored in the upper quartile compared to 16% of Australian-born participants.
The findings also show higher levels of ageism for those born in South and East Europe, Africa and the Middle East and North Africa. Noting that the composition of Australia's migrant intake has changed over time, these results may be related to the length of time in Australia or age of the participant.
| Country of birth | Mean | Lower quartile (%) | Middle quartile (%) | Upper quartile (%) | Total (%) | Number of participants (base) |
|---|---|---|---|---|---|---|
| Australia | 33.2 | 32.4 | 51.3 | 16.3 | 100.0 | 2,349 |
| New Zealand | 39.2* | 24.0 | 49.6 | 26.4 | 100.0 | 96 |
| UK/Ireland | 32.6 | 38.9 | 41.9 | 19.2 | 100.0 | 197 |
| N&W Europe | 38.6 | 24.7 | 42.8 | 32.4 | 100.0 | 36 |
| South, East, SE Europe | 44.6* | 18.2 | 48.9 | 32.9 | 100.0 | 72 |
| Middle East, North Africa | 51.6* | 11.2 | 31.2 | 57.6 | 100.0 | 61 |
| South-East Asia | 52.7* | 6.4 | 41.9 | 51.7 | 100.0 | 120 |
| Chinese Asia | 55.7* | 1.9 | 38.1 | 60.0 | 100.0 | 120 |
| South, Central Asia | 55.6* | 6.1 | 29.7 | 64.1 | 100.0 | 147 |
| North America | 25.9* | 50.2 | 47.2 | 2.7 | 100.0 | 34 |
| Africa | 42.6* | 23.2 | 41.5 | 35.3 | 100.0 | 77 |
Notes: * The difference in mean scores between the category and the reference category (listed as the first category) is a statistically significant difference at the 5% level. Statistical significance test is based on bivariate regression.
Intergenerational support
Views regarding intergenerational support and sense of entitlement are shown in Table 12.5. There was general agreement with intergenerational support among SGC participants (mean = 66.5). Regarding individual items, the highest level of agreement was related to supporting parents financially (mean = 7.3) and with living with ageing parents (mean = 7.0). In contrast, the lowest level of agreement related to adult children being supported financially and with co-residence (mean = 5.5 and 6.8 respectively).
Box 12.4: Measures on intergenerational support and entitlement
To measure attitudes to intergenerational support, the Intergenerational Support Scale was used. Response options to items were on a scale ranging from 0 (strongly disagree) to 10 (strongly agree) with the scale taking the mean of ratings to the four items17 and the score recalibrated to a score range of 0-100. Higher scores on the scale indicate higher levels of agreement with intergenerational support.
- Adult children should help their ageing parents financially if they need it.
- Adult children should let their ageing parents live with them if they need to.
- Parents should let their adult children live with them if they need to.
- Parents should help their adult children financially if they need it.
Sense of entitlement was measured using a single item and the findings are presented alongside the findings on intergenerational support. Response options to the item were on a scale ranging from 0 (strongly disagree) to 10 (strongly agree) with higher levels indicating a stronger sense of entitlement. Participants were asked to respond to the following statement:
- Other family members are entitled to some of the older person's assets if they have assisted the older person on a regular basis.
The findings on the general strong endorsement of intergenerational support were consistent with the work of Weston and Qu (2016) that examined attitudes towards intergenerational support based on a sample aged 18 years and older.18 Their work showed most participants agreed with the provision of financial support to ageing parents as well as to adult children. However, the authors indicated that there was greater support for parents letting adult children live with them than the other way around. The SGC data showed similar but slightly greater support for adult children letting their ageing parents live with them. While this difference may be attributed to different methodologies between the SGC and the data on which this previous research was based (e.g. sampling), further research could shed light on any change in attitudes towards intergenerational support in the Australian context.
| Intergenerational Support scale and Sense of Entitlement item | Mean rating a | Disagree (ratings 0-3) (%) | Neither (ratings 4-6) (%) | Agree (ratings 7-10) (%) | Don't know/ Refused (%) | Total (%) | Number of participants (base) |
|---|---|---|---|---|---|---|---|
| Intergenerational Support scale items | |||||||
| Adult children should help their ageing parents financially if they need it | 7.3 | 6.4 | 24.1 | 69.0 | 0.4 | 100.0 | 3,400 |
| Adult children should let their ageing parents live with them if they need | 7.0 | 8.4 | 28.5 | 62.7 | 0.4 | 100.0 | 3,400 |
| Parents should let their adult children live with them if they need to | 6.8 | 8.8 | 32.4 | 58.6 | 0.3 | 100.0 | 3,400 |
| Parents should help their adult children financially if they need it | 5.5 | 23.4 | 38.3 | 37.6 | 0.7 | 100.0 | 3,400 |
| Total Intergenerational Support scale (0-100, higher ratings = higher level of support). Scale based on first 4 items. | 66.5 | N/A | N/A | N/A | N/A | N/A | N/A |
| Other family members are entitled to some of the older person's assets if they have assisted the older person on a regular basis | 4.6 | 32.8 | 37.8 | 27.3 | 2.1 | 100.0 | 3,400 |
Note: a 'Don't know' or 'Refused' were excluded when calculating means.
Intergenerational support and demographic and socio-economic attributes
Figure 12.9 and Figure 12.10 show that attitudes toward intergenerational support varied according to gender and age.
- Male SGC participants (mean = 67.4) were more likely to agree with the provision of intergenerational support than female participants (mean = 65.6).
- Younger participants (under 25 years) expressed stronger intergenerational support (mean = 70) than participants aged 35-44 years (mean = 66.9), 45-54 years (mean = 65.5) and 55-64 years (mean = 61.2).
Analysis indicated that attitudes towards intergenerational support varied according to socio-demographic characteristics (see Appendix A, Table A12.4). Some differences are evident in the extent to which SGC participants agreed with intergenerational support:
- Country of birth was also associated with intergenerational support. SGC participants born in non-English speaking countries showed higher levels of agreement with intergenerational support (mean = 73.2) than those born in Australia (mean = 64.9).
- Participants who first arrived in Australia less than five years ago showed stronger intergenerational support (mean = 75.2) compared to those who had been in Australia 15 years or more (mean = 64.7).
- SGC participants who identified with another religion (mean = 67.1) or no religion (mean = 73.4) showed higher intergenerational support than participants who identified as Christian (mean = 64.2).
- SGC participants not living with a partner showed higher intergenerational support (mean = 68.1) compared to those living with a partner (mean = 65.6).
- SGC participants living with a partner but no children showed the least intergenerational support (mean = 62.7) compared to those partnered with child/ren (mean = 67.3).
- SGC participants who had low personal income levels showed higher levels of intergenerational support (mean = 67.3) than those on the fourth highest household income quintile (mean = 63.9).
- SGC participants who had low household income levels showed higher levels of intergenerational support (mean = 67.6) than those on the fourth highest household income quintile (mean = 63.7).
- SGC participants who owned their home (mean = 63.2) showed less intergenerational support when compared to participants living in other types of housing situations and particularly those renting from a public housing authority (mean = 74.6).
- Across geographic areas, participants living in a capital city showed higher intergenerational support (mean = 67.6) than those participants living in the rest of the state (mean = 64).
Figure 12.9: Survey of the General Community: Bivariate analysis of the Intergenerational Support scale by gender - Mean score
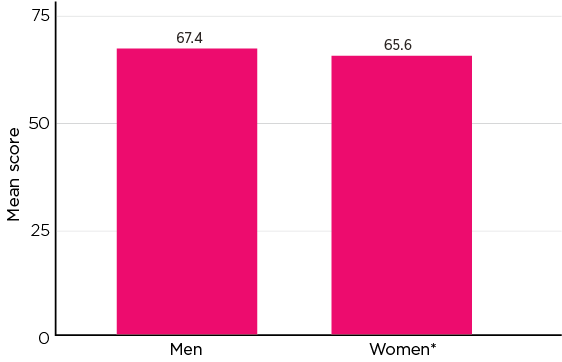
Notes: Weighted data. Unweighted sample size (men n = 1,597, women n = 1,777). * The difference in mean scores between the category and the reference category (listed as the first category) is a statistically significant difference at the 5% level. Statistical significance test is based on univariate regression.
Figure 12.10: Survey of the General Community: Bivariate analysis of the Intergenerational Support scale by age - Mean score
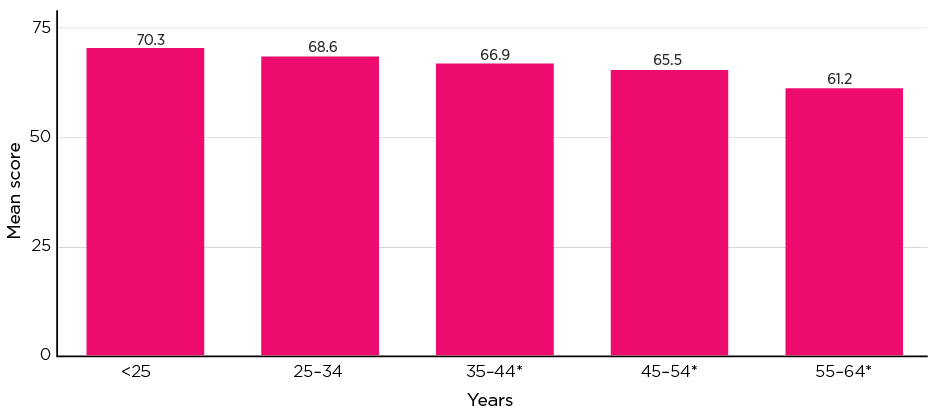
Notes: Weighted data. Unweighted sample size (In order of age category n = 409, 546, 603, 773, 1,016). * The difference in mean scores between the category and the reference category (listed as the first category) is a statistically significant difference at the 5% level. Statistical significance test is based on univariate regression.
Intergenerational support and country of birth
This section extends understanding of attitudes to intergenerational support and country of birth with further analysis undertaken to explore differences according to country of birth. The findings presented in Figure 12.11 show stronger agreement with intergenerational support from those born in South and Central Asia, the Middle East and North Africa and South-East Asia (mean = 82.3, 77.9 and 75 respectively). These levels of support were substantially higher than for those SGC participants born in Australia (mean = 64.9). SGC participants born in the United Kingdom/Ireland (60.5) and North and Western Europe (54.4) showed lower affirmation of intergenerational support compared to Australian-born participants.
Figure 12.11: Survey of the General Community: Intergenerational Support Scale by country of birth - Mean score
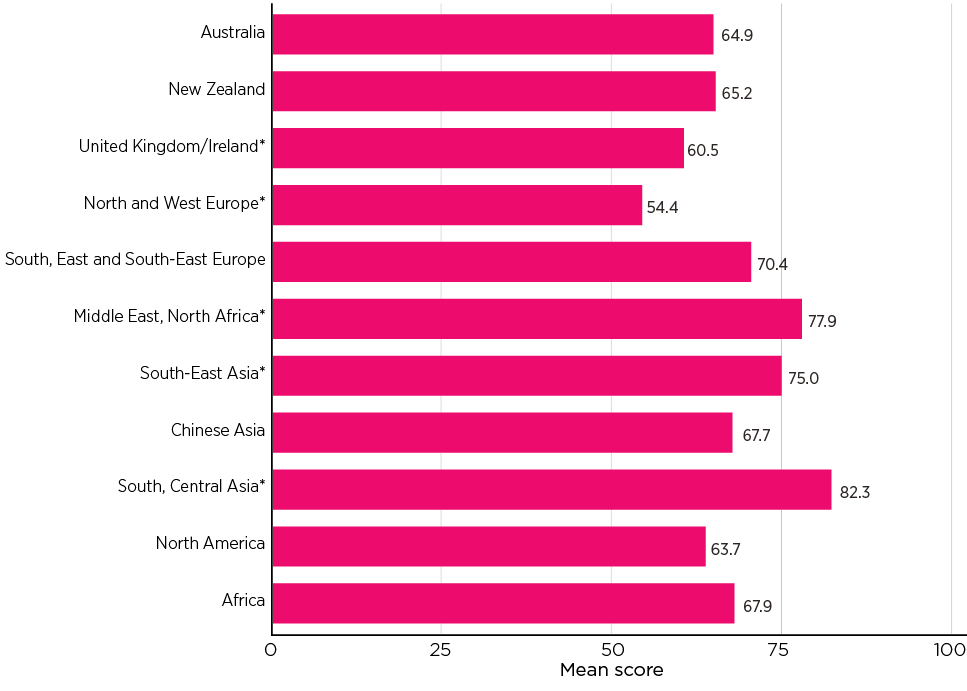
Notes: Weighted data and unweighted sample size (in order of bar, n = 2,339, 96, 197, 36, 72, 61, 121, 123, 148, 33, 78). * The difference in mean scores between the category and the reference category (listed as the first category) is a statistically significant difference at the 5% level. Statistical significance test is based on univariate regression.
Attitudes towards older people, intergenerational support and elder abuse
To better understand the attitudes that may influence experiences of elder abuse, the association between ageist attitudes towards older people and community views on intergenerational support were examined. Table 12.6 shows correlations between ageism, intergenerational support and sense of entitlement. An association between the three was evident:
- More ageist attitudes were associated with a greater endorsement of intergenerational support and a stronger belief that family members are entitled to an older persons' assets for their provision of regular assistance.
- Greater endorsement of intergenerational support was associated with a stronger belief in family members being entitled to an older person's assets in return for providing regular assistance.
| Ageism scale (0-100) | Intergenerational Support scale (0-100) | Agreement rating with assets entitlement for regular assistance (0-10) | |
|---|---|---|---|
| Ageism scale | 1.00 | ||
| Intergenerational Support scale | 0.29 | 1.00 | |
| Sense of entitlement | 0.37 | 0.28 | 1.00 |
Note: a The statement was: 'Other family members are entitled to some of the older person's assets if they have assisted the older person on a regular basis'.
Further analysis was carried out to explore how attitudes toward older people are associated with attitudes toward elder abuse. Table 12.7 shows:
- More ageist views are associated with more condoning attitudes towards elder abuse (r = .35).
- Higher levels of ageist attitudes towards older people are associated with lower levels of recognition of elder abuse behaviours (r = -.28).
- Associations between attitudes towards elder abuse and intergenerational support were negligible.
- Associations between attitudes toward elder abuse and views on assets entitlement for regular assistance were also negligible.
| Ageism scale (0-100) | Intergenerational Support scale (0-100) | Agreement rating with assets entitlement for regular assistance (0-10) | |
|---|---|---|---|
| Elder abuse acceptance scale (0-100) | 0.35 | 0.11 | 0.18 |
| Elder abuse recognition scale (0-100) | -0.28 | -0.03 | -0.13 |
Note: a The statement was: 'Other family members are entitled to some of the older person's assets if they have assisted the older person on a regular basis'.
Summary
This chapter has examined the social values and norms that provide the context for elder abuse in Australia. The chapter has specifically examined acceptance and recognition of elder abuse among older people and the general community. It has also examined the prevalence of ageist views, as well as attitudes to intergenerational support, among the general community. The analysis has highlighted variations in these areas connected to some socio-demographic characteristics.
Overall, participants were not accepting of elder abuse but when subgroups in the sample were examined, findings showed male participants and particularly those born in non-English speaking countries to be more accepting of elder abuse than older females in the SOP. This gender difference held for the SGC.
Age of participants played a role in acceptance of elder abuse. Findings from the SOP sample showed increasing acceptance of elder abuse as age increased whereas in the SGC sample, the youngest age group showed greater acceptance of elder abuse.
SOP and SGC participants born in non-English speaking countries were more likely to be accepting of elder abuse than those born in English speaking countries or Australia.
For both samples, particular demographic and socio-economic characteristics were associated with a higher degree of acceptance of elder abuse. These include identifying with lower education level, unemployment (or retirement), low income and home ownership or rental.
When exploring the recognition of elder abuse subtypes, SOP and SGC participants were more likely to identify financial and physical abuse when compared to psychological abuse and neglect. A strong proportion of SGC participants also recognised sexual abuse. This was not the case with the SOP sample. This may be part of the explanation for the under-reporting of this subtype of abuse (chapter 9).
SOP and SGC participants born in English speaking countries showed greater recognition of elder abuse compared to those born in Australia and non-English speaking countries.
The findings in relation to ageism are generally consistent with the patterns emerging in the findings for acceptance and recognition. Males showed a greater tendency toward ageist attitudes than females and younger people were associated with greater ageist attitudes towards older people. Participants born in non-English speaking countries showed greater ageist attitudes compared to those born in English speaking countries and in Australia. These findings were similar to the factors that the WHO report (2021) identified as factors associated with attitudes consistent with ageism.
Particular demographic and socio-economic characteristics were associated with a greater ageist attitudes and these included lower education level, unemployment, low income and socio-economic contexts.
SGC participants generally showed positive attitudes towards intergenerational support with regard to supporting parents financially and with co-residence. Stronger acceptance of intergenerational support was demonstrated by participants born in non-English speaking countries.
Intergenerational support was also associated with a stronger belief in family members being entitled to an older person's assets in return for their provision of regular assistance.
The findings presented in this chapter are consistent with the current directions in approaches to preventing family violence premised on a socio-ecological approach (Cripps et al., 2019). As with greater recognition of physical forms of family violence (Webster et al., 2018), this chapter establishes greater recognition of physical forms of elder abuse and lower recognition of other forms such as neglect.
Findings about the lower recognition and awareness of elder abuse among some groups, including older men, are consistent with findings in chapter 7 about men, and people in the 65-74 years age group being significant among perpetrator groups. Similarly, these patterns provide further context for understanding findings about men, in particular, being less inclined to seek help and advice about elder abuse in chapter 8.
A range of demographic factors extending beyond age and gender need to be considered in understanding the possible drivers of elder abuse. Economic and social marginalisation along with cultural background are characteristics of the people sampled that are associated with less consistent attitudes towards to the recognition and disapproval of elder abuse. Similarly, findings from the National Community Attitudes Towards Violence Against Women Survey (NCAS) showed that country of birth/length of time in Australia and English language proficiency are the two strongest demographic predictors of attitudes supportive of violence against women (Webster et al., 2018).
In summary, consistent with the direction of violence against women research (McCook & Powell, 2020), understanding the normative processes underlying the social norms highlighted in this chapter and how they influence family and intergenerational dynamics is important. These findings point to the need for the development of an evidence-based prevention framework. They also suggest a need for further service development to effectively respond to older people experiencing elder abuse.
Elder abuse and CALD groups: synthesis
Key messages

Introduction
This chapter draws together the findings of the CALD substudy from previous chapters to provide a synthesis of the results in relation to the CALD subgroups in the SOP and SGC. These findings are based on the responses of 608 SOP participants who spoke a language other than English at home, and 660 SGC participants who were born in a non-English speaking country.19 For the SOP CALD subgroup, 85% were also born outside of Australia in addition to speaking a language other than English at home. As such, these findings shed light on the experience of elder abuse for people from non-English speaking backgrounds.
In the context of the methodology applied in this research, there are a number of issues that need to be taken into account when considering the findings summarised in this chapter. First, each of the cultures represented in the CALD subgroup has its own unique characteristics, including potentially diverse characteristics within the subgroup. Comparisons between CALD subgroups in the SOP are not amenable to examination in this methodology, largely due to small sample sizes. There are some limited comparisons available in the SGC findings based on country of birth where sample sizes permitted.
Second, the social context for these findings is unique internationally, given the socio-demographic characteristics of the CALD population in Australia and the varied make-up of the immigrant population. It ranges from migrants from post-war Europe to recently arrived humanitarian migrants from countries such as Iraq, Democratic Republic of Congo and Myanmar (Department of Home Affairs, 2019).
Third, this research has demonstrated that a range of issues, including socio-economic issues, influence the prevalence of elder abuse. It is therefore difficult to disentangle the influence of culture from other influences, including the psycho-social and economic consequences of immigration and the experiences that preceded it. As noted in chapter 4, it is likely that these samples under-represent people with limited proficiency in English, even though 146 SOP participants and 83 SGC participants were interviewed in languages other than English. For these reasons, caution should be applied in interpreting the findings, particularly in attributing the findings to CALD status per se.
However, it is also evident that the findings in this chapter provide new insight into the way that being from a CALD background influences the experience of elder abuse. Findings in relation to the CALD-specific abuse subtype, abuse relating to language and culture, describe abuse dynamics arising particularly from CALD status. This is evident in findings that this type of abuse is perpetrated less by family members (who are likely to share the same cultural background as the victim) and more by friends, neighbours and acquaintances. This places a focus on the intercultural dimensions of elder abuse, suggesting that being of CALD background is associated with vulnerability to additional types of abuse. This indicates it is important to consider the influence of racist attitudes, in addition to ageist attitudes, on the way CALD groups experience elder abuse.
Prevalence of elder abuse
The overall prevalence of elder abuse in the CALD subgroup does not differ significantly from the prevalence overall in the general population, with 14% of the CALD subgroup reporting an experience of elder abuse compared to 15% of the non-CALD sample (Table 5.7).
With the exception of financial abuse, the prevalence of different types of abuse were similar for the CALD subsample and the non-CALD sample (Table 5.7).
In relation to financial abuse, CALD participants were slightly less likely to report experiencing financial abuse (1.6%) compared to the non-CALD sample (2.1%). This finding contrasts with some previous research that is mainly qualitative, which has suggested that people from CALD groups may be at higher risk of financial abuse because of language barriers (see summary in Dow & Brijnath, 2019). Findings in other areas, however, suggest that some people from CALD backgrounds might be more susceptible to particular kinds of financial abuse. Greater use of family agreements, especially among CALD older women, was reported in chapter 10, raising concerns about abuse in this particular context (Boersig & Illidge, 2018).
As with the whole sample, psychological abuse was the most commonly reported of the five subtypes for the CALD participants (11.9%, cf. 11.7% whole sample).
Reports of physical abuse among the CALD subsample (1.6%) were almost on par with prevalence rates in the non-CALD sample (1.8%). The prevalence of sexual abuse for CALD and non-CALD participants was the same (1.0%). Reports of neglect were also very similar between CALD (2.6%) and non-CALD (2.9%) participants.
The CALD-specific abuse subtype, abuse relating to language and culture, was reported by 4% of the CALD subsample. For this subtype of abuse, the most common abuse item was 'not respecting you when talking to you because of your culture, race or ethnicity' (67%). The next most common subtype item was being 'made to feel like you are just free labour', reported by 45%.
The analysis of abuse subtypes and overall (experience of at least one form of abuse) by country of birth (Australia, English speaking countries, non-English speaking countries) (Tables 6.2-6.8) indicates similar prevalence patterns.
Characteristics of those who experience abuse in the CALD subsample
The socio-demographic characteristics associated with experiencing elder abuse are similar in the CALD and non-CALD samples. In this respect, findings in key areas are as follows, and are consistent with the pattern of findings for the non-CALD sample (Table 6.10).
- The prevalence rate is higher for CALD women compared to CALD men (14.2% cf. 13.8%).
- Elder abuse decreased with age among the CALD sample, from 16.3% for the 65-74 years age group to 10% for the older age group (75-84 years).
- Living alone (compared to living in a couple arrangement) is associated with elder abuse for the CALD sample (14.7% cf. 13.7%).
- Living with children (compared to not living with children) is associated with elder abuse for the CALD sample (16.1% cf. 13.5%).
- The same differences of prevalence in elder abuse by each characteristic above were found in the non-CALD sample.
There is one area where a difference was evident: living with others was associated with a higher risk of experiencing elder abuse for the non-CALD sample (22.8%) but this was not evident for CALD sample (14.1%). It is worth noting that it is much less common for older people, in a community setting, to live with persons other than their spouse/partner (less than 8%). The arrangements concerning living with others are diverse (e.g. with adult children, other relatives, non-family members). As such, this finding should be treated with caution.
For abuse relating to language and culture, the socio-demographic characteristics associated with these experiences are consistent with those outlined above. Prevalence of this kind of abuse was higher in the younger age bracket (65-74 years: 5.4%) than the older age bracket (75-84 years: 2.1%). Living with children is also associated with a slightly higher likelihood of experiencing this kind of abuse, with 4.4% of those living with children reporting abuse relating to language and culture compared with 3.9% of those in other living arrangements (Table 6.11).
Comparisons within the CALD subsample for CALD related abuse according to country of birth were not possible due to small sample sizes.
CALD subsample and perpetrator profiles
Overall, the findings in relation to who commits elder abuse are similar for the CALD and non-CALD samples. For both groups, the most common perpetrators are family members, followed by friends, neighbours and acquaintances (Appendix A, Table A7.7 compared to Table 7.7).
However, for the CALD group, there are some differences in the types of family members identified as perpetrators when compared to the non-CALD group. Even though children form a substantial proportion of all main perpetrators overall, fewer children are perpetrators compared to the non-CALD sample (12.5% cf. 18.0%). A slightly higher proportion of the CALD sample identified sons- and daughters-in-law as the main perpetrator (11.3%, cf. 7.4% non-CALD). Furthermore, CALD participants identified their siblings as the main perpetrators at a higher rate (CALD brother/sister 7.1% cf. 3.4% non-CALD), and they were also more likely to identify friends as perpetrators (17.6% cf. 11.6% non-CALD).
The lower frequency of children as perpetrators compared to non-CALD participants and lower risk of elder abuse when living with others are likely to reflect the different perpetrator dynamics evident for abuse relating to language and culture compared with the other abuse subtypes. This type of abuse is not committed by children and is less likely to be committed by other family members as well (8.8%). Instead, the main perpetrators of this type of abuse are friends (30.6%), acquaintances (16.6%) and neighbours (11.2%) (Table A7.8). This finding highlights the need to account for racism in the community, and the older person's experience of racism, when developing interventions to address elder abuse relating to language and culture.
In addition to the influence of elder abuse relating to language or culture in the findings above about perpetrators, there are further considerations to explore about the frequency of children and other family members as perpetrators of elder abuse with a different profile in this respect for the CALD subgroup compared with the non-CALD subgroup.
First, the differences in the CALD subgroup identifying children as perpetrators do not appear to be a consequence of living arrangements involving children. Living with children is not common for older people overall, but somewhat greater proportions of CALD participants in the SOP live with children than the whole sample (see Table 4.1 and Table 4.3 for weighted sample characteristics). This is particularly so for CALD couples living with children (13.4% cf. 7.4% whole sample) but not substantially different to the Australian population (15.5% Census CALD couples living with children).
Second, there may be complex intergenerational and extended family cultural dynamics potentially associated with the different types of family members identified as the main perpetrator of elder abuse for the CALD subgroup compared to the non-CALD group. Further research is needed to understand these family dynamics and the extent to which demands and expectations upon the older person may be based in cultural norms. Previous research has highlighted varying values about whether resources are considered communal or personal within a family, and it is also evident that expectations are culturally determined (Miskovski, 2014; Wainer et al., 2010). In terms of obligations toward older family members, international research draws attention to the influence of 'filial piety' in East Asian cultures, which, it is argued, has the potential to create elder abuse conducive dynamics by imposing unwanted care obligations on younger family members (Ho et al., 2017).
The somewhat greater presence of sons- and daughters-in-law and siblings as perpetrators for the CALD subgroup raises the need for greater understanding of perpetrator dynamics, and how these might intersect with other perpetrator problems, such as mental health and financial problems (Table 7.2). For example, in their small qualitative study Vrantsidis and colleagues (2016) reported that some participants from culturally and linguistically diverse backgrounds experienced negative views about women associated with particular cultures and strong views about parental and family obligations. A World Health Organization review (2002) has highlighted particular issues that arise for mothers-in-law in some cultures, such as those in India, Austria and Lebanon, that lead to higher rates of abuse against mothers-in-law.
CALD subsample and legal arrangements
The findings set out in chapter 10 demonstrate that the CALD subgroup is less likely to have wills and powers of attorney in place and is more likely to have family agreements than those who spoke only English at home (Appendix A, Table A10.2). Although nine in 10 non-CALD participants had a will, just under eight in 10 CALD participants reported having one.
A similar difference between the overall patterns was evident in relation to powers of attorney, with just over half of the non-CALD sample having a power of attorney, compared with four in 10 of the CALD subsample.
Patterns in who was most frequently appointed as an attorney did not differ between the CALD subsample and the whole sample, with about 70% in each sample appointing children. Family agreements were more common among the CALD subsample, with 4.2% having them compared with 2.7% in the non-CALD sample (Appendix A, Table A10.2).
CALD subsample and attitudes, awareness and understanding
Differences between CALD and non-CALD participants in the SOP and SGC are evident to a greater extent in relation to attitudes and awareness of elder abuse than in other areas covered in the report. Country of birth was the basis for analysing attitudes, awareness and understanding of elder abuse, with comparisons between subgroups of participants born in Australia, English-speaking countries and non-English speaking countries, and some limited comparisons between specific regions or countries where sample sizes permitted. This also enabled comparisons between the SOP and SGC participants in these findings.
Attitudes towards elder abuse
Attitudes towards elder abuse were measured using the acceptance of elder abuse scale score (0-100), with higher mean scores indicating greater acceptance or condoning of elder abuse. Although most participants were not accepting of elder abuse, some differences emerged according to country of birth (Table 12.1).
SOP participants born in countries where English is not the primary language more frequently reported attitudes indicative of accepting elder abuse than those born elsewhere, to a significant extent (mean 32.2 cf. 25.4 English-speaking countries, 27.7 born in Australia). In relation to the acceptance of elder abuse and specific regions of country of birth, SOP participants from South-East Europe (mean 34.9) and South-East Asia (mean 36.9) were more likely than Australian-born participants to hold attitudes indicative of the greater acceptance of elder abuse (mean 27.7, Table 12.1).
These findings were broadly consistent in the SGC sample in relation to region of country of birth. Participants born in non-English speaking countries reported significantly greater acceptance of elder abuse (mean 17.6) compared to those born elsewhere (8.7 English speaking countries, 8.6 Australia). Within specific regions, SGC participants born in South-East Asia (mean 21.7) indicated greater elder abuse acceptance, along with those from Chinese Asia (mean 24.3) and South and Central Asia (mean 17.6). In comparison, those SGC participants born in Australia had a substantially lower acceptance score at 8.6. Notably, the findings show a consistent pattern of lower acceptance of elder abuse among those in the SGC (up to 64 years of age) compared with the SOP (age 65 and older), suggesting that increasing age and cultural factors may influence negative attitudes that are more condoning of elder abuse.
Regression modelling using the SGC data showed that the greater acceptance of elder abuse for those born in Asian countries held after controlling for gender, age and time since arrival in Australia. This means that cultural experiences continue to be a significant factor in acceptance of elder abuse even after other socio-demographic characteristics are accounted for.
Recognition of elder abuse behaviours
Recognition of elder abuse behaviours was measured as a scale score from 0-100, with higher scores indicating higher levels of recognition. There was considerable variation in levels of recognition of elder abuse among SOP subsamples that were Australian-born (mean 84.1), from non-English speaking countries (mean 81.7) and from English speaking countries (mean 86.8, Appendix A, Table A12.2). The Recognition scale score was lowest among those born in South-East Asia (mean 67.7) and Chinese Asia (mean 62, Table 12.2). It was highest among those born in North America (mean 89.6), New Zealand (mean 88.3) and the United Kingdom/Ireland (mean 86.5). Among those born in Australia, recognition was only marginally lower (mean 84.1) than among those born in English speaking countries.
In the SGC, patterns were generally consistent in terms of differences among subsamples born in Australia (mean 86.4), other English-speaking countries (mean 89.5) and non-English speaking countries (mean 78.7, Appendix A, Table A12.2). Lower mean scores were evident for SGC participants from Chinese Asia (mean 69.6), South-East Asia (mean 76.4) and South and Central Asia (mean 81.3) compared with those born in Australia (mean 86.4, Table 12.2). There was greater recognition of elder abuse among SGC participants compared with SOP participants overall, although the differences were not as substantial between the surveys as they were for acceptance of elder abuse.
Ageism (SGC)
Attitudes consistent with ageism were evident among some CALD subgroups in the SGC (this was not examined in the SOP, Appendix A, Table A12.3). SGC participants born in Australia had a mean score on the ageism scale of 33.3 (with lower scores indicating less ageist attitudes), whereas participants born in non-English speaking countries indicated significantly higher scores (mean 51.0). For some specific regions, average ageism scores were also higher compared to Australian-born participants, particularly for those born in Chinese Asia and South and Central Asia (mean 55.7 and 55.6 respectively), South-East Asia (mean 52.7) and the Middle East and North Africa (mean 51.6, Table 12.4).
A simple regression analysis showed that there were still significant differences by country of birth after controlling for other socio-demographic characteristics, including gender, age and time in Australia. For specific regions, this pattern of results was upheld for those born in Asian countries after controlling for gender, age and time since arrival in Australia. Ageism is therefore highly likely to be associated with cultural experiences, which is also consistent with the association between the acceptance of elder abuse and country of birth.
Intergenerational support (SGC)
The intergenerational support scale (0-100) measured the extent to which SGC participants held positive attitudes towards intergenerational support, with higher scores indicating higher levels of agreement (this measure was not included in the SOP). The scale included items indicative of intergenerational support towards adult children as well as items in the direction of supporting ageing parents. In contrast with higher ageism scores, greater levels of affirmation for intergenerational support are evident among some CALD subsamples in the SGC than among those born in Australia. Participants born in non-English speaking countries have a mean score of 73.2, significantly higher than Australian-born SGC participants, whose mean intergenerational support score was 64.9 (Appendix A, Table A12.4). CALD subsamples from specific regions with higher scores included those born in: South and Central Asia (82.3), the Middle East and North Africa (77.9) and South-East Asia (75.0, Figure 12.11).
A regression model applied to the Intergenerational Support scale score showed that country of birth was still a significant predictor after controlling for gender, age and time since arrival in Australia. This means cultural experiences continue to be an important influence on positive agreement with intergenerational support even when accounting for the influence of other socio-demographic characteristics.
Summary
The findings in relation to the CALD subsample presented in this report provide some significant insights into elder abuse as it is experienced by people born in non-English speaking countries who have immigrated to Australia. Dow, and Brijnath (2019, p. 147) note that culture can mediate perceptions of elder abuse, types of abuse and responses and that this varies widely between cultural groups. The findings from the SOP and SGC discussed in this chapter provide insights into differences according to CALD and non-CALD background in the prevalence of and dynamics of elder abuse. Cultural background was also shown to influence attitudes, awareness and understanding of elder abuse according to country of birth.
It is notable that there is limited evidence of substantial differences in key patterns, including the overall prevalence of elder abuse and the prevalence of different subtypes.
However, there are a number of areas where the findings point to a need to develop greater understanding of the experience of elder abuse in the CALD context, in order to better understand dynamics so as to support improved responses.
The first of these is in relation to the findings that point to an intergenerational familial dynamic that is weaker for the CALD subgroup, with children being represented among perpetrators to a lesser extent than for the non-CALD subsample. Further culturally sensitive research examining familial dynamics within different CALD subgroups and how they influence the occurrence or non-occurrence of elder abuse would be helpful in further understanding these dynamics.
The second related finding concerns the CALD-specific abuse subtype, abuse relating to language and culture, measured in the SOP. This type of abuse is perpetrated much less by family members (apart from sons- and daughters-in-law), who are likely to share the same cultural background, and more by friends, neighbours and acquaintances, who are less likely to share the same cultural background. Further research examining links between racism as a dimension of elder abuse is necessary.
These findings suggest that intergenerational dynamics may be less of an influence in the elder abuse experienced by CALD groups but that racist dynamics in the community may be more of an influence. Consequently, although prevalence levels are not substantially different between the CALD and non-CALD groups in the SOP, the findings suggest the dynamics of elder abuse are different, at least to some extent.
A further area where the findings point to differences in dynamics between CALD and non-CALD groups is in the area of awareness and attitudes (chapter 12). These findings highlight some consistent differences in the patterns concerning awareness of elder abuse and recognition of elder abuse behaviours. Significantly, CALD participants from some non-English speaking countries had lower levels of awareness and recognition than participants from English speaking countries in both the SOP and the SGC, although this was stronger among SOP participants than among SGC participants.
Similarly, ageist attitudes were stronger among SGC participants from the CALD subsample than they were among the non-CALD sample. By contrast, positive attitudes to intergenerational support were stronger among some of the CALD subsample than the non-CALD sample, particularly those born in South and Central Asia, the Middle East and North Africa and South-East Asia.
Summary and implications
This chapter provides an overview and summary of the main aspects of the findings in relation to elder abuse set out in the preceding chapters of this report. The discussion also highlights similarities and differences between the five abuse subtypes. This summary provides a basis for a discussion of the implications of the findings for practice and policy in the second part of the chapter. The third section of the chapter provides a high-level overview of the conceptual implications of the report.
Overview
Elder abuse overall
This report has estimated that 14.8% of the population aged 65 and over who live in the community (rather than residential care settings) have experienced elder abuse in the past 12 months. Psychological abuse is the most common subtype, followed by neglect, financial abuse, physical abuse and sexual abuse. The dynamics of elder abuse are complex, with varied patterns in key areas - such as perpetrator profiles, factors that suggest susceptibility and help-seeking behaviours - for the different subtypes.
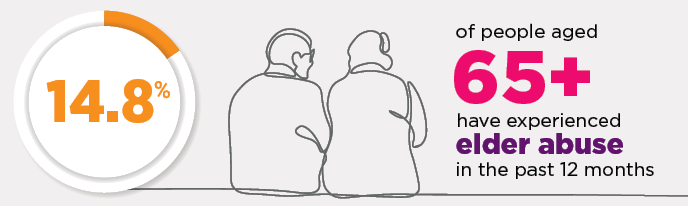
The analysis suggests that, overall, differences in prevalence of elder abuse between men and women are limited (15.9% cf. 13.6%). Women were estimated to be slightly more likely to experience sexual abuse (1.2% cf. 0.7%) and neglect (3.5% cf. 2.2%). Although gendered dynamics are not particularly evident in the prevalence estimates, some subtle gender-related patterns are relevant in other areas (see further below).
Socio-economic status, relationship type and housing type are particularly associated with higher or lower risks of experiencing abuse.
People who are living with a partner are less likely to experience abuse. Those who are divorced or separated are more likely. Having step-children is also associated with a greater likelihood of experiencing abuse.
The findings in relation to socio-economic status and elder abuse point to some complexities in understanding how socio-economic status and elder abuse intersect. Financial, sexual and psychological abuse subtypes are more likely to be experienced by people from relatively disadvantaged socio-economic areas (based on Socio-Economic Indexes for Areas (SEIFA) - the Index of Relative Socio-Economic Disadvantage). Consistent with this, those who own their own home with debt or who rent housing have a higher rate of experiencing psychological abuse compared to those who own their home without debt, even after controlling for other socio-demographic characteristics. On the other hand, participants with a degree or higher level of education are more likely to report experiencing psychological abuse, which may reflect a higher level of awareness of elder abuse and a great capacity to identity such behaviours.
Family members, especially sons and daughters, are the largest perpetrator group (nearly one in five). About one in 10 elder abuse perpetrators are intimate partners.

Together, friends, neighbours and acquaintances (e.g. co-workers) also reflect about a quarter of all perpetrators. Professionals and carers are not significant elder abuse perpetrators, although they are implicated in neglect to a higher extent than other types of abuse.
Perpetrator profiles are an area where gendered patterns are evident, with men outnumbering women as perpetrators by 10 percentage points.
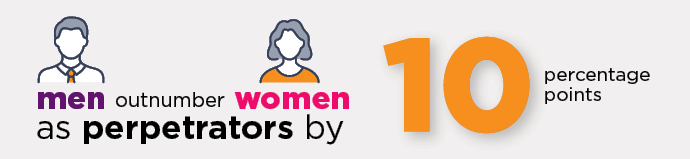
Elder abuse is assessed as very serious or somewhat serious by three-quarters of those who experience it. The findings indicate that older people with poorer health or disability were more likely to experience elder abuse. Older people with poor mental health also had a greater likelihood of experiencing elder abuse. Furthermore, less frequent contact with family members and friends and a lower sense of social support were associated with the elevated likelihood of experiencing elder abuse.
Most people who experience elder abuse try to manage it themselves and don't seek help or advice. However, eight in 10 do take some action to stop the abuse, most commonly speaking directly with the perpetrator (approximately one-half). Another common action is breaking contact with or avoiding the perpetrator (approximately two in five). This is concerning, since it may compound the effects of the abuse and reflect a lack of effective ways of addressing abuse. It also means that perpetrators are not held to account.
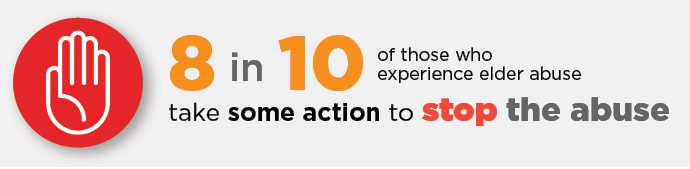
Where help and assistance are sought, it most often involves family members and friends. Otherwise, health professionals, including GPs and nurses, are the most common sources of assistance. Legal responses are more commonly accessed for some abuse subtypes (physical and financial abuse) than others but are not a predominant source of support.
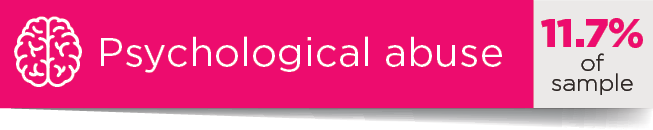
The estimates suggest psychological abuse is the most common form of abuse, affecting 11.7% of the sample, with around half of these experiences in the low score range, more than one-third in the high score range and 14% in the mid-score range. There are three particularly common forms of psychological abuse occurring in nearly commensurate proportions (between 46% and 49%): being insulted, called names or sworn at in an aggressive or offensive way; being excluded or repeatedly ignored; and being undermined or belittled.
Women are more likely to experience psychological abuse than men (12.6% cf. 10.7%). Those in the lower age range (65-69) are also more vulnerable in this community dwelling sample.
As with financial abuse, psychological abuse is most likely to be committed by family members, with children accounting for 18% of perpetrators and other relationships of this type taking the total to around 30%. Friends (10%), neighbours (8%) and acquaintances (12%) are also well-represented in the perpetrator groups. Partners accounted for 8% of all psychological abuse perpetrators.
After physical abuse, psychological abuse was the abuse type for which help and advice was most likely to be sought (40%). Apart from friends and family, the most common sources of formal help were a GP or nurse (30%) and a professional carer or social worker (22%). Help from lawyers or police was not uncommon, at 15% and 17% respectively for those who sought help.

Taking direct action to stop the psychological abuse by speaking to the perpetrator was only a little more common than breaking contact with them (52% cf. 49%).

After physical abuse, psychological abuse attracted the highest seriousness ratings of the abuse subtypes from participants who experienced it, with only 21% saying it was not serious, 32% saying it was very serious and 46% saying it was somewhat serious. Those who reported psychological abuse were four times more likely to have psychological distress scores indicating a probable serious mental illness than those who did not experience psychological abuse (9.6% cf. 2.4%). Low social support scores were particularly evident for psychological abuse, possibly reflecting the consequence of breaking off contact with perpetrators.
There were similar views on psychological abuse between SGC and SOP participants. Similar proportions strongly agreed that calling an older person hurtful names was always abuse (79% SGC and 78% SOP), for example. The main difference in views was on limiting contact with grandchildren, with SOP participants more likely to strongly agree that this was elder abuse (58% cf. 49%).
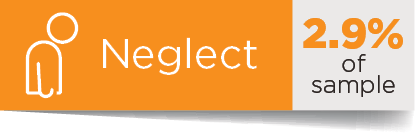
The findings set out in this report indicate that neglect, as an omission rather than an action, is different in character from other subtypes of abuse. After psychological abuse, the analysis suggests neglect is the most common subtype of abuse, with 2.9% of the sample reporting neglect across three score bands: low at 60%, medium at 24% and high at 16%. The most common forms of neglect involved failing to provide assistance with routine housework (80%), travel or transport (69%), shopping for groceries or clothes (57%) and preparing meals (52%).
Women are more likely than men to experience neglect (3.5% cf. 2.2%). Participants in the lower age bracket (65-69) and those over 80 are also more likely to experience neglect.
Intimate partners are the largest perpetrator group (25%), followed closely by children (24%). Unlike the other abuse subtypes, service providers and professionals are significant among perpetrators (13-14%).

Most of the participants who reported experiencing neglect did not seek help or support (70%). Where help or support was sought, the most common sources, apart from family and friends, were a GP or nurse (37%) and a professional carer or social worker (33%). After speaking to the person causing the neglect directly (48%), the most common action taken to stop the neglect was withdrawing from social life (14%), which may in itself be a reflection of an absence of support for social activity.
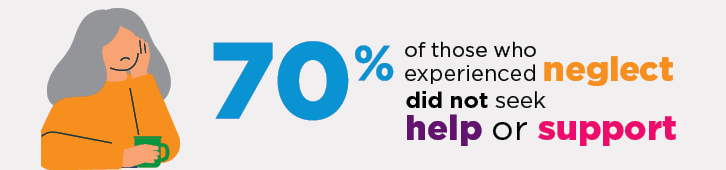
Neglect was the most likely subgroup to be self-rated as 'not serious' (48%). Those who experienced it also had much lower psychological and physical wellbeing, lower social support and higher levels of disability than those who didn't. For example, psychological distress scores indicative of probable serious mental illness were five times more likely for the neglect group compared with participants who did not experience neglect (15% cf. 3%). These findings are likely to reflect the issues that gave rise for the need for care - they also reinforce the negative implications of a failure to provide care for an inherently vulnerable group.
It is also notable that this research has revealed the existence of a group of older people who experience neglect but are not included in the prevalence estimate because they have no one to help them and are therefore not captured by the conceptual and operational definitions applied. This group represents 6% of the total sample.
Views on neglect were similar between the SOP and SGC samples, with the same proportions (64%) strongly endorsing not providing help with personal care when this is normally expected or provided as a form of abuse.
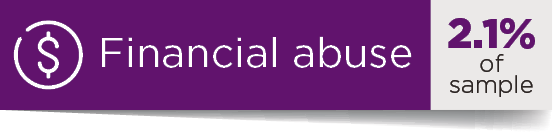
The estimates suggest financial abuse is the third most common abuse subtype, reported by 2.1% of the sample. There are three particularly common forms of this abuse: being pressured into giving or loaning money, possessions or property (42%), having money, possessions or property taken without consent (34%), and the perpetrator not contributing to household expenses or aged care/home service fees where this had previously been agreed (31%).
This form of abuse is mainly committed by children (33%) or other family members. However, friends (9%), neighbours (5%) and acquaintances (3%) are also perpetrators, to a smaller extent.

Just under one-third of the sample that experienced financial abuse sought help and advice. Where this involved someone other than a family member or friend, this was most commonly a professional carer or social worker (34%), GP or nurse (28%), or a lawyer (33%). Police were involved in a quarter of the cases where help or advice were sought. Apart from speaking to the person directly (59%), the most common action taken to stop the abuse was breaking contact with the perpetrator (30%).
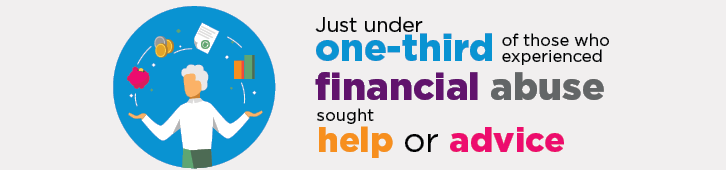
Close to a third of the participants who experienced financial abuse indicated it was not serious, approximately one-third rated it as somewhat serious and another third said it was very serious. Levels of psychological wellbeing scores indicating probable mental illness were close to one-tenth for financial abuse participants, compared with 2.4% for participants who did not experience financial abuse. The participants who experienced financial abuse reported a low sense of social support compared to those without such an experience.
There were some differences between generations in the strength of recognition of financial abuse, with recognition being stronger among SGC participants.
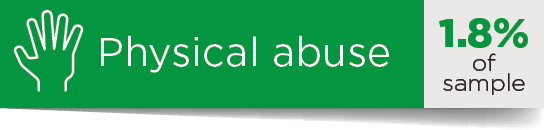
The estimates indicate physical abuse is the second least common subtype of abuse (1.8% of the sample). Of those who experienced physical abuse, threats of harm is the most common form (61%), followed by being grabbed, pushed or shoved (47%), and hit, punched, kicked and slapped (22%).
Men are slightly more likely than women to experience physical abuse (2% cf. 1.6%), which is also particularly associated with those in the 65-69 years age bracket.
Family members, especially children (17%), are prominent perpetrators but friends (10%), neighbours (12%) and acquaintances (9%) are also well-represented among those who commit physical abuse. Notably, 12% of physical abuse perpetrators are spouses.

The physical abuse subgroup was the most likely of all the abuse subtypes to seek help or advice, with around half doing so. This group was also the most likely to engage with police (36%), the only abuse subtype for which police as a source of help or advice outweighed family members (33%). Six in 10 participants who took action to stop the physical abuse spoke directly to the person, and breaking contact (54%) was most common for this abuse subtype.
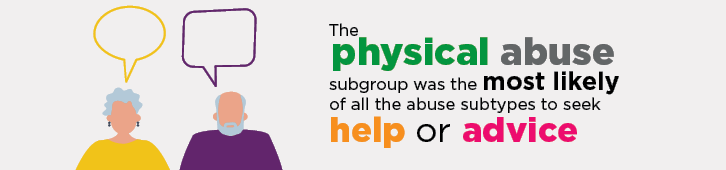
Of all the abuse subtypes, physical abuse was most likely to be rated as very serious (39%) and least likely to be rated as not serious (20%). Participants who experienced physical abuse were almost five times more likely to have a psychological distress score indicating probable serious mental illness than those who did not (14.5% cf. 3%). They were also more likely to rate their physical health as 'poor' compared with those who did not experience physical abuse (14% cf. 7%). Disability was reported by more than two-thirds of the physical abuse subgroup, compared with less than half who did not experience physical abuse.
Attitudes in relation to physical abuse differed slightly between the SOP and the SGC samples. SGC participants were more likely to strongly agree that pushing or shoving an older person was elder abuse (91% cf. 86%).

The analysis indicates sexual abuse is the least common subtype of abuse, applying to just 1% of the sample. The most common type of sexual abuse was being spoken 'to in a sexual way' when this was unwanted (76%). Unwanted sexual touching was reported by almost two-thirds of those who experienced sexual abuse.
Women were more likely to experience sexual abuse than men (1.2% cf. 0.7%), with those in the 65-69 years old age bracket more likely to experience it than those in the older age brackets.
Unlike the other abuse subtypes, sexual abuse is unlikely to be committed by family members (other than intimate partners). The biggest perpetrator groups are friends (42%), acquaintances (13%), neighbours (9%) and spouses (9%).

Help was least likely to be sought for sexual abuse out of all the subtypes, with three-quarters not seeking help. Of those who did seek help, the most common sources of help were family members, a GP or nurse, a friend and a neighbour. The most common actions taken to stop sexual abuse were speaking to the person and breaking contact with them. Police and legal responses were almost never invoked.
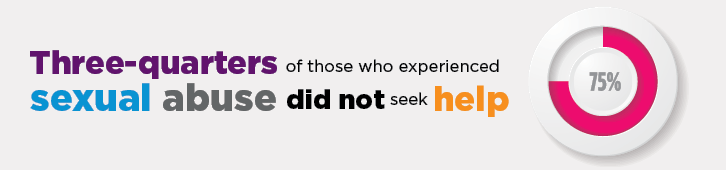
After neglect, sexual abuse was also the form of abuse most likely to be rated as 'not serious' by those who experienced it. This contrasts with participants who experienced sexual abuse having psychological distress scores similar to those who experienced physical or financial abuse. Of the sexual abuse subgroup, the same proportion (14%) had scores indicative of probable serious mental illness as was present for physical abuse.
Attitudes to sexual abuse varied between the SOP and SGC samples, with the SGC sample more likely to agree that talking in a sexual way to an older person against their will was sexual abuse (89% cf. 76%).
Box 14.1: A focus on sexual abuse
Evidence on sexual abuse among older people has been scarce in Australia (Mann et al., 2014) and limited internationally (Bows, 2018; Band-Winterstaein, Goldblatt, & Lev, 2019; Cook, Dinnen, & O'Donnell, 2011). Recently, the proceedings of the Royal Commission into Aged Quality and Safety (2021, pp. 96-97) have drawn attention to the issue of sexual assault in aged care settings. This research highlights the prevalence of sexual abuse among people aged 65 and over in the community.
Based on the estimates in chapter 5, sexual abuse is just under half as common as financial abuse, with an estimated 39,472 people aged 65 and over affected by sexual abuse, compared with 83,787 affected by financial abuse. However, financial abuse receives much greater attention and is perceived to be the most common form of elder abuse (e.g. ALRC, 2017, p. 160).
The prevalence of sexual abuse revealed in this study is higher than indications from other Australian studies. Hill and Katz' 2019 analysis of the PSS (chapter 2) suggested between 0.1% and 0.4% of women aged 55 and over had experienced sexual violence (using narrower measures of forced sexual activity or threats of forced sexual activity (chapter 5)) in the preceding 12 months.
The measures used in the SOP are wider and consistent with some international studies on elder abuse, namely Ireland (Naughton et al., 2010), the UK (O'Keeffe et al., 2007) and Canada (National Initiative for the Care of Elderly, 2016). These studies revealed prevalence rates of 0.5%, 0.2% and 1.5% respectively. Yon's meta-analysis (2019) indicates a pooled prevalence of sexual abuse across 50 studies of 2.2%.
The profile of common sexual abuse perpetrators being friends in the SOP is consistent with the Canadian findings (National Initiative for the Care of Elderly, 2016). It is also consistent with other international literature (Band-Winterstein et al., 2019).
The association between the perpetration of sexual abuse and alcohol misuse by perpetrators reported in chapter 7 is consistent with evidence about alcohol or another substance being involved in about half of cases involving sexual offending from the PSS (AIHW, 2020).
In the context of all forms of elder abuse being under-reported, sexual abuse is particularly under-reported when considered in the context of sexual assault reporting generally. Around half of women in the general population who experience sexual assault seek help or advice (AIHW, 2020). The most common source of help and advice for women who experience sexual assault in the broader community are friends and family members (seven in 10), health professionals (four in 10), counsellors, support workers or telephone helplines (one-quarter) and police (one in six) (AIHW, 2020).
Socio-demographic characteristics associated with particular abuse types
The most significant socio-demographic characteristics associated with the experience of abuse overall are:
- having step-children
- housing types involving owning with a mortgage and renting privately or through a public housing authority
- living in an area classified as disadvantaged under the SEIFA.
In relation to abuse subtypes, the most important associations are:
- Financial abuse: living in a disadvantaged area, living alone or with others (rather than with a partner), being divorced or widowed.
- Physical abuse: being in the 65-69 years age bracket, living alone, being divorced or never married and having step-children.
- Sexual abuse: being in the 65-69 years age bracket, living alone or living with others rather than being partnered, having a higher level of education, being divorced, widowed or never married, living in a disadvantaged area.
- Psychological abuse: being in the 65-69 years age bracket, living alone or with others rather than being partnered, having a higher level of education, being divorced, having step-children, owning a house with a mortgage or being in private or public rental accommodation, living in a disadvantaged area.
- Neglect: being 65-69 years old or over 80, living with others rather than a partner, being divorced and living in a major city.
The findings suggest that complex family dynamics underpin elder abuse to a significant extent, with a complicated relationship history involving divorce and re-partnering with a partner who had children, is associated with an elevated likelihood of abuse. Conversely, being in a relationship with a partner lowers the risk.
Similarly, and likely related to some extent, socio-economic disadvantage is associated with elder abuse, as evidenced through the links with housing type and living in a disadvantaged area with an elevated risk of some subtypes of elder abuse. Conversely, owning your own home outright is associated with a lower risk of elder abuse.
Health, social connection and elder abuse
Experiences of elder abuse are correlated with lower psychological wellbeing, poorer physical health status, greater levels of disability and greater levels of social isolation.
The findings set out in chapter 6 indicate relative rankings of these issues with the experience of elder abuse overall and in relation to specific subtypes, in the context of analysis assessing the relative importance of 14 different variables. For all but sexual abuse, psychological distress and social support are in the top four explanatory variables. For sexual abuse, psychological distress and social support are in the top four.
Legal arrangements
The analysis indicates that advance planning, particularly in relation to wills, is common among those aged over 65. The majority have wills (88%) and around half have executed power of attorney instruments allowing others to make financial and lifestyle decisions on their behalf. People from higher SEIFA brackets are more likely to have made these two kinds of arrangements than those from lower SEIFA brackets.

Family agreements are another form of arrangement involving family members and assets, in that they involve situations where assets or financial interests are traded for care or a shared living arrangement. These arrangements are not common, applying to some 3% of the sample. People from relatively socio-economically disadvantaged areas (i.e. lower SEIFA relative socio-economic brackets) are more likely to have them than people from relative socio-economic advantaged area (in higher SEIFA index brackets).
Views on elder abuse
The SOP and SGC findings suggested some differences in views on elder abuse, between and within the samples in each of these surveys. Most participants in both surveys recognised and did not condone elder abuse. However, these findings were stronger for SGC participants than SOP participants. In both surveys, men and people born in non-English speaking countries were less likely to recognise elder abuse and more likely to condone it than women and those born in Australia or other English speaking countries.
SGC participants were more likely than those in the SOP to believe that elder abuse is common in the community (54% cf. 43%). They were also more likely to believe that elder abuse is ignored (52% cf. 41%). Similarly, they were less likely to believe that elder abuse is a private matter that should be handled in the family (9% cf. 15%).
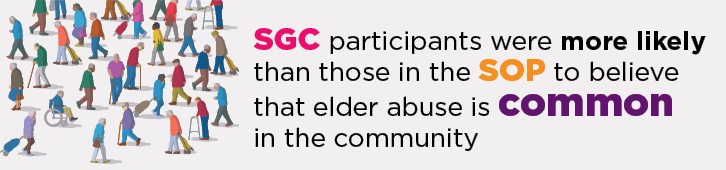
The SGC participants were substantially less likely than SOP participants to agree that abuse is understandable if the perpetrator is experiencing stress (7% cf. 20%). They were even more unlikely to endorse the proposition that elder abuse is understandable if the older person is difficult to deal with (7% cf. 25%).
Ageism, intergenerational support and entitlement
The analysis on the attitudinal context for the findings on the prevalence of elder abuse suggest that SGC participants with ageist attitudes are in the minority, that there is substantial community affirmation for intergenerational support but that attitudes consistent with a sense of entitlement in the community are not uncommon.
Overall, the data indicated modest levels of ageist attitudes towards older people in the general community. The participants in the SGC largely held positive attitudes towards older people. A benevolent ageism measure - that 'it is helpful to repeat things to older people because they rarely understand the first time' - drew the strongest levels of endorsement, with one-third of participants providing a rating of 7-10, on a rating scale from 0 strongly disagree to 10 strongly agree. The vast majority rejected the notion that 'older people are a drain on the health care system and the economy'.
The findings on intergenerational support suggest that this is a majority social value among people in the SGC with a mean score of 66.5 (on a score range of 0-100, a higher score indicating a stronger sense of intergenerational support) and stronger endorsement for children supporting parents than parents supporting children. A sense of entitlement to older people's assets where there has been regular assistance to that person is not insignificant, with over one-quarter agreeing (with ratings of 7-10, on a rating scale from 0 strongly disagree to 10 strongly agree) that other family members held this view. Agreement with intergenerational support was linked with attitudes indicative of entitlement.
Analysis assessing links between a lower recognition of elder abuse and condoning elder abuse found ageist views were linked with more condoning attitudes towards elder abuse and lower recognition of elder abuse behaviours. Links between condoning attitudes to elder abuse and lack of recognition of elder abuse behaviours and support for intergenerational support and entitlement were not evident.
Together these findings suggest that values and attitudes, particularly ageism, are relevant to the wider social context in which elder abuse occurs to some extent. Although ageism is not common (mean score of 37.4), ageist values are evident to a not insignificant extent.
Definition of elder abuse
This research was conducted on the basis of a working research definition of elder abuse (Kaspiew et al., 2019). As explained in chapter 3, the definition applied was:
a single or repeated act or failure to act, including threats, that results in harm or distress to an older person. These occur where there is an expectation of trust and/or where there is a power imbalance between the party responsible and the older person.
This conceptual definition was operationalised into the technical analytic definition applied to deriving prevalence estimates as set out in chapter 5.
The findings in this report enable an assessment of the appropriateness of the conceptual definition. In broad terms, these findings indicate that this definition does represent an appropriate characterisation of elder abuse for research purposes.
However, findings in relation to neglect that fell within the definition (chapter 5) and neglect that was excluded from the definition because the person experiencing neglect had no-one to help require further consideration. The following discussion deals with each of these issues in turn. It should be noted that this discussion refers to a research definition. Different considerations may apply in relation to legal, policy and practice definitions, depending on the purpose that they serve (Kaspiew et al., 2016; Kaspiew et al., 2019).
Conceptual definition
Findings in two areas set out in the report provide broad support for the approach to the definition. First, the relevance of the concept of a power imbalance (as an addition to or replacement for) a relationship of trust is confirmed by the findings in chapter 6. These findings (summarised above) confirm that people who experience elder abuse are considerably more likely than those who don't to report: psychological ill-health, physical ill-health, disability and social isolation. Further, the analysis suggests indications of vulnerability are associated with people who experience abuse from friends (chapter 6) to a greater extent than those who experience abuse from adult children. These findings indicate that power imbalance is a useful and relevant concept in the understanding of elder abuse, alongside a relationship of trust.
The second area where the research findings support the conceptual definition are in the elder abuse recognition findings set out in chapter 12. These findings (also summarised above), demonstrate clear majority support among SOP and SGC participants for the following actions to be considered elder abuse:
- Not providing help with personal activities such as dressing, washing and feeding when this is normally expected or provided
- Talking to an older person in a sexual way when they do not want to
- Taking money from an older person without their consent
- Calling an older person hurtful names.
This level of community agreement with key measures that relate to the conceptual definition indicate that the approach taken is in step with community values.
However, the definition should be tested against the experiences of groups not covered in this study: Aboriginal and Torres Strait Islander people, LGBTIQ groups, people with cognitive decline and people living in residential care settings (see 'Further Research', below).
Neglect
The construct of neglect warrants further consideration for two reasons. First, because this research has highlighted a group whose experiences fall outside the conceptual and technical definitions but who nonetheless have an unmet need for help (chapter 6). Second, the findings indicate that as a construct, neglect has some features that set it apart from other abuse subtypes.
Chapter 6 highlighted a group whose experiences would have amounted to neglect had there been a person responsible for the activities neglected ('the no-one to help' group). As a result of the application of the conceptual and technical definition, this group was excluded from the neglect prevalence estimate in chapter 5 because there was no one to help. This finding underscores the complexity of neglect as a construct, in that it reflects an omission. In practical terms, the experience of the no-one to help group amounts to a double omission in that a need for help was not fulfilled because there was no-one to complete the required actions. The need for an actor (and a relationship of trust or power imbalance) in the conceptual definition is inconsistent with this circumstance.
Another area where the findings distinguish neglect from other types of abuse is in relation to perpetrator characteristics as reported by participants in the SOP and set out in chapter 7. For the neglect group, perpetrators' problems with health, including physical health, were evident to a greater extent than for other abuse subtypes, suggesting that an inability to provide care contributed to the occurrence of neglect.
For these reasons, it is desirable to distinguish neglect from other subtypes of abuse, in recognition of its distinctive characteristics. Accordingly, it is suggested that rather than the term 'elder abuse' being used, the term 'abuse and neglect of older people' should be adopted, to encourage identification of abuse and neglect as distinct concepts and to raise awareness of neglect. This terminology is also consistent with sensitivities in relation to the use of the term 'elder' in some contexts, particularly for Aboriginal and Torres Strait islander groups (Clare et al., 2014; Kaspiew et al., 2016).
In developing definitions in legal, policy and practice frameworks, careful consideration should be applied to the definition of neglect in those frameworks. In some instances, it may well be inappropriate to apply a definition of neglect that excludes people in the position of the 'no-one to help' group in this research. An example of this may be in frameworks that determine access to services based on need. In other contexts - such as the determination of civil or criminal liability - a different definition may be appropriate.
Implications
This section sets out the implications of the findings in this report for further policy and program development. The discussion identifies a need for development in three related areas: preventing, identifying and responding to elder abuse.
Two broad points are important for the discussion. First, the findings summarised above reinforce the point that elder abuse is a complex phenomenon, particularly since it involves family members and social connections to a very significant extent. The findings suggest that each form of abuse involves different dynamics, meaning that policy and practice responses need to be tailored for different subtypes. This insight is consistent with local and international literature, which recognises that blanket approaches are likely to be ineffective and that interventions need to be carefully designed for the specific subtype (Conrad, Liu, & Iris, 2019; DeLiema et al., 2018; Dow & Brijnath, 2019; Santos et al., 2019).
Second, the findings indicate a need for increased focus on neglect and sexual abuse, in particular, given levels of prevalence and lower levels of awareness and help seeking in these areas. Further, as psychological abuse is the most common form of abuse and attracts the second highest self-assessments of seriousness, this form of abuse also warrants more attention. This is not to say that focus should be diverted from financial abuse and physical abuse. However, with financial abuse commonly considered to be the most common form (e.g. ALRC, 2017; Dow & Brijnath, 2019), it is evident that other types of abuse may not have received sufficient attention to date.
In the context of these two points, the discussion about policy and program development that follows is general in nature and should be considered in light of specific and detailed findings set out in this report.
Background
In Australia, the development of responses to elder abuse has been organic and iterative, with agencies in different states and territories that provide services to older people developing responses as different needs have been identified (e.g. Dow et al., 2020).
The stocktake of elder abuse prevention and awareness responses across Australia highlights a varied range of strategies including awareness raising campaigns, moves toward safeguarding mechanisms at state and territory level, and the development of multi-agency, multi-disciplinary responses such as Health Justice Partnerships (Commonwealth of Australia, 2019).
Locally and internationally, the evidence base on what works to address elder abuse is undeveloped and there is limited empirical evidence on the effectiveness of particular approaches (Baker, Francis, Hairi, Othman, & Choo, 2016; Dow & Brijnath, 2019; Teresi et al., 2016). However, insights from developments in allied areas, such as family violence, are considered useful in informing thinking in approaches in relation to elder abuse (e.g. Ng, Lim, & Kadir, 2020; Teresi et al., 2016; Warren & Blundell, 2018b). Notably, there is local and international recognition of the potential value of applying a public health approach to interventions across three levels: primary (preventing elder abuse from happening), secondary (identifying situations where elder abuse may be happening and intervening to stop it) and tertiary (addressing elder abuse when it does happen) (e.g. Clare et al., 2014; Forum on Global Violence Prevention, Board on Global Health, Institute of Medicine, National Research Council, 2014; Lord, McMahon, & Nivelle, n.d.; Mann et al., 2014).
With the National Plan (CAG, 2019) based on a clear recognition of the need for responses to elder abuse to be evidence-based, this research highlights some significant areas where there is a need and opportunity for policy and program development.
A prevention framework
This research establishes that elder abuse is a significant problem in Australia. In the context of population dynamics described in chapter 1, it will become an even larger problem as the proportion of the population that is over 65 increases.
The findings set out in this report highlight significant correlations between lower psychological, physical and social wellbeing and elder abuse, reinforcing the importance of addressing this problem in the interests of supporting the health and wellbeing of the population aged 65 and over. They also identify a range of socio-demographic and economic characteristics that are associated with a greater likelihood of experiencing elder abuse.
With prevention science increasingly applied in the development of strategies to reduce other social problems, such as family violence, in the context of a public health approach (e.g. Our Watch et al., 2015), the development of a rigorous prevention framework could assist in reducing the prevalence of elder abuse in Australia into the future. If such an approach was to be developed, it would be important to focus on using tested and effective prevention frameworks to implement evidence-based programs and policies that reduce risk factors associated with elder abuse over the life course (see e.g. Teresi et al., 2016).
Notably, prevention efforts in elder abuse are in their early stages internationally (Teresi et al., 2016) but as a world leader in primary prevention for family violence (Kinnersley, 2020), Australia is well-placed to develop allied approaches in the context of elder abuse. Notwithstanding the lack of evidence-based approaches, international elder abuse experts confirm that 'the seriousness and scope of the problem' requires preventative actions (Pillemer, Burnes, Riffin, & Lachs, 2016, p. s200).
A range of insights set out in this report would inform the development of such a framework. They include evidence of greater susceptibility to abuse among those with complex relationship histories, people who are renting or paying off homes, people with psychological and/or physical health problems and disability and those who are socially isolated (chapter 6). In addition, chapter 8 indicates that attention to financial management practices, particularly improving approaches to financial management among older women, and accountability practices where support in financial management is provided would be important.
Better awareness and understanding in the community
This research confirms that elder abuse is a 'hidden problem' (see e.g. Kaspiew et al., 2016). It is notable that most people affected by elder abuse did not seek help or support from anyone in relation to their experience. Where they did take action, this was most likely to involve only themselves and the perpetrator or themselves and family or friends (chapter 9). Self-management of elder abuse raises two potential consequences that may enable abuse: secrecy and a lack of adverse consequences for those who perpetrate abuse. Circumstances where there is a power imbalance because the older person is dependent on the perpetrator for support or care and revealing the abuse may have significant adverse consequences for their care arrangements compound these dynamics and reinforce the need for proactive and careful approaches to identifying and responding to elder abuse.
The findings of this research suggest greater recognition of elder abuse among the SGC participants in comparison with the SOP participants. Chapter 12 also highlights greater recognition of elder abuse among those who provide support to people aged 65 and over. These findings indicate that social attitudes to elder abuse are amenable to change and that connections between older people and those around them are important to detecting and addressing elder abuse.
There is a need for awareness-raising measures with several strands. First, there needs to be awareness raised of what elder abuse is, both among older people and among others in the community, such as the family and friends who support them. It is clear that family and friends are important sources of help and support for older people experiencing abuse (even accounting for some being perpetrators of abuse). They need to be alert to indications that elder abuse may be occurring and equipped to respond appropriately if disclosures are made. Some international research highlights the potentially important role that family and friends can play as 'a bridge' to formal avenues of support (Dominguez et al., 2019, p. 10).
A further strand of awareness raising should focus on raising awareness of services and strategies available to support people experiencing elder abuse. A lack of awareness that assistance is available for elder abuse (both on the part of older people and the people they turn to for help on an informal basis) may contribute to the help-seeking patterns described in chapter 8.
A need for proactive screening and identification in services
The findings also demonstrate a need for proactive mechanisms for identifying elder abuse, such as screening in health settings. In the context of the findings concerning the levels of psychological distress, social isolation and disability associated with elder abuse, those who experience elder abuse are likely to have significantly lower wellbeing than those who don't.
This underscores both the necessity of and the opportunities for systematic identification mechanisms. Although those who experience elder abuse may be reluctant to reveal it without prompting, engagement with medical practitioners and other helping professionals offers an important opportunity for elder abuse experiences to be identified and addressed. Dong (2015) argues that early detection and interventions, such as incorporating effective treatment of underlying problems, providing community-based services, and appropriately involving family, may help delay or prevent elder abuse.
However, recent analyses in Australia suggest that in order to support better screening and identification, other improvements in responses are also required (Dow & Brijnath, 2019). According to their analysis, among the issues that need to be addressed to support effective screening are:
- improvements in levels of knowledge about elder abuse among health professionals
- better training on signs that may indicate elder abuse is occurring
- access to effective screening and assessment tools
- organisational support to manage elder abuse cases where they are identified (p. 152).
The complex dynamics and potential risks involved in disclosing abuse need to be carefully managed, with Dominguez and colleagues (2019, p. 11) identifying a need for 'victim centred interventions' based on 'an assessment of the clients' needs and wishes, including the exploration and limiting of interventions that a victim perceives as negative to encourage engagement with services'.
In this context, it is significant that chapter 9 demonstrated that legal and justice responses were relied on for support to a lesser extent than responses involving health and helping professionals. This finding is in line with research showing that even for legal problems more broadly, legal mechanisms are relied on for advice to a lesser extent than non-legal sources of advice (Coumarelos et al., 2012, p. 135). This indicates that health professionals are the key frontline point for identifying elder abuse.
A need for assessment and development of responses
Together, the findings in relation to help-seeking patterns, psychological distress, social isolation and disability also speak to a need for improvements in responses to elder abuse. In particular, reliance on passive avoidant approaches to stopping the abuse (chapter 9) raises concerns about the impact of these approaches on wellbeing (chapter 8). The predominance of these avoidant approaches may reflect not only a reluctance to reveal abuse had occurred but a lack of appropriate and accessible options for addressing it.
There is significant focus on financial abuse in existing responses to elder abuse (e.g. Commonwealth of Australia, 2019). This study demonstrates a need for a systematic assessment of whether existing options for addressing elder abuse overall, and each subtype, are adequate, appropriate and accessible. Further, indications of the role of perpetrator problems such as mental and physical ill-health and financial strain suggest a need to focus on perpetrators as well as victims in service responses.
Psychological abuse is the most prevalent form of elder abuse and assessments of those who experience it indicate it is the second most serious form. There needs to be consideration of whether existing mechanisms to identify and address this form of abuse are adequate and sufficient.
Similarly, help seeking for sexual abuse and neglect are very limited. Sexual abuse is substantially under-reported with almost no reliance on justice responses among older people. Neglect is also substantially under-reported. The findings suggest that identification and response strategies for these two abuse subtypes require further development, including for the group that was not captured by the neglect definition because they had no-one to help (chapter 6).
Overall, the evidence base on the coverage and effectiveness of existing interventions is very limited. In general terms, there are two approaches that are recognised as promising, albeit with limited evidence in support of them at this stage.
One is family mediation, which is low-conflict, non-adversarial and may provide an opportunity for family relationships to be repaired (Dow & Brijnath, 2019). Research by Adams, Bagshaw, Wendt, and Zannettino (2014) has highlighted support for mediation in the context of financial abuse but concern about the limited number of appropriately trained mediators in Australia. Examples of mediation approaches include Relationships Australia's Elder Relationships Service, which includes therapeutic family counselling and mediation (Commonwealth of Australia, 2019).
The other is multidisciplinary approaches that may include legal, therapeutic and health-based elements (Joosten et al., 2017). These approaches are applied internationally (e.g. in Singapore - see Ng et al., 2020) and are gaining increasing momentum in Australia through initiatives such as the Elder Abuse Service Trials currently being trialled (Commonwealth of Australia, 2019).
Although, the findings of this research point to a need for a comprehensive assessment of the adequacy of responses to elder abuse, some particular gaps have already been identified in recent analyses.
In their systematic literature review research, Warren and Blundell (2019, 2018a, 2018b) examined the state of Australian and international social policy and Indigenous and non-Indigenous prevention and service responses to elder abuse in rural and remote communities. They concluded that elder abuse in rural and remote areas presents specific challenges that require specialised policy, prevention and service responses compared to urban areas, including because of geographic isolation, high service demand, poor resourcing, lack of transportation, and issues with confidentiality and privacy, as well as historical and cultural experiences of Indigenous people living in those areas (Warren & Blundell, 2019).
Warren and Blundell's review found consideration of elder abuse in the context of rural and remote areas to be inadequate across social policy literature, with only superficial regard to the vulnerabilities associated with these communities, particularly for Indigenous peoples (Warren & Blundell ,2018a). This is consistent with identified problems in relation to health services (AIHW, 2019b) and legal services (Coumelaros et al., 2012).
Prevention and service responses were better represented in the literature; however, evaluation of these responses was lacking (Warren & Blundell, 2019). The lack of evaluation raised questions about the extent to which delivery of elder abuse prevention and service responses was actually occurring in rural and remote areas (Warren & Blundell ,2019). Warren and Blundell (2018b) also assessed overlapping literature between elder abuse and family violence and identified commonalities across the two sectors that could be utilised for better collaboration in service delivery and approaches to addressing abuse. They observed that formal and informal collaboration could benefit resource limited services in rural and remote areas and improve responses to family violence and abuse across the life course.
It should also be noted that the Department of Communities WA has commissioned the University of Western Australia to examine elder abuse in Western Australia, including assessment of current responses for older people, their families and perpetrators. This research is due for completion in June 2021.
Further research
This study represents a highly significant advance in knowledge about elder abuse in Australia. However, it also highlights the need for further research in a number of areas, including in relation to groups in the community who were not included in sufficient numbers in the SOP sample to support analysis (see further below).
In particular, the findings point to a need to better understand the context for the complicated family dynamics, in particular, intergenerational dynamics, these findings have highlighted as being significant in the occurrence of elder abuse. Similarly, with friends, neighbours and associates significant among perpetrators, further examination of social dynamics is warranted.
The findings of significant associations between a relationship history involving relationship breakdown and step-children, together with likely related dynamics in relation to financial and housing stress, suggest that it is important to understand how these and other complicated relationship dynamics influence the occurrence of elder abuse. A life-course approach, which could not be substantially implemented as a theoretical framework for this study (chapter 3), would be an important framework for further research.
Further, the importance of longitudinal research that can support further examination of causal factors in the occurrence of elder abuse, to further explore correlations identified in cross sectional research, is increasingly recognised internationally (e.g. Acierno, Hernandez-Tejada, Anetzberger, Loew, & Muzzy, 2017; Dong, 2015; Williams et al., 2017).
A longitudinal study that examines the wellbeing of older Australians would have significant value in understanding a range of issues identified as relevant to elder abuse in this research. These include:
- the health and aged care dimensions of elder abuse including: health problems as causes and consequences of elder abuse, the demands placed on the health care system as a result of elder abuse, whether elder abuse is a factor that precipitates entry into aged care
- events that are associated with a worsening or improvement in intergenerational relationship dynamics (e.g. relationship breakdown, partnering and re-partnering among parents and adult children)
- the influence of financial/economic events such as unemployment and retirement on relationship dynamics
- intergenerational support and financial management practices in families
- historical and contemporary patterns in the causes and management of family conflict
- community-level factors associated with the experience of elder abuse committed by friends, neighbours and acquaintances
- histories of exposure to child abuse and family violence
- the impact of physical and mental health and substance misuse problems on intra- and intergenerational relationship dynamics
- how sustained the experience of elder abuse is over time
- whether certain types of elder abuse (e.g. psychological abuse and neglect) are precursors to other types
- the causal relationship between elder abuse and psychological distress, social isolation and disability.
Further research, including using qualitative methods, on elder abuse in some specific contexts would aid in developing improved responses.
As noted in chapter 4, an important group not covered in this methodology is people with cognitive decline. Given the evidence of links between cognitive decline and a higher risk of experiencing elder abuse (Storey, 2020), and indications that elder abuse experiences are different for those experiencing cognitive decline (Gillbard, 2019), this is an important area for further research. However, it is also methodologically and ethically complex (Williams et al., 2017) and would require a specialised approach.
Although data collection from those with cognitive impairment requires particular care, it should not be considered unfeasible. Cognitive impairment does not inevitably equate to incapacity to consent to participation in research. It is recognised that people with dementia may want to participate in research and they have a right to be heard in matters about them (see review by Mayo & Wallhagen, 2009; Chesterman & Bedson, 2017; Slaughter, Cole, Jennings, & Reimer, 2007). Further, research assessing elder abuse in the context of cognitive impairment can also be based on the observations of third parties, such as family members, carers and professionals (see e.g. studies cited in Ho et al., 2017 and Touza & Prado, 2019).
For Aboriginal and Torres Strait Islander groups, the understanding of elder abuse is situated within the history of colonisation and its consequences, including dispossession from traditional lands, removal of children and the disruption of cultural norms in relation to respect and care for elders (Gooda, 2012). Research on elder abuse among Aboriginal Torres Strait Islander communities is scarce but existing sources have drawn attention to cultural norms concerning resource sharing being distorted as a lever for financial abuse (Gooda, 2012; Western Australia Office of the Public Advocate, 2005; Western Australia Parliament, 2018).The 'I never thought it would happen to me' report concluded that Aboriginal and Torres Strait Islander older people are at 'greater risk' of elder abuse and that it may occur at a younger age for these groups.
Following recommendations for research from the inquiry's report (Western Australia Parliament, 2018, Rec 4), the WA Department of Communities commissioned IPS Management Consultants to examine elder abuse among older Aboriginal and Torres Strait Islander people in metropolitan, regional and remote areas in Western Australia in early 2021. Further research on elder abuse among Aboriginal and Torres Strait Islander groups outside of WA is also required, including research that takes into account the diverse circumstances of communities in rural, regional and remote areas (Warren & Blundell, 2019). In keeping with recognition of the need for policy and services to be developed in partnership with Aboriginal and Torres Strait Islanders in a culturally safe way (e.g. Western Australia Parliament, 2018, Rec. 5), such research should be led by Aboriginal and Torres Strait Islander communities (National Health and Medical Research Council [NHMRC], 2018).
Locally and internationally, there is very limited empirical evidence on elder abuse in LGBTIQ contexts (Dow et al., 2020, Westwood, 2019). The limited existing evidence suggests that LGBTIQ groups are at potentially higher risk of experiencing elder abuse, including in forms 'relating to their minority sexualities and/or gender identities, while also being at greater risk of non-disclosure due to their social marginalisation' (Westwood, 2019, p. 110). Consistent with Westwood's observation, Seniors Rights Victoria points to a range of factors that may feed into experiences of elder abuse among LGBTIQ people, including homophobia and transphobia and a potential history of estrangement from family and friends (Seniors Rights Victoria, 2018), possibly leading to heightened levels of social isolation.
Research specifically focusing on elder abuse experiences among LGBTIQ people is needed. Such research should examine the form elder abuse takes in this context, its impact and what effective service responses look like from an LGBTIQ perspective.
It is also important to further understand neglect, including the experiences of the people in the 'no-one to help' group (chapter 6). Given that neglect has characteristics that set it apart from other forms of abuse, more in-depth understanding of how it arises and how it may be addressed, including through overcoming barriers to help seeking, is warranted.
It is important to note in this context that the Royal Commission into Aged Care Quality and Safety found that the aged care system was difficult to enter, navigate and access (summary report, pp. 65-66). It also noted that wait times to receive care at home could be lengthy, ranging from seven to 34 months depending on the level of care required. Even when care packages were assigned, some people received less care than required and did not have access to the specific services they needed.
Summary
In summary, this report has set out the findings of the largest study to date on elder abuse in Australia. The research suggests that one in six Australians aged 65 and over and living in the community has experienced elder abuse in the preceding 12 months.
In applying a socio-ecological lens, the research has established factors correlated with elder abuse at the individual, family and community level. It has also highlighted challenges for the service system and areas where further policy development is required. Additionally, it has identified a need for further research to continue to develop the evidence base.
Figure 14.1 depicts the main aspects of the findings using a socio-ecological framework with insights particularly well-developed at the individual, family and community level. The following paragraphs describe the main points in the figure.
Although the research shows that anyone can experience elder abuse, the study indicates that factors associated with greater vulnerability for victims at the individual level are social isolation, mental ill-health, physical ill-health, disability and renting or paying off a home. Factors associated with perpetrators (according to victims), are mental ill-health, physical ill-health, substance misuse and unemployment. Issues common to both victims and perpetrators are dependence (in either direction or at a mutual level) and shared residence.
These findings, together with insights from other research (ABS, 2020b; Acierno et al., 2010; National Initiative for the Care of the Elderly, 2015), indicate a need to understand complex victim-perpetrator dynamics and how histories of child abuse, family violence and other trauma may influence susceptibility to experiencing elder abuse at this later life stage or indeed susceptibility to perpetrating elder abuse.
Given that a significant proportion of elder abuse involves family members, the family-level factors indicated in this research are also significant. The association between a history of relationship breakdown and vulnerability to experiencing elder abuse, together with findings on financial stress, point to the significance of both relationship issues and financial stress in the constellation of issues that underpin elder abuse. It is also significant that the relational context in which elder abuse occurs inhibits disclosure and action and potentially compounds its impact. Family-level influences relevant to perpetration include entitlement, the opportunity afforded by being in a position of trust and the fact that very limited help-seeking behaviour means that often there may be no or limited adverse consequences to deter perpetration.
Findings on financial management practices and the susceptibility of women who receive help in managing financial matters to financial abuse point to a need to increase financial literacy among older women to reduce opportunities for abuse. Better understanding of norms and practices around intergenerational support, as well as factors that support family cohesion across the life course, would support insight into these dynamics within families and how positive practices could be enhanced.
Community dynamics are significant in a number of ways. First, members of an older person's community, such as neighbours, friends and acquaintances, are a significant group of perpetrators. In this context, vulnerability stemming from ill-health and isolation on the part of the victim are important in considering dynamics in this context. Additionally, attitude-related issues, including ageism and lack of recognition of abusive behaviours, together with the secrecy that surrounds abuse, are significant issues in abuse conducive circumstances.
Second, next to family members, friends are the group to whom an older person is most likely to disclose abuse. These findings reinforce the need to raise awareness at the community level of what elder abuse is, how to support a person who discloses abuse, and what help is available for people experiencing abuse. They also point to the importance of a community role in looking out for older people and 'calling out' abusive behaviour when seen.
Although this research was not intended to directly examine the service system, the findings about levels of non-disclosure and reliance on avoidant strategies, demonstrate a need to assess whether the mechanisms available to identify and address elder abuse are appropriate, adequate and accessible. Importantly, in developing further responses, the question that should be asked is 'what do people who experience elder abuse want from services?'
Further development of responses needs to appropriately manage the complex relationship contexts within which elder abuse occurs so that the potential negative consequences of disclosure do not place the older person in a worse position than they would have been in had disclosure not occurred. This complex relationship context, the possibility that in many cases the older person may want to maintain an ongoing relationship with the perpetrator and the role that perpetrator-related problems such as mental and physical ill-health play in driving abuse, place focus on the need to reduce opportunity and address perpetrator problems, as well as improve understanding on what drives perpetrator behaviour.
Figure 14.1: Findings and implications in a socio-ecological framework
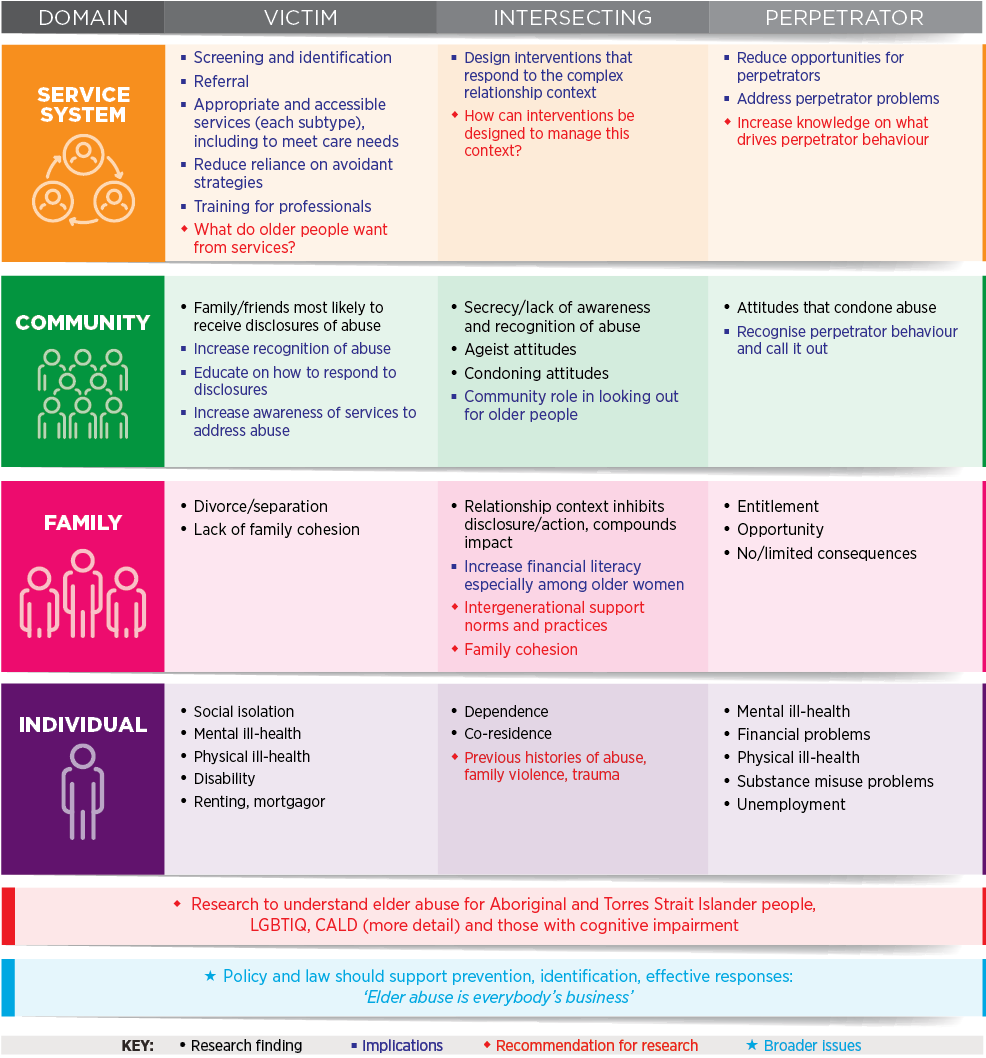
This report was commissioned and funded by the Australian Government Attorney-General's Department (AGD). The authors would like to acknowledge the support of the Family Safety Branch in the AGD.
We thank the Social Research Centre for the implementation of the fieldwork. Sincere thanks also to Professor Ilan Katz, Dr Trish Hill, Wendy Heywood, Laura Rimington and Nikki Honey (Social Policy Research Centre), as well as Professor Briony Dow (Director, National Ageing Research Institute) and Associate Professor Bianca Brijnath (National Ageing Research Institute) for their important advisory contributions to this project.
We extend our gratitude to members of the Expert Panel for their advice on this project: Christine Coumarelos (Australia's National Research Organisation for Women's Safety), Cathy Etherington (Australian Bureau of Statistics), David Firman (Queensland Treasury), Anna Gillbard (Elder Abuse Prevention Unit) and Melinda Leake (Australian Institute of Health and Welfare).
We would like to thank our colleagues at the Australian Institute of Family Studies; in particular, Andrew Whitecross, Acting Director, Anne Hollonds, former Director, Kelly Hand, Deputy Director (Research), Dr Michael Alexander, Deputy Director (Corporate and Strategy), Dr Jennifer Prattley (Statistician) and Jatender Mohal (Senior Manager, Data Management & Linkage) for their advice and support throughout this research.
Sincere appreciation to the AIFS library team and, in particular, Gillian Lord for her research assistance, together with the AIFS communications team; in particular, Katharine Day for editing this report and Lisa Carroll for preparing the report for publication.
Finally, we are very grateful to all the people who participated in the surveys and took the time to talk to us about their views and experiences.
Views expressed in this publication are those of individual authors and may not reflect those of the Australian Government or the Australian Institute of Family Studies.
Qu, L., Kaspiew, R., Carson, R., Roopani, D., De Maio, J., Harvey, J., Horsfall, B. (2021). National Elder Abuse Prevalence Study: Final Report. (Research Report). Melbourne: Australian Institute of Family Studies.
22 December 2021
Download Research report
Related publications

National Elder Abuse Prevalence Study: Summary report
This report summarises the findings of a nationally representative survey of 7,000 people aged 65 and over living in…

Assisting families with ageing-related relationship issues
This discussion article explores Relationship Australia's service response to the ageing of Australia's population.

Responding to elder abuse: Rights, safety and participation
This webinar outlined emerging evidence on the prevalence and risks associated with elder abuse, and discussed…