Child poverty across the industrialised world
You are in an archived section of the AIFS website
Whether measured in relative or real terms, child poverty varies widely across industrialised countries, with most countries having higher levels of national income tending to have lower real poverty rates. The data show Australia as having a relatively high child poverty rate, although the half overall median poverty rate is lower than the United States and United Kingdom.
While the reduction of poverty among the aged has been one of the great success stories of the post-war welfare state, in many countries the last two decades have seen a re-emergence of child poverty. Although the labour market deterioration and family structure changes that have driven these changes have been felt in most (post-) industrialised countries, the poverty outcomes have varied widely.
In the largest industrialised country, the United States, child poverty rates remain high despite relatively high average incomes. Child poverty rates also tend to be higher than average in the other English-speaking countries (including Australia), but much lower than average in the Nordic countries. In the former-socialist countries, dramatic falls in incomes associated with the transition to capitalist economies have led to equally dramatic increases in child poverty.
Why is there so much variation in child poverty rates between countries at similar levels of economic development? What roles do differences in family structure (for example, sole-parenthood), labour markets (for example, unemployment), and welfare state institutions (income transfer programs) play in explaining this variation?
This article presents results from a recent UNICEF study of patterns of child poverty across the industrialised world (Bradbury and Jäntti 1999). The study is based on data from the Luxembourg Income Study (LIS)(1) covering some 25 industrialised countries, including most of the OECD, several of the important non-OECD economies of Eastern Europe (including Russia), and one representative of the newly industrialising countries of East Asia (Taiwan).
Measuring child poverty
In rich nations, poverty is rarely so severe as to threaten survival itself. However, it is still true that 'money matters' for children. Household consumption, whether in the form of goods and services purchased on the market, or via the provision of goods and services by the state, affects child wellbeing both directly and indirectly. Consequently, children are defined here to be poor when they live in a household which has 'a particularly low level of consumption'.
The possibility of social exclusion and its associated social fragmentation is one major reason for our concern about poverty (although not the only reason). For children, the impact of poverty on their social integration is often via their parents. Parents with access to levels of material resources that are low for their society may be excluded from the mainstream of social activities, and this may in turn exclude their children. In addition, reduced consumption opportunities may also exclude children directly, particularly as they become older and seek to form social contacts outside the home. As one 14-year-old girl in a family reliant upon state benefits in the United Kingdom says to Roker and Coleman (1998: 17) 'For me it's about not being part of things, not having the money to live normally like other people.'
The measure of consumption used here is the equivalent annual disposable income of the household in which the child lives(2). Income includes market incomes and government cash transfers, and deducts income taxes and compulsory social insurance contributions. People aged less than 18 years are defined as children. It is assumed that every person in the household has the same poverty status. Income is divided by an 'equivalence scale' which takes account of the variations in needs as household size changes. The scale used in the results presented here is needs = (adults + children x 0.7) 0.85 . (Sensitivity testing shows little change in cross-national patterns when an alternative equivalence scale is used.)
The literature on poverty measurement has typically used two types of poverty threshold: 'absolute' and 'relative' poverty lines. 'Absolute', or more properly, fixed real price poverty lines, are thresholds which permit people living in specified family types to purchase the same bundle of goods and services in different countries or times. Children living in families that fall below the common consumption threshold are therefore considered to be poor. 'Relative' poverty lines, on the other hand, are more closely related to concepts of social exclusion. These poverty lines are typically defined with reference to a measure of 'typical' consumption levels (for example, half median income).
Both relative and real measures provide important insights into the way the living conditions of the most disadvantaged children vary across countries. This article uses three different indicators of child poverty - an overall median poverty line, the US official poverty line, and the relative mean income of the poorest fifth of children.
Overall median poverty line. This relative line is the most common form of poverty line used in international comparisons. For each individual in the population, their household equivalent income is calculated. The poverty line is defined as 50 per cent of the median of this variable across the national population.
The US official poverty line. This real poverty line is set equal to the United States official poverty line for a couple plus two children in 1995 (USD 15,299). National currencies are converted to US dollars by using a purchasing power parity index (PPP) for 1995 and national inflation rates to deflate incomes over time. These price adjustments are likely to be less robust for the transition countries, not least because of the hyper-inflation experienced in many of these after 1989.
The relative mean income of the poorest fifth of children. The mean equivalent household income of the poorest one-fifth of children is calculated, and this is divided by the median household income of children. This thus shows the distance of the poorest children from the average child (rather than the average person as for the overall median poverty line). Nonetheless it is highly correlated with the overall median poverty line (across countries the correlation is - 0.95). However, being based on average incomes rather than income thresholds means that it is easier to identify the sources of variation, and this feature is used below.
Poverty patterns
Table 1 shows the level of child poverty for the latest available LIS years using the relative and absolute poverty indicators. The countries are sorted by descending child poverty rate, using the half overall median poverty line.
Table 1. Child poverty rates
| Country | Year | Poverty rate using different poverty lines | |||
|---|---|---|---|---|---|
| 50% of overall median | US poverty line | ||||
| Rate | Rank | Rate | Rank | ||
| Russia | 1995 | 26.6 | (1) | 98.0 | (1) |
| United States | 1994 | 26.3 | (2) | 18.5 | (12) |
| United Kingdom | 1995 | 21.3 | (3) | 28.6 | (10) |
| Italy | 1995 | 21.2 | (4) | 38.1 | (9) |
| Australia | 1994 | 17.1 | (5) | 20.7 | (11) |
| Canada | 1994 | 16.0 | (6) | 9.0 | (16) |
| Ireland | 1987 | 14.8 | (7) | 54.4 | (6) |
| Israel | 1992 | 14.7 | (8) | 45.3 | (8) |
| Poland | 1992 | 14.2 | (9) | 90.9 | (3) |
| Spain | 1990 | 13.1 | (10) | 47.3 | (7) |
| Germany | 1994 | 11.6 | (11) | 12.4 | (14) |
| Hungary | 1994 | 11.5 | (12) | 90.6 | (4) |
| France | 1989 | 9.8 | (13) | 17.3 | (13) |
| Netherlands | 1991 | 8.4 | (14) | 10.0 | (15) |
| Switzerland | 1982 | 6.3 | (15) | 1.6 | (24) |
| Taiwan | 1995 | 6.3 | (16) | 4.3 | (20) |
| Luxembourg | 1994 | 6.3 | (17) | 1.1 | (25) |
| Belgium | 1992 | 6.1 | (18) | 7.9 | (17) |
| Denmark | 1992 | 5.9 | (19) | 4.6 | (19) |
| Austria | 1987 | 5.6 | (20) | 5.4 | (18) |
| Norway | 1995 | 4.5 | (21) | 2.8 | (22) |
| Sweden | 1992 | 3.7 | (22) | 3.7 | (21) |
| Finland | 1991 | 3.4 | (23) | 2.6 | (23) |
| Slovakia | 1992 | 2.2 | (24) | 95.2 | (2) |
| Czech Republic | 1992 | 1.8 | (25) | 85.1 | (5) |
Note: Children are poor if their household has an equivalent disposable income less than 50 percent of the overall median or less than the official US poverty line (adjusted for different currencies using PPP indices). Countries are sorted by the overall median rate.
Source: Bradbury and Jäntti (1999).
There is large variation in measured rates of child poverty across countries. Taking first the poverty rate relative to the overall median, the likelihood that a randomly picked child will live in a poor family ranges from 1.8 per cent in the Czech Republic to 26.6 per cent in Russia. Northern European countries have fairly low poverty rates. The Nordic countries range between 3.4 (Finland) and 5.9 (Denmark) per cent. Central European countries follow, with Austria, Belgium, Luxembourg and the Netherlands having rates between 5.6 and 8.4 per cent. The United States, Italy, Australia, Canada, Ireland and the United Kingdom are all fairly high up in the poverty ranking, whilst Spain, France and Germany fall towards the middle of the 25 countries.
Unfortunately, Australia is one country where there is significant statistical uncertainty over the level of poverty in the 1990s. The poverty rates for Australia shown in this article place Australia in a similar position relative to other countries as did earlier research conducted during the 1980s. Some researchers have argued, however, that increases in income support payments have led to a subsequent decrease in Australian poverty rates (Harding and Szukalska 1999).
To aid international comparability, the Luxembourg Income Study uses the annual income measure collected in the Australian Bureau of Statistics surveys for the Australian data. This shows a slight increase in child poverty between the 1980s and 1990s. Harding and Szukalska use an alternative 'current' income definition - which shows a fall in poverty. Unfortunately the Australian Bureau of Statistics changed their income survey methodology in the early 1990s, and there are reasons to believe that neither the annual nor the current income measures are fully comparable with the income data collected in the 1980s. Hopefully, more detailed research in the future will allow us to say with more confidence which income measure is best for Australian time series and/or cross-national comparisons.
Returning to the larger cross-national picture, surprising diversity is found among the five former socialist countries in the LIS database. These countries have the lowest national incomes and this is reflected in their very high poverty rates based on the US poverty line. However, in terms of relative poverty, these data show wide diversity in the experience of transition from socialism. Of the 25 countries, Russia has the highest (overall median) child poverty rate and the Czech Republic the lowest.
Although the process of industrialisation is often associated with increased inequality, our single example of an East Asian economy, Taiwan, has a comparatively low child poverty rate - not that different from those found in Northern Europe. Whilst this data does not take account of the financial responsibilities of Chinese parents for their own parents living in other households, this result is nonetheless surprising and deserving of more research.
We now turn to the 'real' measure of poverty, that based on the US poverty line and PPP-adjusted incomes. The poverty ranking using this standard of living definition is quite different from the ones obtained using relative definitions. In particular, the transition economies now all have very high poverty rates. For instance, in the Czech and Slovak Republics (which had the lowest poverty rates using the half overall median poverty line) almost all children are now counted among the poor (though these estimates should not be considered precise).
Turning to the wealthier countries, we find that a large proportion (almost one-fifth) of US children are poor, compared to the low of 1.1 percent in Luxembourg or 1.6 per cent in Switzerland. The north European and Nordic countries with low levels of relative child poverty have also low levels of poverty measured against the US poverty line. For instance, in Sweden 3.7 and in Belgium 7.9 per cent of all children are poor. Italy, Ireland and Spain all have very high levels of child poverty using this measure. In Australia and the United Kingdom, more than one-fifth of all children have a standard of living that is lower than the US official poverty line.
In Figure 1, these poverty estimates are compared against the per-capita national incomes of each country (the former socialist countries are off the scale at the top of the figure). As would be expected, countries with higher national income levels are able to ensure that fewer of their children live in families with incomes below the US poverty line.
Figure 1: National incomes and the proportion of children below the US poverty line
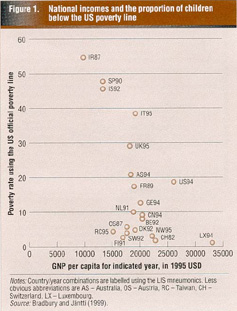
The most important exception to this general relationship is the United States itself. Despite having the highest national income after the small country of Luxembourg, it has a real child poverty rate that is in the middle of these 25 countries and in the bottom half of the OECD countries included here. The key exception in the opposite direction is Taiwan (labelled RC95), that has a national income only slightly higher than Spain and Israel, but one of the lowest child poverty rates. Other countries with low poverty rates but with incomes only slightly higher than Taiwan are Finland, Sweden, Austria and Denmark.
The remaining two outliers, Luxembourg and Italy, are perhaps of less substantive interest. In the first case the poverty rate is close to negligible and measurement error is likely to be important. The results for Italy, on the other hand, may be a reflection of the large informal economy in this country. Whilst estimates of the informal economy are incorporated into the national accounts measures of income, this is more difficult to do at the household level.
Explanations
Why is there so much variation in child poverty across nations with similar levels of economic development? Explanations have focused on three areas - demographic patterns, state income transfers, and labour market outcomes.
In almost all countries, children living in lone-mother households are more likely (often much more likely) to be in poverty than children living with both parents. At the same time, some of high child poverty countries (particularly the United States and Britain) have high rates of lone parenthood. Is this an explanation for their high poverty rates?
In general, the answer to this question is no. If we calculate overall child poverty rates assuming that the rates of lone parenthood are identical, the cross-national ranking does not change to any great extent. Although the United States and Britain have high rates of child poverty and lone motherhood, this relationship does not hold generally. Norway and Sweden, in particular, have high rates of lone motherhood but low rates of child poverty. This is the case even though lone mothers in Norway, in particular, are still significantly worse off than couples and larger households.
Most research on patterns of poverty in rich nations has, not surprisingly, focused on public income transfers, as these are the policies which are most directly charged with providing incomes to disadvantaged families. As might be expected, there is an association between welfare effort and low rates of (relative) child poverty. Countries with a higher share of national income devoted to welfare transfers and services also tend to have lower child poverty rates (though this relationship is surprisingly weak when we focus on the transfers received by the poorest households).
A common way of showing the anti-poverty impact of income transfers is to calculate before and after transfer poverty rates. That is, counter-factual poverty rates are calculated assuming that the only income of families is that which they receive from the market (for example, wages and property income), and this is compared with the actual poverty rates observed after the incorporation of taxes and transfers. The gap between these two poverty rates is thus an indicator of the impact of state income transfers on poverty rates.
However, this presentation provides only part of the story. One problem with this approach is that it is not symmetric; it shows the effect of excluding transfers, but does not show the complementary possibility of households living on transfers alone. Moreover, any counter-factual assumptions are just that - counter to fact. It is very likely that market incomes would change substantially in the total absence of public transfers, particularly since this counter-factual implies that large fractions of the population would have zero incomes.
An alternative way of showing the relationship between market incomes, state transfers and children's living standards is shown in Figure 2. For convenience of exposition, this figure disaggregates the relative mean incomeof the poorest fifth of children in each country. As noted above, this is strongly correlated with the half-median relative poverty measure.
For the poorest one-fifth of children in each country, the elements of the following identity are calculated
| Mean disposable income | = | Mean market income | + | Mean net social transfers |
| Median | Median | Median |
where all incomes are in equivalent terms (that is, adjusted for needs) and the median is the median equivalent disposable income across all children in the country. Market income includes wage, self-employment and property income, and net social transfers includes government transfers minus income taxes and social insurance contributions. These different income components are shown in Figure 2 for each of the 23 countries with recent LIS data (excluding Austria, where market incomes are not separately identified). The five transition countries have been separately identified with open diamonds (see Bradbury and Jäntti (1999) for more details).
Figure 2: Relative income package of the poorest one-fifth of children in each country
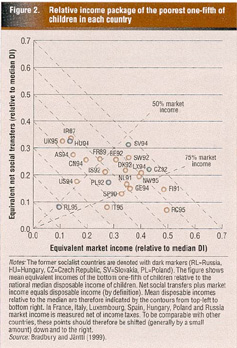
Since market income and net social transfers are defined to add up to disposable income, the latter (relative to median income) can also be read directly from Figure 2. The lines running from top-left to bottom-right indicate contours of equal relative disposable income. The further is the diagonal band from the origin, the higher is the relative living standard of the most disadvantaged children (compared to the median child in their country). The ranking of countries in this respect parallels the child median poverty results in Table 1, with the Nordic countries joined by the Czech and Slovak republics as having relatively equal distributions of income among children.
The rays from the origin in Figure 2 indicate the share of income received from market incomes. This share varies widely, from around three-quarters of disposable income (Taiwan, Italy, Finland, Spain, Germany) to as low as one-quarter (the United Kingdom). In most countries, this market income is mainly wages and salaries. In Taiwan, Russia, Ireland and Finland, however, around one-third of market income is from other sources (such as farm and other business income) and in a number of countries these sources contribute around one-fifth of market income.
We can use this figure to show how the cross-national variation in the relative disadvantage of poor children (variation from bottom-left to top right) is due to variation in market incomes (left to right variation) or variation in net social transfers (up - down). Even though there is substantial variation between countries in net social transfers, there is even greater variation in the relative levels of the market incomes received by the households of the most disadvantaged children. That is, there is more horizontal than vertical spread in Figure 2.
It is also interesting to note that, in countries where the families of the most disadvantaged children have market incomes that are well below average, there tends to be a higher level of social transfers. There are at least two interpretations possible for this correlation. One is the behavioural-response hypothesis: high levels of social transfers to the most disadvantaged suppress their labour supply, and that market incomes adjust to more than offset the patterns of social transfers. The other is that in countries where markets lead to substantial child poverty there is a policy response to alleviate this - that is, that social transfers reduce the dispersion in poverty rates arising from the market. Given that the former would imply an extremely (and unlikely) strong behavioural responses, it would seem that the variation in social transfers across nations does reduce the cross national variation in poverty, at least to some degree.
The English-speaking countries provide an interesting illustration of the strength of the correlation between social and market incomes, and the wide variation in the latter. Whilst the United States has the highest relative child poverty rate among the non-transition countries, the other English speaking countries also have high poverty rates (see Table 1). Yet these countries, as a group, actually have a comparatively high level of social transfers going to their most disadvantaged children.
Indeed, if we use as our 'poverty' index the average income of the poorest 20 per cent of children relative to that of the median child, we can use Figure 2 to describe results using a counter-factual simulation that is the opposite of that commonly employed. If the poorest 20 per cent of children were forced to rely only upon the social transfers that their families were receiving at the time of these surveys, then the relative poverty rates in Ireland, the United Kingdom, Hungary, the Slovak Republic and Australia would all be lower than those in Sweden. In fact, however, it is the high labour market earnings of Swedish parents that ensure high living standards for the most disadvantaged children in that country.
Conclusions
Child poverty, whether measured in relative or real terms, varies widely across the industrialised countries. The results presented here, based on the latest available LIS data for early to mid 1990s are, in most cases, in line with earlier studies. Nordic and Northern European countries have low rates of child poverty, whereas Southern European and English-speaking countries tend to have high rates. The poverty ranking of the former socialist economies, depends very much on whether a real or relative poverty line is used.
The data presented here show Australia as having a relatively high child poverty rate, although the half overall median poverty rate is lower than the United States and United Kingdom. Whilst this is consistent with other results from the 1980s, there is some uncertainty about whether this pattern is still an accurate reflection of the living standards of Australian children in the mid-1990s. Other data show a more favourable trend for Australian child poverty.
Across the whole spectrum of industrial countries considered here, those with higher levels of national income do tend to have lower real poverty rates. Important deviants from this relationship are the United States, which has a much higher level of child poverty than its national income would suggest, and Taiwan, which has a lower than expected child poverty rate.
Children are generally more likely to be poor if living with a lone mother, but variations in rates of lone motherhood are not an important reason for the variations in child poverty across countries.
Whilst cash transfers to poor families are important for their living standards, market incomes are also important. Indeed, they appear to play a larger role than state transfers in accounting for the cross-national diversity of outcomes for disadvantaged children. The English-speaking countries other than the United States, for example, actually provide quite substantial income transfers to the families of their most needy children. However, the living standards of these children remain relatively low because of low labour market incomes.
This suggests that improvements in unemployment, wages for parents and mothers' employment should be a central focus of policy efforts to increase children's living standards. Such an emphasis on labour market outcomes need not necessarily be associated with welfare state retrenchment. Indeed the higher living standards of the most disadvantaged children in the 'welfare leaders' (particularly the Nordic countries) is due to the higher market incomes in these families. Whether this is because of different labour market and family support policies (such as child care subsidies), because of the different incentive structures imposed by different targeting patterns, or because of other factors, remains to be seen.
Notes
- The Luxembourg Income Study comprises a database of household income survey information, adjusted to be as comparable as possible. For more information see http://lissy.ceps.lu/.
- In the United Kingdom and Russia 'current' income is used, and in Sweden and Switzerland the sharing unit is the tax unit rather than the household. In Bradbury and Jäntti (1999) it is argued that broadening the income measure to include non-cash benefits provided by the state, and to take account of household savings patters, is unlikely to change the cross national ranking of child poverty rates to any great degree.
References
- Bradbury, B. & Jäntti, M. (1999), Child Poverty Across Industrialised Nations, Innocenti Occasional Papers, Economic and Social Policy Studies, No. 71, UNICEF International Child Development Centre, Florence. http://bruceb.sprc.unsw.edu.au/papers/Iop71d.pdf
- Harding, A. & Szukalska, A. (1999)style="line-height: 1.6em; word-spacing: -0.05em;">Trends in Child Poverty in Australia 1982 to 1995-96, NATSEM Discussion Paper No. 42, National Centre for Social and Economic Modelling, Canberra. http://www.natsem.canberra.edu.au/pubs/dps/dp42/dp42.html
- Roker, D. & Coleman, J. (1998), 'The invisible poor: young people growing up in family poverty', Paper presented at the conference to mark the centenary of Seebohm Rowntree's first study of poverty, in York, University of York, 18-20 March.
Bruce Bradbury is a Senior Research Fellow at the Social Policy Research Centre, University of New South Wales. This article is based on research conducted in collaboration with Markus Jäntti of Abo Akademi University, Finland, and funded by the UNICEF International Child Development Centre and the Australian Research Council.
2 September 1999