Growing Up in Australia: The Longitudinal Study of Australian Children
The first decade of life
You are in an archived section of the AIFS website
With the release in August 2011 of the fourth wave of Growing Up in Australia: The Longitudinal Study of Australian Children (LSAC), Australia now has national longitudinal data on children's development for the first decade of children's lives. Longitudinal surveys offer opportunities to understand changes in children's development over time and how their earlier experiences shape that development, not only in the middle school years but late adolescence and into adulthood. These types of data can inform policy-makers about how and when to develop preventative strategies or interventions to achieve the best outcomes for children.
The LSAC study provides an evidence base to inform these decisions for the current generation of Australian children, and because of its broad scope, to investigate the contribution of the children's social, economic and cultural environments to their adjustment and wellbeing. The study examines multiple facets of development, including physical health, and social, cognitive and emotional development. Factors that predispose children to poorer outcomes and those that are protective can be identified, and how these interact with children's own characteristics (such as the temperament) and in the broader family, early child care, school and neighbourhood contexts can also be examined.
A set of 11 key research questions guides the study, clustered around the themes of child and family functioning, health, child care, and education (see Sanson et al., 2002, for a detailed discussion):1
- What factors influence a child's physical health and development over time? What is the effect of physical health on a child's overall wellbeing and on other specific outcomes, and how does this influence change over time?
- What are the nature and impacts of family composition, relationships and dynamics on individual outcomes, and how do these relationships and their effects change over time?
- What is the influence of parent labour force participation, education and economic status on individual outcomes? How do the patterns and impacts of parent labour force participation, education and economic status change over time?
- What are the effects of non-parental child care on individual outcomes (particularly those relating to social and cognitive competence, attachment, impulse control, and control of attention). How do these experiences and influences change over time?
- What are the experiences that influence children's school engagement and achievement? How do these impact on individual outcomes and how do these patterns and effects change over time?
- What are the impacts of children's use of time on individual outcomes (such as physical fitness and obesity, family relationships, social skills, and learning)? How does the impact of different patterns of time use change over time?
- What are the impacts of child, parental and community beliefs, attitudes and expectations on outcomes? How do the patterns and effects of these beliefs, attitudes and expectations change over time?
- What characteristics of children, families and communities help children to develop resilience and cope with transitions or adversity? How do these factors influence individual outcomes and how do these influences change over time?
- What social connections and support are available to families and children and how do they impact on individual outcomes, and how do the impacts of these social connections and support change over time?
- What are the impacts of broad neighbourhood characteristics and community connectedness, engagement, trust and violence on individual outcomes, and how do these impacts change over time?
- What is the impact of intergenerational characteristics on individual outcomes, and how does this impact change over time?
Growing Up in Australia: The Longitudinal Study of Australian Children is conducted in partnership between the Department of Families, Housing, Community Services and Indigenous Affairs (FaHCSIA), the Australian Institute of Family Studies (AIFS) and the Australian Bureau of Statistics (ABS). FaHCSIA provides overall management of LSAC on behalf of the Australian Government; AIFS is responsible for the design and content of the study and for the preparation of research and statistical reports; and ABS is responsible for data collection and delivery, instrument development and management of the LSAC sample.
A consortium of leading researchers at research institutions and universities throughout Australia provides advice to the study. The consortium brings together significant research expertise. It includes researchers from a wide range of disciplines, including child development, sociology, epidemiology, public health, family studies, psychology, paediatrics and child health, early childhood education, services and social policy research, and economics (see Box 1). This breadth of expertise ensures comprehensive coverage of influences on child and adolescent development.
Box 1: Consortium Advisory Group members
The Institute is supported by Professor Ann Sanson as Principal Scientific Advisor, and the Consortium Advisory Group (CAG), which includes members of each of the consortium partners. The CAG is chaired by Professor Stephen Zubrick, and its membership is as follows:
- Dr John Ainley, Principal Research Fellow and former Head of Research at Australian Council for Educational Research, Melbourne
- Dr Peter Azzopardi, Centre for Adolescent Health, Murdoch Childrens Research Institute and Royal Children's Hospital, Melbourne
- Professor Donna Berthelsen, Faculty of Education, Queensland University of Technology
- Professor Michael Bittman, School of Behavioural, Cognitive and Social Sciences, University of New England
- Dr Bruce Bradbury, Senior Research Fellow, Social Policy Research Centre, University of New South Wales
- Associate Professor Linda Harrison, School of Teacher Education, Charles Sturt University - Bathurst
- Professor Jan Nicholson, Parenting Research Centre, Melbourne
- Professor Bryan Rodgers, Family Health and Wellbeing, Australian Demographic and Social Research Institute, Australian National University
- Professor Ann Sanson, Department of Paediatrics, University of Melbourne
- Professor Michael Sawyer, Research and Evaluation Unit, Women's and Children's Hospital, School of Paediatrics and Reproductive Health, University of Adelaide
- Associate Professor Lyndall Strazdins, Fellow, National Centre for Epidemiology and Population Health, Australian National University
- Professor Melissa Wake, Centre for Community Child Health at the Royal Children's Hospital, Murdoch Childrens Research Institute and University of Melbourne
- Professor Stephen Zubrick, Head, Division of Population Science, Institute for Child Health Research, Perth
The CAG is supported by staff from the LSAC teams at AIFS, FaHCSIA and the ABS.
Study design and sample recruitment
This section provides a brief description of the study's design and the way in which the initial sample was recruited; more detailed information can be found in discussion and technical papers on the project's website at <www.aifs.gov.au/growingup>.
The study is using an accelerated cross-sequential design in which two cohorts of children are being followed for 14 years (and possibly longer), starting from when the children were aged 0-1 years and 4-5 years. The 0-1 year old cohort is often described as the B (baby) cohort and the 4-5 year old cohort as the K (kindergarten) cohort (or alternatively they can be identified by the years of their birth: 2003-04 birth cohort and 1999-2000 birth cohort respectively).
Face-to-face interviews are conducted every two years, with the first wave of data collection occurring in 2004. Wave 5 fieldwork was completed in November 2012.
The two-cohort design has enabled information on children's development over the first 10 or 11 years of life to be collected in 6 years. The two cohorts are also able to be compared at overlapping ages, to gauge the effect of growing up in differing social conditions and policy settings. The overlapping of cohorts first occurred in Wave 3 (at 4-5 and 6-7 years) and continues to occur for each subsequent wave (see Table 1).
As the focus of the study is on children's development, "the child" was the sampling unit of interest. The sampling frame was the Medicare Australia (formerly the Health Insurance Commission) enrolments database. During 2004, a sample of more than 18,500 children within particular birth dates was taken from the Medicare administrative database. First, a sample of children was drawn via a random selection of 330 postcodes. Next, children and families within these postcodes were randomly selected for invitation into the study. A process of stratification was used to ensure that the numbers of children in each state/territory and within and outside each capital city were proportionate to the population of children in these areas.
A total of 10,090 children and their families participated in Wave 1; approximately half of the children were infants (aged 3-19 months) and half were 4-5 years old. The sample is broadly representative of all Australian children (citizens and permanent residents) in each of two selected age cohorts: children born between March 2003 and February 2004 (B cohort) and children born between March 1999 and February 2000 (K cohort). Children in some remote parts of Australia were excluded because of the extremely high data collection costs in these areas.
| Wave 1 (2004) | Wave 2 (2006) | Wave 3 (2008) | Wave 4 (2010) | Wave 5 (2012) | Wave 6 (2014) | Wave 7 (2016) | Wave 8 (2018) | |
|---|---|---|---|---|---|---|---|---|
| B cohort | 0-1 years | 2-3 years | 4-5 years | 6-7 years | 8-9 years | 10-11 years | 12-13 years | 14-15 years |
| K cohort | 4-5 years | 6-7 years | 8-9 years | 10-11 years | 12-13 years | 14-15 years | 16-17 years | 18-19 years |
Response rates and sample retention
The final Wave 1 sample represented 53% of all families who were sent a letter by Medicare Australia. Refusals were the largest source of sample loss (31% for the B cohort and 35% for the K cohort), followed by "non-contact". Non-contact occurred when the address details were out-of-date or if only a post office box address was available. The rates of non-contact were 10% for the B cohort and 14% for the K cohort. The response rates achieved if non-contactable families are excluded is 64% for the B cohort and 57% for the K cohort.
The Wave 4 data collection took place in 2010, with 8,405 families completing an interview, yielding a response rate of 83% of the originally recruited sample. Similar numbers of families from each cohort participated (4,606 in the B cohort and 4,464 in the K cohort). Between Waves 3 and 4, 637 families permanently withdrew from the study. A further 204 families elected not to participate in the 2nd wave but to remain members of the study. One hundred and thirty five families were away for the entire fieldwork period. A total of 526 families were not able to be contacted, but these families are still considered to be study members.
This retention rate compares favourably with those achieved by comparable international studies. For example, the Millennium Cohort Study, a United Kingdom longitudinal study of approximately 19,000 families and babies, had a sample retention rate of 72% between its Sweep 1 and Sweep 4 (Waves 1 and 4) (Hansen & Joshi, 2007). The six-year period was similar to the period between Waves 1 and 4 of LSAC. The retention rate for Wave 4 also compares favourably compared to other large-scale Australian surveys. For instance, the Household, Income and Labour Dynamics in Australia (HILDA) survey, a general population household survey that commenced in 2001, reported that the proportion of Wave 1 respondents re-interviewed at Wave 7 (also a six-year period) was 69% and the proportion of Wave 1 respondents re-interviewed at Wave 4 (a three-year period) was 76% (Summerfield et al., 2011).
Families can respond to all or only part of the study (with the exception of the face-to-face interview with the Parent 1, which all families must complete in order to participate in the wave).
Table 2 summarises the response rates from families in later waves, using the Wave 1 sample and "available" sample as the bases for comparisons. Table 3 details the reasons why interviews were not obtained in Waves 2, 3 and 4.
Table 4 shows the response rates in Waves 1, 2, 3 and 4 for the differing data collection components.
| Main waves | B cohort | K cohort | Total | ||||||
|---|---|---|---|---|---|---|---|---|---|
| No. | Response rate of Wave 1 (%) | Response rate of available sample (%) | No. | Response rate of Wave 1 (%) | Response rate of available sample (%) | No. | Response rate of Wave 1 (%) | Response rate of available sample (%) | |
| Wave 1 original | 5,107 | 100.0 | 4,983 | 100.0 | 10,090 | 100.0 | |||
| Wave 2 available a | 5,047 | 98.8 | 4,913 | 98.6 | 9,960 | 98.7 | |||
| Wave 2 responding b | 4,606 | 90.2 | 91.2 | 4,464 | 89.6 | 90.9 | 9,070 | 89.9 | 91.1 |
| Wave 3 available a | 4,971 | 97.3 | 4,829 | 96.9 | 9,800 | 97.1 | |||
| Wave 3 responding b | 4,386 | 85.9 | 88.2 | 4,332 | 86.9 | 89.7 | 8,718 | 86.4 | 89.0 |
| Wave 4 available a | 4,929 | 96.5 | 4,774 | 95.8 | 9,703 | 96.2 | |||
| Wave 4 responding b | 4,241 | 83.0 | 86.0 | 4,164 | 83.5 | 87.2 | 8,405 | 83.3 | 86.6 |
Notes: a Available sample excludes those who opted out of the study between waves. Some additional families also opted out permanently during the fieldwork process. b Those who had home visit.
| Response status | Wave 2 | Wave 3 | Wave 4 | |||
|---|---|---|---|---|---|---|
| No. | % | No. | % | No. | % | |
| Responded | 9,070 | 91.1 | 8,718 | 89.0 | 8,405 | 86.6 |
| Refused | 284 | 2.8 | 436 | 4.4 | 637 | 6.6 |
| Non-contact | 540 | 5.4 | 552 | 5.6 | 526 | 5.4 |
| Away for entire enumeration period | 61 | 0.6 | 93 | 1.0 | 135 | 1.4 |
| Death of study child | 5 | 0.1 | 1 | < 0.1 | 0 | 0.0 |
| Total starting sample | 9,960 | 100.0 | 9,800 | 100.0 | 9,703 | 100.0 |
| B cohort | K cohort | |||
|---|---|---|---|---|
| Wave 1 | % of Wave 1 eligible interview sample | Response rate of those eligible | % of Wave 1 eligible interview sample | Response rate of those eligible |
| Parent 1 leave-behind questionnaire | 100.0 | 85.0 | 100.0 | 84.9 |
| Parent 2 self-complete questionnaire | 90.7 | 79.8 | 86.0 | 79.0 |
| Teacher self-complete questionnaire | - | - | 95.5 | 68.8 |
| Home-based carer self-complete questionnaire | 15.4 | 43.4 | - | - |
| Centre-based carer self-complete questionnaire | 8.5 | 53.4 | - | - |
| Time use diary | 100.0 | 78.9 | 100.0 | 77.6 |
| Wave 2 | % of Wave 2 eligible interview sample | Response rate of those eligible | % of Wave 2 eligible interview sample | Response rate of those eligible |
| Parent 1 during-interview questionnaire | 100.0 | 97.8 | 100.0 | 97.6 |
| Parent 1 leave-behind questionnaire | 100.0 | 76.8 | 100.0 | 78.3 |
| Parent 2 self-complete questionnaire | 89.0 | 76.3 | 85.2 | 77.5 |
| PLE self-complete questionnaire | 8.7 | 24.0 | 13.7 | 32.5 |
| Teacher self-complete questionnaire | - | - | 99.6 | 81.7 |
| Home-based carer self-complete questionnaire | 17.2 | 67.3 | - | - |
| Centre-based carer self-complete questionnaire | 36.3 | 68.4 | - | - |
| Time use diary | 100.0 | 74.3 | 100.0 | 77.6 |
| Wave 3 | % of Wave 3 eligible interview sample | Response rate of those eligible | % of Wave 3 eligible interview sample | Response rate of those eligible |
| Parent 1 during-interview questionnaire | 100.0 | 87.3 | 100.0 | 87.9 |
| Parent 2 self-complete questionnaire | 88.9 | 70.6 | 85.6 | 72.3 |
| PLE self-complete questionnaire | 7.9 | 78.6 | 11.8 | 79.0 |
| Teacher self-complete questionnaire | 93.8 | 82.5 | 98.7 | 85.2 |
| Time use diary | 100.0 | 77.2 | 100.0 | 77.8 |
| Wave 4 | % of Wave 4 eligible interview sample | Response rate of those eligible | % of Wave 4 eligible interview sample | Response rate of those eligible |
| Parent 1 during-interview questionnaire | 100.0 | 99.2 | 100.0 | 98.9 |
| Parent 2 self-complete questionnaire | 87.4 | 72.2 | 84.3 | 75.3 |
| PLE self-complete questionnaire | 10.3 | 85.9 | 13.7 | 86.2 |
| Child self-report | 100.0 | 98.6 | 100.1a | 98.2 |
| Teacher self-complete questionnaire | 97.7 | 82.7 | 96.7 | 83.3 |
| Time use diary | - | - | 100.1a | 98.4 |
Notes: Response rate columns are the percentage of those eligible to complete the form. a There were five cases where a child interview was completed and the main interview with parents was not. Refer to Wave 4 issue paper for more details.
Between-wave surveys
As well as the main data collection waves, three between-wave mail surveys have been conducted. The aim of these surveys is to gain an update of the child's progress in specific areas and to maintain the engagement of study families. The first between-wave survey took place in 2005 and included a brief update on the children's health and development, as well as their family, educational and care experiences. Information for the B cohort was also sought on families' service utilisation, parental employment history, maternity and other leave arrangements. In 2007, a second between-wave survey was undertaken that examined work and child care, parental return to work patterns, the child support arrangements of separated or divorced families, and children's media and technology use. The third took place in 2009, with the foci being on education (particularly the transition to school for the B cohort), health (particularly puberty for the K cohort) and children's use of media and technology. No further between-waves surveys have been collected due to declining response rates (in Wave 3.5, only 59% of Wave 1 respondents completed the survey and returned it).
Methods of data collection
Reports from multiple informants are sought in order to obtain information about the child's behaviour across differing contexts and to reduce the effects of respondent bias. Information is being collected from the child (using physical measurement, cognitive testing and interviews, depending upon the age of the child), the parents who live with the child (biological, adoptive or step-parents), home-based and centre-based carers (for preschool children who are regularly in non-parental care), and teachers (for school-aged children). From Wave 2, information has also been sought from parents who live apart from the child but who have contact with them (parent living elsewhere; PLE). See Table 5 for a summary.
In Wave 4, face-to-face computer-assisted interviews (CAIs) were conducted with the child, with the K cohort also completing a self-administered interview on a laptop computer with headphones to provide audio guidance (audio computer-assisted self-interview; ACASI). The primary carer of the child (Parent 1) also completed a computer-assisted interview, as well as being interviewed directly by the ABS. At Wave 4, Parent 1 was the child's biological mother in 96% of families. The other resident parent (biological, adoptive or step-parent) was also asked to complete a leave-behind questionnaire. If a parent lived elsewhere, then they were invited to participate in a computer-assisted telephone interview (CATI). Consent was sought to send a self-complete questionnaire to home-based carers, centre-based carers and teachers. Almost all parents provided consent. In addition, the interviewer recorded some observations about the neighbourhood, family and child.
Several direct assessments of the children's physical and cognitive development have been taken. The physical assessments include height, weight, girth and head circumference. At Wave 4, body fat was also measured for both cohorts and the blood pressure of children in the K cohort. Cognitive tests have included a measure of general cognitive abilities needed for beginning school ("Who am I?"; WAI), a measure of language skills (the Peabody Picture Vocabulary Test; PPVT) and a measure of non-verbal intelligence (Matrix Reasoning from the Wechsler Intelligence Scale for Children; MR). The timing of the physical and cognitive testing varies depending on the developmental appropriateness of the particular measure, which can be seen in Table 6.
In Wave 1, interviewers spent an average of 120 minutes in each home. The times in subsequent waves were 75, 95 and 90 minutes for Waves 2, 3 and 4 respectively.
| Wave 1 | Child | Parent 1 (primary carer) | Parent 2 (if lives with child) | Parent living elsewhere | Home-based carer | Centre-based carer | Teacher |
|---|---|---|---|---|---|---|---|
| Cognitive and/or physical testing | |||||||
| B cohort | X | ||||||
| K cohort | X | ||||||
| Interviewer-administered | |||||||
| B cohort | X PAPI | ||||||
| K cohort | X PAPI | ||||||
| Self-complete form(s) | |||||||
| B cohort | X SCIP & SCMB | X SCMB | X SCMB | X SCMB | |||
| K cohort | X SCIP & SCMB | X SCMB | X SCMB | X SCMB | |||
| Time use diary a | |||||||
| B cohort | X SCMB | ||||||
| K cohort | X SCMB | ||||||
| Wave 2 | Child | Parent 1 (primary carer) | Parent 2 (if lives with child) | Parent living elsewhere | Home-based carer | Centre-based carer | Teacher |
| Cognitive and/or physical testing | |||||||
| B cohort | X | ||||||
| K cohort | X | ||||||
| Interviewer-administered | |||||||
| B cohort | X CAI | ||||||
| K cohort | X CAI | X CAI | |||||
| Self-complete form(s) | |||||||
| B cohort | X SCIP & SCMB | X SCMB | X SCMB | X SCMB | X SCMB | ||
| K cohort | X SCIP & SCMB | X SCMB | X SCMB | X SCMB | |||
| Time use diary a | |||||||
| B cohort | X SCMB | ||||||
| K cohort | X SCMB | ||||||
| Wave 3 | Child | Parent 1 (primary carer) | Parent 2 (if lives with child) | Parent living elsewhere | Home-based carer | Centre-based carer | Teacher |
| Cognitive and/or physical testing | |||||||
| B cohort | X CAI | ||||||
| K cohort | X CAI | ||||||
| Interviewer-administered | |||||||
| B cohort | X CAI | X CATI | |||||
| K cohort | X CAI | X CAI | X CATI | ||||
| Self-complete form(s) | |||||||
| B cohort | X SCIP | X SCMB | X SCMB | X SCMB | |||
| K cohort | X SCIP | X SCMB | X SCMB | ||||
| Time use diary a | |||||||
| B cohort | X SCMB | ||||||
| K cohort | X SCMB | ||||||
| Wave 4 | Child | Parent 1 (primary carer) | Parent 2 (if lives with child) | Parent living elsewhere | Home-based carer | Centre-based carer | Teacher |
| Cognitive and/or physical testing | |||||||
| B cohort | X CAI | ||||||
| K cohort | X CAI | ||||||
| Interviewer-administered | |||||||
| B cohort | X CAI | X CATI & CAI | X CATI | ||||
| K cohort | X ACASI & CAI | X CATI & CAI | X CATI | ||||
| Self-complete form(s) | |||||||
| B cohort | X SCMB | X SCMB | |||||
| K cohort | X SCMB | X SCMB | |||||
| Time use diary | |||||||
| B cohort | |||||||
| K cohort | X SC & CAI | ||||||
Notes: PAPI: Face-to-face pen-and-paper interview. SCIP: Self-complete questionnaire while interviewer present. SCMB: Leave-behind or mailout self-complete questionnaire. CAI: Face-to-face computer-assisted interview. CATI: Computer-assisted telephone interview. ACASI: Audio computer-assisted self-interview. SC: Self-complete time use diary, with assistance from interviewer. a The time use diary was not necessarily completed by Parent 1.
| Measure | Wave 1 | Wave 2 | Wave 3 | Wave 4 |
|---|---|---|---|---|
| Physical measurement | Both cohorts | Both cohorts | Both cohorts | Both cohorts |
| Who Am I? | K cohort | - | B cohort | - |
| PPVT | K cohort | K cohort | Both cohorts | B cohort |
| Matrix reasoning | - | K cohort | K cohort | Both cohorts |
| Blood pressure | - | - | - | K cohort |
Topics covered by LSAC
As outlined above, LSAC collects data on a wide range of topics. A summary of the topics covered by LSAC and their scope is provided in Table 7.
A novel feature of LSAC is the use of time use diaries to collect data on a child's activities throughout two 24-hour periods, divided into 15-minute blocks. For each 15-minute block, options are presented in four categories. These are:
- what the child was doing;
- where the child was;
- who was in the same room, or nearby if outside; and
- whether someone was being paid for this activity to take place (in Wave 2, for the K cohort, this was replaced by whether the activity was part of the child's homework).
In addition, information is collected on the day and date the diary was completed, who completed the diary, and whether the day was atypical. In Waves 2, 3 and 4, information on daily diet was also collected. In Waves 1, 2 and 3 Parent 1 completed the diary. At Wave 4, the K cohort children completed the diary themselves, with the assistance of an interviewer, for the day prior to the interview.
The time use diary data have been used widely because they are applicable to many different research questions. Figure 1 is from a paper by Baxter and Hayes (2007) that shows how 4-5 year old children's activities were distributed over the course of weekdays and weekends when grouped into a number of categories, including sleeping, personal care (e.g., bathing, dressing, hair care, health care, eating, drinking, or being fed, held, cuddled, comforted, soothed), achievement-oriented activities (e.g., colouring in or looking at a book, playing an educational game, reading a story, talking/singing, being talked/sung to, being taught to do chores, reading), exercise, television (e.g., watching TV, video, DVD, movie), other play (listening to tapes, CDs, radio, music, or using computer/computer games), social and organised activities (e.g., visiting people, attending a special event or party, taking part in organised lessons/activities, attending a day care centre or playgroup), and travelling and being taken places with an adult (e.g., shopping, or travelling in a pusher, on a bicycle seat, in a car/other household vehicle, on public transport, on a ferry, on a plane).
| Topic | Scope |
|---|---|
| Family demographics | Demographic information relating to the family, such as education, ethnicity and religion |
| Finances | Financial information, such as income and receipt of government benefits |
| Health behaviour and risk factors | Behaviours and risk factors that potentially impinge upon or promote the health of the study child or his/her family, including behaviours such as parental smoking and drinking, child physical activity and diet, as well as risk factors such as a parent experiencing diabetes during pregnancy |
| Health status | Information about the physical and mental health status of the study child or his/her family, such as body mass index, diagnosis with conditions and number of hospital stays |
| Home education environment | Information on factors likely to promote or hinder the child's learning while at home (such as parental support for education, number of books in the home and TV use) and information on parent interaction with teachers, (such as parent-teacher interviews), with parents' and teachers' perspectives being obtained |
| Housing | Information on housing, such as number of bedrooms, tenure type and payments |
| Learning and cognition outcomes | Information on the child's development in the areas of learning and cognition, including language, literacy and numeracy |
| Learning environment | Characteristics of child care or school environment, such as practices employed by teachers and child care workers in their work, such as time use, use of resources and general philosophies |
| Paid work | Information on work status, such as employment type, occupation and work/family interactions |
| Parent living elsewhere | Details of the child's other parent, such as the relationship to study child, interactions with resident parent and child support |
| Parenting | Information on parenting styles and other aspects of parenting, such as self-efficacy |
| Program characteristics | Characteristics of the school, preschool or child care program, such as type of program, number of days or hours the child attends, and staff satisfaction |
| Relationships | Information on the quality of relationships, primarily focused on the relationship between Parent 1 and Parent 2, but also on broader family harmony |
| Social and emotional development | Information relevant to the social and emotional development of the child, such as temperament, behaviour, peer interactions and emotional states |
| Social capital | Information on social capital, such as interactions with neighbours, neighbourhood characteristics and use of services |
Source: AIFS (2007)
Figure 1: Children's activity patterns, by time of day, weekdays and weekends, couple families, K cohort, Wave 1
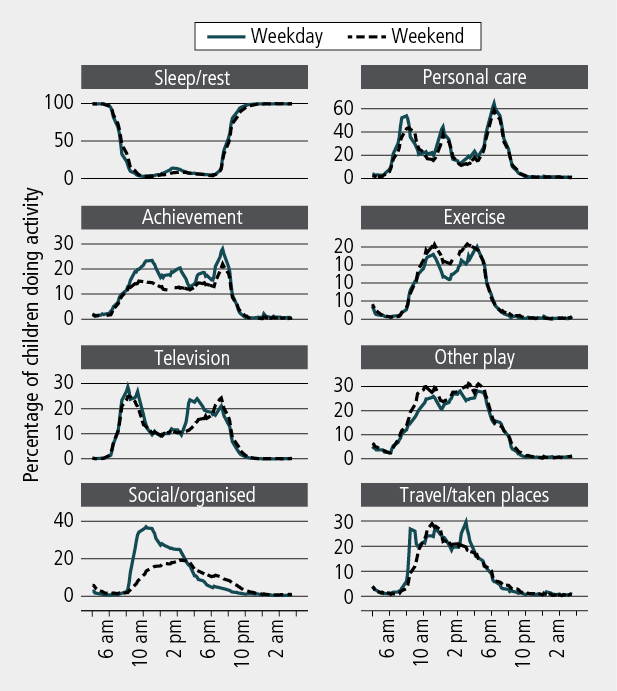
Note: There are different scales for the activity groups.
Data linkage
LSAC has been able to link to a number of administrative databases, which has and will continue to enhance the value of the rich data collected during fieldwork. To date, four data sources have been linked to the main waves, and a further two are planned to be linked. A short description of these datasets follows.
ABS Census of Population and Housing
Data from the Census have been linked to the LSAC data file to obtain socio-demographic profiles of the neighbourhoods and communities in which children live.
National Childcare Accreditation Council (NCAC)
Key research question 4 of LSAC relates to the role of child care in shaping children's development. NCAC has quality assurance data on every long day care (LDC) centre, some family day care (FDC) schemes and some before- and after-school care providers. The LSAC dataset includes linked NCAC data for most children, using LDC or FDC at Wave 1, where contact details of this care were obtained and matched with NCAC data.
Medicare Australia
In Wave 1, we asked parents of study children to give consent for their children's data to be linked with Medicare Australia data for the duration of the study. This includes data from the Medicare Benefit Scheme (MBS), the Pharmaceutical Benefit Scheme (PBS) and the Australian Childhood Immunisation Records (ACIR). Data from these sources provide an indication of usage history of MBS, PBS and ACIR services.
National Assessment Program - Literacy and Numeracy (NAPLAN)
In 2008, NAPLAN commenced in Australian schools. Every year, all students in Years 3, 5, 7 and 9 are assessed on the same days using national tests in reading, writing, language conventions (spelling, grammar and punctuation) and numeracy. These data will enhance LSAC as the NAPLAN test gives a sense of the development of children's literacy and numeracy over time, and also in relation to national benchmarks. We have linked data from NAPLAN since Wave 3 for the K cohort and Wave 4 for the B cohort.
My School (to be linked)
Information from NAPLAN tests aggregated for each of the Years 3, 5, 7 and 9 for each school and other school information, is available for almost 10,000 Australian schools on the My School website at <www.myschool.edu.au>. The information on the My School website is available to the public, and relevant parts of the data will be linked to the LSAC data file. The My School data linked to LSAC includes detailed information about a school's performance in NAPLAN, its student population, the numbers of teaching and other staff, and the school type. Linking relevant aspects of the My School data to the LSAC data provides LSAC data users with valuable information about children's educational environments, which have an important influence on children's developmental experiences.
Australian Early Development Index (AEDI) (to be linked)
The AEDI is a measure of children's development as they enter school. Based on scores from a checklist completed by the child's teacher, the AEDI measures five areas of early childhood development. These are: physical health and wellbeing, social competence, emotional maturity, language and cognitive skills (school-based), and communication skills and general knowledge.
The AEDI was first implemented nationwide in 2009. At this time, the majority of the B cohort children were in the first year of school and would have had an AEDI checklist completed by their teacher. The K cohort was in their third or fourth year of school at this time, therefore no data are available for this cohort.
The AEDI data will be linked to the data file and will add considerably to the value of LSAC data because it will include rich information on the school readiness of study children, as provided by the teacher. This will enable investigation of the relationship between school readiness and early development measures, along with longer term outcomes.
Examples of research that makes use of data linkages
The value of these data linkages are still being realised; however, it is worthwhile noting some interesting examples of research using LSAC that have made use of these data.
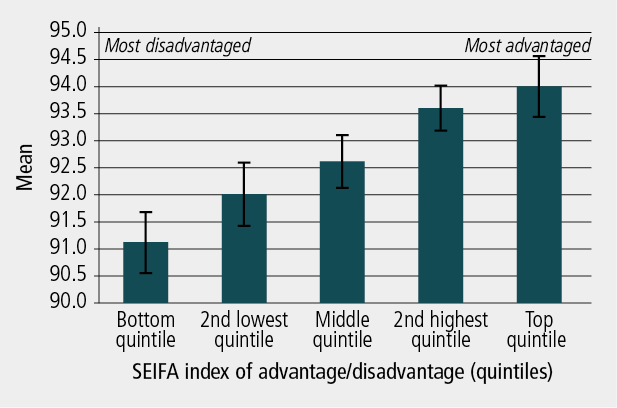
Figure 2 shows differences between 4-5 year old children in their social-emotional wellbeing by quintiles of the Socio-Economic Index for Areas (SEIFA), a measure of the socio-economic status of areas, which is derived by the ABS from the Census (Edwards, 2005). There is a clear socio-economic gradient, with children living in more socio-economically disadvantaged neighbourhoods having lower social-emotional wellbeing than children living in more affluent neighbourhoods.
Figure 2: Neighbourhood effects on social-emotional domain, K cohort, Wave 1
The Medicare Australia data linked to the LSAC database contains information on the health care costs incurred by the Australian government for the MBS and PBS. These data are being used by researchers to estimate the health care costs associated with common childhood disorders such as perinatal risk, mental health difficulties, sleep problems, special health care needs, overweight and obesity, and language disorders. The Medicare costs incurred by children with and without each of these conditions have been calculated, and the excess costs associated with these conditions have been estimated across the whole Australian population. Example findings are that:
- Children born pre-term, with low birth weight or who are small for their gestational age incurred higher Medicare costs in their first year of life and up to age 8 years. Over a four-year period, the excess cost to Medicare incurred by these children was $25 million (Westrupp et al., 2012).
- While individual Medicare costs increased with the persistence of mental health difficulties between ages 4-7 years, population-level costs were highest for those with transient mental health difficulties, suggesting that prevention may be more cost-effective than treatment. Over a four-year period, the excess cost to Medicare incurred by 0-7 year old children with a mental health difficulty was over $27 million (Lucas et al., 2012).
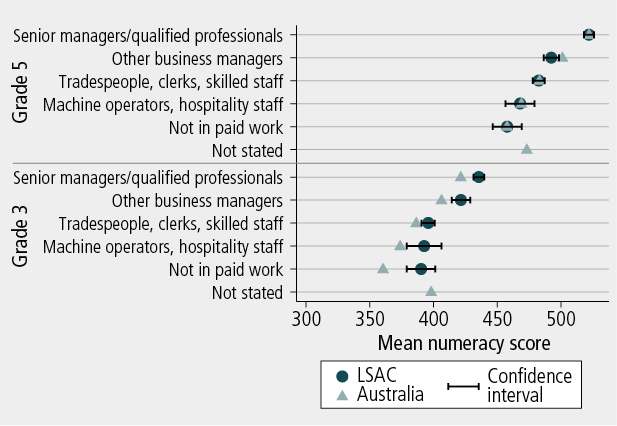
The linkage of educational information, such as NAPLAN data, was only released in 2011, but has tremendous potential for informing educational policy. Figure 3 shows the NAPLAN numeracy scores of children in the LSAC sample by parental occupation, and demonstrates that there is a gradient in children's test scores depending on the occupations of their parents.
As the study proceeds, where feasible, it is hoped that further data sources will be linked to LSAC. To facilitate this process, data users can apply to have geospatial datasets linked to LSAC.2
Figure 3: NAPLAN numeracy scores, by parental occupation, K cohort, Wave 3
Data availability
Data from Waves 1, 1.5, 2 , 2.5, 3, 3.5 and 4 have been released. The LSAC dataset is publicly available, subject to an application process and the granting of a deed of licence. Individuals can have an individual licence, or organisations can be licenced users with their individual users being required to sign a deed of confidentiality. At the end of the 2010-11 financial year, there were over 500 registered users of LSAC data. Data user training workshops are regularly held to assist users gain familiarity with the complex data set.
Endnotes
1 Originally, there were 14 key research questions around which LSAC research was based. Over time, these questions have been refined to the current 11 questions, but the broad topics covered remain the same.
2 See the LSAC website for more details about the application process.
References
- Australian Institute of Family Studies. (2007). Longitudinal Study of Australian Children data user guide: Version 3.0. Melbourne: AIFS.
- Baxter, J., & Hayes, A. (2007). How four year olds spend their day: Insights into the caring contexts of young children. Family Matters, 76, 34-43.
- Edwards, B. (2005). Does it take a village? An investigation of neighbourhood effects on Australian children's development. Family Matters, 72, 36-43.
- Gray, M., & Sanson, A. (2005). Growing Up in Australia: The Longitudinal Study of Australian Children. Family Matters, 72, 4-9.
- Gray, M., & Smart, D. (2008). Growing Up in Australia: The Longitudinal Study of Australian Children is now walking and talking. Family Matters, 79, 5-13.
- Hansen, K., & Joshi, H. (2007). Millennium Cohort Study second survey: User's guide to initial findings. London: Centre for Longitudinal Studies, Bedford Group for Lifecourse and Statistical Studies, University of London.
- Lucas, N., Bayer, J. K., Gold, L., Mensah, F. K., Canterford, L., Wake, M. et al. (2012). The cost of healthcare for children with mental health difficulties. Manuscript submitted for publication.
- Lucas, N., Westrupp, E., Quach. J., Sciberras, E., Wake, M., Mensah, F. et al. (2011, 15-16 November). Cost of common childhood disorders. Paper presented at Growing Up in Australia and Footprints in Time: The LSAC and LSIC Research Conference, Melbourne.
- Sanson, A., Nicholson, J., Ungerer, J., Zubrick, S., Wilson, K., Ainley, J. et al. (2002). Introducing the Longitudinal Study of Australian Children (LSAC Discussion Paper No.1). Melbourne: Australian Institute of Family Studies.
- Summerfield, M., Dunn, R., Freidin, S., Hahn, M., Ittak, P., Kecmanovic, M. et al. (2011). HILDA user manual: Release 10. Melbourne: Melbourne Institute of Applied Economic and Social Research, University of Melbourne.
- Westrupp, E. M., Lucas, N., Mensah, F. K., Gold, L., Wake, M., & Nicholson, J. M. (2012). Healthcare costs for children born low birth weight, preterm and/or small for gestational age: Data from the Longitudinal Study of Australian Children. Manuscript submitted for publication.
Edwards, B. (2012). Growing Up in Australia: The Longitudinal Study of Australian Children: The first decade of life. Family Matters, 91, 7-17.