Experiences of Separated Parents Study
You are in an archived section of the AIFS website
Overview
This report compares the experiences of parents who had separated either before or after the 2012 family violence amendment reforms were introduced. It uses findings from the Experiences of Separated Parents Study.
This report presents the findings of a core element of the Evaluation the 2012 Family Violence Amendments project - the Experiences of Separated Parents Study (ESPS). The research, commissioned and funded by the Australian Government's Attorney-General's Department (AGD), is based on a comparison of two nationally representative samples of the Survey of Recently Separated Parents (SRSP): the SRSP 2012 cohort of parents, who had separated between 1 July 2010 and 31 December 2011 (n = 6,119); and the SRSP 2014 cohort of parents, who had separated between 1 July 2012 and 31 December 2013 (n = 6,079). The family violence amendments introduced by the Family Law Legislation Amendment (Family Violence and Other Measures) Act 2011 came substantially into effect on 7 June 2012 and, as such, the SRSP 2012 survey represents parents' pre-reform experience of the family law system, and the SRSP 2014 represents parents' post-reform experience of the system.
The samples for the two surveys were derived from the Department of Human Services - Child Support (DHS-CS) database and substantially replicate the approach applied in the Longitudinal Study of Separated Families (LSSF). The LSSF research program involved a national, longitudinal study of parents who had at least one child under 19 years of age, who separated after the 2006 reforms to the Family Law Act 1975 (Cth) (FLA), and who were registered with the DHS-CS. Data collection for the LSSF took place in 2008 (Wave 1), 2009 (Wave 2) and 2012 (Wave 3). Together, these studies allow an understanding of the experiences of separated families over a substantial period of time.
The core focus of the SRSP 2012 and 2014 studies were on investigating parents' experiences of family violence and safety concerns (including children's exposure to family violence) and their experiences in disclosing family violence and safety concerns to family law system professionals. The research also explored parents' use of services, patterns in parenting arrangements, child support arrangements and parent and child wellbeing. The data collected informed conclusions about the effect of the 2012 family violence amendments and further developed the evidence base established in the LSSF research program.
Main findings
Family violence and safety concerns
The SRSP 2012 and 2014 data indicate that family violence is a common experience among separated parents, with a majority of participating parents in both cohorts reporting either physical or emotional abuse. Overall, the findings indicate similar profiles in the nature and frequency of family violence and safety concerns in the 2012 and 2014 samples.
Most parents reported experiencing a least one type of emotional abuse before/during or since separation. Overall, mothers reported experiencing emotional abuse in greater proportions than fathers, both in the before/during separation time period (2012: 68% cf. 58%; 2014: 67% cf. 57%) and in the post-separation period (2012: 63% cf. 56%; 2014: 61% cf. 55%). While there were no statistically significant differences between the 2012 and 2014 cohorts in relation to reports of experiencing emotional abuse before separation, a small but statistically significant decrease in the post-separation time period was reflected in the 2014 cohort's reports of the most commonly reported form of emotional abuse - insults with the intent to shame, belittle or humiliate.
Overall, mothers in both cohorts reported experiencing most of the nominated emotional abuse items more frequently than participating fathers. In relation to the intensity of the emotional abuse experienced, a substantial proportion of parents' reports (and predominantly mothers' reports) in each cohort recorded the highest level of reported intensity, which reflected very frequent experience of at least five emotional abuse items (2012: fathers: 8%, mothers 18%; 2014: fathers: 9%, mothers: 17%).
A substantial minority of parents in both the 2012 and 2014 cohorts reported experiencing physical hurt before/during separation (20%), with mothers reporting these experiences in greater proportions than fathers in both cohorts (2012: 24% cf. 16%; 2014: 23% cf. 16%). The reported incidence of physical hurt after separation declined to 5% for fathers and 6% for mothers in the post-separation period for both cohorts. Differences between the 2012 and 2014 cohorts emerged in relation to the effects of physical hurt, with higher post-separation affirmative responses from parents in the 2014 cohort with respect to the categories of "bruises and scratches", "fractured or broken bones", "gunshot, stab wounds or burns" and "other injury".
In the context of a generally stable pattern in reports of experiences of three categories of family violence measured in the SRSP (emotional abuse, physical hurt and attempts to force unwanted sexual activity), some areas of difference were evident between mothers and fathers. That is, a higher proportion of mothers than fathers reported experiencing each type of violence measured, while a higher proportion of fathers reported that they had not experienced any of the three violent and abusive behaviours before/during separation in either cohort (2012: 41%; 2014: 42%) compared with mothers' reported experiences (2012: 31%; 2014: 32%).
In view of the 2012 amendment to the definition of family violence in FLA s 4AB to encompass "violent, threatening or other behaviour by a person that coerces or controls a member of the person's family (the family member), or causes the family member to be fearful", new questions were included in the SRSP 2014 to capture parents' experiences in this regard. In the before/during separation time period, participating mothers were more likely than fathers to report that the behaviour of the other parent had caused them to feel fearful, coerced or controlled, although these reports were more evenly dispersed between parents in relation to feelings of coercion and control. In the post-separation period, mothers were again more likely to report that they felt fearful, while fathers reported in greater proportions than mothers that they "often" felt coerced or controlled in this time period.
Overall, feelings of fear, coercion and control were more commonly reported by parents who had experienced physical hurt and/or attempted unwanted sexual activity as opposed to emotional abuse. Differences of statistical significance were identified between mothers and fathers who reported feeling fearful, coerced or controlled and experiencing either form of family violence, with these differences emerging both before/during and since separation. Mothers' reports of their feelings of fear, coercion and control were also substantially higher than those made by fathers (see Appendix Figures B10 & B11).
The most commonly reported effects on day-to-day activities made by parents who had reported experiencing family violence in the 2012 and 2014 cohorts related to mental health, with statistically significant increases in the reported experiences of mental health issues emerging between the cohorts both before/during separation (2012: 52% cf. 2014: 66%) and since separation (2012: 52% cf. 2014: 60%). Mothers reported experiencing most of the nominated effects in greater proportions than fathers, and mothers also reported experiencing two or more effects in greater proportions than fathers.
Children witnessing family violence
Parents in both the 2012 and 2014 cohorts indicated that their children had witnessed reported emotional abuse or physical hurt in similar proportions, with a greater proportion of mothers than fathers reporting that their children witnessed the family violence before/during separation (mothers - 2012 and 2014: 64% cf. fathers - 2012: 53% and 2014: 54%), and since separation (mothers - 2012: 64% and 2014: 50% cf. fathers - 2012: 53% and 2014: 43%). The decrease in reported post-separation exposure to family violence may reflect greater awareness of the harm caused to children by such exposure, through their interaction with family law system professionals in the post-reform context. When considering parents' reports of the forms of family violence to which their children had been exposed, a higher proportion of mothers than fathers also reported that their children witnessed physical violence compared to emotional abuse alone, with these affirmative reports being particularly pronounced in the post-separation context.
Children's exposure to family violence that resulted in feeling fear, coercion or control was an issue that was also specifically examined in the 2014 survey, given that the definition of abuse in relation to a child in FLA s 4(1) was amended by the 2012 family violence reforms to include exposure to family violence (as defined in s 4AB) that causes serious psychological harm. The SRSP data indicate that the majority of children whose parents reported family violence causing feelings of fear, coercion or control had some exposure to this behaviour. Although the post-separation exposure was lower than in the before/during separation period, the data indicate that most children were nevertheless exposed to behaviour causing these effects, and that fathers' reports were higher than mothers' in this time period, reaching a level of statistical significance.
Safety concerns
Overall, most parents in both cohorts reported that they did not hold safety concerns for themselves or their child arising from ongoing contact with the other parent. However, around one in six parents (17%) in both cohorts did report holding these safety concerns for themselves and/or their children, with an increased proportion of parents in the 2014 cohort reporting that they tried to stop or limit contact because of these safety concerns (2012: 49% cf. 2014: 52%), though this increase did not reach a level of statistical significance.
Among parents who held safety concerns, significantly more mothers than fathers in both cohorts reported trying to stop or limit contact with the focus parent (mothers - 2012: 62% and 2014: 63% cf. fathers - 2012: 28% and 2014: 36%), though the proportion of fathers attempting to limit contact in 2014 increased significantly in 2014.
Care-time arrangements
Similar patterns in the distribution of care-time arrangements emerged in the SRSP 2012 and 2014, which were also similar to those evident in the Wave 3 of LSSF. Where the 2014 SRSP cohort differed, these differences were subtle but statistically significant and, as in the previous section, consistent with the objectives of the 2012 family violence reforms. Most children in both cohorts were reported to be living in majority mother care-time arrangements (where the child spends up to 34% of nights with the father) (2012: 50%; 2014: 46%). There was a statistically significant increase in parenting arrangements involving children spending 100% of nights with the mother and time with the father during the daytime only, from 25% in 2012 to 28% in 2014, and a decrease in majority mother care-time, from 50% in 2012 to 46% in 2014.
Analyses that focused specifically on the patterns evident among parents with family violence and safety concerns indicated that there was a statistically significant increase in 2014 of care-time arrangements involving children of such parents spending 100% of nights with the mother and no nights with the father. Overall, the change emerging in the 2014 data reflected a shift for such children to have daytime contact only rather than toward arrangements involving no time at all with the father. In circumstances where safety concerns were reported, the findings indicate that 23% of children were in arrangements involving daytime contact only with the father in 2014, compared with 19% in 2012. Decreases in reports of some shared care arrangements (where the child spends 53-65% of their time with the mother and 35-47% of their time with the father) and equal time arrangements were also identified in relation to parents reporting safety concerns, though these were not statistically significant decreases.
Generally, mothers reported safety concerns in greater proportions than fathers in the context of care-time arrangements ranging from 100% mother care time through to equal time, whereas fathers reported safety concerns in greater proportions than mothers where care-time arrangements ranged from 100% father care time through to shared care arrangements where the father was the primary carer. In relation to the varying forms of family violence, the data also show that experiences of physical violence were reported in circumstances where either parent had majority or 100% care time of the focus child, while emotional abuse alone or no violence showed no discernable pattern among the different care-time arrangements.
Experiences with the family law system: Patterns in service use
The 2012 family violence amendments were not intended to directly influence parents' use of family law system services and, overall, the findings on service use suggest minimal change between the 2012 and 2014 cohorts in this regard. Where change is evident, it is in a direction consistent with the intention of the 2012 family violence amendments.
The overall pattern of service use among the 2012 and 2014 cohorts indicated a greater tendency for the 2014 cohort to make no use of services or supports, and where services were used, the 2014 cohort reported less use of counselling, relationships and family dispute resolution (FDR) services, lawyers, and legal services at the time of separation. This change in patterns of service use reflect the lower use of services reported by parents not affected by family violence, because the patterns in service use by parents affected by physical hurt or emotional abuse remained largely stable between the two cohorts. The only statistically significant change in service use patterns between the two cohorts among parents affected by physical violence since separation was a decrease in the use of counselling/mediation/FDR services by parents who had experienced physical hurt, with 71% of these parents using one of these services in 2014, compared to 77% in 2012.
Data relating to the parents' reported progress in sorting out their parenting arrangements indicate that compared to the 2012 cohort, the 2014 cohort was less likely (to a statistically significant extent) to have sorted out their parenting arrangements (2012: 74% cf. 2014: 71%). In particular, the reforms have not been associated with parenting arrangements having shorter resolution time frames for some parents affected by family violence. While parents in both cohorts affected by physical hurt (and to a lesser extent emotional abuse) were more likely than parents not affected by these issues to report that their parenting arrangements had not been sorted out, majorities of parents in each category in each cohort (save for fathers in the 2014 cohort reporting physical violence since separation) indicated that their parenting arrangements had been sorted out.
Overall, parents' reports of the pathways that they used to sort out their parenting arrangements were similar among the SRSP cohorts, with most parents (69% in 2012 and 2014) reporting "discussions" as their main pathway. Approximately 10% of the parents reported using counselling/mediation/FDR, with lawyers used by 6-7% of participating parents and courts by 3%. Of those using FDR, a greater proportion of parents in the 2014 cohort (41%) reported reaching an agreement when compared to parents in the 2012 cohort (36%), with this difference reaching a level of statistical significance. The highest rates of agreement via FDR in both cohorts were parents who reported no violence before/during separation (2012: 44%; 2014: 53%). Agreement rates were marginally higher for parents in the 2014 cohort where emotional abuse before/during separation was reported (2012: 36% cf. 2014: 39%). Where physical violence before/during separation had been reported, the agreement rates were substantially higher for parents in the 2014 cohort (38%) than in 2012 (30%), to a statistically significant extent. While patterns remained relatively stable in relation to the use of legal services and courts to reach agreement, where parents used the court system, consistent with the objectives of the 2012 family violence amendments, parents (and mothers in particular) who had experienced physical violence before/during separation in the 2014 cohort were more likely than parents in the 2012 cohort to bring safety issues to court hearings, with this increase reaching a level of statistical significance (2012: 44% cf. 2014: 54%).
Disclosure of family violence and safety concerns
The 2012 family violence amendments included strategies aimed at supporting better identification of family violence and safety concerns by family law system professionals and encouraging parents to disclose these issues. Accordingly, parents' experiences of being asked about (and of disclosing) family violence and child safety concerns were an important focus in the SRSP 2012 and 2014 surveys.
Overall, examination of the 2012 and 2014 SRSP data relating to professionals asking about and parents disclosing family violence and safety concerns suggests subtle positive improvement, consistent with the intention of the 2012 family violence reforms.
Statistically significant increases were evident in the proportions of parents who reported being asked about family violence and safety concerns when using a formal pathway as the main means of resolving their parenting arrangements. Increases were evident among parents who used the three formal pathways (FDR/mediation, lawyers and courts), but particularly evident for those using lawyers and courts, with increases of approximately 10 percentage points in the proportions who reported being asked about family violence and safety concerns. Notably, however, close to 30% of parents in the 2014 cohort reported having never been asked about either of these issues in each formal pathway, indicating that the implementation of consistent screening approaches has some way to go.
In addition to the increases in parents' reporting that they were asked about family violence and safety concerns, the findings also suggest small increases in the proportion of parents who disclosed concerns. A small but statistically significant increase in the proportion of parents who reported experiencing family violence before/during or after separation to one of a range of possible services and organisations (not confined to the family law system) was evident (2012: 53% cf. 2014: 56%), with mothers in 2014 being more likely to report violence than fathers (63% cf. 49%). Physical hurt was more likely to be reported in 2014 than emotional abuse, and the most common service reported to was police (25%). Of note, just over 40% parents did not report family violence to any service in 2014.
Parents self-selected into non-disclosure for a varied range of reasons, including that the family violence or safety concerns were not serious enough to report (2012: 43%; 2014: 38%) or that they could deal with the issue themselves. These findings mean that for a substantial number of people, a history of family violence has not been documented or corroborated, which may or may not have significant implications, given that non-disclosure does not necessarily equate to family violence at the lower end of the spectrum of severity.
More specifically, the proportion of parents who reported disclosing family violence or safety concerns to family law services increased by about 3 percentage points between 2012 and 2014, with the change reaching a level of statistical significance. The findings on the proportions of parents who reported disclosing family violence or safety concerns in the context of making parenting arrangements when using particular pathways demonstrates that increasing increments of parents reported disclosing each type of concern across each pathway in both 2012 and 2014, although reports of disclosure were lowest for parents who used FDR and highest for parents who used courts. Notably, where participating parents reported in the survey either having current safety concerns or having experienced family violence, safety concerns were more likely to be disclosed than family violence.
Mixed findings emerged from the examination of the consequences of disclosure of concerns when assessed against the objectives of the 2012 family violence reforms. Reports of experiences with different pathways varied among participating mothers and fathers, but there were small shifts, and these were mostly evident in a negative direction for parents with family violence and safety concerns for both genders, using all formal pathways (FDR, lawyers, courts). The exception to this was in relation to lawyers and family violence: positive responses among mothers were stable and increased among fathers. Other aspects of the examination of the consequences of disclosing family violence or safety concerns based on parents' reports of what occurred indicate that there were limited short-term effects, though there was some evidence of an increase in referrals to other services and marginally greater use of personal protection orders (relating to safety concerns only) and safety planning.
Parents' views on the efficacy of the family law system
Overall, the views reported by parents participating in each cohort regarding the efficacy of the family law system suggest some positive changes in directions consistent with the intention of the 2012 family violence amendments.
From the perspective of gender, positive views in most areas on measures of efficacy increased incrementally among both mothers and fathers, but among mothers to a greater extent than fathers. Fathers in both cohorts were less satisfied with the family law system than mothers, but this disparity had not widened.
In relation to the experiences of parents reporting family violence, the data suggest a marginal improvement in the views of parents affected by family violence, although this was true to a greater or lesser extent according to the measure and whether the experience involved was physical hurt or emotional abuse. Differences among these groups were evident in different areas, suggesting uneven effects of the reforms, consistent with findings reported in relation to service use. Less positive findings emerged in relation to the family law system protecting children's safety, with agreement among parents with safety concerns for themselves and/or their child in some areas changing little if at all, and with negative shifts for some sub-groups. These findings suggest a particularly mixed set of views and experiences among parents.
Mixed and uneven experiences were also reflected in data relating to nominated pathways. In relation to pathways involving lawyers and courts, there were no clear or consistent statistically significant findings. There was some evidence that the reforms supported the resolution of parenting matters in agreement-based pathways, specifically "discussions" and mediation/FDR.
Finally, in relation to reported awareness of the 2012 family violence amendments, the data indicate a marginal increase among parents in the 2014 cohort, with fathers affected by physical violence and mothers affected by physical violence and/or emotional abuse being more likely to have specific knowledge of the changes in 2014 compared with 2012. Nevertheless, the vast majority of parents (95%) were unaware of the 2012 family violence amendments.
Summary
The findings of this report are based on data from two separate samples, each of over 6,000 separated parents, who had separated either before or after the 2012 family violence amendments. Overall, the findings described in this report suggest some positive shifts in a direction consistent with the intention of the reforms in some areas, and limited or mixed effects in other areas. Consistent with the intention of the reforms, there is evidence of increased emphasis on identifying family violence and child safety concerns across the system, but particularly among lawyers and courts. More parents who used formal services reported being asked about these issues, and increases in parents reporting disclosing were also evident, particularly in relation to safety concerns. There is also evidence that parents with safety concerns were more likely to seek support from family law system services to stop or limit contact than they were before the reforms.
The evidence on parents' experiences of professionals' responses to disclosures of family violence and safety concerns suggest the reforms have had limited effects in this area, particularly for parents who reported using lawyers and courts as their main pathway for parenting arrangements. In contrast, the reforms appear to have supported the resolution of parenting arrangements through agreement-based pathways ("discussions" and FDR/mediation) for parents who had and had not been affected by family violence. The aspect of the reforms likely to be linked to these outcomes are the clarification of advisors' obligations in s 60D, which requires lawyers, FDR practitioners and other professionals to inform parents that the most important issue in making parenting arrangements is their children's best interests. This obligation, together with an obligation to inform parents that where there is a conflict between protecting children from harm and maintaining their relationship with each parent after separation, protection should be given greater weight, were added to the existing obligation to inform parents that they may consider equal or substantial and significant time arrangements.
There was some evidence of an increased emphasis on measures designed to support safety. There was also a subtle shift towards making more arrangements for children to live with their mothers and have daytime-only contact with their fathers where there had been family violence, with a corresponding decrease in arrangements involving overnight stays in these circumstances. Where parents relied on lawyers and courts for making parenting arrangements against a background of family violence or safety concerns, they were, on average, just as likely to indicate they did not consider the professionals' responses to their concerns were adequate, especially in relation to safety concerns, after the reforms.
This report sets out the findings of a core element of the Evaluation the 2012 Family Violence Amendments project - the Experiences of Separated Parents Study (ESPS). This element is based on a comparison of data from two cross-sectional samples of the Survey of Recently Separated Parents (SRSP): the 6,119 parents surveyed in the SRSP 2012, who used family law system services in 2011; and the 6,079 parents surveyed in the SRSP 2014, who experienced the system in 2013. The family violence amendments introduced by the Family Law Legislation Amendment (Family Violence and Other Measures) Act 2011 came substantially into effect on 7 June 2012, meaning the SRSP 2012 survey represents parents' pre-reform experiences and the SRSP 2014 their post-reform experiences. This research was commissioned and funded by the Australian Government's Attorney-General's Department (AGD) and conducted by the Australian Institute of Family Studies (AIFS).
Together, the SRSP 2012 and 2014 studies provide insights into any changes in the ways in which parents have experienced the family law system as a result of the 2012 family violence amendments. These amendments were intended to improve the identification of and response to matters involving family violence and safety concerns. A consistent approach to survey questions, the sampling approach and fieldwork methodology for the SRSP 2012 and 2014 was applied, meaning that statistically rigorous analyses comparing pre- and post-reform patterns in the responses to the survey questions are reported. The samples for the two surveys were derived from the Department of Human Services - Child Support (DHS-CS) database, substantially repeating the approach applied in the Longitudinal Study of Separated Families (LSSF), which was part of the 2009 Evaluation of the 2006 Family Law Reforms. As such, it has continued beyond that research program to allow understanding of the experiences of separated families over the longer term.
Through its focus on the pre- and post-reform experiences of two large, nationally representative and comparable samples of separated parents, the ESPS forms a central plank in the three-part research program comprising the overall evidence base for the Evaluation the 2012 Family Violence Amendments project. The first part, the Responding to Family Violence study, focused on practitioner views and experiences, the findings of which were presented to the AGD in the Responding to Family Violence: A Survey of Family Law Practices and Experiences report on 19 December 2014 (Kaspiew, Carson, Coulson, Dunstan, & Moore, 2014). This current document, analysing the SRSP 2012 and 2014 data, reports on the second part of the evaluation (the ESPS), while the findings from the Court Outcomes Project comprise the third. Together, the three parts of the evaluation research program address a series of research questions, ensuring that the critical questions can be addressed on the basis of more than one source of data. Each of these parts supports a nuanced interpretation of findings across the evaluation, supporting robust conclusions based on triangulation of data sources. A synthesis report based on all three parts of the research program is due for delivery to the AGD on 31 August 2015.
In light of consistent evidence and analyses showing that family violence and child safety concerns are pertinent to substantial numbers of separated families (e.g., Kaspiew et al., 2009; Qu, Weston, Moloney, Kaspiew, & Dunstan, 2014) and highlighting a need for improved responses (Australian Law Reform Commission [ALRC] & NSW Law Reform Commission [NSWLRC], 2010; Chisholm, 2009; Family Law Council, 2009), the 2012 family violence amendments sought to improve rates of disclosure of family violence and safety concerns, and to support better responses by professionals to such disclosures. In addition to obligations concerning disclosure being placed on professionals and parties (s 69ZQ(1)(aa), s 67ZBA, s 67ZBB, s 69Z and s 60CI), the legislative amendments specified that where the legislative principles concerning protection from harm were in conflict with those recognising the child's right to meaningful involvement with each parent after separation, greater weight should be accorded to protection from harm by advisers1 (s 60D(1)(b)(ii)) and court settings (s 60CC(2A)). Further important changes were the widening of the definition of "family violence" and explicit acknowledgement in the legislation that exposing children to family violence amounts to child abuse where it causes serious psychological harm (s 4AB, s 4(1)).
Accordingly, a core focus of the SRSP 2012 and 2014 studies was parents' experiences in disclosing concerns about family violence and safety and the way in which family law system professionals responded to such disclosures. Parents' experiences of family violence and safety concerns were also examined in detail, as was exposure of children to family violence. The research also maintained a focus on parents' use of services, patterns in parenting arrangements, child support arrangements, and parent and child wellbeing to further support conclusions about the consequences of the 2012 family violence amendments, and to continue developing the evidence base established in the LSSF research program. The research questions for the evaluation of the 2012 family violence amendments are considered in section 1.1 and are set out in full in Appendix 1.
The SRSP 2014 represents the third comparable dataset in a series commencing with the LSSF Wave 1 (2008) and continuing with the SRSP 2012. Each of these datasets describes the features and experiences of discrete annual cohorts of separated parents. Together, they shed light on what can be seen to be the consistent features of each annual cohort of separated parents, including the extent to which family violence and safety concerns were relevant to these cohorts, patterns in parenting arrangements and patterns in service use.
1.1 Research design
The SRSP 2014 is based on a methodology that compares the pre- and post-reform experiences of two nationally representative and comparable samples of separated parents with children under the age of 18 years. The pre-reform survey data collection (SRSP 2012) examined the experiences of parents who had separated between 1 July 2010 and 31 December 2011. The experiences of this cohort of separated parents reflected the way in which the system operated in the two-year period prior to the operation of the 2012 family violence reforms. The post-reform survey data collection (SRSP 2014) took place from 7 August to 30 September 2014 and involved a sample of parents whose separations took place between 1 July 2012 and 31 December 2013. The experiences of this second cohort of separated parents reflected the operation of the family law system in the 12- to 18-month period following the introduction of the 2012 family violence reforms.
Data from the SRSP 2014 builds on those of SRSP 2012 to form the basis for the analysis undertaken in the Experiences of Separated Parents Study. Together with the Responding to Family Violence: A Survey of Family Law Practices and Experiences study and Court Outcomes project, the three studies comprise the Evaluation of the 2012 Family Violence Amendments, and the research questions for this evaluation reflect the aims of the amendments. They encompass a series of broad-level research questions, together with a series of more specific research questions shaping each of the separate studies contributing to the evaluation.
The broad-level research questions are:
- To what extent have patterns in arrangements for post-separation parenting changed since the introduction of the family violence amendments, and to what extent is this consistent with the intent of the reforms?
- Are more parents disclosing concerns about family violence and child safety to family law system professionals?
- Are there any changes in the patterns of service use following the family violence amendments?
- What is the size and nature of any changes to practices among family law professionals and to court-based practices and to what extent are any such changes consistent with the intent of the reforms?
- Does the evidence suggest that the legislative changes have influenced the patterns apparent in questions 1-4 above?
- Have the family violence amendments had any unintended consequences, positive or negative?
The SRSP 2014 makes a further contribution to the existing evidence base on the operation of the family law system. Key aspects of the design and sampling strategies of the SRSP 2012 and the LSSF Waves 1, 2 and 3 were used to maintain the comparability of this new cohort of separated parents with the experiences of parents participating in LSSF who (mostly) separated in 2007 and experienced the family law system soon after the 2006 reforms, as well as those of the SRSP 2012 parents, who engaged with the family law system some four years later. The experiences of the SRSP 2014 cohort not only provide further evidence about the operation of the post-2006 system, but also enable comparison against the benchmarks established by the SRSP 2012, which together provide a context in which to examine the effects of the 2012 family violence reforms.
Consistent with the methodology adopted for the LSSF and the SRSP 2012, data collection was undertaken for the SRSP 2014 via surveys administered using computer-assisted telephone interviewing (CATI), and the sampling frame used was the DHS-CS database.
The key areas investigated in the SRSP 2014 were in large part consistent with the SRSP 2012 and similar to Wave 1 of the LSSF, and included:
- the separation pathways and parenting arrangements of participating parents; and
- the nature and strength of any connections between the co-parental relationship and other aspects of parental involvement in the children's lives after family separation.
Consistent with the evaluation research questions and with the SRSP 2012, areas of examination also included:
- the nature (severity and frequency) of family violence experiences, whether family violence and/or safety concerns had been reported to family law and non-family law professionals, and the response of professionals where family violence and/or safety concerns had been reported;
- whether any concerns relating to family violence and/or safety concerns had been raised during the negotiation of parenting arrangements and, if not raised, reasons for not doing so; and
- if family violence and/or safety concerns had been raised, whether such concerns had been considered when negotiating parenting arrangements, and the effects of any such considerations on the nature of parenting arrangements made.
Consistent with SRSP 2012, all parents were again asked whether they knew about the family violence amendments that substantially commenced on 7 June 2012, and to provide their views on the efficacy of the family law system in handling matters involving family violence and safety concerns, and the extent to which the system meets the needs of mothers, fathers and children.
1.2 Data collection
The SRSP 2014 was a survey of 6,079 parents with children aged under 18 years old who (a) separated between 1 July 2012 and 31 December 2013, (b) registered with DHS-CS during 2013, and (c) were still separated from the other parent (known as the "focus parent") at the time of interviewing.
The interviews were carried out using CATI between 7 August and 30 September 2014, with the average interview being 36.8 minutes in duration. Consistent with SRSP 2012, parents participating in SRSP 2014 were asked demographic questions about themselves, their former partner ("the focus parent"), and the eldest child from their union listed in the DHS-CS database (the "focus child"). Once again, the substantive questions asked related to the parenting arrangements that had been made since separation, the quality of their inter-parental relationships, their separation pathways (including any contact with family law system professionals), their experiences of family violence and safety concerns, the wellbeing of their children, and the payment or receipt of child support.
1.2.1 Sample extraction and preparation
In line with Wave 1 of the LSSF and with SRSP 2012, the sample for the SRSP 2014 was drawn from the DHS-CS database, as this database is the most comprehensive and viable data source from which to obtain a representative sample of recently separated parents. This approach was also intended to maximise comparability between the LSSF and SRSP datasets.
As with the LSSF and SRSP 2012, the sample extraction for SRSP 2014 was based on the date on which cases were registered with DHS-CS. For SRSP 2014, registration was to have taken place between 1 January and 31 December 2013, with separation dates from 1 July 2012, where specified. As noted in SRSP 2012, the date of registration for child support is considered to be a good proxy for the date of separation, as most parents register within the three-month period following separation. The sample extraction requirements also provided that a case registered with DHS-CS included both the parent who was the payer of child support and the parent who was the payee, and (consistent with LSSF and SRSP 2012) the first listed child of that relationship (the focus child).
The sample list provided by DHS-CS on 1 May 2014 nominated 35,837 cases. Of the 71,674 individual parents included in the extracted sample, 22,630 of these parents were excluded from the final sample because: they had opted out of the project (n = 2,712), there were missing data in the sample extract file for the other parent (n = 18,219), there was no contact phone number listed for the parent (n = 1,163), they had been included in the SRSP 2012 sample (n = 100), or the parent had featured in "mirror cases" (n = 436). Mirror cases arose in the sample where the same two ex-partners appeared as two separately listed cases, showing one as a payer of child support and the other as a payee. In each instance where mirror cases arose, one of the ex-partners was randomly removed from the sample. A number of discrepancies emerged between the sample extraction requirements and the sample that DHS-CS provided to the fieldwork agency contracted by AIFS to undertake the data collection. A higher than anticipated proportion of the sample extracted was provided without a separation date (n = 12,667 cases; n = 25,334 individual parents), residential addresses were not always provided, not all cases in the sample included payer and payee details, and the details from one parent were missing in the 18,418 cases.
The Department of Human Services mailed letters to the extracted sample of potential participants that provided information about the SRSP 2014 and included an opportunity for them to opt out of the research. Those opting out of the research prior to 3 April 2014 were removed from the sample provided to the fieldwork agency. The main survey sample comprised 28,513 individuals to be approached for participation in the main survey, with this sample distributed across the eight Australian states and territories. This figure was identified as being the required number of individuals to be approached in order to achieve the target sample of 6,000 interviews, assuming a response rate of 21%, based on the experience from conducting the SRSP 2012.
Once again, consistent with SRSP 2012, the SRSP 2014 sample was stratified by state/territory, gender and payer/payee status. In some strata, all potential participants in the sample were selected (e.g., all female payer cases were selected), while in other strata random selection of potential participants were selected (e.g., a proportion of male payer cases were randomly selected). This was done to achieve a geographically proportional sample.
For call outcome statistics for the responding sample, see Appendix 2.
1.2.2 Ethical considerations
The AIFS Human Research Ethics Committee provided ethical review and approval of the SRSP 2014, covering all aspects of the methodology, survey instrument, participant materials and data collection protocols. Fieldwork for the SRSP 2014 was contracted to the same third-party fieldwork agency (with the same management team) that had been retained to undertake the data collection for SRSP 2012. Thorough training sessions and manuals were provided to the CATI interviewers, including training to deal with participant distress and the handling of disclosures of harm and safety concerns. In addition, the SRSP 2014 survey instrument was pilot tested, with these issues among the considerations monitored, and an intensive level of supervision and debriefing employed throughout the fieldwork period. Detailed duty-of-care protocols (devised in accordance with the AIFS Child-Safe Research Policy, requirements for ethics clearance, and legal obligations, as was employed for SRSP 2012) were put in place to facilitate appropriate responses in cases arising during data collection that involved the disclosure of information that could potentially trigger a mandatory reporting obligation (i.e., in cases where there was a risk of family violence or child abuse). Although the duty-of-care protocols were applied to participants in all states and territories, given the specific mandatory reporting requirements in the Northern Territory, only a select team of experienced interviewers conducted interviews with these participants. The Northern Territory survey also included a more specific introduction script that informed potential participants of the mandatory reporting obligations, whereby any disclosures by participants to interviewers of immediate "threats or serious risk of family violence or cases of child abuse" could be required to be reported to the relevant authorities. Participants were also informed that they could refrain from answering any questions that they did not wish to answer. Only five reports were made to the relevant state or territory authorities (with four reports made to the relevant prescribed child welfare authority and one report to the family violence unit of the relevant police department), with these reports being made by senior research staff at the fieldwork agency, in consultation with AIFS.
In addition to the measures noted above, a number of prompts were programmed at relevant intervals in the survey to remind interviewers to offer participants referral numbers to support services if/when it was necessary. At the end of each survey, interviewers recorded whether they had offered referral numbers and whether participants had accepted them. Of the 3,645 offers made to participants (60% of all interviews), 31% (n = 1,122) accepted the referrals that were provided at the time of the interview or, upon the participants' request, at a later date (through email, postal mailout, or by follow-up phone call).
1.2.3 Participant recruitment and data collection
As noted at section 1.2.1, all potential participants listed in the sample were mailed a letter providing them with the opportunity to opt out of future research. All opt-outs received within the specified timeframe (n = 2,712) were removed from the database prior to the sample being released to the fieldwork agency contracted to undertake the data collection.
All potential participants (n = 28,513) were mailed personalised primary approach letters, together with an information brochure prepared by the fieldwork agency on AIFS' behalf, in the week prior to their record being loaded into the survey sample for initial telephone approach. The pre-approach letter and brochure outlined the SRSP 2014 and provided information about participant privacy and confidentiality, together with contact information for both AIFS and the fieldwork agency for further information on the research. The letter also provided a project-specific toll-free 1800 number and email address (maintained by the fieldwork agency's research supervisors) for any participants or potential participants who wished to find out more about the study, change their contact details, make an appointment for an interview, or opt out prior to or during the fieldwork period.
As noted in section 1.2.2, all interviewers were provided with training by the fieldwork agency via a briefing session and an interviewer manual prior to commencing fieldwork. The project employed 107 interviewers and 16 supervisors, who were briefed at four interviewer briefing sessions held between 5 and 14 August 2014. The briefing sessions covered the background to the study, a detailed explanation of the questionnaire and sample, participant confidentiality, response maximisation techniques, complaint handling, dealing with interviewer and participant distress (including when to offer referrals to relevant national and state-based support services), and duty-of-care issues and protocols (including mandatory reporting requirements in the Northern Territory). Together with the interviewer manual, interviewers were also provided with briefing packs that included copies of the opt-out and primary approach letters, the participant information brochure, a copy of a fact sheet titled Changes to the Family Law from 7 June 2012, and a list of national and state telephone support services together with the protocols regarding referrals to these support services.
Consistent with SRSP 2012, all participant information, including details of the focus parent and focus child, were kept in password-protected files on a secure server with restricted access at the offices of the fieldwork agency. Interviewers and their supervisors did not have access to any identifiable participant information except as provided to them within each individual survey. All identifiable details were removed from the data file of completed interviews provided to AIFS for analysis.
1.2.4 Data collection issues
Thorough testing of the survey was carried out by both the fieldwork agency undertaking the data collection and by AIFS prior to commencement of the main data collection. An interim dataset was also provided to AIFS for review part way through the data collection period.
A new survey module was introduced to SRSP 2014 as part of the parent component of the Responding to Family Violence: A Survey of Family Law Practices and Experiences study. This module was placed just after the family violence disclosure module of the SRSP 2014 questionnaire and immediately before the family law system outcomes module (discussed in this chapter). This placement was considered the most appropriate for the SRSP instrument as it caused the least disruption to the flow of the interview (given that the topic of that module was about similar services and experiences to those that had just been discussed in the existing SRSP questionnaire). However, at the beginning of this module, parents were advised to let the interviewer know if they felt a question did not apply to their situation. Although this approach was considered appropriate (given that many aspects of services would not apply for some parents due to limited contact), it resulted in the SRSP 2014 cohort of parents responding more frequently with "Not applicable" to the subsequent SRSP module (family law system outcomes and experiences). As "not applicable" wasn't a valid response for questions in this module, interviewers used appropriate probing methods to encourage parents to select a valid response (e.g., "agree" or "disagree"). Although this interviewing approach was consistent with the interviewing methods in SRSP 2012, the analysis shows that in 2014, where parents did not "agree" or "disagree", they tended to respond with "don't know" rather than "neither agree nor disagree". In contrast, notably higher proportions of parents in SRSP 2012 than 2014 nominated "neither agree nor disagree" when probed (though "don't know" was still more common than "neither" in 2012). Further examination showed higher proportions of "neither agree nor disagree" in 2012 compared with 2014, but higher proportions of "don't know" in 2014 than in 2012. However, when the two responses ("don't know" and "neither") were combined, the proportions were very similar.2
We speculate that this discrepancy between the two cohorts may be associated with the introduction and placement of the Responding to Family Violence: A Survey of Family Law Practices and Experiences module in 2014, and that for this cohort, parents who initially responded to the SRSP questions with "not applicable", when probed, selected "don't know" rather than "neither agree nor disagree" as the most appropriate response. Although for all other sections of the report we have excluded "don't know" responses, analysis of the section on family law system outcomes and experiences reveals that a significant minority of parents did not feel they were able to answer these questions definitively (by either agreeing or disagreeing with the statements). For this reason, we have included the "don't know" and "neither agree nor disagree" responses (combined for succinctness) in the analysis of the family law system outcomes module.
1.2.5 Analytical approach
Consistent with SRSP 2012, the analysis presented in this report is based on weighted data. The sample data for parents was first weighted to take into account the unequal probability of sample selection of participants with different characteristics. The variables used to develop the weights were the same as those used in Wave 1 of the LSSF and in SRSP 2012.3
Data were analysed using STATA MP Version 13, and data items were further analysed by participants' gender and, where relevant, by their experiences of family violence. For the majority of the data items reported here, the proportions of "don't know" or "refused" responses were less than 2% of the combined total in most cases. As such, the "don't know" and "refused" responses have been excluded from most of the reported analyses, except in a small number of tables and figures as marked.
Statistical significance testing was undertaken where indicated in relation to comparisons between SRSP 2012 and SRSP 2014. With respect to SRSP 2014 data analysed in isolation, statistical significance testing was conducted only for selected items (where indicated), so any differences in reported data that do not indicate statistical significance should be interpreted with this in mind.
1.2.6 Limitations
This research represents one component of the Evaluation of the 2012 Family Violence Reforms. The main findings of the overall research program are set out in the Evaluation of the 2012 Family Violence Amendments: Synthesis Report (Kaspiew, Carson, Dunstan et al., 2015). The findings in this report are critical to assessing the effects of the reforms and should be considered in the context of other evidence from the evaluation research program.
In some respects, the findings in this report should be considered as evidence of emerging effects of the reforms rather than conclusions, as the experiences of the post-reform sample of parents reflect the operation of the reforms in their first two years.
An area where particular challenges arise for research based on population-level quantitative survey methods is in relation to experiences of family violence (see, for example, Australian Bureau of Statistics [ABS], 2013). Although this research builds significantly on the existing evidence base in this area through examining experiences and patterns across two separate, cross-sectional datasets of separated parents, and in more detail than has occurred in Australia previously, there are several aspects of the experience of family violence that the methodology applied in this context cannot illuminate. The measures applied in the ESPS study go some way towards establishing prevalence and intensity of family violence in post-separation parenting contexts, but they do not shed light on a range of important questions. These include the dynamics of aggression and defence, which research in clinical samples from the US has shown are important in understanding family violence experiences from the perspective of gender (Hamberger & Larsen, 2015) or on the subjective construction of the experiences, which previous research has indicated vary according to gender (Bagshaw et al., 2010; Hergarty, 2007, p. 11). Hamberger and Larsen (2015) identified gender differences in relation to both physical and emotional violence, including that women appeared to use physical violence in response to violence initiated against them (p. 715).
The SRSP was nevertheless able to capture variations between the effects of physical violence perpetrated by men and women (see, for example, Straus, Hamby, Boney-McCoy, & Sugarman, 1996) and in patterns in the forms of emotional abuse employed by men and women (Hamberger & Larson, 2015).
1.3 Approach and structure of this report
This report compares the findings of the SRSP 2012 and SRSP 2014, particularly highlighting areas where changes in response patterns are evident. The findings of the Court Outcomes Project will provide further insight into the effects of the reforms on parenting arrangement outcomes in court orders by consent or judicial determination. The insights into the experiences of the small proportion of parents nominating court as the main pathway for reaching parenting arrangements in SRSP 2014 will be augmented by the data available from the file analysis in the Court Outcomes Project to provide a more focused view of the effects that the legislative changes have had.
This report has eight further chapters and three appendices. In each chapter, where the findings reported are of statistical significance, this will be identified in the accompanying text. Other data reported, while not reaching a level of statistical significance, are nevertheless important in demonstrating consistencies between the 2012 and 2014 SRSP cohorts, and similarities between gender groups were relevant. Chapter 2 provides an overview of the socio-economic, demographic and family composition characteristics of parents participating in the SRSP 2014. It also includes an examination of parents' relationship dynamics and parenting arrangements in the post-separation context, and an overview of the incidence of family violence among the SRSP 2014 cohort in comparison with the SRSP 2012 and LSSF Wave 1 samples. Chapter 3 focuses on family violence and safety concerns, and examines the incidence, frequency and effects of family violence and safety concerns, both before/during and since separation. The discussion also examines parenting arrangements made by parents who were reporting family violence and ongoing safety concerns. The analysis in Chapter 4 examines patterns in service use by families that have or have not been affected by family violence and ongoing safety concerns. Particular attention is given to the patterns emerging in relation to FDR, legal services and courts. The discussion also considers the status of and pathways engaged in resolving parenting arrangements. Chapter 5 presents findings on parents' reports of disclosure of family violence and safety concerns, and family law system responses. Chapter 6 considers parents' evaluations of the effectiveness of the family law system, and Chapter 7 presents data relating to child and parent wellbeing, with a particular emphasis on the connection between wellbeing and family violence and safety concerns. Chapter 8 presents data relating to child support arrangements as reported by parents in both SRSP 2012 and SRSP 2014, including liability for and compliance with paying or receiving child support, together with parents' perceptions about the fairness of their child support arrangements. Chapter 9 summarises the main findings of Chapters 2 to 8.
1 s 60D(2) of the FLA provides that an adviser is: (a) a legal practitioner; or (b) a family counsellor; or (c) a family dispute resolution practitioner; or (d) a family consultant.
2 For example, parents were asked whether they agreed or disagreed with the statement: "The family law system addresses family violence". While the distribution of agree and disagree responses were similar between the two cohorts, 19% of parents in 2012 responded with "neither agree nor disagree" and 36% responded with "don't know" (a total of 55% when combined), compared with 4% of parents in 2014 responding with "neither agree nor disagree" and 46% "don't know" (50% when combined).
3 Weighting variables used were participant gender, age group, income, and child support payer type.
This chapter presents the key demographic and family composition characteristics of the parents interviewed for both SRSP 2012 and the SRSP 2014. The discussion first outlines the demographic and socio-economic characteristics of participating mothers and fathers in each cohort. This is followed by a summary of family characteristics prior to separation (e.g., duration of relationship and number of children) and after separation (relationship status, living arrangements). The final section in this chapter provides a summary of post-separation parenting arrangements and reports of participating parents regarding the quality of their family relationships (both with the focus parent and their children).
2.1 Key demographic characteristics of parents
In both the SRSP 2012 and SRSP 2014, the samples were primarily comprised of opposite-sex separating couples, with 17 fathers and 31 mothers in the 2014 cohort, and 14 mothers in the 2012 cohort reporting that they had separated from same-sex partners (data not shown).
Table 2.1 shows that the average age of participating parents was 36 years in both the 2012 and the 2014 cohorts, with the average age in the 2014 cohort being 37 years for fathers (cf. 2012: 38 years) and 34 years for mothers (cf. 2012: 35 years). Consistent with the SRSP 2012, the most common age range for separated parents in the SRSP 2014 was 35-44 years, with 38% of participating parents reporting to be in this category, although there were significantly fewer parents in this age range in 2014 compared to 2012 (40%). As noted in the SRSP 2012 final report (De Maio, Kaspiew, Smart, Dunstan, & Moore, 2013, p. 8), this contrasts with the Wave 1 LSSF cohort, where 25-34 years was the most commonly reported age range (Kaspiew et al., 2009, Table 2.1, p. 25).
| Demographic characteristics of participant | Total | Fathers | Mothers | |||
|---|---|---|---|---|---|---|
| 2012 | 2014 | 2012 | 2014 | 2012 | 2014 | |
| Notes: Data have been weighted. a Percentages may not total 100.0% due to rounding b Percentages do not sum to 100.0% as multiple responses could be selected. Statistically significant differences between 2012 and 2014 within a given population are noted: * p < .05; ** p < .01; *** p < .001. Statistically significant differences between mothers and fathers within a given population (years) are noted: † p < .05; †† p < .01; ††† p < .001. | ||||||
| Age a | ||||||
| Years | Years | Years | Years | Years | Years | |
| Mean age | 36 | 36 | 38 | 37 | 35 | 34 |
| Median age | 36 | 35 | 38 | 37 | 35 | 34 |
| SD | 8.5 | 8.5 | 8.6 | 8.6 | 8.1 | 8.1 |
| % | % | % | % | % | % | |
| 18-24 years | 10.0 | 11.8 | 7.2 | 8.7 | 12.7 ††† | 14.8 *††† |
| 25-34 years | 33.4 | 34.7 | 30.5 | 32.1 | 36.1 ††† | 37.3 ††† |
| 35-44 years | 40.2 | 37.7 ** | 40.5 | 39.1 | 40.0 | 36.3 **† |
| 45+ years | 16.4 | 15.8 | 21.8 | 20.1 | 11.2 ††† | 11.6 ††† |
| Country of birth a | ||||||
| Australia | 80.4 | 80.2 | 80.0 | 79.3 | 80.8 | 81.1 |
| Other country | 19.6 | 19.8 | 20.0 | 20.7 | 19.2 | 19.2 |
| Aboriginal and Torres Strait Islander status a | ||||||
| Aboriginal and Torres Strait Islander | 2.7 | 3.5 ** | 2.3 | 3.2 | 3.2 | 3.8 |
| Neither | 97.2 | 96.5 | 97.7 | 96.8 | 96.8 | 96.2 |
| Education a | ||||||
| Bachelor's degree or above | 22.0 | 22.1 | 20.7 | 21.1 | 23.2 † | 23.2 † |
| Other post-secondary qualification (incl. trades etc.) | 29.6 | 31.5 | 30.4 | 30.8 | 28.7 | 32.3 ** |
| Year 12 (no post-secondary qualification) | 21.5 | 20.5 | 20.3 | 19.8 | 22.6 † | 21.3 |
| Year 11 or below | 27.0 | 25.8 | 28.7 | 28.3 | 25.4 †† | 23.2 ††† |
| Employment a | ||||||
| Full-time employed | 47.0 | 46.2 | 75.8 | 73.6 | 20.1 ††† | 19.3 ††† |
| Part-time employed | 24.8 | 24.3 | 9.5 | 10.6 | 39.1 ††† | 38.7 ††† |
| Not employed | 28.2 | 29.5 | 14.7 | 15.7 | 40.8 ††† | 43.0 ††† |
| Current relationship status a | ||||||
| Re-partnered (cohabiting) | 11.0 | 9.6 * | 15.6 | 13.4 * | 6.6 ††† | 5.9 ††† |
| Re-partnered (not cohabiting) | 13.9 | 15.1 | 14.7 | 17.1 * | 13.2 | 13.1 ††† |
| Not partnered | 75.1 | 75.4 | 69.7 | 69.6 | 80.2 ††† | 81.0 ††† |
| Housing tenure a | ||||||
| Own or purchasing | 28.9 | 27.5 | 28.6 | 28.8 | 29.2 | 26.3 **† |
| Private rental | 57.6 | 57.5 | 54.6 | 53.7 | 60.4 ††† | 61.2 ††† |
| Living with family | 7.7 | 9.2 | 9.2 | 10.7 | 6.2 | 7.7 ††† |
| Paying board | 3.9 | 3.8 | 5.2 | 4.8 | 2.6 | 2.8 ††† |
| Other | 2.0 | 2.0 | 2.4 | 1.9 | 1.6 | 2.0 |
| Financial stress since separation b | ||||||
| No financial difficulties | 30.6 | 31.7 | 38.2 | 37.4 | 23.4 ††† | 26.1 *††† |
| Unable to pay bills on time | 38.7 | 36.8 * | 32.5 | 32.8 | 44.5 ††† | 40.8 **††† |
| Unable to pay car registration/insurance on time | 24.2 | 23.9 | 22.9 | 23.3 | 25.6 † | 24.5 |
| Unable to make rent/mortgage payments on time | 22.2 | 21.1 | 21.2 | 21.5 | 23.1 | 20.6 * |
| Unable to heat the home | 11.3 | 10.8 | 9.5 | 8.6 | 13.1 ††† | 12.8 ††† |
| Went without meals | 12.7 | 13.0 | 12.6 | 14.5 | 12.8 | 11.5 †† |
| Had to sell something | 26.4 | 26.8 | 26.7 | 27.3 | 26.1 | 26.4 |
| Sought financial assistance welfare/community group | 19.2 | 19.8 | 11.0 | 12.2 | 27.1 ††† | 27.4 ††† |
| Sought financial assistance from family/friends | 50.0 | 50.1 | 41.6 | 44.2 | 57.9 ††† | 56.0 ††† |
| Experienced periods of homelessness | 7.7 | 7.7 | 9.1 | 9.4 | 6.3 ††† | 6.0 ††† |
| $ | $ | $ | $ | $ | $ | |
| Annual personal income | ||||||
| Mean ($1,000s) | 52.9 | 52.2 | 67.0 | 65.9 | 39.8 ††† | 39.1 ††† |
| Median ($1,000s) | 41.6 | 40.0 | 55.0 | 55.0 | 33.8 ††† | 33.8 ††† |
| SD | 688 | 773 | 1,230 | 1,345 | 580 | 719 |
| Annual household income | ||||||
| Mean ($1,000s) | 61.4 | 57.8 ** | 79.1 | 72.9 ** | 45.9 ††† | 43.1 **††† |
| Median ($1,000s) | 45.0 | 42.8 | 65.0 | 58.0 ** | 36.4 ††† | 35.0 ††† |
| SD | 823 | 914 | 1,436 | 1,605 | 766 | 799 |
| No. of observations | 6,119 | 6,079 | 2,853 | 2,817 | 3,266 | 3,262 |
Four per cent of the 2014 parents reported that they were of Aboriginal or Torres Strait Islander background, in contrast with 3% in the 2012 cohort. This increase was statistically significant.
In relation to educational attainment, 54% of the 2014 parents reported holding a post-secondary qualification (tertiary degree or trade) (cf. 52% in SRSP 2012), with a higher proportion of mothers in the 2014 cohort reporting a non-tertiary degree post-secondary qualification than mothers participating in the SRSP 2012, with this difference also reaching a level of statistical significance.
Table 2.1 also indicates a decrease in parents' reports of full-time and part-time employment, from 72% in the 2012 cohort to 71% in the 2014 cohort, and a consequential increase in reports of unemployment. While a statistically significant higher proportion of fathers were in full-time employment than were mothers (74% cf. 19%), Table 2.1 shows that in the 2014 cohort, the decrease in mothers' reports of employment was greater than that of fathers, compared to the 2012 cohort.
Statistically significant decreases were also identified in parents' reports of cohabiting with their new partners (2012: 11% cf. 2014: 10%), with Table 2.1 showing a more pronounced decrease emerging in fathers' reports on this issue, from 16% in the 2012 cohort to 13% in the 2014 cohort.
Housing tenure was relatively similar across both the 2012 and 2014 cohorts for mothers and fathers. However, there were statistically significant differences between mothers and fathers in housing tenure for almost all categories in 2014 (but not 2012), with private rental being the most common housing arrangement (58% of all parents in 2012 and 2014; 2012 - fathers: 55% and mothers: 60% cf. 2014 - fathers: 54% and mothers: 61%). Parents' reports of owning or purchasing their home remained at less than 30% of participants in the 2014 cohort. A decrease was, however, identified in mothers' reports (2012: 29% cf. 2014: 26%). This remains substantially lower than parents in the general population, with the most recent 2011 Census data indicating that 67% of homes were owned outright or were being purchased (ABS, 2012a). A statistically significant increase in the 2014 (but not 2012) cohort was also identified in reports of parents living with family members (2012 - fathers: 9% and mothers: 6% cf. 2014 - fathers: 11% and mothers: 8%).
Table 2.1 also depicts parents' reports of financial stress since separation and indicates that a majority of parents reported experiencing such hardship. Similar to the 2012 cohort, 32% of parents in the 2014 cohort reported experiencing "no financial difficulties" since separation. While mothers' reports of having "no financial difficulties" increased between 2012 and 2014 to a statistically significant extent (2012: 23% cf. 2014: 26%), the data indicate that mothers' experiences of financial hardship across four of the nine indicators were statistically significantly higher than those of fathers in the 2014 cohort. These four indicators include the inability to pay bills; the inability to heat the home; and the need to seek financial assistance from welfare/community groups, or from family/friends. However, mothers' reports in the 2014 cohort of an inability to pay their bills on time was reduced to a statistically significant extent when compared with mothers' reports in the 2012 cohort (2012: 45% cf. 2014: 24%). Consistent with the SRSP 2012, fathers in the 2014 cohort reported statistically significant higher levels of homelessness (9%) than mothers (6%) Fathers within the 2014 cohort also reported going without meals at a statistically significantly higher rate than mothers.
In relation to reports of annual personal income, fathers in the 2014 cohort reported a statistically significantly higher mean personal income ($65,900) than mothers ($39,100), with this difference being similar to the difference seen in the SRSP 2012, which was also statistically significant. This difference was also reflected in a statistically significant difference between fathers' and mothers' reports of their mean annual household incomes. Overall, however, there was a reduction in the mean annual household income for parents in the 2014 cohort (2012: $61,400 cf. 2014: $57,800). Once again, as noted in the SRSP 2012 final report (De Maio et al., 2013, p. 8), when compared with the most recently available income data based on ABS estimates in 2009-10 (ABS, 2011), the annual household income of parents participating in the SRSP 2014 was lower than the average household income of families with dependent children (including both two-parent and one-parent families), with the latter being $113,200.
Table 2.2 presents the family-level characteristics of separated parents participating in the SRSP 2012 and the SRSP 2014. The data indicate that, consistent with the 2012 cohort, on average, parents in the 2014 cohort had been separated for 17 months at the time of interview. While the majority of parents in the 2014 cohort reported that they had been married at the time of separation (63%), this represented a statistically significant reduction in parents in the 2012 cohort who reported that they had been married (70%). There was, correspondingly, a statistically significant increase in reports of separation from couples who had been in a de facto/cohabitation relationship (2012: 29% cf. 2014: 34%). Consistent with the SRSP 2012, the majority of separated parents in the 2014 cohort reported having one or two children from their relationship.
Table 2.2 also shows that in over one-half of the separated families in both the SRSP 2012 and SRSP 2014 cohorts, the father was the parent to leave the family home at the time of separation (2012: 53% and 2014: 52%), while 40% of the mothers left the family home at separation in both cohorts. The remaining sample included 5% where both parents left the family home, and 3% where other arrangements (such as both parents living under the same roof or alternating the family home residence for the children) were made. A statistically significant increase in the reports of these other types of arrangements was seen between the 2012 and 2014 cohorts (2% cf. 3%).
| Family characteristics of participant | 2012 | 2014 |
|---|---|---|
| Notes: Data have been weighted. The "don't know" and "refused" responses for some characteristics were excluded from this analysis (less than 1% each). In cases where both parents of a focus child participated (2012: n = 539; 2014: n = 523), data from one parent were randomly selected for inclusion. a The question was only asked of parents who were married or had lived together before separating (2014: fathers, n = 2,776; mothers, n = 3,198). Percentages may not total 100.0% due to rounding. Statistically significant differences between 2012 and 2014 within a given population are noted: * p < .05; ** p < .01; *** p < .001. | ||
| Duration of separation from focus parent | ||
| Number of months (mean) | 17 | 17 |
| % | % | |
| Marital status at separation | ||
| Married | 69.5 | 63.3 *** |
| Cohabiting | 28.7 | 34.4 *** |
| Not living together | 1.8 | 2.3 |
| Number of children from union | ||
| One | 37.6 | 42.0 |
| Two | 42.3 | 40.7 |
| Three or more | 20.0 | 17.4 *** |
| Who left the house a | ||
| Mother left | 39.9 | 39.8 |
| Father left | 53.4 | 52.2 |
| Both parents left | 5.2 | 5.3 |
| Other arrangement | 1.5 | 2.7 *** |
Table 2.3 presents data on issues that participating parents reported as being pertinent prior to their separation from the focus parent. For each of the issues, a significantly higher proportion of mothers than fathers reported that the issue was relevant to their separation. More than one-third of parents in the 2012 cohort (35%) and the 2014 cohort (39%) reported mental health problems, 25% of parents in both cohorts reported difficulties associated with drug and alcohol use, and almost one-quarter (2012: 23% and 2014: 24%) indicated problems with Internet and social media use. In both cohorts, 10% reported issues with pornography while 7% indicated concerns about gambling.
| 2012 | 2014 | |||
|---|---|---|---|---|
| Total (%) | Total (%) | Fathers (%) | Mothers (%) | |
| Notes: Data have been weighted. Statistically significant differences between 2012 and 2014 within a given population are noted: * p < .05; ** p < .01; *** p < .001. Statistically significant differences between mothers and fathers within a given population (years) are noted: † p < .05; †† p < .01; ††† p < .001. | ||||
| Mental health | 35.0 | 39.2 *** | 35.0 | 43.3 ††† |
| Alcohol/drug use | 25.1 | 25.2 | 17.2 | 33.0 ††† |
| Internet/social media use | 23.3 | 24.3 | 22.3 | 26.2 ††† |
| Pornography | 9.6 | 9.5 | 4.4 | 14.4 ††† |
| Gambling | 6.6 | 6.5 | 3.6 | 9.3 ††† |
| No. of observations | 6,119 | 6,079 | 2,817 | 3,262 |
2.1.1 Key characteristics of focus children
Table 2.4 presents data relating to the age and gender of the focus children for both the SRSP 2012 and SRSP 2014. In both cohorts, the 5-11 year age group was the largest (2012: 39% cf. 2014: 38%), although the combined 0-2 years and 3-4 years age groups were also substantial (2012: 38% cf. 2014: 42%). The average age of the focus children in both the SRSP 2012 and SRSP 2014 was 7 years, and there was a relatively even distribution of boys and girls in both samples (boys - 2012: 51% and 2014: 52%; girls - 2012: 49% and 2014: 48%).
| Characteristics of focus child | 2012 | 2014 | ||
|---|---|---|---|---|
| Notes: Data have been weighted. In cases where both parents of a focus child participated (2012: n = 539; 2014: n = 523), data from one parent were randomly selected for inclusion. Percentages may not total 100.0% due to rounding. Statistically significant differences between 2012 and 2014 were not found. | ||||
| Age | Years | Years | ||
| Mean age | 7 | 7 | ||
| Median age | 6 | 6 | ||
| N | % | N | % | |
| 0-2 years | 903 | 21.1 | 1,071 | 24.0 |
| 3-4 years | 837 | 17.3 | 869 | 17.7 |
| 5-11 years | 2,223 | 38.6 | 2,184 | 37.7 |
| 12-14 years | 741 | 11.0 | 674 | 10.1 |
| 15-17 years | 876 | 12.0 | 758 | 10.6 |
| Gender | ||||
| Boys | 2,880 | 51.2 | 2,859 | 51.9 |
| Girls | 2,700 | 48.8 | 2,697 | 48.1 |
| No. of observations | 5,580 | 100.0 | 5,556 | 100.0 |
2.2 Relationship dynamics and parenting arrangements
This section examines the dynamics of parents' relationships before/during and since separation. It also considers post-separation parenting arrangements relating to both the division of care time and decision-making about the children.
2.2.1 Experience of family violence
By way of context, Table 2.5 presents a comparison between parents' reports of family violence before/during separation from the LSSF Wave 1, SRSP 2012 and SRSP 2014. The data show similar experiences in all three samples of parents, with around 1 in 5 parents reporting physical hurt by their former partner (LSSF: 21%; SRSP 2012 & 2014: 20%), and almost 2 in 5 parents experiencing emotional abuse alone (LSSF: 38%; SRSP 2012: 39%; SRSP 2014: 38%). Parents' reports of experiencing family violence and safety concerns are considered in detail in Chapter 3. In relation to each category of family violence, mothers' reports were higher than those of fathers in all three cohorts.
| LSSF Wave 1 (%) | SRSP 2012 (%) | SRSP 2014 (%) | |||||||
|---|---|---|---|---|---|---|---|---|---|
| Fathers | Mothers | Total | Fathers | Mothers | Total | Fathers | Mothers | Total | |
| Notes: Data have been weighted. a Physical hurt includes those who experienced both physical hurt and emotional abuse, given that the majority of parents who experienced physical violence also experienced emotional abuse. For the purposes of comparability between the SRSP and LSSF, experiences of "unwanted sexual activity" have been excluded from the analysis, as this was not asked in LSSF Wave 1. Percentages may not total 100.0% due to rounding. Statistically significant differences between mothers and fathers for each type of violence (SRSP only) are noted: † p < .05; †† p < .01; ††† p < .001. | |||||||||
| Physical hurt a | 16.5 | 25.7 | 21.1 | 15.7 | 23.5 ††† | 19.8 | 16.0 | 22.7 ††† | 19.6 |
| Emotional abuse alone | 36.4 | 39.1 | 37.7 | 40.5 | 37.3 † | 38.9 | 39.7 | 36.9 † | 38.3 |
| No family violence reported | 47.1 | 35.3 | 41.2 | 43.8 | 39.2 ††† | 41.4 | 44.3 | 40.4 †† | 42.4 |
| No. of observations | 4,983 | 5,019 | 10,002 | 2,853 | 3,266 | 6,119 | 2,817 | 3,262 | 6,079 |
2.2.2 Quality of inter-parental relationship
During their interview, participating parents nominated one of five terms describing the quality of their relationship with the focus parent. Two descriptors were clearly positive ("friendly" and "cooperative"), a third descriptor was ambiguous ("distant"), and the final two were clearly negative ("lots of conflict" and "fearful"). Figure 2.1 shows that differences between the positive responses of mothers in fathers in both the 2012 and 2014 cohorts were minimal. A majority of mothers and fathers in both cohorts reported that their relationship was "friendly" or "cooperative" (2012: 62% and 2014: 61%), with a statistically significant decrease in the proportion of mothers who reported having a "cooperative" relationship from 2012 to 2014 (32% cf. 29%). These response rates are consistent with those of LSSF Wave 1 parents, among whom 62-63% reported that their relationship with the focus parent was either "friendly" or "cooperative" (Kaspiew et al., 2009, Table 2.7). However, a statistically significantly higher proportion of mothers than fathers in both SRSP cohorts described their relationship as "fearful" (mothers - 6% in both cohorts cf. fathers - 2012: 3% and 2014: 4%), with more fathers (2012: 22% and 2014: 21%) than mothers (19% in both cohorts) describing their relationship as "distant", the difference being statistically significant in 2012. There was also a statistically significant increase from 2012 to 2014 in fathers reporting a relationship with "lots of conflict" (12% cf. 14%).
Figure 2.1: Quality of inter-parental relationship, by parent gender, 2012 and 2014
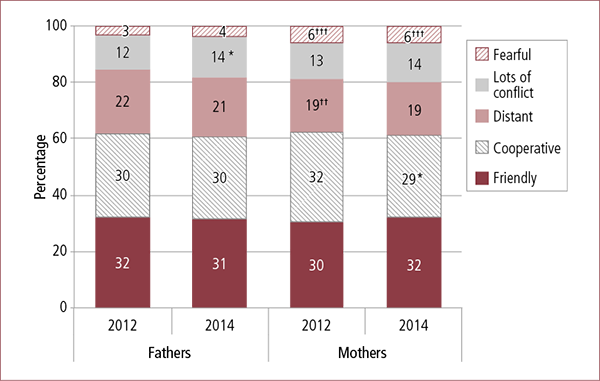
Notes: Data have been weighted. No. of observations: fathers, n = 2,795; mothers, n = 3,208; total:, n = 6,003. The "don't know" and "refused" responses were excluded from this analysis (< 2%). Percentages may not total 100.0% due to rounding. Statistically significant differences between 2012 and 2014 within a given population are noted: * p < .05; ** p < .01; *** p < .001. Statistically significant differences between mothers and fathers within a given population (years) are noted: † p < .05; †† p < .01; ††† p < .001.
Figure 2.2 indicates that most parents reported either communicating with the focus parent about their child several times per week (fathers - 29% in both cohorts; mothers - 2012: 26% and 2014: 25%) or on at least one occasion per week (fathers - 2012: 28% and 2014: 27%; mothers - 2012: 26% and 2014: 24%). While 12% of parents in the 2012 cohort and 14% of parents in the 2014 cohort reported that this communication occurred daily, similar proportions reported that they communicated less than once a year with the focus parent (fathers - 2012: 12% and 2014: 13%; mothers - 15% in both cohorts). The increases in daily communication for fathers and mothers from 2012 to 2014 were statistically significant.
Figure 2.2: Frequency of inter-parental communication, by parent gender, 2012 and 2014

Notes: Data have been weighted. Percentages may not total 100.0% due to rounding. Statistically significant differences between 2012 and 2014 within a given population are noted: * p < .05; ** p < .01; *** p < .001. Statistically significant differences between mothers and fathers within a given population (years) are noted: † p < .05; †† p < .01; ††† p < .001.
2.2.3 Parenting time
Parents in the SRSP 2012 and SRSP 2014 were asked about the parenting arrangements for the focus child that were current at the time of the interview. Parenting care-time arrangements were calculated on the basis of the proportion of nights the non-resident parent spent with the focus child per year.4 Figure 2.3 indicates that consistent response patterns emerged between the 2012 and 2014 cohorts in relation to a number of the parenting arrangement classifications. These data indicate that the care-time arrangement where the child stays the majority of nights (66-99%) with the mother ("mother majority") remained the most commonly reported parenting arrangement (2012: 50%; 2014: 46%), although such arrangements were reported at a statistically significant reduced rate in the 2014 cohort. Of note, 20% of the focus children in the 2012 cohort and 21% in the 2014 cohorts were reported to be in shared care-time arrangements (spending 35-65% of nights per year with each parent), which, as indicated in the SRSP 2012 final report (De Maio et al., 2013, p. 14) is higher than that reported by parents in the LSSF Wave 1 (16%). The average age of children in the SRSP samples was older than that of the children in the LSSF Wave 1, which may go some way towards explaining the higher rate of shared care-time arrangements in the SRSP cohorts. Consistent responses also emerged in the 2012 and 2014 cohorts regarding reports of "father majority" care-time arrangements (3%) (where the children spent 66-99% of nights with the father), and in relation to children spending 100% of nights with their father and only saw their mother in the daytime or not at all (2%). A statistically significant difference was, however, identified in relation to reports of arrangements where children spent 100% of nights with the mother in the 2014 cohort, which increased to 28%, from 25% in 2012.
Figure 2.3: Care-time arrangements for focus child, 2012 and 2014
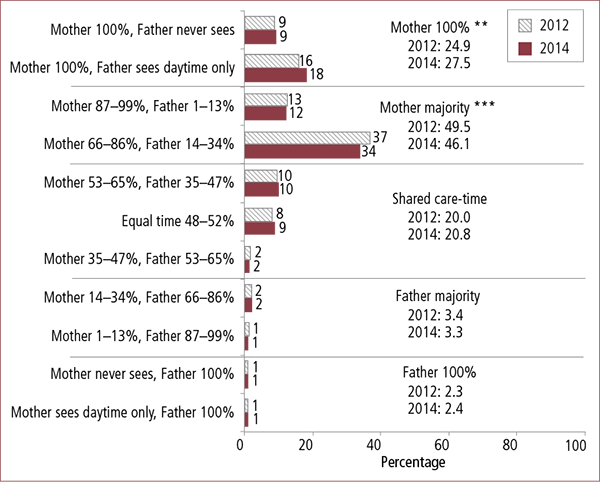
Notes: Data have been weighted. No. of observations: 2012, n = 5,404; 2014, n = 5,305. In cases where both parents of a focus child participated (2012: n = 539; 2014: n = 523), data from one parent were randomly selected for inclusion. Percentages may not total 100.0% due to rounding. Statistically significant differences between 2012 and 2014 within a given population are noted: * p < .05; ** p < .01; *** p < .001.
2.2.4 Distance between houses
Parents in both the SRSP 2012 and SRSP 2014 were asked to nominate the estimated distance (or driving time) between their house and the focus parent's house. Figure 2.4 shows that almost 3 in 5 parents (58-59%) in both cohorts indicated that they lived less than 20 kilometres (or less than 30 minutes) from the focus parent, with a further 18% of parents in both cohorts reporting that they lived between 20 and 49 kilometres (or 30-59 minutes) from the focus parent.
Figure 2.4: Distance/time between parents' houses, 2012 and 2014
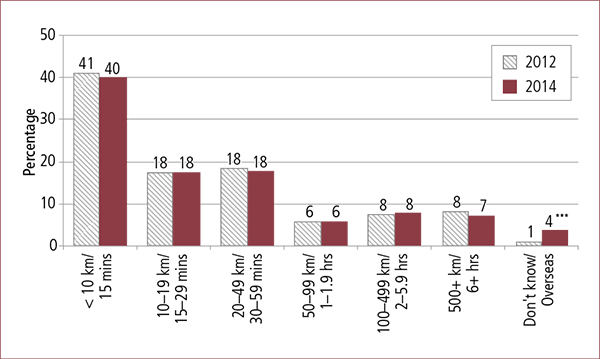
Notes: Data have been weighted. No. of observations: 2012, n = 5,489.; 2014, n = 5,552. In cases where both parents of a focus child participated (2012: n = 539; 2014: n = 523), data from one parent were randomly selected for inclusion. Percentages may not total 100.0% due to rounding. Statistically significant differences between 2012 and 2014 within a given population are noted: * p < .05; ** p < .01; *** p < .001.
Figure 2.5 presents more specific analysis of distances between parents' houses by care-time arrangements. The data indicate that 56% of parents in the 2014 cohort who reported that they had shared care-time arrangements in place for their child lived within 10 kilometres or 15 minutes of the focus parent, compared with 60% in the 2012 cohort. Similar to the SRSP 2012, where the child spent most nights with the mother in the 2014 cohort, more than half of the parents reported that they lived 19 kilometres or less (or 29 minutes or less travel time) from the focus parent (2012: 56% cf. 2014: 55%). Consistent with the SRSP 2012, distance once again appeared to be a factor for parents in the 2014 cohort who reported that their child never saw the focus parent, with more than one in four such parents in both cohorts reporting that the focus parent lived 500 kilometres or more (or six hours or more) away (child never saw the father - 27% in both cohorts; child never saw the mother - 2012: 26% and 2014: 30%). However, there was a statistically significant increase in the proportion of care-time arrangements where the participant lived within 10 kilometres or 15 minutes of the focus parent and the child never saw the mother (2012: 18% cf. 2014: 34%), and where the father cared for the child 66-99% of the time (2012: 31% cf. 2014: 42%), though due to the small sample sizes of these groups, data should be interpreted with caution.
Figure 2.5: Distance/time between houses, by care-time arrangements, 2012 and 2014
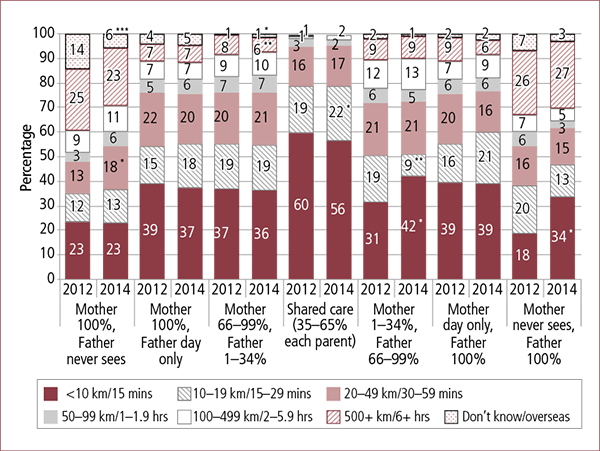
Notes: Data have been weighted. No. of observations: 2012, n = 5,489.; 2014, n = 5,552. In cases where both parents of a focus child participated (2012: n = 539; 2014: n = 523), data from one parent were randomly selected for inclusion. Results for 2012 may differ from what was presented in previous reports due a difference in the random selection of parents at the time of the analysis for the 2012 report. Percentages may not total 100.0% due to rounding. Statistically significant differences between 2012 and 2014 within a given population are noted: * p < .05; ** p < .01; *** p < .001.
2.2.5 Changeover arrangements
Figure 2.6 indicates that the most commonly reported changeover arrangement where the focus child spent some care-time at night with each parent was for the changeover point to be at the focus child's home (2012: 60%; 2014: 59%). The focus child's school or child care venue was the next most common changeover location (2012: 17%; 2014: 19%), with a meeting point between the parents' homes or other public locations nominated by fewer still parents. Three per cent of parents in each cohort reported that the focus child made their own way between the homes, while up to 1% of participating parents in both cohorts nominated more formal changeover locations, such as a police station or children's contact centre.
Figure 2.6: Changeover arrangements for focus child, 2012 and 2014
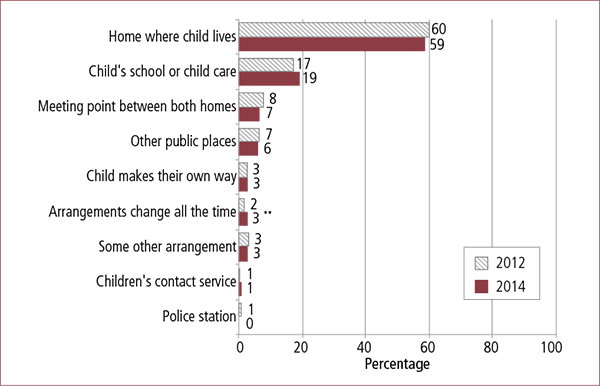
Notes: Data have been weighted. No. of observations: 2012, n = 5,574.; 2014, n = 5,507. In cases where both parents of a focus child participated (2012: n = 539; 2014: n = 523), data from one parent were randomly selected for inclusion. Percentages may not total 100.0% due to rounding. Statistically significant differences between 2012 and 2014 were not found.
2.2.6 Supervision of arrangements
Table 2.6 shows that changeover arrangements were supervised for just over 1 in 10 children in both cohorts (2012: 12%; 2014: 13%). Where changeover was supervised, this was most often by a relative of either parent (2012: 52%; 2014: 51%) or by someone else (such as a friend or teacher). In 6% of supervised cases, this occurred at a formal supervision service.
| 2012 (%) | 2014 (%) | |
|---|---|---|
| Notes: Data have been weighted. In cases where both parents of a focus child participated (2012: n = 539; 2014: n = 523), data from one parent were randomly selected for inclusion. The "don't know" and "refused" responses have been excluded from this analysis (2%). Percentages do not total 100.0% due to rounding. Statistically significant differences between 2012 and 2014 were not found. | ||
| Changeover not supervised | 87.8 | 86.9 |
| Changeover supervised | 12.2 | 13.1 |
| By a relative | 52.1 | 51.4 |
| By someone else | 40.5 | 41.1 |
| By a formal supervision service | 5.6 | 5.8 |
| No. of observations | 4,631 | 4,462 |
In cases where the one parent only spent time with the child during the day (i.e., no overnight stays), parents were asked whether there was someone else present when the child spent time with this parent and if this was a condition of the parenting arrangements ("supervised time"). Table 2.7 shows that in 2014, 1 in 10 cases where the child saw a parent in the daytime only were supervised (cf. 13% in 2012). While the vast majority of parents reported that supervised time was overseen by a relative or other informal person, 23% of parents in 2014 reported that this supervised time took place at a formal supervision service (cf. 21% in 2012).
| 2012 (%) | 2014 (%) | |
|---|---|---|
| Notes: Data have been weighted. In cases where both parents of a focus child participated (2012: n = 539; 2014: n = 523), data from one parent were randomly selected for inclusion. The "don't know" and "refused" responses have been excluded from this analysis (1%). Percentages do not total 100.0% due to rounding. Statistically significant differences between 2012 and 2014 were not found. | ||
| Daytime visits unsupervised | 87.4 | 90.2 |
| Daytime visits supervised | 12.6 | 9.8 |
| By a relative | 42.1 | 41.0 |
| By someone else | 37.0 | 36.5 |
| By a formal supervision service | 20.9 | 22.5 |
| No. of observations | 881 | 940 |
2.2.7 Decision-making for focus child
The SRSP 2012 and 2014 asked parents to report on who was mostly involved in decision-making about the following issues in the focus child's life:
- education (where the focus child was aged 4 years and above);
- health care;
- religious or cultural ties; and
- sporting or social activities.
Table 2.8 presents an overview of parents' reports about decision-making about the focus child. Consistent with the responses provided by the 2012 cohort, these data indicate that in relation to each of the nominated issues, a majority of parents in the 2014 cohort reported that decisions were mainly made by the mother or by both parents equally, with only a small minority of parents reporting that the father was the main decision-maker. Of note, a higher proportion of mothers than fathers reported themselves as being the main decision-maker, while a higher proportion of fathers reported that both parents shared the decision-making (data not shown). As noted in the SRSP 2012 final report (De Maio et al., 2013, p. 18), this response pattern is consistent with the findings from the LSSF Wave 1 (Kaspiew et al., 2009, Table 8.1).
| Area of child's life | 2012 (%) | 2014 (%) |
|---|---|---|
| Notes: Data have been weighted. No. of observations: education - 2012: n = 3,391, 2014: n = 3,400; health - 2012: n = 4,874, 2014: n = 4,811; religious/cultural ties - 2012: n = 4,525, 2014: n = 4,499; sporting/social activities - 2012: n = 4,762, 2014: n = 4,730. In cases where both parents of a focus child participated (2012: n = 539; 2014: n = 523), data from one parent were randomly selected for inclusion. The "other" category consists of the responses "whichever parent is with the child at the time", "someone else" and "focus child makes the decision". Observations for each item have been excluded where the response was "don't know" or the parent did not respond to the question: education - "don't know" < 1%, no response = 2%; health care - "don't know" & no response < 1%; sporting and social activities - "don't know" = 3%, no response = 0.2%; religion and cultural ties - "don't know" = 7%, no response = 1%. Religion and cultural ties "don't know"/non-response is consistent with the rates in LSSF Wave 1 (10% "don't know" and 1% did not respond) and is likely to be due to parents not feeling it was relevant (e.g., no religion). Percentages may not total 100.0% due to rounding. Statistically significant differences between 2012 and 2014 within a given population are noted: * p < .05; ** p < .01; *** p < .001. | ||
| Education (children 4+ years only) | ||
| Mainly mother | 52.1 | 51.4 |
| Mainly father | 5.6 | 5.8 |
| Both parents equally | 40.5 | 41.1 |
| Other | 1.8 | 1.7 |
| Health care | ||
| Mainly mother | 62.4 | 60.3 * |
| Mainly father | 6.1 | 5.9 |
| Both parents equally | 26.9 | 30.0 ** |
| Other | 4.6 | 3.8 |
| Religion or cultural ties | ||
| Mainly mother | 42.4 | 42.7 |
| Mainly father | 7.0 | 6.1* |
| Both parents equally | 45.0 | 44.9 |
| Other | 5.6 | 6.3 |
| Sporting or social activities | ||
| Mainly mother | 50.8 | 50.4 |
| Mainly father | 7.2 | 7.8 |
| Both parents equally | 34.7 | 34.9 |
| Other | 7.3 | 6.8 |
| Total | 100.0 | 100.0 |
Overall, Table 2.8 shows that more than one-third of parents (41%) in both cohorts reported that shared decision-making occurred with respect to the focus child's education, and just less than one-third of parents in the 2014 cohort (30%) reported shared decision-making about health care (significantly higher than in 2012: 27%). Almost one-half of the parents (45%) in both cohorts reported shared decision-making in relation to religion or cultural ties, and just over one-third (35%) of parents reported shared decision-making about sporting or social activities.
The data presented in Figure 2.7 suggest that the age of the focus child is a key factor in the way in which parents exercise decision-making responsibility. In relation to both the SRSP 2012 and SRSP 2014, parents reported that for focus children aged up to 4 years, mothers were most often reported as the main decision-maker in each area, save for decisions about religious or cultural ties for children aged between 3 and 4 years of age, which were reported as being more commonly made by both parents equally. Figure 2.7 also shows that in relation to children aged between 5 and 17 years of age in both cohorts, mothers continued to be the main decision-maker with respect to education and health care. While mothers were also the most substantially nominated main decision-maker in relation to religious/cultural ties or sporting/social activities, the response option "other" (which included the focus child as the decision-maker) was nominated in greater proportions as the age of the focus child increased. In relation to sporting and social activities for children aged between 15 and 17 years, the response option of "other" was nominated by 19% of parents in the 2012 cohort and 17% of parents in the 2014 cohort. Similarly, in relation to religious and cultural ties for children aged between 15 and 17 years, the response option of "other" was nominated by 16% of parents in the 2012 cohort and 15% of parents in the 2014 cohort. These response rates contrast with those arising in relation to children's education and health care, where the response option of "other" was nominated by between 2% and 3% of participating parents of 15-17 year olds.
Figure 2.7: Parental decision-making, by focus child age, 2012 and 2014

Notes: Data have been weighted. No. of observations: education - 2012: n = 3,391, 2014: n = 3,400; health - 2012: n = 4,874, 2014: n = 4,811; religious/cultural ties - 2012: n = 4,525, 2014: n = 4,499; sporting/social activities - 2012: n = 4,762, 2014: n = 4,730. In cases where both parents of a focus child participated (2012: n = 539; 2014: n = 523), data from one parent were randomly selected for inclusion. Total number of observations varies due to exclusion of "don't know" or "refused" responses. The "other" category consists of the responses "whichever parent is with the child at the time", "someone else" or "focus child makes the decision". Percentages may not total 100.0% due to rounding. Statistically significant differences between 2012 and 2014 within a given population are noted: * p < .05; ** p < .01; *** p < .001.
2.3 Summary
The discussion in this chapter outlined demographic and socio-economic characteristics of participating mothers and fathers in both the 2012 and 2014 SRSP cohorts, and included an analysis of family characteristics prior to separation (e.g., duration of relationship and number of children) and after separation (relationship status, living arrangements).
2.3.1 Family characteristics
The average age of participating parents was 36 years in both cohorts, with a majority of parents holding a post-secondary qualification. Differences between mothers and fathers were again most evident in the 2014 cohort in relation to reports of full-time employment (74% of fathers and 19% of mothers), albeit that there was a decrease in fathers' reports of employment that was greater than that of mothers. Housing tenure remained relatively similar between mothers and fathers, and between fathers across both the 2012 and 2014 cohorts, with private rental being the most common housing arrangement. Just over one-quarter of parents reported owning or purchasing their home, although there was a decrease in mothers' reports between the two surveys (2012: 29% cf. 2014: 26%). An increase was also identified in the reports of parents living with family members (2012 - fathers: 9% and mothers: 6%; 2014 - fathers: 11% and mothers: 8%). Consistent with the 2012 cohort, a majority of parents in the 2014 cohort reported experiencing financial stress since separation. More than one-third of parents in the 2012 cohort (35%) and the 2014 cohort (39%) reported that mental health problems were present in their relationship prior to separation, and one-quarter of parents in both cohorts reported difficulties associated with drug and alcohol use prior to separation.
Although a majority of parents in the 2014 cohort (63%) reported that they were married to the focus parent prior to separation, this represented a reduction in the proportion of such reports compared to the 2012 cohort (70%), and there was an increase in reports of cohabitation (2014: 34% cf. 2012: 29%). Consistent with the SRSP 2012, the majority of separated parents in the 2014 cohort reported having one or two children from their relationship, and the average age of the focus child in both the 2012 and the 2014 cohort was seven years of age.
2.3.2 Family relationships and parenting arrangements
A majority of parents participating in both the 2012 and 2014 cohorts reported that their relationship with the focus parent was "friendly" or "cooperative". While differences between the positive responses of mothers in fathers in both the 2012 and 2014 cohorts were minimal, a higher proportion of mothers than fathers in both SRSP cohorts described their relationship as "fearful" (mothers - 6% in both cohorts cf. fathers - 2012: 3% and 2014: 4%), with more fathers (2012: 22% and 2014: 21%) than mothers (19% in both cohorts) describing their relationship as "distant".
The analysis in this chapter indicates that mother majority care-time arrangements remained the most commonly reported parenting arrangement (2012: 50%; 2014: 46%), although such arrangements were reported at a statistically significant reduced rate in the 2014 cohort. Of note, 20% of focus children in 2012 and 21% in 2014 were reported to be in shared care-time arrangements, a proportion higher than that reported by parents in the LSSF Wave 1 (16%). The average age of children in the SRSP samples was older than that of the children in the LSSF Wave 1, which may provide some explanation for the higher rate of shared care-time arrangements in the SRSP cohorts.
Parents' reports of the exercise of decision-making responsibility in four key areas (education, health care, religious/cultural ties and sporting/social activities) illustrated differences in the views of mothers and fathers in the 2014 cohort regarding who was responsible for these decisions. These varying perceptions broadly reflected the response patterns identified in the 2012 cohort. Generally, however, the data indicate that the age of the focus child was a key factor in the way in which parents exercised decision-making responsibility, with shared decision-making increasing with the age of the focus child.
Footnote
4 Note that for both the SRSP 2012 and SRSP 2014 the "care time" calculations discussed in this section exclude the small proportion of participants who reported living "under the same roof" as the focus parent at the time of the interview.
This chapter explores participating parents' experiences of family violence and concerns about safety both before/during and since their separation from the focus parent, with the discussion of these findings based on comparisons between the 2012 and 2014 survey cohorts. The chapter begins by considering parents' reports of their experiences of emotional abuse, examining both the nature and frequency of this abuse. The findings relating to parents' experiences of physical violence is then explored, focusing on both the frequency of experiencing physical hurt and the types of injuries inflicted. Findings relating to both the occurrence and coexistence of these various forms of family violence are also considered, followed by an examination of the effects of family violence on participants' day-to-day activities. Parents' reports of their children witnessing physical violence and emotional abuse, and of their current concerns for their own safety and/or that of their children as a result of ongoing contact with the focus parent are then examined. The focus then turns to data obtained from new questions included in the 2014 survey, based on the amended definition of family violence in FLA s 4AB that were introduced by the 2012 family violence reforms, which specifically look at reports of focus parent behaviour that coerced or controlled the participating parent or caused them to be fearful. The chapter concludes with an examination of the care-time arrangements protection orders made in circumstances characterised by family violence or safety concerns. Note that in this chapter, 2012 data by gender are not always shown in the figures and tables, but may be mentioned in the text. In each case, complete data are available in the SRSP 2012 final report (De Maio et al., 2013).
3.1 Parents' experiences of emotional abuse
Parents participating in both the 2012 and 2014 surveys were asked whether they had experienced emotional abuse inflicted by the focus parent at any time before/during or since separation. Emotional abuse in these survey questions was specified as involving behaviour on the part of the focus parent where they had:
- tried to prevent the participant from knowing about or accessing family money, contacting family or friends or using the car or telephone;5
- threatened to harm the participant, their child/children, themselves, other family members/friends or pets (including causing actual harm to pets);
- damaged or destroyed property;
- insulted the participant with the intent to shame, belittle or humiliate;
- tried to force the participant into any unwanted sexual activity;
- monitored the participant's whereabouts; and/or
- circulated defamatory comments about the participant with the intent to shame, belittle or humiliate them (including through social media).
- These emotional abuse items are consistent with those asked in LSSF Wave 1, save for the item on unwanted sexual activity, intended to capture experiences of sexual violence, which was first introduced in the SRSP 2012. "Sexual violence" is defined in the ABS Personal Safety Survey as "involving any incidents of sexual assault and/or sexual threat" (ABS, 2012b). The importance of including this item in the survey questions relating to family violence and safety concerns was highlighted in the SRSP 2012 final report (De Maio et al., 2013, p. 23), as it allows the capture of a broader range of experiences arising from sexual violence; that is, beyond experiences of sexual assault.
3.1.1 Experience of emotional abuse before/during and since separation
Figure 3.1 depicts the experience of emotional abuse inflicted by the focus parent at any time before/during separation for those parents participating in the 2012 or 2014 surveys. Comparison of these data show that both mothers' and fathers' reports of experiencing at least one type of emotional abuse are consistent between the 2012 and 2014 cohorts, with a higher proportion of mothers (2012: 68%; 2014: 67%) than fathers (2012: 58% and 2014: 57%) indicating that they had experienced some form of emotional abuse in the SRSP 2012. Figure 3.1 also shows that this response pattern is reflected in parents' responses in both cohorts to each of the more specific emotional abuse items and that once again, a significantly higher proportion of mothers reported experiencing each nominated form of emotional abuse when compared with fathers, save for reports of the focus parent trying to prevent contact with family or friends (23% for both mothers and fathers in SRSP 2012 and SRSP 2014). Particularly marked differences of 10 percentage points or more are again evident with respect to attempts to force any unwanted sexual activity, and damaging or destroying property.
Figure 3.1: Parental experience of emotional abuse inflicted by focus parent before/during separation, by parent gender, 2012 and 2014
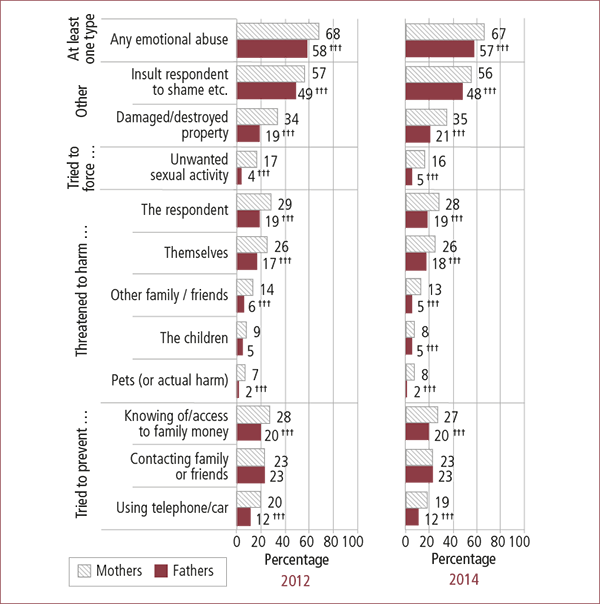
Notes: Data have been weighted. Parents were asked: "At any time before or during the separation, did <focus parent> ever: [forms of emotional abuse]". The "don't know" and "refused" responses were excluded from this analysis (< 2% for each item). Percentages do not sum to 100.0% as multiple responses could be chosen. Statistically significant differences between 2012 and 2014 were not found. Statistically significant differences between mothers and fathers within a given population (years) are noted: † p < .05; †† p < .01; ††† p < .001.
In relation to parents' post-separation experiences of emotional abuse inflicted by the focus parent, Figure 3.2 indicates lower proportions of affirmative responses than for comparable emotional abuse items in the pre-separation context. There were generally consistent response rates between the 2012 and 2014 cohorts, with marginally lower proportions of the SRSP 2014 parents reporting experiences of some of the types of emotional abuse since separation. Overall, 61% of mothers and 55% of fathers in the 2014 cohort reported that they had experienced at least one type of emotional abuse since separation, compared to 63% of mothers and 56% of fathers in the 2012 cohort. More specifically, mothers' reports of the focus parents' threats to harm them, their child/children and other family members or friends were lower in 2014 than in 2012, though a small but statistically significant increase between cohorts emerged in fathers' reports of threats of harm made against them (2012: 11% cf. 2014: 13%). In addition, 50% of mothers and 44% of fathers in the 2014 cohort reported that the focus parent had insulted them with the intent to shame, belittle or humiliate, compared with 53% of mothers and 47% of fathers in the 2012 cohort, with these decreases being small but statistically significant.
Figure 3.2: Parental experience of emotional abuse inflicted by focus parent since separation, by parent gender, 2012 and 2014
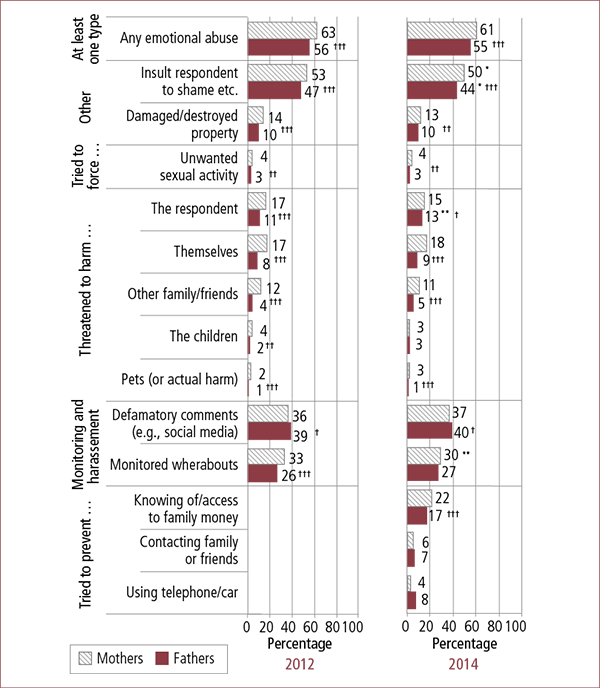
Notes: Data have been weighted. Parents were asked: "At any time since the separation, has <focus parent> ever: [forms of emotional abuse]". In 2012, the "tried to prevent" questions were only asked of parents who were living under the same roof at the time of interview. In 2014, these questions were asked of all participating parents. The "don't know" and "refused" responses were excluded from this analysis (< 6% for each item). Percentages do not sum to 100.0% as multiple responses could be chosen. Statistically significant differences between 2012 and 2014 within a given population are noted: * p < .05; ** p < .01; *** p < .001. Statistically significant differences between mothers and fathers within a given population (years) are noted: † p < .05; †† p < .01; ††† p < .001.
The "tried to prevent" response set was omitted from the SRSP 2012 questions relating to the post-separation period for all parents except those who were still living under the same roof as the focus parent at the time of interview, but were asked of all parents participating in the SRSP 2014. Figure 3.2 shows that SRSP 2014 mothers reported that the focus parent had tried to prevent their knowledge of or access to family money in higher proportions than participating fathers (mothers: 22% cf. fathers: 17%). In relation to participants' reports of having their whereabouts monitored and defamatory comments circulated about them, consistent with the SRSP 2012, the latter item was the item for which affirmative responses by fathers significantly exceeded those for mothers in the SRSP 2014 (40% cf. 37%). Mothers' reports of having their whereabouts monitored decreased to 30% in the 2014 cohort, from 33% in the 2012 cohort, with this decrease reaching a level of statistical significance.
Consistent gender differences emerged in both cohorts, with significantly higher proportions of mothers than fathers reporting that since the separation, the focus parent had made threats to harm them, their family/friends and pets, as well as making threats of self-harm. Further to this, significantly more mothers than fathers reported the focus parent had prevented their access to family money; damaged or destroyed property; insulted them with the intent to shame, belittle or humiliate; monitored their whereabouts; and/or tried to force them into unwanted sexual activity. Conversely, more fathers than mothers reported that the focus parent had circulated defamatory comments about them since the separation.
As noted at the outset (section 1.2.6), the family violence measures applied in the SRSP provide limited insight into the subjective construction of the experiences reported by parents in this study. Research undertaken by Dale Bagshaw and colleagues (2010) also identified gendered differences in parents' reports of their experiences of family violence. Their analysis of participants' descriptions of family violence indicated that women's accounts tended to reflect physical, sexual, emotional, financial and social abuse. By contrast, male participants reported that the family violence perpetrated against them by women included "withholding child contact and inducing the children to have a poor view of them" (p. 75), women's relationship to the family law courts and DHS-Child Support, gambling, drinking or telling lies.
Figures 3.1 and 3.2 show that for both the 2012 and 2014 cohorts, the most commonly reported type of emotional abuse in either time frame examined (before/during and since separation) was humiliating insults, with around half the sample reporting an experience of this type (2012 - fathers: 47-49% and mothers: 53-57%; 2014 - fathers: 44-48% and mothers: 50-56%), though mothers' and fathers' reports decreased to a statistically significant extent in the 2014 cohort. The next most commonly reported emotional abuse experienced before/during separation was the focus parent damaging or destroying property (2012 - fathers: 19% and mothers: 34%; 2014 - fathers: 21% and mothers: 35%), though this behaviour was less often reported in the post-separation context (2012 - fathers: 10% and mothers: 14%; 2014 - fathers: 10% and mothers: 13%).
While reported rates of threats to harm before/during separation were substantially higher than reports of threats to harm since separation for both the 2012 and 2014 cohorts, similar proportions of mothers and fathers in both cohorts reported that the focus parent had made threats to harm other family members or friends before/during separation (2012 - fathers: 6% and mothers: 14%; 2014 - fathers 5% and mothers: 13%) and since separation (2012 - fathers: 4% and mothers: 12%; 2014 - fathers 5% and mothers: 11%).
3.1.2 Frequency of experiencing emotional abuse before/during separation
Parents who reported that they had experienced one or more of the emotional abuse items before/during separation were asked to indicate the frequency of this abuse in the 12-month period before separation or during the separation. The response options for these frequency questions were "often", "sometimes", "rarely (but more than once)", "once only", "never" "don't know" and "refused".
Figure 3.3 presents the "often" or "sometimes" responses provided by parents in relation to the frequency of each emotional abuse item for both the SRSP 2012 and SRSP 2014 before/during separation. These data highlight the differences in how frequently each emotional abuse type was experienced by participating parents in the 2012 and 2014 cohorts, as well as differences in the patterns of responses between fathers and mothers in these cohorts.
Figure 3.3: Frequency of parental experience of emotional abuse inflicted by focus parent in the 12 months before/during separation, by parent gender, 2012 and 2014
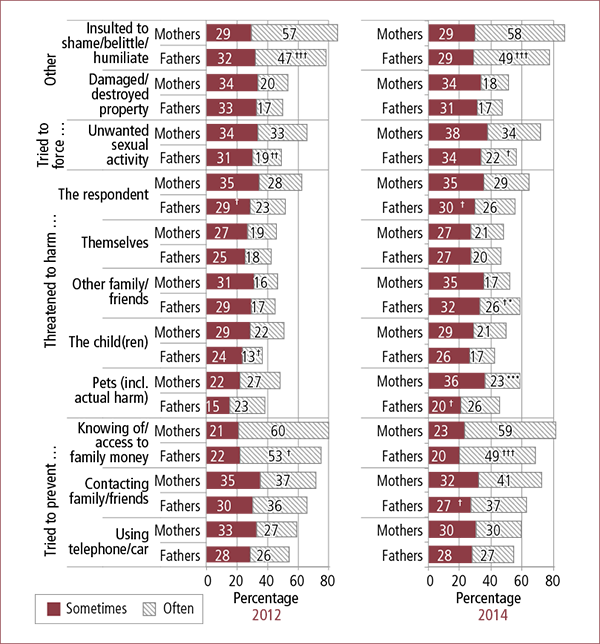
Notes: Data have been weighted. Results are presented for parents who reported experiencing emotional abuse "sometimes" or "often", as a percentage of participating parents reporting emotional abuse. Parents who reported specific emotional abuse at any time before or during separation were asked: "And how often (if ever), in the 12 months before separation or during the separation, did <focus parent>: [forms of emotional abuse]". The "don't know" and "refused" responses were excluded from this analysis (< 3% for each item). Percentages do not sum to 100.0% as multiple responses could be chosen. Statistically significant differences between 2012 and 2014 within a given population are noted: * p < .05; ** p < .01; *** p < .001. Statistically significant differences between mothers and fathers within a given population (years) are noted: † p < .05; †† p < .01; ††† p < .001.
While the most commonly nominated type of emotional abuse - humiliating insults - remained stable in its reported frequency of "often" or "sometimes" (2012 - fathers: 79% and mothers: 86%; 2014 - fathers 78% and mothers: 87%), the "sometimes" or "often" responses for a number of other emotional abuse items in the SRSP 2014 reflected an increase of 5 percentage points or more when compared with the 2012 cohort. For example, reports regarding the frequency of attempts on the part of the focus parent to force any unwanted sexual activity were higher in the 2014 SRSP by 5 and 6 percentage points for mothers and fathers respectively. There were also increases in mothers' and fathers reports' of the frequency of threats to harm other family members or friends (by 5 and 12 percentage points respectively) and pets (by 10 and 8 percentage points, with mothers' reports in this regard increasing by a statistically significant extent in 2014), and in fathers' reports of threats by the focus parent to harm their child/children (6 percentage points).
The largest discrepancy between mothers' and fathers' frequency reports related to attempts to prevent knowledge of and access to money, with 82% of mothers in the 2014 cohort reporting that the focus parent "sometimes" or "often" engaged in this behaviour, compared to 69% of fathers in this cohort.
In spite of these differences, Figure 3.3 shows that consistent with the response pattern that emerged in the SRSP 2012 data, parents in the 2014 cohort reported emotional abuse that involved attempts to prevent contact with family/friends, and knowledge of or access to family money more frequently than emotional abuse that involved threats to harm or damaging or destroying property. The figure also shows that of the parents who reported experiencing emotional abuse, more mothers than fathers reported that the focus parent sometimes or often threatened to harm them before/during separation (64% cf. 56% respectively) and threatened to harm their child/children (50% cf. 43%).
3.1.3 Frequency of experiencing emotional abuse since separation
Figure 3.4 shows the frequency responses of parents who reported experiencing emotional abuse at any time since separation in both the 2012 and 2014 cohorts. Participating parents were asked how often, on average, the focus parent had engaged in the listed emotional abuse items since separation, with the response options once again being "often", "sometimes", "rarely (but more than once)", "once only", "never" "don't know" and "refused".
Figure 3.4: Frequency of parental experience of emotional abuse inflicted by focus parent since separation, by parent gender, 2012 and 2014
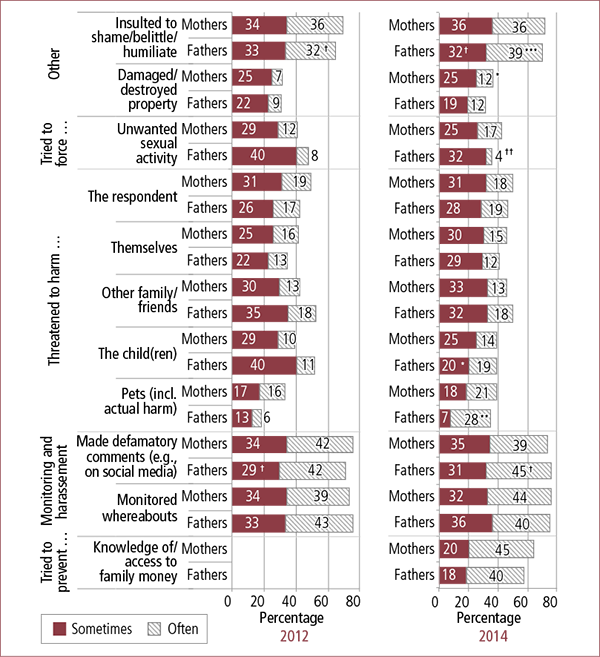
Notes: Data have been weighted. Results are presented for parents who reported experiencing emotional abuse "sometimes" or "often", as a percentage of participating parents reporting emotional abuse. Data not shown where sample sizes for care-time categories were smaller than 50 responses. Parents who reported experiencing specific forms of emotional abuse since separation were asked: "And how often, on average, (since the separation) has <focus parent>: [forms of emotional abuse]". In 2012, the "control" questions (whether tried to prevent access to money, contact with family/friends and use of telephone/car) were only asked of parents who were living under the same roof at the time of interview. In 2014, these questions were asked of all participating parents. Percentages do not sum to 100.0% as multiple responses could be selected. Statistically significant differences between 2012 and 2014 within a given population are noted: * p < .05; ** p < .01; *** p < .001. Statistically significant differences between mothers and fathers within a given population (years) are noted: † p < .05; †† p < .01; ††† p < .001.
Similar patterns in the reported post-separation experience of most emotional abuse items were evident in both the 2012 and 2014 cohorts, with fewer parents generally reporting that they had "often" experienced the nominated emotional abuse items since separation, compared to before/during separation. In both the 2012 and 2014 cohorts, some types of emotional abuse were reported more frequently in the post-separation context, with 73-76% of the fathers and mothers who reported that the focus parent monitored their whereabouts indicating that this occurred "often" or "sometimes", and 71-76% of fathers and 74-76% of mothers reporting this frequency for the focus parent subjecting them to defamatory comments through social media reporting.
Compared to the 2012 cohort, in the 2014 cohort, decreases of 10 percentage points or more were observed in mothers' reports of the frequency of the following behaviour by the focus parent since, as opposed to before/during, separation:
- "often" attempted to prevent their knowledge of or access to family money (2012: 59% cf. 2014: 45%).
- "often" insulted them with the intent to shame, belittle or humiliate (2012: 58% cf. 2014: 36%).
- "often" (2012: 34% cf. 2014: 17%) or "sometimes" (2012: 38% cf. 2014: 25%) attempted to force them into any unwanted sexual activity.
- "often" threatened to harm them (2012: 29% cf. 2014: 18%) and
- "sometimes" threatened to harm their pets (2012: 36% cf. 2014: 18%).
Significantly more fathers in the 2014 cohort than in the 2012 cohort reported that since separation, the focus parent "often" made threats to harm pets (2014: 28% cf. 2012: 6%) or insulted them (2014: 39% cf. 2012: 32%). Significantly more mothers in 2014 than in 2012 reported that the focus parent "often" damaged or destroyed property (2014: 12% cf. 2012: 7%).
In 2014, more fathers than mothers reported that since separation, the focus parent "often" made defamatory comments about them (fathers: 45% cf. mothers: 39%), while more mothers than fathers reported the focus parent tried to force them into unwanted sexual activity (mothers: 17% cf. fathers: 4%).
3.1.4 Interaction between incidence and frequency of emotional abuse
The discussion in this section further analyses parents' reported experiences of emotional abuse via a scale that is a combined measure of the incidence and frequency of emotional abuse. As outlined in the SRSP 2012 final report (De Maio et al., 2013), this scale seeks to "develop understanding of the nature of the continuum encompassed in experiences of emotional abuse … supporting the development of a description of the intensity of parents' experiences based on the number and frequency of emotionally abusive behaviours reported" (p. 28).
As indicated earlier in section 3.1, parents were initially asked if they had experienced one or more of a list of emotional abuse items at any time before/during separation, and how often in the 12 months before/during separation they had experienced them. As indicated in the SRSP 2012 final report (De Maio et al., 2013, p. 28), for each participant a score of 0-5 was assigned to the frequency response options for each of the 11 emotional abuse items: 0 = emotional abuse item was not experienced; 1 = item was experienced but not in the 12 months before separation; 2 = item was experienced once only; 3 = item was rarely experienced; 4 = item was sometimes experienced; and 5 = item was often experienced. The 11 resulting scores were then summed to provide a total score ranging from 0 to 55 for each participant. A 0 score indicates that none of the emotional abuse items were experienced before/during separation, with the maximum score of 55 indicating that a parent reported that each of the 11 emotional abuse items was experienced often. As there were 13 rather than 11 emotional abuse items nominated in the survey questions examining emotional abuse experienced since separation, a modified scoring approach was employed for this deeper analysis of the incidence and frequency of emotional abuse since separation, with the maximum possible score determined to be 65.6
The analysis in Figure 3.5 of the frequency of emotional abuse before/during separation (based on 5,713 responses providing complete data for each item) reflects consistent experiences for the 2012 and 2014 cohorts. While between 16% and 19% of the parents' reports of experiencing emotional abuse before/during separation suggested low intensity - that is, a total score between 1 and 5 (2012 - fathers: 19% and mothers: 17%; 2014 - fathers: 19% and mothers: 16%) - a not insubstantial proportion of parents' reports (and significantly more mothers than fathers) resulted in a total score of between 21 and 55, which reflects very frequent experience of at least five emotional abuse items (2012 - fathers: 8% and mothers 19%; 2014 - fathers: 9% and mothers: 17%).
Figure 3.5: Total frequency of parental experience of emotional abuse score before/during separation, by parent gender, 2012 and 2014
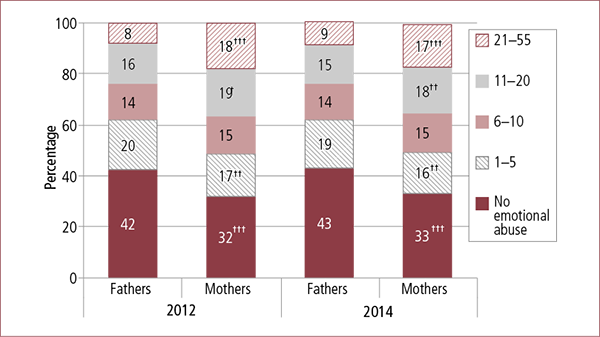
Notes: Data have been weighted. Percentages may not total 100.0% due to rounding. Statistically significant differences between 2012 and 2014 were not found. Statistically significant differences between mothers and fathers within a given population (years) are noted: † p < .05; †† p < .01; ††† p < .001.
Figure 3.6 depicts a similar pattern in the reported experiences of parents since separation in the 2012 and 2014 cohorts, although lower proportions of parents in both cohorts reported very frequent experience of at least five emotional abuse items (a score of 21-55) since separation (2012 - fathers: 4% and mothers: 9%; 2014 - fathers: 7% and mothers: 10%). There were small but statistically significant increases between 2012 and 2014 in fathers' and mothers' reports of very frequent abuse. Gender differences were present in both cohorts, with significantly more fathers than mothers reporting no emotional abuse (2012: 45% of fathers and 38% of mothers; 2014: 46% of fathers and 39% of mothers).
Figure 3.6: Total frequency of parental experience of emotional abuse score since separation, by parent gender, 2012 and 2014
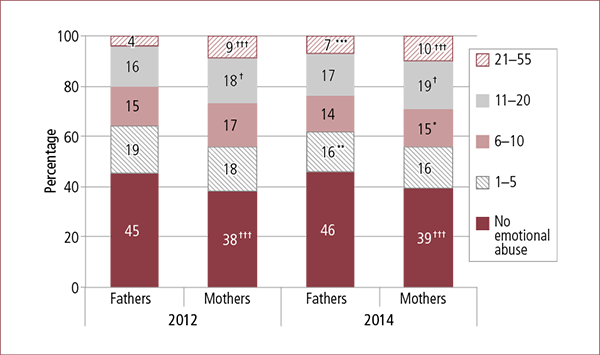
Notes: Data have been weighted. Percentages may not total 100.0% due to rounding. Statistically significant differences between 2012 and 2014 within a given population are noted: * p < .05; ** p < .01; *** p < .001. Statistically significant differences between mothers and fathers within a given population (years) are noted: † p < .05; †† p < .01; ††† p < .001.
3.2 Parents' experiences of physical hurt
3.2.1 Reports of physical hurt
Participating parents were asked whether they were physically hurt by the focus parent in any way before they separated or since the separation. Figure 3.7 shows that a substantial minority of participants in 2012 and 2014 cohorts reported experiencing physical hurt from the focus parent before/during separation, with significantly more mothers than fathers reporting this in both cohorts (16% of fathers and 23-24% of mothers).
Reports by fathers and mothers of physical hurt since separation were substantially lower than the pre-separation reports in both the 2012 and 2014 cohorts, with only 5% of fathers and 6% of mothers reporting this experience.
Parents in the SRSP 2012 and SRSP 2014 who reported that they had experienced physical hurt before or since separation were also asked to indicate the frequency of family violence by the focus parent in each time period. The response options for these frequency questions were "often", "sometimes", "rarely (but more than once)", "once only", "never" "don't know/can't say" and "refused".
Figure 3.7: Parental experience of physical hurt inflicted by focus parent before and since separation, by parent gender, 2012 and 2014
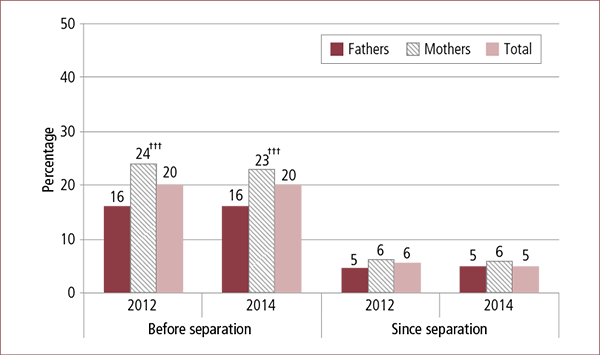
Notes: Data have been weighted. Parents were asked: "Before you separated, were you ever physically hurt by <focus parent> in any way?"; and "And since the separation, have you ever been physically hurt by <focus parent> in any way?" The "don't know" and "refused" responses were excluded from the analysis (< 2% for each item). Statistically significant differences between 2012 and 2014 were not found. Statistically significant differences between mothers and fathers within a given population (years) are noted: † p < .05; †† p < .01; ††† p < .001.
Figure 3.8 shows parents' reports of the frequency with which they experienced physical hurt before and since separation. In relation to the before separation period, a higher proportion of mothers than fathers in both the 2012 and 2014 cohorts reported that they had been hurt "often" (2012 - mothers: 12% cf. fathers: 8%, see De Maio et al., 2012, Table 3.1; 2014 - mothers: 14% cf. fathers: 10%), and a lower proportion said they had been hurt rarely but on more than one occasion (2012 - mothers: 35% cf. fathers: 42%, see De Maio et al., 2012, Table 3.1; 2014 - mothers: 33% cf. fathers: 38%). Consistent with the pattern that emerged regarding the reported incidence of physical hurt in Figure 3.7, the reported frequency of physical hurt for both mothers and fathers since separation declined substantially. Mothers reported a greater incidence of physical hurt before and since separation and a greater frequency before separation when compared with fathers.
Figure 3.8: Frequency of parental experience of physical hurt inflicted by focus parent in the 12 months before and since separation, by parent gender, 2012 and 2014
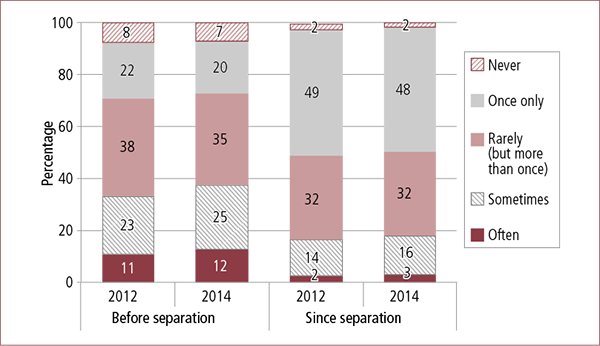
Notes: Data have been weighted. No. of observations: before separation - 2012: total n = 1,253; 2014: total n = 1,241; since separation - 2012: total n = 340; 2014: total n = 319. Parents who had reported experiencing family violence before separating were asked: "How often were you physically hurt by <focus parent> in the 12 months before you separated?" Parents who reported experiencing family violence since separation were asked: "How often have you been physically hurt by <focus parent> since separation?" The "don't know" and "refused" responses were excluded from this analysis (< 1%). Percentages may not total 100.0% due to rounding. Statistically significant differences between 2012 and 2014 were not found. Statistically significant differences between mothers and fathers within a given population (years) are noted: † p < .05; †† p < .01; ††† p < .001.
3.2.2 Effects of physical hurt
Table 3.1 presents the effects of physical hurt before and since separation, as reported by participants in the SRSP 2012 and SRSP 2014. Where parents reported that they had been physically hurt by the focus parent "often", "sometimes", "rarely (but more than once)", "once only", they were asked whether they had as a result experienced one or more injuries from seven categories of injury.
Table 3.1 shows that bruises or scratches were the most commonly reported category of injury in both cohorts, with 73-79% of all parents in the 2012 cohort and 77% of all parents in the 2014 cohort who experienced physical hurt reporting that they had received bruises or scratches before and since separation. An increased proportion of the 2014 cohort (2012: 17% cf. 2014: 19%) reported that this physical hurt did not result in any of the listed categories of injury before separation (2014 - mothers: 18% and fathers: 20% cf. 2012 - mothers: 16% and fathers: 19%), with markedly higher proportions of mothers and fathers in both the 2012 and 2014 cohorts (85%) reporting that they had not suffered any of the injuries specified since separation. Nevertheless, substantial proportions of parents in both cohorts who experienced physical hurt before separation reported that they had suffered two or more injuries as a result (2012 - fathers: 31% and mothers: 26%; 2014 - fathers: 26% and mothers: 27%).
While Table 3.1 shows that the responses of the 2014 cohort reflect a higher proportion of affirmative responses than the 2012 cohort in relation to the "other injury" category in the before separation time period, the responses of the 2014 cohort with respect to this post-separation time period reflect a higher proportion of affirmative responses to the "bruises or scratches" (2012: 73% cf. 2014: 77%) and "fractured or broken bones" (2012: 2% cf. 2014: 5%).
Gender differences emerged between the types of injuries experienced, with more fathers than mothers in 2014 reporting having experienced cuts (other than stab wounds) before/during separation (fathers: 24% cf. mothers: 14%) and a higher proportion of mothers than fathers reporting other types of injuries both before/during and since separation (e.g., 2014 - mothers: 16% cf. fathers: 7%). When considering these data, it is important to note that the SRSP surveys do not collect data on whether these reported injuries arose in a defensive or aggressive context.
| Type of injury | Before separation (%) | Since separation (%) | ||||||
|---|---|---|---|---|---|---|---|---|
| 2012 | 2014 | 2012 | 2014 | |||||
| Total | Total | Fathers | Mothers | Total | Total | Fathers | Mothers | |
| Notes: Data have been weighted. Parents who reported experiencing physical hurt before separation were asked: "In the 12 months before you separated, did you ever experience any of the following injuries as a result of <focus parent>'s behaviour: [types of injury]". Parents who reported experiencing physical hurt since separation were asked: "(Since the separation), have you ever experienced any of the following injuries as a result of <focus parent>'s behaviour: [types of injury]". a This item only asked of female participants. Data for fathers and mothers in 2012 are not shown - see De Maio et al. (2013), pp. 31-32. Percentages in top panel do not sum to 100.0% as multiple responses could be chosen. Percentages in bottom panel may not total 100.0% due to rounding. Statistically significant differences between 2012 and 2014 were not found. Statistically significant differences between mothers and fathers in 2014 are noted: † p < .05; †† p < .01; ††† p < .001. | ||||||||
| Bruises or scratches | 79.2 | 76.8 | 75.8 | 77.6 | 73.2 | 76.6 | 71.8 | 80.3 |
| Cuts (other than stab wounds) | 19.1 | 17.8 | 23.5 | 14.0 ††† | 18.4 | 16.0 | 21.1 | 12.0 |
| Fractured or broken bones | 3.6 | 3.0 | 1.9 | 3.8 | 1.5 | 4.7 | 3.2 | 5.8 |
| Gunshot/stab wounds or burns | 2.7 | 2.2 | 1.7 | 2.5 | 0.9 | 1.4 | 0.4 | 2.2 |
| Broken teeth | 0.7 | 1.2 | 1.0 | 1.4 | 0.4 | 0.4 | - | 0.6 |
| Other injury | 10.0 | 12.5 | 9.1 | 14.9 †† | 10.0 | 11.9 | 7.3 | 15.5 † |
| Miscarriage a | - | - | - | 3.2 | - | - | - | 1.9 |
| No. of observations | 1,253 | 1,138 | 431 | 707 | 340 | 311 | 129 | 182 |
| Of those reporting physical hurt: | ||||||||
| None of these injuries resulted | 17.2 | 18.8 | 19.5 | 18.3 | 84.5 | 85.1 | 85.0 | 85.2 |
| One of these injuries resulted | 54.9 | 54.8 | 54.5 | 55.1 | 11.3 | 10.3 | 11.0 | 9.8 |
| Two or more of these injuries resulted | 28.0 | 26.4 | 26.0 | 26.6 | 4.2 | 4.6 | 4.0 | 5.0 |
| Total | 100.0 | 100.0 | 100.0 | 100.0 | 100.0 | 100.0 | 100.0 | 100.0 |
3.3 Experiences of physical violence and emotional abuse
The discussion so far in this chapter has highlighted largely consistent response patterns in relation to the incidence and frequency of emotional abuse and physical hurt between the 2012 and 2014 cohorts. Some differences have nevertheless been identified with respect to the frequency of some of the less commonly nominated emotional abuse items and in relation to the effects of physical hurt.
The discussion in this section consolidates this analysis of participating parents' reports of emotional abuse and physical hurt by analysing the extent to which parents' reported experiencing emotional abuse, attempts to force unwanted sexual activity, and physical hurt. Tables 3.2 and 3.3 present the response patterns where parents reported experiencing none, one, two or all three of these forms of domestic and family violence on the part of the focus parent, before/during and since separation respectively.
In relation to parents' reports of experiencing all three violent/abusive behaviours before/during separation, Table 3.2 shows that reports across the total sample of participating parents remained stable between the SRSP 2012 and SRSP 2014, though the experience of these three behaviours was reported by 3% of the 2014 sample of fathers, as opposed to 2% of the 2012 sample. A higher proportion of fathers reported that they had not experienced emotional abuse, physical hurt or unwanted sexual activity before/during separation in both the 2012 (41%) and 2014 (42%) cohorts, compared with mothers' reported experiences (2012: 31%; 2014: 32%).
| Experience of violent/abusive behaviours | 2012 (%) | 2014 (%) | ||||
|---|---|---|---|---|---|---|
| Total | Fathers | Mothers | Total | Fathers | Mothers | |
| Notes: Data have been weighted. Percentages may not total 100.0% due to rounding. Statistically significant differences between 2012 and 2014 were not found. Statistically significant differences between mothers and fathers within a given population (years) are noted: † p < .05; †† p < .01; ††† p < .001. | ||||||
| Physical hurt and … | ||||||
| emotional abuse and attempted unwanted sexual activity | 5.0 | 1.8 | 8.0 ††† | 5.3 | 2.6 | 8.0 ††† |
| attempted unwanted sexual activity and no emotional abuse | 0.0 | 0.0 | 0.1 | 0.0 | 0.0 | 0.0 |
| emotional abuse and no attempted unwanted sexual activity | 14.2 | 13.4 | 14.9 | 13.3 | 12.6 | 14.0 |
| no emotional abuse and no attempted unwanted sexual activity | 0.6 | 0.5 | 0.6 | 0.7 | 0.8 | 0.7 |
| Subtotal | 19.8 | 15.7 | 23.5 | 19.4 | 16.0 | 22.7 |
| No physical hurt and … | ||||||
| emotional abuse and attempted unwanted sexual activity | 5.1 | 2.4 | 7.6 ††† | 5.2 | 2.4 | 8.0 ††† |
| attempted unwanted sexual activity and no emotional abuse | 0.4 | 0.1 | 0.6 ††† | 0.1 | 0.2 | 0.1 |
| emotional abuse and no attempted unwanted sexual activity | 38.9 | 40.5 | 37.3 † | 38.3 | 39.7 | 36.9 † |
| no emotional abuse and no attempted unwanted sexual activity | 36.0 | 41.3 | 31.0 ††† | 37.0 | 41.7 | 32.4 ††† |
| Subtotal | 80.3 | 84.3 | 76.5 | 80.6 | 84.0 | 77.4 |
| No. of observations | 6,119 | 2,853 | 3,266 | 6,079 | 2,817 | 3,262 |
Consistent with parents' experiences before/during separation, Table 3.3 shows that significantly more mothers than fathers in 2014 reported having experienced family violence that included physical hurt, emotional abuse and unwanted sexual activity since separation, though the numbers are far smaller than was reportedly experienced before/during separation. Examining family violence experienced since separation that did not involve physical hurt, significantly more mothers than fathers in both cohorts experienced emotional abuse and unwanted sexual activity (2012 & 2014 - mothers: 3% cf. fathers: 2%) and emotional abuse alone (2012 - mothers: 54% cf. fathers: 50%; 2014 - mothers: 52% cf. fathers: 48%).
| Experience of violent/abusive behaviours | 2012 (%) | 2014 (%) | ||||
|---|---|---|---|---|---|---|
| Total | Fathers | Mothers | Total | Fathers | Mothers | |
| Notes: Data have been weighted. Percentages may not total 100.0% due to rounding. Statistically significant differences between 2012 and 2014 were not found. Statistically significant differences between mothers and fathers within a given population (years) are noted: † p < .05; †† p < .01; ††† p < .001. | ||||||
| Physical hurt and … | ||||||
| emotional abuse and attempted unwanted sexual activity | 1.0 | 0.7 | 1.2 | 0.8 | 0.4 | 1.2 †† |
| attempted unwanted sexual activity and no emotional abuse | 0.0 | 0.0 | 0.0 | 0.0 | 0.0 | 0.0 |
| emotional abuse and no attempted unwanted sexual activity | 4.3 | 3.7 | 5.0 † | 4.3 | 4.1 | 4.5 |
| no emotional abuse and no attempted unwanted sexual activity | 0.2 | 0.3 | 0.1 | 0.2 | 0.2 | 0.2 |
| Subtotal | 5.5 | 4.7 | 6.3 | 5.3 | 4.7 | 5.9 |
| No physical hurt and … | ||||||
| emotional abuse and attempted unwanted sexual activity | 2.2 | 1.8 | 2.6 † | 2.7 | 2.2 | 3.1 † |
| attempted unwanted sexual activity and no emotional abuse | 0.1 | 0.1 | 0.2 | 0.1 | 0.1 | 0.1 |
| emotional abuse and no attempted unwanted sexual activity | 51.6 | 49.5 | 53.5 †† | 50.3 | 48.3 | 52.3 †† |
| no emotional abuse and no attempted unwanted sexual activity | 40.6 | 43.9 | 37.4 ††† | 41.6 | 44.7 | 38.6 ††† |
| Subtotal | 94.5 | 95.3 | 93.7 | 94.7 | 95.3 | 94.1 |
| No. of observations | 6,119 | 2,853 | 3,266 | 6,079 | 2,817 | 3,262 |
Together, Tables 3.2 and 3.3 show that the most frequently reported experiences for participating parents involved the experience of emotional abuse without physical hurt or attempted unwanted sexual activity, with 39% and 38% of the 2012 and 2014 samples respectively reporting this combination of experiences before/during separation, and 52% and 50% respectively since separation.
3.4 Categories of family violence
Following the approach taken to the analysis of the SRSP 2012 (De Maio et al., 2013, p. 34),7 family violence from this point in the report is analysed in terms of the following three categories:
- physical violence - comprised of physical hurt and/or attempted unwanted sexual activity, with or without the presence of the ten non-sexual emotional abuse categories;
- emotional abuse alone - comprised of one or more of the non-sexual emotional abuse items, but in the absence of physical hurt or unwanted sexual activity; or
- no violence - no emotional abuse, no unwanted sexual activity and no physical hurt.
As with the SRSP 2012, "trying to force unwanted sexual activity" is once again categorised with physical hurt, in acknowledgement of the physical component involved in attempting to force unwanted sexual activity upon a person.
Table 3.4 shows that equal proportions of parents in the 2012 and 2014 cohorts reported that they had experienced physical violence before/during separation (25%), with more mothers (before/during separation: 31%; since separation: 9%) than fathers (before/during separation: 19%; since separation: 7%) in the 2014 cohort reporting this form of family violence. Parents' reports of emotional abuse alone since separation were recorded in greater proportions in both cohorts (2014: 50%; 2012: 52%) compared to before/during separation, as were their reports of experiencing no violence. Fathers' reports of no violence both before/during and since separation were consistently higher than mothers' reports in each cohort (before/during separation - fathers: 2012: 42% and 2014: 42%, mothers: 2012: 31% and 2014: 32%; since separation - fathers: 2012: 44% and 2014: 45%, mothers: 2012: 37% and 2014: 39%).
| Type of family violence | Before/during separation (%) | Since separation (%) | ||||||
|---|---|---|---|---|---|---|---|---|
| 2012 | 2014 | 2012 | 2014 | |||||
| Total | Total | Fathers | Mothers | Total | Total | Fathers | Mothers | |
| Note: Data have been weighted. Emotional abuse since separation includes two additional items: "monitored your whereabouts" and "circulated defamatory comments about you". Data for fathers and mothers in 2012 are not shown - see De Maio et al. (2013), pp. 33-34. Percentages may not total 100.0% due to rounding. Statistically significant differences between 2012 and 2014 were not found. Statistically significant differences between mothers and fathers within a given population (years) are noted: † p < .05; †† p < .01; ††† p < .001. | ||||||||
| Physical violence | 25.2 | 24.7 | 18.6 | 30.7 ††† | 7.9 | 8.0 | 7.0 | 9.1 †† |
| Emotional abuse alone | 38.9 | 38.3 | 39.7 | 36.9 † | 51.6 | 50.3 | 48.3 | 52.3 †† |
| No violence | 36.0 | 37.0 | 41.7 | 32.4 ††† | 40.6 | 41.6 | 44.7 | 38.6 ††† |
| No. of observations | 6,119 | 6,079 | 2,817 | 3,262 | 6,119 | 6,079 | 2,817 | 3,262 |
3.5 Effects of family violence on day-to-day activities
The SRSP 2012 and SRSP 2014 explored the effects of family violence on parents' day-to-day activities. When parents responded that the focus parent's violent/abusive behaviours before/during or since separation had affected their day-to-day activities, they were also asked about the nature of this effect.8
Among those who reported experiencing physical violence and/or emotional abuse, 82% (mothers: 82% and fathers: 83%) reported that the focus parent's behaviour had affected their day-to-day activities before/during separation, and 63% (mothers: 60%, and fathers: 66%) reported effects post-separation (data not shown).
Tables 3.5 and 3.6 present findings about the nature of the reported effects. Table 3.5 shows that similar response patterns emerged in the SRSP 2012 and SRSP 2014 with respect to reports of taking time off work or changing work or study arrangements as a result of the physical violence or emotional abuse experienced before/during separation, though a slightly smaller proportion of 2014 participants reported that this was an effect (2012: 27%; 2014: 26%). While fathers' reports were higher than mothers' reports in both the 2012 and 2014 cohorts (which may reflect fathers' greater participation in employment, as described in Chapter 2), a higher proportion of mothers than fathers in both cohorts reported experiencing each of the other nominated effects before/during separation.
| Effects on day-to-day activities | 2012 (%) | 2014 (%) | ||||
|---|---|---|---|---|---|---|
| Total | Fathers | Mothers | Total | Fathers | Mothers | |
| Notes: Data have been weighted. a Given that analysis is based on labour force status at the time of interview, some participants' employment may have changed since family violence took place. Parents who reported that the focus parent's behaviour before/during separation affected their day-to-day activities were asked: "(And) what impact did <focus parent>'s behaviour before/during the separation have on your day-to-day activities?: [list of day-to-day activities]". In 2012, only every tenth participant who answered that the focus parent's behaviour had an effect was asked about the nature of these effects. In 2014, every participant who answered that the focus parent's behaviour had an effect was asked about the nature of these effects. Percentages do not sum to 100.0% as multiple responses could be selected. Statistically significant differences between 2012 and 2014 within a given population are noted: * p < .05; ** p < .01; *** p < .001. Statistically significant differences between mothers and fathers within a given population (years) are noted: † p < .05; †† p < .01; ††† p < .001. | ||||||
| Took time off work/changed work or study arrangements | 27.2 | 37.6 | 19.7 ††† | 25.6 | 35.1 | 17.5 ††† |
| Currently work full-time | 57.8 | 76.5 | 32.5 | 21.4 | 9.1 | 29.5 †† |
| Currently work part-time | 16.9 | 5.9 | 31.8 | 7.6 | 4.4 | 42.5 † |
| Currently study full-/part-time | 5.4 | 3.9 | 7.4 | 12.5 | 11.0 | 13.0 ††† |
| Not currently working/studying a | 19.9 | 13.7 | 28.4 | 58.5 | 75.5 | 15.0 ††† |
| Mental health affected (e.g., increased depression, anxiety or stress) | 51.8 | 47.0 | 55.3 | 65.7 *** | 64.8 *** | 66.4 ** |
| Felt less confident, less secure or intimidated | 32.8 | 22.8 | 40.0 †† | 28.9 | 19.6 | 36.8 ††† |
| Changed social activities (e.g., didn't want to leave the house or see friends) | 29.4 | 21.4 | 35.0 † | 25.2 | 19.1 | 30.5 ††† |
| Eating or sleeping habits affected | 15.8 | 14.4 | 16.8 | 13.5 | 12.8 | 14.2 |
| Other relationships affected | 15.4 | 15.0 | 15.7 | 12.4 | 10.8 | 13.9 † |
| Changed household tasks | 7.6 | 4.9 | 9.6 | 7.2 | 4.9 | 9.1 ††† |
| Other effects | 14.0 | 15.5 | 12.9 | 14.6 | 12.6 | 16.2 †† |
| No. of observations | 323 | 128 | 195 | 3,320 | 1,429 | 1,891 |
The data shown in Table 3.5 indicate a statistically significant increase in both mothers' and fathers' reported experiences of mental health effects (including increased depression, anxiety or stress) arising from the focus parent's violent/abusive conduct before/during separation between the 2012 and 2014 cohorts (52% cf. 66% respectively). A comparison between 2012 and 2014 for the other listed effects of family violence before/during separation showed no significant changes.
Other areas where changes between cohorts were evident to a statistically significant extent emerged in participants' reports of the effects on day-to-day activities of experiencing emotional abuse or physical violence since separation. The data in Table 3.6 indicate a statistically significant increase in parents' reported experiences of mental health effects arising from the focus parent's violent/abusive conduct since separation between the 2012 and 2014 cohorts (2012: 52% cf. 2014: 60%). Mothers' reports of making changes to their social activities as a result of the focus parent's violent or abusive conduct reduced by a statistically significant amount (2012: 35% cf. 2014: 24%), while fathers' reports that the focus parent's conduct affected their other relationships increased between the cohorts (2012: 8% cf. 2014: 17%).
| Effects on day-to-day activities | 2012 (%) | 2014 (%) | ||||
|---|---|---|---|---|---|---|
| Total | Fathers | Mothers | Total | Fathers | Mothers | |
| Notes: Data have been weighted. Parents who reported that the focus parent's behaviour since separation affected their day-to-day activities were asked: "(And) What impact has <focus parent>'s behaviour since the separation had on your day-to-day activities?: [list of day-to-day activities]". In 2012, only every tenth participant who answered that the focus parent's behaviour had an effect was asked about the nature of these effects. In 2014, every participant who answered that the focus parent's behaviour had an effect was asked about the nature of these effects. Percentages do not sum to 100.0% as multiple responses could be selected. Statistically significant differences between 2012 and 2014 within a given population are noted: * p < .05; ** p < .01; *** p < .001. Statistically significant differences between mothers and fathers within a given population (years) are noted: † p < .05; †† p < .01; ††† p < .001. | ||||||
| Took time off work/changed work or study arrangements | 25.0 | 32.5 | 20.6 | 23.9 | 29.5 | 18.2 ††† |
| Work full-time | 24.3 | 17.8 | 30.4 | 11.4 | 10.3 | 13.1 |
| Work part-time | 48.8 | 69.8 | 29.0 | 59.0 | 76.4 | 30.5 |
| Study full-/part-time | 25.2 | 12.4 | 37.2 | 22.6 | 10.0 | 43.3 |
| Study full-/part-time | 1.7 | 0.0 | 3.4 | 7.0 | 3.3 | 13.1 * ††† |
| Mental health affected (e.g., increased depression, anxiety or stress) | 52.4 | 51.0 | 53.2 | 59.8 * | 59.0 | 60.7 |
| Felt less confident, less secure or intimidated | 29.9 | 20.6 | 35.3 † | 28.3 | 19.6 | 37.0 ††† |
| Changed social activities (e.g., didn't want to leave the house or see friends) | 28.6 | 18.0 | 34.9 † | 19.0 ** | 14.6 | 23.5 **††† |
| Eating or sleeping habits affected | 12.4 | 12.2 | 8.1 | 9.1 | 8.4 | 9.8 |
| Other relationships affected | 9.6 | 8.0 | 15.0 | 15.1 | 16.7 * | 13.4 † |
| Changed household tasks | 4.7 | 4.6 | 4.7 | 4.9 | 4.4 | 5.4 |
| Other effects | 20.8 | 22.3 | 19.9 | 20.7 | 21.7 | 19.7 |
| No. of observations | 323 | 128 | 195 | 3,320 | 1,429 | 1,891 |
Figure 3.9 shows the number of reported effects on day-to-day activities arising as a result of the violent and/or abusive conduct of the focus parent, and Figure 3.10 shows the average number by type of reported effects. Figure 3.9 shows somewhat differing response patterns between the 2012 and 2014 cohorts, with participants' reports of either one effect or two or more effects arising from violent or abusive conduct before/during separation being more divergent in 2014 (46-51%) than they were in the 2012 (48-49% of mothers and fathers) (data not shown). A comparison of the total sample of participating parents suggests that the number of reported effects since separation remained unchanged between the SRSP 2012 and SRSP 2014. However, there was a rise in fathers' reports of experiencing two or more effects, from 38% in 2012 (data not shown) to 45% in 2014. Nevertheless, overall, a significantly greater proportion of mothers in 2014 reported that they experienced two or more effects than fathers.
Figure 3.9: Number of reported effects of family violence before/during and since separation on parent's day-to-day activities, by parent gender, 2012 and 2014
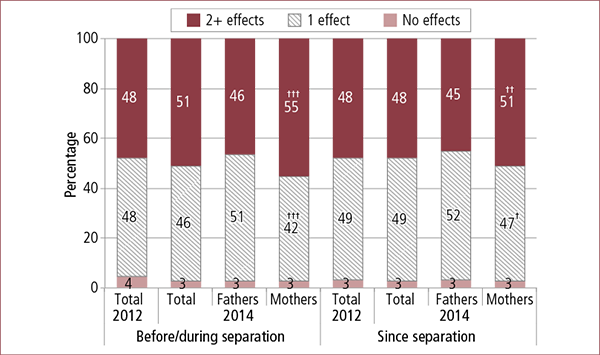
Notes: Data have been weighted. In 2012, only every tenth participant who answered that the focus parent's behaviour had an effect was asked about the nature of these effects. In 2014, every participant who answered that the focus parent's behaviour had an effect was asked about the nature of these effects. Percentages may not sum to 100.0% due to rounding. Statistically significant differences between 2012 and 2014 were not found. Statistically significant differences between mothers and fathers within a given population (years) are noted: † p < .05; †† p < .01; ††† p < .001.
Figure 3.10 presents further analysis of the average number of effects of family violence on day-to-day activities, by type of violence reported for both the 2012 and 2014 cohorts. Overall, parents reported a higher average number of effects before/during separation when physical violence was experienced (2012: 2.3; 2014: 2.0) compared to emotional abuse (2012: 1.6; 2014: 1.7). While there was little difference in the average number of effects by type of violence since separation reported in the 2012 SRSP, in the 2014 cohort, a greater differential emerged since separation, with parents reporting an average of 2.1 effects when physical violence was experienced, compared to an average number of 1.7 effects when emotional abuse was experienced. Overall, mothers who experienced family violence before/during separation reported a higher average number of effects than fathers on their day-to-day activities, whether these related to physical violence or emotional abuse.
Figure 3.10: Average number of effects on parent's day-to-day activities before/during and since separation, by type of family violence and parent gender, 2012 and 2014
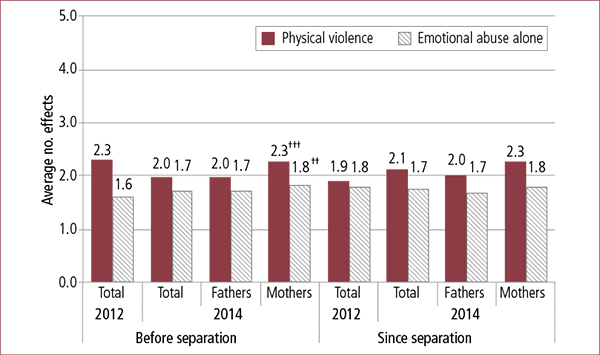
Notes: Data have been weighted. In 2012, only every tenth participant who answered that the focus parent's behaviour had an effect was asked about the nature of these effects. In 2014, every participant who answered that the focus parent's behaviour had an effect was asked about the nature of these effects. Percentages may not sum to 100.0% due to rounding. Statistically significant differences between 2012 and 2014 were not found. Statistically significant differences between mothers and fathers within a given population (years) are noted: † p < .05; †† p < .01; ††† p < .001.
Tables 3.7 and 3.8 present data relating to whether the experience of family violence before/during and since separation coincide with the timing of an event. Table 3.7 shows that parents in both cohorts most commonly reported that family violence before/during separation coincided with the period after the birth of a child and the months before separation. Statistically significant differences between mothers and fathers in both cohorts in the before/during separation period included that more mothers than fathers reported that the family violence started soon after the relationship began or during a pregnancy (Table 3.7).
In the 2014 cohort, significantly fewer parents nominated each type of event as coinciding with the start of family violence; however, further analysis showed that these decreases did not reflect fewer parents being able to nominate an event. Rather, given that parents could select multiple responses to this question, it appears that significantly higher proportions of parents in 2014 only nominated one event compared with 2012 (2014: 58% cf. 2012: 40%), while significantly fewer parents in 2014 nominated three or more events (2012: 33% cf. 2014: 20%).
| Timing of family violence | 2012 (%) | 2014 (%) | ||||
|---|---|---|---|---|---|---|
| Total | Fathers | Mothers | Total | Fathers | Mothers | |
| Notes: Data have been weighted. a "None" includes the responses of no connection, don't know and refused. Parents who had experienced family violence before/during separation were asked: "And thinking back to when this behaviour started, did it first occur around the same time as any of the following events …?" Percentages in the top panel do not sum to 100.0% as multiple responses could be chosen. Percentages in the bottom panel may not total 100.0% due to rounding. Statistically significant differences between 2012 and 2014 within a given population are noted: * p < .05; ** p < .01; *** p < .001. Statistically significant differences between mothers and fathers within a given population (years) are noted: † p < .05; †† p < .01; ††† p < .001. | ||||||
| Soon after relationship began | 20.1 | 17.0 | 22.6 ††† | 19.7 | 16.4 | 22.4 ††† |
| During a pregnancy | 25.8 | 21.3 | 29.4 ††† | 22.9 ** | 17.9 * | 27.1 ††† |
| After the birth of a child | 41.4 | 40.7 | 41.9 | 36.0 *** | 37.7 | 34.6 *** |
| During/after a stress life event | 33.7 | 28.8 | 37.6 ††† | 26.8 *** | 24.7 * | 28.6 ***† |
| A few months before separation | 42.3 | 43.2 | 41.7 | 29.8 *** | 31.7 *** | 28.2 ***† |
| During separation | 38.9 | 39.5 | 38.4 | 25.0 * | 25.1 *** | 24.9 *** |
| Other event | 9.4 | 9.7 | 9.1 | 7.8 | 8.4 | 7.2 * |
| No connection to any event | 5.3 | 5.7 | 4.9 | 5.0 | 4.9 | 5.1 |
| Number of events reported | ||||||
| None a | 10.8 | 11.2 | 10.4 | 9.4 | 9.6 | 9.2 |
| One event | 40.1 | 41.7 | 38.8 | 57.5 *** | 58.4 *** | 56.7 *** |
| Two events | 15.9 | 16.9 | 15.2 | 13.3 ** | 14.1 * | 12.6 * |
| Three or more events | 33.2 | 30.2 | 35.6††† | 19.8 *** | 17.8 *** | 21.4 ***†† |
| No. of observations | 4,049 | 1,739 | 2,310 | 3,983 | 1,710 | 2,273 |
Table 3.8 shows that the majority of parents in both cohorts reported that where family violence had commenced since separation, it occurred "after separation was finalised (2012: 62% and 2014: 55%), with a statistically significant decrease between cohorts. Twice as many fathers than mothers in the 2014 cohort reported that there was no connection between the family violence and any event (fathers: 13%; mothers: 6%), with both this difference between mothers and fathers and the reduction in fathers' reports reaching a level of statistical significance.
Similar to the changes noted in Table 3.7, the number of events that parents nominated as coinciding with the onset of family violence decreased significantly between 2012 and 2014, though this shift mainly occurred in fathers' responses.
| Timing of family violence | 2012 (%) | 2014 (%) | ||||
|---|---|---|---|---|---|---|
| Total | Fathers | Mothers | Total | Fathers | Mothers | |
| Notes: Data have been weighted. a "None" includes the responses of no connection, don't know and refused. Parents who had experienced family violence since separation but had not experience family violence before/during separation were asked: "And thinking back to when this behaviour started, did it first occur around the same time as any of the following events …?" Percentages in the top panel do not sum to 100.0% as multiple responses could be chosen. Percentages in the bottom panel may not total 100.0% due to rounding. Statistically significant differences between 2012 and 2014 within a given population are noted: * p < .05; ** p < .01; *** p < .001. Statistically significant differences between mothers and fathers within a given population (years) are noted: † p < .05; †† p < .01; ††† p < .001. | ||||||
| After separation was finalised | 62.2 | 66.2 | 57.5 | 54.6 * | 53.3 * | 56.2 |
| During parenting negotiations | 27.9 | 30.3 | 25.0 | 22.3 | 24.9 | 19.2 |
| After an attempt to change parenting arrangements | 23.3 | 30.6 | 14.5 ††† | 16.6 * | 15.8 ** | 17.5 |
| During/after property negotiations | 25.3 | 27.5 | 22.8 | 20.6 | 19.9 | 21.4 |
| After the birth of a child | 7.4 | 9.3 | 5.1 | 8.1 | 6.5 | 10.1 |
| During/just after a stressful life event | 20.0 | 23.5 | 15.8 | 10.9 ** | 8.5 *** | 13.8 |
| One parent began a new relationship | 34.0 | 41.9 | 24.5 ††† | 26.5 * | 26.2 * | 27.0 |
| Other event | 3.4 | 2.6 | 4.4 | 6.4 | 4.4 | 8.9 |
| No connection to any event | 10.3 | 8.4 | 12.7 | 9.5 | 12.3 | 6.1 *† |
| Number of events reported | ||||||
| None a | 14.2 | 12.3 | 16.4 | 11.4 | 14.3 | 7.8 |
| One event | 36.1 | 28.3 | 45.3††† | 52.5 *** | 50.8 *** | 54.6 |
| Two events | 17.6 | 20.6 | 14.0 | 16.4 | 16.0 | 16.9 |
| Three or more events | 32.2 | 38.9 | 24.3††† | 19.7 *** | 18.9 *** | 20.6 |
| No. of observations | 405 | 216 | 191 | 392 | 203 | 189 |
3.6 Children witnessing family violence
Parents who reported experiencing emotional abuse or physical violence before/during or since separation were asked whether their children witnessed this violent/abusive conduct (including seeing or hearing the focus parent's conduct or seeing the participant hurt or property damaged afterwards). Before/during separation, 53-54% of fathers and 64% of mothers reported that their children had seen or heard the violence or abuse in 2012 and 2014 (data not shown). In the post-separation period, 43% of fathers and 50% of mothers in the 2014 cohort reported that their children had seen or heard the violence or abuse, compared with 53% of fathers and 64% of mothers in the 2012 cohort (data not shown).
More specifically, Figure 3.11 shows that, consistent with the 2012 SRSP findings, a higher proportion of both mothers and fathers in the 2014 cohort reported that their children had witnessed physical violence rather than emotional abuse alone, with this observation again being more pronounced for mothers who had reported physical violence since separation and had indicated that the children had witnessed this violence (70-72%), when compared with mothers who had experienced emotional abuse since separation and indicated that the children had witnessed this violence (45-47%).
Figure 3.11: Proportion of children witnessing violence before/during and since separation, by type of family violence and parent gender, 2012 and 2014

Notes: Data have been weighted. Parents who experienced family violence before/during or since separation were asked: "Did the children ever witness any of this behaviour? This would include seeing or hearing it or seeing you hurt or property damaged afterwards". Statistically significant differences between 2012 and 2014 were not found. Statistically significant differences between mothers and fathers within a given population (years) are noted: † p < .05; †† p < .01; ††† p < .001.
This issue is considered further at section 3.10 concerning parents' reports of the exposure of children to focus parent behaviour that made the participant feel fearful, coerced or controlled.
3.7 Safety concerns
3.7.1 Reports of current safety concerns
Participating parents were asked in both the SRSP 2012 and SRSP 2014 whether they had any current concerns about the focus child's safety or their own safety as a result of ongoing contact with the focus parent. Figure 3.12 indicates that the majority of parents reported that they did not have any such safety concerns. Consistent with the findings arising from the SRSP 2012, 17% of parents in the 2014 cohort reported having safety concerns for themselves and/or their child, although this was significantly higher among mothers than fathers (mothers: 20% cf. fathers: 15%). Mothers in the 2014 cohort were more likely to express concern for both their child and themselves (9%) than were fathers (4%), with 7% of mothers and 10% of fathers expressing concerns for the focus child only.
Figure 3.12: Current safety concerns as a result of ongoing contact with focus parent, by parent gender, 2012 and 2014
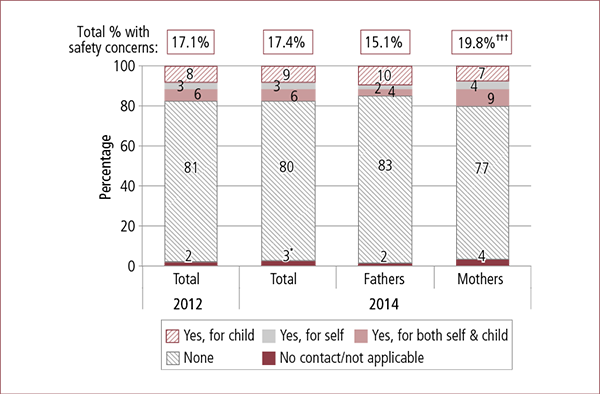
Notes: Data have been weighted. Parents who did not live under the same roof as focus parent, and where focus parent and focus child lived in Australia were asked: "Do you have any concerns about <focus child>'s safety or your own safety as a result of ongoing contact with <focus parent>?". Percentages may not total 100.0% due to rounding. Statistically significant differences between 2012 and 2014 within a given population are noted: * p < .05; ** p < .01; *** p < .001. Statistically significant differences between mothers and fathers were not found.
Figure 3.13 presents parents' responses when questioned about whether they ever limited or tried to limit the focus child's contact with the focus parent because of these safety concerns. Around half of the parents in both cohorts reported having tried to limit contact (2012: 49%; 2014: 52%), with around twice the number of mothers reporting this than fathers (2012 - mothers: 62% cf. fathers: 28%; 2014 - mothers: 63% cf. fathers: 36%).
Figure 3.13: Parents with safety concerns who limited or attempted to limit the child's contact with focus parent, by parent gender, 2012 and 2014

Note: Data have been weighted. Parents who reported having safety concerns were asked: "Have you ever limited or tried to limit <focus child>'s contact with <focus parent> because of these concerns?". This question was not asked if the focus parent lived overseas or if the parents lived under the same roof. The "don't know" and "refused" responses were excluded from this analysis (1% or less). Statistically significant differences between 2012 and 2014 within a given population are noted: * p < .05; ** p < .01; *** p < .001. Statistically significant differences between mothers and fathers within a given population (years) are noted: † p < .05; †† p < .01; ††† p < .001.
3.7.2 The people and behaviours generating safety concerns
Where parents reported safety concerns, they were then asked more specifically whether these safety concerns related to contact with the focus parent, the focus parent's new partner, another adult or another child. These parents were also asked whether their safety concerns related to alcohol or substance abuse, mental health issues, gambling problems, violent or dangerous behaviour, emotional abuse or anger issues (e.g., getting angry easily), or something else.
Comparison of the 2012 and 2014 SRSP data (Table 3.9) shows that parents overwhelmingly indicated that their safety concerns related to contact with the focus parent (2012: 84% and 2014: 86%). Consistent with the findings in the SRSP 2012, a substantially higher proportion of mothers than fathers in the 2014 cohort (94%) reported having safety concerns relating to the other parent (75%). Again consistent with the SRSP 2012, Table 3.9 shows that fathers in the 2014 cohort were more likely to report that their safety concerns related to another adult (30%) or the focus parent's new partner (16%).
| Participant's safety concerns related to: | 2012 (%) | 2014 (%) | ||
|---|---|---|---|---|
| Total | Total | Fathers | Mothers | |
| Notes: Data have been weighted. Parents who reported having safety concerns were asked: "Do these concerns relate to contact with: [sources of safety concerns]". Percentages do not sum to 100.0% as multiple responses could be chosen. Statistically significant differences between 2012 and 2014 were not found. Statistically significant differences between mothers and fathers within a given population (years) are noted: † p < .05; †† p < .01; ††† p < .001. | ||||
| Focus parent | 84.3 | 85.6 | 74.7 | 93.9 ††† |
| Another adult | 17.8 | 20.7 | 30.2 | 13.4 ††† |
| Focus parent's new partner | 13.1 | 11.2 | 15.9 | 7.8 ††† |
| Another child | 4.7 | 3.3 | 4.1 | 2.7 |
| No. of observations | 1,090 | 1,093 | 437 | 656 |
Table 3.10 shows that where safety concerns were reported, emotional abuse or anger issues emerged as the major concern identified by parents in both the 2012 and 2014 cohorts (77% and 81% respectively). Mental health issues and violent or dangerous behaviour were other commonly nominated behaviours giving rise to parents' safety concerns (2012: 55% and 51% and 2014: 62% and 53% respectively). Differences did emerge between the response patterns of mothers and fathers in relation to emotional abuse and anger issues in the SRSP 2012 that were again reflected in the SRSP 2014 data. Consistent with the findings of the SRSP 2012, a substantially higher proportion of mothers in the 2014 cohort (by almost 10 percentage points) reported that this conduct underpinned their safety concerns, compared with fathers. In both cohorts, mothers nominated alcohol or substance abuse (2012 - mothers: 48%; fathers 39%; 2014 - mothers: 50% and fathers 34%) and gambling problems (2012 - mothers: 10%; fathers 4%; 2014 - mothers: 11% and fathers 4%) in substantially greater proportions than fathers, though mothers in the 2014 cohort more commonly nominated alcohol or substance abuse than those participating in the SRSP 2012. A noticeable variation between the mothers' responses in the 2012 and 2014 cohorts also emerged in relation to violent or dangerous behaviour, with 57% of mothers in the 2014 cohort providing this response (again almost 10 percentage points higher than fathers in the 2014 cohort), compared to 52% of mothers in the 2012 cohort (cf. fathers: 48%). Both mothers and fathers in the 2014 cohort reported concerns arising from mental health issues in greater numbers than parents in the 2012 cohort (62% cf. 55% respectively).
| Behaviour generating safety concerns | 2012 (%) | 2014 (%) | ||
|---|---|---|---|---|
| Total | Total | Fathers | Mothers | |
| Notes: Data have been weighted. Parents who had safety concerns were asked: "Do your concerns relate to any of the following issues: [behaviours generating safety concerns]". Percentages do not sum to 100.0% as multiple responses could be chosen. Data for fathers and mothers in 2012 are not shown - see De Maio et al. (2013), p. 40. Statistically significant differences between 2012 and 2014 within a given population are noted: * p < .05; ** p < .01; *** p < .001. Statistically significant differences between mothers and fathers within a given population (years) are noted: † p < .05; †† p < .01; ††† p < .001. | ||||
| Emotional abuse or anger issues | 77.0 | 81.3 * | 75.8 | 85.4 ††† |
| Mental health issues | 55.3 | 61.5 ** | 60.5 | 62.3 |
| Violent or dangerous behaviour | 50.5 | 53.3 | 47.8 | 57.4 †† |
| Alcohol or substance abuse | 44.3 | 42.9 | 34.2 | 49.5 ††† |
| Gambling problems | 8.0 | 7.8 | 3.6 | 10.9 ††† |
| Something else | 12.9 | 8.7 ** | 9.8 | 7.9 |
| No. of observations | 1,090 | 1,093 | 437 | 656 |
3.8 Behaviour that causes parents to feel fearful, coerced or controlled
As noted in the introduction to this chapter, the 2014 SRSP included additional questions based on the amended definition of family violence in s 4AB introduced in the 2012 family violence reforms, with these additional questions aimed at capturing participating parents' reports of focus parent behaviour that coerced or controlled them, or caused them to be fearful.
Figure 3.14 presents the reported frequency with which participating parents' felt fearful, coerced or controlled by the focus parent's behaviour before/during separation and since separation. In relation to parents' experiences before/during separation, a substantial proportion of fathers (more than double that of mothers) reported that they "never" felt fearful (43% cf. 21%), whereas 60% of mothers indicated that they "often" or "sometimes" felt fearful (cf. 41% of fathers). Mothers' and fathers' reports of feeling coerced and controlled before/during separation were more similar than their responses relating to fear, although a greater proportion of mothers did report that they "often" felt controlled by the focus parent (56% cf. 50%).
In relation to the post-separation period, Figure 3.14 shows that, once again, a substantial proportion of fathers (52%) reported that they "never" felt fearful as a result of the focus parent's behaviour, with over one-third of mothers reporting that they were "often" (15%) or "sometimes" (24%) fearful. While a greater proportion of fathers than mothers reported that they had "often" felt controlled since separation (32% cf. 22%), a greater proportion of mothers reported that they "sometimes" (27%) or "rarely" (18%) felt this way when compared with fathers (23% and 15% respectively). A greater proportion of fathers than mothers reported that they "often" felt coerced during this post-separation period (26% cf. 18% respectively).
Figure 3.14: Frequency of focus parent's behaviour making participant feel fearful, controlled or coerced before/during and since separation, by parent gender, 2014
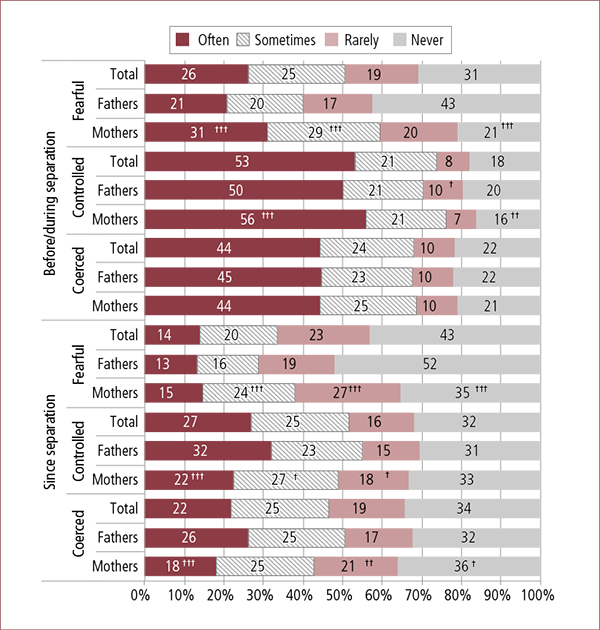
Notes: Data have been weighted. Parents who reported experiencing family violence before/during separation were asked: "How often did <focus parent>'s behaviour before or during separation make you feel: fearful; controlled; coerced?". Parents who reported experiencing family violence since separation were asked: "How often did <focus parent>'s behaviour since separation make you feel: fearful; controlled; coerced?" Percentages may not total 100.0% due to rounding. Statistically significant differences between mothers and fathers within a given population (fearful, controlled, coerced) are noted: † p < .05; †† p < .01; ††† p < .001.
Table 3.11 presents the frequency reports from participating parents regarding the focus parent behaviour that made them feel fearful, coerced or controlled, together with their reported experience of family violence before/during separation. Table 3.12 presents these data in the post-separation context.
When comparing parents' reports before/during separation of (a) feeling fearful, coerced or controlled and (b) experiencing either physical violence or emotional abuse alone, Table 3.9 shows that almost all the responses were statistically different between experiences of physical and emotional abuse within the given population (that is, within the fathers', mothers' and total samples). For example, before/during separation, 42% of parents who reported physical violence said that they "often" felt fearful as a result of the focus parent's behaviour, compared to 16% of parents who reported emotional abuse. However, Table 3.11 does indicate lower levels of discrepancies in the frequency responses between physical violence and emotional abuse with respect to parents feeling coerced or controlled.
Table 3.11 also identifies differences between the mothers' and fathers' reports of their experiences of physical violence and emotional abuse. For example, in the pre-separation context, 26% of fathers who reported experiencing physical violence also reported that they "never" felt fearful as a result of the focus parent's behaviour, whereas only 7% of responding mothers fell into this category, with this difference reaching a level of statistical significance. Further, while 47% of mothers who experienced physical violence reported that the focus parent's behaviour "often" made them feel fearful, significantly fewer fathers did (32%). Statistically significant differences also emerged in mothers' and fathers' responses with respect to feeling controlled by the focus parent's behaviour before/during separation, with 61% of fathers compared to 70% of mothers who reported experiencing physical violence also indicating that they "often" felt controlled.
Differences in this pre-separation context also emerged between mothers' and fathers' reports about feeling fearful, coerced or controlled where there had been emotional abuse. For example, 32% of fathers compared with 44% of women who reported suffering emotional abuse, also reported that they "often" or "sometimes" felt fearful as a result of the focus parent's behaviour (with the differences between mothers and fathers with respect to the "sometimes" response option reaching a level of statistical significance). While 23% of mothers reporting emotional abuse indicated that they "rarely" felt fearful and 33% reported that this was "never" the case, these contrasted with the reports of fathers in these categories, with 17% indicating that they "rarely" felt fearful and 51% that they "never" felt fearful, with each of the results being of statistical significance. Statistically significant differences again emerged between mothers' and fathers' responses with respect to feeling coerced, with 39% of fathers and 32% of mothers who reported that they experienced emotional abuse, also indicating that they "often" felt coerced by the focus parent's behaviour in this time period.
| Physical violence (%) | Emotional abuse alone (%) | |||||
|---|---|---|---|---|---|---|
| Total | Fathers | Mothers | Total | Fathers | Mothers | |
| Notes: Data have been weighted. Parents who reported experiencing family violence before/during separation were asked: "How often did <focus parent>'s behaviour before or during separation make you feel: fearful; controlled; coerced?" Percentages may not total 100.0% due to rounding. Statistically significant differences between fathers and mothers within a given population (physical violence, emotional abuse) are noted: † p < .05; †† p < .01; ††† p < .001. For example, significantly fewer fathers than mothers who reported experiencing physical violence before/during separation also reported that they "often" felt fearful. Statistically significant differences between the experience of physical violence and emotional abuse within a given population (mothers, fathers and total) are noted: * p < .05; ** p < .01; *** p < .001. For example, significantly fewer parents who reported experiencing physical violence before/during separation also reported that they "never" felt fearful when compared with parents who reported experiencing emotional abuse before/during separation and also reported that they "never" felt fearful. | ||||||
| Fearful | (n = 1,594) | (n = 548) | (n = 1,046) | (n = 2,357) | (n = 1,141) | (n = 1,216) |
| Often | 41.5 | 31.9 | 47.2 ††† | 16.1 *** | 15.1 *** | 17.2 *** |
| Sometimes | 28.8 | 25.0 | 31.0 † | 21.7 *** | 17.0 *** | 26.6 *††† |
| Rarely | 15.8 | 17.3 | 14.9 | 20.2 ** | 17.3 | 23.3 ***†† |
| Never | 14.0 | 25.9 | 6.9 ††† | 41.9 *** | 50.6 *** | 32.9 ***††† |
| Controlled | (n = 1,589) | (n = 542) | (n = 1,047) | (n = 2,354) | (n = 1,146) | (n = 1,208) |
| Often | 66.3 | 60.6 | 69.6 ††† | 44.7 *** | 45.1 *** | 44.2 *** |
| Sometimes | 17.9 | 17.9 | 17.8 | 22.3 ** | 21.8 | 22.9 ** |
| Rarely | 5.5 | 6.5 | 4.9 | 10.3 *** | 11.1 * | 9.5 *** |
| Never | 10.3 | 15.0 | 7.6 ††† | 22.7 *** | 22.0 ** | 23.4 *** |
| Coerced | (n = 1,586) | (n = 543) | (n = 1,043) | (n = 2,352) | (n = 1,147) | (n = 1,205) |
| Often | 57.8 | 55.8 | 59.0 | 35.7 *** | 39.2 *** | 32.0 ***††† |
| Sometimes | 23.1 | 23.5 | 22.8 | 24.4 | 23.0 | 25.8 |
| Rarely | 7.2 | 7.2 | 7.2 | 12.1 *** | 11.6 * | 12.6 *** |
| Never | 11.9 | 13.5 | 11.0 | 27.9 *** | 26.3 *** | 29.5 *** |
Table 3.12 presents the frequency reports from participating parents regarding behaviour on the part of the focus parent since separation that made them feel fearful, coerced or controlled together with their reported experience of family violence. In relation to this post-separation period, when comparing parents' reports of feeling (a) fearful, coerced, or controlled and (b) experiencing either physical violence or emotional abuse, almost all the frequency responses differed to a statistically significant extent. For example, while 25% of parents who reported physical violence reported that they "often" felt fearful since separation, 12% of parents who reported emotional abuse indicated that this.
| Physical violence (%) | Emotional abuse alone (%) | |||||
|---|---|---|---|---|---|---|
| Total | Fathers | Mothers | Total | Fathers | Mothers | |
| Notes: Data have been weighted. Parents who reported experiencing family violence since separation were asked: "How often did <focus parent>'s behaviour since separation make you feel: fearful; controlled; coerced?" Percentages may not total 100.0% due to rounding. Statistically significant differences between fathers and mothers within a given population (physical violence, emotional abuse) are noted: † p < .05; †† p < .01; ††† p < .001. For example, significantly greater fathers than mothers who reported experiencing physical violence since separation also reported that they "never" felt fearful. Statistically significant differences between the experience of physical violence and emotional abuse within a given population (mothers, fathers and total) are noted: * p < .05; ** p < .01; *** p < .001. For example, significantly fewer parents who reported experiencing physical violence since separation also reported that they "never" felt fearful when compared with parents who reported experiencing emotional abuse since separation and also reported that they "never" felt fearful. | ||||||
| Fearful | (n = 469) | (n = 184) | (n = 285) | (n = 3,202) | (n = 1,418) | (n = 1,784) |
| Often | 25.1 | 23.1 | 26.6 | 12.1 *** | 11.6 *** | 12.5 *** |
| Sometimes | 29.6 | 22.4 | 34.9 †† | 18.3 *** | 14.8 * | 21.5 ***††† |
| Rarely | 25.6 | 24.6 | 26.4 | 22.8 | 18.6 | 26.5 ††† |
| Never | 19.7 | 30.0 | 12.2 ††† | 46.8 *** | 55.0 *** | 39.4 ***††† |
| Controlled | (n = 469) | (n = 187) | (n = 282) | (n = 3,195) | (n = 1,414) | (n = 1,781) |
| Often | 40.2 | 47.0 | 35.0 † | 24.8 *** | 29.8 *** | 20.3 ***††† |
| Sometimes | 27.8 | 22.4 | 31.8 † | 24.5 | 23.1 | 25.8 * |
| Rarely | 13.7 | 11.9 | 15.1 | 16.6 | 14.9 | 18.2 † |
| Never | 18.4 | 18.7 | 18.1 | 34.1 *** | 32.2 *** | 35.8 *** |
| Coerced | (n = 471) | (n = 187) | (n = 284) | (n = 3,192) | (n = 1,412) | (n = 1,780) |
| Often | 34.5 | 40.4 | 30.0 † | 19.8 *** | 24.2 *** | 15.8 ***††† |
| Sometimes | 28.2 | 25.0 | 30.6 | 24.3 | 24.5 | 24.1 * |
| Rarely | 20.3 | 17.7 | 22.3 | 18.8 | 16.7 | 20.7 †† |
| Never | 17.0 | 16.9 | 17.1 | 37.1 *** | 34.6 *** | 39.4 ***† |
Table 3.12 depicts higher levels of discrepancy in the frequency responses in the two nominated categories of family violence where the behaviour on the part of the focus parent that made the participant feel coerced or controlled than in relation to parents' reports of feeling fearful in this same time period. For example, 40% of parents experiencing physical violence reported that they often felt controlled, whereas 25% of parents experiencing emotional abuse only reported that they often felt controlled in this time period.
Table 3.12 also identifies statistically significant gender differences in experiences of physical violence in the post-separation context. For example, 30% of fathers who reported experiencing physical violence indicated that they "never" felt fearful as a result of the focus parent's behaviour, whereas 12% of responding mothers fell into this category. Differences also emerged in mothers' and fathers' responses with respect to feeling controlled and experiencing physical violence, although in contrast to the before/during separation period, more fathers (47%) than mothers (35%) indicated that they "often" felt controlled, while 22% of fathers and 32% of mothers indicated that this was "sometimes" the case since separation. A greater proportion of fathers than mothers who reported physical violence also reported that they "often" felt coerced (40% cf. 30% respectively).
Statistically significant differences post-separation also emerged between mothers' and fathers' reports about feeling fearful, coerced, or controlled where there had been emotional abuse. For example, among parents who reported suffering emotional abuse, 15% of fathers compared to 22% of mothers also reported that they "sometimes" felt fearful as a result of the focus parent's behaviour. While 27% of the mothers indicated that they "rarely" felt fearful and 39% reported that this was "never" the case, these contrasted with the reports of the fathers (rarely: 19% and never: 55%). In terms of feeling controlled and suffering emotional abuse, 30% of fathers and 20% of mothers reported that they "often" felt controlled, and 15% of fathers and 18% of mothers indicated that this was "rarely" the case. In relation to feelings of coercion and suffering emotional abuse, 17% of fathers and 21% of mothers indicated that they "rarely" felt coerced, while 35% of fathers and 39% of mothers indicated that this was "never" the case. In addition, 24% of fathers and 16% of mothers who reported emotional abuse also indicated that they "often" felt coerced.
Figure 3.15 depicts frequency data relating to the exposure of the focus child to behaviour by the focus parent that gave rise to the participating parent's feeling fearful, coerced or controlled. In each response category, between 19% and 20% of participating parents indicated that the focus child was "never" exposed to such behaviour before/during separation, but 54-60% of parents reported that the focus child was "often" or "sometimes" exposed to this behaviour before/during separation, and 39-43% since separation.
While Figure 3.15 indicates limited differences in the responses of fathers and mothers in the before/during separation context, there were statistically significant differences between fathers' and mothers' responses with respect to the post-separation period. Fathers' reports that the focus child was "often" exposed to the focus parent's fearful, coercive or controlling behaviour were about twice as high as those of mothers.
Figure 3.15: How often focus child was exposed to focus parent's behavior that made participant feel fearful, controlled or coerced before/during and since separation, by parent gender, 2014
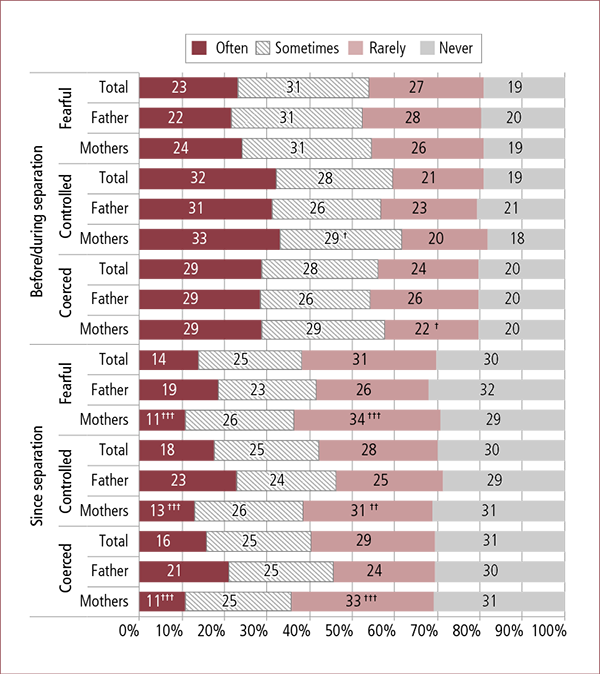
Notes: Data have been weighted. Parents who reported feeling fearful, controlled or coerced due to focus parent's behaviour before/during separation were asked: "How often before or during separation was <focus child> exposed to any of the behaviour that made you feel: fearful; controlled; coerced?" Parents who reported feeling fearful, coerced or controlled due to focus parent's behaviour since separation were asked: "How often since the separation has <focus child> been exposed to any of the behaviour that made you feel: fearful; controlled; coerced?" Percentages may not total 100.0% due to rounding. Statistically significant differences between fathers and mothers within a given population (fearful, controlled or coerced) are noted: † p < .05; †† p < .01; ††† p < .001.
Figure 3.16 presents parents' reports of the severity of fear, coercion or control that they felt arising from the focus parent's behaviour before/during and since separation. Parents were asked to rate how fearful, coerced or controlled they felt on a scale of 0 ("not at all") to 10 ("extremely"). Over 80% of parents gave a rating of between 5 and 10 for feeling fearful (81%), coerced (87%) or controlled (89%) relating to the period before/during separation. Mothers' ratings of between 9 and 10 were substantially higher than those of fathers, with 27% of mothers and 20% of fathers rating their fear at these levels, 35% of mothers and 27% of fathers rating their feelings of being controlled at these levels, and 31% of mothers and 25% of fathers rating their feelings of being coerced at these levels.
The figure shows that in the post-separation context, lower - but still substantial - proportions of parents responding to this question gave a rating of between 5 and 10 for feeling fearful (68%), coerced (71%) or controlled (73%). There were fewer differences between mothers' and fathers' responses with respect to severity during this period of statistical significance.
Figure 3.16: Ratings of feeling fearful, controlled or coerced because of focus parent's behavior before/during and since separation, by parent gender, 2014
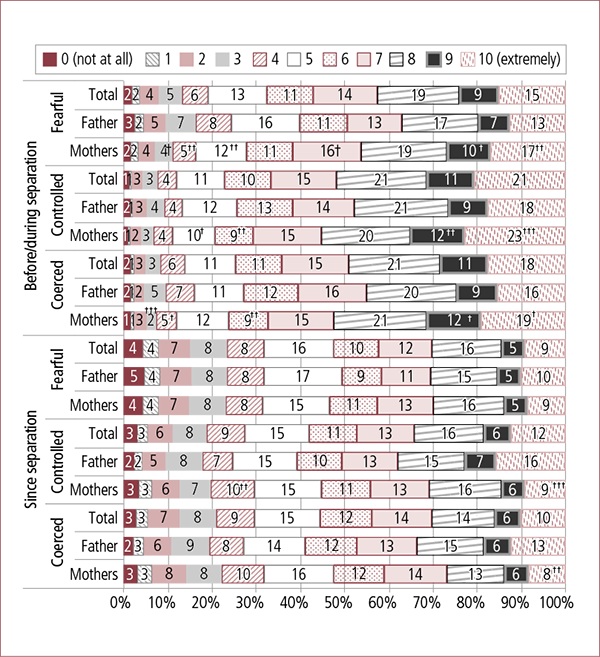
Notes: Data have been weighted. Parents who reported feeling fearful, controlled or coerced due to focus parent's behaviour before or during separation were asked: "On a scale of 0 to 10, where 0 is not at all and 10 is extremely, how fearful (controlled; coerced) has <focus parent>'s behaviour before or during separation made you feel?" Percentages may not total 100.0% due to rounding. Statistically significant differences between mothers and fathers within a given population (fearful, controlled, coerced) are noted: † p < .05; †† p < .01; ††† p < .001.
3.9 Family violence, safety concerns and care-time arrangements
Figure 3.17 presents the care-time arrangements made by parents in the 2012 and 2014 cohorts who reported that they held safety concerns. The data demonstrate that in the context of safety concerns, there was an increase between 2012 and 2014 in parenting arrangements being made where the focus child resides with the mother for 100% of nights and spends time with the father during the daytime only (2012: 19%; 2014: 23%, falling just short of statistical significance). There were also decreases in reports of some shared care-time arrangements (where the child spends 53-65% of their time with the mother and 35-47% of their time with the father), equal care-time arrangements (where the child spends 48-52% with each parent), and arrangements where the focus child lived with the father or mother for 100% of their time and spent no time with the other parent, although these decreases were not statistically significant.
Figure 3.17: Care-time arrangements made in the presence of safety concerns associated with ongoing contact with focus parent, 2012 and 2014
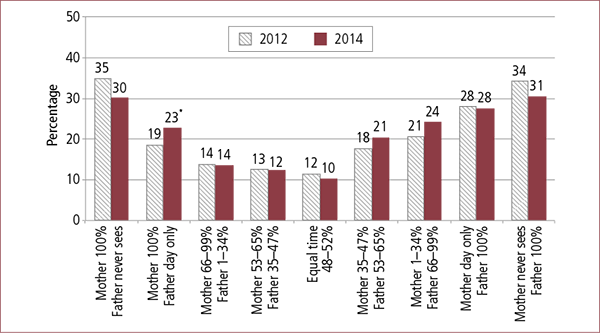
Notes: Data have been weighted. In cases where both parents of a focus child participated (2012: n = 539; 2014: n = 523), data from one parent were randomly selected for inclusion. Statistically significant differences between 2012 and 2014 were not found.
Consistent with the response pattern in the SRSP 2012 and with the earlier AIFS Evaluation of the 2006 Family Law Reforms (Kaspiew et al., 2009), Figure 3.18 shows that safety concerns were most frequently reported in 2014 where the focus child never saw one of their parents (27-32%). More specifically, reports of care-time arrangements whereby children spent 100% of their time with the mother and no time with their father remained the most common response for mothers in both cohorts (2012: 33%; 2014: 32%). Of note and as identified above, even parents with shared care-time arrangements (where the child spends 35-65% of their time with each parent) were not immune from holding safety concerns (2012: 10-19%; 2014: 10-22%). Figure 3.18 also shows that the only area where changes between cohorts were evident to a statistically significant extent was in relation to mothers' reports of children spending between 1-34% of their time with their fathers (2012: 18%; 2014: 15%).
Figure 3.18: Care-time arrangements made in the presence of safety concerns associated with ongoing contact with focus parent, by parent gender, 2012 and 2014
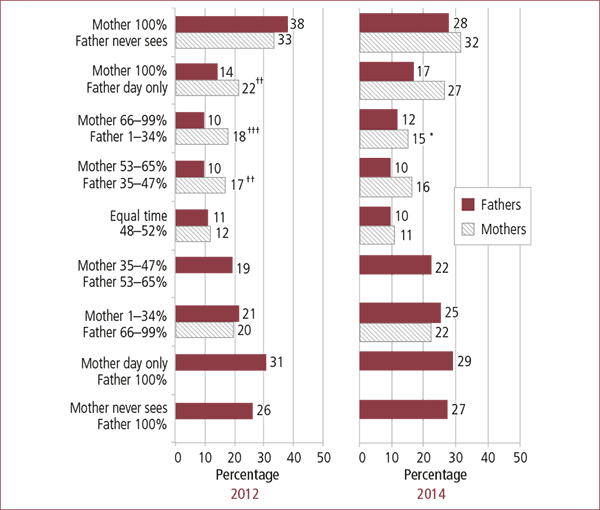
Notes: Data have been weighted. Data not shown where sample sizes for care-time categories were smaller than 20 responses. Statistically significant differences between 2012 and 2014 within a given population are noted: * p < .05; ** p < .01; *** p < .001. Statistically significant differences between mothers and fathers within a given population (years) are noted: † p < .05; †† p < .01; ††† p < .001.
Figures 3.19 and 3.20 demonstrate the relationship between care-time arrangements and the experience of family violence before/during separation. Figure 3.19 presents fathers' and mothers' reports of care-time arrangements by the type of family violence experienced before/during separation for both the 2012 and 2014 cohorts. Overall, these data show that across all care-time groups, significantly more mothers than fathers reported experiences of physical violence. The results also show a significant decrease in the proportion of mothers reporting experiences of family violence where they did not have any overnight contact with their child (i.e., mother sees child during the daytime only or not at all); however, due to the small sample size of this care-time group, results should be interpreted with caution.
Examination of the distribution of care-time arrangements among parents who reported experiencing family violence before/during separation showed a significant decrease in mother majority care (1-34% of nights with the father) (2012: 47% cf. 2014: 44%), and a corresponding increase in daytime-only contact with their fathers in these circumstances (2012: 16% cf. 2014: 18%) (see Appendix 3, Figure B9).
Figure 3.19: Care-time arrangements made when family violence experienced before/during separation, by type of violence and parent gender, 2012 and 2014
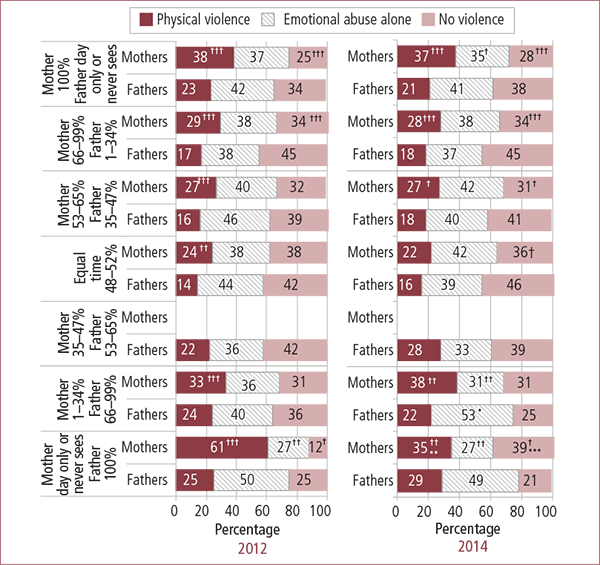
Notes: Data have been weighted. Percentages may not total 100.0% due to rounding. Statistically significant differences between 2012 and 2014 within a given population are noted: * p < .05; ** p < .01; *** p < .001. Statistically significant differences between Mothers and Fathers within a given population (years) are noted: † p < .05; †† p < .01; ††† p < .001.
Figure 3.20 presents data relating to parents' experiences of family violence since separation and shows less significant gender variation than Figure 3.19, though in cases where the child stays 100% of nights with the mother, significantly more mothers than fathers had experienced physical violence since separation. Significantly more mothers than fathers with equal care-time arrangements also reported physical violence since separation, while among parents where the child lives the majority of the time with the mother (66-99% of nights), significantly more mothers than fathers reported experiencing emotional abuse alone since separation.
The only significant change between 2012 and 2014 regarding the experiences of family violence since separation in the context of care-time arrangements was that fewer fathers with majority care reported "no violence", though given the small sample size of this group, this finding should be interpreted with caution.
Figure 3.20: Care-time arrangements made when family violence experienced since separation, by type of violence and parent gender, 2012 and 2014
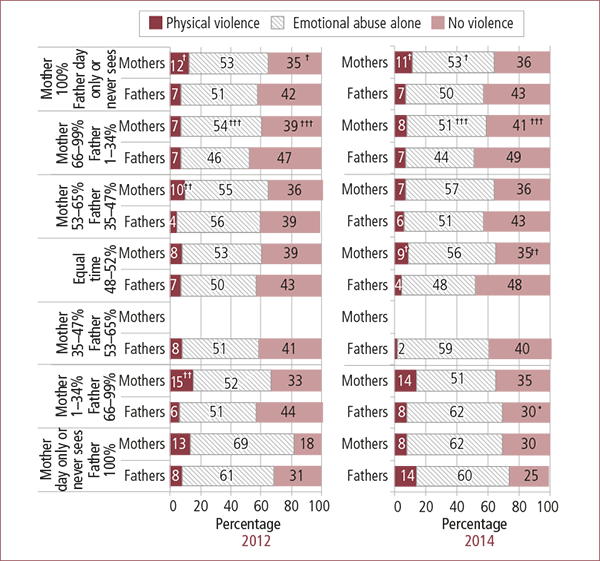
Notes: Data have been weighted. Data not shown where sample sizes for care-time categories were smaller than 20 responses. Percentages may not total 100.0% due to rounding. Statistically significant differences between 2012 and 2014 within a given population are noted: * p < .05; ** p < .01; *** p < .001. Statistically significant differences between mothers and fathers within a given population (years) are noted: † p < .05; †† p < .01; ††† p < .001.
3.10 Protection orders
Parents who had experienced family violence before/during or since separation, and had reported these experiences to police or other services, were asked whether a protection order had been issued in their favour. Figure 3.21 presents parents' responses to this question. Slightly smaller proportions of participating parents in the Australian Capital Territory, South Australia, Victoria and New South Wales in the 2014 cohort (compared to 2012) reported that they had never had a protection order issued. Although these data must be interpreted with caution due to the small differences between reported proportions, Figure 3.21 also shows an increase in parents reporting that a protection order had been issued both before/during and since separation in most states and territories, although in Victoria reports remained stable at 2%, and in Western Australia reports reduced both before/during and since separation. There were statistically significant increases in "yes, both" responses in the Northern Territory and South Australia, and "yes, since" for New South Wales. As noted at the outset, this may reflect shifting dynamics in policy or practice in state/territory-based systems, which have not been examined in this report.
Figure 3.21: Whether protection order issued before/during, since, or both before/during and since separation, by state/territory, 2012 and 2014
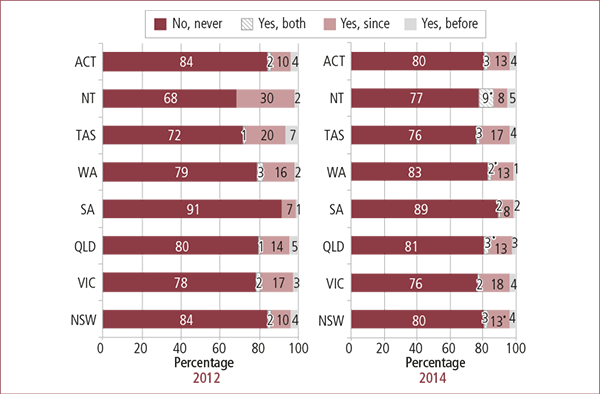
Notes: Data have been weighted. Percentages may not total 100.0% due to rounding. Statistically significant differences between 2012 and 2014 within a given population (state/territory) are noted: * p < .05; ** p < .01; *** p < .001.
More specifically, Figure 3.22 presents the comparison of the reports of parents about the issuing of protection orders in the 2012 and 2014 cohorts in the context of whether family violence was experienced before/during and/or since separation. The figure shows that mothers in the 2014 cohort were more likely than those in the 2012 cohort to report that where they had experienced family violence both before/during and since separation, a protection order was issued in their matter either since separation (21% cf. 19%), or both before/during and since separation (4% cf. 2%). The data also show that a substantial proportion of mothers who reported experiencing family violence since separation only, had never had a protection order issued in their matter, with this increasing from 90% of the 2012 cohort to 99% of the 2014 cohort.
Figure 3.22: Whether protection order issued before, since or both before and since separation, by when family violence was experienced and parent gender, 2012 and 2014

Notes: Data have been weighted. Percentages may not total 100.0% due to rounding. Statistically significant differences between 2012 and 2014 within a given population are noted: * p < .05; ** p < .01; *** p < .001. Statistically significant differences between mothers and fathers within a given population (years) are noted: † p < .05; †† p < .01; ††† p < .001.
Figure 3.23 shows that mothers in the 2014 cohort reported that protection orders had been issued in their favour in greater proportions than fathers in all categories for which there were sufficient data to report. Of note is that 20% of mothers in the 2014 cohort who had had protection orders issued reported that shared care arrangements were in place in their matters.
Figure 3.23: Care-time arrangements made where protection order has been issued, by parent gender, 2012 and 2014
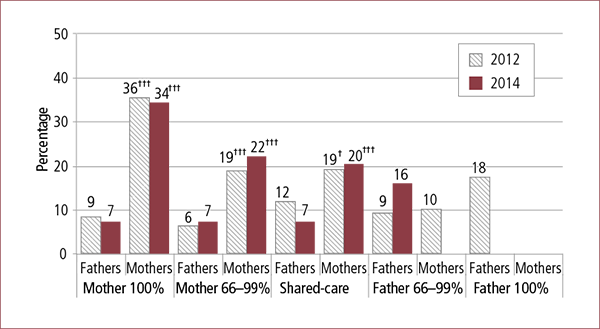
Note: Data have been weighted. Population consists of parents who experienced family violence either before/during or since separation and reported this family violence to authorities (2012: n = 492; 2014: n = 522). Selected data not shown in this figure where population sizes within sub-groups were less than 50. Statistically significant differences between 2012 and 2014 were not found. Statistically significant differences between mothers and fathers within a given population (years) are noted: † p < .05; †† p < .01; ††† p < .001.
Figure 3.24 shows that mothers in both cohorts reported that protection orders had been made at any time in their matter in significantly greater proportions than fathers (mothers: 27% cf. fathers: 9%). This was the case in all states and territories save for South Australia. Analysis comparing the two cohorts showed that in 2014, a significantly higher proportion of mothers who experienced family violence in NSW had protection orders issued (2012: 23% cf. 2014: 29%).
Figure 3.24: Protection orders issued, by state/territory and parent gender, 2014
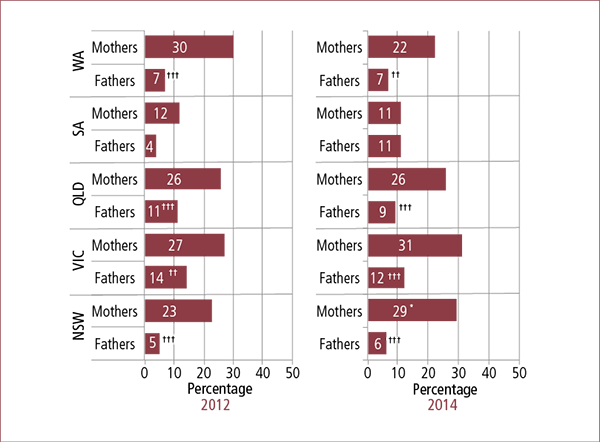
Notes: Data have been weighted. Statistically significant differences between 2012 and 2014 within a given population are noted: * p < .05; ** p < .01; *** p < .001. Statistically significant differences between mothers and fathers within a given population (years) are noted: † p < .05; †† p < .01; ††† p < .001.
3.11 Summary
This chapter has examined participating parents' experiences (both before/during and since separation) of family violence and their concerns about their own safety or the safety of their children, with the analysis comparing the findings of the SRSP 2012 and 2014. The following discussion summarises key findings presented in this chapter.
3.11.1 Parents' experiences of emotional abuse and physical hurt
The data analysis in this chapter indicates largely consistent response patterns in relation to the incidence and frequency of emotional abuse and physical hurt between the 2012 and 2014 cohorts.
Emotional abuse
Most parents participating in the SRSP 2014 reported experiencing at least one type of emotional abuse before/during or since separation, and they did so in proportions consistent with the reports of mothers and fathers in the 2012 SRSP cohort. The analysis in this chapter indicates that overall, mothers reported experiencing emotional abuse in greater proportions than fathers both before/during separation (2012 - fathers: 58%, mothers: 68%; 2014 - fathers: 57%, mothers: 67%) and since separation (2012 - fathers: 56%, mothers: 63%; 2014 - fathers: 55%, mothers: 61%). In relation to the 11 nominated emotional abuse items, generally, a higher proportion of mothers reported experiencing these forms of emotional abuse than did fathers, with particularly marked differences (of 10 percentage points or more) emerging in relation to mothers' and fathers' reports of attempts to force any unwanted sexual activity and the damage or destruction of property before/during separation.
While there were no statistically significant differences between the 2012 and 2014 cohorts with respect to reports of experiencing emotional abuse before/during separation, a small but statistically significant decrease was reflected in the 2014 cohort's post-separation reports of the most commonly reported form of emotional abuse - insults with the intent to shame, belittle or humiliate - when compared with the responses of the 2012 cohort on this item (2014 - fathers: 44%, mothers: 50% cf. 2012 - fathers: 47%, mothers: 53%). Mothers' reports of threats by the focus parent to harm them, their child/children and other family members or friends were lower in 2014 than in 2012.
The analyses in this chapter also show that overall, mothers in both the 2012 and 2014 cohorts reported experiencing each of the nominated emotional abuse items (bar reports by the 2014 cohort regarding one item) more frequently than participating fathers. While the most commonly nominated form of emotional abuse remained stable between cohorts in its reported frequency before/during separation (2012 - fathers: 79%, mothers: 86%; 2014 - fathers 78%, mothers: 87%), the "sometimes" or "often" responses for some of the less commonly nominated emotional abuse items in this time period (e.g., frequency of attempts to force unwanted sexual activity) reflected an increase of 5 or 6 percentage points in the 2014 cohort. The only variation of statistical significance in relation to post-separation experiences of emotional abuse was the increase from 32% to 39% for fathers reporting that the focus parent had "often" insulted them with the intent to shame, belittle or humiliate. More specific analysis of the interaction between the incidence and frequency of emotional abuse both before/during and since separation also indicated consistent experiences for the 2012 and 2014 cohorts.
Physical hurt
The data analysis in this chapter shows that, consistent with the reported experiences of parents participating in the SRSP 2012, a substantial minority of parents in the 2014 cohort reported experiencing physical hurt from the focus parent before separation. Overall, mothers in both cohorts reported experiencing this in greater proportions than fathers (2012 - fathers: 16%, mothers: 24%; 2014 - fathers: 16%, mothers: 23%). Reports by fathers and mothers of physical hurt since separation were also reported in consistent proportions in each cohort (5% of fathers and 6% of mothers in both 2012 and 2014).
The analyses in this chapter also show that in the 2014 cohort, overall, mothers reported experiencing physical hurt more frequently than fathers, both before separation (fathers: 36%, mothers: 38%) and since separation (fathers: 16%, mothers: 20%). Further, the response patterns in relation to the frequency of reported experiences of physical hurt both before and since separation by parents were consistent between the 2012 and 2014 cohorts.
Differences between the 2012 and 2014 cohorts did emerge, however, in relation to the effects of physical hurt. In particular, there was a higher proportion of parents reporting post-separation "bruises and scratches", "fractured or broken bones", "gunshot/stab wounds or burns" or "other injury" in the 2014 cohort than the 2012 cohort.
Consolidated analysis of parents' experiences of family violence
While parents' reports of experiencing all three violent and abusive behaviours - emotional abuse and physical violence (comprised of attempted unwanted sexual activity and/or physical hurt) remained stable between the SRSP 2012 and SRSP 2014, the analysis presented in this chapter shows that similar proportions of parents in the 2012 and 2014 cohorts reported experiencing physical hurt and/or attempted unwanted sexual activity before/during separation (25%) and since separation (8%), and parents' reports of experiencing emotional abuse alone were also consistent between cohorts (before/during separation - 2012: 39% cf. 2014: 38%; since separation - 2012: 52% cf. 2014: 50%)
Overall, in the 2014 cohort, mothers reported experiencing physical violence in greater proportions than fathers both before/during separation (fathers: 19% and mothers: 31%) and since separation (fathers: 7% and mothers: 9%). However, in the before/during separation period, fathers reported experiencing emotional abuse alone (40%) in greater proportions than mothers (37%), although mothers reported higher rates of emotional abuse alone than fathers since separation (52% and 48% respectively). Also, the data analysis shows that a higher proportion of fathers reported that they had not experienced any of the three violent and abusive behaviours before/during separation in either cohorts (2012: 41% and 2014: 42%) compared with mothers' reported experiences (2012: 31% and 2014: 32%).
3.11.2 Effects of family violence on day-to-day activities
In general terms, the reported effects of family violence were similar in the two surveys in terms of the nature and number of these effects on parents' day-to-day activities. The analysis of data relating to the effects of violence on day-to-day activities indicated similar response patterns emerging in both the SRSP 2012 and SRSP 2014 with respect to reports of taking time off work or changing work or study arrangements as a result of emotional abuse or physical violence experienced before/during separation. The analysis of these data also indicates a statistically significant increase between the two cohorts in parents' reported experiences of mental health issues before/during separation, with 66% of parents reporting these issues in the SRSP 2014, compared to 52% of parents in the SRSP 2012.
Differences of statistical significance also emerged between cohorts in relation to parents' reports of effects in the post-separation context, with these including reported experiences of mental health issues (2012: 52% cf. 2014: 60%) and making changes to social activities (2012: 29% cf. 2014: 19%).
Variations were also identified in relation to the reported effects of family violence on day-to-day activities both before/during and since separation. While fathers indicated that they took time off work in greater proportions than mothers in both the 2012 cohort (33% cf. 21% respectively) and 2014 cohort (30% cf. 18% respectively), mothers indicated that the behaviour of the focus parent was affecting their mental health, eating and sleeping habits, and household tasks, as well as contributing to feelings of lower confidence and security, and feelings of intimidation, in greater proportions than that of fathers. Mothers also reported in greater proportions than fathers that they experienced two or more effects as a result of the focus parent's behaviour.
Overall, parents reported a higher average number of effects before/during separation when physical violence was experienced (2012: 2.3 effects and 2014: 2.0 effects) compared to emotional abuse (2012: 1.6 effects and 2014: 1.7 effects). A greater differential emerged since separation, with parents reporting an average of 2.1 effects when physical violence was experienced, compared to an average of 1.7 effects when emotional abuse was experienced in 2014. Overall, mothers reported a higher average number of effects than fathers on their day-to-day activities, whether these reports were accompanied by physical violence or emotional abuse.
3.11.3 Children witnessing violence
The discussion in this chapter also considered the data available from both the SRSP 2012 and SRSP 2014 relating to children witnessing emotional abuse or physical violence before/during or since separation. Parents in the 2014 cohort reported that their children saw or heard violence or abuse in the before/during separation period in proportions consistent with the 2012 cohort (mothers: 64%; fathers: 53-54%). When compared with the 2012 cohort, a smaller proportion of mothers and fathers in the 2014 cohort reported that their children had seen or heard the violence or abuse that occurred since separation (2012 - fathers: 53% and mothers: 64%; 2014 - fathers: 43% and mothers: 50%).
Consistent with the SRSP 2012, a higher proportion of mothers than fathers in the 2014 cohort reported that their children witnessed physical violence as opposed to emotional abuse, with these affirmative reports particularly pronounced in the post-separation context.
Data relating to parents' reports of children's exposure to behaviour on the part of the focus parent that made them feel fearful, coerced or controlled were also analysed in this chapter (see below).
3.11.4 Safety concerns
The data analysis in this chapter also considered participating parents' concerns about their own safety and the safety of the focus child arising from ongoing contact with the focus parent. While the majority of parents reported that they did not hold such safety concerns, consistent proportions of parents in the 2012 and 2014 cohorts (17%) reported having safety concerns. The analysis also shows that an increased proportion of parents in the 2014 cohort reported limiting or trying to limit the focus child's contact with the focus parent because of these safety concerns (2012: 49% cf. 2014: 52%). The LSSF Waves 2 and 3 findings showed that close to 20% of parents held safety concerns in each wave, but these proportions included parents for whom concerns dissipated or arose newly between waves. For a core group of close to five per cent of parents, safety concerns were sustained across the three LSSF waves (Qu et al., 2014).
Consideration of the 2012 and 2014 data also indicates that focus parent behaviour was the source of these safety concerns for most parents, with emotional abuse or anger issues emerging as the major concern identified in both cohorts (2012: 77% and 2014: 81%). The discussion of these data also identified differences between the response patterns of mothers and fathers in relation to emotional abuse and anger issues, with a substantially higher proportion (almost 10 percentage points) of mothers in both cohorts reporting that this conduct underpinned their safety concerns when compared with fathers.
More mothers in the 2014 cohort reported the focus parents' violent or dangerous behaviour as giving rise to their safety concerns (57%), compared to 52% in the 2012 cohort.
3.11.5 Behaviour that causes parents to feel fearful, coerced or controlled
The analysis in this chapter indicates that in the before/during separation period, participating mothers were more likely to report that behaviour on the part of the focus parent caused them to feel fearful, coerced or controlled. A substantial proportion of fathers (more than double that of mothers) reported that they "never" felt fearful before/during separation, whereas 60% of mothers (cf. 41% of fathers) reported that they "often" or "sometimes" felt fearful. Mothers' and fathers' reports of feeling coerced or controlled were more evenly dispersed in this time period, although a greater proportion of mothers than fathers did report that they "often" felt controlled by the focus parent (56% cf. 50%).
In relation to the post-separation period, the data analysis once again indicates that participating mothers were more likely than fathers to report that they felt fearful as a result of the focus parent's behaviour. A substantial proportion of fathers (52%) reported that they "never" felt fearful, while over one-third of mothers responding to this question reported that they were "often" (15%) or "sometimes" (24%) fearful. However, a greater proportion of fathers than mothers reported that they "often" felt coerced or controlled (32% cf. 22%) during this post-separation period (26% cf. 18%).
The analysis in this chapter also extended to a consideration of parents' reports of feeling fearful, coerced or controlled together with their reported experience of family violence both before/during and since separation. Comparisons between parents who reported feeling (a) fearful, coerced or controlled, and (b) experiencing either physical violence or emotional abuse alone, showed statistically significant differences in almost all frequency response options.
Overall, feeling fearful, coerced or controlled was more commonly reported by parents who had experienced physical violence as opposed to emotional abuse, with this response pattern evident both before/during and since separation. Statistically significant differences were also identified between mothers and fathers who reported feeling fearful, coerced or controlled and experiencing either form of family violence, in the context of both cohorts. Mothers who reported experiencing either physical violence or emotional abuse reported feeling fearful in greater proportions than fathers both before/during separation and since separation. For example, mothers who experienced physical violence before/during separation reported that they "often" or "sometimes" felt fearful (78% cf. fathers: 57%), coerced (82% cf. fathers: 79%) or controlled (87% cf. fathers: 79%). Lower level discrepancies appeared in the frequency responses relating to reports of experiencing either form of family violence and feeling coerced or controlled before/during separation.
Notably, mothers' reports of the severity of their feeling fearful, coerced or controlled were also substantially higher than those made by fathers. Overall, participating parents rated the severity of their feelings at a higher level when experienced before/during separation, compared with the post-separation period, with mothers' reports being at higher severity levels than those of fathers.
The discussion of these data also included an analysis of parents' reports of children's exposure to the behaviour that made them feel fearful, coerced or controlled. Of particular note is that more than one-half of parents reported that the focus child was "often" or "sometimes" exposed to this focus parent behaviour before/during separation, and more than one-third of parents reported this to be the case in the post-separation period. While limited differences were identified in the responses of mothers and fathers with respect to the exposure of children to this behaviour before/during separation, there were differences of statistical significance between mothers' and fathers' responses in the post-separation context.
3.11.6 Care-time arrangements
The comparison of SRSP 2012 and 2014 data demonstrates that in circumstances where safety concerns existed, there was a statistically significant increase over time in making parenting arrangements where the focus child resides with the mother for 100% of nights and spends time with the father during the daytime only (2012: 19% and 2014: 23%).
The data analysis also identified decreases in reports of some shared care-time arrangements (where the child spends 53-65% of their time with the mother and 35-47% of their time with the father), and equal care-time arrangements (where the child spends 48-52% with each parent), and arrangements where the focus child lived with one parent for 100% of their time and spent no time with the other parent, although these decreases were not of statistical significance. A substantial proportion of parents holding safety concerns also reported having shared care-time arrangements (2012: 10-19%; 2014: 10-22%)
Consistent with the response patterns in the SRSP 2012 and with the earlier AIFS Evaluation of the 2006 Family Law Reforms (Kaspiew et al., 2009), the SRSP 2014 data indicate that safety concerns were most frequently reported where the focus child never saw one of their parents (2014: 27-32%). More specifically, in circumstances involving safety concerns, the most common response for mothers in both cohorts was to report care-time arrangements where children spent 100% of their time with the mother and no time with their father (2012: 33%; 2014: 32%). The only area where statistically significant changes between cohorts were evident was in relation to mothers' reports of children spending between 1-34% of their time with their fathers (2012: 18% and 2014: 15%).
Overall, the 2012 and 2014 cohort data indicate that when either parent had majority or 100% care of the focus child, this was more likely to be associated with reports of having experienced physical violence. Generally, mothers in the 2014 cohort reported having safety concerns in greater proportions than fathers in the context of care-time arrangements ranging from 100% mother care time through to equal time, whereas fathers in the 2014 cohort reported having safety concerns in greater proportions than mothers where care-time arrangements ranged from 100% father care time through to shared arrangements where the father was the primary carer. Among parents who experienced family violence before/during separation, there was a shift in 2014 toward daytime-only contact with their fathers, and a corresponding shift away from overnight stays with fathers.
3.11.7 Protection orders
Overall, the analysis of data collected in the SRSP 2014 in relation to protection orders show that substantially greater proportions of mothers than fathers reported that protection orders had been made in all states and territories save for South Australia.
Smaller proportions of participating parents in the Australian Capital Territory, South Australia, Victoria and in New South Wales in the 2014 cohort, compared with the 2012 cohort, reported that they had never had a protection order issued in their favour. Increases in parents reporting that a protection order had been issued both before/during and since separation were apparent in most states and territories, though in Victoria reports remained stable at 2%, and in Western Australia reports reduced both before/during and since separation. There were statistically significant increases in "yes, both" responses in the Northern Territory and South Australia, and "yes, since" for New South Wales.
More specifically, where they had experienced family violence, mothers in the 2014 cohort were more likely than mothers in the 2012 cohort to report that a protection order had been issued in their matter in either time period, although 20% of mothers in the 2014 cohort who had had protection orders issued reported that shared care-time arrangements were in place. The data also show that a substantial proportion of mothers who reported experiencing family violence since separation only, had never had a protection order issued in their matter, with this increasing from 90% of the 2012 cohort to 99% of the 2014 cohort.
5 Note that in the SRSP 2012, these "tried to prevent" survey questions were asked only of parents who were living under the same roof at the time of the interview, whereas in the SRSP 2014 they were asked of all parents.
6 However, the highest score for emotional abuse in either cohort was 51, therefore Figure 3.6 only shows a maximum score of 55.
7 Consistent with the rationale described in De Maio et al. (2013), the rationale for categorising attempts to force unwanted sexual activity together with physical hurt is based on the data identified in Table 2.3 that indicate attempted unwanted sexual activity in the absence of emotional abuse and/or physical abuse was reported by less than 1% of parents. While attempting to force unwanted sexual activity was included as one of the 11 emotional abuse items in the SRSP 2012 survey to enable comparability with the LSSF Wave 1 data, from this point in the report it is grouped with physical hurt to reflect its serious nature, and acknowledges that some physical hurt may be involved in "trying to force" unwanted sexual activity on someone.
8 Note that in the SRSP 2012, time/resource constraints meant we only asked questions about the nature of these effects of every 10th participant who answered that the focus parent's behaviour before/during or since separation had an effect on their day-to-day activities, whereas in the SRSP 2014, every participant who answered in the affirmative was asked about the nature of these effects.
A key change to the family law system introduced by the Australian Government in 2006 involved changes to the family relationship services system. The principal aim of these changes was to meet the following two policy objectives:
- to help separated parents agree on what is best for their children (rather than litigating), through the provision of useful information and advice, and effective dispute resolution services; and
- to establish a highly visible entry point that operates as a doorway to other services, and help families to access these other services.
This chapter maintains a focus on parental use of family law services and the outcomes of their interactions with these services. The aim is to continue developing the evidence base established in the LSSF research program and to consider what, if any, consequences appear to be flowing from the 2012 family violence amendments at this stage.
4.1 Service use at the time of separation
Parents in both the SRSP 2012 and SRSP 2014 were asked whether they had contacted a range of services, including a number of specific family law services and other sources of support at the time of separation. Table 4.1 reveals that with the exception of courts, domestic violence services, and family members, modest but statistically significant decreases occurred in the proportion of parents in the 2014 cohort making use of specified services, compared to the 2012 cohort. A correspondingly statistically significant increase (from 12% to 15%) occurred in the proportion of parents not making use of any formal or informal assistance.
| Total (%) | Fathers (%) | Mothers (%) | ||||
|---|---|---|---|---|---|---|
| 2012 | 2014 | 2012 | 2014 | 2012 | 2014 | |
| Notes: Data have been weighted. Percentages do not sum to 100.0% as multiple responses could be selected. Statistically significant differences between 2012 and 2014 within a given population are noted: * p < .05; ** p < .01; *** p < .001. Statistically significant differences between mothers and fathers within a given population (years) are noted: † p < .05; †† p < .01; ††† p < .001. | ||||||
| Counselling/relationship/FDR service | 54.8 | 52.2 ** | 54.9 | 53.0 | 54.7 | 51.3 ** |
| A lawyer | 49.4 | 47.0 * | 49.1 | 47.6 | 49.8 | 46.4 ** |
| A legal service | 32.0 | 30.1 * | 25.5 | 24.3 | 38.1 ††† | 35.9 ††† |
| The courts | 20.3 | 19.6 | 20.3 | 20.0 | 20.3 | 19.2 |
| Domestic violence service | 8.7 | 9.1 | 3.4 | 3.6 | 13.8 ††† | 14.4 ††† |
| Family members | 65.3 | 63.7 | 63.0 | 60.5 | 67.6 ††† | 66.8 ††† |
| Other | 3.3 | 1.8 *** | 2.6 | 1.6 * | 3.9 †† | 1.9 *** |
| None | 12.0 | 15.3 *** | 13.6 | 17.3 *** | 10.6 †† | 13.4 **††† |
| No. of observations | 6,119 | 6,079 | 2,853 | 2,817 | 3,266 | 3,262 |
Notwithstanding these changes, for both cohorts, counselling, relationship and FDR (combined) remained the most commonly used services, followed by lawyers, a legal service, courts and domestic violence services.
In the 2014 cohort, mothers were substantially more likely than fathers to use a domestic violence service (14% cf. 4% respectively), considerably more likely to use a legal service (36% cf. 24%), and a little more likely to seek advice or support from family members (67% cf. 61%). Mothers were less likely than fathers to make use of no services or supports (13% cf. 17%), while roughly equal proportions of mothers and fathers in both cohorts used courts (19% cf. 20%). Statistically significant decreases in mothers' use of counselling/relationship/FDR services, lawyers and other services were identified in the 2014 cohort when compared with the 2012 cohort.
The discussion in section 3.4 presented parents' reported experiences of emotional abuse and physical violence (physical hurt and/or attempts to force unwanted sexual activity). Table 4.2 indicates that among parents who had experienced physical violence or emotional abuse before/during separation, there was no significant change between the 2012 and 2014 cohorts in the proportions using services or seeking support from family members. Among those who had not experienced family violence, however, there were modest but statistically significant decreases in the proportions making use of family member support and the three most used services (counselling, lawyers, legal services); and there was a corresponding significant increase in the proportion who did not use any services or supports. The proportion making use of the courts remained the same in both cohorts (8%).
| Physical violence (%) | Emotional abuse alone (%) | No family violence (%) | ||||
|---|---|---|---|---|---|---|
| 2012 | 2014 | 2012 | 2014 | 2012 | 2014 | |
| Notes: Data have been weighted. Percentages do not sum to 100.0% as multiple responses could be selected. Statistically significant differences between 2012 and 2014 within a given population are noted: * p < .05; ** p < .01; *** p < .001. | ||||||
| Counselling/relationship/FDR service | 68.8 | 67.3 | 59.6 | 59.0 | 39.8 | 35.0 ** |
| A lawyer | 63.4 | 62.4 | 56.0 | 54.9 | 32.5 | 28.5 ** |
| A legal service | 48.0 | 47.6 | 33.4 | 33.6 | 19.2 | 14.8 *** |
| The courts | 35.7 | 35.7 | 21.5 | 20.7 | 8.3 | 7.6 |
| Domestic violence service | 24.1 | 25.0 | 5.9 | 7.0 | 1.0 | 0.5 |
| Family members | 70.7 | 71.9 | 67.6 | 67.6 | 59.1 | 54.1 ** |
| Other | 3.9 | 2.0 ** | 4.0 | 1.9 *** | 2.0 | 1.5 |
| None | 5.4 | 5.9 | 8.5 | 9.4 | 20.6 | 27.8 *** |
| No. of observations | 1,616 | 1,605 | 2,433 | 2,379 | 2,070 | 2,095 |
An examination of parents' reports of contact with services, by whether family violence had been experienced before/during separation, showed no significant differences between 2012 and 2014 for either mothers or fathers, with the exception of the "other" service category, where there were significantly fewer mothers and fathers choosing this category in 2014 than in 2012. There were, however, significant differences between mothers' and fathers' reports within each cohort. For example, more mothers than fathers who experienced physical violence and/or emotional abuse accessed a legal service or a domestic violence service, while more fathers than mothers who experienced emotional abuse alone accessed formal family law pathways (e.g., FDR, lawyers, courts) (see Appendix 3, Table B1).
Table 4.2 also reveals that in both cohorts, those who had experienced physical violence before/during separation were the heaviest users of services, the courts and family supports and, conversely, the least likely to have not made use of assistance. In both cohorts, those who had experienced emotional abuse were the next most likely to make use of services, the courts and family supports and the next least likely to have sought no assistance. Finally, those who experienced no family violence were least likely to have made use of services and most likely, by a considerable margin, to have not sought supports.
In both cohorts, for all three categories - physical violence, emotional abuse and no violence - support from family members was the most common form of assistance cited (54-72%), followed by counselling/relationship/FDR services (35-69%), lawyers (29-63%), legal services (15-48%), and courts (8-36%). Domestic violence services were consulted by about a quarter of the parents in both cohorts who had reported physical violence, but by only a fairly small percentage (6-7%) of parents who had experienced emotional abuse.
Patterns in reported service use according to experiences of family violence since separation are presented in Table 4.3. The data reveal a pattern of service use and family support largely similar to that seen in Table 4.2. Between the 2012 and 2014 cohorts, there was a statistically significant change in the use of services among parents who had experienced family violence since separation, which was a decrease (from 77% to 71%) in the use of counselling/relationship/FDR services by parents who had experienced physical violence. As was the case for the before/during separation period, among those who had not experienced family violence since separation, there were significant decreases in the use of services, and a corresponding significant increase in the number who sought no family support or professional input. The percentage making use of the courts remained almost the same (8-9%).
| Physical violence (%) | Emotional abuse alone (%) | No family violence (%) | ||||
|---|---|---|---|---|---|---|
| 2012 | 2014 | 2012 | 2014 | 2012 | 2014 | |
| Notes: Data have been weighted. Percentages do not sum to 100.0% as multiple responses could be selected. Statistically significant differences between 2012 and 2014 within a given population are noted: * p < .05; ** p < .01; *** p < .001. | ||||||
| Counselling/relationship/FDR service | 77.1 | 70.9 * | 63.8 | 64.5 | 39.0 | 33.7 *** |
| A lawyer | 67.9 | 63.7 | 60.5 | 60.0 | 31.8 | 28.0 ** |
| A legal service | 52.9 | 50.5 | 39.2 | 39.7 | 18.7 | 14.6 *** |
| The courts | 38.3 | 37.0 | 26.3 | 26.3 | 9.1 | 8.0 |
| Domestic violence service | 26.7 | 28.5 | 11.3 | 12.4 | 1.9 | 1.4 |
| Family members | 74.8 | 71.8 | 69.2 | 71.0 | 58.7 | 53.3 *** |
| Other | 3.6 | 2.7 | 3.6 | 1.8 *** | 2.8 | 1.5 ** |
| None | 3.7 | 3.9 | 6.5 | 7.1 | 20.7 | 27.4 *** |
| No. of observations | 486 | 480 | 3,258 | 3,232 | 2,375 | 2,367 |
An examination of parents' reports of contact with services, by whether family violence had been experienced since separation, showed no significant differences between 2012 and 2014 for either mothers or fathers, with the exception of the "other" services category, where there were significantly fewer mothers and fathers choosing this category in 2014 than in 2012. There were, however, significant differences between mothers' and fathers' reports within each cohort. For example, more mothers than fathers who experienced physical violence and/or emotional abuse accessed a legal service or a domestic violence service, while among parents who had not experienced family violence, more fathers than mothers did not access any services or support (see Appendix 3, Table B2).
Similar to the before/during separation period, those in both cohorts who had experienced physical violence since separation were the heaviest users of services, the courts and family supports and, conversely, the least likely to have not made use of assistance. In both cohorts, those who had experienced emotional abuse since separation were the next most likely to make use of services, the courts and family supports, but were more likely to have sought no assistance than those parents who had experience physical violence. Finally, those who experienced no family violence since separation were the least likely to have made use of services, and most likely, again by a considerable margin, to have not sought support.
For the emotional abuse and no violence categories, support from family members was the most common form of assistance cited (53-71%). The most common form of assistance cited by those who had experienced physical violence was counselling/relationship/FDR services for the 2012 cohort, but family member support for the 2014 cohort. This reflects a significant drop in the use of counselling/relationship/FDR services by 2014 parents in this category.
The frequency of other service use followed the pattern of the before/during separation period, with lawyers being the next most used (28-68%), followed by legal services (15-33%), courts (8-38%), and domestic violence services (physical violence: 27-29%; emotional abuse: 11-12%; no family violence: 1-2%).
4.2 Sorting out arrangements after separation
The discussion in this section examines whether, at the time of interview, participating parents had resolved their post-separation parenting arrangements and what methods they had used or were in the process of using to realise this goal.
4.2.1 Resolution of parenting arrangements
Table 4.4 reveals that, compared to the 2012 cohort, the 2014 cohort of parents were significantly less likely to report having sorted out parenting arrangements (74% cf. 71%). This decrease is reflected in small increases in reports of being in the process of sorting things out (2012: 19% cf. 2014: 21%) and not having sorted matters out (2012: 7% cf. 2014: 8%). Compared to fathers, mothers in the 2014 cohort were significantly more likely to have reported that parenting matters had been sorted out (fathers: 69% cf. mothers: 73%), but significantly less likely to be in the process of sorting out arrangements (fathers: 22% cf. mothers: 19%).
| 2012 (%) | 2014 (%) | |||
|---|---|---|---|---|
| Total | Total | Fathers | Mothers | |
| Notes: Data have been weighted. The "don't know" and "refused" responses were excluded from this analysis (< 1%). Percentages may not total 100.0% due to rounding. Statistically significant differences between 2012 and 2014 within a given population are noted: * p < .05; ** p < .01; *** p < .001. Statistically significant differences between mothers and fathers within each of the two cohorts are noted: † p < .05; †† p < .01; ††† p < .001. | ||||
| Yes, sorted out | 73.6 | 71.0 ** | 69.1 | 72.9 †† |
| In process of sorting out | 19.2 | 20.7 | 22.3 | 19.0 †† |
| No, not sorted | 7.2 | 8.4 * | 8.6 | 8.1 |
| No. of observations | 6,056 | 6,010 | 2,795 | 3,215 |
Table 4.5 explores the relationship between parenting arrangements and the experience of family violence before/during separation. The table demonstrates that for both mothers and fathers, and within each category - physical violence, emotional abuse and no violence - there were no significant differences between cohorts with respect to the status of their parenting arrangements. Nevertheless, for mothers and fathers in both cohorts, sorting out post-separation parenting issues was linked to whether or not physical violence, emotional abuse or no violence had occurred before/during separation. For example, where no violence had been reported, the "sorted" response rate was relatively high (mothers: 87% and fathers: 81-85%), the "not sorted" response was quite small (mothers: 4% and fathers: 4-5%), and the "in process" response rate was 9% for mothers and between 11-14% for fathers.
For both mothers and fathers in each cohort, a similar pattern can be seen for those who had experienced either physical violence or emotional abuse before/during the separation. At the same time, compared to "no violence", both categories of violence were associated with lower "sorted out" rates, and higher "in process" and "not sorted" rates. More particularly, parents who experienced physical violence reported the lowest "sorted out" rates (mothers: 59-66% and fathers: 51-54%), the highest "in process" rates (mothers: 24-28% and fathers: 34-36%), and the highest "not sorted" rates (mothers and fathers: 11-13%). Parents who experienced emotional abuse reported "sorted out" "in process" and "not sorted" rates that were in between ("sorted out" - mothers: 72-74% and fathers: 65-67%; "in process" - mothers: 19-20% and fathers: 25%; "not sorted" - mothers: 7-8% and fathers: 8-11%).
| Physical violence (%) | Emotional abuse alone (%) | No family violence (%) | ||||
|---|---|---|---|---|---|---|
| 2012 | 2014 | 2012 | 2014 | 2012 | 2014 | |
| Notes: Data have been weighted. The "don't know" and "refused" responses were excluded from this analysis (< 1%). Percentages may not total 100.0% due to rounding. Statistically significant differences between 2012 and 2014 within a given population are noted: * p < .05; ** p < .01; *** p < .001. Statistically significant differences between mothers and fathers within a given population (years) are noted: † p < .05; †† p < .01; ††† p < .001. | ||||||
| Fathers | (n = 539) | (n = 546) | (n = 1,185) | (n = 1,151) | (n = 1,107) | (n = 1,098) |
| Yes, sorted out | 54.2 | 50.8 | 66.7 | 64.6 | 84.7 | 81.4 |
| In process of sorting out | 34.4 | 36.2 | 25.2 | 24.9 | 11.3 | 13.7 |
| No, not sorted | 11.4 | 13.0 | 8.1 | 10.5 | 3.9 | 4.9 |
| Mothers | (n = 1,057) | (n = 1,039) | (n = 1,220) | (n = 1,203) | (n = 948) | (n = 973) |
| Yes, sorted out | 65.5 ††† | 59.3 **†† | 73.5 ††† | 72.0 ††† | 87.2 | 86.8 †† |
| In process of sorting out | 23.9 ††† | 27.7 †† | 19.2 ††† | 20.1 † | 8.7 | 9.4 †† |
| No, not sorted | 10.7 | 12.9 | 7.3 | 7.9 † | 4.2 | 3.8 |
Table 4.6 summarises data on the status of parenting arrangements as a function of experiences of violence since separation. The table reveals that for both mothers and fathers, and within each category - physical violence, emotional abuse and no violence - there were again no significant differences between cohorts with respect to the status of their parenting arrangements. There is, however, a pattern similar to that found in Table 4.5, which links the status of parenting arrangements to the experience of violence since separation. For example, where no violence has been reported, the "sorted" response rate was again relatively high (mothers: 87% and fathers: 84-86%), the "not sorted" response was again quite small (mothers and fathers: 4%), and the "in process" response rate was 9% for mothers and 11-12% for fathers. These figures are very similar to those reported in the "no violence" category before/during separation in Table 4.5.
| Physical violence (%) | Emotional abuse alone (%) | No family violence (%) | ||||
|---|---|---|---|---|---|---|
| 2012 | 2014 | 2012 | 2014 | 2012 | 2014 | |
| Notes: Data have been weighted. The "don't know" and "refused" responses were excluded from this analysis (less than 1%). Percentages may not total 100.0% due to rounding. Statistically significant differences between 2012 and 2014 within a given population are noted: * p < .05; ** p < .01; *** p < .001. Statistically significant differences between mothers and fathers within a given population (years) are noted: † p < .05; †† p < .01; ††† p < .001. | ||||||
| Fathers | (n = 187) | (n = 191) | (n = 1,449) | (n = 1,424) | (n = 1,195) | (n = 1,180) |
| Yes, sorted out | 59.5 | 44.6 ** | 61.5 | 58.8 | 85.5 | 84.0 |
| In process of sorting out | 30.1 | 38.4 | 28.9 | 29.6 | 11.1 | 11.9 |
| No, not sorted | 10.4 | 17.0 | 9.6 | 11.6 | 3.5 | 4.1 |
| Mothers | (n = 292) | (n = 287) | (n = 1,778) | (n = 1,766) | (n = 1,155) | (n = 1,162) |
| Yes, sorted out | 58.7 | 56.6† | 69.8 ††† | 65.5 **††† | 87.0 | 86.8 |
| In process of sorting out | 29.5 | 29.5 | 21.5 ††† | 24.7 * †† | 8.6 | 8.8 † |
| No, not sorted | 11.8 | 13.9 | 8.7 | 9.8 | 4.4 | 4.4 |
For both mothers and fathers in each cohort, a similar pattern of parenting arrangement status can also be seen for those who had experienced violence since separation, although compared to "no violence", both categories of violence were associated with lower "sorted out" rates and higher "in process" and "not sorted" rates. More particularly, parents who had experienced physical violence reported the lowest "sorted out" rates (mothers: 57-59% and fathers: 45-65%), the highest "in process" rates (mothers: 30% and fathers: 30-38%), and the highest "not sorted" rates (mothers: 12-14% and fathers: 10-17%). Parents who had experienced emotional abuse since separation reported moderate rates in each category ("sorted out" - mothers: 66-70% and fathers: 59-62%; "in process" - mothers: 22-25% and fathers: 25%; "not sorted" - mothers: 9-10% and fathers: 10-12%).
4.2.2 Agreement types
Parents in the 2012 and 2014 cohorts who reported in the survey that their parenting arrangements had been "sorted out" (see Table 4.4) were asked whether this agreement had been written down, and if so, whether this had been formalised by a court. Table 4.7 summarises the data on the type of agreements made by parents in both cohorts. The table shows that a minority of parents wrote down their agreements (2012: 39% and 2014: 41%), while a majority did not (2012: 61% and 2014: 60%). Where agreements were in writing, a minority also had the agreement formalised by a court (2012: 42% and 2014: 38%), while a majority did not (2012: 58% and 2014: 63%). The only statistically significant difference in these data was that fewer parents in the 2014 cohort formalised their agreement in court than those in the 2012 cohort.
Mothers in the 2014 cohort were less likely than fathers to report having written agreements (mothers: 37% cf. fathers: 45%), and a little less likely to report written court-related agreements (mothers: 36% cf. fathers: 39%).
| 2012 (%) | 2014 (%) | |||
|---|---|---|---|---|
| Total | Total | Fathers | Mothers | |
| Notes: Data have been weighted. The "don't know" and "refused" responses were excluded from this analysis (< 1%). Percentages may not total 100.0% due to rounding. a Sample consisted of parents who had sorted out their parenting arrangements (i.e., answered "Yes" to the question: "Have you and [child's other parent] sorted out the parenting arrangements for [child]?"). b Sample consisted of parents who had sorted out their parenting arrangements and answered "Yes" when asked whether the parenting arrangements had been written down. Only those who answered "Yes" were asked whether the written agreement had been formalised by a court. Statistically significant differences between 2012 and 2014 within a given population are noted: * p < .05; ** p < .01; *** p < .001. Statistically significant differences between mothers and fathers within a given population (years) are noted: † p < .05; †† p < .01; ††† p < .001. | ||||
| Agreement written down a | ||||
| Yes | 38.9 | 40.6 | 44.8 | 36.6 ††† |
| No | 61.1 | 59.5 | 55.2 | 63.4 |
| No. of observations | 4,398 | 4,173 | 1,874 | 2,299 |
| Written agreement formalised by a court b | ||||
| Yes | 42.2 | 37.5 ** | 38.5 | 36.3 |
| No | 57.8 | 62.5 | 61.5 | 63.7 |
| No. of observations | 1,782 | 1,765 | 876 | 889 |
Figure 4.1 suggests that among parents in the 2014 cohort, the decision to write down a parenting agreement is associated with a higher likelihood of experiencing family violence both before/during and since separation, and these patterns are consistent with a greater use of lawyers among parents affected by family violence (see section 4.2.3) The figure shows that of the fathers who had experienced physical violence before/during separation and had reached an agreement about parenting, 50% had written the agreement down (down from 63% in 2012, though not a statistically significant change). A higher proportion (58%) of written agreements occurred among fathers who had experienced emotional abuse and had reached an agreement. And of the fathers who had not experienced violence and had reached an agreement, 35% had written it down.
Figure 4.1: Parenting agreements that were written down, by experiences of family violence before/during and since separation and parent gender, 2012 and 2014
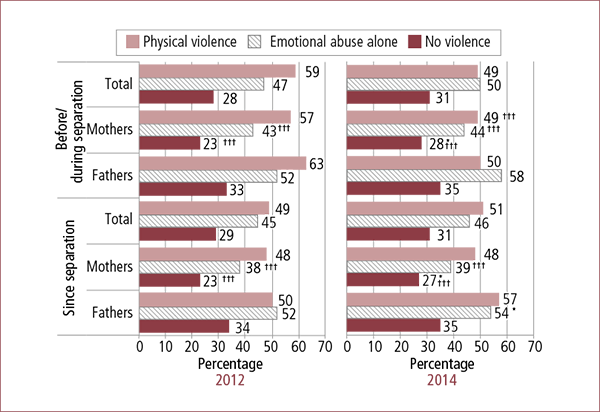
Notes: Data have been weighted. Statistically significant differences between 2012 and 2014 within a given population are noted: * p < .05; ** p < .01; *** p < .001. Statistically significant differences between mothers and fathers within a given population (years) are noted: † p < .05; †† p < .01; ††† p < .001.
Though mothers who experienced family violence before/during separation were significantly less likely than fathers to report writing agreements down, the patterns for mothers were similar. That is, of the mothers in the 2014 cohort who had experienced physical violence before/during separation and had reached an agreement, 44% had written the parenting agreement down. Of the mothers in 2014 who had experienced emotional abuse and had reached an agreement, 44% had written it down. And of the mothers who had not experienced violence and had reached an agreement, 28% had written it down (a small but significant increase from 23% in 2012).
The pattern was quite similar with respect to experiences of family violence since separation. Of the fathers in SRSP 2014 who had experienced physical violence since separating and had reached an agreement, 57% had written the agreement down. Of the fathers who had experienced emotional abuse since separating and had reached an agreement, 54% had written it down (a small but significant increase from 52% in 2012). Of the fathers who had not experienced violence in this period and had reached an agreement, 35% had written it down.
Of the mothers who had experienced physical violence since separation and had reached a parenting agreement, 48% had written the agreement down. Of the mothers who had experienced emotional abuse alone in this period and had reached an agreement, 39% had written it down. Of the mothers who had not experienced violence and had reached an agreement, 27% had written it down (a small but significant increase from 23% in 2012).
Among the parents whose parenting agreements were written down, Figure 4.2 shows the proportions of these that were formalised by a court, by whether parents had experienced family violence before/during and since separation. Among parents who had sorted out their parenting arrangements at the time of interview, a higher proportion of parents had their arrangement formalised by a court where they had experienced physical violence, compared to those who had experienced emotional abuse alone or no family violence. The results showed no statistically significant differences either between 2012 and 2014, or by parent gender.
Figure 4.2: Parenting agreements that were formalised by a court, by experiences of family violence before/during and since separation and parent gender, 2012 and 2014
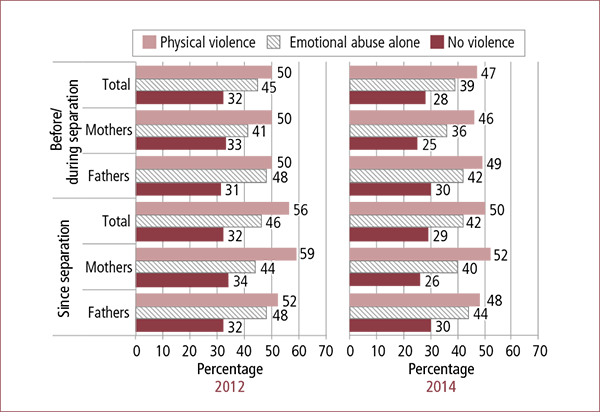
Notes: Data have been weighted. Statistically significant differences between 2012 and 2014 within a given population were not found. Statistically significant differences between mothers and fathers within a given population (years) were not found.
4.2.3 Main pathways for sorting out arrangements
The findings on service use and the characteristics of parents who relied on family law system services in both cohorts of the SRSP and the LSSF (Qu et al., 2014) consistently show that it is parents at the more complex end of the spectrum who rely on family law system services for assistance to resolve parenting arrangements after separation.
Parents participating in the SRSP 2012 and SRSP 2014 were asked about the main pathways that they had used in resolving their parenting arrangements. Table 4.8 shows no significant differences between cohorts with respect to the main pathways used, though differences between mothers and fathers in the 2014 cohort emerged. The table shows that where parenting arrangements had been sorted out, discussions with the focus parent was seen by a substantial majority of participants in both cohorts as the most common main pathway (69%). This is in line with what was reported in LSSF Wave 1, where 62% reported using "discussions" (Qu et al., 2014). Among the other formal options canvassed, "nothing specific, just happened" and "counselling/mediation/FDR services" each accounted for a further 9-10% of responses in both cohorts. Lawyers as main pathways represented the next most common response (6-7%), while courts were cited least often (3%).
With respect to the three professionally assisted main pathways in the 2014 cohort, the percentage difference between mothers' and fathers' reports were minimal. With respect to the "self-help" main pathways, it can be seen that mothers were less likely than fathers to cite "discussion with other parent" (mothers: 67% cf. fathers: 72%) and more likely to cite "nothing specific, just happened" (mothers: 13% cf. fathers: 8%), both of which are statistically significant findings.
| 2012 (%) | 2014 (%) | |||
|---|---|---|---|---|
| Total | Total | Fathers | Mothers | |
| Notes: Data have been weighted. The "don't know" and "refused" responses were excluded from this analysis (less than 1%). Percentages may not total 100.0% due to rounding. Differences between 2012 and 2014 were not statistically significant. Statistically significant differences between fathers and mothers within a given population are noted: † p < .05; †† p < .01; ††† p < .001. | ||||
| Counselling/mediation/FDR services | 9.5 | 9.9 | 9.9 | 9.9 |
| A lawyer | 6.5 | 5.7 | 6.2 | 5.3 |
| The courts | 3.4 | 2.9 | 3.0 | 2.9 |
| Discussions with other parent | 68.9 | 68.9 | 71.5 | 66.5 ††† |
| Nothing specific, just happened | 9.3 | 10.4 | 7.6 | 13.0 ††† |
| Something else | 2.3 | 2.1 | 1.8 | 2.4 |
| No. of observations | 4,428 | 4,108 | 1,869 | 2,239 |
Table 4.9 summarises how the experience of family violence before/during separation affects the main pathways used to sort out arrangements. The table illustrates how in situations of no family violence, discussions account for more than 80% of the main pathways for both cohorts. Indeed when this is combined with "nothing specific, just happened", the number of situations in which the main pathway towards resolution did not involve the use of professional services was 89-91%. Of the remaining parents, the most common pathway was counselling/ mediation/FDR services (6%), followed by lawyers (2-3%) and courts (1%).
The effects of experiencing physical violence or emotional abuse before/during separation can be seen in the appreciably lower rates of resolution via discussions (physical violence - 52-53%; emotional abuse - 64-65%). Parents who reported physical violence were the most likely of all to nominate using counselling/mediation/FDR services (14-15%), lawyers (10-12%) and courts (8%) as their main pathways towards resolution. Parents reporting emotional abuse nominated in-between rates of using counselling/mediation/FDR services (10-13%), lawyers (7-8%) and courts (3-4%) as their main pathways.
| Physical violence (%) | Emotional abuse alone (%) | No family violence (%) | ||||
|---|---|---|---|---|---|---|
| 2012 | 2014 | 2012 | 2014 | 2012 | 2014 | |
| Notes: Data have been weighted. The "don't know" and "refused" responses were excluded from this analysis (less than 1%). Percentages may not total 100.0% due to rounding. Statistically significant differences between 2012 and 2014 within a given population are noted: * p < .05; ** p < .01; *** p < .001. | ||||||
| Counselling/mediation /FDR service | 15.0 | 13.5 | 10.4 | 13.1 * | 6.1 | 5.6 |
| A lawyer | 10.4 | 11.5 | 8.3 | 7.3 | 3.0 | 1.8 * |
| The courts | 8.1 | 8.0 | 4.1 | 2.6 * | 0.6 | 0.9 |
| Discussions with focus parent | 52.7 | 52.2 | 65.0 | 63.5 | 80.3 | 81.0 |
| Nothing specific, just happened | 10.6 | 11.6 | 9.1 | 10.4 | 8.8 | 9.9 |
| Something else | 3.2 | 3.2 | 3.1 | 3.1 | 1.2 | 0.8 |
| No. of observations | 976 | 847 | 1,684 | 1,550 | 1,768 | 1,711 |
Table 4.10 reveals no significant difference between cohorts with respect to the main pathways used by those "in the process" of sorting out parenting arrangements. It can be seen that fewer than half (42-43%) nominated "discussions" as their main pathway. When "nothing specific, just happened" is added to discussions, both cohorts registered a small majority in this "self-help" category of main pathways (51-54%). Gender differences were small, with mothers being marginally more likely than fathers to report using both "discussions" and "nothing specific".
| 2012 (%) | 2014 (%) | |||
|---|---|---|---|---|
| Total | Total | Fathers | Mothers | |
| Notes: Data have been weighted. The "don't know" and "refused" responses were excluded from this analysis (< 1%). Percentages may not total 100.0% due to rounding. Differences between 2012 and 2014 and between mothers and fathers were not statistically significant. | ||||
| Counselling/mediation/FDR services | 14.5 | 13.8 | 13.2 | 14.5 |
| A lawyer | 14.9 | 16.7 | 17.4 | 15.9 |
| The courts | 14.4 | 17.0 | 18.7 | 15.0 |
| Discussions with focus parent | 42.9 | 42.2 | 41.6 | 43.0 |
| Nothing specific, just happened | 10.6 | 8.5 | 7.3 | 9.9 |
| Something else | 2.6 | 1.9 | 1.9 | 1.8 |
| No. of observations | 1,154 | 1,221 | 614 | 607 |
The 2012 cohort who were "in the process" of sorting out their parenting arrangements were almost equally likely to nominate counselling/mediation/FDR services (15%), lawyers (15%) and courts (14%) as their main pathways. The 2014 cohort were a little more inclined to favour lawyers and courts (each 17%) over counselling/mediation/FDR (14%) as their main pathway. Gender differences on these service dimensions were small, the largest difference being that of fathers being more likely than mothers to report courts as their main pathway (19% cf. 15% respectively).
Finally, a comparison of Table 4.10 with Table 4.8 reveals appreciably higher nominations of services (counselling/mediation/FDR, lawyers and courts) and correspondingly lower nominations of "self-help" (discussions/just happened) pathways by both cohorts of parents who were in the process of sorting out parenting arrangements, compared to parents who had sorted matters out.
4.3 Use of family law services
Consistent with the SRSP 2012, parents participating in the SRSP 2014 were asked about their use of family law services. These data are considered in this section and are also analysed by their experiences of family violence.
4.3.1 Family dispute resolution
Table 4.11 summarises data on at least one parent making an attempt at FDR. It shows the same proportions of cases in both cohorts in which at least one parent attempted FDR (38%) and where neither parent made an attempt (61-62%). Fathers in the 2014 cohort were significantly more likely than mothers to report making an attempt at FDR.
| 2012 (%) | 2014 (%) | |||
|---|---|---|---|---|
| Total | Total | Fathers | Mothers | |
| Notes: Data have been weighted. The "don't know" and "refused" responses were excluded from this analysis (less than 1%). Percentages may not total 100.0% due to rounding. Differences between 2012 and 2014 were not statistically significant. Statistically significant differences between fathers and mothers within a given population are noted: † p < .05; †† p < .01; ††† p < .001. | ||||
| At least one parent attempted | 37.8 | 37.6 | 40.6 | 34.7 ††† |
| Neither parent attempted | 61.3 | 62.4 | 59.4 | 65.3 |
| No. of observations | 6,064 | 6,038 | 2,793 | 3,245 |
Table 4.12 reveals that in both cohorts, more than one-third of parents reported reaching agreement following their engagement in FDR; however, there was still a statistically significant increase from 2012 (36%) to 2014 (41%). About a quarter (2012: 25% and 2014: 24%) were issued with a certificate that would have enabled these parents to litigate should they have wished to do so, while between a quarter in 2012 (24%) and a fifth in 2014 (19%) neither reached agreement nor received a certificate, with this decrease being one of statistical significance. A further 10% in 2012 and 12% in 2014 reported that FDR was still in progress. Reports with respect to outcomes for mothers and fathers in the 2014 cohort were very similar.
| 2012 (%) | 2014 (%) | |||
|---|---|---|---|---|
| Total | Total | Fathers | Mothers | |
| Notes: Data have been weighted. Cases where only the focus parent had attempted FDR were excluded from this analysis. Percentages may not total 100.0% due to rounding. Statistically significant differences between 2012 and 2014 within a given population are noted: * p < .05; ** p < .01; *** p < .001. Statistically significant differences between mothers and fathers were not found. | ||||
| Agreement reached | 35.9 | 41.3 *** | 41.4 | 41.1 |
| No agreement, certificate issued | 25.2 | 23.7 | 24.0 | 23.4 |
| No agreement, no certificate | 24.3 | 19.1 *** | 19.2 | 19.0 |
| No agreement, don't know if certificate issued | 1.5 | 1.0 | 0.8 | 1.2 |
| FDR/mediation in progress | 9.6 | 12.3 ** | 11.8 | 12.8 |
| Other outcome | 2.5 | 0.8 ** | 1.1 | 0.6 |
| Don't know outcome | 1.1 | 1.8 | 1.6 | 2.0 |
| No. of observations | 2,344 | 2,355 | 1,175 | 1,180 |
Table 4.13 examines outcomes of attempted FDR through the lens of whether or not family violence had occurred before/during separation. The data demonstrate that when no violence had been reported, parents attained the highest rates of agreement in both cohorts (2012: 44% and 2014: 53%), with a statistically significant increase reported by parents in the 2014 cohort. Where emotional abuse had been reported, agreement rates were a little less (2012: 36% and 2014: 39%), and where physical violence had been reported, agreement rates were also reduced (2012: 30% and 2014: 38%), though a greater proportion of parents in the 2014 cohort reached agreement in these circumstances.
| Physical violence (%) | Emotional abuse alone (%) | No family violence (%) | ||||
|---|---|---|---|---|---|---|
| 2012 | 2014 | 2012 | 2014 | 2012 | 2014 | |
| Notes: Data have been weighted. Cases where only the focus parent had attempted FDR were excluded from this analysis. Percentages may not total 100.0% due to rounding. Statistically significant differences between 2012 and 2014 within a given population are noted: * p < .05; ** p < .01; *** p < .001. | ||||||
| Agreement reached | 30.2 | 37.5 ** | 36.2 | 38.7 | 44.0 | 53.0 * |
| No agreement, certificate issued | 33.0 | 29.8 | 25.1 | 25.1 | 13.1 | 10.6 |
| No agreement, no certificate | 22.6 | 18.6 | 24.4 | 20.1 * | 26.5 | 18.1 ** |
| No agreement, don't know if certificate issued | 2.2 | 1.5 | 1.1 | 1.0 | 1.4 | 0.2 |
| FDR/ mediation in progress | 8.1 | 10.8 | 9.7 | 13.0 * | 11.7 | 13.1 |
| Other outcome | 2.9 | 0.2 *** | 2.6 | 0.6 *** | 1.6 | 2.4 |
| Don't know outcome | 1.0 | 1.6 | 0.9 | 1.5 | 1.7 | 2.6 |
| No. of observations | 821 | 853 | 1,038 | 1,050 | 485 | 453 |
The rate at which certificates had been issued was lowest for cases in which no violence had been reported (2012: 13% and 2014: 11%), higher in cases of reported emotional abuse (2012 and 2014: 25%), and highest in cases in which physical violence had been noted (2012: 33% and 2014: 30%).
No agreement/no certificate rates were reduced (some to a statistically significant extent) in the 2014 cohort in all three violence categories (no violence - 2012: 27% cf. 2014: 18%; emotional abuse - 2012: 24% cf. 2014: 20%; physical violence - 2012: 23% cf. 2014: 19%). Between 8% and 13% of the mediations were still in progress for both cohorts and for all categories of violence.
4.3.2 Legal services
Table 14.4 summarises the data on issues that lawyers helped with when parents consulted legal services. For all parents in both the 2012 and 2014 cohorts, help with property settlement was the most common issue (59-61%), followed by help with parenting arrangements (50-52%), court proceedings (22%), child support matters (19-20%), FDR services (12-13%) and protection orders (10%). Interestingly, more than a quarter of the responses (27-28%) were deemed by parents to fall into none of the above categories, but related to other divorce and separation matters. A small proportion (5-6%) reported receiving help that was unrelated to separation and divorce.
It will be seen that there was a high rate of consistency with respect to the percentages for each category in each cohort. Gender differences in the 2014 cohort were small but significant, with respect to reports of help with child support matters (fathers: 17% cf. mothers: 21%) and protection orders (fathers: 8% cf. mothers: 12%).
| 2012 (%) | 2014 (%) | |||
|---|---|---|---|---|
| Total | Total | Fathers | Mothers | |
| Notes: Data have been weighted. Five participants who did not provide a response were excluded from this analysis. Percentages do not sum to 100.0% as multiple responses could be chosen. Differences between 2012 and 2014 were not statistically significant. Statistically significant differences between mothers and fathers within a given population (years) are noted: † p < .05; †† p < .01; ††† p < .001. | ||||
| Property settlement | 60.8 | 59.2 | 58.7 | 59.7 |
| Parenting arrangements | 50.0 | 52.2 | 52.0 | 52.5 |
| Court proceedings | 22.4 | 22.3 | 23.4 | 21.2 |
| Child support matters | 20.0 | 18.6 | 16.6 | 20.5 †† |
| FDR services | 12.1 | 12.8 | 12.2 | 13.5 |
| Protection orders | 10.2 | 9.6 | 7.5 | 11.5 ††† |
| Other divorce/separation matters | 28.2 | 27.4 | 26.2 | 28.6 |
| None of these | 5.3 | 6.1 | 6.7 | 5.5 |
| No. of observations | 3,868 | 3,728 | 1,165 | 2,063 |
Table 4.15 summarises the data on issues that lawyers helped with when parents consulted legal services, considered against experiences of family violence before/during the separation.
The table reveals that help with parenting arrangements was the most common response for the 2012 and 2014 cohorts where there had been physical violence (59-60%). This was followed by property settlement (53-55%), court proceedings (30-31%), other divorce/separation matters (29%), child support matters (21-23%), protection orders (19%), FDR services (17-18%), and other matters (5-7%).
In the case of emotional abuse, lawyers helped most often with property settlements (63%), followed by parenting arrangements (50-53%), other divorce/separation matters (28-29%), court proceedings (22-23%), child support matters (19-20%), FDR services (12-13%), protection orders (7-8%), and other matters (5%).
Where no family violence had been reported, property settlements again accounted for the most common form of help for both the 2012 and 2014 cohorts (62-65%). This was followed by help for parenting arrangements (39-40%), other divorce/separation matters (25-26%), child support matters (16%), court proceedings (11%), other matters (7%), and protection orders (1-2%).
| Physical violence (%) | Emotional abuse alone (%) | No family violence (%) | ||||
|---|---|---|---|---|---|---|
| 2012 | 2014 | 2012 | 2014 | 2012 | 2014 | |
| Notes: Data have been weighted. Five participants who did not provide a response were excluded from this analysis. Percentages do not sum to 100.0% as multiple responses could be chosen. Statistically significant differences between 2012 and 2014 within a given population are noted: * p < .05; ** p < .01; *** p < .001. | ||||||
| Property settlement | 54.8 | 52.8 | 63.1 | 62.7 | 64.6 | 61.7 |
| Parenting arrangements | 59.1 | 60.1 | 49.7 | 52.8 | 38.9 | 39.7 |
| Court proceedings | 31.3 | 30.0 | 22.7 | 22.2 | 10.5 | 11.3 |
| Child support matters | 23.0 | 20.9 | 19.9 | 18.5 | 16.2 | 15.7 |
| FDR services | 16.7 | 17.7 | 12.3 | 13.0 | 5.7 | 5.6 |
| Protection orders | 19.3 | 19.2 | 8.0 | 6.9 | 2.3 | 1.0 * |
| Other divorce/separation matters | 29.0 | 28.5 | 29.0 | 27.7 | 25.6 | 25.4 |
| None of these | 4.9 | 7.1 * | 4.9 | 4.7 | 6.7 | 7.3 |
| No. of observations | 1,259 | 1,264 | 1,680 | 1,641 | 929 | 823 |
More broadly, help with property, followed by help with parenting arrangements, were sought most often by parents in both cohorts, except where physical violence had been reported before/during the separation. In the latter cases, help with parenting arrangements was sought somewhat more frequently than help with property. Where no violence had been reported, help with property was sought considerably more often (a ratio of roughly three consultations to two) than help with parenting arrangements. When emotional violence had been reported before/during separation, the gap between the ratio of property to parenting consultations was less (roughly six to five).
Help with court proceedings was clearly linked to the experience of violence before/during separation. Where no violence had been reported, only 11% of participants sought such help. When emotional abuse had been reported, this ratio roughly doubled (22-23%), and when physical violence had been experienced the ratio was almost three times (30-31%) the proportion of cases with no reported violence. In addition, help with FDR was associated with the experience of violence. It was sought relatively infrequently when no violence had occurred (6%), about twice as often (12-13%) in cases of emotional abuse, and almost three times as often (17-18%) when there had been physical violence.
Not surprisingly, help with protection orders was also strongly linked to experiences of violence, with such help being sought relatively rarely (1-2%) in cases where no violence was reported, from time to time (7-8%) when emotional abuse was experienced, but considerably more often (19%) in cases of physical violence.
Though not strongly associated with the experience of violence, help with child support matters was nonetheless most frequent in cases of physical violence (21-23%), a little less frequent in cases of emotional abuse (19-20%) and somewhat less frequent (16%) in cases of no reported violence.
Table 4.16 summarises the data on issues that lawyers helped with when parents consulted legal services, considered against family violence experienced since separation. The table reveals a pattern of responses similar to, though not quite the same as, those noted with respect to the experience of violence before/during separation.
Help with parenting arrangements was again the most common response for the 2012 and 2014 cohorts where there had been physical violence (61-62%). This was followed by property settlement (46-50%), court proceedings (33%), other divorce/separation matters (27%), protection orders (24-27%), child support matters (20-21%), FDR services (17-19%), and other matters (5-9%).
| Physical violence (%) | Emotional abuse alone (%) | No family violence (%) | ||||
|---|---|---|---|---|---|---|
| 2012 | 2014 | 2012 | 2014 | 2012 | 2014 | |
| Notes: Data have been weighted. Five participants who did not provide a response were excluded from this analysis. Percentages do not sum to 100.0% as multiple responses could be chosen. Statistically significant differences between 2012 and 2014 within a given population are noted: * p < .05; ** p < .01; *** p < .001. | ||||||
| Property settlement | 50.0 | 45.6 | 60.2 | 60.5 | 66.3 | 61.7 |
| Parenting arrangements | 60.9 | 61.6 | 54.6 | 55.7 | 35.5 | 39.7 |
| Court proceedings | 33.3 | 33.4 | 25.6 | 24.7 | 11.1 | 11.4 |
| Child support matters | 19.9 | 20.6 | 21.4 | 19.3 | 16.7 | 16.1 |
| FDR services | 16.8 | 18.5 | 14.4 | 14.9 | 5.0 | 5.3 |
| Protection orders | 23.7 | 26.6 | 11.0 | 9.4 | 3.1 | 2.9 |
| Other divorce/separation matters | 26.6 | 27.2 | 29.8 | 28.8 | 24.9 | 24.2 |
| None of these | 5.0 | 9.3 * | 5.1 | 5.1 | 6.1 | 7.3 |
| No. of observations | 395 | 380 | 2,428 | 2,431 | 1,045 | 917 |
In the case of emotional abuse, lawyers helped most often with property settlements (60-61%), followed by parenting arrangements (55-56%), other divorce/separation matters (29-30%), court proceedings (25-26%), child support matters (19-21%), FDR services (14-15%), protection orders (9-11%), and other matters (5%).
Where no family violence had been reported, property settlements again accounted for the most common form of help for both cohorts (62-66%). This was followed by parenting arrangements (36-40%), other divorce/separation matters (24-25%), child support matters (16-17%), court proceedings (11%), other matters (6-7%), and protection orders (3%).
More broadly, as with data on experiences of violence before/during separation, help with property, followed by help with parenting arrangements, was sought most often by parents in both cohorts, except where physical violence had been reported since separation. In the latter cases, help with parenting arrangements was sought somewhat more frequently than help with property. Where no violence had been reported since separation, help with property was sought considerably more often than help with parenting arrangements (ratios of close to two to one in the 2012 cohort and roughly three to two in the 2014 cohort). When emotional violence had been reported since separation, the gap between the ratio of property to parenting consultations was fairly small.
Help with court proceedings was again clearly linked to the experience of violence since separation. Where no violence had been reported, 11% of participants sought such help. When experiencing emotional abuse, this ratio more than doubled (25-26%), and when physical violence had been experienced the ratio was almost exactly three times (33%) that of court consultations in cases of no reported violence. In addition, help with FDR was associated with the experience of violence since separation. It was sought relatively infrequently (5%) when no violence had occurred, almost three times more often (14-15%) in cases of emotional abuse, and more than three times as often (17-19%) when there had been physical violence.
Again not surprisingly, help with protection orders was also strongly linked to experiences of violence since separation, with such help being sought relatively rarely (3%) in cases in which no violence was reported, fairly often (9-11%) when emotional abuse was experienced, and quite frequently (24-27%) in cases of physical violence.
Finally, help with child support matters occurred a little more often (19-21%) in cases of both physical violence and emotional abuse compared to cases of no reported violence (16-17%).
4.3.3 Court use
Figure 4.3 illustrates the link between mothers and fathers in the 2014 cohort accessing courts, and their experience of family violence before/during and since separation.9 The analysis shows no notable variation between parents' use of courts by their experiences of family violence in the two cohorts. However, in both cohorts, significantly more mothers than fathers who accessed the courts had experienced physical violence, while fathers who had accessed the courts were more likely than mothers to have experienced emotional abuse alone, or no family violence.
Figure 4.3: Parents who accessed the courts, by experiences of family violence before/during and since separation, by parent gender, 2014
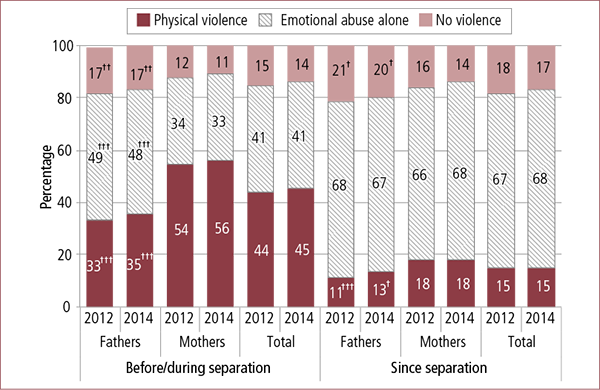
Notes: Data have been weighted. Statistically significant differences between 2012 and 2014 were not found. Statistically significant differences between mothers and fathers within a given population (years) are noted: † p < .05; †† p < .01; ††† p < .001.
Participating parents who reported using the court system were asked what their case was about. The data in Table 4.17 reveal that for both the 2012 and 2014 cohorts, children's care arrangements were easily the most common issue brought to courts (67-69%). For the 2012 cohort, division of property was the next most common issue (39%), followed by safety issues (36%) and then child support (13%). For the 2014 cohort, safety issues became the second most common issue, increasing to 41% (although this was not statistically significant). Division of property became the third most common issue (33%), with the decrease from 2012 being modest but statistically significant. Child support remained the fourth most common issue, representing a small but statistically significant decrease (from 13% to 11%) when compared to the 2012 cohort. Comparison of mothers' and fathers' responses showed that significantly more mothers in both cohorts named safety issues and care-time arrangements as the reasons for going to court.
Compared to those in the 2012 cohort, fathers in the 2014 cohort were somewhat less likely to seek help from courts with respect to division of property, the difference being statistically significant. Differences in other specified categories of assistance sought by fathers were small. Compared to those in the 2012 cohort, mothers in the 2014 cohort were somewhat less likely to seek help from courts with respect to child support, the difference being statistically significant. Differences in other specified categories of assistance sought by mothers did not reach statistical significance.
Finally, it will be seen that mothers in both cohorts were less likely than fathers to seek court assistance with child care arrangements, but more likely to seek help with respect to safety issues, child support and division of property.
| Total (%) | Fathers (%) | Mothers (%) | ||||
|---|---|---|---|---|---|---|
| 2012 | 2014 | 2012 | 2014 | 2012 | 2014 | |
| Notes: Data have been weighted. The "don't know" and "refused" responses were excluded from this analysis (n = 8). Percentages do not sum to 100.0% as multiple responses could be chosen. Statistically significant differences between 2012 and 2014 within a given population are noted: * p < .05; ** p < .01; *** p < .001. Statistically significant differences between mothers and fathers within a given population (years) are noted: † p < .05; †† p < .01; ††† p < .001. | ||||||
| Children's care arrangements | 69.1 | 66.8 | 72.6 | 70.5 | 65.3† | 62.8† |
| Division of property/finances | 39.4 | 32.5 ** | 38.9 | 31.6 * | 40.0 | 33.4 |
| Safety issues | 35.8 | 41.0 | 31.3 | 34.1 | 40.4† | 48.4††† |
| Child support/financial support for children | 12.5 | 10.5 * | 11.2 | 8.5 | 13.9 | 12.7 * |
| Something else | 4.8 | 8.7 ** | 3.3 | 9.0 ** | 6.4 | 8.5† |
| No. of observations | 771 | 794 | 771 | 794 | 392 | 402 |
Table 4.18 summarises the data on parents' use of the courts as a function of parents' experiences of family violence before/during separation. The table shows that 771 parents in the 2012 cohort and 770 parents in the 2014 cohort made use of courts. Based on a total of 6,119 participants in 2012 and 6,079 in 2014, this represents 13% of each cohort.
| Physical violence (%) | Emotional abuse alone (%) | No family violence (%) | ||||
|---|---|---|---|---|---|---|
| 2012 | 2014 | 2012 | 2014 | 2012 | 2014 | |
| Notes: Data have been weighted. The "don't know" and "refused" responses were excluded from this analysis (n = 8). Percentages do not sum to 100.0% as multiple responses could be chosen. Where population sizes within sub-groups were less than 50 data are not shown. Statistically significant differences between 2012 and 2014 within a given population are noted: * p < .05; ** p < .01; *** p < .001. Statistically significant differences between Mothers and Fathers within a given population (years) are noted: † p < .05; †† p < .01; ††† p < .001. | ||||||
| Total | ||||||
| Children's care arrangements | 70.2 | 64.2 | 69.5 | 69.7 | 59.6 | 70.0 |
| Division of property/finances | 33.3 | 31.2 | 46.7 | 34.5 ** | 43.3 | 31.7 |
| Safety issues | 44.1 | 53.5 * | 28.8 | 30.6 | 16.3 | 12.6 |
| Child support/financial support for children | 12.9 | 10.8 | 13.6 | 10.7 | 3.9 | 8.8 |
| Another reason | 4.4 | 7.2 | 4.8 | 8.5 | 7.6 | 18.1 |
| No. of observations | 409 | 409 | 301 | 291 | 61 | 70 |
| Fathers | ||||||
| Children's care arrangements | 77.0 | 71.0 | 71.0 | 69.8 | - | - |
| Division of property/finances | 29.9 | 30.6 | 45.8 | 33.1 | - | - |
| Safety issues | 39.9 | 46.3 | 27.7 | 28.6 | - | - |
| Child support/financial support for children | 10.2 | 8.4 | 13.5 | 10.1 | - | - |
| Another reason | 3.6 | 7.4 | 2.6 | 7.7 * | - | - |
| No. of observations | 152 | 166 | 185 | 178 | 40 | 48 |
| Mothers | ||||||
| Children's care arrangements | 65.7† | 59.6 † | 66.9 | 69.5 | - | - |
| Division of property/finances | 35.5 | 31.6 | 48.1 | 37.0 | - | - |
| Safety issues | 46.8 | 58.4 *† | 30.8 | 34.1 | - | - |
| Child support/financial support for children | 14.7 | 12.4 | 13.9 | 11.7 | - | - |
| Another reason | 4.9 | 7.1 | 8.7 † | 9.8 | - | - |
| No. of observations | 257 | 267 | 116 | 113 | 21 | 22 |
Based on these numbers, it can be deduced that courts were used least often (less than 1% of the total cohort in both cases) when no family violence had been experienced before/during separation. They were used by 5% of both cohorts in cases of emotional abuse and by 7% of both cohorts in cases of physical violence.
The table shows that, compared to 2012, there was a modest but statistically significant increase in the proportion of safety issues brought to court by parents in the 2014 cohort (2012: 44% cf. 2014: 54%) in cases of physical violence. This difference was mainly a function of the statistically significant increase in cases brought by mothers (2012: 47% cf. 2014: 58%), rather than by fathers (2012: 40% cf. 2014: 46%, which is not significant).
Among parents who had experienced physical violence before/during separation, there were no other statistically significant differences in categories of cases brought in 2012 and 2014. In both these cohorts, children's care arrangements were brought to court most often (64-70%). Fathers were more likely to have this concern than mothers (fathers: 71-77% cf. mothers: 60-66%). Safety issues were next most frequent (44-54%), with mothers more likely to have this concern (mothers: 47-58% cf. fathers: 40-46%). Division of property/finances was the next most common concern (mothers: 32-36% and fathers: 30-31%), followed by child support/financial support for children (11-13%), which was sought a little more often by mothers (12-15%) than fathers (8-10%).
With respect to emotional abuse, Table 4.18 shows a modest statistically significant decrease in the proportion of property and financial issues brought to court by parents in the 2014 cohort (2012: 47% cf. 2014: 35%).
In both the 2012 and 2014 cohorts, mothers and fathers who had experienced emotional abuse before/during separation were most likely to bring child care arrangement cases to court (70%). There were relatively minor differences evident between mothers (67-70%) and fathers (70-71%). The next most common type of case was division of property (35-47%), with mothers being a little more likely to have made these applications (37-48%) than fathers (33-46%). This was followed by safety issues (29-31%), which were somewhat more frequently reported by mothers (31-34%) than fathers (28-29%). Child support issues were least commonly reported (11-14%), with the difference between mothers (12-14%) and fathers (10-14%) being small.
A similar order of issues was evident for parents experiencing "no violence" as for those who experienced some form of violence. Thus, child care arrangements was again the most common issue, followed by division of property. However, it is important to note that the number of parents who experienced "no violence" and went to court was too small to sustain reliable analysis in each cohort.
4.4 Parents' experiences of fear, coercion and control, and their use of family law services to sort out parenting arrangements
Analysis was undertaken to examine whether the patterns of service use varied among parents who experienced family violence involving fear, coercion and control. Figure 4.4 shows the distribution of parents' experiences of fear, coercion and control among those who had experienced family violence before/during separation and had sorted out their parenting arrangements at the time of the SRSP 2014 interview. For all pathways, mothers were significantly more likely than fathers to report that they had experienced all three of these types of family violence (fear, coercion and control).
Figure 4.4: Experience of fear, coercion and control by parents who experienced family violence before/during separation and had sorted out arrangements, by main pathway used for parenting arrangements and parent gender, 2014

Notes: Data have been weighted. The "don't know" and "refused" responses were excluded from this analysis (n = 8). Percentages may not sum to 100.0% due to rounding. Statistically significant differences between mothers and fathers within a given population are noted: † p < .05; †† p < .01; ††† p < .001.
Among those who used the three formal pathways (FDR, lawyers and courts), the majority of mothers who had experienced family violence before/during separation reported feeling fearful, coerced and controlled by their former partner (mothers: 71-86% cf. fathers: 48-59%). For all pathways except going to court, significantly higher proportions of fathers than mothers reported feeling two of these emotions in relation to the family violence they had experienced before/during separation. This may be related to the finding in Figure 3.14, where significantly fewer fathers reported having felt fearful of the focus parent before/during separation (43% of fathers reported never feeling fearful, compared to 21% of mothers; a significant difference). Among parents who had experienced family violence before/during separation whose main pathway to sorting out parenting arrangements was the court system, one in five fathers reported never having felt fearful, coerced or controlled, significantly higher than the 1% of mothers who reported this. Among the same group, significantly higher proportions of fathers than mothers reported that one of these experiences had occurred (fathers: 11% cf. mothers: 2%). Conversely, the vast majority of mothers who had experienced family violence before/during separation reported having experienced fear, coercion and control (mothers: 86% cf. fathers: 55%).
Figure 4.5 shows parents' experiences of fear, coercion and control since separation in the context of the main pathway they used to sort out their parenting arrangements. The results show that significantly higher proportions of mothers than fathers who used FDR or lawyers had experienced fear, coercion and control since separation.
In the examination of the informal pathways nominated by parents (discussions with the other parent and "nothing specific, it just happened"), significantly more fathers than mothers reported that two of these experiences (fear, coercion or control) had occurred. For both of these informal pathways, higher proportions of mother than fathers had experienced all three of these types of family violence, though these differences were not significant.
Figure 4.5: Experience of fear, coercion and control parents experienced by parents who experienced family violence since separation and had sorted out arrangements, by main pathway used for parenting arrangements and parent gender, 2014
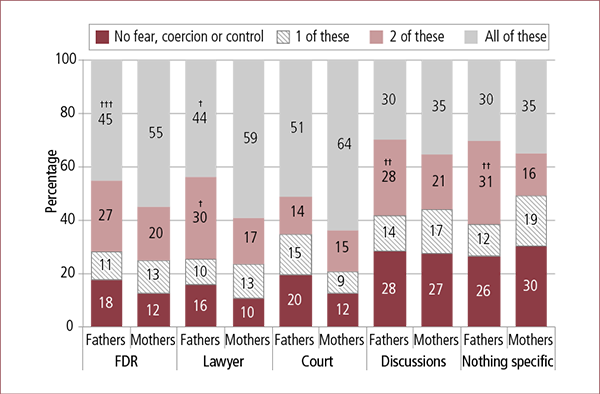
Notes: Data have been weighted. The "don't know" and "refused" responses were excluded from this analysis (n = 8). Percentages may not sum to 100.0% due to rounding. Statistically significant differences between mothers and fathers within a given population are noted: † p < .05; †† p < .01; ††† p < .001.
4.5 Summary
4.5.1 Service use at the time of separation
Compared to the 2012 cohort of parents, the 2014 cohort made a little less use of counselling, relationships and FDR services, or of lawyers and legal services at the time of separation. This was not countered by increased use of support by family members or by increased use of the two other specified services - domestic violence services and courts. Rather, there was a modest increase in the 2014 cohort parents' reports of making no use of services or supports.
In both cohorts, parents who experienced physical violence before/during separation were the heaviest users of all family law services, as well as the most likely to make use of support from family members. Parents who experienced no violence were the least likely to use any services and were also the least likely to make use of support from family members. Parents who experienced emotional abuse fell in between in their use of services and support from family members.
Among parents who had experienced physical violence or emotional abuse, there were no significant differences between cohorts with respect to service use or support from family members. However, parents in the 2014 cohort who had not experienced family violence were significantly less likely than their 2012 counterparts to make use of non-court services or receive family support and significantly more likely to make use of no services or family support.
Though fewer in number, parents who had experienced physical violence since separation, were again the heaviest users of all family law services as well as the most likely to make use of support from family members. Parents who had experienced no violence were again the least heavy users of all services and were the least likely to make use of support from family members. This was especially the case with respect to the 2014 cohort, who apart from their use of courts, made statistically significantly less use of counselling/relationship/FDR services, lawyers and legal services, as well as support from family members. Parents who had experienced emotional abuse fell in between in their use of services and support from family members.
Among parents who had experienced physical violence or emotional abuse, the only statistically significant difference between cohorts with respect to service use or support from family members was in the use of counselling/relationship/FDR services by the 2014 cohort of parents who experienced physical violence. Just over 77% of these parents had used one of these services in 2012, compared to just under 71% in 2014.
4.5.2 Sorting out arrangements after separation
Compared to the 2012 cohort, the 2014 cohort of parents was a little less likely to report having sorted out parenting arrangements (2012: 74% cf. 2014: 71%). This statistically significant decrease was reflected in increased reports of being in the process of sorting things out (2012: 19% cf. 2014: 21%) and not having sorted matters out (2012: 7% cf. 2014: 8%). Compared to fathers, mothers in the 2014 cohort were a little more likely to have reported that parenting matters had been sorted out (fathers: 69% cf. mothers: 74%).
In both cohorts, mothers' and fathers' reports of the experience of physical violence before/during separation were associated with the poorest chances of sorting out parenting arrangements (fathers: 51-54% and mothers: 59-66%). Reports of emotional abuse were associated with somewhat better chances of sorting out parenting (fathers: 64-67% and mothers: 72-74%). Parenting was most likely to have been sorted out when no family violence had been reported (fathers: 81-85% and mothers: 87%). The reverse pattern could be observed for the categories of "in the process of sorting out" and "nothing sorted out": physical violence was associated with the highest percentages of "being in the process" and "nothing sorted out", followed in decreasing order by emotional abuse and no violence.
Though, as noted earlier, absolute numbers were considerably lower, mothers' and fathers' reports in the 2012 and 2014 cohorts of the experience of physical violence since separation were similarly associated with the poorest chances of sorting out parenting arrangements (fathers: 45-60% and mothers: 57-59%). Again, reports of emotional abuse were associated with somewhat better chances of sorting out parenting (fathers: 59-62% and mothers: 66-70%). Parenting was most likely to have been sorted out when there had been no family violence (fathers: 84-86% and mothers: 87%). Again, the reverse pattern could be observed for the categories of "in the process of sorting out" and "nothing sorted out": physical violence was associated with the highest percentages of "being in the process" and "nothing sorted out", followed in decreasing order by emotional abuse and no violence.
Of the parents who reported that their arrangements had been sorted out, a minority of parents in both cohorts (39-41%) wrote down agreements made outside of court processes, and a minority (38-42%) had a written agreement formalised by the court. Mothers in the 2014 cohort were a little less likely than fathers to report written agreements (mothers: 37% cf. fathers: 45%) and marginally less likely to report written court-related agreements (mothers: 36% cf. fathers: 39%). The data also indicate that the decision to write down a parenting agreement was linked to whether parents experienced family violence, both before/during and since separation.
4.5.3 Main pathways for sorting out parenting arrangements
Where parenting arrangements had been sorted out, the main pathway towards this was seen by both cohorts to be "discussions with the other parent" in almost seven out of ten cases. "Nothing specific, just happened" and "counselling/mediation/FDR" each accounted for roughly a further one in ten responses. Main pathways for the remaining cases were made up of lawyers (about 6%) and courts (about 3%). In the 2014 cohort, fathers were a little more likely to nominate "discussions with the other parent" and mothers a little more likely to nominate, "nothing specific, just happened". Both these categories are, of course, personal constructions. It is possible that they may reflect a modest gender difference in the threshold for defining communications as "discussions" rather than "just happening".
The capacity to sort out parenting arrangements via the "self-help" routes of "discussions" or "nothing specific just happened" is linked to the experience of violence before/during the separation. Where no violence had occurred, only about ten per cent of parents who had sorted out these arrangements nominated professional help as their main pathway, with counselling/mediation/FDR services accounting for most of these, followed by lawyers and then courts.
Where emotional abuse had occurred before/during the separation, the "self-help" main pathway accounted for roughly three-quarters of the arrangements that had been sorted out, with the remainder needing the assistance of counselling/mediation/FDR services, lawyers and courts in decreasing order. Where physical violence had occurred, the "self-help" main pathway accounted for a little less than two-thirds of the arrangements that had been sorted out, with the remainder needing the assistance of counselling/mediation/FDR services, lawyers and courts, again in decreasing order. Among these parents, there were no significant differences in main pathways between cohorts.
There were appreciably higher nominations of professional services (counselling/mediation/ FDR, lawyers and courts) and correspondingly lower nominations of "self-help" (discussions/just happened) by both cohorts of parents who were in the process of sorting out children's arrangements, compared to parents who had finished sorting these matters out. Thus, a little over two in five parents in both cohorts who were in the process of sorting out arrangements nominated "discussions" as their main pathway. When "nothing specific, just happened" was added, a little over half of these parents were in the "self-help" category. The remainder relied on professional help as their main pathway, using counselling/mediation/FDR, lawyers and courts in roughly equal proportions. There were no statistically significant differences between cohorts in these parents' nominations of main pathways.
4.5.4 Use of family law services
Family dispute resolution
In both cohorts, 38% of parents indicated that at least one of them had made an attempt at FDR. In the 2014 cohort, fathers were more likely than mothers to report making an attempt at FDR, with this difference reaching a level of statistical significance.
In both cohorts, more than a third of parents reported reaching agreement following their engagement in FDR. A significantly greater proportion of parents in the 2014 cohort (41%) reached an agreement through FDR than in the 2012 cohort (36%). About a quarter (24-25%) were issued with a certificate that would have enabled these parents to litigate had they wished to do so, while between almost one-quarter in 2012 (24%) and one-fifth in 2014 (19%) did not reach agreement but did not receive a certificate. Reports with respect to outcomes by mothers and fathers in the 2014 cohort were very similar.
The highest rates of reaching agreement via FDR by parents in both cohorts (2012: 44% and 2014: 53%) were in situations in which no violence had been reported. Where emotional abuse had been reported, agreement rates were lower (2012: 38% and 2014: 39%), as were agreement rates where physical violence had been reported (2012: 30% and 2014: 38%). There was a statistically significant increase between cohorts in agreements reached via FDR where parents had reported physical violence.
The proportions of certificates being issued were lowest for cases in which no violence had been reported (11-13%), higher in cases of reported emotional abuse (25%), and highest in cases in which physical violence had been reported (30-33%). Of note, no agreement/no certificate rates were higher in the 2012 cohort in all three categories compared with the 2014 cohort.
Legal services
In both cohorts, help with property was the assistance most commonly sought from legal services, followed by help with parenting arrangements, court proceedings, child support, FDR services and protection orders. Intriguingly, more than a quarter of parents in both cohorts sought help not covered by the above categories and about one in twenty sought help not related to separation or divorce.
Where physical violence had been experienced before/during separation, legal services most often offered assistance with parenting arrangements for parents in both cohorts. This was followed by property settlement, court proceedings, other divorce/separation matters, child support matters, protection orders, FDR services and other matters. In the case of emotional abuse experienced before/during separation, help was most often sought by parents in both cohorts for property settlements. This was followed by parenting arrangements, other divorce/separation matters, court proceedings, child support matters, FDR services, protection orders and other matters. Where no family violence had been reported, property settlements again accounted for the most common form of help for both the 2012 and 2014 cohorts. This was followed by help with parenting arrangements, other divorce/separation matters, child support matters, court proceedings, other matters and protection orders.
Thus, help with property, followed by help with parenting arrangements, were sought most often by parents in both cohorts, except where physical violence had been reported before/during the separation. In the latter cases, help with parenting arrangements was sought somewhat more frequently than help with property.
The pattern of legal services delivery in cases in which physical violence or emotional abuse had been experienced since separation followed a pattern similar, though not identical, to cases in which family violence had been experienced before/during separation.
Help with parenting arrangements was again the most commonly sought assistance in both cohorts for parents who had experienced physical violence since separation. This was followed by property settlement, court, other divorce/separation matters, protection orders, child support matters, FDR services and other matters. In the case of emotional abuse, help from legal services was most often reported with respect to property settlements, followed by parenting arrangements, other divorce/separation matters, court proceedings, child support matters, FDR services, protection orders and other matters. Where no family violence had been reported, property settlements again accounted for the most common form of help for both cohorts. This was followed by parenting arrangements, other divorce/separation matters, child support matters, court proceedings, other matters and protection orders.
As with data on experiences of violence before/during separation, help with property followed by help with parenting arrangements was sought most often by parents in both cohorts except where physical violence had been reported since separation. In these cases, help with parenting arrangements was sought somewhat more frequently than help with property.
Court use
Courts were used least often (less than 1% of the total cohort in both cohorts) when no family violence had been experienced before/during separation. They were used by 5% of both cohorts in cases of emotional abuse and by 7% of both cohorts in cases of physical violence.
For both cohorts, parenting arrangements were easily the most common issue brought to courts. For the 2012 cohort, division of property was the next most common issue, followed by safety issues and then child support. Although for the 2014 cohort, safety issues became the second most common issue, the increase in the proportion compared to the 2012 cohort was not statistically significant. For the 2014 cohort, division of property became the third most common issue. Child support remained the fourth most common issue dealt with by the courts in the 2014 cohort, representing a small but statistically significant decrease (from 13% to 11%) when compared to the 2012 cohort.
Compared to those in the 2012 cohort, fathers in the 2014 cohort were somewhat less likely than mothers to seek help from courts with respect to division of property, the difference being statistically significant. Cohort differences in other specified categories of assistance sought by fathers were small. Compared to those in the 2012 cohort, mothers in the 2014 cohort were somewhat less likely to seek help from courts with respect to child support, the difference being statistically significant. Cohort differences in other specified categories of assistance sought by mothers did not reach statistical significance.
Parents in the 2014 cohort who had experienced physical violence before/during separation were significantly more likely to bring safety issues to court hearings than were their 2012 counterparts (2014: 54% cf. 2012: 44%), the statistical significance being mainly a function of the increases in cases brought by mothers. Other cohort differences for these parents did not reach statistical significance.
In both the 2012 and 2014 cohorts, mothers and fathers who had experienced physical violence before/during separation were most likely to bring parenting arrangement cases to court. Fathers in each cohort were more likely to have this concern than mothers. Safety issues were next most common, with mothers in both cohorts being more likely to bring this concern. Division of property was the next most common, with mothers in both cohorts a little more likely than fathers to bring this issue to court. The least likely of the specified issues to be brought to court was child support, with mothers in both cohorts also more likely than fathers to have this concern.
Among parents who experienced emotional abuse before/during separation, there was a modest but statistically significant decrease in the proportion of property and financial issues brought to court in 2014 compared to 2012. For this group of parents, other differences between cohorts did not reach statistical significance.
In both the 2012 and 2014 cohorts, mothers and fathers who had experienced emotional abuse before/during separation were most likely to bring parenting arrangement cases to court with relatively minor differences evident between mothers and fathers. The next most common was division of property, mothers in both cohorts being a little more likely to have made these applications. This was followed in frequency by safety issues, a little more of which were reported by mothers than fathers. Child support issues were again least commonly brought to court, with little difference between mothers and fathers in this regard.
Parents who experienced no family violence before/during separation showed no statistically significant differences in categories of cases brought to court.
A similar hierarchy of issues was evident for this group, as for those parents who experienced some form of violence. Again, child care arrangements was the most common category, with fathers in both cohorts being more inclined than mothers to provide this response. Division of property was next most common, with mothers in both cohorts more likely to pursue this issue. Though no violence had been reported by this group, safety concerns were raised in court by roughly one in six of these parents in both cohorts. Finally, a handful of these fathers and mothers in both cohorts raided child support issues.
These findings build on a separate analysis of SRSP 2012 data that examined the parenting arrangement resolution pathways among those who reported problems indicative of complexity. Parents in the SRSP 2012 were asked whether the following issues were present in their situation: problematic alcohol or drug use, mental ill health, gambling, problematic Internet or social media use, emotional abuse or safety concerns. The analysis showed the following notable findings:
- of the parents who used court, 93% reported a history of emotional abuse, 41% a history of physical hurt, 44% ongoing safety concerns for themselves and/or the child as a result of ongoing contact with the other parent, and 55% mental health issues;
- of the parents who used lawyers, 80% reported a history of emotional abuse, 28% a history of physical hurt, 24% safety concerns, and 41% mental health issues; and
- of the parents who used FDR, 73% reported emotional abuse, 25% physical hurt, 18% safety concerns, and 41% mental health issues (Kaspiew & Qu, 2014).
These data demonstrate that families with complex issues are dealt with across the system but are particularly concentrated in the court caseload. This is reinforced by the analysis assessing the pathways used by parents reporting multiple instances of the specified problems, which shows that parents with four or more problems were most likely to use courts (42%). In comparison, 23% of the group who used FDR and 29% of the group who used lawyers had four or more problems. The mean number of problems among court users was 3.1, compared with 2.5 for lawyers, 2.2 for FDR, 1.8 for "just happened" and 1.5 for "discussions".
Together, these findings underline an issue of central relevance to the objectives of the 2012 family violence reforms: children in families that use formal services to resolve their parenting arrangements are being cared for in circumstances where a range of complex dynamics are relevant. This is particularly true for those children whose parents rely on family law courts.
4.5.5 Pathways to sorting out parenting arrangements in the context of fear, coercion and control
Among parents who had experienced family violence before/during separation, the proportions of those who reported that the family violence caused them to feel fearful, coerced and controlled was far higher among those who used formal pathways to sort out their parenting arrangements. Moreover, across all pathways, significantly higher proportions of mothers than fathers reported having experienced fear, coercion and control, while more fathers than mothers reported having experienced none, one or two of these. These gender differences were also present among parents' experiences of fear, coercion or control since separation, though not as pronounced as the differences that occurred in their experiences before/during separation. It could be speculated that these differences may be due to the significantly smaller proportion of fathers who reported that the family violence they had experienced made them feel fearful.
9 Accessing courts may include obtaining information or being involved more substantively in court processes, and may also include state/territory magistrate's courts.
One of the key aims of the 2012 family violence amendments was to support the disclosure of concerns relating to family violence and safety through the introduction of provisions requiring parties to disclose and professionals to ask about these concerns (see Chapter 1). Together with a general exploration of disclosure to services both within and outside of the family law system, this chapter sets out findings on the extent of any changes to the ways in which professionals ask about family violence and safety concerns, and parents report disclosing them. Additionally, the consequences of disclosure are explored through an examination of findings from survey questions asking parents what happened as a result of their disclosure.
The discussion is based on a comparison of SRSP 2012 and 2014 findings. The first section explores whether parents reported their experiences of family violence to a range of services and organisations not limited to the family law system, together with their reasons for not reporting. The second explores the extent to which these experiences were asked about and disclosed when using family law system services. The third examines what happened as a result of the disclosure. Each section compares pre- and post-reform response patterns.
Note that in this chapter 2012 data by gender are not always shown in the figures and tables, but may be mentioned in the text. In each case, readers are directed to the relevant table or figure in the SRSP 2012 final report (De Maio et al., 2013) for full details.
5.1 Disclosure of family violence to police and other services
Parents in the two survey cohorts who reported any experiences of family violence (physical violence or emotional abuse alone) before/during or since separation were also asked if they had disclosed10 any of these behaviours or incidents to the police or sought help from health care professionals, family service providers or family law system professionals regarding these issues.
5.1.1 Disclosure of family violence and emotional abuse
Comparison of the SRSP 2012 and 2014 data (see Figure 5.1 and Table 5.1) shows a slight increase in rates of disclosure of family violence experienced at any time before/during or since separation. In both cohorts, higher proportions of both fathers and mothers who experienced physical violence at any time disclosed this to police or other services, compared with parents who experienced emotional abuse alone. Higher proportions of mothers than fathers disclosed family violence to professionals in both the 2012 and 2014 cohorts.
Fathers' disclosures of physical violence increased from 57% in 2012 to 63% in 2014, while the proportion who disclosed experiencing emotional abuse alone increased from 45% in 2012 to 48% in 2014. The proportion of mothers who disclosed physical violence remained relatively unchanged between 2012 and 2014 (79% and 78% respectively); however, the proportion who disclosed emotional abuse increased significantly between 2012 and 2014 (56% and 61% respectively).
Figure 5.1: Parents who disclosed to police and other services that they had experienced family violence before/during or since separation, by type of violence and parent gender, 2012 and 2014
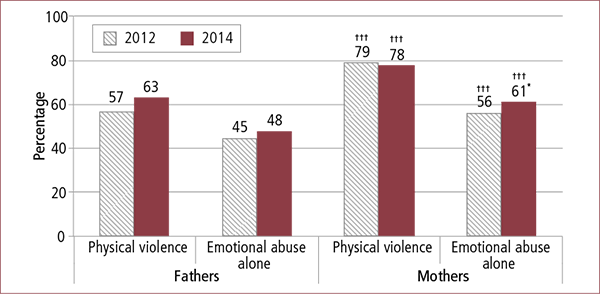
Notes: Data have been weighted. Statistically significant differences between 2012 and 2014 within a given population are noted: * p < .05; ** p < .01; *** p < .001. Statistically significant differences between mothers and fathers within a given population (years) are noted: † p < .05; †† p < .01; ††† p < .001.
Table 5.1 shows that in 2012, slightly more than one half (53%) of parents reported that they had disclosed family violence to the police or other services. The corresponding proportion in the 2014 cohort was slightly higher at 56%. This means that substantial minorities of parents (2012: 47% and 2014: 44%) had not reported their experience of family violence to any professional, and this was more common in relation to emotional abuse than for physical violence. A higher proportion of mothers (63%) disclosed family violence compared to fathers (49%) in 2014. This difference by gender was similar to the 2012 data.
| 2012 (%) | 2014 (%) | |||
|---|---|---|---|---|
| Total | Total | Fathers | Mothers | |
| Notes: Data have been weighted. Percentages in the top panel do not sum to 100.0% as multiple responses could be chosen. Percentages in the bottom panel may not total 100.0% due to rounding. Statistically significant differences between 2012 and 2014 within a given population are noted: * p < .05; ** p < .01; *** p < .001. Statistically significant differences between mothers and fathers within a given population (2014) are noted: † p < .05; †† p < .01; ††† p < .001. | ||||
| Total who disclosed family violence | 53.2 | 56.4 ** | 48.8 | 63.1 |
| Service/professional disclosed to: | ||||
| Police | 24.2 | 24.6 | 18.2 | 30.3 ††† |
| Counsellor | 19.0 | 17.7 | 13.5 | 21.4 ††† |
| Psychologist/psychiatrist | 11.5 | 14.1 *** | 11.5 | 16.5 ††† |
| Doctor/GP (inc. hospital admission) | 9.6 | 9.4 | 6.0 | 12.3 ††† |
| Lawyer | 8.1 | 8.7 | 9.0 | 8.3 |
| Other support service (inc. phone help line) | 4.0 | 4.7 | 5.0 | 4.5 |
| Mediation/FDR services | 4.0 | 4.6 | 4.5 | 4.7 |
| Domestic/family violence service | 3.7 | 4.1 | 1.6 | 6.3 ††† |
| Other family relationship support service | 2.9 | 2.7 | 2.6 | 2.8 |
| Other relationship service | 1.1 | 2.6 *** | 2.5 | 2.7 |
| Family Relationship Centre | 2.6 | 2.4 | 2.8 | 2.1 |
| Court staff | 1.9 | 1.9 | 1.7 | 2.2 |
| Judge/magistrate | 0.8 | 1.0 | 0.9 | 1.2 |
| Cultural/religious leader | 0.6 | 0.6 | 0.6 | 0.7 |
| No. of observations | 4,468 | 4,375 | 1,913 | 2,462 |
| No. of services/professionals disclosed to: | ||||
| One | 57.8 | 56.4 | 60.2 | 53.9 |
| Two | 24.8 | 25.1 | 23.9 | 25.8 |
| Three or more | 17.4 | 18.5 | 15.9 | 20.3 |
| No. of observations | 2,446 | 2,546 | 952 | 1,594 |
Table 5.1 also shows the specific services/professionals to which each cohort of parents reported disclosing family violence. Similar patterns are evident for each cohort, with close to a quarter of parents in 2012 and 2014 indicating that they had reported family violence to police, the most common professional nominated. When comparing cohorts, more parents nominated psychologists and psychiatrists in 2014 (2012: 12% cf. 2014: 14%), a statistically significant difference.
Mothers in each cohort were more likely to disclose family violence than fathers, but rates increased between 2012 and 2014 for both mothers and fathers, and to a greater extent for fathers than mothers. In 2014, 63% of mothers reported disclosing to at least one professional, compared with 61% in 2012. For fathers, an increase of four percentage points in their disclosures to at least one professional occurred: 49% in 2014 compared with 44% in 2012 (2012 gender data not shown; see De Maio et al., 2013, Table 5.1).
The majority of parents disclosed family violence to only one service/professional (56%) in 2014; however, there was a tendency for mothers to report a higher rate of disclosure to two or more organisations compared to fathers (46% cf. 40% respectively). This mirrors earlier findings from the 2012 data (45% cf. 37%, data not shown).
5.1.2 Reasons for non-disclosure of family violence to police or other services
The previous section established that a sizable minority of parents in each cohort who experienced family violence chose not to disclose these incidents to police or other services. The reasons for this are of particular interest in the context of family law reforms intended to support greater disclosure. Other analyses have identified a range of reasons why individuals may not disclose, including having feelings of shame or low self-esteem. Victims of violence may also believe that they won't be believed, feel powerless, or fear further violence if they disclose violent incidents (ALRC & NSWLRC, 2010).
Data from the SRSP 2012 and 2014 support further understanding of this question and suggest subtle shifts in behaviour in this context between the two time frames, although the overall patterns in responses remained consistent. In each survey, parents who had not disclosed the family violence that they reported to have experienced were asked to nominate which of 17 specific reasons (ranging from attitudinal to practical) was relevant to them, with multiple selections being available. The most common reason nominated in each time frame was that the experience of family violence "was not serious enough to report" (Table 5.2). Although this remained the most common response nominated in 2014, fewer parents nominated this reason than in 2012 (43% cf. 2014: 38%). A drop in fathers selecting this response accounts mainly for the overall decrease (2012: 44% cf. 2014: 36%), while among mothers the change was negligible (2012: 41% cf. 2014: 40%) (2012 gender data not shown; see De Maio et al., 2013, Table 5.2).
| 2012 (%) | 2014 (%) | |||
|---|---|---|---|---|
| Total | Total | Fathers | Mothers | |
| Notes: Data have been weighted. Percentages in the top panel do not sum to 100.0% as multiple responses could be chosen. Percentages in the bottom panel may not total 100.0% due to rounding. Statistically significant differences between 2012 and 2014 within a given population are noted: * p < .05; ** p < .01; *** p < .001. Statistically significant differences between mothers and fathers within a given population (years) are noted: † p < .05; †† p < .01; ††† p < .001. | ||||
| Reasons for not disclosing family violence or seeking help | ||||
| Not serious enough to report | 42.6 | 38.1 | 36.3 | 40.2 |
| Felt you could deal with it yourself | 22.1 | 23.5 | 24.7 | 22.1 |
| Did not need or want service | 11.4 | 15.4 | 18.0 | 12.2 †† |
| Did not want to cause trouble | 5.2 | 7.5 | 6.9 | 8.2 |
| Did not want to ask for help | 4.0 | 3.3 | 2.4 | 4.3 † |
| Did not think they could help | 3.7 | 4.9 | 5.6 | 4.0 |
| Received help from family or friends | 2.8 | 3.5 | 3.0 | 4.2 |
| Fear of focus parent | 1.5 | 3.0 | 1.5 | 4.7 ††† |
| Shame or embarrassment | 2.1 | 2.0 | 1.9 | 2.2 |
| Would not be believed | 2.3 | 1.9 | 2.2 | 1.5 |
| Did not know of any services | 1.4 | 1.9 | 2.1 | 1.7 |
| Focus parent prevented me | 0.5 | 0.9 | 0.9 | 1.0 |
| Couldn't afford it | 0.4 | 0.7 | 0.8 | 0.5 |
| Cultural reasons | 0.3 | 0.7 | 1.0 | 0.3 |
| Unable to contact service | 0.3 | 0.2 | 0.1 | 0.3 |
| Language reasons | 0.0 | 0.2 | - | 0.4† |
| Couldn't get an appointment | - | 0.1 | 0.2 | 0.1 |
| Other reason | 12.4 | 7.5 | 7.3 | 7.7 |
| No. of observations | 2,022 | 1,829 | 961 | 868 |
| How many reasons given for not disclosing violence? | ||||
| One of these reasons | 82.1 | 78.7 | 78.9 | 78.4 |
| Two of these reasons | 14.1 | 17.1 | 17.0 | 17.3 |
| Three or more of these reasons | 3.8 | 4.2 | 4.1 | 4.3 |
| No. of observations | 1,858 | 1,674 | 881 | 793 |
In almost one-quarter of cases for each cohort, the participant did not disclose because they felt they could deal with it themselves (2012: 22% and 2014: 24%). Subtle changes were evident in the proportions of parents selecting the third most common response - that "they did not need or want a service" - with 15% of parents choosing this answer in 2014, compared with 11% in 2012. An increase among fathers choosing this response accounts for most the difference (2012: 12% cf. 2014: 18%; 2012 gender data not shown; see De Maio et al., 2013, Table 5.2).
Notably, reasons associated with negative subjective states were nominated by consistently small minorities of parents in both time frames. Fear was almost twice as likely to be selected in 2014 than 2012 (3% cf. 2%), and by more mothers than fathers, with the 2014 increase reflecting an increase among mothers rather than fathers. In 2014, the proportion of mothers electing fear of focus parent was 5%, compared with 3% in 2012 (2012 gender data not shown; see De Maio et al., 2013, Table 5.2). Shame or embarrassment was nominated by 2% in both cohorts. Concern about not being believed was also a reason nominated by very small proportions (2% in both cohorts).
Reasons associated with practical issues, including cost and availability were nominated by very small proportions, as were reasons associated with other barriers, including culture and language.
5.2 Asking and telling about family violence in the family law system
A key focus of the evaluation of the family violence amendments is whether professional practices in screening for and assessing family violence and safety concerns have changed. The analysis reported in this section compares parents' experiences of being asked about family violence and safety concerns in 2012 and 2014, which supports an assessment of the extent and nature of the changes in professional practice.
The first part of this section focuses on whether professionals asked about family violence and safety concerns, based on responses of all parents who reported they were using (or were in the process of using) a formal pathway to resolve parenting arrangements, or had resolved their parenting arrangements informally but had accessed such services at some point. The second part of the section sets out parents' reports on whether they, the other parent or both of them had disclosed family violence or safety concerns. These analyses are based on questions asked of all parents in the survey. The third part of the discussion is based on the responses of parents who reported family violence and/or safety concerns to questions about whether they disclosed these experiences when negotiating parenting arrangements.
5.2.1 Did family law system professionals ask about family violence?
Parents were asked questions about whether or not family law system professionals asked about family violence and safety concerns (separately). The data presented in Table 5.3 depict the pattern of answers according to whether parents nominated a formal pathway (FDR, lawyers, courts) as the main pathway for sorting out parenting arrangements, or whether family law services had been accessed in two separate sets of circumstances: where parenting arrangements were still being resolved, or where parenting arrangements had been resolved informally (through "discussions" or "just happened").
| Whether professional asked | Formal pathway (%) | Not-resolved/informal pathway (%) a | ||||||
|---|---|---|---|---|---|---|---|---|
| 2012 | 2014 | 2012 | 2014 | |||||
| Total | Total | Fathers | Mothers | Total | Total | Fathers | Mothers | |
| Notes: Data have been weighted. The "don't know" and "refused" responses (3-5%) were excluded from the analysis. Parents who had contact with at least one family law service in relation to their separation were asked: "At any time during this process, have any of the professionals involved, ever asked you about your possible experience of family violence or any safety concerns for <child>?", and then if necessary, interviewers probed for clarification: "Were you asked about family violence, the safety of <child>, or both?" a This included parents who reported that either their arrangements were still being resolved, that their main pathway was discussions with other parent, or that parenting arrangements "just happened", but they had been in contact with family law professionals at some stage. b In the SRSP 2012, participants could also choose "something else", but this option was not available in 2014. Percentages may not total 100.0% due to rounding. Statistically significant differences between 2012 and 2014 within a given population are noted: * p < .05; ** p < .01; *** p < .001. Statistically significant differences between mothers and fathers within a given population (years) are noted: † p < .05; †† p < .01; ††† p < .001. | ||||||||
| Yes, asked about: | ||||||||
| Both family violence and safety concerns | 50.2 | 59.8 *** | 55.5 | 64.6†† | 42.0 | 47.2 | 38.9 | 54.5 ††† |
| Family violence only | 8.1 | 6.8 | 5.8 | 7.9 | 6.8 | 4.7 | 3.8 | 5.4 |
| Safety concerns only | 5.8 | 4.2 | 4.2 | 4.2 | 6.3 | 5.2 | 6.5 | 4.1 † |
| Subtotal | 64.1 | 70.8 | 65.5 | 76.7 | 55.1 | 57.1 | 49.2 | 64.0 |
| No, never asked | 35.9 | 29.2 *** | 34.6 | 23.4 ††† | 44.9 | 42.9 | 50.7 | 36.1 |
| Something else b | 4.0 | - | - | - | 4.7 | - | - | - |
| No. of observations | 1,392 | 1,417 | 690 | 727 | 1,663 | 1,586 | 687 | 899 |
Overall, the findings indicate that significantly more parents reported being asked about family violence and safety concerns after the 2012 family violence amendments. This is particularly evident for the group who had resolved parenting arrangements through a formal pathway and less strongly for the not-resolved/informal pathway group. An increase of ten percentage points is evident in the responses of the first group of parents, comparing the 2012 (50%) and 2014 (60%) samples. An increase of five percentage points was evident for the not-resolved/informal pathway group (2012: 42% and 2014: 47%).
The increase in reports of being asked about family violence is almost uniform for fathers and mothers. For example, in the formal pathway group. 46% of fathers and 56% of mothers reported being asked about both in 2012, compared with 56% of fathers and 65% of mothers in 2014 (2012 gender data not shown; see De Maio et al., 2013, Table 5).
Notwithstanding these changes in professional practices between 2012 and 2014, a substantial minority of parents in 2014 still reported seeking advice from family law system professionals but not being asked about family violence (formal pathway: 29% and not-resolved/informal pathway: 43%).
For both formal and not-resolved/informal pathways, a higher proportion of fathers compared to mothers reported in 2014 that they had not been asked about these concerns (fathers: 35% and 51% cf. mothers: 23% and 36% respectively).
In interpreting these results, it should also be noted that in the SRSP 2012, 4-5% of participants chose the option "something else" in response to this question. This response option was not available in the SRSP 2014.
5.2.2 Did family law system professionals ask parents using formal pathways about family violence?
This section deals with a more specific aspect of experiences in using family law system services to negotiate parenting arrangements: the extent to which parents reported that professionals in particular parts of the system (FDR, lawyers and courts) asked about family violence and safety concerns in this context. The discussion is based on analysis of parents' responses to the question: "At any time during this process, did any of the professionals involved ever ask you about your possible experience of family violence or any safety concerns for the [focus] child?" in the context of the service that they nominated as "the main pathway" for sorting parenting arrangements. Response options were "yes, asked about family violence", "yes, asked about the safety of the child", "yes, asked about both", "no, never asked" and "don't know" (in 2012; or "don't know/can't say" in 2014). The question was asked of all parents who reported using a formal pathway and had sorted or were in the process of sorting their parenting arrangements, not just those who reported a history of family violence or holding safety concerns. The data discussed in this section therefore shed light on the extent to which parents' experiences indicate that screening processes are applied in particular parts of the system. In connection with experiences of courts, it should be borne in mind that the phrasing "did any of the professionals involved" will mean the responses may reflect on experiences with several kinds of professionals, including lawyers, family consultants, judicial officers and other court personnel.
The data depicted in Figure 5.2 indicate improvements between the surveys in screening across the three formal pathways examined, with increases in the prevalence of parents being asked about both family violence and safety concerns reaching a level of statistical significance for each pathway (FDR/mediation, lawyers and courts). In relation to courts, parents' reports of being asked about both family violence and safety concerns for children increased by eleven percentage points between the 2012 and 2014 surveys. This largely reflects a move away from responses suggesting a pre-reform emphasis on asking about one or other of these concerns (mostly family violence) rather than both. Similar patterns hold for lawyers, although for this group, the 10 percentage point increase in 2014 reflects a decrease in the "never asked" category. Concerningly, however, around three in ten parents across the three pathways reported never being asked about either issue in 2014.
Figure 5.2: Whether professionals asked about family violence/safety concerns, by main pathway used, 2012 and 2014

Notes: Data have been weighted. Percentages may not total 100.0% due to rounding. Statistically significant differences between 2012 and 2014 within a given population are noted: * p < .05; ** p < .01; *** p < .001. Statistically significant differences between mothers and fathers within a given population (years) are noted: † p < .05; †† p < .01; ††† p < .001.
Table 5.4 shows the pattern of parents' responses in relation to being asked about family violence and safety concerns when using formal pathways according to the experiences reported by mothers and fathers separately. Both mothers and fathers were more likely to report being asked about both issues in each formal pathway in 2014 compared with 2012 and, with the exception of fathers' responses in relation to courts, less likely to report never being asked. The pattern of proportions of mothers and fathers being asked about both issues was largely consistent across pathways in the two cohorts, with fathers being less likely to be asked about either issue in both cohorts. The most notable changes in the pattern of results is in relation to fathers being asked about both issues by lawyers, with a significant increase of 14 percentage points, and professionals associated with courts asking mothers about both issues, which increased significantly by 17 percentage points. As noted in the preceding discussion, the proportions of parents reporting never being asked decreased in 2014, but still around one-third of fathers and up to one-quarter of mothers provided this response. In 2014, the highest proportion of fathers who reported not being asked about either issue were those using courts (37%). Among mothers, the pathway with the highest proportion not being asked about either were those using FDR/mediation (25%).
| What professional asked about | 2012 (%) | 2014 (%) | ||
|---|---|---|---|---|
| Fathers | Mothers | Fathers | Mothers | |
| Notes: Data have been weighted. Percentages may not total 100.0% due to rounding. Statistically significant differences between 2012 and 2014 within a given population are noted: * p < .05; ** p < .01; *** p < .001. Statistically significant differences between mothers and fathers within a given population (years) are noted: † p < .05; †† p < .01; ††† p < .001. | ||||
| FDR/mediation | ||||
| Asked about family violence | 6.2 | 10.3 | 8.4 | 7.6 |
| Asked about safety | 6.4 | 6.7 | 4.8 | 3.6 |
| Asked about both | 49.5 | 54.8 | 55.2 | 64.1 * |
| Never asked | 37.9 | 28.2 † | 32.0 | 24.7 |
| No. of observations | 288 | 283 | 263 | 318 |
| Lawyers | ||||
| Asked about family violence | 4.9 | 4.8 | 4.2 | 8.2 |
| Asked about safety | 5.9 | 5.1 | 4.8 | 6.4 |
| Asked about both | 39.8 | 58.3 ††† | 55.2 ** | 63.7 |
| Never asked | 49.4 | 31.8 ††† | 35.9 ** | 21.7 * |
| No. of observations | 233 | 241 | 241 | 235 |
| Courts | ||||
| Asked about family violence | 10.2 | 14.9 | 3.8 * | 8.1 |
| Asked about safety | 6.6 | 3.2 | 2.8 | 2.3 |
| Asked about both | 48.1 | 50.1 | 56.3 | 66.5 ** |
| Never asked | 35.1 | 31.8 | 37.0 | 23.1 |
| No. of observations | 169 | 178 | 186 | 174 |
5.2.3 Did parents tell professionals about family violence?
Parents who used family law system services
In this section, disclosures of family violence and safety concerns are further explored by looking more specifically at disclosures as part of negotiating post-separation care-time arrangements with the assistance of family law professionals. The focus of this analysis is all parents who nominated a formal pathway (FDR, lawyers, courts) to negotiate parenting arrangements or had sought advice from these sources in the process of negotiating parenting arrangements. Parents were asked separate questions about whether they "raised or disclosed any issues about family violence/safety concerns" with these professionals. Response options allowed parents to specify whether they had disclosed such concerns, the other parent had disclosed such concerns, both parents had disclosed concerns or no such concerns were disclosed.
The first part of the discussions sets out broad findings in relation to family violence and safety concerns, based on comparisons of 2012 and 2014 data. More detailed discussion of disclosure of family violence and safety concerns separately follows, with analyses based on parents' accounts of the main pathways used and analyses examining the reports of mothers and fathers separately.
Overall, the data described establish that the greatest indication of change between 2012 and 2014 is evident in relation to reports of disclosures of family violence and safety concerns (taken separately) to lawyers (see detailed discussion below). Parents were most likely to report disclosing concerns of each nature to courts in each time period and least likely to report disclosing these concerns when using FDR services. They were also most likely to refer to their own disclosures, while disclosures by the other parent or both parents were not commonly referred to.
Overall reports of disclosure of family violence and safety concerns
Table 5.5 demonstrates that the proportions of parents who reported disclosing family violence or safety concerns increased by around 3 percentage points between 2012 and 2014. In each period, mothers were more likely to report disclosing concerns of each type compared with fathers, with the relative proportions of fathers and mothers disclosing remaining similar. In relation to family violence, the proportion of fathers reporting that they disclosed increased by 3 percentage points to 30%, and the proportion of mothers increased by 3 percentage points to 48%. In relation to safety concerns, the proportions of fathers reporting disclosures increased by 3 percentage points to 32%, with mothers increasing by 4 percentage points to 45%. In each period, in relation to both issues, negligible proportions of fathers and mothers reported either that the other parent disclosed or both parents disclosed. These findings are likely to reflect a lack of awareness about disclosures by the other parent.
| Which parent disclosed | 2012 (%) | 2014 (%) | ||||
|---|---|---|---|---|---|---|
| Total | Fathers | Mothers | Total | Fathers | Mothers | |
| Notes: Data have been weighted. Percentages may not total 100.0% due to rounding. Parents who had contact with at least one family law service in relation to their separation were asked: "Did you ever raise or disclose any issues about family violence with these professionals?", followed by: "Did you ever raise or disclose any concerns about the safety of <child> with these professionals?" Responses were not read out, but interviewers could record instances where parents volunteered information about the other parent disclosing. Statistically significant differences between 2012 and 2014 within a given population are noted: * p < .05; ** p < .01; *** p < .001. Statistically significant differences between mothers and fathers within a given population (years) are noted: † p < .05; †† p < .01; ††† p < .001. | ||||||
| Family violence | ||||||
| Participant disclosed | 34.8 | 25.8 | 45.4 ††† | 37.7 * | 28.2 | 46.9 ††† |
| Other parent disclosed | 0.2 | 0.5 | 0.1 † | 0.5 | 0.9 | 0.1 †† |
| Both parents disclosed | 1.6 | 2.3 | 0.7 ††† | 1.2 | 1.9 | 0.6 †† |
| Neither parent disclosed | 63.3 | 71.5 | 53.7 ††† | 60.6* | 69.0 | 52.4 ††† |
| No. of observations | 3,124 | 1,432 | 1,692 | 3,088 | 1,416 | 1,672 |
| Safety concerns | ||||||
| Participant disclosed | 34.5 | 27.6 | 40.8 ††† | 37.5* | 30.8 | 44.0 ††† |
| Other parent disclosed | 0.2 | 0.4 | 0.1 | 0.4 | 0.6 | 0.2 |
| Both parents disclosed | 0.9 | 1.3 | 0.5 † | 0.8 | 1.2 | 0.5 |
| Neither parent disclosed | 64.4 | 70.8 | 58.6 ††† | 61.3 * | 67.4 | 55.3 ††† |
| No. of observations | 3,126 | 1,434 | 1,692 | 3,089 | 1,414 | 1,675 |
Disclosure of family violence and main pathways used
Table 5.6 depicts the proportions of parents who experienced family violence before/during or since separation and disclosed this to the professionals they used as their main pathway for reaching parenting arrangements. In the 2014 cohort, among parents whose main pathway was FDR/mediation, around 1 in 3 disclosed family violence during these negotiations (self: 32%; both: 1%). Among parents whose main pathway was a lawyer, just over half disclosed family violence (self: 49%; both: 3%). Among parents who mainly used the courts to sort out parenting arrangements, almost 2 in 3 disclosed family violence (self: 60%; both: 4%). In terms of changes between 2012 and 2014, the most notable findings concern patterns of disclosure in relation to FDR/mediation and lawyers, especially the latter, with changes in reports of disclosure in these pathways reaching statistical significance. For lawyers, the proportion of parents reporting that neither parent disclosed family violence decreased significantly (2012: 55% cf. 2014: 47%), while the proportions reporting that both parents disclosed increased from 1% in 2012 to 3% in 2014.
| Which parent disclosed | 2012 (%) | 2014 (%) | ||||
|---|---|---|---|---|---|---|
| FDR/mediation | Lawyers | Courts | FDR/mediation | Lawyers | Courts | |
| Notes: Data have been weighted. Percentages may not total 100.0% due to rounding. Statistically significant differences between 2012 and 2014 within a given population are noted: * p < .05; ** p < .01; *** p < .001. | ||||||
| Participant disclosed | 27.8 | 43.4 | 59.9 | 32.0 | 49.3 | 59.6 |
| Other parent disclosed | 0.1 | 0.2 | 0.0 | 0.7 * | 0.4 | 1.3 * |
| Both parents disclosed | 2.7 | 1.2 | 4.8 | 0.7 ** | 3.0* | 4.0 |
| Neither parent disclosed | 69.4 | 55.3 | 35.3 | 66.7 | 47.3* | 35.2 |
| No. of observations | 593 | 493 | 359 | 611 | 501 | 374 |
Table 5.7 presents further analyses of the data in Table 5.6, broken down by gender. The findings show that in both cohorts, significantly more mothers than fathers disclosed family violence to each of the main family law services. The findings also indicate that the statistically significant shifts in reported disclosure of family violence in FDR/mediation and to lawyers are mostly accounted for by increased disclosures by fathers, as no significant changes occurred between 2012 and 2014 in mothers' disclosures. Among fathers whose main pathway was FDR/mediation, significantly fewer reported that both parents disclosed family violence in 2014 (2012: 4% cf. 2014: 1%), while there was a small but significant increase in the number of fathers reporting that the focus parent disclosed family violence (2012: 0% cf. 2014: 1%). In relation to lawyers, the proportion of fathers reporting disclosure of family violence rose by 12 percentage points, to 44% in 2014, while the proportion reporting that neither parents disclosed decreased significantly from 68% in 2012 to 55% in 2014. The only significant shift in relation to disclosure when courts were the main pathway was that more fathers reported that the focus parent disclosed family violence (2012: 0% to 2014: 2%).
| Which parent disclosed family violence | 2012 (%) | 2014 (%) | ||||
|---|---|---|---|---|---|---|
| FDR/ mediation | Lawyers | Courts | FDR/ mediation | Lawyers | Courts | |
| Notes: Data have been weighted. Percentages may not total 100.0% due to rounding. Statistically significant differences between 2012 and 2014 within a given population are noted: * p < .05; ** p < .01; *** p < .001. Statistically significant differences between mothers and fathers within a given population (years and main pathway used) are noted: † p < .05; †† p < .01; ††† p < .001. | ||||||
| Fathers | ||||||
| Participant disclosed | 15.7 | 30.1 | 48.6 | 22.4 | 39.5 * | 46.6 |
| Other parent disclosed | 0.2 | 0.4 | 0.0 | 1.3 * | 0.7 | 2.3 * |
| Both parents disclosed | 4.4 | 1.6 | 5.8 | 1.1 * | 4.5 | 6.5 |
| Neither parent disclosed | 79.8 | 67.9 | 45.6 | 75.2 | 55.3 ** | 44.7 |
| No. of observations | 290 | 242 | 175 | 278 | 248 | 194 |
| Mothers | ||||||
| Participant disclosed | 40.9 ††† | 57.2 ††† | 71.7 ††† | 41.4 ††† | 60.6 ††† | 75.3 ††† |
| Other parent disclosed | - | - | - | 0.2 † | - | - |
| Both parents disclosed | 0.9 † | 0.7 | 3.8 | 0.3 | 1.3 | 1.1 † |
| Neither parent disclosed | 58.2 ††† | 42.2 ††† | 24.5 ††† | 58.2 ††† | 38.0 ††† | 23.6 ††† |
| No. of observations | 303 | 251 | 184 | 333 | 253 | 180 |
Disclosure of safety concerns and main pathways used
This section sets out more detailed findings on parents' reports of disclosing safety concerns. Table 5.8 sets out whether parents reported disclosing safety concerns in the context of the main pathway nominated for reaching parenting arrangements. The one area where changes were statistically significant was in reports of disclosure to lawyers, where reports that only the participant disclosed safety concerns increased by 11 percentage points (to 53% in 2014), while reports that neither parent disclosed decreased by 10 percentage points (to 46% in 2014). Patterns for other pathways were largely stable. A notable feature of the overall pattern of results depicted is the increasing increments of parents reporting disclosure of safety concerns from FDR/mediation, to lawyers and to courts, with the increases emerging with the increases in the formality of the pathway.
| Which parent disclosed | 2012 (%) | 2014 (%) | ||||
|---|---|---|---|---|---|---|
| FDR/mediation | Lawyers | Courts | FDR/mediation | Lawyers | Courts | |
| Notes: Data have been weighted. Statistically significant differences between 2012 and 2014 within a given population are noted: * p < .05; ** p < .01; *** p < .001. | ||||||
| Participant disclosed | 29.5 | 42.3 | 60.2 | 33.1 | 52.5** | 59.9 |
| Other parent disclosed | 0.1 | 0.7 | 0.8 | 0.1 | 0.0 | 2.0 |
| Both parents disclosed | 2.0 | 0.6 | 2.3 | 0.8 | 1.3 | 1.9 |
| Neither parent disclosed | 68.4 | 56.3 | 36.7 | 66.1 | 46.3** | 36.2 |
| No. of observations | 592 | 497 | 357 | 614 | 499 | 372 |
Table 5.9 shows patterns in disclosure of safety concerns for particular pathways according to fathers and mothers reports. It demonstrates that the statistically significant increase in disclosing safety concerns to lawyers reflects the greater increase in fathers reporting disclosure compared to mothers. The proportion of fathers reporting disclosure of safety concerns to lawyers increased by 13 percentage points to 45% in 2014, compared with a more modest increase of 8 percentage points to 61% among mothers. Contrasting trends were evident among fathers and mothers who disclosed safety concerns where courts were the main pathway, with a decrease for fathers (by 4 percentage points to 54%) and an increase for mothers (by 4 percentage points to 71%).
| Which parent disclosed safety concerns | 2012 (%) | 2014 (%) | ||||
|---|---|---|---|---|---|---|
| FDR/ mediation | Lawyers | Courts | FDR/ mediation | Lawyers | Courts | |
| Notes: Data have been weighted. Percentages may not total 100.0% due to rounding. Statistically significant differences between 2012 and 2014 within a given population are noted: * p < .05; ** p < .01; *** p < .001. Statistically significant differences between mothers and fathers within a given population (years and main pathway used) are noted: † p < .05; †† p < .01; ††† p < .001. | ||||||
| Fathers | ||||||
| Participant disclosed | 19.7 | 32.1 | 55.4 | 24.8 | 45.1 ** | 50.6 |
| Other parent disclosed | 0.0 | 1.4 | 1.2 | 0.0 | 0.0 | 3.6 |
| Both parents disclosed | 3.2 | 0.8 | 2.7 | 1.3 | 1.6 | 3.5 |
| Neither parent disclosed | 77.1 | 65.6 | 40.7 | 73.9 | 53.3 * | 42.2 |
| No. of observations | 287 | 244 | 174 | 278 | 248 | 193 |
| Mothers | ||||||
| Participant disclosed | 40.0 ††† | 53.0 ††† | 65.4 | 41.0 ††† | 61.0 ††† | 71.2 ††† |
| Other parent disclosed | 0.3 | 0.0 | 0.4 | 0.2 | 0.0 | 0.0 † |
| Both parents disclosed | 0.7† | 0.4 | 2.0 | 0.3 | 0.9 | 0.0 † |
| Neither parent disclosed | 59.1 ††† | 46.6 ††† | 32.5 | 58.5 ††† | 38.1 †† | 28.8 † |
| No. of observations | 305 | 253 | 183 | 336 | 251 | 179 |
Disclosure to family law system professionals by parents with family violence or safety concerns
The analysis in the preceding section examined reports of disclosures of family violence or safety concerns made by all parents who reported using a formal pathway for reaching parenting arrangements. This section examines a more specific issue: whether parents who experienced family violence or held safety concerns, had made contact with and disclosed their concerns to family law professionals. This analysis therefore supports an assessment not only of patterns in disclosure but also in non-disclosure where these concerns are pertinent.
Figures 5.3 and 5.4 respectively depict the proportions of parents who experienced family violence and held safety concerns and reported disclosing them when negotiating parenting arrangements.11 In relation to family violence, 45% of parents reported disclosing in 2014, compared with 42% in 2012, with significantly more mothers than fathers in both cohorts disclosing family violence in both cohorts (2012 - mothers: 51% and fathers: 32%; 2014 - mothers: 54% and fathers: 35%).
Figure 5.3: Parents who experienced family violence and disclosed this to family law professionals, by parent gender, 2012 and 2014
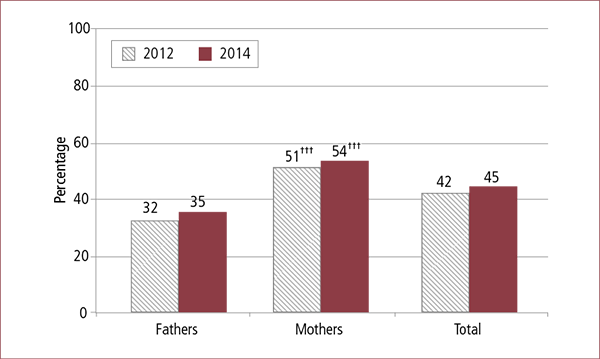
Notes: Data have been weighted. Analysis restricted to parents who reported experiencing family violence. Includes responses where only the participant disclosed, as well as instances where both parents disclosed. The "don't know" and "refused" responses were excluded from this analysis (1% in 2012 and 2% in 2014). Statistically significant differences between 2012 and 2014 were not found.. Statistically significant differences between mothers and fathers within a given population (years) are noted: † p < .05; †† p < .01; ††† p < .001.
Figure 5.4: Parents who held safety concerns and disclosed this to family law professionals, by parent gender, 2012 and 2014
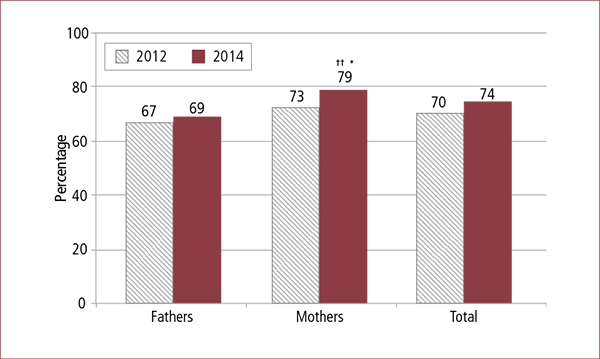
Notes: Data have been weighted. Analysis restricted to parents who reported safety concerns. Includes responses where only the participant disclosed, as well as instances where both parents disclosed. The "don't know" and "refused" responses were excluded from this analysis (2% in 2012 and 1% in 2014). Statistically significant differences between 2012 and 2014 within a given population are noted: * p < .05; ** p < .01; *** p < .001. Statistically significant differences between mothers and fathers within a given population (years) are noted: † p < .05; †† p < .01; ††† p < .001.
In relation to safety concerns, 74% of parents who had current safety concerns reported disclosing them to family law professionals during parenting negotiations in 2014, compared with 70% in 2012, though the increase was not statistically significant (Figure 5.4). There was, however, a significant increase in mothers' disclosures of safety concerns between 2012 and 2014 (from 73% to 79%). Further, significantly more mothers than fathers disclosed safety concerns in 2014 (mothers: 79% cf. fathers: 69%).
It is notable that greater proportions of mothers than fathers reported disclosing each kind of concern and that safety concerns were substantially more likely to be disclosed than family violence.
It is also notable that, despite a significant decrease from 2012 to 2014, a substantial minority of parents who experienced family violence or held safety concerns (or both) did not disclose this to family law professionals during negotiations (2012: 41% and 2014: 38%; see Table 5.10). Consideration of findings reported earlier in this chapter suggest three explanations may be reflected in these findings to unquantifiable extents. One explanation is that parents chose not to disclose these issues for the kinds of reasons set out in section 5.1.2. A second explanation, informed by the findings reported in section 5.2.1, is that they may not have been asked whether they had safety concerns and did not feel comfortable raising them without being asked. Finally, with regard to safety concerns, it is possible that parents who reported having current safety concerns at the time of the survey, did not hold these safety concerns at the time of parenting negotiations, as supported in the forthcoming discussion focusing on reasons for non-disclosure (section 5.2.4). Overall, the data reported in this chapter, particularly those discussed at section 5.2.1, suggest that being asked was more common after than before the reforms, but even so, a substantial minority (about three in ten) of parents were still not asked whether they had experienced family violence or held safety concerns.
| 2012 (%) | 2014 (%) | |
|---|---|---|
| Notes: Data have been weighted. Percentages may not total 100.0% due to rounding. Sample populations: total - 2012: n = 2,275, 2014: n = 2,296; FDR/mediation - 2012: n = 415, 2014: n = 448; lawyers - 2012: n = 393, 2014: n = 416; court - 2012: n = 333, 2014: n = 334. Statistically significant differences between 2012 and 2014 within a given population are noted: * p < .05; ** p < .01; *** p < .001. | ||
| All participating parents who had violence/safety concerns and did not disclose | 41.3 | 37.9 * |
| Parents who had sorted/were sorting out arrangements and did not disclose to this service: | ||
| FDR/mediation | 46.2 | 45.7 |
| Lawyer | 33.6 | 28.2 |
| Court | 22.8 | 21.5 |
Table 5.10 also shows the proportion of parents who had sorted or were in the process of sorting out their parenting arrangements through a formal pathway and who had experienced family violence or held current safety concerns for themselves or their child, but didn't disclose these issues during negotiations. Between both cohorts, 46% of these parents did not disclose to their FDR practitioner. Among parents in 2014 whose main pathway was a lawyer, 28% did not disclose, compared with 34% in the 2012 cohort. Among parents in both cohorts who mainly used the courts, 22-23% did not disclose.
5.2.4 Disclosure analysis
Participants in the SRSP 2014 cohort who reported experiencing family violence or abuse in the survey, or who reported having current safety concerns for themselves or their child, but who said that they had not disclosed any issues about family violence or any concerns about the safety of the focus child to family law professionals, were asked: "What was the main reason why you didn't raise or disclose any concerns about [family violence/or the safety of the focus child]?"12 There were 1,017 open-ended responses to this question provided by 446 female participants and 571 male participants. This section provides an overview of the main themes that emerged in the verbatim responses to this question. Responses have been coded according to their primary theme, but it should be noted that there was significant overlap between numerous themes, with many participants raising multiple, interlinked reasons for not disclosing to family law professionals. Consistent with the data in section 5.1.2 on reasons for not disclosing violence reported, the analysis of these open-ended responses suggest that to some extent parents self-select into disclosure on the basis of their current view of the behaviour and its implications for the child.
The majority of participants responding to this question (n = 509) indicated that they had not disclosed any concerns about family violence or the safety of the focus child because they did not have concerns at the time they were engaging with professionals (mothers: n = 201; fathers: n = 308).13 For some participants who answered in this way, this involved an explicit statement that they had no concerns about either family violence or child safety:
I do not believe there are any safety issues or family violence issues.
For other participants, their responses indicated that they held no safety concerns for the focus child, but did not make explicit whether or not they had concerns about family violence:
I wasn't concerned about [focus child's] safety.
Many participants who answered in this manner simply indicated that they did not consider disclosure necessary, but did so in quite general terms:
Not applicable.
Did not feel it was relevant, no need.
Just wasn't an issue.
The next largest category of responses were provided by those participants who indicated that the main reason that they did not disclose concerns was because the family violence was not perceived by them to be affecting the focus child and/or because the violence was not physical in character (total: n = 171; mothers: n = 96; fathers: n = 75). Some participants were explicit about both these aspects of their decision not to disclose:
There's no concern for [the focus child's] safety at all and there is no violence … well, not physical violence, and the emotional violence is more manipulative.
Because he has never been physical towards me and I know he loves [focus child]. I really do not think he would ever hurt her.
Other participants provided more general responses indicating that they know that the other parent would not harm the focus child and/or that the other parent was a "good parent":
I think deep down [focus parent] is a good father and would have kept activities away from the children.
He's a good father. He's still a good father, and I know he wouldn't hurt the children. He's never done anything to the children.
She wouldn't hurt [focus child]. I was never worried about that.
Some participants (total: n = 46; mothers: n = 17; fathers: n = 29) reported that they did not consider the family violence or abuse that they reported experiencing to be serious enough to warrant disclosure of concerns to family law professionals:
It wasn't that serious.
It's a rare anger thing. Not serious enough.
Wasn't a big enough of a deal.
Other participants (total: n = 53; mothers: n = 21; fathers: n = 32) reported that they did not consider making a disclosure to be worth it and/or they were concerned about potential consequences. Some of these responses indicated the participant did not want to escalate the situation with the focus parent or delay the process of coming to an agreement:
I guess, for the kids, I actually had taken them to counsellors. I knew they were never in danger from their father. He would never do anything to them. His behaviour towards me, he was not thinking straight. To involve the people would have just escalated the situation. Just took the kids to the professionals, it was mainly to safeguard the kids.
I didn't want to provoke the situation, even afterwards, I just wanted to move on with my life. My main concern was that the girls were okay and looked after.
[I] thought that it would drag out the process.
Other participants indicated that their main reason for not disclosing any concerns was that they did not consider that such concerns would be taken seriously:
[I] didn't think I would be believed or would be taken seriously and didn't think it'd be worth the trouble.
A smaller group of participants (total: n = 17; mothers: n = 6; fathers: n = 11) stated that they had not raised any concerns because they thought and/or hoped that the issues would work themselves out and that the parties' relationship would remain amicable. For another group of participants (total: n = 14; mothers: n = 8; fathers: n = 6), the main reason that they did not disclose was due to the influence of the focus parent in the process they were undertaking, resulting in fear or limiting their ability to raise issues:
They didn't actually bring it up in mediation. [The focus parent] and I were both in the room. I wouldn't bring up anything in front of him, that would be worse.
I was too scared because we were in the room together. Even if we weren't, I was too scared.
Some participants (total: n = 33; n = 17; fathers: n = 16) reported that the main reason that they did not disclose was because the family violence was confined to the break up, often a one-off incident that was explained as the result of the stress associated with the relationship ending:
I felt it was not relevant or something that was going to continue, as it was mainly caused by the stress of the break up.
There wasn't really any family violence. Only normal separation stress.
For around 29 participants (mothers: n = 13; fathers: n = 16), the main reason reported for not raising or disclosing any concerns about family violence or the safety of the focus child was that the family violence or abuse they described experiencing had not yet occurred at the time they were dealing with the family law professions, or they had not yet come to recognise it as such:
It hadn't happened yet.
I did not think it was such a big problem then; it got worse as time went on.
I hadn't identified it as a problem yet. Not aware of it as abuse.
This latter issue was outlined in some detail by one participant:
Because it was never - how can I explain it - it can seem like very normal behaviour when you're there. I never thought the children were at risk. I never even felt that I was at risk until it came time for me to leave; and then it was, well, you can imagine, it was horrible. Up until that point in time I didn't understand why he was behaving the way he was. But when I found out and decided it wasn't okay, because I didn't know he was lying and cheating, and I thought it was crazy because they blame [expletive] on you and blame everything on your behaviour. And I didn't know why I was sick. Because it wasn't at the point that I was fearful until the end, and then by then I'd moved states and I was safe. It wasn't until right until the end I found out about what he had been doing. There was no big red flashing light to say: "This is emotional abuse. You should do something about it". You don't know about it when you're there.
In smaller numbers, participants also raised other issues as the main reason for not disclosing any concerns about family violence or about the safety of the focus child. A number of participants (the majority being mothers), indicated that they thought that they could manage the safety concerns for their children themselves, with this sometimes being as a result of the focus parent no longer having any contact with them or the focus child. Responses in this category convey some of the complexity of dealing with family violence and/or safety concerns in the process of separation and attempting to have protective frameworks in place:
Because the place that [focus child] shared with his father he shares with two other housemates that are female, to me I feel like he is not alone with his father. At least, some other people are around him to call for help. And he knows that if anything happens, call 000 or call me if he gets in trouble.
Because after we moved out I think his dad is not interested anymore in seeing or talking to me. So I think that's alright as long as he's not looking for us. I think he doesn't know anything where we live. As long as I have a peaceful life with my son, it's alright. That's why I never talk to anyone about safety for me or my son.
Other reasons provided by participants for not disclosing any concerns included: that there was a lack of evidence regarding their concerns, they were embarrassed, they wanted to keep the issue private, they were not the focus of the discussions that were taking place, their primary concern was for the focus parent's mental health and safety, and there were systematic barriers to disclosure, such as a lack of concern by family law professionals, or that the system was convoluted or biased.
5.3 Consequences of disclosing family violence and safety concerns
The discussion in this section focuses on the consequences of disclosing family violence and safety concerns, supporting an assessment of the extent to which the reforms have changed the family law system's response to these issues when they are identified. Data addressing this question were collected in several different ways, including asking parents their views of professional responses, the actions that followed the disclosure, and the extent to which the disclosure influenced parenting arrangements. A further method of examining this issue was through analysis of the care-time arrangements of different groups of parents who reported family violence or safety concerns in the survey and who did and did not disclose concerns to professionals (see section 5.3.3).
5.3.1 Parents' reports of professionals' responses to family violence and safety concerns
Overall parent views of professionals' responses
The data set out in the previous section highlighted some slight improvements in disclosure rates by parents between 2012 and 2014. They also indicated improvements in screening processes across the different pathways, most notably by lawyers and courts. Where parents reported disclosing family violence and safety concerns, they were also asked in relation to each issue to nominate a description of how the professional or service responded. The possible response options were: the concerns were taken seriously and dealt with appropriately, the concerns were acknowledged but not considered relevant, the concerns were ignored or not taken seriously at all, and "something else".
Table 5.11 depicts the pattern of responses of fathers and mothers in relation to family violence and safety concerns in 2012 and 2014. Overall, the results depicted in this table suggest little improvement or a marginally negative effect of the 2012 family violence reforms in relation to parents' perceptions of professionals' responses to their disclosures.
| 2012 (%) | 2014 (%) | |||||
|---|---|---|---|---|---|---|
| Total | Fathers | Mothers | Total | Fathers | Mothers | |
| Notes: Data have been weighted. Percentages may not total 100.0% due to rounding. Statistically significant differences between 2012 and 2014 were not found. Statistically significant differences between mothers and fathers within a given population (years) are noted: † p < .05; †† p < .01; ††† p < .001. | ||||||
| Response to disclosing family violence | ||||||
| Taken seriously, dealt with appropriately | 53.4 | 38.0 | 61.5 ††† | 51.9 | 41.0 | 58.4 ††† |
| Acknowledged but not considered relevant | 31.2 | 38.1 | 27.5 ††† | 32.6 | 38.4 | 29.1 †† |
| Ignored or not taken seriously | 10.8 | 19.5 | 6.2 ††† | 10.9 | 16.7 | 7.4 ††† |
| Something else | 4.7 | 4.5 | 4.8 | 4.6 | 4.0 | 5.0 |
| No. of observations | 1,182 | 396 | 786 | 1,243 | 437 | 806 |
| Response to disclosing safety concerns | ||||||
| Taken seriously, dealt with appropriately | 50.9 | 39.5 | 58.4 ††† | 48.5 | 38.3 | 55.3 ††† |
| Acknowledged but not considered relevant | 31.0 | 33.4 | 29.4 | 33.1 | 36.7 | 30.7 † |
| Ignored or not taken seriously | 13.0 | 20.5 | 8.2 ††† | 13.6 | 19.4 | 9.9 ††† |
| Something else | 5.0 | 6.7 | 4.0 | 4.7 | 5.6 | 4.2 |
| No. of observations | 1,096 | 412 | 684 | 1,170 | 434 | 736 |
Notably, around half of the parents were positive about professionals' responses to the disclosure of both family violence and safety concerns (concerns were taken seriously) in both time frames. Other interesting aspects of the data depicted in Table 5.11 are:
- small overall (though not statistically significant) declines in responses of a positive nature in relation to family violence and safety concerns (about 2 percentage points each); and
- small overall (though not statistically significant) increases in negative responses (i.e., the parent's disclosure being considered irrelevant or ignored) in relation to safety concerns (3 percentage points) and to family violence (2 percentage points).
Looking at the reports of fathers and mothers separately, it is evident that mothers were more likely than fathers to be positive about professional responses in relation to both family violence and safety concerns in both cohorts.
The proportions of fathers nominating the "acknowledged but not considered relevant" response pattern in relation family violence remained stable (38%), but the proportions of mothers nominating this response increased slightly (from 28% to 29%). In relation to safety concerns, this answer was chosen more often by both fathers and mothers in 2014 than by parents in the 2012 cohort, but to a greater extent by fathers (from 33% to 37%) than mothers (from 29% to 31%).
Parents' perceptions of the way in which professionals dealt with disclosures of violence were also analysed by the type of family violence experienced before/during separation, but little difference was found between those reporting physical violence or emotional abuse. In 2014, half the parents (51-54%) who experienced such family violence before/during separation also reported that family law system professionals took their concerns seriously (see Appendix 3, Table B3).
Parent views of professionals' responses to disclosures of family violence, by main pathway
An analysis of professionals' responses to disclosures of family violence, broken down according to the main pathways parents nominated using, are set out in Figure 5.5 and Table 5.12.
Considering Figure 5.5, the noteworthy features of these data are that in relation to FDR/mediation and courts, the proportions of parents who considered their disclosures were taken seriously and dealt with appropriately fell from 2012 to 2014, marginally more so in relation to courts (10 percentage points, from 40% to 30%, which is statistically significant) than FDR/mediation (by 8 percentage points, from 58% to 50%). The proportion of the sample returning positive responses rose slightly for lawyers (2 percentage points, from 49% to 51%).
Figure 5.5: Professionals' responses to disclosures of family violence, by main pathway used, 2012 and 2014
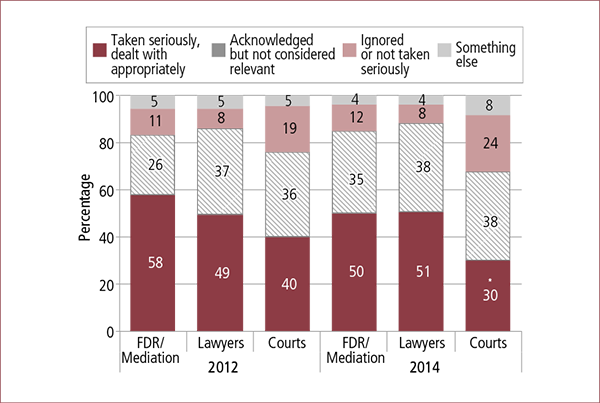
Notes: Data have been weighted. Percentages may not total 100.0% due to rounding. Statistically significant differences between 2012 and 2014 within a given population are noted: * p < .05; ** p < .01; *** p < .001.
For FDR/mediation, the proportion of parents indicating their concerns were "acknowledged but not considered relevant" increased by 9 percentage points, corresponding to the decrease in positive responses. In relation to courts, the decrease in positive responses was accounted for more by an increase in the proportion of parents nominating the "ignored or not taken seriously" response option in 2014 (from 19% to 24%) than an increase in the "acknowledged but not considered relevant" category (from 36% to 38%).
Considering any difference in patterns of positive responses from professionals according to parent gender, Table 5.12 shows that mothers disclosing family violence reported positive professional responses in substantially lower proportions in 2014 compared to 2012 in relation to FDR/mediation (2012: 65% cf. 2014: 55%) and courts (2012: 46% cf. 2014: 36%), but these changes were not statistically significant. In relation to lawyers, mothers' reports were stable (61%), and more fathers reported positive responses in 2014 (37%) than in 2012 (29%). Fathers were substantially less likely to report positive responses from courts in 2014 (2012: 32% cf. 2014: 23%), and marginally less likely to report positive FDR/mediation responses (2012: 44% cf. 2014: 42%).
| 2012 (%) | 2014 (%) | |||||
|---|---|---|---|---|---|---|
| FDR/ mediation | Lawyers | Courts | FDR/ mediation | Lawyers | Courts | |
| Notes: Data have been weighted. Percentages may not total 100.0% due to rounding. Statistically significant differences between 2012 and 2014 were not found. Statistically significant differences between mothers and fathers within a given population (years) are noted: † p < .05; †† p < .01; ††† p < .001. | ||||||
| Fathers | ||||||
| Taken seriously, dealt with appropriately | 43.7 | 29.4 | 32.0 | 41.6 | 37.4 | 22.9 |
| Acknowledged but not considered relevant | 25.9 | 55.2 | 37.7 | 38.1 | 49.4 | 37.2 |
| Ignored or not taken seriously | 23.3 | 12.1 | 27.2 | 18.8 | 11.5 | 30.3 |
| Something else | 7.1 | 3.4 | 3.1 | 1.6 | 1.6 | 9.5 |
| No. of observations | 62 | 77 | 95 | 68 | 109 | 101 |
| Mothers | ||||||
| Taken seriously, dealt with appropriately | 65.1 †† | 60.7 ††† | 45.5 | 55.1 | 61.1 ††† | 35.8 |
| Acknowledged but not considered relevant | 25.3 | 26.7 ††† | 35.4 | 33.0 | 28.7 †† | 38.3 |
| Ignored or not taken seriously | 5.4 ††† | 6.1 | 13.6 † | 7.4 † | 4.4 † | 18.5 |
| Something else | 4.2 | 6.6 | 5.4 | 4.5 | 5.8 † | 7.4 |
| No. of observations | 127 | 146 | 141 | 138 | 155 | 139 |
Parent views of professionals' responses to disclosures of safety concerns, by main pathway
This section sets out an analysis of the data on professionals' responses to parents' reports of safety concerns. Again, these are broken down according to the main pathway that parents nominated using for parenting arrangements (Figure 5.6 and Table 5.13).
Figure 5.6: Professionals' responses to disclosures of safety concerns by main pathway used, 2012 and 2014
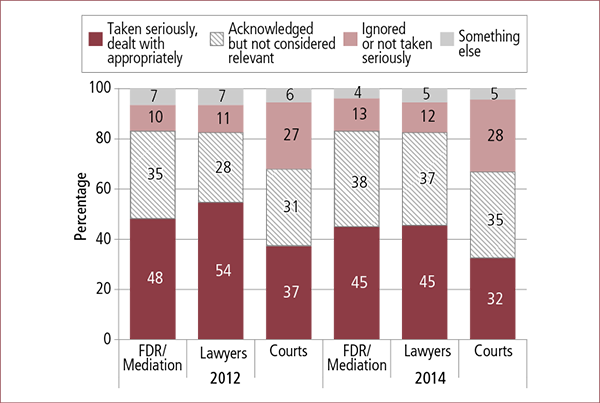
Notes: Data have been weighted. Percentages may not total 100.0% due to rounding. Statistically significant differences between 2012 and 2014 were not found.
Disclosure of safety concerns was associated with smaller proportions of parents considering professional responses were positive across all three pathways in 2014 compared with 2012, though none of these changes were statistically significant. In 2014, just fewer than half of the parents who disclosed safety concerns to FDR/mediation practitioners or lawyers, reported that their concerns were taken seriously and dealt with appropriately (45% for both pathways). Among parents who disclosed safety concerns to the courts, fewer than 1 in 3 felt their concerns had been taken seriously and dealt with appropriately (32% in 2014).
Positive responses among both fathers and mothers dropped across all three pathways (Table 5.13), though none of these decreases were statistically significant. Decreases among fathers were particularly marked for FDR/mediation (from 39% to 33%) and lawyers (from 44% to 33%), but were minimal for courts (from 33% to 31%). Among mothers, the biggest drop in positive responses was for courts (from 41% to 33%). It was less substantial for lawyers (from 61% to 56%), and minimal for FDR/mediation (from 54% to 52%).
| 2012 (%) | 2014 (%) | |||||
|---|---|---|---|---|---|---|
| FDR/ mediation | Lawyers | Courts | FDR/ mediation | Lawyers | Courts | |
| Notes: Data have been weighted. Percentages may not total 100.0% due to rounding. Statistically significant differences between 2012 and 2014 were not found. Statistically significant differences between mothers and fathers within a given population (years) are noted: † p < .05; †† p < .01; ††† p < .001. | ||||||
| Fathers | ||||||
| Taken seriously, dealt with appropriately | 39.2 | 44.3 | 33.2 | 32.7 | 32.8 | 31.4 |
| Acknowledged but not considered relevant | 31.1 | 28.5 | 27.3 | 45.5 | 41.8 | 30.1 |
| Ignored or not taken seriously | 15.1 | 17.5 | 35.9 | 15.9 | 20.5 | 31.6 |
| Something else | 14.6 | 9.8 | 3.6 | 5.9 | 5.0 | 6.9 |
| No. of observations | 67 | 76 | 98 | 66 | 110 | 99 |
| Mothers | ||||||
| Taken seriously, dealt with appropriately | 53.5 | 60.6 † | 41.2 | 51.9 † | 55.8 ††† | 32.7 |
| Acknowledged but not considered relevant | 37.2 | 27.9 | 33.7 | 33.7 | 33.0 | 38.7 |
| Ignored or not taken seriously | 7.1 | 6.7 † | 17.9 †† | 11.2 | 5.4 ††† | 25.7 |
| Something else | 2.2 ††† | 4.9 | 7.3 | 3.2 | 5.7 | 2.9 |
| No. of observations | 125 | 135 | 114 | 138 | 147 | 125 |
5.3.2 Parents' reports of the actions resulting from disclosure
Parents who reported disclosing family violence and safety concerns were then asked what happened after these disclosures were made. The response options allowed for seven specific actions and one miscellaneous option ("something else") to be chosen. Multiple responses were possible.
Overall, the data in Table 5.14 suggest a relatively stable pattern of experiences of responses in both cohorts. Around one-third of parents in both cohorts reported that "nothing happened" in relation to their disclosure of family violence, and this was higher for safety concerns (around four in ten parents). Fathers were more likely to report this than mothers for both kinds of concerns in both time frames.
| Disclosure of family violence (%) | Disclosure of safety concerns (%) | |||||||
|---|---|---|---|---|---|---|---|---|
| 2012 | 2014 | 2012 | 2014 | |||||
| Total | Total | Fathers | Mothers | Total | Total | Fathers | Mothers | |
| Notes: Data have been weighted. The "don't know" and "refused" responses were excluded from the analysis. Percentages may not total 100.0% due to rounding. Statistically significant differences between 2012 and 2014 within a given population are noted: * p < .05; ** p < .01; *** p < .001. Statistically significant differences between mothers and fathers within a given population (years) are noted: † p < .05; †† p < .01; ††† p < .001. | ||||||||
| Action taken | ||||||||
| Nothing happened | 35.2 | 32.2 | 41.0 | 26.8 | 41.3 | 41.5 | 48.2 | 36.9 |
| Referral to relevant support services | 31.8 | 35.8 * | 22.8 | 43.7 | 23.4 | 24.6 | 16.5 | 30.3 |
| Advised to get a protection order | 27.9 | 26.3 | 16.0 | 32.7 | 15.1 | 17.0 | 9.5 | 22.2 |
| Other parent's time with child temporarily reduced | 21.8 | 20.8 | 8.0 | 28.7 | 21.1 | 20.1 | 8.3 | 28.4 |
| Safety plans were put in place | 20.0 | 21.7 | 10.0 | 28.9 | 19.6 | 20.5 | 11.2 | 27.0 |
| Appointment of an Independent Children's Lawyer (ICL) was requested/granted | 11.1 | 11.0 | 14.1 | 9.1 | 10.0 | 9.6 | 12.8 | 7.4 |
| Participant's time with child temporarily reduced | 7.8 | 9.0 | 19.4 | 2.5 | 7.7 | 6.4 | 12.9 | 1.8 |
| Something else | 4.0 | 4.5 | 5.3 | 4.1 | 4.7 | 4.8 | 6.5 | 3.6 |
| No. of observations | 1,203 | 1,271 | 451 | 820 | 1,136 | 1,219 | 464 | 755 |
| Of those reporting at least one action: | ||||||||
| One action taken | 45.7 | 47.9 | 57.7 | 43.0 | 53.4 | 51.0 | 60.6 | 45.6 |
| Two actions taken | 27.5 | 23.6 | 25.5 | 22.7 | 23.2 | 24.4 | 25.5 | 23.8 |
| Three or more actions taken | 26.8 | 28.5 | 16.8 | 34.3 | 23.5 | 24.6 | 13.9 | 30.6 |
| No. of observations | 849 | 777 | 255 | 594 | 643 | 692 | 229 | 463 |
The only area where changes between cohorts are evident to a statistically significant extent is in relation to referrals to relevant support services where family violence was reported. The proportion of parents reporting this response rose by 4 percentage points (to 36%) in 2014. This increase mostly reflects a greater proportion of mothers nominating this response in 2014 than in 2012 (2012: 36% cf. 2014: 44%), with a very marginal decrease evident among fathers (2012: 24% cf. 2014: 23%) (2012 gender data not shown; see De Maio et al., 2013, Table 5.4).
There are some subtle indications of increases from 2012 to 2014 in responses designed to support safety, particularly for mothers. The proportions of mothers indicating that a safety plan was put in place rose from 24% in 2012 to 29% in 2014 where family violence was reported, and from 24% to 27% where safety concerns were reported. Where safety concerns were raised in 2014, 22% of mothers reported being advised to get a protection order, compared with 18% in 2012. Where family violence was raised, the increase in protection order advice was smaller: 33% in 2014 compared with 33% in 2012. Proportions of fathers reporting these responses in these areas all increased as well, but to a much lesser extent (2012 gender data not shown; see De Maio et al., 2013, Table 5.4).
These data cannot be directly used to assess the extent to which the dynamics have changed, if at all, in relation to the seriousness of the concerns disclosed. There are, however, some aspects of these data that support some exploratory inferences on this question, to the extent that the responses reported by parents can be assumed to be appropriate and proportionate to the nature of the concerns disclosed. There are two sets of responses that might be suggestive of particularly serious concerns being raised. These are responses that indicate a reduction in time spent with the child for either the parent being interviewed or their former partner. There are negligible changes in the patterns for these response options between the two cohorts in relation to family violence or safety concerns. For both cohorts, mothers were substantially more likely than fathers to report that the other parent's time with the child was reduced in response to a disclosure of family violence and safety concerns, and substantially less likely to report their own time was reduced. For fathers, the pattern is reversed. In both time frames, for both family violence and safety concerns, fathers were much more likely to report that their own time with their child was reduced as a result of disclosure.
A further area where responses reported by parents might be indicative of greater or lesser seriousness of concerns, or conversely greater or lesser emphasis by professionals, is in relation to the number of actions reported by parents. This is an area where small changes between the two cohorts are evident overall, but some bigger changes are evident according to gender. For fathers who reported disclosing family violence, the proportions who reported that one action was taken increased between 2012 (43%) and 2014 (58%). Fathers disclosing family violence and reporting three or more actions diminished: from 28% in 2012 to17% in 2014. For mothers, the proportions increased substantially in relation to three or more actions: from 27% in 2012 to 34% in 2014. In relation to safety concerns, the patterns are similar. The proportions of fathers reporting three or more actions fell from 25% to 14%, but the proportion of mothers reporting this rose from 23% to 31% (2012 gender data not shown; see De Maio et al., 2013, Table 5.4).
Considered together, the findings in relation to reductions in time spent with the child as a consequence of disclosure of family violence and safety concerns tend to suggest some complexities surrounding fathers' disclosures in relation to these issues. The fact that fathers' disclosures are more likely to result in a reduction of their own time with the child would tend to suggest such disclosures arise in the context of particularly difficult relationship dynamics in some instances. In this context, it would appear that little has changed since the 2012 family violence reforms.
At the same time, the differences in patterns in the number of actions taken in relation to disclosures of family violence and safety concerns suggest professional actions consistent with lesser seriousness for some fathers' disclosures and greater seriousness for some mothers' disclosures. These data do not, however, permit understanding of the extent to which professionals' assessments are valid.
5.3.3 Influence on care-time arrangements of disclosure of family violence and safety concerns
The relationship between care-time arrangements and disclosures of family violence is further explored in this section.
The distribution of care-time arrangements in 2014 for parents who disclosed experiences of family violence compared to parents who did not disclose such incidents is provided in Figure 5.7. Irrespective of whether they disclosed family violence, the most common care-time arrangement reported by both mothers and fathers was where the child spent the majority of nights with the mother.
Among fathers who experienced family violence before/during or since separation, a significantly higher proportion who had disclosed that violence had the child in their care 100% of nights (2012: 7%; 2014: 6%), compared to fathers who did not disclose family violence (2012: 3%; 2014: 2%).
Similar results emerged among mothers who experienced family violence, with significantly more mothers who disclosed family violence in both cohorts having the child in their care 100% of nights, compared to mothers who did not disclose. Further, in 2014, a significantly higher proportion of mothers who did not disclose family violence had 66-99% care time, compared with mothers who did disclose. The data suggest that among mothers who experienced family violence, much of the shift in care time occurred between these two care-time groups, when disclosure occurred.
Figure 5.7: Current care-time arrangements, by whether parents disclosed family violence, 2012 and 2014
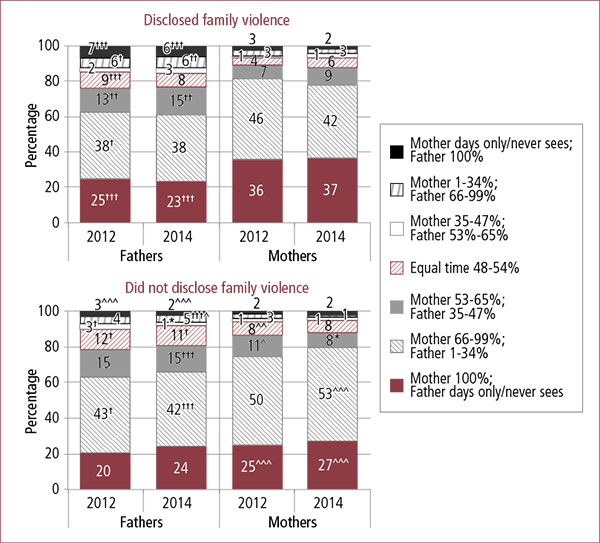
Notes: Data have been weighted. Statistically significant differences between 2012 and 2014 within a given population are noted: * p < .05; ** p < .01; *** p < .001. Statistically significant differences between mothers and fathers within a given population (years) are noted: † p < .05; †† p < .01; ††† p < .001. Statistically significant differences between disclosing and not disclosing within a given population (parent gender & year) are noted: ^ p < .05; ^^ p < .01; ^^^ p < .001.
No statistically significant differences in care time emerged among mothers and fathers who disclosed family violence between 2012 and 2014. However, among fathers who did not disclose family violence, there was a small but significant decrease in the proportion with 53-65% care of the child (2012: 3% cf. 2014: 1%). Among mothers who did not disclose family violence, there was also a small but significant decrease in the proportion with 53-65% care (2012: 11% cf. 2014: 8%).
Differences between mothers and fathers were apparent in both cohorts across many, but not all, care-time groups. Many of these differences were somewhat expected; for example, among parents who disclosed family violence, significantly fewer fathers than mothers reported that the child spent 100% of nights with the mother, and significantly more fathers than mothers reported that the child spent 100% of nights with the father. Among parents who did not disclose family violence in 2014, significantly more fathers than mothers reported shared care (mother 53-65% of care time; fathers: 15% cf. mothers: 8%) and equal care (fathers: 11% cf. mothers: 8%), while significantly more mothers than fathers reported mother majority care time (mothers: 53% cf. fathers: 42%).
The distribution of care-time arrangements in 2014 among parents who disclosed current safety concerns during parenting negotiations, compared to those who had safety concerns but did not disclose them, is set out in Figure 5.8. In relation to the disclosure of safety concerns and the association with greater likelihood of 100% care time, fathers' disclosure of safety concerns appeared to have a greater influence in this respect than mothers, and this pattern is consistent for fathers between the two cohorts. For mothers in 2012, non-disclosure of safety concerns appeared to result in a greater proportion of equal shared care, and a lesser likelihood of mother 100% care time, compared with mothers who did disclose their safety concerns. This pattern was not sustained in the 2014 cohort, with none of the differences between mothers who disclosed safety concerns and those who did not reaching statistical significance. Specifically, in 2012, mothers who did not disclose safety concerns reported a significantly smaller proportion of mothers having 100% care time compared to those who did disclose (did not disclose: 28% cf. disclosed: 42%), while a significantly higher proportion of mothers who did not disclose reported equal care time (9%), compared with those who did disclose (3%). Neither of these significant differences emerged in 2014, with 44% of mothers who disclosed safety concerns having 100% care time (cf. 38% who did not disclose), and 4% of mothers who disclosed safety concerns having equal care time (cf. 6% who did not disclose).
Figure 5.8: Current care-time arrangements, by whether parents disclosed safety concerns, 2012 and 2014
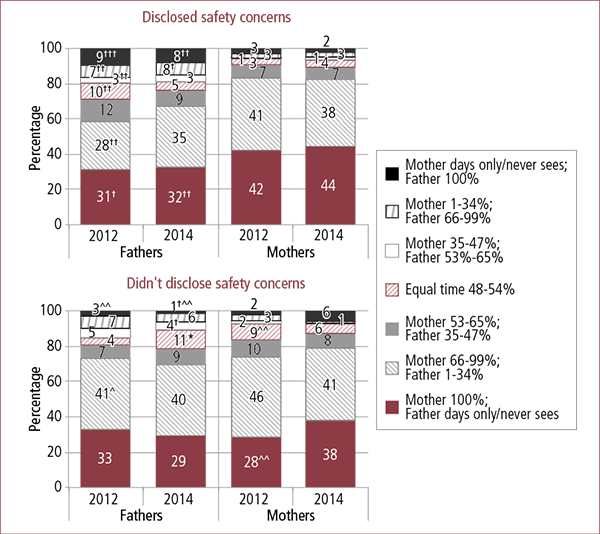
Notes: Data have been weighted. Statistically significant differences between 2012 and 2014 within a given population are noted: * p < .05; ** p < .01; *** p < .001. Statistically significant differences between mothers and fathers within a given population (years) are noted: † p < .05; †† p < .01; ††† p < .001. Statistically significant differences between disclosing and not disclosing within a given population (parent gender & year) are noted: ^ p < .05; ^^ p < .01; ^^^ p < .001.
Among fathers with safety concerns, where these concerns were disclosed, 8% of fathers reported having the child 100% of nights in 2014, a significantly higher proportion compared with fathers who did not disclose these concerns (1%). This was also the case in 2012. Various differences emerged between mothers' and fathers' reported care-time arrangements in the context of safety concerns disclosure. For example, in 2014, significantly more mothers than fathers who disclosed safety concerns had arrangements where the child spent 100% of nights with the mother (mothers: 44% cf. fathers: 32%).
Interestingly, among parents who did not disclose safety concerns, significantly more mothers than fathers in 2014 reported the child spent 100% of nights with the father (mothers: 6% cf. fathers: 1%), while only fathers reported a shared care-time arrangement where the child spent 53-65% of nights with the father (fathers: 4% cf. mothers: 0%). No significant differences between 2012 and 2014 emerged.
Where parents indicated they disclosed family violence or safety concerns to family law professionals, they were also asked to specify to what extent this disclosure influenced their parenting arrangements. These data are presented in Table 5.15 and the most noticeable aspect of this analysis is the very little change in parents' perceptions of the influence of disclosures on negotiated care-time arrangements between 2012 and 2014.
| How much influenced parenting arrangements | Disclosure of family violence (%) | Disclosure of safety concerns (%) | ||||||
|---|---|---|---|---|---|---|---|---|
| 2012 | 2014 | 2012 | 2014 | |||||
| Total | Total | Fathers | Mothers | Total | Total | Fathers | Mothers | |
| Notes: Data have been weighted. The "don't know" and "refused" responses were excluded from the analysis (4-11%). Percentages may not total 100.0% due to rounding. Statistically significant differences between 2012 and 2014 were not found. Statistically significant differences between mothers and fathers within a given population (years) are noted: † p < .05; †† p < .01; ††† p < .001. | ||||||||
| Very much | 30.5 | 30.2 | 24.5 | 33.5 †† | 30.7 | 29.4 | 21.3 | 34.8 ††† |
| Somewhat | 22.9 | 22.3 | 20.0 | 23.7 | 25.2 | 23.1 | 20.4 | 25.0 |
| Not really | 19.3 | 18.7 | 19.7 | 18.0 | 15.8 | 16.4 | 17.6 | 15.6 |
| Not at all | 27.3 | 28.8 | 35.9 | 24.7 ††† | 28.3 | 31.1 | 40.7 | 24.6 ††† |
| No. of observations | 1,151 | 1,201 | 413 | 788 | 1,052 | 1,130 | 425 | 705 |
In both cohorts, 53% of parents who disclosed family violence reported that this "very much" or "somewhat" influenced their child's parenting arrangements. This was similar to the corresponding proportion of parents who disclosed safety concerns (2012: 56% and 2014: 53%).
As found in the SRSP 2012 survey findings, fathers were more likely to report that their disclosures of family violence and safety concerns did "not at all" influence parenting arrangements. In 2014, the difference in the proportion of fathers selecting this option compared to mothers was 10 percentage points for the group disclosing family violence and 15 percentage points for those disclosing safety concerns. The corresponding difference in the SRSP 2012 was around 10 percentage points (data not shown).
Figure 5.9 shows parents' perceptions of the extent to which their disclosure of family violence influenced parenting arrangements, analysed by the type of care-time arrangement they reported. Parents reporting care-time arrangements where the child never saw either the mother or father or had daytime-only contact with the other parent were more likely to report that their disclosure had "very much" influenced the care-time arrangements of their child. Almost one-half (47%) of parents in 2012 where the child never saw or had daytime-only contact with their father reported that their disclosure of family violence had "very much" influenced this arrangement. This proportion increased to 54% in 2014. The figure shows that as parents' care-time increased towards more shared arrangements, their perceptions that disclosure of concerns influenced their parenting arrangements decreased, with only 22-24% of parents across both cohorts indicating that disclosure influenced parenting arrangements "very much".
When interpreting these findings it is worth noting that for the sub-population who disclosed family violence to family law professionals, the majority of parents (74%) who reported that the father never saw or had daytime-only contact were female (not shown). The reverse was true for parents who reported the mother never saw or had daytime-only contact with the child (67% of these parents were male), although the samples of parents where the father had majority or 100% care of the child were too small to analyse in this instance.
Figure 5.9: Influence on parenting arrangements of disclosing family violence, by care-time arrangements, 2012 and 2014
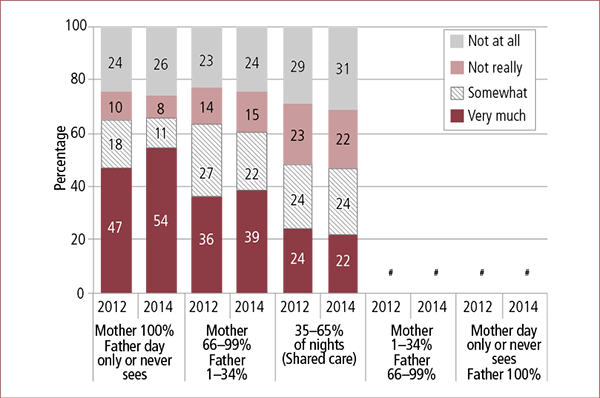
Notes: Data have been weighted. # = Data not shown where sample sizes for care-time categories were fewer than 50 responses. Percentages may not total 100.0% due to rounding. Differences between 2012 and 2014 were not statistically significant.
5.4 Summary
This chapter has examined several different aspects of the dynamics surrounding disclosure of family violence and safety concerns, drawing on comparisons of responses from the 2012 and 2014 cohorts of SRSP parents.
5.4.1 Disclosure of family violence to police and other services
A small but statistically significant increase in the proportion of parents who reported disclosing family violence before/during or since separation to at least one of a range of possible services and organisations is evident. The proportions of parents disclosing increased from 53% in 2012 to 56% in 2014. Mothers were more likely to report violence than fathers (2014 - mothers: 63% cf. fathers: 49%) and the relative proportions of men and women reporting disclosure remained similar. Notably, just over four in ten parents did not disclose family violence to any service in 2014. Physical violence was more likely to be reported than emotional abuse, and the most common service reported to was police (25% in 2014).
Data on the reasons parents did not disclose family violence to any service demonstrate that a considerable minority (2012: 43% and 2014: 38%) did not feel it was serious enough to report. Another quarter indicated they felt they could deal with the issue themselves. These findings suggest that parents self-select into disclosing, and that this is not an inevitable response where family violence is experienced. It also means that a history of family violence is not documented or corroborated for a substantial number of people who experience it. This may or may not have implications for the parents who self-select into not disclosing for reasons that may be regarded as relatively benign, bearing in mind that even these reasons can't necessarily be taken to imply that the family violence is at the lower end of the spectrum of severity (Chapter 3). For parents who do not report for reasons suggestive of very difficult circumstances, such as fear (2014 - mothers: 5% cf. fathers: 2%), the implications are even more concerning since the difficulty establishing a relevant history for the purposes of engagement with the family law system after separation may mean that experiences in this range are not given the attention that they warrant. It also means that people who need help and assistance may not get it.
5.4.2 Asking and telling about family violence
Parents' reports on whether they were asked by family law system professionals about family violence indicate an increased emphasis on screening, in keeping with the intent of the 2012 family violence amendments. Statistically significant increases are evident in the proportions of parents who reported using a formal pathway to resolve their parenting arrangements and being asked about family violence and safety concerns. Increases are evident among parents who used the three formal pathways (FDR/mediation, lawyers and courts), but particularly evident for those using lawyers and courts, with increases of about 10 percentage point in the proportions reporting being asked about family violence and safety concerns. Notably, however, close to three in ten parents reported never being asked about either of these issues in each pathway, indicating that the implementation of consistent screening approaches has some way to go.
Moving from the question of being asked (the focus being on professional behaviour) to the issue of disclosing (the focus being on the parents' behaviour), the findings on the proportions of parents who reported disclosing family violence or safety concerns when using particular pathways demonstrate a small increase in the number of parents who reported disclosing each type of concern across each pathway from 2012 to 2014. This is consistent with the operation of FLA s 60I under which matters involving family violence and/or safety concerns are exceptions to the requirement to attempt family dispute resolution prior to lodging a court application for a parenting order.
In terms of differences in patterns between the two cohorts, increases in disclosure rates are generally evident, but there are some differences in the extent of increases according to pathway, gender and whether family violence or safety concerns were disclosed. The findings show statistically significant increases in the disclosure of family violence where the main pathways were FDR/mediation (up 4 percentage points to 32% in 2014), and lawyers (up 6 percentage points to 49%), largely accounted for by increases in reporting by fathers. In relation to safety concerns, greater proportions of fathers in the 2014 cohort reported disclosing safety concerns in FDR/mediation (up by 5 percentage points to 25%). In relation to lawyers, the 13 percentage-point increase (to 45%) in the proportions of fathers disclosing safety concerns is statistically significant. The increases in the proportions of mothers reporting disclosing safety concerns were greatest where lawyers were the main pathway (up by 8 percentage points to 61%). The data for mothers disclosing safety concerns when courts were the main pathway show an increase of 6 percentage points, whereas fathers showed a decrease of 5 percentage points. Notably, parents uncommonly reported that the other parent disclosed either of these concerns, and reports of disclosure on the part of both parents were also rare.
The findings just discussed are based on reports about disclosures of family violence or safety concerns made by all parents who reported using a formal pathway for reaching parenting arrangements. Analysis focusing more specifically on parents who experienced family violence or held safety concerns, and who had contact with family law professionals show small overall increases in the proportions of parents indicating they disclosed these concerns to professionals. Overall, 45% of all parents in 2014 disclosed family violence to professionals (cf. 42% in 2012), and 74% disclosed safety concerns (cf. 70% in 2012). Among mothers, however, disclosure of safety concerns to professionals increased significantly between 2012 and 2014 (from 73% to 79%). For both types of concerns, mothers were more likely to disclose than fathers.
5.4.3 Consequences of disclosing family violence and safety concerns
In light of these very modest increases in reports of disclosure, which do not suggest any great change in the extent to which concerns are disclosed, findings on changes in parents' perceptions of whether professionals' responses were appropriate are inconsistent with positive effects arising from the reforms. In considering these findings, it is important to reiterate their exploratory nature, given the absence of statistically significant changes and small sample sizes in some areas, especially groups who used courts. On the basis of a conservative interpretation of the data, the findings suggest that in this area, there has been little change; if anything, the evidence is suggestive of a move in a negative rather than positive direction. Overall, there was a very slight increase in parents reporting that their concerns were being ignored or not considered relevant, and a very slight decrease in perceptions that their concerns were taken seriously. In relation to family violence, the proportion of fathers reporting positive responses (taken seriously and dealt with appropriately) rose, and the proportion of mothers reporting this fell. In relation to safety concerns, the proportions of both mothers and fathers nominating the positive response fell.
In relation to the data on mothers' and fathers' experiences with different pathways, the findings show that in relation to family violence disclosures, positive responses fell among mothers who used FDR/mediation and courts. Findings were similarly less positive for fathers for FDR/mediation and courts (to a greater extent for courts). In relation to lawyers, mothers' perceptions showed little change, but fathers' were more positive.
In the context of safety concerns, positive experiences were less likely to be reported by parents across all three pathways. Among fathers, decreases were marked for FDR/mediation and lawyers, and minimal for courts. Among mothers, the biggest drop was for those who used courts. Decreases were less significant for lawyers, and minimal for FDR/mediation.
The findings on disclosure and satisfaction with the professional responses to disclosure raise questions about differences in the way in which family violence and safety concerns are regarded by parents and professionals. The data reported in this chapter show that, where they experience these issues, parents are significantly more likely to report safety concerns than family violence (Figures 5.5 and 5.6), yet professionals are less likely to respond in ways that parents consider appropriate (Table 5.10).
Findings on the actions taken as a result of disclosure of family violence concerns were largely stable between the two cohorts, although there was a statistically significant increase in the number of parents reporting referrals to relevant support services (to 36%), and this overtook "nothing happened" as the most common response in 2014. There were small increases in the proportions of parents reporting responses to support safety, such as obtaining personal protection orders and implementing safety plans, where both family violence and safety concerns were raised.
Examination of the dynamics concerning parenting arrangements where family violence or safety concerns are disclosed suggest limited change in this area, with similar response patterns evident among both cohorts of fathers and mothers. However, comparing parenting arrangements of those who disclosed and those who did not showed that fathers who disclosed family violence appeared to have a greater proportion of father-majority (66-100% of nights) and father 100% care time compared to fathers who did not disclose. Similarly, mothers who disclosed family violence had a significantly higher proportion of 100% care time, than mothers who did not disclose, though the overall proportions of mother-majority care time were very similar, regardless of whether disclosure occurred or not. Fathers who disclosed safety concerns also reported a significantly higher proportion of father 100% care time than fathers who did not disclose safety concerns. No significant differences emerged in 2014 between mothers who disclosed safety concerns and those who did not. However, in 2012, mothers who did not disclose safety concerns had a greater proportion of equal shared care time and a smaller proportion of mother 100% care time compared to mothers who did disclose. These differences were not sustained in SRSP 2014, suggesting that non-disclosure in this cohort appeared to have less influence on care-time arrangements for mothers than it did in 2012.
In both cohorts, three in ten parents indicated the disclosure influenced parenting arrangements "very much", and mothers were more likely than fathers to choose this response in relation to both issues in both cohorts. Any indication of change is subtle, but one such area is in the selection of the "very much" response by fathers in relation to safety concerns, which increased from 21% in 2012 to 25% in 2014, although the "not at all" response decreased from 41% in 2012 to 36% in 2014.
5.5 Discussion
Overall, the data presented in this chapter indicate conclusions consistent with a positive effect of the reforms in some areas, and limited or mixed effects in others. Parents' reports indicate a greater emphasis on screening for and identifying family violence and safety concerns, especially in relation to lawyers and courts. Patterns in parents' reports of disclosure suggest that safety concerns are of greater salience to parents than family violence, but professionals' responses to safety concerns appear to be less satisfactory from parents' perspectives than their response to family violence. Substantial minorities of parents still reported not disclosing either kind of concern, but this was more marked for family violence than safety concerns.
Limited or mixed effects are suggested by parents' perspectives on systemic responses to family violence and safety concerns. The examination of consequences of disclosing shows the response to a substantial minority of disclosures of family violence and safety concerns remains "nothing", although there is some indication of an increased emphasis on providing referrals and safety-oriented actions, such as safety planning and obtaining intervention orders. Parents' assessments of whether professionals responses were appropriate (i.e., that their concerns were taken seriously and dealt with appropriately) show mixed effects, with some indication of less satisfaction, particularly in relation to safety concerns.
On this basis, the elements of the reforms related to screening and identification can be seen to be having a positive effect. In contrast, the elements of the reforms related to improving the system's response to family violence and safety concerns, with the ultimate aim of assisting parents to make parenting arrangements that meet children's best interests, with a particular priority on safety, can be seen to be having a limited effect. Given the small increases in the proportions of parents disclosing both kinds of concerns, and the evidence in the first part of the chapter about self-selection into disclosure, it is unlikely that this pattern of findings reflects the consequences of over-disclosure of insignificant or trivial concerns to any great extent.
10 For clarity, the term "disclosed" is used to refer to when a parent reported family violence or safety concerns to professionals, either before/during or since separation.
11 For both family violence and safety concerns, these include responses where just the participant disclosed, as well as cases where both the participant and the focus parent disclosed.
12 This question was programmed to only display the issue that had not been disclosed. That is, if a parent reported having experienced family violence in the survey, but did not have any current safety concerns, the question was: "What was the main reason why you didn't raise or disclose any concerns about family violence?" Whereas, if a parent did not report having experienced family violence or reported that they had disclosed family violence to professionals, but had current safety concerns and had not disclosed safety concerns to family law professionals, the question was: "What was the main reason why you didn't raise or disclose any concerns about the safety of <child>?"
13 As mentioned in the discussion for Table 5.10 in section 5.2.3, this question was asked of parents who had reported having current safety concerns for themselves or their child, but reported not disclosing safety concerns to professionals during parenting negotiations. We believe it is therefore possible that for some of these parents, their safety concerns at the time of the survey had only emerged more recently and might not have been present at the time of their contact with family law professionals.
This chapter sets out parents’ views of various aspects of the family law system, with a focus on differences between the responses of the 2012 and 2014 cohorts. It first considers how parents responded to a range of propositions about the family law system, including its efficacy in meeting the needs of children and parents and dealing with family violence. Data on the more specific question of whether particular pathways worked for parents and children are then considered. Finally, the level of awareness of the 2012 family violence amendments among the parents in the two samples is examined.
6.1 Effectiveness of the family law system
In order to gain insight into parents’ views of the effectiveness of the family system, SRSP 2012 participants were asked how much they agreed or disagreed that the current family law system effectively:
- addresses family violence issues;
- meets the needs of mothers;
- meets the needs of fathers;
- meets the needs of children;
- protects children’s safety; and
- helps parents find the best outcome for their children.
Possible responses to the six questions were: strongly agree, agree, neither agree nor disagree, disagree, strongly disagree, and don’t know. For ease of presentation, participants were considered to agree with the statement if they responded strongly agree or agree, and to disagree if they responded disagree or strongly disagree. Responses of don’t know and neither agree nor disagree have been combined for the analyses in this section due to the response bias issue discussed in section 1.2.4 of this report.
The following discussion sets out the overall distribution of responses to each statement for mothers and fathers in each cohort (see Appendix 3, Table B4), as well as presenting more detailed discussion of the differences in responses by parents with and without a history of family violence and safety concerns. Overall, the data examined in section 6.1 suggest that parents’ views of the effectiveness of the family law system have shifted to a small but mostly statistically significant extent, in a direction consistent with the objectives of the 2012 family violence amendments. The 2014 cohort was more likely to endorse the efficacy of the family law system in relation to each of the global statements provided, with the exception of the one concerning the safety of children. As the forthcoming discussion demonstrates, these shifts are mostly accounted for by changes in the views of the sub-populations affected by family violence. The positive shifts seen in relation to the efficacy of the family law system among parents affected by family violence are not reflected to the same extent in the responses of parents who held concerns for their own safety or the safety of their children (or both) at the time of the survey.
In addition to the analysis highlighting responses from fathers and mothers in each cohort, findings from two further sets of analyses are also described. One focuses on experiences of family violence, which compares parents who reported in the survey that they had (a) experienced physical violence; (b) experienced emotional abuse alone; or (c) not experienced any violence. (Analyses of responses from parents who had experienced family violence since separation are similar to those who experienced violence before/during separation. The data for the former group of parents are included in Appendix 3, Table B5.)
The second set of analysis concerns parents with and without safety concerns as a result of ongoing contact with the other parent. Analyses of response patterns to the questions are based on parents who reported in the survey that: (a) they had current safety concerns for themselves and their child in the survey (“concerns for both”); (b) they had safety concerns for themselves only (“concerns for self”); (c) they had safety concerns for their child only (“concerns for child”); (d) they had no safety concerns (“no concerns”); and (e) the safety concerns question was not relevant to them because there was no contact with the other parent (“no contact”). It is possible that the experiences of this last group may reflect the effects of the family law system in this area, although it is uncertain whether their arrangements for no contact arose as a result of engagement with family law system services or as a result of other circumstances (e.g., the other parent may have moved, or been in gaol, or had personal protection orders in place against them that prohibited contact).
The following discussion sets out findings for each question for each group in each cohort. There was a relatively high proportion of “don’t know” responses to all statements (23–36% in 2012 and 27–46% in 2014) compared with the other questions in the survey, for both cohorts. For this reason, these responses have been included in the tables.
6.1.1 The family law system addresses violence issues
In relation to the statement that the “family law system addresses family violence issues”, the overall level of agreement among parents increased in 2014 by 4 percentage points to 32%. Increased proportions of both fathers and mothers endorsed the statement in 2014, rising by 3 percentage points for fathers and 4 percentage points for mothers (data not shown).
These statistically significant increases are accounted for by increases among the groups of parents who reported experiencing family violence before/during separation in the survey (Figure 6.1). The strongest increase of 7 percentage points was evident among the group that reported physical violence (35% agreeing with the statement). A slightly lower increase (4 percentage points) was evident among parents who reported experiencing emotional abuse (32% gave positive responses). In both periods, close to three in ten parents in the physical violence group disagreed with the proposition, and this also increased slightly by 2 percentage points in 2014. A similarly small increase of 2 percentage points occurred in the emotional abuse group in 2014, with disagreement indicated by 18% in 2014. Changes among the group not affected by family violence were negligible in relation to both positive and negative views.
Figure 6.1: Parents’ views on whether family law system addresses family violence, by experience of family violence before/during separation, 2012 and 2014
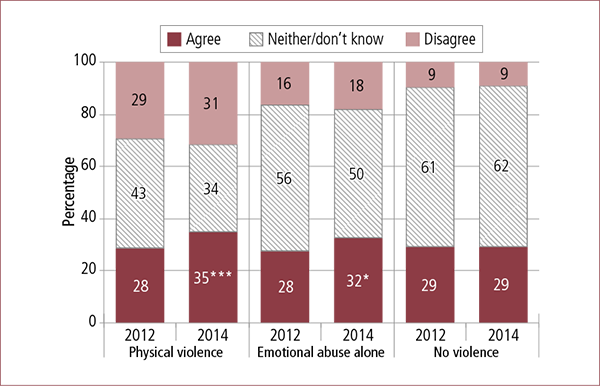
Notes: Data have been weighted. Sample sizes: physical violence—2012: n = 1,252, 2014: n = 1,144; emotional abuse alone—2012: n = 1,547, 2014: n = 1,316; no violence—2012: n = 1,148, 2014: n = 866. Data were excluded where parents did not provide a response (i.e., “refusal”). Percentages may not total 100.0% due to rounding. Statistically significant differences between 2012 and 2014 within a given population are noted: * p < .05; ** p < .01; *** p < .001.
Figure 6.2 sets out the pattern of responses to this question among groups of parents with and without current safety concerns. This analysis highlights a general pattern of small increases in agreement levels among all groups, reaching a level of statistical significance for the “concerns for child” (2012: 24% cf. 2014: 31%) and “no concerns” groups (2012: 29% cf. 2014: 32%). Even with this statistically significant increase in agreement among the “concerns for child” group, levels of agreement were second lowest, with the “concerns for both” group lowest of all at 26% in 2014, representing a non-significant increase on 23% in 2012. Disagreement with the statement was strongest of all among this group in both periods, increasing in 2014 to 50%, from 44% in 2012. In contrast with minor and stable levels of disagreement among the “no safety concerns” groups (13%), about one-third of each of the other two groups with safety concerns disagreed with the proposition in both periods.
Figure 6.2: Parents’ views on whether family law system addresses family violence, by whether they had current safety concerns, 2012 and 2014
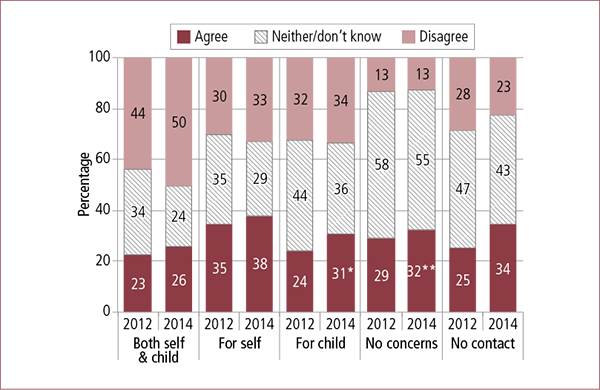
Notes: Data have been weighted. Sample sizes: both self & child—2012: n = 298, 2014: n = 331; for self—2012: n = 172, 2014: n = 137; for child—2012: n = 385, 2014: n = 358; no concerns—2012: n = 2,921, 2014: n = 2,222; no contact with other parent—2012: n = 97, 2014: n = 107. Data were excluded where parents did not provide a response (i.e., “refusal”). Percentages may not total 100.0% due to rounding. Statistically significant differences between 2012 and 2014 within a given population are noted: * p < .05; ** p < .01; *** p < .001.
6.1.2 The family law system meets the needs of mothers
The statement that “the family law system meets the needs of mothers” also attracted a greater level of endorsement in 2014, with positive responses increasing by 4 percentage points (to 54%) on an aggregate basis (see Appendix 3, Table B4). Increases in endorsement were evident among both fathers (3 percentage points) and, to a greater extent, mothers (4 percentage points). Changes in disagreement levels were negligible. It is notable that views on this question were very different among fathers (64% agreeing in 2014) compared with mothers (44% agreeing in 2014) (see Appendix 3, Table B4).
Figure 6.3 demonstrates that the shifts evident in the aggregate data are accounted for by increases in positive views to a statistically significant extent among parents in the sub-populations affected by physical violence (increase of 6 percentage points) and emotional abuse (increase of 5 percentage points) before/during separation. Proportions disagreeing were largely stable between the survey cohorts.
Figure 6.3: Parents’ views on whether family law system meets mothers’ needs, by experience of family violence before/during separation, 2012 and 2014
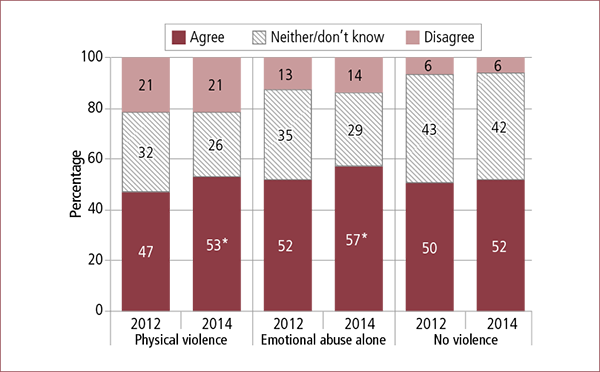
Notes: Data have been weighted. Sample sizes: physical violence—2012: n = 1,252, 2014: n = 1,144; emotional abuse alone—2012: n = 1,547, 2014: n = 1,316; no violence—2012: n = 1,148, 2014: n = 866. Data were excluded where parents did not provide a response (i.e., “refusal”). Percentages may not total 100.0% due to rounding. Statistically significant differences between 2012 and 2014 within a given population are noted: * p < .05; ** p < .01; *** p < .001.
When the responses of the groups with and without safety concerns are considered (Figure 6.4), rates of agreement increased to statistically significant extents for parents in the “concerns for child” and “no concerns” groups, and levels of disagreement among these groups were largely stable. In relation to the other groups, increased proportions agreed with the statement, except for the “concerns for self” group, with agreement falling from 50% to 47%. Negative views are most clearly evident among the “concerns for self and child” group, with the response patterns in 2014 showing greater polarity than the 2012 patterns. In 2014, 36% disagreed with this statement (cf. 30% in 2012) and 45% agreed (cf. 40% in 2012).
Figure 6.4: Parents’ views on whether family law system meets mothers’ needs, by whether they had safety concerns, 2012 and 2014
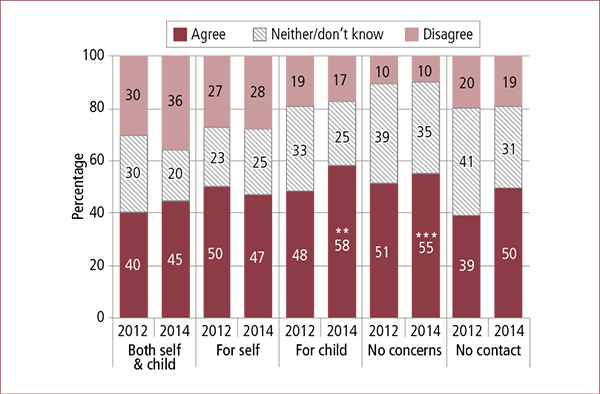
Notes: Data have been weighted. Sample sizes: both self & child—2012: n = 298, 2014: n = 331; for self—2012: n = 172, 2014: n = 137; for child—2012: n = 385, 2014: n = 358; no concerns—2012: n = 2,921, 2014: n = 2,222; no contact with other parent—2012: n = 97, 2014: n = 107. Data were excluded where parents did not provide a response (i.e., “refusal”). Percentages may not total 100.0% due to rounding. Statistically significant differences between 2012 and 2014 within a given population are noted: * p < .05; ** p < .01; *** p < .001.
6.1.3 The family law system meets the needs of fathers
The statement that “the family law system meets the needs of fathers” also received a greater level of endorsement in 2014, albeit to a lesser extent than the same statement in relation to mothers. On an aggregate level, endorsement increased by 4 percentage points, with positive responses from one-third of parents in 2014 (see Appendix 3, Table B4). Increased endorsement was evident among mothers (6 percentage points to 43%) to a greater extent than fathers (3 percentage points to 24%) (see Appendix 3, Table B4). As with the statement in relation to mothers, it is noteworthy that the proportions of mothers and fathers agreeing with this proposition are substantially different. In 2014, endorsement by fathers hovered at just below a quarter, compared with just over four in ten among mothers. The differences between the proportions disagreeing were stronger still, with 24% of fathers disagreeing in 2014 (a small increase on 2012 levels), and 13% of mothers (see Appendix 3, Table B4).
Again, the increases in positive responses in the aggregate results are accounted for by increases in positive attitudes among the sub-groups affected by family violence (Figure 6.5). The proportion of parents reporting physical violence before/during separation who agreed with the statement increased by 3 percentage points to 35%, and the proportion affected by emotional abuse increased by more than 6 percentage points to 32%, both statistically significant changes. Negative responses rose among the physical violence group (by 3 percentage points to 33%), but were negligible among the other groups.
Figure 6.5: Parents’ views on whether family law system meets fathers’ needs, by experience of family violence before/during separation, 2012 and 2014
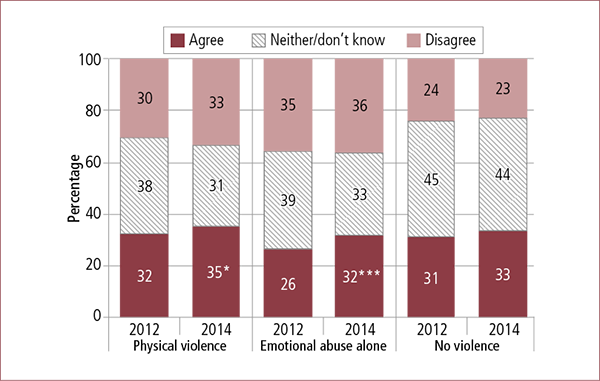
Notes: Data have been weighted. Sample sizes: physical violence—2012: n = 1,252, 2014: n = 1,144; emotional abuse alone—2012: n = 1,547, 2014: n = 1,316; no violence—2012: n = 1,148, 2014: n = 866. Data were excluded where parents did not provide a response (i.e. “refusal”). Percentages may not total 100.0% due to rounding. Statistically significant differences between 2012 and 2014 within a given population are noted: * p < .05; ** p < .01; *** p < .001.
The patterns in responses according to the different safety concerns groups (Figure 6.6) reveal a statistically significant change in two areas. One was an increased level of agreement among the group with concerns for self and child, from 32% to 39%, and the other was an increased level of disagreement in the “concerns for child” group, from 40% in 2012 to 49% in 2014. In keeping with the aggregate results, agreement among the “no safety concerns” group increased (29% to 34%), and disagreement declined nominally. For the “concerns for self” group, an evenly spread distribution of responses between the positive, negative and “neither/don’t know” categories in 2012 shifted to a more polarised picture in 2014, with 42% agreeing, 31% disagreeing and 27% nominating “neither/don’t know”.
Figure 6.6: Parents’ views on whether family law system meets fathers’ needs, by whether they had safety concerns, 2012 and 2014
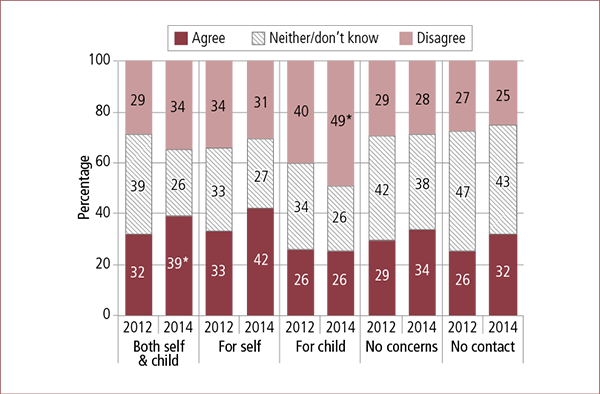
Notes: Data have been weighted. Sample sizes: both self & child—2012: n = 298, 2014: n = 331; for self—2012: n = 172, 2014: n = 137; for child—2012: n = 385, 2014: n = 358; no concerns—2012: n = 2,921, 2014: n = 2,222; no contact with other parent—2012: n = 97, 2014: n = 107. Data were excluded where parents did not provide a response (i.e., “refusal”). Percentages may not total 100.0% due to rounding. Statistically significant differences between 2012 and 2014 within a given population are noted: * p < .05; ** p < .01; *** p < .001.
6.1.4 The family law system meets the needs of children
In relation to the statement the “family law system meets the needs of the children”, the changes between the two cohorts were smaller, with an overall increase in endorsement of 3 percentage points, to 47% (see Appendix 3, Table B4). Increases were evident among both fathers (up 2 percentage points to 47%) and mothers (up 2 percentage points to 46%). Disagreement rates were largely stable (see Appendix 3, Table B4).
The increased positive response pattern mostly reflects an increase among the emotional abuse sub-group, for whom endorsement increased by 5 percentage points to 48% (statistically significant), compared to a much smaller increase of 1 percentage point for the physical violence group (Figure 6.7). Disagreement did not change for the emotional abuse group, but it was 3 percentage points higher for the physical violence group (statistically significant). Responses were stable between the time frames for the no violence group.
Figure 6.7: Parents’ views on whether family law system meets children’s needs, by experience of family violence before/during separation, 2012 and 2014
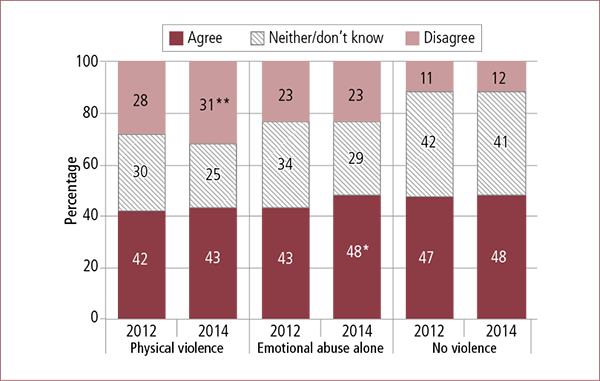
Notes: Data have been weighted. Sample sizes: physical violence—2012: n = 1,252, 2014: n = 1,144; emotional abuse alone—2012: n = 1,547, 2014: n = 1,316; no violence—2012: n = 1,148, 2014: n = 866. Data were excluded where parents did not provide a response (i.e., “refusal”). Percentages may not total 100.0% due to rounding. Statistically significant differences between 2012 and 2014 within a given population are noted: * p < .05; ** p < .01; *** p < .001.
Analysis of the responses to this question among the different safety concerns groups in Figure 6.8 highlights greater variability of attitudes. Statistically significant changes were evident for two groups: a positive change for the group with no concerns (up 3 percentage points to 50%), and a negative change for the “concerns for child” group, with disagreement rising from 34% to 40%. This reflects a small decrease in positive responses (34% to 33%) and a larger decrease in neither/don’t know responses (32% to 27%).
Figure 6.8: Parents’ views on whether family law system meets children’s needs, by whether they had safety concerns, 2012 and 2014

Notes: Data have been weighted. Sample sizes: both self & child—2012: n = 298, 2014: n = 331; for self—2012: n = 172, 2014: n = 137; for child—2012: n = 385, 2014: n = 358; no concerns—2012: n = 2,921, 2014: n = 2,222; no contact with other parent—2012: n = 97, 2014: n = 107. Data were excluded where parents did not provide a response (i.e., “refusal”). Percentages may not total 100.0% due to rounding. Statistically significant differences between 2012 and 2014 within a given population are noted: * p < .05; ** p < .01; *** p < .001.
6.1.5 The family law system protects children’s safety
The one question that did not elicit any statistically significant changes between the two cohorts was whether the “family law system protects the safety of children”. Overall, close to half the total sample of participating parents agreed with this proposition in both time frames. In the 2014 cohort, fathers were slightly more likely to agree than mothers (53% cf. 48% respectively), and mothers were more likely to disagree (17% cf. 14%) (see Appendix 3, Table B4).
Analysis based on the family violence sub-groups (Figure 6.9) shows that a positive shift was evident among parents who reported a history of emotional abuse (by 4 percentage points to 53%), the only change that was statistically significant for this question.
Figure 6.9: Parents’ views on whether family law system protects children’s safety, by experience of family violence before/during separation, 2012 and 2014
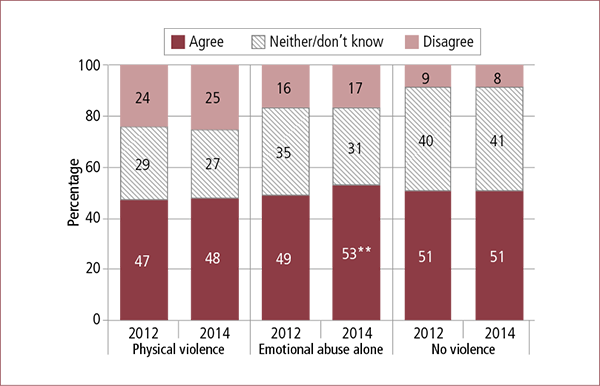
Notes: Data have been weighted. Sample sizes: physical violence—2012: n = 1,252, 2014: n = 1,144; emotional abuse alone—2012: n = 1,547, 2014: n = 1,316; no violence—2012: n = 1,148, 2014: n = 866. Data were excluded where parents did not provide a response (i.e., “refusal”). Percentages may not total 100.0% due to rounding. Statistically significant differences between 2012 and 2014 within a given population are noted: * p < .05; ** p < .01; *** p < .001.
Further analyses of this question based on the different sub-samples of parents according to safety concerns show substantial (though not statistically significant) variation exists in the general patterns of agreement or disagreement and between time frames (Figure 6.10).
Figure 6.10: Parents’ views on whether family law system protects children’s safety, by whether they had safety concerns, 2012 and 2014
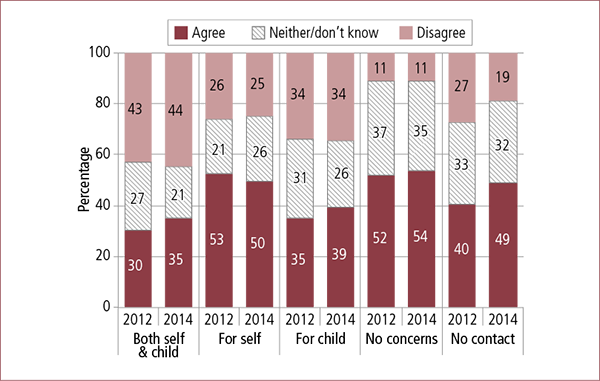
Notes: Data have been weighted. Sample sizes: both self & child—2012: n = 298, 2014: n = 331; for self—2012: n = 172, 2014: n = 137; for child—2012: n = 385, 2014: n = 358; no concerns—2012: n = 2,921, 2014: n = 2,222; no contact with other parent—2012: n = 97, 2014: n = 107. Statistically significant differences between 2012 and 2014 were not found. Data were excluded where parents did not provide a response (i.e., “refusal”). Percentages may not total 100.0% due to rounding.
Noteworthy features are summarised below:
- The greatest increase in agreement and decrease in disagreement was evident in the group that reported no contact with the other parent. Agreement with the proposition increased from 40% to 49%, and disagreement fell from 27% to 19%.
- The group most likely to agree with the proposition in both cohorts (with a slight increase in 2014 to 54%) was the group that did not have safety concerns.
- The group least likely to agree with the proposition in both cohorts was the group that reported safety concerns for both themselves and their child, although positive responses increased slightly (from 30% to 35%) and negative responses increased slightly (from 43% to 44%).
- Slightly higher proportions of positive responses were also evident among parents who had safety concerns only for the child (2012: 35% and 2014: 39%).
- Parents who had concerns for their own safety were almost as likely to endorse the proposition as parents without safety concerns, although positive responses among this group decreased slightly and negative responses also decreased slightly between cohorts. In 2014, 50% of the group endorsed the statement and 25% disagreed. In 2012, the proportion endorsing stood at 53% and the proportion disagreeing was 26%.
6.1.6 The family law system helps parents find the best outcomes for children
The final statement in the series was the family law system “helps families to find the best outcome for children”. There was a statistically significant increase in agreement, from 41% in 2012 to 45% in 2014 (see Appendix 3, Table B4). Agreement among fathers increased by 3 percentage points to 41%, and among mothers by 4 percentage points to 48%. This is an area where disagreement levels were stable, and differences between mothers and fathers were not large in comparison with other areas (see Appendix 3, Table B4).
The positive shifts are mostly accounted for by similar changes in the sub-populations affected by family violence before/during separation in the physical violence group (up by 3 percentage points to 41%), and emotional abuse group (up by 4 percentage points to 44%; Figure 6.11).
Figure 6.11: Parents’ views on whether family law system helps them find the best outcome for children, by experience of family violence before/during separation, 2012 and 2014
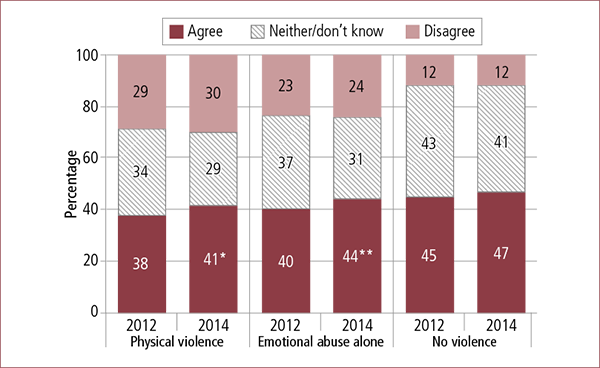
Notes: Data have been weighted. Sample sizes: physical violence—2012: n = 1,252, 2014: n = 1,144; emotional abuse alone—2012: n = 1,547, 2014: n = 1,316; no violence—2012: n = 1,148, 2014: n = 866. Data were excluded where parents did not provide a response (i.e., “refusal”). Percentages may not total 100.0% due to rounding. Statistically significant differences between 2012 and 2014 within a given population are noted: * p < .05; ** p < .01; *** p < .001.
The highest level of endorsement, showing a statistically significant increase, was evident for the no safety concerns group (2012: 43% and 2014: 47%) (see Figure 6.12). Lower levels of endorsement were evident for the “concerns for both” and “concerns for child” group, and for both these groups, endorsement increased from 30% to 33% between the time frames. So too did disagreement, which was higher for the “concerns for both” group (41% to 45%), compared with 36% to 40% for the “concerns for child” group. Views among the no contact group were largely stable, with some slight suggestion of an improvement in 2014 (35% to 37%).
Figure 6.12: Parents’ views on whether family law system helps them find the best outcome for children, by whether they had safety concerns, 2012 and 2014
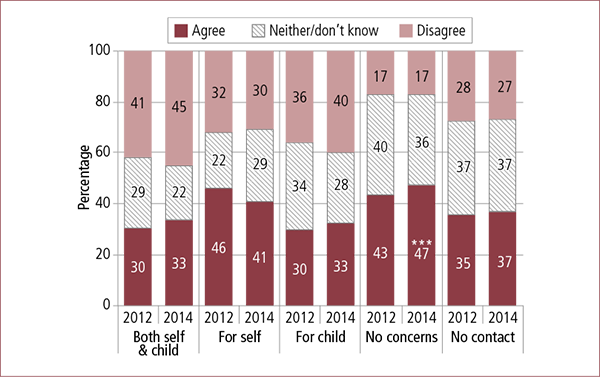
Notes: Data have been weighted. Sample sizes: both self & child—2012: n = 298, 2014: n = 331; for self—2012: n = 172, 2014: n = 137; for child—2012: n = 385, 2014: n = 358; no concerns—2012: n = 2,921, 2014: n = 2,222; no contact with other parent—2012: n = 97, 2014: n = 107. Data were excluded where parents did not provide a response (i.e., “refusal”). Percentages may not total 100.0% due to rounding. Statistically significant differences between 2012 and 2014 within a given population are noted: * p < .05; ** p < .01; *** p < .001.
6.2 Parents’ assessments of particular pathways
The discussion in this section focuses on parents’ assessments of the mechanism they nominated as the main pathway for negotiating parenting arrangements, among those who indicated their arrangements had been sorted out. The mechanisms examined are FDR/mediation, lawyers, courts and discussions. Parents who had sorted out their parenting arrangements were read a number of statements about the main pathway they used, and asked how much they agreed or disagreed with statements about how well the process worked for them, the focus parent and their children. Further insights were sought on the extent to which they and the focus parent had an adequate opportunity to put their side forward and whether the needs of the child had been adequately considered. The results in Table 6.1 show the proportions of parents who agreed or strongly agreed with each statement in 2012 and 2014.
Some consistent findings emerged for both cohorts. Across all pathways, a smaller proportion of fathers than mothers agreed that the main pathway they used worked for them. Conversely, fathers agreed at a higher rate than mothers that the pathway used worked for the focus parent. A smaller percentage of fathers than mothers agreed that the pathway used worked for the child, the result was what they expected, they had an adequate opportunity to put their side forward, and the needs of the child were adequately considered. The vast majority of fathers and mothers agreed that the main pathway they used provided an adequate opportunity for the focus parent to put their side forward.
| Mediation/ FDR (%) | Lawyers (%) | Courts (%) | Discussions (%) | |||||
|---|---|---|---|---|---|---|---|---|
| 2012 | 2014 | 2012 | 2014 | 2012 | 2014 | 2012 | 2014 | |
| Note: Data have been weighted. The “don’t know” and “refused” responses were excluded from this analysis (< 1%), resulting in varying sample sizes for each statement. Table shows smallest responding sample size for each pathway/statement for fathers and mothers (statement “worked for focus parent” was the smallest responding sample for fathers, mothers and all participating parents). Statistically significant differences between 2012 and 2014 within a given population are noted: * p < .05; ** p < .01; *** p < .001. Statistically significant differences between mothers and fathers within a given population (years) are noted: † p < .05; †† p < .01; ††† p < .001. | ||||||||
| Total | (n = 382) | (n = 449) | (n = 277) | (n = 269) | (n = 148) | (n = 142) | (n = 2,764) | (n = 2,743) |
| Worked for you | 66.5 | 73.6 | 61.2 | 60.0 | 53.6 | 50.3 | 84.4 | 89.1 *** |
| Worked for focus parent | 84.3 | 87.3 | 76.2 | 73.4 | 61.4 | 71.8 | 92.6 | 95.6 * |
| Worked for focus child | 78.0 | 82.4 | 66.7 | 66.2 | 57.7 | 60.6 | 88.1 | 91.4 *** |
| Result was expected | 73.0 | 76.7 * | 68.1 | 64.3 | 66.3 | 60.3 | 88.0 | 89.5 |
| Had opportunity to put side forward | 83.1 | 82.6 | 72.6 | 69.7 | 59.3 | 55.4 | 86.1 | 87.8 * |
| Other parent had opportunity to put side forward | 96.8 | 96.9 | 96.6 | 96.7 | 88.1 | 87.4 | 97.0 | 97.5 |
| Needs of child were adequately considered | 85.7 | 86.5 | 73.2 | 69.0 | 64.0 | 66.0 | 93.0 | 94.1 |
| Fathers | (n = 183) | (n = 202) | (n = 128) | (n = 130) | (n = 68) | (n = 63) | (n = 1,312) | (n = 1,297) |
| Worked for you | 56.8 | 70.0 | 46.8 | 48.6 | 41.0 | 49.0 | 82.3 | 87.4 |
| Worked for focus parent | 89.1 | 90.3 | 84.9 | 77.2 | 68.4 | 80.0 | 94.9 | 96.5 |
| Worked for focus child | 73.7 | 81.2 | 51.8 | 56.9 | 43.3 | 52.0 | 86.5 | 91.3 |
| Result was expected | 73.8 | 74.4 | 62.5 | 60.8 | 58.5 | 57.4 | 87.3 | 89.1 |
| Had opportunity to put side forward | 79.3 | 81.5 | 61.8 | 63.3 | 50.1 | 50.2 | 84.0 | 86.6 |
| Other parent had opportunity to put side forward | 96.5 | 97.9 | 97.2 | 96.9 | 88.0 | 86.4 | 97.7 | 98.9 |
| Needs of child were adequately considered | 81.5 | 84.5 | 64.7 | 58.5 | 52.7 | 56.7 | 92.2 | 93.4 |
| Mothers | (n = 199) | (n = 247) | (n = 149) | (n = 140) | (n = 80) | (n = 79) | (1,452) | (1,447) |
| Worked for you | 76.3 ††† | 77.0 | 74.5 ††† | 72.6 | 64.0 †† | 51.6 | 86.3 †† | 90.7 |
| Worked for focus parent | 79.5 † | 84.4 | 68.3 †† | 69.1 | 55.1 | 63.8 | 90.4 ††† | 94.7 |
| Worked for focus child | 82.1 | 83.6 | 79.4 ††† | 75.9 | 69.4 †† | 68.7 | 89.6 † | 91.5 |
| Result was expected | 72.3 | 78.8 | 73.2 | 68.1 | 72.6 | 63.0 | 88.7 | 89.8 |
| Had opportunity to put side forward | 87.1 † | 83.7 | 82.5 ††† | 76.9 | 66.9 † | 60.3 | 88.2 †† | 89.0 |
| Other parent had opportunity to put side forward | 97.0 | 95.9 | 96.1 | 96.5 | 88.2 | 88.3 | 96.4 † | 96.1 |
| Needs of child were adequately considered | 90.0 † | 88.5 | 80.8 †† | 80.5 | 73.2† | 74.7 | 93.7 | 94.9 |
Generally, the patterns in responses establish that pathways that focused on achieving mutually agreed outcomes were associated with a higher proportion of positive assessments. Thus, the “discussion” pathway consistently attracted positive endorsements on most measures, followed by the FDR/mediation pathway. The pathways in which outcomes were more likely to be either informed by legal advice about the parents’ position under the FLA framework (lawyers) or reflect the imposition of a judicial decision (courts) were associated with diminishing proportions of positive responses, although these were still returned by (smaller) majorities. As discussed in Chapter 4, these pathways were also more likely to be used by parents whose cases manifested a greater level of complexity. This pattern is consistent, and more strongly evident, between time frames, particularly in the greater level of satisfaction evident among the parents whose main pathway was “just discussions”. Thus, between the two cohorts, satisfaction with discussions rose overall (to a statistically significant extent on most measures), and FDR/mediation also rose slightly on most measures. In contrast, shifts in relation to lawyers and courts were mostly slightly negative.
Statistically significant shifts are evident in a limited number of areas, mostly concerned with positive trends in relation to the discussions pathway. In this area, the strongest changes were increases in agreement with the statement that “the process worked for you” (from 84% to 89%) and “the process worked for the focus child” (from 88% to 91%), for all participating parents and for both fathers and mothers separately. Two other statements attracted weaker positive increases: “the process worked for the focus parent” (from 93% to 96%), and “I had an adequate opportunity to put my side forward” (from 86% to 88%), again reported by all participating parents and by fathers and mothers separately.
The only other area where a statistically significant shift is shown is in responses to the statement that “the result was what I expected” in relation to the FDR/mediation pathway, where endorsement rose from 73% to 77%, reflecting increased positive ratings from fathers and mothers, but to a greater extent among mothers.
Table 6.2 sets out parents’ responses on the same set of questions discussed in the preceding section, analysed according to the main pathway nominated and any reported experiences of family violence. In relation to the sub-groups of parents who nominated lawyers or courts as the main pathway but did not experience physical violence or emotional abuse before/during separation, the sample sizes were too small to sustain reliable analyses, so none are reported.
| Physical violence (%) | Emotional abuse alone (%) | No violence (%) | ||||
|---|---|---|---|---|---|---|
| 2012 | 2014 | 2012 | 2014 | 2012 | 2014 | |
| Notes: Data have been weighted. Percentages do not sum to 100.0% as multiple responses could be selected. Data not shown where sample sizes for sub-groups were smaller than 50 responses. Statistically significant differences between 2012 and 2014 within a given population are noted: * p < .05; ** p < .01; *** p < .001. | ||||||
| FDR/mediation | (n = 148) | (n = 123) | (n = 176) | (n = 223) | (n = 109) | (n = 105) |
| Worked for you | 67.8 | 64.3 | 66.9 | 74.9 | 63.0 | 78.9 ** |
| Worked for focus parent | 68.4 | 70.7 | 76.8 | 74.3 | 80.4 | 87.7 |
| Worked for focus child | 70.7 | 67.7 | 72.6 | 77.7 | 78.6 | 84.8 |
| Result was expected | 69.7 | 69.4 | 73.2 | 77.2 | 72.4 | 76.7 |
| Had adequate opportunity to put side forward | 78.5 | 78.6 | 79.5 | 80.2 | 90.5 | 90.5 |
| Other parent had opportunity to put side forward | 95.9 | 92.9 | 95.2 | 95.3 | 93.5 | 94.2 |
| Needs of child were adequately considered | 86.6 | 78.8 | 80.5 | 86.8 | 89.4 | 89.7 |
| Lawyers | (n = 111) | (n = 112) | (n = 149) | (n = 130) | (n = 55) | (n = 32) |
| Worked for you | 60.4 | 58.0 | 56.8 | 59.4 | 70.2 | – |
| Worked for focus parent | 64.3 | 72.5 | 64.2 | 58.9 | 84.5 | – |
| Worked for focus child | 65.2 | 62.0 | 56.2 | 63.4 | 70.0 | – |
| Result was expected | 63.3 | 61.8 | 65.5 | 64.9 | 76.7 | – |
| Had adequate opportunity to put side forward | 70.6 | 67.0 | 64.4 | 65.9 | 84.7 | – |
| Other parent had opportunity to put side forward | 90.5 | 92.6 | 91.1 | 90.5 | 99.3 | – |
| Needs of child were adequately considered | 69.4 | 63.9 | 67.6 | 68.2 | 88.8 | – |
| Court | (n = 87) | (n = 82) | (n = 75) | (n = 44) | (n = 14) | (n = 19) |
| Worked for you | 56.7 | 50.4 | 44.9 | – | – | – |
| Worked for focus parent | 40.5 | 61.0 | 67.6 | – | – | – |
| Worked for focus child | 56.1 | 59.7 | 50.0 | – | – | – |
| Result was expected | 65.2 | 59.4 | 61.7 | – | – | – |
| Had adequate opportunity to put side forward | 53.2 | 56.3 | 56.4 | – | – | – |
| Other parent had opportunity to put side forward | 79.0 | 83.6 | 86.2 | – | – | – |
| Needs of child were adequately considered | 69.3 | 66.4 | 52.4 | – | – | – |
| Discussions | (n = 487) | (n = 419) | (n = 1,040) | (n = 976) | (n = 1,393) | (n = 1,371) |
| Worked for you | 78.3 | 78.8 | 77.7 | 85.4 *** | 89.9 | 93.0 ** |
| Worked for focus parent | 82.7 | 86.4 | 85.5 | 89.0 * | 91.8 | 92.8 |
| Worked for focus child | 83.3 | 82.6 | 79.9 | 84.9 ** | 90.5 | 92.6 |
| Result was expected | 82.3 | 80.9 | 83.4 | 84.6 | 90.5 | 91.5 |
| Had adequate opportunity to put side forward | 76.7 | 74.4 | 80.8 | 83.3 | 91.0 | 92.6 |
| Other parent had opportunity to put side forward | 93.8 | 91.8 | 94.9 | 94.6 | 96.7 | 96.4 |
| Needs of child were adequately considered | 87.6 | 85.9 | 89.9 | 91.1 | 95.4 | 96.9 * |
There are three areas where statistically significant changes between the two cohorts are evident. First, consistent with the results reported in the preceding section, the FDR/mediation pathway attracted a significantly greater level of support in relation to the statement that the process “worked for you” among the group of parents who did not report a history of family violence before/during separation in the survey: in 2014, 79% agreed with this statement, compared with 63% in 2012. In relation to all the other statements, the pattern of results is positive or stable for this group.
Second, among the “no violence” parents, the level of endorsement of the statement that the process “worked for you” for those in the discussions pathway increased to 93% in 2014, up from 90% in 2012. The patterns in responses for discussions among this group were all marginally positive, to a small but statistically significant extent for the statement that the “needs of the child were adequately considered”. Again, this is consistent with the findings presented in the previous section.
The aspect of the reforms most likely to be associated with the positive shifts reported in the two preceding paragraphs is the change to advisers’ obligations under the new s 60D(1)(a) provisions, which require advisers’ to inform parents that the children’s best interests are the paramount consideration and that the protection from harm principles outweigh the child’s right to have meaningful involvement with both parents, where these principles conflict. This obligation sits alongside the obligations enacted in 2006 in s 63DA(1) and (2) requiring advisers to give parents advice about parenting plans and arrangements involving equal or substantial and significant time arrangements. As s 63DA(1A) indicates, these two sets of provisions operate in parallel, but s 60D(1)(a) reinforces the paramountcy principle and the s 63DA obligations are specified as being “in addition” to s 60D(1). Although it is uncertain how these obligations are reflected in advisers’ practices in various parts of the family system, and also uncertain how this advice is construed by parents who receive it, these provisions may mean the 2014 cohort received advice that provided a clearer focus on the “best interests” message, and the patterns suggesting greater satisfaction among parents with agreement-based pathways are reflecting this to some extent.
The third area where statistically significant changes are evident is in relation to the group that reported experiencing emotional abuse before/during separation and used the discussions pathway. For this group, statistically significant increases are evident in positive responses to three statements: the process “worked for you” (up 8 percentage points to 85%), “worked for the focus parent” (up by 4 percentage points to 89%) and “worked for the focus child” (up 5 percentage points to 85%). For this group, the responses to all the other questions were marginally more positive or stable in 2014 compared with 2012. In addition to the advisers’ obligations spelt out in the preceding paragraph, the aspect of the 2012 family violence reforms most likely to be associated with this shift is the widened definition of family violence s 4AB (see Chapter 1).
In the three areas just described, statistically significant positive changes for responses to some questions and positive or stable results for other questions in the same groups support the conclusion that the 2012 family violence amendments have supported the resolution of parenting arrangements by agreement, whether this was through discussions or in FDR/mediation, for families where there had been neither physical violence nor emotional abuse before/during separation. The results reported for the discussions pathway where there had been emotional abuse suggest a similar effect in this context.
In relation to the other pathways, there is no consistent pattern evident for the three groups of parents (physical violence, emotional abuse alone, no violence).
The pattern of results for the questions that were child-focused (the process “worked for the focus child” and “the needs of the focus child were adequately considered”), suggests an overall positive effect for the emotional abuse group in relation to FDR/mediation, lawyers and courts. These two statements attracted greater levels of endorsement in 2014 to varying degrees for all three pathways (and, as already reported, just discussions), tending to suggest some support for a tentative conclusion that one aspect of the changes—the broader definition of family violence—is working in the children’s interests.
The opposite appears to be true for responses to most child-focused questions for all pathways for the physical violence group. Positive responses were down to varying extents, except in relation to the statement that the process worked for the focus child in relation to courts.
Table 6.3 depicts parents’ assessments of the main pathway used when they reported that: (a) they had safety concerns for the child, or for themselves and the child (the “concerns” group); (b) they did not have safety concerns because there was no contact with the other parent (the “no contact” group). The “concerns for child” and “concerns for self and child” were previously analysed separately, but here were analysed together in order to produce sample sizes large enough to sustain statistically reliable analysis. The other group, which had no safety concerns because there was no contact, is likely, as observed previously, to have characteristics indicative of significant complexity, given previous analyses showing that arrangements involving no contact are more common among families affected by family violence, safety concerns and other complex issues, such as substance misuse or mental ill health (Kaspiew et al., 2014).
| Concerns for child/self & child (%) | No concerns/no contact with other parent (%) | |||
|---|---|---|---|---|
| 2012 | 2014 | 2012 | 2014 | |
| Notes: Data have been weighted. Percentages do not sum to 100.0% as multiple responses could be selected. Statistically significant differences between 2012 and 2014 within a given population are noted: * p < .05; ** p < .01; *** p < .001. | ||||
| FDR/mediation | (n = 66) | (n = 63) | (n = 345) | (n = 354) |
| Worked for you | 47.6 | 64.7 | 69.5 | 76.1 |
| Worked for focus parent | 63.0 | 70.7 | 78.2 | 78.2 |
| Worked for focus child | 50.9 | 65.9 | 78.5 | 79.0 |
| Result was expected | 54.6 | 59.0 | 76.1 | 77.7 |
| Had adequate opportunity to put side forward | 68.5 | 73.0 | 85.2 | 84.8 |
| Other parent had opportunity to put side forward | 89.6 | 97.5 | 95.6 | 94.0 |
| Needs of child were adequately considered | 66.3 | 69.5 | 88.4 | 88.9 |
| Lawyers | (n = 56) | (n = 58) | (n = 237) | (n = 183) |
| Worked for you | 60.4 | 51.9 | 60.4 | 60.9 |
| Worked for focus parent | 59.4 | 62.7 | 70.6 | 63.5 |
| Worked for focus child | 57.9 | 50.5 | 62.8 | 66.7 |
| Result was expected | 63.0 | 59.0 | 68.7 | 63.1 |
| Had adequate opportunity to put side forward | 63.4 | 61.5 | 72.2 | 70.3 |
| Other parent had opportunity to put side forward | 84.2 | 86.0 | 94.1 | 95.3 |
| Needs of child were adequately considered | 61.5 | 62.4 | 75.5 | 72.7 |
| Court | (n = 64) | (n = 46) | (n = 95) | (n = 80) |
| Worked for you | 43.1 | 52.0 | 55.0 | 44.9 |
| Worked for focus parent | 52.8 | 67.3 | 55.2 | 51.3 |
| Worked for focus child | 41.4 | 56.9 | 60.7 | 58.3 |
| Result was expected | 55.8 | 54.1 | 67.8 | 60.3 |
| Had adequate opportunity to put side forward | 39.6 | 43.8 | 67.4 | 56.2 |
| Other parent had opportunity to put side forward | 79.8 | 79.8 | 83.8 | 78.9 |
| Needs of child were adequately considered | 49.4 | 59.2 | 65.5 | 65.2 |
| Discussions | (n = 151) | (n = 140) | (n = 2,686) | (n = 2,489) |
| Worked for you | 67.3 | 66.9 | 84.9 | 89.3 *** |
| Worked for focus parent | 72.6 | 75.1 | 89.2 | 91.5 ** |
| Worked for focus child | 67.9 | 66.4 | 86.7 | 89.6 ** |
| Result was expected | 74.4 | 65.2 | 87.4 | 88.7 |
| Had adequate opportunity to put side forward | 58.1 | 64.8 | 86.8 | 87.9 |
| Other parent had opportunity to put side forward | 90.0 | 90.2 | 96.1 | 95.5 |
| Needs of child were adequately considered | 75.4 | 76.3 | 93.2 | 94.0 |
Consistent with the discussion in the preceding section, the pattern of responses highlights a statistically significant improvement in positive responses (from a high base in 2012) for the discussions pathway among the “no contact” group. The questions addressing the interests of each party (self, other parent, child), all recorded statistically significant increases between 2012 and 2014. Endorsement of the statement “the process worked for you” was up 4 percentage points to 89% in 2014, “the process worked for the focus parent” was up by a smaller but still statistically significant 2 percentage points to 92%, and the equivalent child-focused question was up 3 percentage points to 90%. Responses to all other questions for discussions among this group were stable.
No other statistically significant shifts between the 2012 and 2014 cohorts are evident in these data. There are, however, three areas where consistent patterns are evident: uniformly positive (or stable) results in relation to FDR/mediation and courts for the “concerns” group; and uniformly negative results for the court pathway among the “no contact” group (although responses for the question about children’s needs are stable). In all other areas, the pattern of results is mixed.
Once again, these findings tend to support the conclusion that the 2012 family violence amendments have supported mechanisms for resolution based on agreement (discussions, FDR/mediation) to a certain extent, even for the more complex groups in the spectrum represented in the SRSP dataset: parents with safety concerns and parents with no safety concerns because there is no contact with the other parent. Again, the amendments to advisers’ obligations in this regard (s 60D(1)(a)), together with the clarification of the priority to be placed on protection from harm in the list of primary and additional considerations in s 60CC, are likely to be relevant (to an uncertain extent) to this shift.
With the exception of courts, the patterns for the other pathways confirm the theme of limited and perhaps mixed effects evident elsewhere in this report. The divergent results for the two groups using the courts pathway raise some intriguing questions but support few conclusions, other than to suggest that there may be significant differences between the “concerns” and “no contact” groups. Possibly, the negative responses among the “no-contact” group may to some extent reflect disappointment in the court’s inability to resolve whatever concerns were behind the trajectory that propelled this group along the court pathway in the first place.
Table 6.4 shows the analysis of parents’ agreement with statements about the main process they were using to sort out parenting arrangements, for those parents who were still in the process of finalising parenting arrangements. Compared with the responses from parents who had sorted out their parenting arrangements (Table 6.1), the picture is much less positive among those who were still in the process, up to 18 months after separation. Regardless of the main pathway being used, only a minority of parents agreed that the process was working for them. For example, in 2014, this was the case for 49% of parents using “discussions with the other parent” 48% of parents using FDR/mediation, 35% of parents using lawyers and 31% of parents using the courts. Higher proportions of mothers than fathers agreed the process was working for them, although none of these differences were significant.
Very few changes emerged in parents’ agreement with these statements between 2012 and 2014. Firstly, among parents who were mainly using lawyers to sort out parenting arrangements, a significantly higher proportion in 2014 than in 2012 agreed that this was working for them (2012: 31% cf. 2014: 35%) and for the focus parent (2012: 61% cf. 2014: 72%). And among parents mainly using “discussions with the other parent” a small but significant increase occurred in the proportion agreeing that the process was working for them (2012: 45% cf. 2014: 49%).
| Mediation/FDR (%) | Lawyers (%) | Courts (%) | Discussions (%) | |||||
|---|---|---|---|---|---|---|---|---|
| 2012 | 2014 | 2012 | 2014 | 2012 | 2014 | 2012 | 2014 | |
| Note: Data have been weighted. The “don’t know” and “refused” responses were excluded from this analysis (less than 1%), resulting in varying sample sizes for each statement. Table shows smallest responding sample size for each pathway/statement for fathers and mothers (statement “Working for focus parent” was the smallest responding sample for fathers, mothers and all participating parents). Percentages do not sum to 100.0% as multiple responses could be selected. Statistically significant differences between 2012 and 2014 within a given population are noted: * p < .05; ** p < .01; *** p < .001. Statistically significant differences between mothers and fathers within a given population (years) are noted: † p < .05; †† p < .01; ††† p < .001. | ||||||||
| Total | (n = 117) | (n = 153) | (n = 120) | (n = 213) | (n = 149) | (n = 223) | (n = 421) | (n = 482) |
| Working for you | 44.2 | 48.1 | 31.2 | 34.8 * | 27.5 | 31.4 | 44.8 | 49.2 ** |
| Working for focus parent | 68.3 | 67.2 | 60.5 | 71.8 ** | 65.2 | 69.2 | 77.4 | 79.4 |
| Working for focus child | 46.7 | 50.8 | 32.9 | 32.6 | 29.5 | 33.3 | 59.4 | 62.4 |
| Fathers | (n = 60) | (n = 69) | (n = 67) | (n = 114) | (n = 84) | (n = 129) | (n = 211) | (n = 239) |
| Working for you | 47.6 | 40.4 | 24.0 | 29.4 | 23.7 | 29.2 | 43.2 | 42.0 |
| Working for focus parent | 74.2 | 80.1 | 68.3 | 79.2 | 73.1 | 74.1 | 85.4 | 86.3 |
| Working for focus child | 45.0 | 47.0 | 25.0 | 28.6 | 24.8 | 29.5 | 53.3 | 55.4 |
| Mothers | (n = 57) | (n = 84) | (n = 53) | (n = 99) | (n = 65) | (n = 94) | (n = 210) | (n = 243) |
| Working for you | 39.5 | 56.1 | 40.8 † | 42.1 | 32.6 | 34.7 | 46.6 | 57.2 |
| Working for focus parent | 60.4 | 51.6 | 49.8 | 60.7 | 53.4 † | 61.1 | 68.4 ††† | 71.3 |
| Working for focus child | 48.9 | 54.9 | 43.6 † | 37.2 | 36.0 | 39.2 | 65.7 †† | 70.2 |
6.3 Awareness of 2012 family violence amendments to the Family Law Act 1975 (Cth)
Each survey tested the awareness among parents of the changes to the FLA introduced by the 2012 family violence amendments. For the 2012 cohort, implementation of the 2012 amendments occurred just three months prior to the commencement of the SRSP 2012 data collection. For the 2014 cohort, the amendments had been in force for some 14 months. In each survey, parents were asked: “There have been some recent changes to the family law system that came into effect in June 2012. Are you aware of any of these changes?” If participants answered yes, they were asked: “Could you please explain to me your understanding of these changes?”
In both cohorts, very small minorities (around one in ten) evinced any awareness of the changes (Table 6.5). In 2014, the small proportion indicating they were aware of specific changes was 4%, significantly higher than the 2% indicating this in 2012. In 2014, 4% indicated awareness of some change but were unsure of the detail, compared with 7% in 2012, again to a significant level. Differences between fathers and mothers in these areas were negligible in both cohorts.
| Total (%) | Fathers (%) | Mothers (%) | ||||
|---|---|---|---|---|---|---|
| 2012 | 2014 | 2012 | 2014 | 2012 | 2014 | |
| Note: Data have been weighted. The “refused” responses were excluded from this analysis. Percentages may not total 100.0% due to rounding. Statistically significant differences between 2012 and 2014 within a given population are noted: * p < .05; ** p < .01; *** p < .001. Differences between mothers and fathers were not statistically significant. | ||||||
| Yes, aware of specific changes | 2.0 | 3.7 *** | 2.0 | 3.7 *** | 2.1 | 3.7 *** |
| Yes, aware, not sure details | 7.4 | 3.9 *** | 7.9 | 3.5 *** | 7.0 | 4.2 *** |
| Not aware of any changes | 90.5 | 92.4 *** | 90.1 | 92.8 ** | 90.9 | 92.1 |
| No. of observations | 6,114 | 6,079 | 2,851 | 2,817 | 3,263 | 3,262 |
In both cohorts, parents who reported experiencing family violence in the survey were more likely to have knowledge, particularly detailed knowledge, of the changes (Table 6.6), with incremental increases evident between 2012 and 2014. Among the parents who reported experiencing physical violence, specific knowledge was reported by 3% of fathers in 2012 and 8% in 2014. Among mothers in the physical violence group, the proportion reporting specific knowledge rose from 4% to 6%. For parents who reported experiencing emotional abuse, 3% of fathers had specific knowledge in both 2012 and 2014. Among mothers in this group. 2% had specific knowledge in 2012 compared with 4% in 2014. For parents in each cohort who did not report a history of family violence, 95–96 reported no awareness of the 2012 family violence amendments.
Table 6.6 depicts the pattern of responses among parents who reported family violence before/during separation. The findings in relation to parents who reported these experiences since separation show little difference and are included in Table B6 in the Appendix 3.
| Physical violence (%) | Emotional abuse alone (%) | No family violence (%) | ||||
|---|---|---|---|---|---|---|
| 2012 | 2014 | 2012 | 2014 | 2012 | 2014 | |
| Note: Data have been weighted. The “don’t know” and “refused” responses were excluded from this analysis . Percentages may not total 100.0% due to rounding. Statistically significant differences between 2012 and 2014 within a given population are noted: * p < .05; ** p < .01; *** p < .001. Statistically significant differences between mothers and fathers within a given population (years) are noted: † p < .05; †† p < .01; ††† p < .001. | ||||||
| Total | (n = 1,612) | (n = 1,605) | (n = 2,415) | (n = 2,379) | (n = 2,060) | (n = 2,095) |
| Yes, aware of specific changes | 3.3 | 6.5 *** | 2.1 | 3.4 ** | 1.0 | 2.0 * |
| Yes, aware, not sure details | 8.0 | 5.0 ** | 7.5 | 4.2 *** | 6.9 | 2.8 *** |
| Not aware of any changes | 88.6 | 88.4 | 90.4 | 92.4 * | 92.1 | 95.1 *** |
| Fathers | (n = 542) | (n = 552) | (n = 1,190) | (n = 1,158) | (n = 1,108) | (n = 1,107) |
| Yes, aware of specific changes | 3.0 | 8.2 *** | 2.5 | 3.3 | 1.0 | 2.1 * |
| Yes, aware, not sure details | 7.7 | 5.5 | 7.8 | 3.8 *** | 8.2 | 2.3 *** |
| Not aware of any changes | 89.3 | 86.2 | 89.7 | 92.9 * | 90.9 | 95.6 *** |
| Mothers | (n = 1,070) | (n = 1,053) | (n = 1,225) | (n = 1,221) | (n = 952) | (n = 988) |
| Yes, aware of specific changes | 3.5 | 5.5 *† | 1.7 | 3.6 ** | 1.1 | 2.0 |
| Yes, aware, not sure details | 8.3 | 4.8 ** | 7.2 | 4.5 ** | 5.4† | 3.5 |
| Not aware of any changes | 88.2 | 89.5 † | 91.1 | 91.9 | 93.6 † | 94.6 |
6.4 Summary
This chapter has examined three main issues relating to parents’ perceptions and knowledge of the family law system in both the 2012 and 2014 cohorts. The first issue concerned parents’ views of whether the family law system process worked for themselves, the other parent, and their child, and whether they could put forward their views and have the needs of their child considered. The second concerned parents’ views of the effectiveness of particular pathways in the family law system: discussions, FDR/mediation, lawyers and courts. The third was the extent to which parents showed awareness of the 2012 family violence amendments. In each area, to the extent that is statistically sustainable given the samples sizes in various sub-groups, these issues were examined according to patterns exhibited by the sample as whole, gender (the gender lens), the experience of family violence (physical violence and emotional abuse) and safety concerns (the circumstances lens), and the resolution pathway used (the pathway lens).
6.4.1 Effectiveness of the family law system
Parents’ assessments of the efficacy of the family law system (reflected in levels of agreement in relation to six statements) generally suggest small but statistically significant shifts in a direction consistent with the intention of reforms. Statements relating to whether the family law system meets the needs of mothers, fathers and children generally attracted a slightly higher level of endorsement among parents in 2014, suggesting that the aims of the 2012 reforms to improve responses to family violence and safety concerns have not produced negative shifts in other areas of the system. The improvements generally reflect greater levels of agreement from parents who reported in the survey that they had experienced physical violence or emotional abuse.
The statement concerning family violence also attracted greater levels of endorsement generally, especially among parents who had experienced physical violence (up by 7 percentage points to 35%), which was to a greater extent than those affected by emotional abuse (up by 4 percentage points to 32%).
Responses to the question about whether the family law system protects the safety of children, while slightly more positive in 2014 compared with 2012, did not reach a level of statistical significance for the aggregate sample. Considering responses to this question by circumstance, the proportions of parents agreeing with the statement increased to a statistically significant extent for the emotional abuse group (up by 4% to 53%). In relation to the different safety concerns groups, the pattern was mixed. Agreement increased among the two groups that had safety concerns involving children (i.e., for self and child, and for child only), but decreased for parents whose concerns related to their own safety only. The group that recorded the greatest increase in the proportion of positive responses was the group that did not have contact with the other parent, for whom agreement rose from 40% to 49%. Overall, these results tend to suggest a weaker positive effect and continuing mixed experiences of the elements of the 2012 family violence reforms for parents concerned with child and parent safety.
At the same time as highlighting some small but positive shifts consistent with the direction of the reforms, the data described in this section continue to reinforce the point that improving responses to families affected by complex issues (including family violence and to a greater extent safety concerns) remains a work in progress. Negative responses remain high to varying extents among parents who reported family violence or safety concerns in the survey. In relation to the family violence statement, three in ten parents who reported physical hurt disagreed with the statement that the family law system addresses family violence issues, as did 18% of the emotional abuse group. Levels of disagreement with the statement that the family law system protects the safety of children were even higher among some groups with safety concerns: three in ten parents with concerns for themselves and their child disagreed and just over two-thirds of those who had concerns for the child only disagreed. In most areas, endorsement rates among groups affected by these issues remained lower than endorsement rates among the other groups overall. Patterns of responses for the sub-groups with concerns for self and child and concerns for child provide further evidence of the point illustrated in earlier chapters of this report that suggest the system has particular shortcomings in this area.
6.4.2 Effectiveness of specific family law pathways
The discussion on the effectiveness of particular pathways indicates that 2012 family violence reforms are supportive of the resolution of parenting matters by agreement. Parents were asked seven questions about the pathway they nominated as the main one for reaching parenting agreements, focusing respectively on whether it worked for them, the other parent or the child; whether the result was consistent with expectations; whether each parent had an adequate opportunity to be heard; and whether the needs of the child were adequately considered.
In relation to the agreement-based pathways (discussions and FDR/mediation), some statistically significant improvements were evident in a largely positive pattern of results. The strongest positive indications were evident in relation to discussions among parents not affected by physical violence or emotional abuse, but responses about the predictability of the result in FDR/mediation also improved to a statistically significant extent for these parents, as well as the group affected by emotional abuse. Discussions also attracted higher positive ratings among some of the sub-groups who had safety concerns, most markedly among the group where there was no contact with the other parent, with endorsement of the statement “the process worked for you” increasing by 5 percentage points to 89% in 2014.
The aspects of the 2012 family violence amendments most likely to be associated with these changes are the introduction of s 60D(1)(a), which requires advisers to tell parents that parenting arrangements should be in the child’s best interests; the wider definition of family violence (s 4AB); and the s 60CC(2A) so-called “tie-breaker” (Rhoades, Sheehan, & Dewar, 2013) provisions requiring greater weight to be accorded to protection from harm.
In relation to the other pathways (lawyers and courts), the patterns are mixed, tending towards indications of greater levels of dissatisfaction among parents in 2014, to the limited extent that sample sizes can sustain statistical analysis.
6.4.3 Awareness of changes to the family law system
In both cohorts, most parents (nine in ten) were not aware of the 2012 family violence amendments, with little difference between fathers and mothers on this point. To the extent that awareness accompanied by specific knowledge increased in 2014, this was most likely to be evident among fathers who experienced physical violence and mothers who experienced emotional abuse alone.
This chapter examines reports of child and parent wellbeing, with a particular focus on the effects of the occurrence of family violence and the witnessing of this family violence by the focus child on reported wellbeing. The first part of the chapter considers the data relating to child wellbeing. Following a discussion of data relating to reports of the physical health and general wellbeing of the focus child, more specific consideration is given to data measuring the wellbeing of children aged between 0 and 3 years, followed by an analysis of factors relevant to the wellbeing of school-aged children. Concerns about children's wellbeing will then be considered in the context of reports of difficult child behaviours in the three-month period prior to the SRSP data collection. Connections between child wellbeing and family violence before/during and since separation are then discussed, examining the correlation of reports of focus child wellbeing with the occurrence and timing of the family violence and with whether this family violence was witnessed by the focus child. This is followed by a discussion of parents' perceptions of their own wellbeing, measured by their satisfaction with aspects of their lives, including their relationship with their child, their feelings of safety and their life as a whole, with correlations between these perceptions of their wellbeing with their reported experiences of family violence and fear, coercion or control also considered.
7.1 Child wellbeing
7.1.1 Physical health and general wellbeing of focus child
Overall, participating parents' perceptions of their child's health were consistent between the 2012 and 2014 cohorts, with just over half of all parents providing a rating of "excellent" (2012: 54% cf. 2014: 55%, data not shown). Differences by parent gender and child age did emerge, both within and between each cohort (Figure 7.1). For example, a significantly higher proportion of mothers of 15-17 year old children in 2014 reported that their child's health was "fair/poor" (2012: 9% cf. 2014: 14%). Similarly, a higher proportion of fathers of 5-11 year olds in 2014 reported that their child's health was "good" (2012: 12% cf. 2014:18%), with a corresponding decrease in the proportion of fathers rating their 5-11 year old child's health as "excellent" (2012: 51% cf. 2014: 47%).
In both cohorts, fathers tended to provide more "middle of the road" assessments ("good" and "very good") of their child's overall health when compared to mothers, while higher proportions of mothers than fathers rated their child's health as "excellent". Gender differences were particularly prominent among parents of 0-2 year old children and 5-11 year old children. For example, significantly higher proportions of mothers than fathers of 5-11 year olds in both cohorts rated their child's health as "excellent" (mothers: 56-58% cf. fathers: 47-51%), while significantly more fathers than mothers of 5-11 year old children in 2014 rated their child's health as "good" (fathers: 18% cf. mothers: 12%). Further, significantly more mothers than fathers of 0-2 year old children in both cohorts rated their child's health as "excellent" (mothers: 67-69% cf. fathers: 54-57%). Conversely, significantly higher proportions of fathers than mothers of 0-2 year old children in both cohorts rated their child's health as "fair/poor" (fathers: 6% cf. mothers: 2%).
Figure 7.1: Parents' perception of focus child's health, by child age, by parent gender, 2012 and 2014

Notes: Data have been weighted. The "don't know" and "refused" responses were excluded from this analysis (less than 2%). Statistically significant differences between 2012 and 2014 within a given population are noted: * p < .05; ** p < .01; *** p < .001. Statistically significant differences between fathers and mothers within each cohort are noted: † p < .05; †† p < .01; ††† p < .001.
Parents were asked to provide a rating of their satisfaction with their child's overall wellbeing. Ratings were provided on a scale of 0 to 10, where 0 was extremely dissatisfied and 10 was extremely satisfied. These ratings were then categorised as follows: ratings of 0 to 4 were classified as "dissatisfied", ratings of 5 to 7 were classified as "moderately satisfied, and ratings of 8 to 10 were classified as "highly satisfied". Figure 7.2 shows parents' satisfaction ratings by their children's ages, with no significant changes in overall satisfaction having occurred between 2012 and 2014. The majority of parents in both cohorts were "highly satisfied" with their child's overall wellbeing, though a number of differences emerged between fathers' and mothers' responses, particularly among parents of younger children. In each age category, higher proportions of mothers than fathers reported that they were "highly satisfied". For example, around 9 in 10 mothers compared to 7-8 in 10 fathers of 0-2 year old and 3-4 year old children were highly satisfied (mothers - 0-2 years: 94-95%, 3-4 years: 88% cf. fathers - 0-2 years: 73-78%, 3-4 years: 73-76%). In both cohorts, among parents of children under 12 years, significantly higher proportions of fathers than mothers reported they were either "moderately satisfied" or "dissatisfied" with their child's overall wellbeing.
Figure 7.2: Parents' overall satisfaction with focus child's wellbeing, by child age, by parent gender, 2012 and 2014
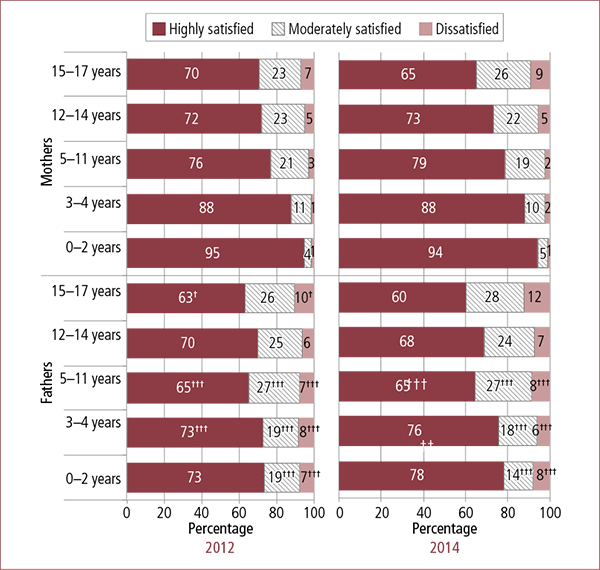
Notes: Data have been weighted. The "don't know" and "refused" responses were excluded from this analysis (less than 1%). Percentages may not total 100.0% due to rounding. Statistically significant differences between 2012 and 2014 within a given population are noted: * p < .05; ** p < .01; *** p < .001. Statistically significant differences between fathers and mothers within each cohort are noted: † p < .05; †† p < .01; ††† p < .001.
Figure 7.3 depicts parents' satisfaction with their child's wellbeing by the current care-time arrangements in place. Between 2012 and 2014, there was little change in parents' satisfaction with their child's wellbeing, with the only noticeable shift being an increase in the number of fathers with majority care (66-99% of nights) being highly satisfied with their child's wellbeing (2012: 82% cf. 2014: 86%). Gendered differences in wellbeing satisfaction were apparent in most care-time arrangements, but most significantly where one parent had care of the child 66-100% of nights.
Figure 7.3: Parents' overall satisfaction with focus child's wellbeing, by care-time arrangements, by parent gender, 2012 and 2014
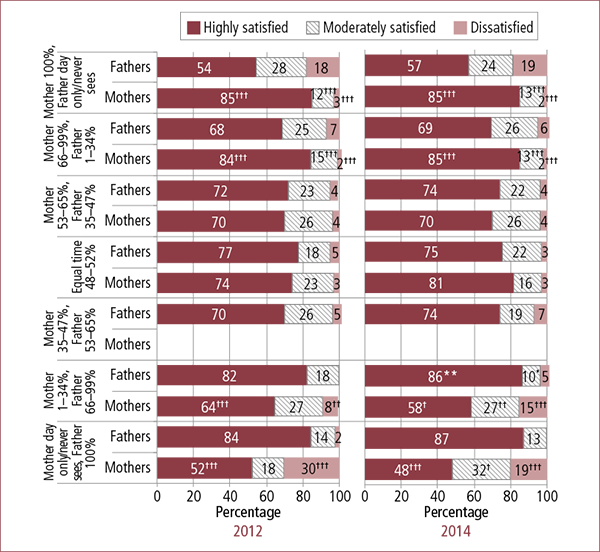
Notes: Data have been weighted. The "don't know" and "refused" responses were excluded from this analysis (less than 1%). Percentages may not total 100.0% due to rounding. Categories with less than a sample of n = 50 have been excluded from this analysis. Statistically significant differences between 2012 and 2014 within a given population are noted: * p < .05; ** p < .01; *** p < .001. Statistically significant differences between fathers and mothers within each cohort are noted: † p < .05; †† p < .01; ††† p < .001.
7.1.2 Wellbeing of children in infancy and toddlerhood
The data relating to the behavioural and social wellbeing of children aged 1-3 years in the SRSP 2012 and 2014 were assessed using the Externalising and Internalising Behaviour Problem subscales of the Brief Infant-Toddler Social and Emotional Adjustment scale (BITSEA; Briggs-Gowan & Carter, 2006). As detailed in De Maio et al. (2013), "the items measure behaviours such as being restless, physically violent or accident prone, as well as fearfulness, sadness, insecurity, and avoidance of contact with others" (p. 83).
Participating parents were asked to indicate on a three-point scale the regularity with which the focus child had shown the relevant behaviours in the past month. Responses of "not true/rarely" were denoted by 0, responses of "somewhat true/sometimes" were denoted by 1 and responses of "very true/often" were denoted by 2. The sum of the ratings provided by the participating parent for each of the behaviour problem items provided their total or combined score.11 As De Maio et al. (2013) explained, this score can facilitate understanding of the proportion of children exhibiting multiple problems, "as it is the combination of behaviours … that is often taken as being indicative of more serious problems" (p. 83). The scores could range from 0 to 28.
Table 7.1 shows that in both the 2012 and 2014 cohorts, the mean total scores for child behaviour problems suggest that children tended to exhibit some, albeit not a large number of, behaviour problems. In both cohorts, the scores were similar for both mothers' and fathers' reports. These data indicate that while the children of parents participating in the SRSP were not problem-free, they generally exhibited a small number of problems.
| BITSEA scores | 2012 | 2014 | ||||
|---|---|---|---|---|---|---|
| Total | Fathers | Mothers | Total | Fathers | Mothers | |
| Notes: Data have been weighted. | ||||||
| Mean | 3.08 | 3.05 | 3.10 | 3.02 | 3.05 | 3.02 |
| Standard error | 0.09 | 0.16 | 0.11 | 0.08 | 0.12 | 0.10 |
| Range | 0-28 | 0-28 | 0-23 | 0-28 | 0-17 | 0-28 |
| No. of observations | 1,376 | 529 | 847 | 1,561 | 613 | 948 |
Figure 7.4 shows that when the scores were further analysed on a continuous scale, parents' reports indicated that only a minority of children aged 0-3 years displayed a large number of problems, with 4% of parents in each cohort reporting a score of 10 or more. Around one-quarter of parents (2012: 24%; 2014: 25%) of children in this age group reported a score of 5 or more.
Figure 7.4: Total behaviour problem (BITSEA) scores, children aged 0-3 years, 2012 and 2014

Notes: Data have been weighted. The "don't know" and "refused" responses were excluded from this analysis (less than 1%). Differences between 2012 and 2014 were not statistically significant.
7.1.3 Wellbeing of school-aged children
Both the SRSP 2012 and 2014 asked questions directed at measuring school-aged children's social and learning wellbeing. Parents were asked: "Compared with children of the same age, how would you say your child is":
- doing with learning or school work;
- getting along with children his/her own age; and
- doing in most areas of his/her life.
Figure 7.5 indicates no significant differences between parents' subjective ratings of their child's wellbeing between 2012 and 2014, with 86-93% of parents reporting that their school-aged children were doing the same or better than other children of the same age on these three aspects measured.
Figure 7.5: Parents' ratings of social and learning wellbeing of focus child relative to peers, by child age, 2012 and 2014
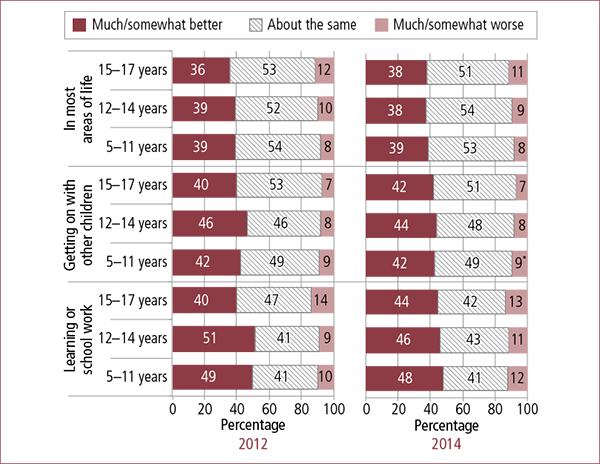
Notes: Data have been weighted. Percentages may not total 100.0% due to rounding. Statistically significant differences between 2012 and 2014 within a given population are noted: * p < .05; ** p < .01; *** p < .001. Note that the categories of "much better" and "somewhat better" are collapsed together and the categories of "much worse" and "somewhat worse" are collapsed together.
7.1.4 Concerns about children's wellbeing
Information was also sought by SRSP 2012 and 2014 about difficult child behaviours in the three months prior to the survey. Parents were asked whether:
- any professional (e.g., teacher, GP, nurse) said they were worried about the child (e.g., being settled, feeding, sleeping, toileting, health, learning or general development);
- the child had seemed to be more distressed by routine separations than usual (e.g., when being dropped off at child care or school);
- the child had been more irritable or upset than usual (excluding routine illness, teething etc.);
- the child had ever become very agitated or very upset or withdrawn when going to or returning from spending time with the focus parent; and
- the child's patterns of social interactions had changed significantly from his/her general behaviour (e.g., a generally outgoing child is suddenly very withdrawn).
Analysis comparing parents' responses between 2012 and 2014 shows no significant changes occurred during this time (Figure 7.6). Of note, professionals were reported to express concerns in greater proportions with respect to children in the 5 year and above age groups, and a greater proportion of parents in both cohorts reported children aged 15-17 years as exhibiting distress at routine separation (2012: 19%; 2014: 21%) when compared with children of other age groups. Concerns were also raised in greater proportions about the social interactions of 3-4 and 5-11 year old children when compared with children in other age groups.
Figure 7.6: Parents' assessments of negative behaviour of focus child, by child age, 2012 and 2014
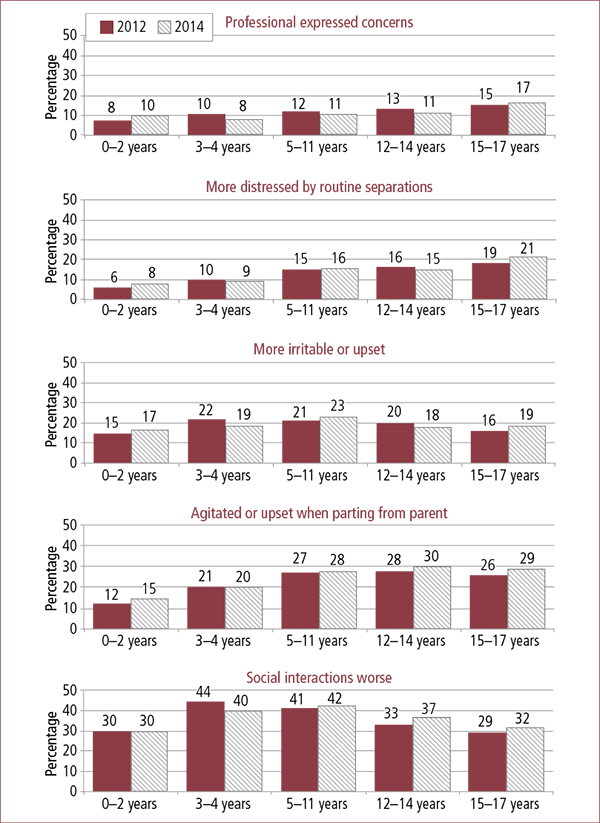
Notes: Data have been weighted. The "don't know" and "refused" responses were excluded from this analysis (less than 1%). Differences between 2012 and 2014 were not statistically significant.
7.2 Child wellbeing and family violence
7.2.1 Children's wellbeing and family violence before/during or since separation
This section looks at connections between children's wellbeing and family violence that had occurred before/during and/or since separation. Overall, a comparative analysis of SRSP 2012 and 2014 data reveals very few changes in parents' ratings of their child's health and wellbeing between the two cohorts, with significantly higher ratings where no family violence had occurred, and lower ratings where physical violence had occurred, with or without emotional abuse.
Physical health and general wellbeing
A large majority of children were reported as being in excellent or very good health, with parents who reported experiencing no violence providing higher ratings of their children's physical health when compared with parents' ratings where violence had occurred, particularly when family violence had occurred since the separation.
A comparison of fathers' and mothers' reports in both cohorts revealed a significantly smaller proportion of fathers than mothers rating their child's health as excellent, and significantly higher proportions of fathers than mothers rating their child's health as good, fair or poor (data not shown). There were no significant changes between mothers' reports by their experiences of family violence before/during or since separation in 2012 and 2014 (data not shown). Among fathers who experienced no family violence either before/during or since separation, the proportion that rated their child's physical health as fair or poor decreased between 2012 and 2014 (from 4% in each period in 2012, to 2% before/during separation in 2014 and 3% since separation in 2014; data not shown).
Overall child wellbeing
Analyses of child wellbeing by parents' experiences of family violence either before/during or since separation showed no significant differences between 2012 and 2014 (data not shown). In both the before/during and since separation time periods, parents' satisfaction with their child's overall wellbeing was highest among those who had reported not experiencing family violence and lowest among parents who reported experiencing physical violence. Decreases in satisfaction between cohorts generally was from high satisfaction to moderate satisfaction rather than to dissatisfaction (before/during - no violence: 2012: 87% and 2014: 88%; emotional abuse alone: 2012: 70% and 2014: 72%; physical violence: 2012: 67% and 2014: 63%; since separation - no violence: 2012: 86% and 2014: 87%; emotional abuse alone: 2012 and 2014: 68%; physical violence: 2012: 63% and 2014: 65%; data not shown).
Behaviour problems
In both cohorts, there were sizable differences among 1-3 year old children in their levels of behaviour problems according to whether family violence was reported as occurring before/during or since separation. Children showed the highest levels of problems when physical violence was reported, lower (but still somewhat elevated) levels when emotional abuse alone was reported, and the lowest levels when no family violence had occurred. Levels were higher if the family violence had occurred in the period since separation rather than in the before/during separation time period (physical violence - before/during: 3.7 mean cf. since: 4.3; emotional abuse alone - before/during: 3.3 cf. since: 3.4; data not shown).
Social and learning wellbeing
Among school-aged children, the vast majority of parents rated their child as doing the same as or better than their peers with regard to school work, getting on with others, and most areas of their life. Almost no differences of any statistical significance emerged between 2012 and 2014, (see Figures B1-B6 in Appendix 3). Overall, parents who experienced physical violence either before/during or since separation were slightly more likely than parents who did not experience family violence to report that their child was faring worse than their peers.
7.2.2 Children's wellbeing and timing of witnessing family violence
This section examines parents' perceptions of their child's wellbeing by reports of the presence of family violence and the reported timing of the child witnessing any violence. As outlined in section 3.6, where parents reported in the interview that they had experienced family violence either before/during the separation or since the separation, they were asked whether the child had ever witnessed it. Analyses are presented in five categories:
- no family violence occurred (2012: n = 1,651; 2014: n = 1,704);
- family violence occurred and the child:
- never witnessed it (2012: n = 1,502; 2014: n = 1,371)
- witnessed family violence before/during the separation only (2012: n = 1,010; 2014: n = 1,116);
- witnessed family violence since the separation only (2012: n = 402; 2014: n = 411); or
- witnessed family violence before/during and since the separation (2012: n = 1,389; 2014: n = 1,296).
The examination of results from both the 2012 and 2014 cohorts (Figure 7.7), reinforce the response patterns reported in De Maio et al. (2013), indicating that there was a correlation between parents reporting that they had experienced family violence and their perceptions of any negative effects on their children's health and wellbeing. The data also suggest that the timing of children witnessing family violence also had negative effects on their wellbeing.
As De Maio et al. (2013, p. 86) observed, as the same participant was reporting on both the occurrence of family violence and the child's wellbeing, some "eye of the beholder" effects12 are likely to have contributed to the findings in this section, though the size and consistency of differences suggest genuine divergences in the wellbeing of the relevant children.
General child health
Consistent with parents' perceptions of their child's physical health, Figure 7.7 shows that reports rating the focus child's general health varied to a statistically significant extent between fathers and mothers, with mother's reports of children's wellbeing yielding higher positive ratings than fathers in both cohorts, with this being particularly marked where family violence was reported as being witnessed, both before/during and since separation ("excellent" rating - mothers: 2012: 52% and 2014: 49%; fathers: 2012: 37% and 2014: 38%). Also notable is that father's ratings of children's wellbeing as fair/poor decreased to a statistically significant extent in the "no violence" category between cohorts (2012: 3% cf. 2014: 1%).
Figure 7.7: Parents' ratings of focus child's general health, by timing of child witnessing family violence and parent gender, 2012 and 2014
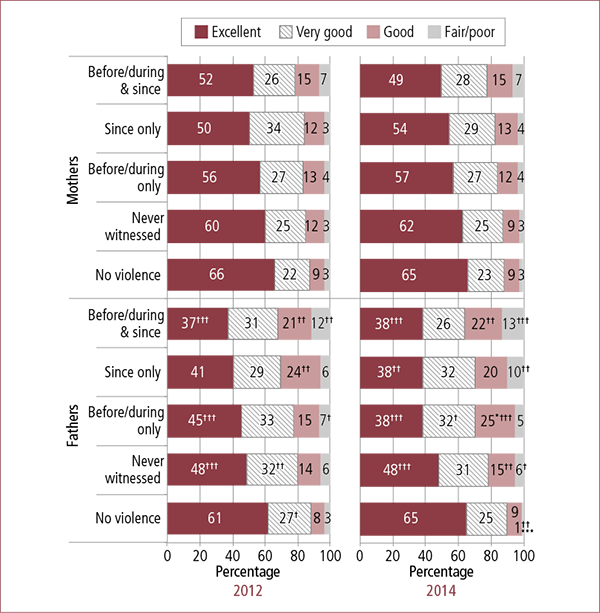
Notes: Data have been weighted. The "don't know" and "refused" responses were excluded from this analysis (less than 3%). Statistically significant differences between 2012 and 2014 within a given population are noted: * p < .05; ** p < .01; *** p < .001. Statistically significant differences between fathers and mothers within each cohort are noted: † p < .05; †† p < .01; ††† p < .001.
Overall child wellbeing
Figure 7.8 shows parents' satisfaction with the child's overall wellbeing by the timing of children witnessing family violence. No changes between 2012 and 2014 were identified, with the exception of an increase in the proportion of mothers whose child witnessed family violence before/during separation alone, who were highly satisfied with their child's overall wellbeing (2012: 77% cf. 2014: 82%), and a decrease in the proportion of mothers reporting that they were dissatisfied (2012: 3% cf. 2014: 2%). Similar to parents' perceptions of their child's physical health (described in section 7.2.1) and parents' ratings of their child's general health described directly above, gendered patterns emerged in parents' satisfaction with their child's overall wellbeing, with significantly fewer fathers than mothers reporting that they were highly satisfied, and significantly more fathers reporting that they were either moderately satisfied or dissatisfied with their child's wellbeing.
Figure 7.8: Parents' satisfaction with focus child's overall wellbeing, by timing of child witnessing family violence and parent gender, 2012 and 2014
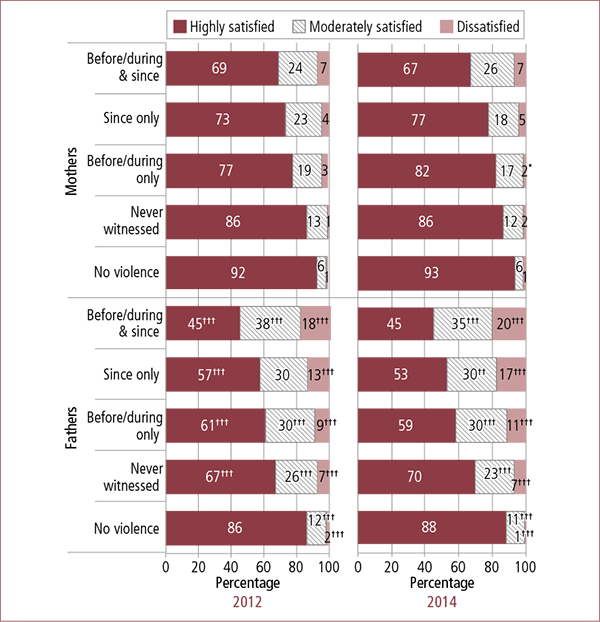
Notes: Data have been weighted. Percentages may not total 100.0% due to rounding. The "don't know" and "refused" responses were excluded from this analysis (less than 3%). Statistically significant differences between 2012 and 2014 within a given population are noted: * p < .05; ** p < .01; *** p < .001. Statistically significant differences between fathers and mothers within each cohort are noted: † p < .05; †† p < .01; ††† p < .001.
Behaviour problems
Analysis of behaviour problems among infants and toddlers by whether they were exposed to family violence showed no differences of statistical significance across the groups or between the two cohorts (Table 7.2). Once again, the overall trend among all parents' responses showed that where family violence had not occurred, children showed fewer behaviour problems, whereas children who had witnessed prolonged family violence (both before/during and since separation) exhibited more behaviour problems. Examination by parent gender showed almost no differences of statistical significance, with the exception being that of the parents in SRSP 2012 whose children witnessed family violence since separation only, among whom mothers tended to nominate fewer behaviour problems on average than fathers (mothers: mean = 2.8 cf. fathers: mean = 4.3).
| 2012 | 2014 | |||||
|---|---|---|---|---|---|---|
| Total (mean) | Fathers (mean) | Mothers (mean) | Total (mean) | Fathers (mean) | Mothers (mean) | |
| Notes: Data have been weighted. | ||||||
| No violence | 2.2 | 2.1 | 2.3 | 2.2 | 2.3 | 2.1 |
| Never witnessed | 3.2 | 3.2 | 3.2 | 2.8 | 2.8 | 2.7 |
| Before/during separation only | 3.2 | 3.1 | 3.2 | 3.5 | 3.8 | 3.3 |
| Since separation only | 3.5 | 4.3 | 2.8 † | 3.5 | 4.0 | 3.1 |
| Before/during & since separation | 4.3 | 4.8 | 4.1 | 4.6 | 4.7 | 4.6 |
| No. of observations | 1,376 | 529 | 847 | 1,561 | 613 | 948 |
Social and learning wellbeing
The data from parents in both the 2012 and 2014 cohorts indicate that a higher proportion of children who were reported to have witnessed family violence over a prolonged period (before/during and since separation) were faring worse with regard to their social/learning wellbeing than those children who had not witnessed family violence and were more commonly reported as faring worse when compared with children who were reported to have witnessed the family violence in just one time period (Figures 7.9 and 7.10).
Figure 7.9: Parents' ratings of learning wellbeing of focus child compared to peers, by timing of child witnessing family violence and parent gender, 2012 and 2014
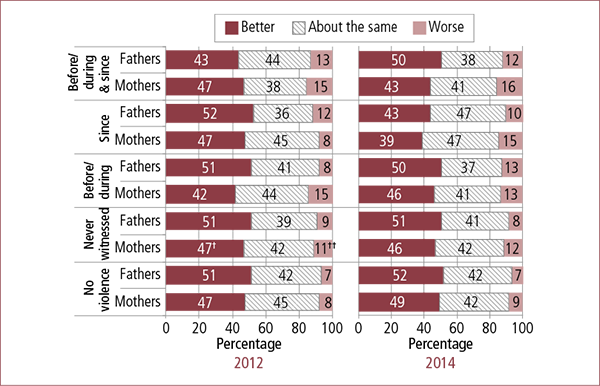
Notes: Data have been weighted. Percentages may not total 100.0% due to rounding. The "don't know" and "refused" responses were excluded from this analysis (less than 3%). Statistically significant differences between 2012 and 2014 were not found. Statistically significant differences between fathers and mothers within each cohort are noted: † p < .05; †† p < .01; ††† p < .001. Note that the categories of "much better" and "somewhat better" are collapsed together and the categories of "much worse" and "somewhat worse" are collapsed together.
Figure 7.10: Parents' ratings of social wellbeing of focus child compared to peers, by timing of child witnessing family violence and parent gender, 2012 and 2014
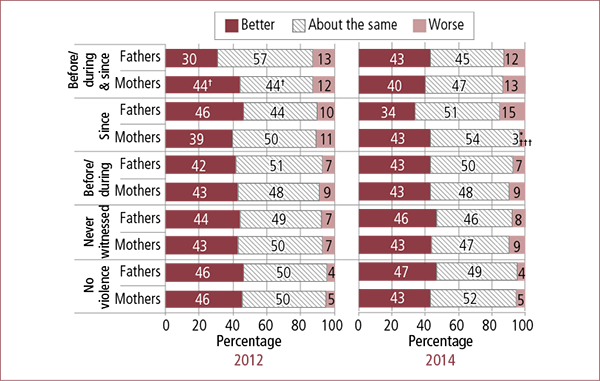
Notes: Data have been weighted. Percentages may not total 100.0% due to rounding. The "don't know" and "refused" responses were excluded from this analysis (less than 3%). Statistically significant differences between 2012 and 2014 within a given population are noted: * p < .05; ** p < .01; *** p < .001. Statistically significant differences between fathers and mothers within each cohort are noted: † p < .05; †† p < .01; ††† p < .001. Note that the categories of "much better" and "somewhat better" are collapsed together and the categories of "much worse" and "somewhat worse" are collapsed together.
No significant changes were observed between the reports of parents in each cohort with respect to children's wellbeing as reflected in their learning or schoolwork. Mothers in the 2012 cohort who reported that they had experienced family violence but that this had not been witnessed by the child, were significantly less likely than fathers to report that the child was doing much/somewhat better academically and, conversely, these mothers were more likely than fathers to report that their child was doing somewhat or much worse academically than their peers.
In relation to parents' reports of focus children's interactions with other children, among parents whose child witnessed family violence since separation, fathers in the 2014 cohort were significantly more likely than mothers to feel that their child was faring worse socially than their peers.
Analysis of parents' perceptions of how the focus child was faring in most areas of their life, by whether the child had witnessed family violence, once again showed very little variation of statistical significance (Figure 7.11). Interestingly, however, mothers in the 2014 cohort who reported experiencing no family violence thought that their child fared much/somewhat better than their peers in lower proportions than mothers who reported that they had experienced family violence but their child had not witnessed it (40% cf. 44% respectively).
Figure 7.11: Parents' ratings of wellbeing of focus child in most areas of their life compared to peers, by timing of child witnessing family violence and parent gender, 2012 and 2014
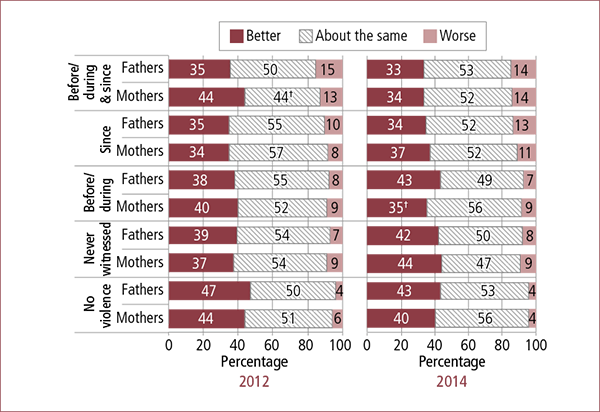
Notes: Data have been weighted. Percentages may not total 100.0% due to rounding. The "don't know" and "refused" responses were excluded from this analysis (less than 3%). Differences between 2012 and 2014 were not statistically significant. Statistically significant differences between fathers and mothers within each cohort are noted: † p < .05; †† p < .01; ††† p < .001. Note that the categories of "much better" and "somewhat better" are collapsed together and the categories of "much worse" and "somewhat worse" are collapsed together.
Negative changes in patterns of behaviour
The 2012 and 2014 SRSP data indicate that reports of negative changes in focus child behaviour were significantly less common among children whose parents reported that they had not experienced family violence, when compared with parents who reported experiencing family violence (Figure 7.12).
Figure 7.12: Parents' assessments of negative behaviour of focus child, by timing of child witnessing family violence, 2012 and 2014
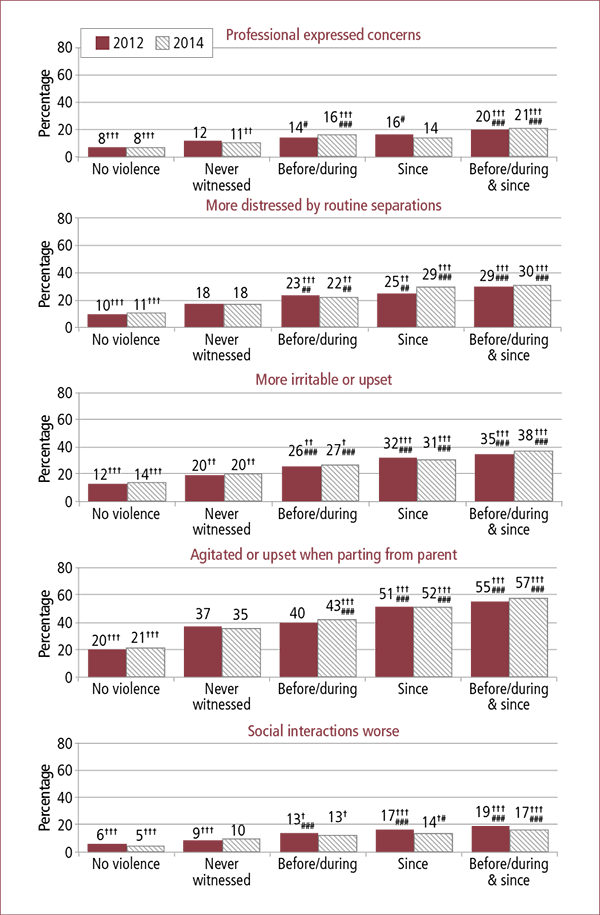
Notes: Data have been weighted. Percentages may not total 100.0% due to rounding. The "don't know" and "refused" responses were excluded from this analysis (less than 3%). Differences between 2012 and 2014 were not statistically significant. Statistically significant differences between "no violence" and each other sub-group within each cohort are noted: † p < .05; †† p < .01; ††† p < .001. Statistically significant differences between "never witnessed" and each other sub-group of witnessing violence within each cohort are noted: # p < .05; ## p < .01; ### p < .001.
Higher proportions of children were reported as having each behaviour problem where they had witnessed family violence more recently (in the periods since separation only, and both before/during and since separation). For example, in 2014, almost one in three parents who reported that their child had witnessed family violence since separation, also reported that their child had recently been more distressed than usual by routine separation (e.g., when going to school or visiting a friend's house), as compared with one in ten parents who reported that family violence had never occurred.
Witnessing violence also appears to have a negative effect on children's general demeanour. Thirty-eight per cent of parents in the 2014 cohort who reported that their child had witnessed family violence before/during and since separation, also reported that their child seemed more irritable or upset than usual, compared to 14% of parents who reported that family violence had not occurred. Similarly, 57% of parents who reported that their child had witnessed family violence before/during and since separation also reported that their child was more agitated or upset when parting from their parent at changeovers, compared with 21% of parents reporting that family violence had never occurred.
7.3 Children's wellbeing and their exposure to fear, coercion and control
7.3.1 Overall child wellbeing
As noted in section 3.8, parents participating in the SRSP 2014 were asked new questions intended to capture their experiences in regard to the 2012 amendment to the definition of family violence in FLA s 4AB to encompass "violent, threatening or other behaviour by a person that coerces or controls a member of the person's family (the family member), or causes the family member to be fearful".
Figure 7.13 presents data regarding parents' satisfaction with their child's overall wellbeing, considered in the context of the child's exposure to behaviour that causes feelings of fear (fear-inducing behaviour). These data indicate that where parents reported that since separation their child had witnessed their parent's fear in response to the focus parent's behaviour, they were significantly less likely to report being highly satisfied with their child's overall wellbeing when compared to the satisfaction ratings relating to children where family violence had never occurred. These parents were also less likely (although not to a statistically significant extent) to report high satisfaction when compared with parents indicating that their children had never witnessed fear-inducing behaviour. Dissatisfaction ratings were also significantly higher among parents reporting that the focus child had witnessed fear-inducing behaviour when compared with parents who did not report such behaviour.
Figure 7.13: Timing of focus child being exposed to fear-inducing behaviour, by parents' satisfaction with child's overall wellbeing, 2014
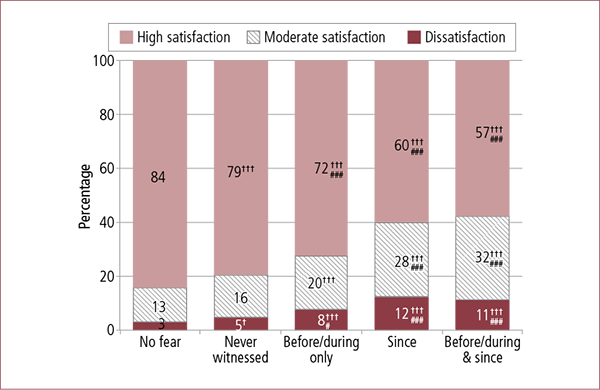
Notes: Data have been weighted. Percentages may not total 100.0% due to rounding. The "don't know" and "refused" responses were excluded from this analysis (less than 3%). Statistically significant differences between "no fear" and each other sub-group within each cohort are noted: † p < .05; †† p < .01; ††† p < .001. Statistically significant differences between "never witnessed" and each other sub-group of witnessing violence within each cohort are noted: # p < .05; ## p < .01; ### p < .001.
A similar response pattern is also evident in Figure 7.14 in relation to parents' reported satisfaction with children's overall wellbeing in the context of exposure to coercive behaviour on the part of the focus parent. These data show that parents were significantly less likely to be highly satisfied with their child's overall wellbeing where they reported their child to have witnessed their parent experiencing coercive behaviour before and/or since separation, when compared to reports both about children who had never witnessed such coercive behaviour and where such coercion had never occurred. Dissatisfaction ratings were again significantly higher among parents reporting that the focus child had witnessed the coercive behaviour when compared with parents who reported no coercive behaviour.
Figure 7.14: Timing of focus child being exposed to coercive behaviour, by parents' satisfaction with child's overall wellbeing, 2014
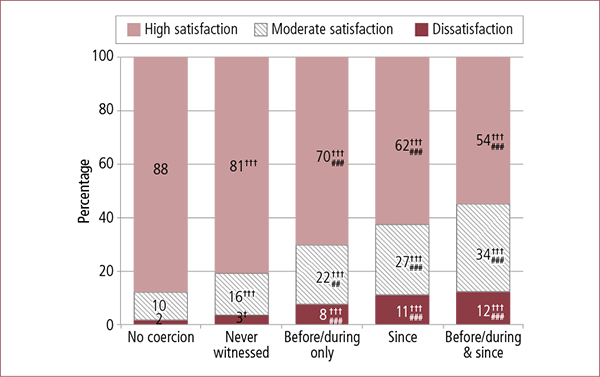
Notes: Data have been weighted. Percentages may not total 100.0% due to rounding. The "don't know" and "refused" responses were excluded from this analysis (less than 3%). Statistically significant differences between "no coercion" and each other sub-group within each cohort are noted: † p < .05; †† p < .01; ††† p < .001. Statistically significant differences between "never witnessed" and each other sub-group of witnessing violence within each cohort are noted: # p < .05; ## p < .01; ### p < .001.
Similarly, Figure 7.15 indicates that where parents reported that their child had witnessed the focus parents' controlling behaviour since separation, they were significantly less likely to report being highly satisfied with their child's overall wellbeing when compared to parents who reported that no family violence had occurred or that any controlling behaviour had never been witnessed by the focus child. Once again, dissatisfaction ratings were also significantly higher among parents who reported that the focus child had witnessed the controlling behaviour, compared with parents who reported that no controlling behaviour had occurred.
Figure 7.15: Timing of focus child being exposed to controlling behaviour, by parents' satisfaction with child's overall wellbeing, 2014
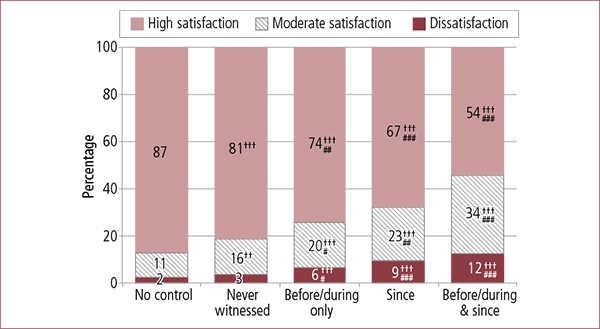
Notes: Data have been weighted. Percentages may not total 100.0% due to rounding. The "don't know" and "refused" responses were excluded from this analysis (less than 3%). Statistically significant differences between "no control" and each other sub-group within each cohort are noted: † p < .05; †† p < .01; ††† p < .001. Statistically significant differences between "never witnessed" and each other sub-group of witnessing violence within each cohort are noted: # p < .05; ## p < .01; ### p < .001.
Reports of focus children's social and learning wellbeing were also considered in the context of parents' reports of the child's exposure to fearful, coercive or controlling behaviour on the part of the focus parent.
7.3.2 Behaviour problems
Regression analysis was undertaken to examine the BITSEA scores for infants and toddlers in the context of these children's exposure to fear, coercion and control. Data presented in Figure 7.16 indicate that infants and toddlers who were exposed to fear, coercion and/or control before/during and since separation were reported as having significantly more behaviour problems than those for whom fear, coercion and control were not present.
For example, the top panel in Figure 7.16 shows that children reported as having been exposed to fear-inducing behaviour by the focus parent before, since or before and since separation were considered by parents to have significantly more behaviour problems (mean BITSEA scores - before: 3.6; since: 4.1; before and since: 4.3) than the number of behaviour problems reported for those children where no fearful behaviour was reported (mean BITSEA score: 2.5).
Figure 7.16: Total behaviour problem (BITSEA) scores, by timing of focus child being exposed to fear/coercion/control of focus parent, 2014

Notes: Data have been weighted. Percentages may not total 100.0% due to rounding. The "don't know" and "refused" responses were excluded from this analysis (less than 3%). Statistically significant differences between "no fear/coercion/control" and each other sub-group within each cohort are noted: † p < .05; †† p < .01; ††† p < .001.
7.3.3 Social and learning wellbeing
Figure 7.17 shows that significantly higher proportions of parents reported that their children who had been exposed to fear-inducing behaviour by the focus parent since the separation were reported as faring somewhat or much worse than their peers in all three domains - learning and schoolwork, socialising and in most areas of life - when compared with reports about children who had not been exposed to such behaviour. For example, a significantly higher proportion of parents who reported that their children had been exposed to fear-inducing behaviour before and since separation or since separation only, also reported that their children were faring "much worse" or "somewhat worse" than their peers in relation to their learning and schoolwork (before and since: 13%; since: 19%) when compared with the reports relating to children who had not been exposed to fear-inducing behaviour (10%). Similarly, a significantly higher proportion of parents who reported that their children had been exposed to fear-inducing behaviour before and since separation or since separation only also reported that their children were faring "much worse" or "somewhat worse" than their peers in relation to most areas of their life (before and since: 15%; since: 14%) when compared with the reports relating to children who had not been exposed to such behaviour (6%). Figure 7.17 also shows that a significantly lower proportion of parents reported that their child was faring "much better" or "somewhat better" in most areas of life where that child had witnessed the focus parent's fear-inducing behaviour before and since separation (34%) and since separation (27%), when compared with other categories of children on this issue.
Figure 7.17: Timing of focus child being exposed to fear-inducing behaviour, by parents' ratings of how well the child is faring compared to peers, 2014
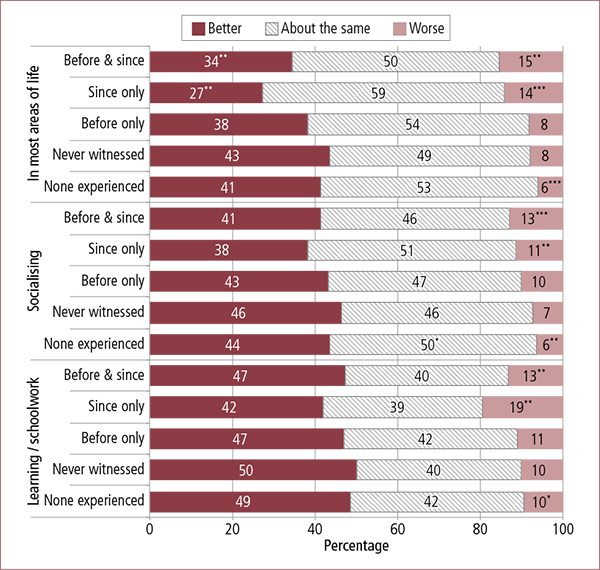
Notes: Data have been weighted. Percentages may not total 100.0% due to rounding. The "don't know" and "refused" responses were excluded from this analysis (less than 3%). Statistically significant differences between each population are noted: * p < .05; ** p < .01; *** p < .001. Note that the categories of "much better" and "somewhat better" are collapsed together and the categories of "much worse" and "somewhat worse" are collapsed together.
Consistent with these findings in relation to the wellbeing of children who witnessed fear-inducing behaviour by the focus parent, Figure 7.18 shows that significantly higher proportions of children who were reported as having been exposed to controlling behaviour before and since separation or since the separation, were also reported as faring somewhat or much worse than their peers in all three domains, compared with reports that their children had not been exposed to controlling behaviour. For example, a significantly higher proportion of parents who reported that their children had been exposed to controlling behaviour before and since separation or since separation only also reported that their children were faring "much worse" or "somewhat worse" than their peers in relation to most areas of their life (before and since: 14%; since: 17%) when compared with reports relating to children who had not been exposed to controlling behaviour (5%). Similarly, a significantly higher proportion of parents who reported that their children had been exposed to controlling behaviour before and since separation or since separation only also reported that their children were faring "much worse" or "somewhat worse" than their peers in relation to their learning and schoolwork (before and since: 13%; since: 17%) when compared with the reports relating to children who had not been exposed to controlling behaviour (9%).
Figure 7.18: Timing of focus child being exposed to controlling behaviour, by parents' ratings of how well the child is faring compared to peers, 2014
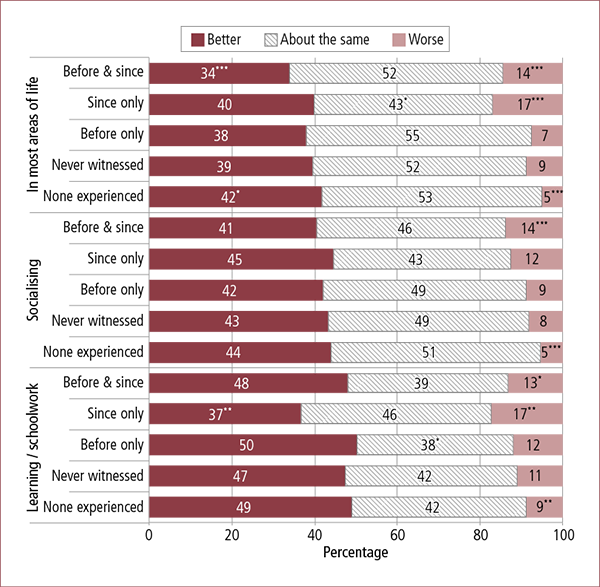
Notes: Data have been weighted. Percentages may not total 100.0% due to rounding. The "don't know" and "refused" responses were excluded from this analysis (less than 3%). Statistically significant differences between each population are noted: * p < .05; ** p < .01; *** p < .001. Note that the categories of "much better" and "somewhat better" are collapsed together and the categories of "much worse" and "somewhat worse" are collapsed together.
Consistent with the response patterns identified in relation to children's exposure to fearful and controlling behaviour on the part of the focus parent, Figure 7.19 shows that significantly higher proportions of children who had been exposed to coercive behaviour both before and since or only since the separation, were reported as faring somewhat or much worse than their peers in all three domains, compared with reports of children not experiencing coercion. For example, parents who reported that their child had witnessed the focus parent's coercive behaviour before and since separation thought that their child was faring "much worse" or "somewhat worse" in most areas of their life, to a significantly higher proportion (15%) than the reports relating to children who had not been exposed to coercive behaviour. A significantly lower proportion of parents who reported that their children had been exposed to coercive behaviour since separation only also reported that their children were faring "much better" or "somewhat better" than their peers in relation to their learning and schoolwork (36%) when compared with the reports relating to children who had not been exposed to coercive behaviour (49%).
Figure 7.19: Timing of focus child being exposed to coercive behavior, by parents' ratings of how well the child is faring compared to peers, 2014

Notes: Data have been weighted. Percentages may not total 100.0% due to rounding. The "don't know" and "refused" responses were excluded from this analysis (less than 3%). Statistically significant differences between each population are noted: * p < .05; ** p < .01; *** p < .001. Note that the categories of "much better" and "somewhat better" are collapsed together and the categories of "much worse" and "somewhat worse" are collapsed together.
7.3.4 Effects on child wellbeing of witnessing family violence
Table 7.3 shows the number of parents in each cohort who reported that their child had witnessed family violence and the proportions of parents who felt that these experiences had affected the child in some way. In both cohorts, the majority of parents felt that the family violence they experienced from the focus parent had affected the child, with this being slightly higher among mothers than fathers. There was a significant decrease between 2012 and 2014 in the proportion of mothers reporting that witnessing family violence had affected their child (2012: 74%; 2014: 70%). Though excluded from the analysis below, it is worth noting that 5% of parents in 2012 and 6% of parents in 2014, did not know if witnessing family violence had affected their children, and this was higher among fathers than mothers in both cohorts (data not shown).
| 2012 | 2014 | |||||
|---|---|---|---|---|---|---|
| Total (%) | Fathers (%) | Mothers (%) | Total (%) | Fathers (%) | Mothers (%) | |
| Notes: Data have been weighted. The "don't know" (5%) and "refused" (less than 1%) responses were excluded from this analysis. Statistically significant differences between 2012 and 2014 within a given population are noted: * p < .05; ** p < .01; *** p < .001. Statistically significant differences between fathers and mothers within each cohort are noted: † p < .05; †† p < .01; ††† p < .001. | ||||||
| Yes | 72.3 | 69.8 | 74.0 † | 71.3 | 72.4 | 70.4 * |
| No | 27.7 | 30.2 | 26.0 | 28.7 | 27.6 | 29.6 |
| No. of observations | 2,728 | 1,089 | 1,639 | 2,725 | 1,090 | 1,635 |
In each cohort of the SRSP, a subset of randomly selected parents was asked to describe the effect that witnessing a parent's violent or abusive behaviour had had on their child.13 The themes that emerged from analysis of these responses were consistent in both cohorts.
The most common response from parents was that witnessing family violence had had a negative effect on their child's mental health and psychological adjustment, causing distress, fear and anxiety:
I think it affected their sense of security. Certainly [child's] security, her confidence, she did not really understand what was happening. It also impacted on the way she treated other people, started copying some of the behaviours. She'd become withdrawn. She certainly felt uneasy. (Mother, SRSP 2014)
My son has nightmares all the time, he would yell in his sleep, and it's always the same nightmare all the time. My girl is scared of when males start raising their voice, and now there is certain events, e.g., certain songs, that would trigger her memory and she would burst in to tears and start crying (Mother, SRSP 2014)
I think it erodes trust and makes them less confident. Stunts emotional development, and I guess [child] had become more fearful of new situations and change. (Father, SRSP 2014)
They were locking doors, and crying. The other kids thought that if [child] was late that [focus parent] was not going to bring her back. They have come good in the last couple of months; they have stopped locking doors since the supervision was established. (Mother, SRSP 2014)
[Child] starts crying, he's afraid. Every time [focus parent] raises her voice, [child] panics and is scared of doing something he might want to do. (Father, SRSP 2014)
My eldest has anxiety. They're all still seeing a counsellor due to [focus parent's] behaviour. Socially, [the children's] behaviour is much more reserved compared to other children their age. My little one suffers quite badly because of his shyness. At preschool, whenever one of the teachers ask him to do something, he bursts into tears because he thinks he's going to get into trouble. (Mother, SRSP 2012)
[Family violence] caused regressive behaviour, such as sleep disruption, anxiety and trauma being alone in bed. Also withholding bowel movements, distressing and leading problems to doing bowel movements in bath, and has now escalated to fear of water and also very clingy behaviour. (Mother, SRSP 2014)
Other parents felt the family violence had affected their relationship with their children:
How [child] looks at me and the things they say to me. I think my relationship with the kids has been diminished because of what's been told to them. My relationship with them is nothing like it was. [Child] has been to counselling. He's very reserved and he won't open up. I know there's a lot of damage that's been done to those kids and their relationship with me. (Father, SRSP 2014)
Made one of them basically totally withdraw from me, made another one incredibly clingy when I'm around, and the third one [child] has withdrawn into herself and won't open up to me. She's becoming mates with a very bad man, a monster who is her current partner. (Father, SRSP 2014)
[Child] is more attached to me as a consequence, and picks up when I feel anxious in [focus parent's] presence, and that makes [child] feel like he needs to stay with me. [Child] often doesn't want to go off with [focus parent] by himself. It has impacted on [child's] feeling of security. (Mother, SRSP 2014)
Fear or wariness of other men or women more generally was a common theme in both cohorts, with children becoming fearful or distrusting of adults who were the same gender as the perpetrator of the family violence:
Emotional-wise, where [child's] trust [in] men has drastically dropped. [Child] thinks that whenever there are strange men around, that they will hurt you. (Mother, SRSP 2012)
[Witnessing family violence] affected their confidence quite a lot actually. [The violence has] kind of been demoralising. [The violence] has impacted on their relationships with other males; reduced their confidence in day-to-day life and living. (Mother, SRSP 2012)
They are more hesitant to be around men. I noticed the oldest likes clinging to people … It's hard for him to let go of people. [Child] got bashed by [focus parent], and for a long time [child] plays up a lot for men and me. Pushes it more for men. Impacted my 4-year-old's speech; he got hurt physically the most. (Mother, SRSP 2014)
[Child] is scared of females raising their voice, even if they're not aggressive about it. (Father, SRSP, 2012)
Another common theme mentioned by mothers was that of the child becoming protective of them or other family members:
[Child 1] became very protective of me. For example, [focus parent] used to come up and torment me while I was cooking tea, and [child] used to fight him off, saying, "Leave mum alone, leave mum alone". [Child 2] hibernated into his own world. [Child 2] saw what was going on before separation, and at one time was trying to stop his father during a drunken episode, and father bashed [Child 2]. First time I've seen his father hit him like that. (Mother, SRSP 2012)
Because she wasn't close to her dad; that is, her dad didn't have a good relationship with her [or] show attention or love to her. And because … there isn't anyone in her life that gave her a lot of love besides me, she has an attachment disorder to me. Because she has witnessed her dad not treating me nicely physically and emotionally, she is very wary about any male coming into my life and feels the need to protect me. (Mother, SRSP 2012)
Around one in five of the children of the parents in this subset of the sample had developed antisocial behaviours such as aggression and violence, and these behaviours were often described in the context of the negative modeling of the family violence they had witnessed:
After [focus parent] threatened to smash my face after [child] was put in corner, [the child] used the same sentence to get out of the corner and to get out of [the] situation. (Mother, SRSP 2014)
[The] children have become aggressive and like to punch one another, as well as adapting bullying tactics when socialising with each other, and slapping me across the face. (Mother, SRSP 2014)
They're starting to get angry. They throw things around and mimicking [focus parent's] behaviour. And they say it's okay because daddy does it. (Mother, SRSP 2014)
Body language. She comes here and swears and is abusive for the first couple of hours until she realises she is with dad. She throws her arms around like her mum does, so I know she has witnessed some of that. (Father, SRSP 2014)
They're abusive against each other; they copy. They don't see abuse as bad. The verbal abuse and blackmailing when they come to me; I need three to five days to pull them out of that behaviour pattern. Last time … I used the stepsisters of Cinderella to show them how they're acting. When they're with me, after four or five days they're more relaxed; they're like little angels, and then I have to send them back. (Father, SRSP 2014)
Bedwetting and wetting pants at school. The kids have been physically abusive to one another: punching, kicking, biting, pushing over one another and jumping on one another and pulling hair. They've also been swearing at each other and directing all said behaviour at me: kicking me, punching me, biting me and calling me a [expletive], begging me not to speak to their father because that will set him off, and blaming themselves for his behaviour towards me. (Mother, SRSP 2012)
Both are much more aggressive and violent, using the same behaviour. My 4-year-old is undergoing psychology at the moment. My 2-year-old is a lot more rude and aggressive, using some of the same comments back at me, and using the same statements he made. (Mother, SRSP 2012)
Many parents described quite complex issues that have arisen since the child witnessed family violence:
Because they're all boys they're quite aggressive themselves. I think they think that it's okay to be cranky and aggressive, whereas I try to steer them away from being aggressive and stuff. I try to get them to solve it in other ways instead of getting aggressive. [Child] has been affected … that he doesn't want to spend time with [focus parent] ever. When [child] was spending time with [focus parent], [child] didn't want to go one weekend because he was feeling unwell. [Focus parent] said, "My lawyer said he had to" … so [focus parent] physically picked [child] up and locked him in the car and was going to drive off with him, but [child] got out of the car and ran away. [Child] had a meltdown at school earlier on in the year. So it's affected him the worst. (Mother, SRSP 2012)
Other issues mentioned covered a range of topics, such as specific effects on the child's personal functioning (sleeping, bedwetting, eating habits, physical health) and social and learning wellbeing; issues with changeovers or the child not wanting contact with the focus parent; the child being desensitised to fighting, aggression etc.; and the possibility that witnessing family violence may affect the child later in life.
7.4 Parent wellbeing
7.4.1 Parents' satisfaction with various aspects of life
This section examines parents' perceptions of their own wellbeing, measured by their satisfaction with the following aspects of their lives at the time of the interview:
- their relationship with their child;
- their physical health;
- their feelings of safety;
- their financial situation;
- the home in which they lived; and
- their life as a whole.
Parents provided a score from 0 ("completely dissatisfied") to 10 ("completely satisfied") and these were then aggregated into three broad groups: "dissatisfaction" (scores of 0-4), "moderate satisfaction" (scores of 5-7) and high satisfaction (scores of 8-10).
Results in this section firstly compare fathers' and mothers' satisfaction in general, followed by their satisfaction in the context of their experiences of family violence before/during and since separation. Overall, no significant changes emerged in parents' wellbeing between 2012 and 2014, with higher levels of satisfaction being reported in both cohorts by parents who had not experienced family violence, compared with those who had.
7.4.2 Parents' overall satisfaction with aspects of their life
Figure 7.20 indicates parents' satisfaction with the various aspects of their life measured in both cohorts of SRSP and shows that no statistically significant differences emerged between 2012 and 2014 for any of the aspects of parental wellbeing.
Overall, the majority of parents reported high levels of satisfaction with their relationship with their child (2012: 79%; 2014: 78%), though this was significantly higher among mothers than fathers (e.g., 2014 - mothers: 90% cf. fathers: 66%).
Figure 7.20: Current satisfaction with various aspects of life, by parent gender, 2012 and 2014
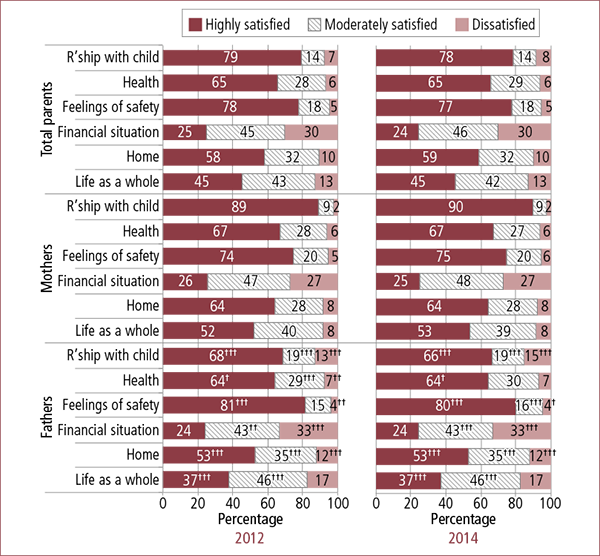
Notes: Data have been weighted. Percentages may not total 100.0% due to rounding. Differences between 2012 and 2014 were not statistically significant. Statistically significant differences between fathers and mothers within each cohort are noted: † p < .05; †† p < .01; ††† p < .001.
Around two in three parents were reportedly highly satisfied with their overall health (65% in both cohorts). However, only one in four parents in either cohort were highly satisfied with their financial situation (2012: 25%; 2014: 24%).
Several significant differences emerged when parents' wellbeing was examined by gender. In addition to their satisfaction with their relationship with the child, higher proportions of mothers than fathers in both cohorts reported high levels of satisfaction with their health (mothers: 67% cf. fathers: 64%), their home (mothers: 64% cf. fathers: 53%) and their life as a whole (mothers: 52-53% cf. fathers: 37%). Conversely, higher proportions of fathers than mothers in both cohorts reported high satisfaction with how safe they felt (fathers: 80-81% cf. mothers: 74-75%).
7.4.3 Parents' satisfaction with their relationship with their child by experiences of family violence
Regarding their relationship with their child, the statistically significant gendered differences persisted when analysed by parents' experiences of family violence both before/during and since separation. Figure 7.21 shows that 88% of mothers in 2014 who experienced physical violence before/during separation were highly satisfied with their relationship with their child, compared with 57% of fathers. Correspondingly, 24% of fathers in the 2014 cohort who had experienced physical violence were dissatisfied with their relationship with their child, compared with just 3% of mothers. Very similar results emerged in parents' satisfaction with their relationship with their child when examined by parents' experiences since separation (see Appendix 3, Figure B7).
Figure 7.21: Current satisfaction with parent-child relationship, by parents' experiences of family violence before/during separation, by parent gender, 2012 and 2014
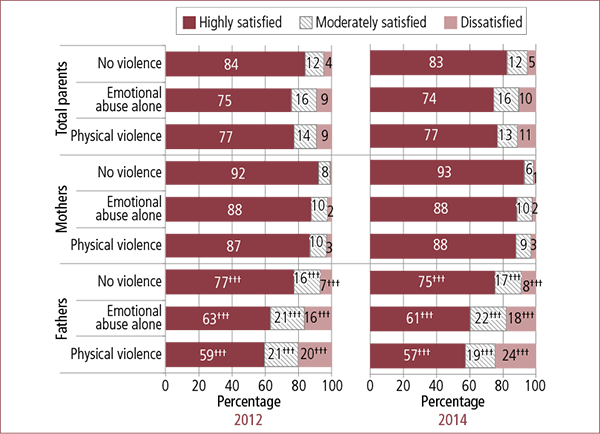
Notes: Data have been weighted. Percentages may not total 100.0% due to rounding. Statistically significant differences between 2012 and 2014 were not found. Statistically significant differences between fathers and mothers within each cohort are noted: † p < .05; †† p < .01; ††† p < .001.
7.4.4 Parents' satisfaction with their life as a whole by experiences of family violence
Significantly higher proportions of mothers than fathers in both cohorts were highly satisfied with their life as a whole, and these gendered differences persisted when analysed by parents' experiences of family violence both before/during and since separation. For example, Figure 7.22 shows that 51% of mothers in 2014 who experienced physical violence before/during separation were highly satisfied with their life as a whole, compared with 30% of fathers. Correspondingly, 26% fathers in the 2014 cohort who experienced physical violence were dissatisfied with their life as a whole, compared with 11% of mothers. Very similar results emerged in parents' satisfaction with their life as a whole when examined by parents' experiences since separation (see Appendix 3, Figure B8).
Figure 7.22: Current satisfaction with life as a whole, by parents' experiences of family violence before/during separation, by parent gender, 2012 and 2014
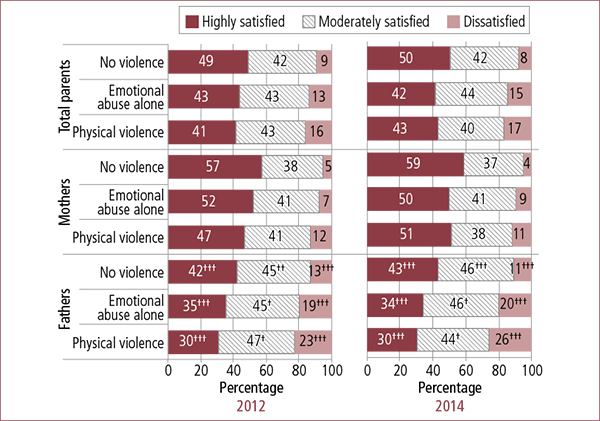
Notes: Data have been weighted. Percentages may not total 100.0% due to rounding. Statistically significant differences between 2012 and 2014 were not found. Statistically significant differences between fathers and mothers within each cohort are noted: † p < .05; †† p < .01; ††† p < .001.
7.4.5 Parents' satisfaction with their safety by experiences of fear, coercion and control
As discussed in section 3.8, parents in SRSP 2014 who had experienced family violence were asked additional questions about whether the family violence caused them to feel fearful, coerced or controlled. This section examines the effect that experiencing fear, coercion and control have on parents' satisfaction with how safe they feel.
Figure 7.23 shows that parents who experienced behaviour that caused them to feel fearful reported lower levels of satisfaction with feelings of personal safety. Moreover, recent and persistent experience of fear-inducing behaviour (i.e., occurring both before/during and since separation) appeared to influence how safe parents felt, with lower proportions of parents reporting they were highly satisfied with their safety, when they had experienced fear before/during and since separation (mothers: 56%; fathers: 62%) compared to those who had experienced family violence but had never felt fearful (mothers: 87%; fathers: 86%). In addition, mothers who had experienced persistent fear (i.e., before/during and since separation) reported significantly higher proportions of moderate satisfaction and dissatisfaction with their personal safety than fathers (moderate satisfaction - mothers: 32% cf. fathers: 26%; dissatisfaction - mothers: 12% cf. fathers: 11%).
Figure 7.23: Parents' experiences and timing of feeling fearful, by current satisfaction with how safe they feel and by parent gender, 2014
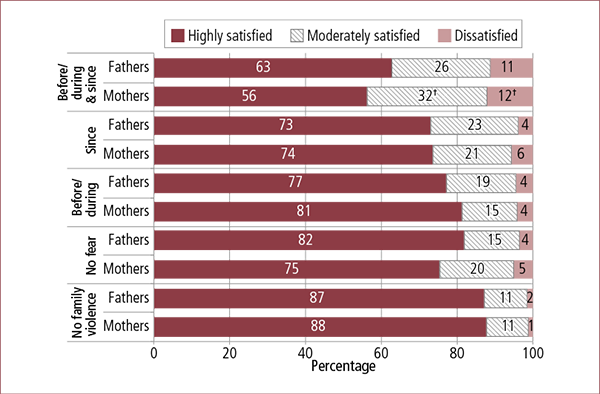
Notes: Data have been weighted. Percentages may not total 100.0% due to rounding. The "don't know" and "refused" responses were excluded from this analysis (less than 3%). Statistically significant differences between fathers and mothers within each cohort are noted: † p < .05; †† p < .01; ††† p < .001.
Similar to experiences of fear, parents who experienced family violence that made them feel coerced generally reported lower levels of satisfaction with their personal safety (Figure 7.24). Again, recent and persistent exposure to coercion appeared to influence how safe parents felt, with lower proportions of parents reporting they were highly satisfied with their safety when they experienced coercion both before/during and since separation. Among these parents, mothers who experienced persistent coercion reported significantly lower satisfaction levels than fathers who experienced persistent coercion (e.g., highly satisfied - mothers: 59% cf. fathers: 67%; dissatisfied - mothers: 11% cf. fathers: 9%).
Figure 7.24: Parents' experiences and timing of feeling coerced, by current satisfaction with how safe they feel and by parent gender, 2014
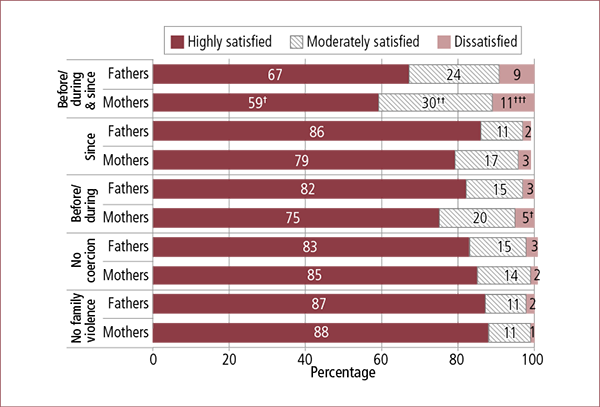
Notes: Data have been weighted. Percentages may not total 100.0% due to rounding. The "don't know" and "refused" responses were excluded from this analysis (less than 3%). Statistically significant differences between fathers and mothers within each cohort are noted: † p < .05; †† p < .01; ††† p < .001.
Interestingly, fathers who experienced family violence in the form of coercion either before/during or since separation, had similar levels of high satisfaction with their current personal safety compared to fathers who had not experienced coercion or family violence at all (82-87% reported high satisfaction across these four groups).
Figure 7.25 shows the relationship between parents' experiences of family violence that made them feel controlled and their feelings of personal safety at the time of the interview. As with fear and coercion, parents who had experienced persistent controlling behaviour had lower levels of satisfaction with their personal safety than parents who had not experienced controlling behaviour and those who had not experienced any family violence. Among parents who experienced persistent controlling behaviour, mothers reported significantly lower levels of satisfaction with their current safety than fathers (high satisfaction - mothers: 58% cf. fathers: 70%; dissatisfaction - mothers: 11% cf. fathers: 8%).
Figure 7.25: Parents' experiences and timing of feeling controlled, by current satisfaction with how safe they feel, by parent gender, 2014
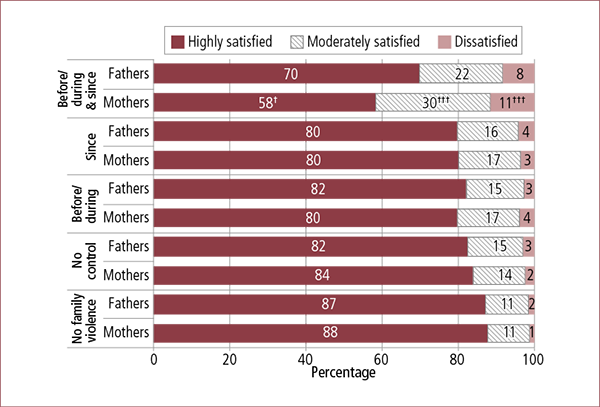
Notes: Data have been weighted. Percentages may not total 100.0% due to rounding. The "don't know" and "refused" responses were excluded from this analysis (less than 3%). Statistically significant differences between fathers and mothers within each cohort are noted: † p < .05; †† p < .01; ††† p < .001.
Figure 7.26 examines how many experiences of fear, coercion and/or control co-occurred before/during separation and whether it affected parents' satisfaction with their safety. Further, among parents who experienced fear, coercion and control before/during separation, a significantly lower proportion of mothers were highly satisfied with their safety than fathers (mothers: 61% cf. fathers: 66%), and they both had significantly lower proportions who were highly satisfied with their safety compared to parents who had not experienced any family violence (mothers and fathers: 87%).
Figure 7.26: Parents' experiences of feeling fearful, coerced and/or controlled before/during separation, by current satisfaction with how safe they feel and parent gender, 2014
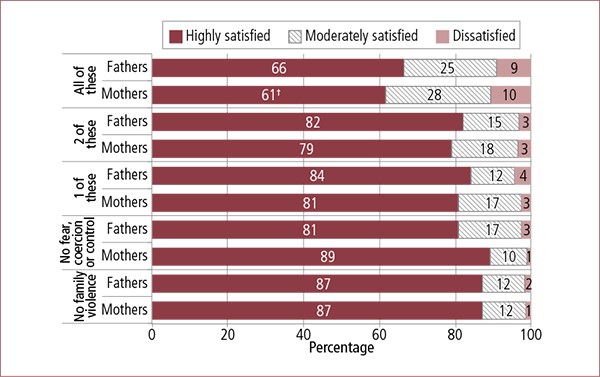
Notes: Data have been weighted. Percentages may not total 100.0% due to rounding. The "don't know" and "refused" responses were excluded from this analysis (less than 3%). Statistically significant differences between fathers and mothers within each cohort are noted: † p < .05; †† p < .01; ††† p < .001.
Similar to experiences before/during separation, parents who experienced fear, coercion and control since separation reported lower levels of satisfaction with their personal safety than parents who did not report experiencing any of these (Figure 7.27). Gendered differences emerged among parents who experienced fear coercion and control, with significantly lower proportion of mothers reporting they were highly satisfied with their current personal safety than fathers (mothers: 55% cf. fathers: 63%). It is also worth noting that fathers who reported that one or two of these experiences occurred reported slightly higher levels of satisfaction with their safety than fathers who had not experienced any fear coercion or control (1-2 experiences: 82-84% cf. no experiences: 81%).
Figure 7.27: Parents' experiences of feeling fearful, coerced and/or controlled since separation, by current satisfaction with how safe they feel, by parent gender, 2014
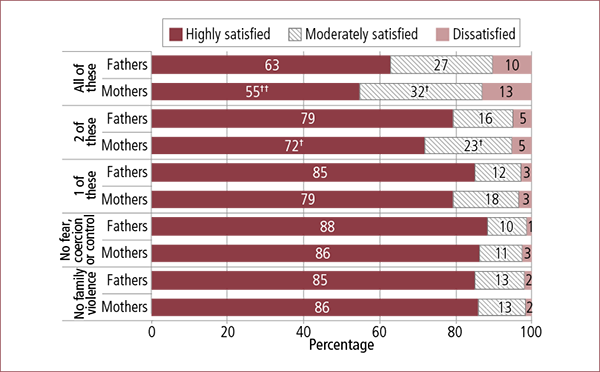
Notes: Data have been weighted. Percentages may not total 100.0% due to rounding. The "don't know" and "refused" responses were excluded from this analysis (less than 3%). Statistically significant differences between fathers and mothers within each cohort are noted: † p < .05; †† p < .01; ††† p < .001.
7.5 Summary
This chapter examined parents' perceptions of their children's and their own wellbeing, some 18 months after parental separation, across the two cohorts of the SRSP. Overall, very few differences emerged between the 2012 and 2014 cohorts, showing that in general, both the sample characteristics and parents' responses were consistent across the two cohorts.
7.5.1 Child wellbeing overall
Overall, the picture of child wellbeing after parental separation was fairly positive, with the vast majority of parents rating their child's physical health as very good or excellent and being satisfied with their child's overall wellbeing. Gender differences in parents' perceptions of child wellbeing emerged, with mothers in both cohorts tending to respond more positively than fathers with regard to their child's wellbeing. Age differences also occurred, with parents of younger children in both cohorts tending to rate their child's wellbeing more positively than parents of older children.
7.5.2 Child exposure to family violence
Child wellbeing was noticeably less favourable where family violence had occurred, especially where the child had been exposed to the violence. Moreover, the timing of the family violence also influenced parents' perception of their child's wellbeing, with children who had been exposed to family violence since the separation reported to be faring less well overall than those who had either been exposed to family violence before/during separation only or not at all.
7.5.3 Parent wellbeing overall
Parents' satisfaction with various aspects of their life remained essentially unchanged between 2012 and 2014, though with each cohort, gendered patterns emerged across the different areas. In both 2012 and 2014, the majority of all parents reported high satisfaction with their health (65% both cohorts), the home in which they lived (58-59%) the relationship with their child (78-79%), and how safe they felt (77-78%). Only one in four parents reported high satisfaction with their financial situation in either cohort, with around one in three reporting dissatisfaction (higher among fathers than mothers).
Mothers in both cohorts were significantly more likely than fathers to report high satisfaction with their life as a whole (mothers: 52-53% cf. fathers: 37%), the relationship with their child (mothers: 89-90% cf. fathers: 66-68%), the home in which they lived (mothers: 64% cf. fathers: 53%) and their health (mothers: 67% cf. fathers: 64%). Fathers in both cohorts, on the other hand, were significantly more likely than mothers to report high satisfaction with how safe they felt (mothers: 74-75% cf. fathers: 80-81%).
7.5.4 Parent wellbeing in the context of family violence
Parents' satisfaction with both their life as a whole and their parent-child relationship showed lower levels of satisfaction in both of these areas where family violence had occurred, though there was little difference in satisfaction between those experiencing either physical violence or emotional abuse alone.
Significant differences emerged between mothers and fathers for both satisfaction with the parent-child relationship and their life as a whole, with fathers reporting lower levels of satisfaction than mothers in both areas.
Examination of parents' feelings of personal safety in the context of family violence that caused the responding parent to feel fearful, coerced or controlled showed that if each of these experiences occurred before/during and since the separation, parents reported lower levels of satisfaction with their safety, than parents who did not experience them. Further, among parents who experienced persistent fear, coercion and/or control from the other parent, mothers reported significantly lower levels of satisfaction with their safety than fathers. Similarly, among parents who experienced fear, coercion and control, either before/during or since separation, mothers reported significantly lower levels of satisfaction with their safety than fathers.
11 Note that at least 10 items must be answered to enable this score to be generated, with a 0, 1 or 2 attributed for each item completed, depending on the participating parent's response (De Maio et al., 2013, p. 83).
12 The "eye of the beholder effect" refers to the potential influence of the reporter's knowledge of the family violence on their assessment of their child's wellbeing.
13 Due to constraints regarding budget and interview length, not all qualifying participants could be asked this question. In 2014, every 10th responding parent who qualified (i.e., whose child had witnessed family violence either before/during or since separation) was asked this question. From the sample of 2,905 participants whose child had witnessed family violence, 2,010 reported that this had affected them, and a subsequent 182 provided more detailed responses. In 2012, the approach was slightly different: prior to data collection, a proportion of the sample was randomly pre-allocated to be asked this question if they reported during the interview that their children had witnessed family violence. From the sample of 2,872 participants whose children had witnessed violence, 900 were subsequently asked the question.
This chapter presents experiences of child support reported by parents participating in the SRSP 2012 and 2014. It discusses parents' reports of child support liability, methods of payment and compliance, and their perceptions of the fairness of the child support assessment. In this discussion, the term "payers" refers to parents who reported that they were assessed by Child Support as being liable to pay child support to the focus parent, and "payees" refers to parents who reported that they were assessed as having to receive child support from the focus parent.
In the period covered by the two SRSP surveys, DHS implemented initiatives intended to improve the identification of and responses to client experiences of family violence. In 2011, it implemented family violence risk and identification and referral processes for new applicants, supported by training and the development of a risk assessment guide for frontline staff. In August 2013, DHS adopted a department-wide family violence strategy as part of the Commonwealth's actions the National Plan to Reduce Violence Against Women and their Children.11 The definition employed in this strategy is based on the definition in FLA s 4AB. In a number of areas highlighted in the forthcoming discussion (such as child support transfer methods), there are statistically significant shifts among parents who reported a history of family violence in the survey.
This chapter starts with an examination of parents' reports of child support liability, followed by patterns in methods of transfer (i.e., through DHS-Child Support or direct transfer from payer or payee). This is followed by an analysis of parents' reports of whether child support obligations are complied with (both in terms of transfers and timing). The chapter concludes with a discussion of perceptions of fairness in relation to child support.
8.1 Child support liability
Parents in the SRSP 2012 and 2014 were asked whether, at the time of the survey, they were supposed to pay or receive child support. Figure 8.1 shows that in both cohorts, the vast majority of fathers reported that they were liable to pay child support to the focus parent (2012: 81%; 2014: 82%), and the vast majority of mothers reported that they were to receive child support (2012: 85%; 2014: 86%). These gendered differences were statistically significant in both cohorts. There were no significant changes that occurred in parents' liability to pay or receive child support between the two cohorts.
Figure 8.1: Liability to pay or receive child support, by parent gender, 2012 and 2014
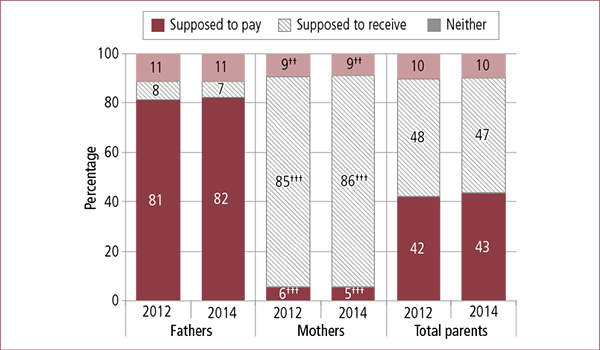
Notes: Data have been weighted. The "don't know" and "refused" responses, as well as responses of "both pay and receive" were excluded from this analysis (less than 1.5% combined total in each cohort). Differences between 2012 and 2014 within a given population were not statistically significant. Statistically significant differences between fathers and mothers within each cohort are noted: † p < .05; †† p < .01; ††† p < .001.
Figure 8.2 examines parents' child support liability by three broad categories of care-time arrangements of the child. For simplicity, we have used the same classification as was used in the SRSP 2012; that is, "resident" fathers and mothers, where the child spends 66-100% of nights with this parent; "shared care", where there the child spends 35-65% of nights with each parent; and "non-resident" fathers and mothers, where the child spends fewer than 35% of nights with this parent. The breakdown of data based on care-time arrangements in the figure reflects the gendered pattern in the distribution of child support liability described in Figure 8.1, with fathers representing the greater proportion of payers in each care-time category, and mothers reflecting the greater proportion of payees in each of these categories. Figure 8.2 does, however, show a statistically significant decrease in the number of fathers in shared care-time arrangements who are liable to pay child support (2012: 77% cf. 2014: 72%).
Figure 8.2: Liability to pay or receive child support for children, by parents' caring status and gender, 2012 and 2014
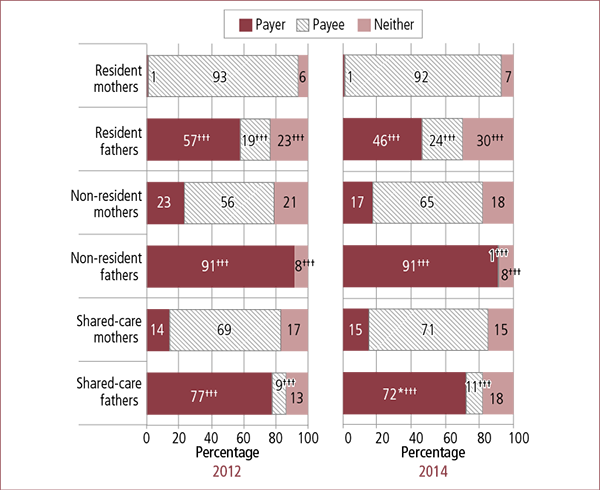
Notes: Data have been weighted. The "don't know" and "refused" responses were excluded from this analysis (less than 1%). Percentages may not total exactly to 100.0% due to rounding. Statistically significant differences between 2012 and 2014 within a given population are noted: * p < .05; ** p < .01; *** p < .001. Statistically significant differences between fathers and mothers within each cohort are noted: † p < .05; †† p < .01; ††† p < .001.
8.2 Method of payment transfer
In each cohort, parents who reported paying or receiving child support were asked about how these payments were supposed to be made. Figure 8.3 shows that, overall, there appears to have been an increase in the number of parents transferring their payments via DHS-Child Support rather than direct payments between parents, with a statistically significant decline in the reported use of direct payments when comparing fathers' reports in each cohort. Differences that emerged when comparing mothers' and fathers' reports on the method of transfer were reflected similarly in each cohort.
Figure 8.3: Method of transfer of child support payment, by parent gender, 2012 and 2014
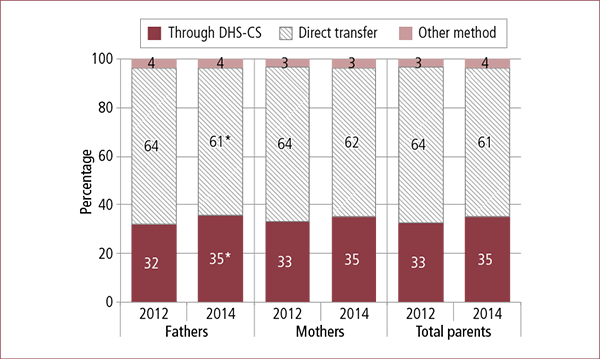
Notes: Data have been weighted. The "don't know" and "refused" responses were excluded from this analysis (less than 1%). Percentages may not total exactly to 100.0% due to rounding. Statistically significant differences between 2012 and 2014 within a given population are noted: * p < .05; ** p < .01; *** p < .001. Differences between fathers and mothers within each cohort were not statistically significant.
Methods of transfer of child support payments were also examined by parents' reported experiences of family violence before/during separation (Figure 8.4) and since separation (Figure 8.5). These data indicate parents who reported experiencing physical violence or emotional abuse alone at any time reported that their child support payments were transferred through DHS-Child Support in higher proportions than those who reported that they had not experienced family violence. Nevertheless, substantial proportions of parents who reported experiencing physical or emotional abuse alone either before/during or since separation also reported using direct payment as their transfer method (Figure 8.4 and 8.5).
Figure 8.4 shows that among parents who reported experiencing physical violence before/during separation, as well as those who reported that they had not experienced family violence, there had been a statistically significant increase in use of DHS-Child Support as a transfer method between cohorts (physical violence - 2012: 47%; 2014: 52%), in preference to direct transfers between parents (physical violence - 2012: 50%; 2014: 45%). These shifts were primarily related to statistically significant changes in mothers' reported use of these transfer methods, with 51% of mothers in the 2014 cohort who indicated that they had experienced physical violence before/during separation reporting that they used DHS-Child Support (cf. 2012: 47%), and 46% reporting that they used direct transfers (cf. 2012: 51%). Of those mothers in the 2014 cohort who reported that they had not experienced family violence, 21% reported using DHS-Child Support (cf. 2012: 16%), and 75% reported that they used direct transfers (cf. 2012: 80%). While changes in fathers' reports of using this transfer method did not reach levels of statistical significance, they nevertheless reflected a similar response pattern on these items.
In contrast, Figure 8.4 indicates that where mothers in the 2014 cohort reported experiencing emotional abuse alone before/during separation, they reported significantly lower rates of using DHS-Child Support compared to fathers (mothers: 33% cf. fathers: 41%) and higher rates of direct transfer (mothers: 63% cf. fathers: 56%).
Figure 8.4: Method of transfer of child support payment, by experiences of family violence before/during separation and parent gender, 2012 and 2014

Notes: Data have been weighted. The "don't know" and "refused" responses were excluded from this analysis (less than 1%). Percentages may not total exactly to 100.0% due to rounding. Sample populations: Physical violence: fathers - 2012: n = 473, 2014: n = 490; mothers - 2012: n = 947, 2014: n = 948. Emotional abuse alone: fathers - 2012: n = 1,048, 2014: n = 1,028; mothers - 2012: n = 1,113, 2014: n = 1,098. No family violence: fathers - 2012: n = 964, 2014: n = 966; mothers - 2012: n = 835, 2014: n = 883. Statistically significant differences between 2012 and 2014 within a given population are noted: * p < .05; ** p < .01; *** p < .001. Statistically significant differences between fathers and mothers within each cohort are noted: † p < .05; †† p < .01; ††† p < .001.
Figure 8.5 shows that where parents in the 2014 cohort had not experienced family violence since separation, statistically significant increases were observed in both mothers' and fathers' reports of their use of DHS-Child Support as their transfer method for child support when compared with the 2012 cohort, and a corresponding decrease in their reports of direct transfers. Among parents who experienced physical violence since separation, a reduced proportion of parents in the 2014 cohort reported using DHS-Child Support as their transfer method when compared with the 2012 cohort. This shift primarily related to there being a trend towards fewer fathers in the 2014 cohort reporting that they used this transfer method (however, these differences were not statistically significant). In the 2014 cohort there was a statistically significant increase in the proportion of parents who used DHS-Child Support as their transfer method where they had experienced emotional abuse alone since separation. There were a significantly higher proportion of fathers, but not mothers reporting this (fathers: 2012: 41% cf. 2014: 46%).
Figure 8.5: Method of transfer of child support payment, by experiences of family violence since separation and parent gender, 2012 and 2014
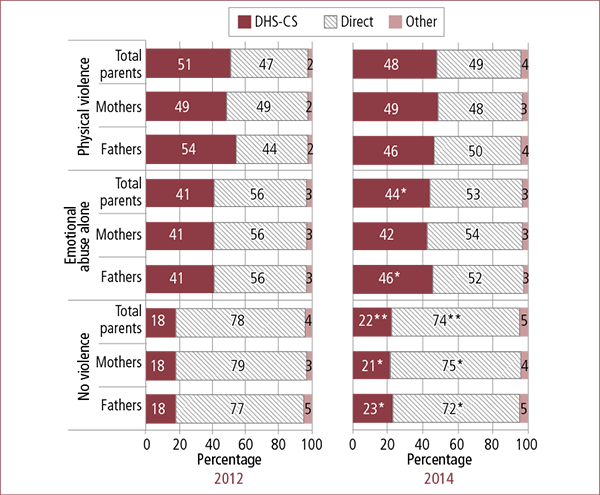
Notes: Data have been weighted. The "don't know" and "refused" responses were excluded from this analysis (less than 1%). Percentages may not total exactly to 100.0% due to rounding. Statistically significant differences between 2012 and 2014 within a given population are noted: * p < .05; ** p < .01; *** p < .001. Differences between fathers and mothers within each violence type and cohort were not statistically significant.
8.3 Child support compliance
The discussion in this section considers participating parents' reports about compliance with the child support assessment relating to their children. The discussion begins with an analysis of reports from both payer and payee parents of the level of compliance with the assessed amount. This is followed by an analysis of both the amount of child support received and the timeliness of the payment.12
8.3.1 Compliance with assessed amount of child support
Table 8.1 shows that, overall, a majority of parents in each cohort (2012: 65%; 2014: 69%) reported that they paid or received the full amount of child support as per the assessment. Child support payments in excess of the amount assessed were also reported by comparable proportions of parents in each cohort (2012: 19%; 2014: 18%). Reported compliance with the amount of child support was higher among parents who were supposed to pay child support (2012 and 2014: 95%) than those who were supposed to receive it (2012: 73%; 2014: 77%), though there was a statistically significant increase in payees in the 2014 cohort reporting compliance in full with the assessed amount, and a corresponding decrease in those reporting that less than the assessed amount had been paid or received.
| 2012 | 2014 | |||||
|---|---|---|---|---|---|---|
| Payers (%) | Payees (%) | Total parents (%) | Payers (%) | Payees (%) | Total parents (%) | |
| Notes: Data have been weighted. The "don't know" and "refused" responses were excluded from this analysis (less than 1%). Percentages may not total exactly to 100.0% due to rounding. Statistically significant differences between 2012 and 2014 within a given population are noted: * p < .05; ** p < .01; *** p < .001. | ||||||
| Full assessed amount | 72.3 | 57.9 | 65.0 | 73.4 | 63.7 *** | 68.5 |
| More than assessed amount | 22.5 | 14.6 | 18.5 | 21.5 | 13.5 | 17.5 |
| $1-20 more paid/received | 7.5 | 7.6 | 7.5 | 6.7 | 6.0* | 6.3 |
| $21-99 more paid/received | 9.2 | 4.9 | 7.0 | 8.9 | 5.1 | 7.0 |
| $100+ more paid/received | 5.8 | 2.1 | 4.0 | 6.0 | 2.4 | 4.2 |
| Less than assessed amount | 5.2 | 27.6 | 16.5 | 5.0 | 22.8 *** | 14.0 |
| $1-20 less paid/received | 1.3 | 9.9 | 5.6 | 1.4 | 8.0 * | 4.7 |
| $21-99 less paid/received | 2.7 | 11.3 | 7.0 | 2.2 | 9.0 * | 5.6 |
| $100+ less paid/received | 1.2 | 6.4 | 3.8 | 1.5 | 5.8 | 3.6 |
| No. of observations | 2,076 | 2,360 | 4,436 | 2,110 | 2,425 | 4,535 |
Figure 8.6 shows that in both the 2012 and 2014 cohorts, reports of transfers of less than the assessed amount were fewer among both mothers and fathers who paid child support than among mothers and fathers who received child support, particularly fathers. For example, 5% of father payers in both cohorts reported that they paid less than the assessed amount, while 39% of father payees in the 2012 cohort and 33% in the 2014 cohort reported that they received less than the assessed amount.
Figure 8.6: Reported compliance with assessed amount of child support, by liability status and parent gender, 2012 and 2014
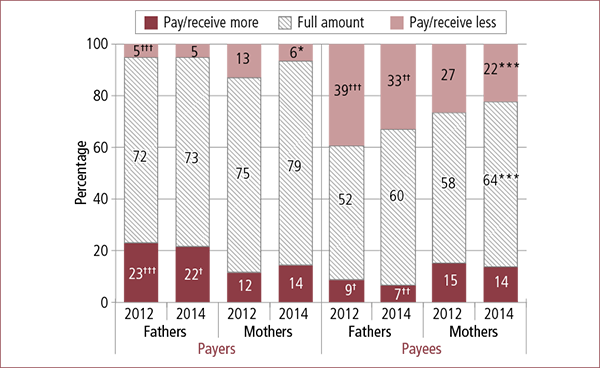
Notes: Data have been weighted. The "don't know" and "refused" responses were excluded from this analysis (less than 1%). Percentages may not total exactly to 100.0% due to rounding. Statistically significant differences between 2012 and 2014 within a given population are noted: * p < .05; ** p < .01; *** p < .001. Statistically significant differences between fathers and mothers within each liability group and cohort are noted: † p < .05; †† p < .01; ††† p < .001.
Figure 8.6 also shows that among parents who received child support, a higher proportion of fathers than mothers reported that they received less than the assessed amount in both cohorts, with these differences between mothers and fathers reaching a level of statistical significance. A statistically significant difference also emerged between mother payers in each cohort and between mother payees in each cohort, with 6% of mothers payers in the 2014 cohort reporting paying lower than the assessed payment (cf. 2012: 13%), and 22% of mother payees in the 2014 cohort reporting receiving lower than the assessed payment (cf. 2012: 27%).
Reports of payer and payee parents regarding compliance with the assessed amount of child support were also analysed by experience of family violence. Figures 8.7 and 8.8 show some variation from the pattern of compliance described above, with a higher proportion of payee parents who had reported experiencing family violence before/during or since separation reporting that the amount that they received was less than the assessed amount when compared with parents who reported that they had not experienced family violence.
Figure 8.7 shows that 30-34% of payees who reported experiencing physical violence before/during separation and 22-29% of payees who reported experiencing emotional abuse alone before/during separation, also reported receiving less than the assessed amount of child support, as compared to 16-18% of parents who indicated that they had not experienced any family violence. Notably, Figure 8.7 also shows that for payee parents who reported experiencing emotional abuse alone, there was a statistically significant decrease between cohorts in payees' reports of underpayments of child support (2012: 29% cf. 2014: 22%), and a corresponding increase in reports of payments in full (2012: 56% cf. 2014: 65%), together with a statistically significant increase between the two cohorts in reports of payments in full by payee parents who reported physical violence before/during separation.
Figure 8.7: Reported compliance with assessed amount of child support, by experiences of family violence before/during separation and liability status, 2012 and 2014
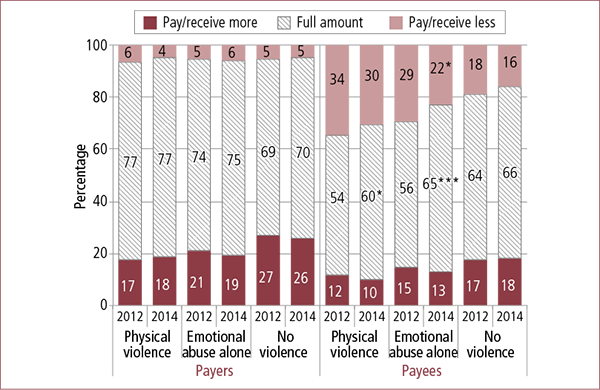
Notes: Data have been weighted. The "don't know" and "refused" responses were excluded from this analysis (less than 1%). Percentages may not total exactly to 100.0% due to rounding. Statistically significant differences between 2012 and 2014 within a given population are noted: * p < .05; ** p < .01; *** p < .001.
Consistent with the before/during separation time period, Figure 8.8 shows that a greater proportion of payee parents than payers reporting physical violence (37% in both cohorts) and emotional abuse alone (26-31%) also reported receiving less than the assessed amount of child support. In addition, statistically significant decreases between cohorts in reports of receiving less were identified in relation to payee parents who reported experiencing emotional abuse alone (2012: 31% cf. 2014: 26%) and no violence (2012: 20% cf. 2014: 15%).
Figure 8.8: Reported compliance with assessed amount of child support, by experiences of family violence since separation and liability status, 2012 and 2014
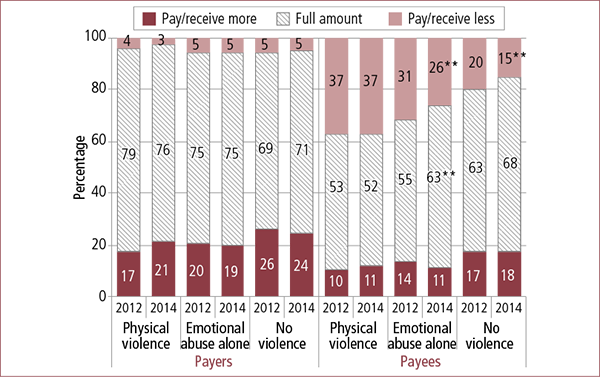
Notes: Data have been weighted. The "don't know" and "refused" responses were excluded from this analysis (less than 1%). Percentages may not total exactly to 100.0% due to rounding. Statistically significant differences between 2012 and 2014 within a given population are noted: * p < .05; ** p < .01; *** p < .001.
8.3.2 Compliance with amount and timeliness of child support
As noted in the De Maio et al. (2013, p. 111), examining the timeliness of child support payments together with compliance with the payment of the assessed amount facilitates understanding of parents' behaviours in relation to child support liability. Compliance by timeliness is only shown for parents who received child support for the reason described at the outset of this section (see footnote 13).
Figure 8.9 indicates that while there was no change between cohorts in reported rates of full compliance (in relation to both the amount and timeliness of the child support payment), there have been statistically significant increases in mothers' reports of payers' compliance with the amount of child support, and decreases in reports of payers' compliance in relation to the timing of payments or failure to comply with either requirement. Statistically significant differences also emerged between mothers' and fathers' reports of payers' failure to comply with both assessed amount and timing of the payment, with 39% and 30% of fathers and 20% and 18% of mothers in the 2012 and 2014 cohorts respectively reporting a lack of compliance with both the amount and timeliness by the payer.
Figure 8.9: Reported compliance with amount and timeliness of payments made to parents who receive child support, by parent gender, 2012 and 2014
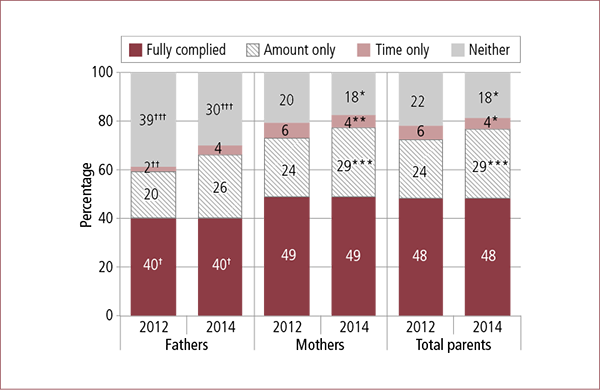
Notes: Data have been weighted. The "don't know" and "refused" responses were excluded from this analysis (less than 1%). Percentages may not total exactly to 100.0% due to rounding. Statistically significant differences between 2012 and 2014 within a given population are noted: * p < .05; ** p < .01; *** p < .001. Statistically significant differences between fathers and mothers within each cohort are noted: † p < .05; †† p < .01; ††† p < .001.
Figures 8.10 and 8.11 indicate that payee parents who reported experiencing family violence either before/during or since separation also reported lower proportions of full compliance with the child support assessment by the payer parent.
Interestingly, Figure 8.10 shows that where parents indicated that they had experienced family violence before/during separation, reports of full compliance remained either stable (physical violence) or increased (emotional abuse alone) between the 2012 and 2014 cohorts, while reports of full compliance by parents who indicated that they had not experienced family violence decreased between the cohorts. Statistically significant increases were identified in relation to compliance with the child support amount but not timing by parents in the 2014 cohort who had reported experiencing emotional abuse alone or no violence. The proportion of parents experiencing emotional abuse who reported compliance with nether amount or timeliness decreased to a statistically significant extent.
Figure 8.10: Reported compliance with amount and timeliness of payments made to parents who receive child support, by experiences of family violence before/during separation, 2012 and 2014
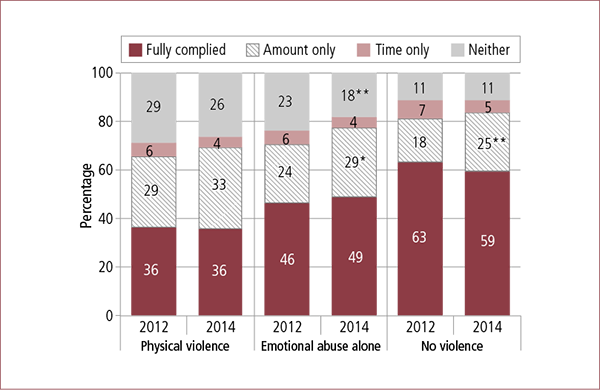
Notes: Data have been weighted. The "don't know" and "refused" responses were excluded from this analysis (less than 1%). Percentages may not total exactly to 100.0% due to rounding. Statistically significant differences between 2012 and 2014 within a given population are noted: * p < .05; ** p < .01; *** p < .001.
Figure 8.11 shows that where parents indicated that they had experienced emotional abuse alone or no violence since separation, reports of full compliance remained stable, while reports of full compliance by parents who indicated that they had experienced physical violence decreased between the 2012 and 2014 cohorts. Statistically significant increases were, however, again identified in relation to compliance with the child support amount but not timing by parents in the 2014 cohort who had reported experiencing emotional abuse alone or no violence. The proportion of parents experiencing emotional abuse who reported compliance with neither amount nor timeliness also decreased to a statistically significant extent.
Figure 8.11: Compliance with amount and timeliness of payments made to parents who receive child support, by experiences of family violence since separation, 2012 and 2014
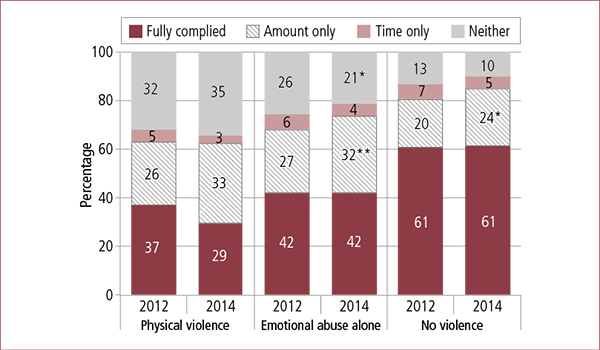
Notes: Data have been weighted. The "don't know" and "refused" responses were excluded from this analysis (less than 1%). Percentages may not total exactly to 100.0% due to rounding. Statistically significant differences between 2012 and 2014 within a given population are noted: * p < .05; ** p < .01; *** p < .001.
8.4 Perceived fairness of child support assessment
This section examines parents' perceived sense of fairness for themselves regarding the amount of the child support assessment. Figure 8.12 indicates that for both cohorts, parents' perceived fairness on this issue varied when analysed by mothers' and fathers' liability status. While 61% of father payers in the 2014 cohort reported that their child support assessment was "very fair" (26%) or "somewhat fair" (35%), 52% of father payees in this cohort described their child support assessment as "very fair" (14%) or somewhat fair (38%). A higher proportion of father payees (48%) reported that their child support assessment was "very unfair" or "somewhat unfair" when compared with father payers (38%). There was a statistically significant increase in father payers' negative responses in the 2014 cohort, with 21% (cf. 2012: 17%) reporting that their child support assessment was "very unfair", and a statistically significant decrease in the proportion of fathers payers describing their assessment as "somewhat unfair" (35%; cf. 2012: 39%).
Figure 8.12 shows that mother payees' positive perceptions (2012: 54%; 2014: 55%) and negative perceptions (2012: 46%; 2014: 45%) were relatively consistent between cohorts. Mother payees reported in greater proportions than mother payers that their child support assessments were "somewhat fair", to a statistically significant extent in both cohorts. In the 2014 cohort, mother payees' descriptions of their child support assessments as "very fair" were significantly lower than mother payers. Interestingly, a statistically significant increase in mother payers' reports of their child support assessment as "very fair" emerged when comparing the 2012 and 2014 cohorts.
Figure 8.12: Perceived fairness of child support assessment for self, by liability status and parent gender, 2012 and 2014
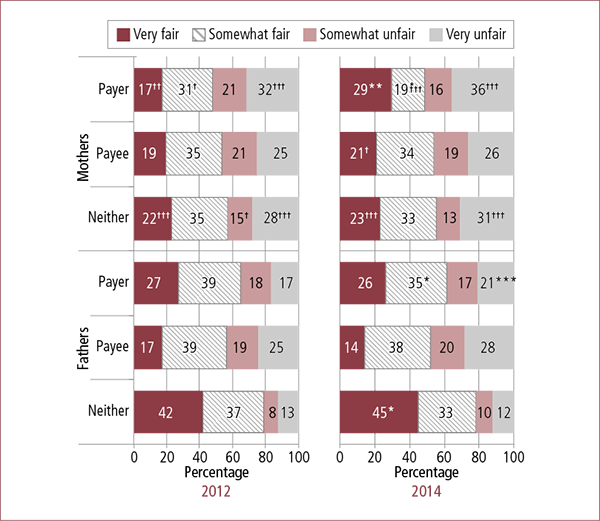
Notes: Data have been weighted. The "don't know" and "refused" responses were excluded from this analysis (5%). Percentages may not total exactly to 100.0% due to rounding. Statistically significant differences between 2012 and 2014 within a given population are noted: * p < .05; ** p < .01; *** p < .001. Statistically significant differences between fathers and mothers within each cohort are noted: † p < .05; †† p < .01; ††† p < .001.
Figures 8.13 and 8.14 present parents' reports of their perceptions of the fairness of their child support assessment in the context of their reported experiences of family violence before/during and since separation.
Figure 8.13 shows that parents' perceptions of the fairness of their assessment were largely consistent between cohorts with respect to the before/during separation period, save for payer fathers in the 2014 cohort who reported experiencing physical violence or emotional abuse alone, with statistically significant increases in their description of their child support assessments as being "very unfair". Overall, in both cohorts, parents who reported no violence described their child support assessments as "very fair" or "somewhat fair" in greater proportions than those who had experienced emotional abuse alone (29-34% cf. 17-21% respectively), with payee parents who reported physical violence being the least likely to describe their child support assessment in these positive terms (12%).
Figure 8.13: Perceived fairness of child support assessment for self, by experiences of family violence before/during separation and liability status, 2012 and 2014
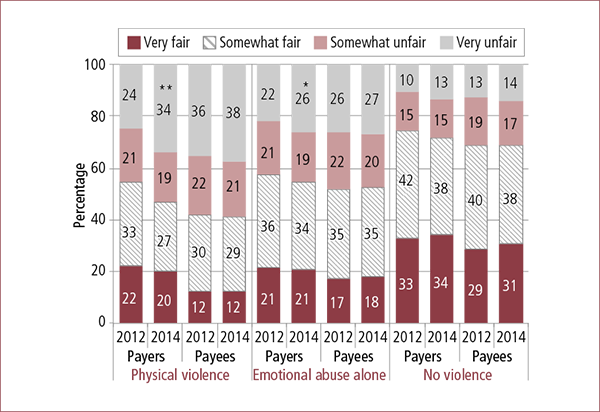
Notes: Data have been weighted. The "don't know" and "refused" responses were excluded from this analysis (5%). Percentages may not total exactly to 100.0% due to rounding. Statistically significant differences between 2012 and 2014 within a given population are noted: * p < .05; ** p < .01; *** p < .001.
While a similar overall response pattern was identified in relation to reports of family violence since separation, Figure 8.14 shows greater differentiation between parents in the 2012 and 2014 cohorts regarding their perceptions of the fairness of their assessment. Notably, payees in the 2014 cohort described their child support assessments as "very fair" or "somewhat fair" in lower proportions where they experienced physical violence (2012: 42% cf. 2014: 40%) as did payers reporting emotional abuse alone (2012: 56% cf. 2014: 53%). However, the only decrease of statistical significance were payers who reported no violence and described their assessment as "somewhat fair" (2012: 43% cf. 2014: 36%). A statistically significant increase in payers' description of their child support assessments as being "very unfair" was also identified where those parents reported experiencing emotional abuse alone (2012: 24% cf. 2014: 29%).
Figure 8.14: Perceived fairness of child support assessment for self, by experiences of family violence since separation and liability status, 2012 and 2014
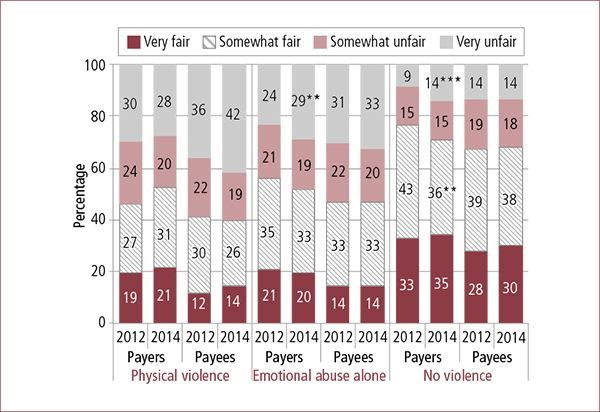
Notes: Data have been weighted. The "don't know" and "refused" responses were excluded from this analysis (5%). Percentages may not total exactly to 100.0% due to rounding. Statistically significant differences between 2012 and 2014 within a given population are noted: * p < .05; ** p < .01; *** p < .001.
Figure 8.15 depicts parents' descriptions of the fairness of their child support assessment, by reference to their parenting arrangements. Figure 8.15 shows that in the 2014 cohort, mothers and fathers in shared care-time arrangements who received child support payments (64-68%) and mothers and fathers who were non-regular carers (64-65%) were most positive in their perceptions of their child support assessment. Mothers with shared care-time arrangements who paid child support were least positive in their response on this question (27%). This response pattern reflects that identified in relation to the 2012 cohort.
Figure 8.15: Perceived fairness of child support for self, by liability status and parenting arrangements
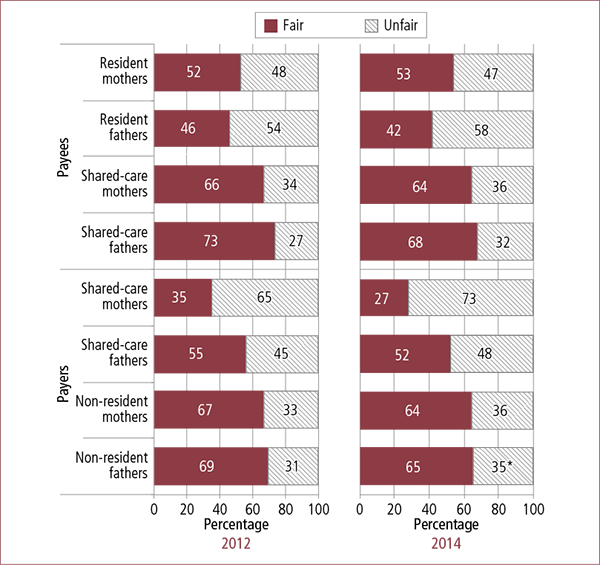
Notes: Data have been weighted. The "don't know" and "refused" responses were excluded from this analysis (less than 2%). Percentages may not total exactly to 100.0% due to rounding. Statistically significant differences between 2012 and 2014 within a given population are noted: * p < .05; ** p < .01; *** p < .001. Note that the categories of "very fair" and "somewhat fair" are collapsed together and the categories of "very unfair" and "somewhat unfair" are collapsed together.
More specifically, Figure 8.16 shows that in both the 2012 and 2014 cohorts, father payers with daytime-only parenting arrangements were most positive in their reflections on the fairness of their child support assessment (2012: 71%; 2014: 68%), and payee mothers where fathers spent no time with their children were least positive on this question (2012: 36%; 2014: 40%).
Figure 8.16: Perceived fairness of child support for self, by liability status and care-time arrangements, 2014

Notes: Data have been weighted. The "don't know" and "refused" responses were excluded from this analysis (less than 2%). Percentages may not total exactly to 100.0% due to rounding. Statistically significant differences between 2012 and 2014 were not found.
8.5 Summary
8.5.1 Child support liability
In both cohorts, the vast majority of responding fathers reported that they were liable to pay child support (2012: 81%; 2014: 82%), and the vast majority of mothers reported that they were to receive child support (2012: 85%; 2014: 86%). These gendered differences were statistically significant in both cohorts and there were no significant changes that occurred in relation to parents' reports of liability to pay or receive child support between the two cohorts.
This gendered pattern was also reflected in the breakdown of data based on care-time arrangement, with fathers representing the greater proportion of payers in each care-time category and mothers reflecting the greater proportion of payees in each of these categories. There was, however, a statistically significant decrease in the number of fathers in shared care-time arrangements reporting that they were liable to pay child support (2012: 77% cf. 2014: 72%)
8.5.2 Method of payment transfer
Overall, there appeared to be an increase in parents transferring their payments via DHS-Child Support instead of direct payments between parents. There was a statistically significant decline in the reported use of direct payments when comparing fathers' reports in each cohort. Differences between mothers' and fathers' reports on the method of transfer followed a similar pattern in each cohort.
Comparisons of methods of transfer for child support payments in the context of reported experiences of family violence before/during separation and since separation indicated that parents who reported experiencing physical violence or emotional abuse alone at any time, also reported that their child support payments were transferred through DHS-Child Support in higher proportions than those parents who reported that they had not experienced family violence.
Among parents who reported experiencing physical violence before/during separation, as well as those who reported that they had not experienced family violence during this time period, there was a statistically significant increase from 2012 to 2014 of 5 percentage points in the use of DHS-Child Support as a transfer method, and a corresponding drop in direct transfers between parents. These shifts primarily related to statistically significant changes in mothers' reported use of these transfer methods, with consistent changes in fathers' reports of using of DHS-Child Support as a transfer method not reaching levels of statistical significance. However, where mothers in the 2014 cohort reported experiencing emotional abuse alone before/during separation, they reported significantly lower rates of using DHS-Child Support as compared to fathers (mothers: 33% cf. fathers: 41%) and higher rates of direct transfer (mothers: 63% cf. fathers: 56%).
Data relating to reports of transfer method in the context of family violence since separation, also shows that where parents in the 2014 cohort had not experienced family violence since separation, statistically significant increases were observed in their reported use of DHS-Child Support as their transfer method for child support, and a corresponding decrease in their reports of direct transfers. In contrast to the before/during separation period, a reduced proportion of parents in the 2014 cohort who reported experiencing physical violence since separation also reported using DHS-Child Support as their transfer method, and there was a statistically significant increase in reports in the 2014 cohort of using DHS-Child Support as their transfer method where they had experienced emotional abuse alone since separation
While acknowledging the overall shifts towards using DHS-Child Support as a transfer method, substantial proportions of parents who reported experiencing physical violence or emotional abuse alone either before/during or since separation continued to report using direct payment as their transfer method.
8.5.3 Child support compliance
Overall, the majority of parents in each cohort (2012: 65%; 2014: 69%) reported that they paid or received the full amount of child support as per the assessment, and a further 18-20% of parents in each cohort reported that they paid in excess of the amount assessed. Reported compliance with the amount of child support was higher among parents who were supposed to pay child support (2012 and 2014: 95%) than those who were supposed to receive it (2012: 73%; 2014: 77%), though there was a statistically significant increase in payees in the 2014 cohort reporting compliance in full with the assessed amount, and a corresponding decrease in those reporting that less than the assessed amount had been paid or received. Among parents who received child support, a higher proportion of fathers than mothers reported that they received less than the assessed amount in both cohorts, with these differences between mothers and fathers reaching a level of statistical significance. There was some variation from the general pattern of compliance, with a higher proportion of payee parents who had reported experiencing physical violence or emotional abuse alone before/during separation (30-34% and 22-29% respectively) or since separation (37% and 26-31% respectively) reporting that the amount that they received was less than the assessed amount when compared with parents who reported that they had not experienced family violence. However, compared to 2012, there was a statistically significant decrease in payees in the 2014 cohort reporting underpayments of child support where they also reported experiencing emotional abuse alone either before/during or since separation.
While there was no change between cohorts in reported rates of full compliance (in relation to both the amount and timeliness of the child support payment), there were statistically significant decreases in mothers' reports of compliance in relation to the timing of payments. Statistically significant differences also emerged between mothers' and fathers' reports of payers' failure to comply with both assessed amount and timing of the payment, with 39% and 30% of fathers and 20% and 18% of mothers in the 2012 and 2014 cohorts respectively reporting a lack of compliance with both the amount and timeliness by the focus parent.
The data also indicate that overall, parents who reported experiencing family violence either before/during or since separation also reported lower proportions of full compliance with the child support assessment by the payer. Interestingly, where parents indicated that they had experienced family violence before/during separation, reports of full compliance remained either stable (physical violence) or increased (emotional abuse alone), though where parents indicated that they had experienced physical violence since separation, reports of full compliance decreased between the 2012 and 2014 cohorts.
8.5.4 Perceived fairness of child support
Parents' reports of their sense of fairness about the amount of their child support assessment varied when analysed by mothers' and fathers' liability status. A higher proportion of father payees (48%) reported that their child support assessment was "very unfair" or "somewhat unfair" when compared with father payers (38%), and there was a statistically significant increase in father payers' negative responses in the 2014 cohort. In this cohort, mother payees' descriptions of their child support assessments as being "very fair" were significantly lower than mother payers, and interestingly, there was a statistically significant increase in mother payers' reports of their child support assessment as being "very fair" between the 2012 and 2014 cohorts.
Data collected from parents in both cohorts who reported experiencing family violence before/during separation show that, overall, parents who reported no violence described their child support assessments as "very fair" or "somewhat fair" in greater proportions than those who had experienced emotional abuse alone (29-34% cf. 17-21% respectively), with payee parents reporting physical violence being the least likely to describe their child support assessment in these positive terms (12%). While a similar overall response pattern was identified in relation to reports of family violence since separation, there was greater differentiation between parents in the 2012 and 2014 cohorts regarding their perceptions of the fairness of their assessment. Nevertheless, the only decrease of statistical significance related to payers who reported no violence since separation and described their assessment as "somewhat fair" (2012: 43% cf. 2014: 36%). A statistically significant increase in payers' description of their child support assessments as being "very unfair" was also identified where those parents reported experiencing emotional abuse since separation (2012: 24% cf. 2014: 29%).
Descriptions of fairness of payments by reference to parenting arrangements indicated that in both cohorts, mothers and fathers in shared care-time arrangements who received child support payments and mothers and fathers who were non-regular carers were the most positive in their perceptions of their child support assessment, while mothers with shared care-time arrangements who paid child support were least positive in their response on this question.
11 See Family and Domestic Violence Strategy: <www.humanservices.gov.au/corporate/publications-and-resources/family-and-domestic-violence-strategy>.
12 Note that compliance by timeliness (section 8.3.2) is only shown for parents who received child support. This is because a programming error during the data collection for SRSP 2012 resulted in a substantial proportion of participants not being asked questions about the amount paid/received or the timeliness of child support payments. Call backs were undertaken during the SRSP 2012 to rectify this, but the number of parents who paid child support but who missed the question on timeliness was too substantial for them to be included in the analysis.
The findings in this report are based on the comparison of data from two cross-sectional surveys examining the experiences of separated parents before (SRSP 2012, n = 6,119) and after the 2012 family violence amendments (SRSP 2014, n = 6,079). This element of the research program for the Evaluation of the 2012 Family Violence Amendments is critical for assessing the effects of the reforms as it shows areas of both change and stability in the experience of separated families. In most areas, the findings of the two surveys show that the two samples have nearly identical features, highlighting what are emerging as stable features of each annual cohort of separated parents. These two surveys, along with the findings of LSSF Wave 1, provide three separate but comparable datasets that reveal largely consistent patterns in key areas: the experience of family violence and safety concerns, patterns in service use, and patterns in parenting arrangements.
The findings described in this report suggest some areas where there are statistically significant - though mostly subtle - shifts that are consistent with the objectives of the 2012 family violence reforms. In other areas, the findings suggest the reforms have had a limited or mixed effect. In considering these findings, it is important to appreciate that the 2012 family violence amendments had objectives that were focused on the needs of families affected by family violence and child safety concerns. Unlike the 2006 family law reforms, which were intended to change attitudes and culture in relation to post-separation parenting, the scope of change sought to be achieved by the changes subject to the present evaluation was relatively narrow: to support safer parenting arrangements for children in families where these issues are pertinent. Accordingly, the practices of professionals are the areas where active behavioural change is sought in order to support the aims of the reforms in working with parents to change outcomes for children. Change or lack of change in the experience of parents is likely to be a function of change or lack of change in professional practices. Understanding the interaction between parents affected by family violence and safety concerns and family law system services and professionals has therefore been a particular focus of this report, since this is a key way in which the effects of professional and systemic change can be assessed.
There is one aspect of the reforms that may have had some influence on parents who use services generally rather than just those affected by family violence and/or safety concerns: the addition to advisers' obligations that require them to advise parents that parenting arrangements should be in children's best interests (s 60D). This obligation sits alongside advisers' obligations to inform parents that they may consider arrangements involving equal or substantial and significant time (s 63DA), but the use of the term "paramount" in s 60D makes it clear that the best interests consideration is the most important one.
The Survey of Family Law Practices and Experiences examined professional approaches and experiences and the findings were described in the 2014 Responding to Family Violence report (Kaspiew et al., 2014). The Court Outcomes Project examines patterns in court orders (reached by consent, agreement after litigation has commenced, and judicial determination) and the findings are being presented in a separate report. The Evaluation of the 2012 Family Violence Amendments synthesis report will draw together the evidence from this element of the research program and the two other components (Survey of Family Law Practices and Experiences) and the Court Outcomes Project to address the research questions on the basis of multiple data sources that provide triangulation on key questions and support interpretation of the legislative and systemic factors that influence the patterns evident in the data presented in this report.
9.1 Characteristics of the 2012 and 2014 cohorts
The two SRSP cohorts were substantially the same in most areas related to family form and socio-economic characteristics. In both cohorts, the average age of parents was 36, the average age of children was 7 years and, on average, families had two children each. The mean period of separation for both cohorts was 17 months. Private rental was the most common form of accommodation. Fewer than one-third of parents were living in homes that they had bought or were buying. Substantial minorities reported mental ill health (39% in 2014) and a quarter indicated that problems with substance abuse were relevant in their situation.
The proportions of parents describing their relationships by selecting one of five descriptors were also consistent in the two cohorts. A majority of parents chose positive descriptors: "friendly" (three in ten) or "cooperative" (also three in ten). One in five parents indicated their relationship was "distant", and around 14% indicated their relationship involved "lots of conflict". The most negative descriptor, "fearful", was chosen by minorities of parents in both cohorts, with 6% of mothers in both cohorts and 3% (2012) and 4% (2014) of fathers nominating this response.
Most focus children in both cohorts were cared for in parenting arrangements where they spent the most time with their mother. However, there was a slight reduction in the prevalence of these arrangements in the 2014 cohort (2012: 50% cf. 2014: 46%). Shared care-time arrangements were reported for 20-21% of focus children in each cohort. Reports of the focus child spending 100% of nights in their mother's care increased to 28% in the 2014 cohort, from 25% in the 2012 cohort.
9.2 Family violence and safety concerns
The 2012 family violence amendments made changes to the definitions of family violence and child abuse. Although there is some controversy about the actual breadth of the change in the definition of family violence in FLA s 4AB, the new definition encompasses non-physical forms of abuse, including emotional and financial abuse. The primary statement in the definition reads: "'family violence' means violent, threatening or other behaviour by a person that coerces or controls a member of the person's family (the family member), or causes the family member to be fearful". In order to establish that the definition applies, the relevant behaviour must also be shown to have caused one of the three issues: fear, coercion or control. Accordingly, the SRSP 2012 and 2014 surveys had a significant focus on the experience of family violence, and the 2014 survey also examined the extent to which behaviours examined in the family violence measures were associated with fear, coercion and control.
The findings from the SRSP 2012 and 2014 indicate very similar - and in some areas near-identical - profiles in the experience of family violence and safety concerns in the two samples of separated parents. Across measures of the nature and frequency of emotional abuse and physical hurt and the presence of safety concerns as a result of ongoing contact with the other parent, the two samples have remarkably consistent features, with reports of most experiences differing only minimally in the two populations.
In relation to emotional abuse, the survey findings indicate that 57% of fathers and 67% of mothers reported experiencing at least one kind of emotional abuse before/during separation, and these experiences continue for 55% of fathers and 61% of mothers after separation. A small but statistically significant difference between the experiences of the two populations was a decrease reflected in the 2014 cohort's post-separation reports of the most commonly reported form of emotional abuse - insults with the intent to shame, belittle or humiliate. The proportions of fathers and mothers reporting this experience dropped by three percentage points: to 44% of fathers and 50% of mothers in 2014. Otherwise, the distributions of parents reporting the different types of emotional abuse in each time frame were similar.
Generally, a higher proportion of mothers reported experiencing the nominated emotional abuse items than did fathers, with particularly marked differences (of 10 percentage points or more) emerging in relation to mothers' and fathers' reports of attempts to force any unwanted sexual activity and of damaging or destroying property before/during separation.
Again, the experiences of physical hurt reported by the two cohorts were similar, with 16% of fathers and 23-24% of mothers reporting being hurt by the focus parent before/during separation. The experience reportedly diminished after separation, with 5% of fathers and 6% of mothers reporting that this happened post-separation.
In the context of a generally stable pattern in reports of experiences of the three types of family violence measured (emotional abuse, physical hurt and attempts to force unwanted sexual activity) in the two surveys, some areas of difference were evident between mothers and fathers. A higher proportion of mothers than fathers reported experiencing each type of violence measured, while a higher proportion of fathers reported that they had not experienced any of the three violent and abusive behaviours before/during separation in both cohorts (2012: 41% and 2014: 42%) compared with mothers' reported experiences (2012: 31% and 2014: 32%).
In general terms, the reported effects of family violence were similar in the two surveys in terms of the nature and number of these effects on parents' day-to-day activities. One area where the patterns changed was in relation to a statistically significant increase in reported mental health effects of family violence before/during separation (2012: 52% cf. 2014: 66%) and in the post-separation period (2012: 52% cf. 2014: 60%). The increase in the identification of this kind of effect is likely to be linked to the increased use of psychologists and psychiatrists reported by SRSP 2014 parents (see Chapter 5, Table 5.1). Variations were also identified in relation to the effects of violence on other day-to-day activities. While fathers indicated that they took time off work in greater proportions than mothers in both the 2012 cohort (fathers: 33% cf. mothers: 21%) and 2014 cohort (fathers: 30% cf. mothers: 18%), mothers reported most other nominated effects in greater proportions than fathers. These included changes to their mental health, eating and sleeping habits, and household tasks, and to feelings of lower confidence, insecurity and intimidation. Mothers also reported that they experienced two or more effects as a result of the focus parent's behaviour in greater proportions than fathers.
The analysis in Chapter 3 indicates that in the before/during separation period, participating mothers were more likely than fathers to report that behaviour on the part of the focus parent caused them to feel fearful, coerced or controlled, although these reports were more evenly dispersed between parents in relation to feelings of coercion and control. In the post-separation period, mothers were again more likely to report that they felt fearful, while fathers reported often feeling coerced or controlled in greater proportions than mothers.
Overall, feelings of fear, coercion and control were more commonly reported by parents who had experienced physical violence as opposed to emotional abuse, with this response pattern evident both before/during and since separation. There were statistically significant differences between the number of mothers and fathers who reported feeling fearful, coerced or controlled and experiencing family violence, with these gender differences emerging in the context of both cohorts. For example, mothers who reported experiencing either physical violence or emotional abuse reported feeling fearful in greater proportions than fathers both before/during separation and since separation. Of note, mothers' reports of their level of fear, coercion and control were also substantially higher than those made by fathers.
In relation to safety concerns, the SRSP 2012 and 2014 surveys revealed similar patterns that are broadly consistent with LSSF Wave 3 findings. The majority of parents reported that they did not hold safety concerns for themselves and/or their child as a result of ongoing contact with the other parent, but consistent proportions of parents in the 2012 and 2014 cohorts (17%) reported safety concerns for themselves and/or their child. An increased proportion of parents in the 2014 cohort reported limiting or trying to limit the focus child's contact with the focus parent because of these safety concerns (2012: 49% cf. 2014: 52%). Although this increase in limiting or attempting to limit contact on the basis of these safety concerns between the 2012 and 2014 cohorts was not statistically significant, overall, the proportion of fathers attempting to limit contact did increase significantly in 2014 (from 28% in 2012 to 36% in 2014). These data may suggest a trend in a direction consistent with the objectives of the 2012 family violence amendments.
9.3 Children witnessing family violence
The 2012 family violence reforms involved explicit legislative recognition of children being exposed to family violence as a form of child abuse, where it "causes the child to suffer serious psychological harm" (FLA s 4(1), s 4AB). The SRSP 2012 and 2014 surveys therefore examined the extent to which parents reported that children were exposed to family violence. Parents in the 2014 cohort reported that their children saw or heard violence or abuse in the before/during separation period in proportions consistent with the 2012 cohort (mothers - both 2012 and 2014: 64%; fathers - 2012: 53% and 2014: 54%). A smaller proportion of mothers and fathers in the 2014 cohort reported that their children had seen or heard the violence or abuse that occurred since separation when compared with the responses of the 2012 cohort on this issue (2012 - fathers: 53% and mothers: 64%; 2014 - fathers: 43% and mothers: 50%). The decrease in the reported exposure of children to family violence since separation may reflect greater awareness by parents of the harm caused to children by such exposure, through their interaction with family law system professionals in the post-reform context. When considering parents' reports of the forms of family violence to which their children had been exposed, a higher proportion of parents reported that their children witnessed physical violence than emotional abuse alone in the 2014 cohort, with this observation again being more pronounced for mothers who had reported physical violence since separation (2012: 72% and 2014: 70%) when compared with mothers who experienced emotional abuse (2012: 47% and 2014: 45%). Although this difference was not statistically significant, the trend towards an increase in parents' reports of exposure to family violence may reflect improved identification of this form of abuse in relation to children, consistent with the objectives of the 2012 family violence amendments.
Children's exposure to family violence that resulted in fear, coercion or control was also specifically examined in the 2014 survey. The findings indicate that the majority of children whose parents reported family violence causing fear, coercion or control had some exposure to this behaviour. Reduced exposure was reported since separation (three in ten children were not exposed) compared with before/during separation (one in five children were not exposed), but even in this period, majorities of children were exposed where their parents experienced this emotional state.
While the data indicated limited statistically significant differences in the responses of fathers and mothers in the before/during separation context, there were statistically significant differences between fathers' and mothers' responses with respect to the exposure of children in the post-separation time period. Interestingly, fathers' reports that the focus child was "often" exposed to the focus parent's fearful, controlling or coercive behaviour were about twice as high as those of mothers in the post-separation context.
9.4 Family violence, safety concerns and care-time arrangements
In relation to the distribution of the different types of care-time arrangements, the SRSP 2012 and 2014 showed similar patterns, which were again like the patterns evident in LSSF Wave 3. Where differences were evident in SRSP 2014, they were subtle (though statistically significant) and consistent with the objectives of the 2012 family violence amendments. In addition to the measures aimed at identifying family violence and safety concerns, the most relevant amendment in this context is the provision specifying that protection from harm is to be given greater weight than the child's right to a meaningful relationship with each parent after separation, where the two principles conflict. This is relevant in court-based decision-making (s 60CC(2A)) and in advice-giving practice (s 60D).
Detailed analysis of care-time arrangements was based on 11 types of possible arrangements. For simplicity, the patterns were also presented in five possible configurations: mother 100% of nights (no nights spent with the father), mother majority (1-34% of nights spent with the father), shared care time, father majority (1-34% of nights spent with the mother), and father 100% (no nights spent with the mother).
Similar patterns in the distribution of care-time arrangements were evident in 2012 and 2014, with most children being in mother majority arrangements (2012: 50% and 2014: 46%). Shared care time was reported for 20-21% of the sample in 2012 and 2014. Father majority care was identical in each time frame at 3%, and father 100% was also stable at 2% in 2012 and 2014. Statistically significant changes were evident between 2012 and 2014 in relation to arrangements where children spent no nights with the father (increasing from 25% to 28%), and had majority mother care time (decreasing from 50% to 46%). These shifts reflect that more care-time arrangements involved spending no nights with the father, although this was more due to a shift towards children having daytime contact only rather than no time at all. In circumstances where safety concerns were reported, the findings indicate that 23% of such children were in arrangements involving daytime contact only with the father in 2014, compared with 19% in 2012. Similarly, where parents had experienced family violence before/during separation, the proportion of children in mother majority care time decreased from 47% in 2012 to 40% in 2014, while the proportion having daytime-only contact increased from 16% in 2012 to 18% in 2014. Although there appeared to be a trend towards decreases in reports of some shared care-time arrangements (where the child spends 53-65% of their time with the mother and has equal care time with each parent), these were not statistically significant. Generally, mothers reported safety concerns in greater proportions than fathers in the context of care-time arrangements ranging from 100% mother care time through to equal time, whereas fathers reported safety concerns in greater proportions than mothers where care-time arrangements ranged from 100% father care time through to shared care-time arrangements where the father was the primary carer. In relation to the varying forms of family violence, the data also show that experiences of physical violence were reported in circumstances where the parent had either majority or 100% care-time of the focus child.
9.5 Family law service use
The 2012 family violence amendments were not directly intended to influence service use patterns, unlike the 2006 family law reforms. However, the reforms could potentially have an effect in this area in two broad ways. First, better screening and identification of family violence concerns might mean fewer parents are accepted into FDR. It is noted, however, that an FDR practitioner may consider FDR to be an appropriate and viable option, despite concerns about family violence exist, if the relevant party is assessed as having the ability to negotiate freely, and sufficient measures are in put in place to ensure their safety. Second, the clarification in the law, primarily through FLA s 60CC(2A), but also through the changes to advisers' obligations (s 60D) might influence parents' decisions about litigation, depending on the nature of the professional or legal information and advice they received and their response to it. However, these issues might also have a mutual influence in that the clarification of law could support agreement-making in FDR, even where family violence and child safety concerns have been identified, assuming these are of a nature that are appropriate to be addressed in FDR. Overall, the findings on service use described in Chapter 4 suggest minimal change. Where such change was evident it was in a direction consistent with the intention of the 2012 family violence amendments.
The overall pattern of service use among the two cohorts indicates a decreased likelihood for the 2014 cohort to make use of services or supports. This cohort made a little less use of counselling, relationships and FDR services, or of lawyers and legal services at the time of separation. This change reflects less use of services among parents not affected by family violence. Patterns in the use of services by parents affected by physical violence or emotional abuse were largely stable. The only statistically significant change in service use patterns between the two cohorts among parents affected by family violence since separation was in the use of counselling/relationship/FDR services by the 2014 cohort of parents who had experienced physical violence - 77% of these parents had used one of the services in 2012, compared to 71% in 2014.
Findings in relation to progress in sorting out parenting arrangements suggest the reforms have been associated with a longer time frame for sorting out arrangements among some parents affected by family violence. Compared to the 2012 cohort, the 2014 cohort was less likely (to a statistically significant extent) to have sorted out their parenting arrangements (2012: 74% cf. 2014: 71%). In both surveys, parents affected by physical violence, and to a lesser extent emotional abuse, were more likely than parents not affected by these issues to report that their parenting arrangements had not been sorted out. Nonetheless, majorities of parents in each category in each survey indicated that their parenting arrangements had been sorted out. In most categories, the indications of a more protracted parenting resolution time frame were subtle. The greatest shifts were evident in two areas. The proportions of mothers affected by physical violence before/during separation who reported that their parenting arrangements were sorted dropped by 6 percentage points to 59% in 2014. The other area where there was a notable change was in the proportion of fathers affected by physical violence since separation, which dropped by 15 percentage points to 45%.
Overall, the main pathways that parents used to sort out their parenting arrangements showed little change between the two cohorts, with most parents (69% in both cohorts) reporting "discussions" were the main pathway. In both periods, one in ten parents reported using counselling/mediation/FDR. Lawyers were used by about 6% of participating parents, and courts used by 3%. There was little change in the proportions of parents reporting use of the different pathways when their experience of family violence was taken into account. The area where subtle shifts were evident was among parents affected by emotional abuse before/during separation, with these parents being slightly more likely to report using counselling/mediation/FDR (2012: 10% cf. 2014: 13%), and less likely to report reliance on courts (2012: 8% cf. 2014: 7%) and lawyers (2012: 4% cf. 2014: 3%).
Of particular note is that a greater proportion of parents in the 2014 cohort (41%) who attended FDR/mediation reported reaching an agreement when compared to parents in the 2012 cohort (36%), with this difference reaching a level of statistical significance. While the highest rates of agreement via FDR/mediation in both cohorts were where parents reported no violence (2012: 44% and 2014: 53%), agreement rates where marginally higher for parents in the 2014 cohort where emotional abuse before/during separation was reported (2012: 36% and 2014: 39%). Where physical violence before/during separation had been reported, agreement rates were significantly higher for parents in the 2014 cohort (38%) and 2012 (30%).
Where parents used legal services, the most commonly sought assistance for parents in both cohorts who had experienced physical violence related to parenting arrangements, whereas for parents in both cohorts who had experienced emotional abuse or who reported no violence, help was most commonly sought in relation to property settlement. For both cohorts, parenting arrangements were the most common issues giving rise to the use of courts. Consistent with the objectives of the 2012 family violence amendments, parents (and mothers in particular) who had experienced physical violence before/during separation in the 2014 cohort were more likely than parents in the 2012 cohort to bring safety issues to court hearings, with this increase reaching a level of statistical significance (2012: 44% cf. 2014: 54%).
9.6 Disclosure of family violence and safety concerns
To support the broad overall aim of improving protection from family violence and child abuse, the 2012 family violence amendments also involve specific strategies aimed at increasing the extent to which family law system professionals attempt to identify these issues and support parents to disclose them. Accordingly, parents' experiences of being asked about (and disclosing) family violence and child safety concerns were a significant focus in the SRSP 2012 and 2014 surveys. The main legislative elements of relevance in this context are threefold: the obligations of professionals to ask about family violence and child safety concerns, the legislative encouragement for parents and others to disclose them, and the removal of legislative discouragement to revealing them (the repeal of s 117AB, which referred to courts having the power to make costs orders where a party was found to have "knowingly made a false statement" in proceedings, and the repeal of the so-called "friendly parent" provision in s 60CC(3)(c)).
Taken together, the findings reported in Chapter 5 suggest there has been a greater focus on screening for family violence and child safety across the system, especially among lawyers and courts. Statistically significant increases were evident in the proportions of parents who reported being asked about family violence and safety concerns when using a formal pathway as the main means of resolving their parenting arrangements. Increases were evident among parents who used the three formal pathways (FDR/mediation, lawyers and courts), but particularly evident for those using lawyers and courts, with increases between the 2012 and 2014 cohorts of about 10 percentage points in the proportions reporting being asked about family violence and safety concerns. However, close to three in ten parents reported never being asked about either of these issues in each pathway, indicating that the implementation of consistent screening approaches has some way to go.
The findings also suggest small increases in the proportions of parents who disclosed concerns. A small but statistically significant increase in the proportion of parents who reported experiencing family violence before/during or since separation to one of a range of possible services and organisations (not confined to the family law system) is evident (2012: 53% cf. 2014: 56%). Mothers were more likely to report violence than fathers (mothers: 63% cf. fathers: 49% in 2014), and the relative proportions of men and women reporting disclosure remained similar. Notably, just over four in ten parents did not report family violence to any service in 2014. Physical violence was more likely to be reported than emotional abuse, and the most common service reported to was police (25% in 2014).
The reasons given as to why parents did not disclose family violence indicate that parents self-select into non-disclosure. Around four in ten (2012: 43% and 2014: 38%) indicated the violence was not serious enough to report, and close to a quarter indicated they felt they could deal with the issue themselves. These findings mean that a history of family violence will not be documented or corroborated for a substantial number of people who experience it. This may or may not have important implications for the parents who self-select into not reporting for reasons that may be regarded as relatively benign, bearing in mind that even these reasons cannot necessarily be taken to imply that the family violence is at the lower of the spectrum of severity (see Chapter 3). The implications of not reporting, and therefore not having any corroboration of the experience, are even more concerning for the parents who indicated that the reason for not reporting was fear. This reason was nominated by small minorities (2012: 2% and 2014: 3%) and by almost three times as many mothers (5%) as fathers (2%) in 2014. The experiences of this group of parents are likely to be particularly severe so the lack of access to assistance, and the absence of a corroborating history, suggest that some of the parents with the most serious family violence issues will also have the most difficulty having them addressed effectively.
In relation to family law services specifically, the proportion of parents who reported disclosing family violence or safety concerns increased by about 3 percentage points between 2012 and 2014, with the change reaching a level of statistical significance largely accounted for by increases in reports by fathers. These figures relate to the parents who reported using a formal main pathway for reaching parenting arrangements (FDR, lawyers and courts) or seeking advice from one of these services. In 2014, equal proportions of parents disclosed family violence and safety concerns (38% each). The proportion of fathers indicating they disclosed family violence increased from 24% in 2012 to 28% in 2014. For mothers, the increase was from 45% to 47%. In relation to safety concerns, the proportion of fathers indicating that they had disclosed concerns increased from 28% to 31%, and for mothers the proportions were 41% and 44%.
The findings on the proportions of parents who reported disclosing family violence or safety concerns when using particular pathways demonstrates that increasing increments of parents reported disclosing each type of concern across each pathway in both 2012 and 2014. Thus, reports of disclosure of safety concerns or family violence were lowest for parents who used FDR and highest for parents who used courts.
Overall, the examination of professionals asking and parents telling about family violence and safety concerns suggests subtle positive improvements consistent with the intention of the 2012 family violence reforms. According to parents, more professionals are asking about these issues, particularly when lawyers and courts are the main pathway being used. Despite this, substantial minorities of parents report not being asked about these issues. In relation to parents who reported these issues in the survey, very small increases in disclosure are evident among fathers and mothers, and safety concerns are more likely to be disclosed than family violence. Again, substantial minorities of parents did not disclose these concerns.
The examination of the consequences of disclosure of concerns yields mixed findings, when assessed against the objectives of the reforms. In relation to the proportions of parents providing responses consistent with a positive effect of the reforms, the data suggest little change, or possibly small shifts in a negative direction. Experiences with different pathways varied among mothers and fathers, but were mostly evident in a negative direction for family violence and safety concerns for both genders for all three pathways. The exceptions to this were in relation to lawyers and family violence: positive responses among mothers were stable and increased among fathers. The incremental shifts in the levels of disclosure do not suggest any substantial shifts in the dynamics of disclosure. These suggestions of stable or negative experiences of responses by professionals when parents disclose are counter-intuitive in light of several aspects of the reforms, including the enactment of the so-called "tie-breaker" provision that requires greater weight to be placed on protection from harm when it conflicts with a child's right to a meaningful relationship with each parent after separation.
Other aspects of the consequences of disclosing family violence or safety concerns suggested that there were limited short-term effects, although there is some evidence of an increase in referrals to other services and marginally greater use of personal protection orders and safety planning.
9.7 The family law system and outcomes for families
Parents' views on the family law system provide a means of engaging in a general assessment of their understanding of and experiences with this system, particularly through the analysis of responses to general questions according to particular experiences (family violence and safety concerns) and to the pathways used for making parenting arrangements. Considered in the context of findings in other areas, these data can be used to inform overall conclusions about the effects of the 2012 family violence amendments.
The perspectives of parents in the 2012 and 2014 cohorts were used to assess views and experiences in three areas. Most generally, parents' views on the efficacy of the family law system were examined through assessing rates of agreement with a range of general statements about the family law system, including whether it meets the needs of mothers and fathers, addresses family violence, and protects the safety of children. The second concerns parents' views of the effectiveness of particular pathways in the family law system, including discussions, FDR/mediation, lawyers and courts, with these nominated pathways assessed through responses to the questions regarding how the process worked (e.g., the process worked for you, the process worked for the focus parent, the needs of the child were adequately considered). In each of the areas considered, to the extent that is statistically sustainable given the samples sizes in various sub-groups, these questions were examined according to patterns in the sample as whole, gender (the gender lens), the experiences of family violence (physical violence and emotional abuse) and safety concerns (the circumstances lens), and the resolution pathway used (the pathway lens). The third area is the extent to which parents showed awareness of the 2012 family violence amendments.
Taken together, the data examined in Chapter 6 support the following conclusions. Overall, the findings suggest some positive moves in directions consistent with the intention of the reforms. From the perspective of gender, positive views in most areas on the measures of efficacy increased incrementally among both mothers and fathers, but among mothers to a greater extent than fathers. It remained true that fathers were consistently less satisfied with the family law system than mothers, but the differences between mothers and fathers in 2014 were not statistically significant. The data support the conclusion that no generalisations can be made about whether the reforms have favoured fathers or mothers.
In relation to family violence, it is fairly clear that there has been a marginal improvement in the views of parents affected by family violence, although this is true to greater or lesser extent according to the measure and whether the experience involved physical violence or emotional abuse. Differences among these groups are evident in different areas, suggesting uneven effects of the reforms, consistent with some of the findings reported in Chapter 5.
In relation to safety concerns, the picture is less positive than in relation to family violence. In some areas, the experience of parents with current safety concerns for themselves or their child (or both) appear to have changed little, if at all, and there is some indication of a negative shift for some sub-groups. Findings in this context suggest a particularly mixed set of views and experiences among parents.
In terms of pathways, the findings suggest that the reforms have supported the resolution of parenting matters in the pathways linked to agreement: discussion and FDR/mediation. In these pathways, there are several indications of positive shifts among all groups of parents (some statistically significant), but to a lesser extent for those affected by current safety concerns compared to those who reported that before/during the separation they had experienced physical violence, emotional abuse or those reporting none of these concerns. In relation to pathways involving lawyers and courts, there were no clear or consistent statistically significant findings; again, this evidences a mixed and uneven set of experiences among parents.
Awareness of the 2012 family violence amendments increased marginally (albeit to a statistically significant extent) among the 2014 cohort, with fathers affected by physical violence and mothers affected by emotional abuse being more likely to have specific knowledge of the changes in 2014 compared with 2012. The vast majority of parents, nine in ten, were unaware of the changes.
9.8 Wellbeing
A key factor in understanding the effects of parental separation on families involves asking the parents themselves their views on how they and their children are coping. Trauma - such as abuse, exposure to violence, and neglect - can have serious long-term consequences on children's development and, with regard to family violence, this research supports that position. While the majority of parents interviewed in the SRSP 2012 and 2014 reported that their child was in good general health and were overall quite satisfied with their child's wellbeing, exposure to family violence negatively affected these views. The effects of family violence were also felt among parents and permeated across many areas of their lives.
Reports of children's physical health differed between fathers and mothers, with significantly more mothers than fathers reporting their child's health was "excellent" across all child age groups. Favourable reports of physical health were also more common with regard to younger children than with teenagers. Similar patterns emerged in parents' satisfaction with their child's overall wellbeing, with mothers reporting higher satisfaction than fathers, and parents of infants and toddlers reporting higher satisfaction than those with school-aged children.
Child wellbeing was noticeably less favourable where family violence had occurred, especially where the child had been exposed to this behaviour. Moreover, the timing of the family violence influenced parents' perception of their child's wellbeing, with children who had been exposed to family violence since separation reported to be faring less well overall than those who had either been exposed to family violence before/during separation only or not at all.
Overall, children who were exposed to family violence before/during and since separation were reported to be having significantly more behaviour problems than children who were not exposed to family violence.
Significantly higher proportions of parents reported that their children who had been exposed to fear-inducing behaviour by the focus parent since separation were faring somewhat or much worse than their peers in all three domains - learning and schoolwork, socialising, and in most areas of life - when compared with children not reported to have been exposed to such behaviour.
Parents' satisfaction with various aspects of their own lives remained essentially unchanged between 2012 and 2014, though with each cohort, gendered patterns emerged across the different areas. Mothers in both cohorts were significantly more likely than fathers to report high satisfaction with their life as a whole (mothers: 52-53% cf. fathers: 37%), their relationship with their child (mothers: 89-90% cf. fathers: 66-68%), the home in which they lived (mothers: 64% cf. fathers: 53%) and their health (mothers: 67% cf. fathers: 64%). Fathers in both cohorts, on the other hand, were significantly more likely than mothers to report high satisfaction with how safe they felt (mothers: 74-75% cf. fathers: 80-81%).
Parents reported lower levels of satisfaction with their personal safety when they experienced family violence that caused them to feel fearful, coerced or controlled both before/during and since the separation (compared to parents who did not experience those feelings). Further, among parents who experienced persistent fear, coercion and/or control from the other parent, mothers reported significantly lower levels of satisfaction with their safety than fathers. Similarly, among parents who experienced fear, coercion and control, either before/during or since separation, mothers reported significantly lower levels of satisfaction with their safety than fathers.
9.9 Child support
The gendered pattern of child support liability was unchanged between 2012 and 2014, with the vast majority of fathers being liable to pay some amount of child support, and the vast majority of mothers supposed to receive child support.
However, some interesting changes emerged between 2012 and 2014 with regard to parents' engagement with and experiences of the DHS-Child Support program, and we speculate that this may be a reflection of some DHS initiatives that were implemented in recent years.
With regard to the method of transfer used by parents to make/receive payments, while the majority of parents still reported using direct transfers between parents, there was a small but significant shift reported by fathers, away from direct transfers, in favour of the DHS-Child Support transfer method.
In the context of family violence, just over half the parents who experienced physical violence before/during separation used DHS-Child Support to transfer payments, a significant increase since 2012, where 47% of parents who experienced physical violence used DHS-Child Support as their method of transfer. Further, 37% of parents in 2014 who experienced emotional abuse alone and 21% of parents who did not experience family violence nominated DHS-Child Support as their method of transfer.
Overall, the majority of parents in each cohort (2012: 65%; 2014: 69%) reported that they paid or received the full amount of child support as per the assessment, and a further 18-20% of parents in each cohort reported that they paid in excess of the amount assessed.
The data also indicate that overall, parents who reported experiencing family violence either before/during or since separation also reported lower proportions of full compliance with the child support assessment by the payer. Interestingly, where parents indicated that they had experienced family violence before/during separation, reports of full compliance remained either stable (physical violence) or increased (emotional abuse alone), though where parents indicated that they had experienced physical violence since separation, reports of full compliance decreased between the 2012 and 2014 cohorts.
Analysis of parents' sense of fairness about the amount of their child support assessment showed a statistically significant increase in payers' reports that their child support assessment was "very unfair" where they reported experiencing emotional abuse alone since separation (2012: 24% cf. 2014: 29%). There was also a significant increase in the proportion of payers who had not experienced family violence reporting that their child support assessment was "very unfair" (2012: 9% cf. 2014: 14%).
Descriptions of the fairness of payments by reference to parenting arrangements indicated that in both cohorts, mothers and fathers in shared care-time arrangements who received child support payments, and mothers and fathers who were non-regular carers, were the most positive in their perceptions of their child support assessment, while mothers with shared care-time arrangements who paid child support were least positive in their responses on this question.
| 2012 (%) | 2014 (%) | |
|---|---|---|
| Notes: Data have been weighted. a Percentages may not total exactly to 100.0% due to rounding. Statistically significant differences between 2012 and 2014 within a given population are noted: * p < .05; ** p < .01; *** p < .001. Statistically significant differences between fathers and mothers within each cohort are noted: † p < .05; †† p < .01; ††† p < .001. | ||
| Family characteristics | ||
| Parental relationship | ||
| Parents married at separation | 69.5 | 63.3 |
| Fathers experienced financial difficulties since separation | 61.8 | 62.6 |
| Mothers experienced financial difficulties since separation | 76.6 ††† | 73.9 *††† |
| Inter-parental relationship currently friendly/cooperative | 62.3 | 61.2 |
| Care-time arrangements a | ||
| Mother 100%, father days only or never sees | 24.9 | 27.5 ** |
| Mother majority | 49.5 | 46.1 *** |
| Shared care | 20.0 | 20.8 |
| Fath er majority | 3.4 | 3.3 |
| Father 100%, mother days only or never sees | 2.3 | 2.4 |
| Supervision | ||
| Changeover supervised | 12.2 | 13.1 |
| Daytime visits supervised | 12.6 | 9.8 |
| Pre-separation issues | ||
| Mental health | 35.0 | 39.2 *** |
| Alcohol/drug use | 25.1 | 25.2 |
| Family violence before/during separation | ||
| Physical violence | 25.2 | 24.7 |
| Emotional abuse alone | 38.9 | 38.3 |
| Family violence since separation | ||
| Physical violence | 7.9 | 8.0 |
| Emotional abuse alone | 51.6 | 50.3 |
| Safety concerns for self/child | 17.1 | 17.4 |
| Family law service use | ||
| Parents who had sorted out parenting arrangements | 73.6 | 71.0 ** |
| Contacted a lawyer | 49.4 | 47.0* |
| Contact a legal service | 32.0 | 30.1 * |
| Contact with courts | 20.3 | 19.6 |
| FDR/mediation attempted by at least 1 parent | 37.8 | 37.6 |
| Agreement reached in FDR/mediation | 35.9 | 41.3 *** |
| No agreement, certificate issued | 25.2 | 23.7 |
| No agreement, no certificate issued | 24.3 | 19.1 *** |
| Family law professionals and family violence | ||
| Asked about family violence by family law professionals | 48.8 | 51.9 |
| Disclosed family violence to family law professionals | 36.4 | 39.0 |
| Family violence taken seriously, dealt with appropriately | 53.4 | 51.9 |
| Family law professionals and safety concerns | ||
| Asked about safety concerns by family law professionals | 48.3 | 52.4 * |
| Disclosed safety concerns to family law professionals | 35.3 | 38.4 * |
| Safety concerns taken seriously, dealt with appropriately | 50.9 | 48.5 |
| Parents' agreement with statements about family law system | ||
| Addresses family violence | 28.4 | 31.8 *** |
| Meets needs of mothers | 50.1 | 54.0 *** |
| Meets needs of fathers | 29.3 | 33.2 *** |
| Meets needs of children | 44.3 | 46.8 * |
| Protects children's safety | 49.2 | 50.9 |
| Helps parents find best outcome for their children | 41.2 | 44.5 *** |
9.10 Summary
In many areas, the findings described in this report reinforce the point that most separated parents do not use family law system services to any great extent. For the majority of parents, parenting arrangements after separation were resolved with minimal or no assistance from services. The parents who do use services are those affected by complex problems, including family violence, safety concerns and other issues, including mental ill health, substance misuse and gambling. These issues are present among each of the SRSP cohorts to varying extents and with varying levels of severity, but the overall pattern of findings in the SRSP 2012 and 2014, together with the patterns in LSSF Wave 1, suggest that that the prevalence, extent and nature of complex issues in separated families are relatively stable for each cohort of separated parents. The findings of Wave 3 of the LSSF suggested that the experience of family violence was sustained for a substantial minority of parents for five years after separation, and if this finding is characteristic of other annual cohorts, then the family law system would appear to be dealing with cumulative cohorts of parents manifesting complex problems over a substantial period of time.
Against this background of the inherent complexity of the parent group that the family law system is dealing with (in contrast with the less complicated range of separated parents who do not engage with the family law system), the challenges of realising the objectives of the 2012 family violence reforms are appreciable. It is also important to reiterate the point that the changes were focused more on bringing about shifts in professional practice and legal and court practice, and therefore parents' experiences will, in turn, reflect changes in professional practice. Although the reforms were accompanied by the implementation of practice strategies designed to provide professional development (e.g., the AVERT family violence training package) and practice tools (e.g., DOORS), they did not change service and practice models.
This report has highlighted some areas where positive indications of the effects of the reforms are evident, but the extent of changes reported is generally quite small. There are limited indications that the experiences of some families affected by family violence and safety concerns have improved in some areas. It is notable that an increased emphasis on screening and disclosure is evident from parents' reports but that there are limited indications of changes in responses where family violence and child safety concerns are disclosed. Encouraging signs of emerging change are evident in relation to increases in parenting arrangements involving daytime-only contact where there is a history of emotional abuse. The reforms have supported the resolution of parenting arrangements in resolution-based pathways, even for families not affected by family violence. Importantly, the aggregate-level data on views of the family law system suggest incremental improvements among parents affected by family violence. Overall, parents with safety concerns are less satisfied with the responses of professionals than those affected by family violence. The data analysis suggests that this was more so in relation to family violence than safety concerns.
Australian Bureau of Statistics. (2011). Household income and income distribution, Australia, 2009-10 (Cat. No. 6523.0). Canberra: ABS. Retrieved from <www.abs.gov.au/AUSSTATS/[email protected]/DetailsPage/6523.02009-10?OpenDocument>.
Australian Bureau of Statistics. (2012a). Housing tenure data in the Census (Fact Sheet). Canberra: ABS. Retrieved from <www.abs.gov.au/websitedbs/censushome.nsf/home/factsheetshtdc?>.
Australian Bureau of Statistics. (2012b). Personal safety, Australia, 2012 (Cat. No. 4906.0). Canberra: ABS. Retrieved from <www.abs.gov.au/ausstats/[email protected]/mf/4906.0>.
Australian Bureau of Statistics. (2013). Defining the data challenge for family, domestic and sexual violence, Australia (Cat. No. 4529.0). Canberra: ABS.
Australian Law Reform Commission, & NSW Law Reform Commission. (2010). Family violence: A national legal response. Sydney: ALRC and NSWLRC.
Bagshaw, D., Brown, T., Wendt, S., Campbell, A., McInnes, E., Tinning, B., et al. (2010). Family violence and family law in Australia. The experiences and views of children and adults from families who separated post-1995 and post-2006. Canberra: Attorney-General's Department.
Briggs-Gowan, M., & Carter, A. (2006). BITSEA: Brief Infant-Toddler Social and Emotional Assessment: Examiner's manual. San Antonio, TX: Harcourt.
Chisholm, R. (2009). Family courts violence review. Canberra: Attorney-General's Department.
De Maio, J., Kaspiew, R., Smart, D., Dunstan, J., & Moore, S. (2013). Survey of Recently Separated Parents: A study of parents who separated prior to the implementation of the Family Law Amendment (Family Violence and Other Matters) Act 2011. Canberra: Attorney-General's Department.
Family Law Council. (2009). Improving responses to family violence in the family law system: An advice on the intersection of family violence and family law issues. Canberra: Attorney-General's Department.
Hamberger, L. K., & Larsen, S. (2015). Men's and women's experience of intimate partner violence: A review of ten years of comparative studies in clinical samples. Part 1. Journal of Family Violence, 30, 699-717.
Hegarty, K. (2007). Composite Abuse Scale manual. Melbourne: University of Melbourne.
Hegarty, K., Bush, R., & Sheehan, M. (2005) The Composite Abuse Scale: Further development and assessment of reliability and validity of a multidimensional partner abuse measure in clinical settings. Violence and Victims, 20(5), 529-547.
Kaspiew, R., Carson, R., Coulson, M., Dunstan, J., & Moore, S. (2014). Responding to family violence: A survey of family law practices and experiences (Evaluation of the 2012 Family Violence Amendments). Melbourne: Australian Institute of Family Studies.
Kaspiew, R., Carson, R., Dunstan, J., Qu, L., Horsfall, B., De Maio, J. et al. (2015). Evaluation of the 2012 family violence amendments: Synthesis report (Evaluation of the 2012 Family Violence Amendments). Melbourne: Australian Institute of Family Studies.
Kaspiew, R., Gray, M., Weston, R., Moloney, L., Hand, K., Qu, L., & the Family Law Evaluation Team. (2009). Evaluation of the 2006 family law reforms. Melbourne: Australian Institute of Family Studies
Kaspiew, R., & Qu, L. (2014, 7 October). Hounouring the role and meeting the challenges. Paper presented at the Inaugural National ICL Training Conference, Sydney.
Rhoades, H., Sheehan, G., & Dewar, J. (2013). Developing a consistent message about children's care needs across the family law system. Australian Journal of Family Law, 27(3), 191-219.
Qu, L., Weston, R., Moloney, L., Kaspiew, R., & Dunstan, J. (2014). Post-separation parenting, property and relationship dynamics after five years. Canberra: Attorney-General's Department.
Straus, M., Hamby, L., Boney-McCoy, S., & Sugarman, D. (1996). The Revised Conflict Tactics Scales (CTS2): Development and preliminary psychometric data. Journal of Family Issues, 17, 283.
The key aims of the research are to:
1. undertake an analysis of the extent and nature of the changes of the impacts of the family violence amendments on the family law system, including professional practices and parents and children; and
2. examine the impacts in terms of achieving the intent of the changes (to achieve safer post-separation parenting arrangements).
The specific issues the research is to address will be determined in consultation with the Attorney-General’s Department. Areas for consideration include:
3. To what extent have patterns in arrangements for post-separation parenting changed since the introduction of the family violence amendments, and to what extent are they consistent with the intent of the reforms?
4. Are more parents disclosing concerns about family violence and child safety to family law system professionals?
5. Are there any changes in the patterns of service use following the family violence amendments?
6. What is the size and nature of any changes in the following areas and to what extent are any such changes consistent with the intent of the reforms:
- practices among the following groups of professionals—advisers (FLA s 63DA(5)), lawyers, professionals associated with courts, including family consultants and judges; and
- court-based practices, as reflected in the manner in which practitioners and judges fulfil their obligations under the Family Law Act 1975 (Cth)?
7. Does the evidence suggest that the legislative changes have influenced the patterns apparent in the above areas?
8. Have the family violence amendments had any unintended consequences, both positive or negative?
Call statistics
| Call outcome | % | N |
|---|---|---|
| Notes: Data have not been weighted. Percentages may not total 100.0% due to rounding. | ||
| Completed interviews | 21.5 | 6,079 |
| Unusable phone number (fax machine/modem, disconnected, etc.) | 15.5 | 4,389 |
| No contact achieved throughout fieldwork (answering machine, no answer) | 31.7 | 8,956 |
| Out-of-scope (wrong number, separated before July 2010, no longer separated, focus child lives independently, focus child/parent deceased, etc.) | 6.7 | 1,898 |
| Unresolved appointments | 0.0 | 19 |
| Refusals (incl. household/participant terminated interviews, etc.) | 24.5 | 6,909 |
| Total | 100.0 | 28,250 |
Responding sample
| Characteristics | % | N |
|---|---|---|
| Gender | ||
| Male | 46.3 | 2,816 |
| Female | 53.7 | 3,263 |
| State | ||
| NSW | 29.4 | 1,790 |
| VIC | 26.2 | 1,590 |
| QLD | 20.7 | 1,261 |
| WA | 10.5 | 641 |
| SA | 7.6 | 461 |
| TAS | 2.5 | 152 |
| ACT | 2.0 | 123 |
| NT | 1.0 | 61 |
| Language of interview | ||
| English | 99.3 | 6,038 |
| Arabic | 0.2 | 12 |
| Cantonese | 0.0 | 3 |
| Mandarin | 0.3 | 17 |
| Vietnamese | 0.1 | 9 |
| Child support status | ||
| Payer | 45.5 | 2,765 |
| Payee | 54.5 | 3,314 |
| Aboriginal/Torres Strait Islander | ||
| Yes | 2.9 | 177 |
| No | 76.0 | 4,620 |
| Total | 100.0 | 6,079 |
Family law service use
| Physical violence | Emotional abuse alone | No violence | ||||
|---|---|---|---|---|---|---|
| Fathers (%) | Mothers (%) | Fathers (%) | Mothers (%) | Fathers (%) | Mothers (%) | |
| Note: Data have been weighted. Statistically significant differences between fathers and mothers within each population (experience of violence) are noted: † p < .05; †† p < .01; ††† p < .001. | ||||||
| Counselling/mediation/FDR service | 69.9 | 65.7 | 61.8 | 56.0 †† | 37.2 | 32.3 † |
| A lawyer | 65.9 | 60.3 † | 58.7 | 50.9 ††† | 28.9 | 28.0 |
| A legal service | 39.7 | 52.3 ††† | 29.7 | 37.7 ††† | 12.3 | 18.1 ††† |
| The courts | 37.2 | 34.7 | 24.1 | 17.2 ††† | 8.3 | 6.6 |
| A domestic violence service | 10.9 | 33.5 ††† | 3.7 | 10.6 ††† | 0.4 | 0.8 |
| Family members | 69.6 | 73.2 | 66.0 | 69.2 | 51.2 | 57.8 †† |
| Other | 2.0 | 2.0 | 1.7 | 2.0 | 1.4 | 1.6 |
| None | 7.3 | 5.7 | 9.6 | 9.7 | 30.4 | 25.3 † |
| No. of children | 552 | 1,053 | 1,158 | 1,221 | 1,107 | 998 |
| Physical violence | Emotional abuse alone | No violence | ||||
|---|---|---|---|---|---|---|
| Fathers (%) | Mothers (%) | Fathers (%) | Mothers (%) | Fathers (%) | Mothers (%) | |
| Note: Data have been weighted. Statistically significant differences between fathers and mothers within each population (experience of violence) are noted: † p < .05; †† p < .01; ††† p < .001. | ||||||
| Counselling/mediation/FDR service | 71.2 | 70.7 | 66.3 | 62.8 | 35.8 | 31.2 † |
| A lawyer | 67.5 | 60.9 | 61.9 | 58.3 | 29.0 | 26.8 |
| A legal service | 43.1 | 56.0† | 33.3 | 45.5 ††† | 11.6 | 18.1 ††† |
| The courts | 36.7 | 37.2 | 27.9 | 24.9 | 8.8 | 7.2 |
| A domestic violence service | 15.7 | 38.2 ††† | 4.6 | 19.4 ††† | 0.8 | 2.1 †† |
| Family members | 72.4 | 71.3 | 67.9 | 73.7 ††† | 50.6 | 56.3 †† |
| Other | 2.9 | 2.5 | 1.8 | 1.8 | 1.2 | 1.9 |
| None | 4.7 | 4.1 | 8.8 | 6.2† | 29.7 | 25.7 † |
| No. of children | 552 | 1,053 | 1,158 | 1,221 | 1,107 | 998 |
Disclosure of family violence and safety concerns
| Response to disclosing family violence | 2012 (%) | 2014 (%) | ||||
|---|---|---|---|---|---|---|
| Physical violence | Emotional abuse alone | No violence | Physical violence | Emotional abuse alone | No violence | |
| Note: Data have been weighted. | ||||||
| Taken seriously, dealt with appropriately | 51.2 | 56.3 | 58.5 | 50.6 | 53.9 | 50.7 |
| Acknowledged but not considered relevant | 32.1 | 29.6 | 33.3 | 33.3 | 30.7 | 42.4 |
| Ignored or not taken seriously | 12.1 | 9.2 | 5.5 | 10.1 | 11.3 | 4.8 |
| Something else | 4.7 | 4.9 | 2.7 | 5.2 | 4.1 | 2.1 |
| No. of observations | 696 | 448 | 38 | 749 | 455 | 39 |
| Total (%) | Fathers (%) | Mothers (%) | ||||
|---|---|---|---|---|---|---|
| 2012 | 2014 | 2012 | 2014 | 2012 | 2014 | |
| Note: Data have been weighted. Responses of “strongly agree” and “agree”, and “strongly disagree” and “disagree” have been combined to “agree” and “disagree” respectively for each statement. The “refused” responses were excluded from this analysis, varying slightly for each statement. Statistically significant differences between 2012 and 2014 within a given population are noted: * p < .05; ** p < .01; *** p < .001. | ||||||
| Addresses family violence issues | (n = 6,084) | (n = 6,057) | (n = 2,833) | (n = 2,807) | (n = 3,251) | (n = 3,250) |
| Agree | 28.4 | 31.8 *** | 26.6 | 29.8 * | 30.1 | 33.8 ** |
| Neither agree/disagree | 18.6 | 4.4 *** | 17.3 | 4.3 *** | 19.9 | 4.5 *** |
| Disagree | 17.1 | 18.0 | 18.1 | 18.2 | 16.2 | 17.8 |
| Don’t know | 35.9 | 45.9 *** | 38.0 | 47.8 *** | 33.9 | 43.9 *** |
| Meets the needs of mothers | (n = 6,084) | (n = 6,052) | (n = 2,833) | (n = 2,801) | (n = 3,251) | (n = 3,251) |
| Agree | 50.1 | 54.0 *** | 61.1 | 63.7 | 39.8 | 44.5 *** |
| Neither agree/disagree | 11.2 | 3.4 *** | 8.2 | 2.6 *** | 14.0 | 4.2 *** |
| Disagree | 12.6 | 12.7 | 4.6 | 4.3 | 20.1 | 21.0 |
| Don’t know | 26.0 | 29.8 *** | 26.1 | 29.4 ** | 26.0 | 30.3 *** |
| Meets the needs of fathers | (n = 6,083) | (n = 6,048) | (n = 2,836) | (n = 2,806) | (n = 3,247) | (n = 3,242) |
| Agree | 29.3 | 33.2 *** | 20.8 | 23.5 * | 37.3 | 42.7 *** |
| Neither agree/disagree | 13.5 | 4.5 *** | 10.7 | 4.4 *** | 16.1 | 4.6 *** |
| Disagree | 29.9 | 30.4 | 46.6 | 47.8 | 14.2 | 13.3 |
| Don’t know | 27.3 | 31.9 *** | 21.9 | 24.3 * | 32.4 | 39.5 *** |
| Meets the needs of the children | (n = 6,086) | (n = 6,053) | (n = 2,837) | (n = 2,803) | (n = 3,249) | (n = 3,250) |
| Agree | 44.3 | 46.8 * | 45.1 | 47.1 | 43.5 | 46.5 * |
| Neither agree/disagree | 12.8 | 5.0 *** | 12.2 | 5.7 *** | 13.3 | 4.3 *** |
| Disagree | 19.9 | 20.9 | 20.9 | 22.2 | 19.0 | 19.7 |
| Don’t know | 23.0 | 27.3 *** | 21.8 | 25.0 ** | 24.2 | 29.6 *** |
| Protects the safety of children | (n = 6,085) | (n = 6,049) | (n = 2,836) | (n = 2,802) | (n = 3,249) | (n = 3,247) |
| Agree | 49.2 | 50.9 | 51.9 | 53.5 | 46.7 | 48.3 |
| Neither agree/disagree | 11.3 | 4.2 *** | 10.9 | 4.4 *** | 11.6 | 4.1 *** |
| Disagree | 15.5 | 15.7 | 13.4 | 14.1 | 17.4 | 17.3 |
| Don’t know | 24.1 | 29.2 *** | 23.8 | 28.0 *** | 24.3 | 30.4 *** |
| Helps families to find the best outcome for children | (n = 6,082) | (n = 6,048) | (n = 2,833) | (n = 2,800) | (n = 3,249) | (n = 3,248) |
| Agree | 41.2 | 44.5 *** | 38.3 | 41.2 * | 43.8 | 47.7 ** |
| Neither agree/disagree | 13.7 | 5.4 *** | 13.5 | 5.7 *** | 13.8 | 5.0 *** |
| Disagree | 20.5 | 21.1 | 24.0 | 25.2 | 17.2 | 17.1 |
| Don’t know | 24.7 | 29.0 *** | 24.3 | 27.9 ** | 25.1 | 30.2 *** |
| Physical violence (%) | Emotional abuse (%) | No family violence (%) | Total (%) | |||||
|---|---|---|---|---|---|---|---|---|
| 2012 | 2014 | 2012 | 2014 | 2012 | 2014 | 2012 | 2014 | |
| Note: Data have been weighted. Responses of “strongly agree” and “agree”, and “strongly disagree” and “disagree” have been combined to “agree” and “disagree” respectively for each statement. The “refused” responses were excluded from this analysis, varying slightly for each statement. Statistically significant differences between 2012 and 2014 within a given population are noted: * p < .05; ** p < .01; *** p < .001. | ||||||||
| Addresses family violence issues | (n = 484) | (n = 478) | (n = 3,219) | (n = 3,226) | (n = 2,357) | (n = 2,353) | (n = 6,084) | (n = 6,057) |
| Agree | 28.8 | 35.5 * | 27.4 | 33.4 *** | 29.6 | 29.1 | 28.4 | 31.8 *** |
| Neither | 18.7 | 3.5 *** | 19.9 | 5.1 | 16.9 | 3.6 *** | 18.6 | 4.4 *** |
| Disagree | 33.6 | 34.2 | 20.5 | 22.2 | 9.6 | 9.7 | 17.1 | 18.0 |
| Don’t know | 19.0 | 26.7 ** | 32.2 | 39.3 *** | 43.9 | 57.6 *** | 35.9 | 45.9 *** |
| Meets the needs of mothers | (n = 484) | (n = 477) | (n = 3,243) | (n = 3,223) | (n = 2,357) | (n = 2,352) | (n = 6,084) | (n = 6,052) |
| Agree | 48.0 | 56.4 * | 50.7 | 56.8 *** | 49.9 | 50.1 | 50.1 | 54.0 *** |
| Neither | 12.5 | 4.5 *** | 10.9 | 3.8 | 11.4 | 2.8 *** | 11.2 | 3.4 *** |
| Disagree | 21.5 | 21.3 | 15.7 | 16.2 | 7.0 | 6.9 | 12.6 | 12.7 |
| Don’t know | 18.1 | 17.8 | 22.8 | 23.3 | 31.7 | 40.2 *** | 26.0 | 29.8 *** |
| Meets the needs of fathers | (n = 484) | (n = 475) | (n = 3,244) | (n = 3,219) | (n = 2,356) | (n = 2,354) | (n = 6,083) | (n = 6,048) |
| Agree | 32.0 | 32.7 | 27.4 | 33.0 *** | 31.2 | 33.5 | 29.3 | 33.2 *** |
| Neither | 13.8 | 5.7 *** | 13.6 | 5.0 | 13.4 | 3.7 *** | 13.5 | 4.5 *** |
| Disagree | 33.6 | 39.8 | 34.4 | 36.1 | 23.6 | 21.6 | 29.9 | 30.4 |
| Don’t know | 20.7 | 21.8 | 24.7 | 25.9 | 31.9 | 41.3 *** | 27.3 | 31.9 *** |
| Meets the needs of the children | (n = 483) | (n = 478) | (n = 3,242) | (n = 3,222) | (n = 2,359) | (n = 2,353) | (n = 6,086) | (n = 6,053) |
| Agree | 39.6 | 45.5 | 42.0 | 46.0 ** | 48.1 | 47.9 | 44.3 | 46.8 * |
| Neither | 15.7 | 6.0 *** | 13.0 | 5.8 | 11.9 | 4.0 *** | 12.8 | 5.0 *** |
| Disagree | 29.3 | 31.9 | 25.0 | 27.1 | 11.7 | 11.2 | 19.9 | 20.9 |
| Don’t know | 15.5 | 16.6 | 20.0 | 21.1 | 28.3 | 36.9 *** | 23.0 | 27.3 *** |
| Protects the safety of children | (n = 485) | (n = 477) | (n = 3,241) | (n = 3,221) | (n = 2,357) | (n = 2,351) | (n = 6,085) | (n = 6,049) |
| Agree | 46.2 | 48.1 | 47.9 | 52.1 ** | 51.5 | 50.0 | 49.2 | 50.9 |
| Neither | 11.8 | 5.0 *** | 11.7 | 5.1 | 10.6 | 3.0 *** | 11.3 | 4.2 *** |
| Disagree | 26.1 | 27.5 | 18.7 | 19.3 | 9.2 | 9.1 | 15.5 | 15.7 |
| Don’t know | 15.9 | 19.4 | 21.7 | 23.6 | 28.7 | 37.9 *** | 24.1 | 29.2 *** |
| Helps to find the best outcome for children | (n = 484) | (n = 476) | (n = 3,241) | (n = 3,222) | (n = 2,357) | (n = 2,350) | (n = 6,082) | (n = 6,048) |
| Agree | 37.0 | 41.1 | 38.6 | 43.3 *** | 45.3 | 46.7 | 41.2 | 44.5 *** |
| Neither | 14.8 | 5.8 *** | 14.2 | 6.3 *** | 12.7 | 4.1 *** | 13.7 | 5.4 *** |
| Disagree | 31.2 | 32.5 | 25.8 | 27.1 | 11.6 | 11.6 | 20.5 | 21.1 |
| Don’t know | 17.0 | 20.6 | 21.4 | 23.3 | 30.4 | 37.6 *** | 24.7 | 29.0 *** |
| Physical violence (%) | Emotional abuse (%) | No family violence (%) | ||||
|---|---|---|---|---|---|---|
| 2012 | 2014 | 2012 | 2014 | 2012 | 2014 | |
| Note: Data have been weighted. The “refused” responses were excluded from this analysis (n = 5). Percentages may not total exactly 100.0% due to rounding. Statistically significant differences between 2012 and 2014 within a given population are noted: * p < .05; ** p < .01; *** p < .001. Statistically significant differences between fathers and mothers within each cohort are noted: † p < .05; †† p < .01; ††† p < .001. | ||||||
| Total | (n = 486) | (n = 480) | (n = 3,253) | (n = 3,232) | (n = 2,375) | (n = 2,367) |
| Yes, aware of specific changes | 3.2 | 7.0 ** | 2.5 | 4.5 *** | 1.3 | 2.1 * |
| Yes, aware, not sure of details | 8.0 | 6.4 | 8.4 | 4.2 *** | 6.0 | 3.0 *** |
| Not aware of any changes | 88.8 | 85.0 | 89.1 | 90.1 ** | 92.7 | 93.8 ** |
| Fathers | (n = 189) | (n = 191) | (n = 1,458) | (n = 1,436) | (n = 2,851) | (n = 1,190) |
| Yes, aware of specific changes | 1.2 | 7.6 ** | 2.7 | 4.7 ** | 1.3 | 2.1 |
| Yes, aware, not sure of details | 5.3 | 6.2 | 8.9 | 4.2 *** | 7.2 | 2.5 *** |
| Not aware of any changes | 93.5 | 86.2 * | 88.3 | 91.2 * | 91.5 | 95.4 *** |
| Mothers | (n = 297) | (n = 289) | (n = 1,795) | (n = 1,796) | (n = 1,171) | (n = 1,177) |
| Yes, aware of specific changes | 4.5 † | 6.8 | 2.3 | 4.4 *** | 1.2 | 2.1 |
| Yes, aware, not sure of details | 9.9 | 6.6 | 8.1 | 4.3 *** | 4.8 † | 3.7 |
| Not aware of any changes | 85.6 † | 86.6 | 89.6 | 91.3 | 94.0 † | 94.2 |
Parent and child wellbeing
Figure B1: Wellbeing of child compared to peers in learning or school work, by parents’ experiences of family violence before/during separation and parent gender, 2012 and 2014
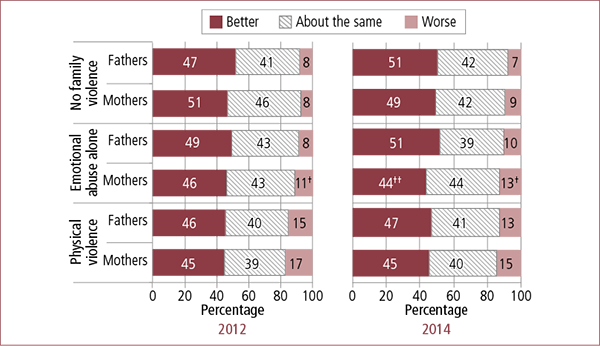
Notes: Data have been weighted. Percentages may not total 100.0% due to rounding. The “don’t know” and “refused” responses were excluded from this analysis (less than 3%). Note that the categories of “much better” and “somewhat better” are collapsed together and the categories of “much worse” and “somewhat worse” are collapsed together. Differences between 2012 and 2014 were not statistically significant. Statistically significant differences between fathers and mothers within each cohort are noted: † p < .05; †† p < .01; ††† p < .001.
Figure B2: Wellbeing of child compared to peers in getting on with other children, by parents’ experiences of family violence before/during separation and parent gender, 2012 and 2014
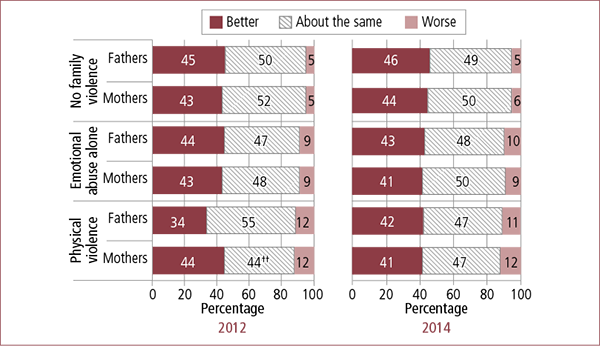
Notes: Data have been weighted. Percentages may not total 100.0% due to rounding. The “don’t know” and “refused” responses were excluded from this analysis (less than 3%). Note that the categories of “much better” and “somewhat better” are collapsed together and the categories of “much worse” and “somewhat worse” are collapsed together. Statistically significant differences between 2012 and 2014 within a given population are noted: * p < .05; ** p < .01; *** p < .001. Statistically significant differences between fathers and mothers within each cohort are noted: † p < .05; †† p < .01; ††† p < .001.
Figure B3: Wellbeing of child compared to peers in most areas of life, by parents’ experiences of family violence before/during separation and parent gender, 2012 and 2014
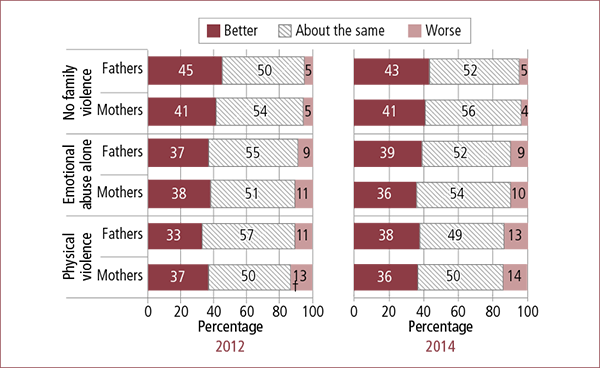
Notes: Data have been weighted. Percentages may not total 100.0% due to rounding. The “don’t know” and “refused” responses were excluded from this analysis (less than 3%). Note that the categories of “much better” and “somewhat better” are collapsed together and the categories of “much worse” and “somewhat worse” are collapsed together. Differences between 2012 and 2014 were not found. Statistically significant differences between fathers and mothers within each cohort are noted: † p < .05; †† p < .01; ††† p < .001.
Figure B4: Wellbeing of child compared to peers in learning or school work, by parents’ experiences of family violence since separation and parent gender, 2012 and 2014
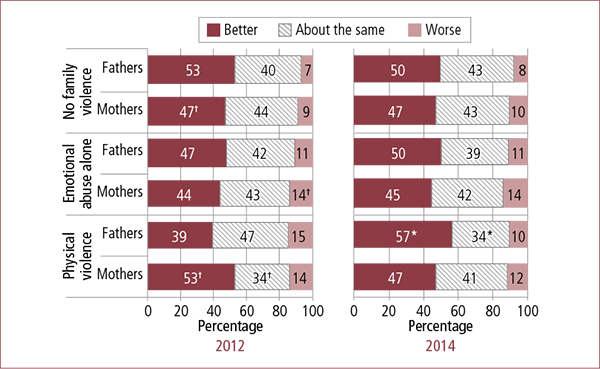
Notes: Data have been weighted. Percentages may not total 100.0% due to rounding. The “don’t know” and “refused” responses were excluded from this analysis (less than 3%). Note that the categories of “much better” and “somewhat better” are collapsed together and the categories of “much worse” and “somewhat worse” are collapsed together. Statistically significant differences between 2012 and 2014 within a given population are noted: * p < .05; ** p < .01; *** p < .001. Statistically significant differences between fathers and mothers within each cohort are noted: † p < .05; †† p < .01; ††† p < .001.
Figure B5: Wellbeing of child compared to peers in getting on with other children, by parents’ experiences of family violence since separation and parent gender, 2012 and 2014
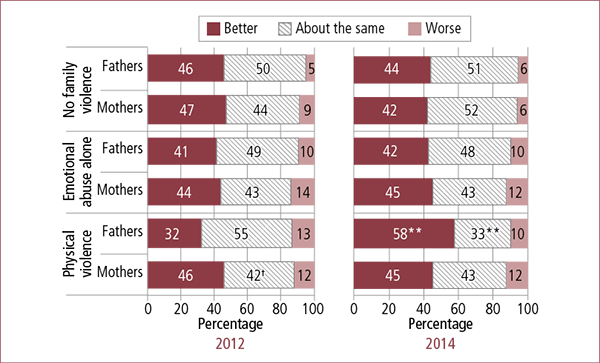
Notes: Data have been weighted. Percentages may not total 100.0% due to rounding. The “don’t know” and “refused” responses were excluded from this analysis (less than 3%). Note that the categories of “much better” and “somewhat better” are collapsed together and the categories of “much worse” and “somewhat worse” are collapsed together. Statistically significant differences between 2012 and 2014 within a given population are noted: * p < .05; ** p < .01; *** p < .001. Statistically significant differences between fathers and mothers within each cohort are noted: † p < .05; †† p < .01; ††† p < .001.
Figure B6: Wellbeing of child compared to peers in most areas of life, by parents’ experiences of family violence since separation and parent gender, 2012 and 2014
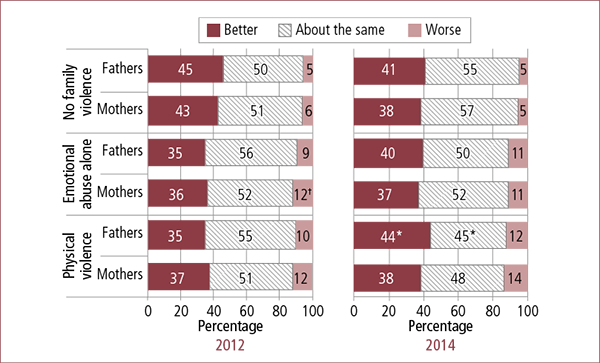
Notes: Data have been weighted. Percentages may not total 100.0% due to rounding. The “don’t know” and “refused” responses were excluded from this analysis (less than 3%). Note that the categories of “much better” and “somewhat better” are collapsed together and the categories of “much worse” and “somewhat worse” are collapsed together. Statistically significant differences between 2012 and 2014 within a given population are noted: * p < .05; ** p < .01; *** p < .001. Statistically significant differences between fathers and mothers within each cohort are noted: † p < .05; †† p < .01; ††† p < .001.
Figure B7: Satisfaction with parent–child relationship, by parents’ experiences of family violence since separation and parent gender, 2012 and 2014
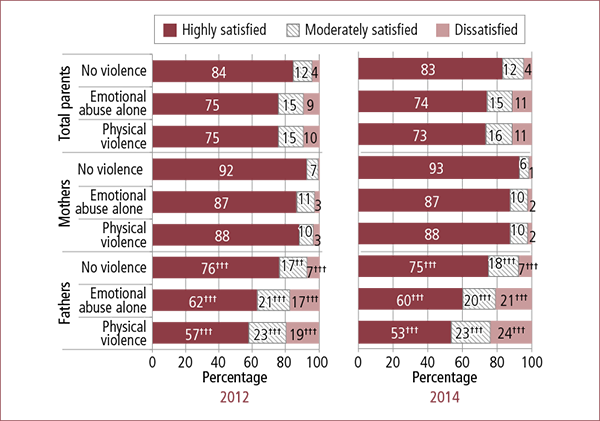
Notes: Data have been weighted. Percentages may not total 100.0% due to rounding. Differences between 2012 and 2014 were not statistically significant. Statistically significant differences between fathers and mothers within each cohort are noted: † p < .05; †† p < .01; ††† p < .001.
Figure B8: Satisfaction with life as a whole, by parents’ experiences of family violence since separation and parent gender, 2012 and 2014
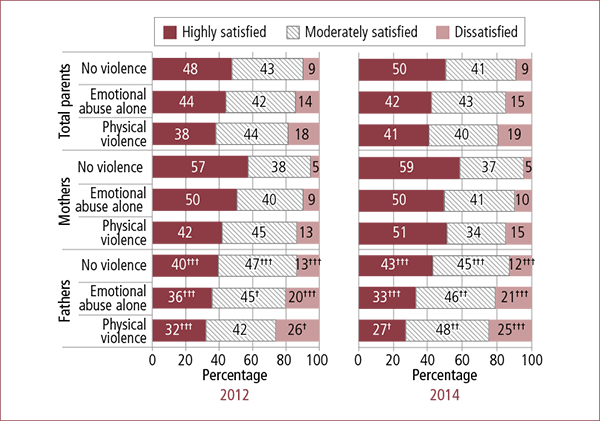
Notes: Data have been weighted. Percentages may not total 100.0% due to rounding. Differences between 2012 and 2014 were not statistically significant. Statistically significant differences between fathers and mothers within each cohort are noted: † p < .05; †† p < .01; ††† p < .001.
Figure B9: Distribution of care-time arrangements when family violence experienced before/during separation, 2012 and 2014
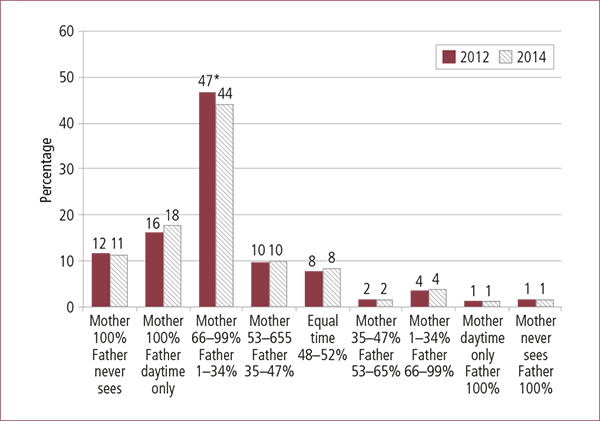
Notes: Data have been weighted. In cases where both parents of a focus child participated (2012: n = 539; 2014: n = 523), data from one parent were randomly selected for inclusion. Statistically significant differences between 2012 and 2014 within a given population are noted: * p < .05; ** p < .01; *** p < .001.
Family violence - experiences of fear, coercion and control
Figure B.10: All parents: How many of "fear, coercion and control" parents experienced before/during and since separation, father and mother reports
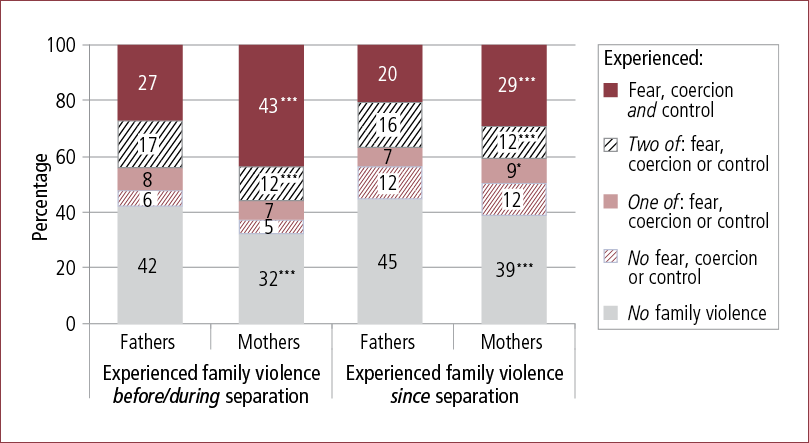
Notes: Data have been weighted. Percentages may not sum to 100.0% due to rounding. Sample population for both time periods is all parents: Fathers, n = 2,817; Mothers, n = 3,262. Statistically significant differences between mothers and fathers within each time period are noted: * p < .05; ** p < .01; *** p < .001.
Figure B.11: Parents who experienced family violence: How many of "fear, coercion and control" parents experienced before/during and since separation, father and mother reports
[[{"fid":"10032","view_mode":"full","fields":{"format":"full","field_file_image_alt_text[und][0][value]":"Parents who experienced family violence: How many of \"fear, coercion and control\" parents experienced before/during and since separation, father and mother reports","field_file_image_title_text[und][0][value]":""},"type":"media","attributes":{"alt":"Parents who experienced family violence: How many of "fear, coercion and control" parents experienced before/during and since separation, father and mother reports","class":"media-element file-full"}}]]
Notes: Data have been weighted. Percentages may not sum to 100.0% due to rounding. Sample populations for before/during separation: Fathers, n = 1,710; Mothers, n = 2,274. Sample populations for since separation: Fathers, n = 1,627; Mothers, n = 2,085. Statistically significant differences between mothers and fathers within each time period are noted: * p < .05; ** p < .01; *** p < .001.
Rae Kaspiew is a Senior Research Fellow, Rachel Carson is a Research Fellow, Jessie Dunstan is a Senior Research Officer, John De Maio was a Research Fellow, Sharnee Moore is a Research Fellow, Lawrie Moloney is a Senior Research Fellow, Diana Smart was a Senior Research Fellow, Lixia Qu is a Senior Research Fellow, Melissa Coulson was a Research Officer and Sarah Tayton was a Research Officer at the Australian Institute of Family Studies.
This report was commissioned and funded by the Australian Government Attorney-General's Department (AGD).
First and foremost, the authors would like to acknowledge and thank all parents who participated in the telephone interviews for the Survey of Recently Separated Parents 2012 and 2014. Without their contributions and willingness to share their views and experiences with us, this research would not have been possible.
We are grateful for the support and assistance provided by AGD, specifically by AGD officers Tamsyn Harvey, Tracy Ballantyne, Sue Harris and Jackie Aumann.
Thanks also go to the team at the Department of Human Services - Child Support, particularly Judi Pritchard, Paula Potter, Alex Dolan and Ashley Bryant, who also supported this research through facilitating access to the sampling frame.
We would like to thank Roy Morgan Research for their efforts in undertaking the data collection with parents for the Survey of Recently Separated Parents (SRSP), in both 2012 and 2014, and to Robert Clark of the University of Wollongong for undertaking the weighting of data for both the 2012 and 2014 surveys.
We also extend our thanks to the AIFS Publishing team, and to Lan Wang in particular, for her invaluable assistance, including for her insight and attention to detail in editing this report.
We would also like to thank Professor Alan Hayes AM, Director of AIFS (until 30 June 2015); Sue Tait, Acting Director of AIFS (until 7 September 2015); Associate Professor Daryl Higgins, Deputy Director (Research); and Dr Michael Alexander, Acting Deputy Director (Corporate and Strategy) for their advice and support throughout the research. This study builds on the methodology applied in the Longitudinal Study of Separated Families and we acknowledge the contribution made to this research by AIFS Assistant Director Ruth Weston and Senior Research Fellow Dr Lixia Qu.
Cover photo: © Rachata Sinthopachakul/Shutterstock.com
Kaspiew, R., Carson, R., Dunstan, J., De Maio, J., Moore, S., Moloney, L. et al. (2015). Experiences of Separated Parents Study (Evaluation of the 2012 Family Violence Amendments). Melbourne: Australian Institute of Family Studies.
978-1-76016-051-7
21 October 2015