Families Then & Now: Having children

Many changes have occurred in Australia since the establishment of the Australian Institute of Family Studies in 1980. This snapshot focuses on fertility rate, the age at which women have their first child, and the number of births per woman.
Key trends
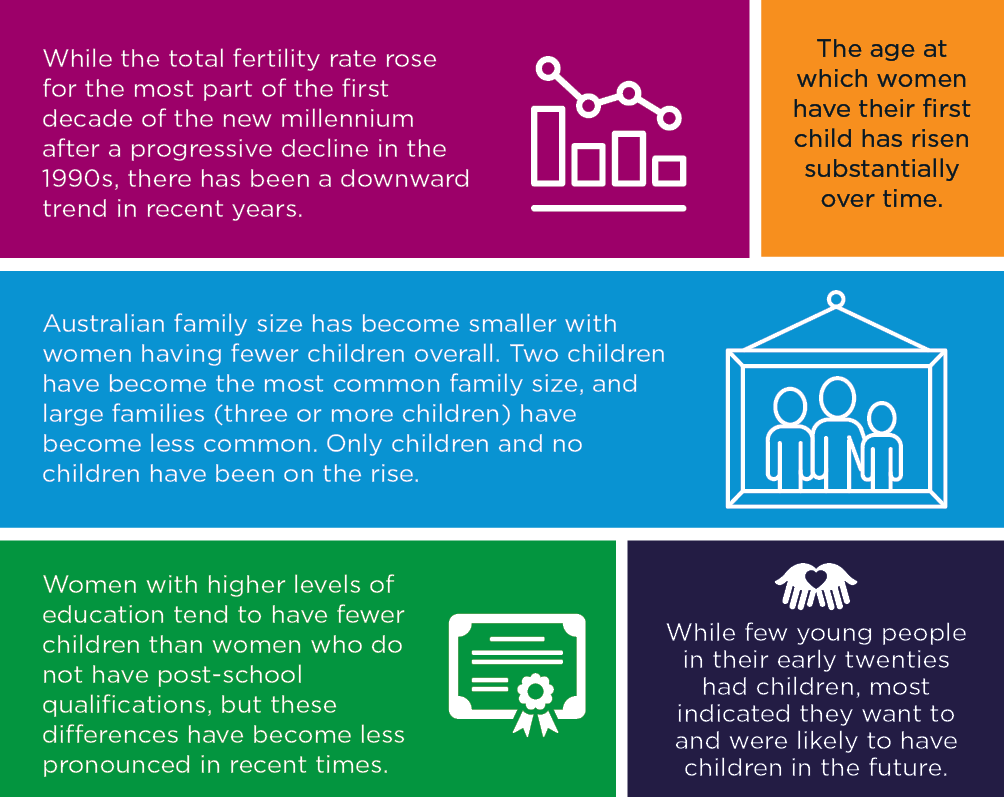
The trends in having children
Fertility trending down
Since 1976, the total fertility rate (babies per woman) has been below replacement level, it fell to 1.89 in 1980.1 After stabilising in the 1980s, the fertility rate then fell in small progressive steps in the 1990s and rose in the 2000s. By 2008, the rate had increased to 2.02, and has since fallen progressively. It was 1.74 in 2018.
Figure 1: Number of births and total fertility rate, 1921-2018

Sources: Australian Bureau of Statistics (ABS) (various years) Births, Australia (Cat. No. 3301.0)
Credit: Australian Institute of Family Studies 2020
The total fertility rate refers to the average number of children each woman would have across her childbearing years if she experiences the prevailing fertility rates observed for women of different ages in that specific year.
Women having children later
Over time there has been a gradual increase in the age of Australian women giving birth to their first child, shown in Figure 2.
- In 1981, most commonly, married women giving birth to their first child were aged in their early twenties (40%). Women in their late twenties represented the second most common age (37%).
- By 2017, it was most common for women to have their first child in their early thirties (33%), followed by late twenties (31%).
- Having a first child during teen years was uncommon across the four time periods presented in the figure.
- The proportion of all new mothers who were in their late thirties has also increased substantially (from 3% in 1981 to 13% in 2017)
- Overall, the proportion of all new mothers who were aged thirty and over increased from 15% in 1981 to 23% in 1991 and 49% in 2017 (Figure 3).
Figure 2: Age of new mothers, 1981-2017

Note: Data for 1981 refer to nuptial births.
Sources: ABS (1983). Births, Australia (Cat. No. 3301.0); Lancaster, Huang, & Pedisich (1994); Laws & Sullivan (2004); Australian Institute of Health and Welfare (AIHW) (2019).
Credit: Australian Institute of Family Studies 2020
Figure 3: Proportion of all new mothers who were aged thirty and over

Credit: Australian Institute of Family Studies 2020
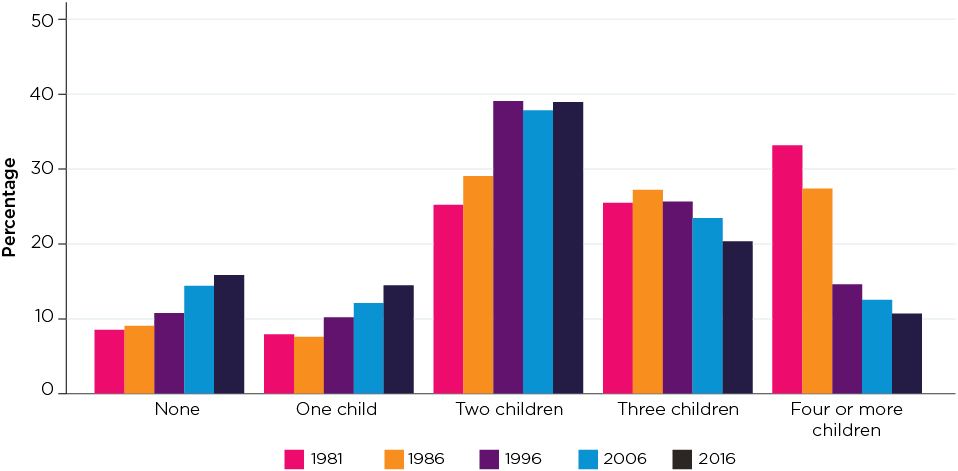
Women having fewer children
Figure 4 shows that, by age 45-49 years, the proportion of women who have had three or more children has fallen considerably since the 1980s. The proportions who have had no children or only one or two children has increased.
- In 1981, women aged 45-49 years were less likely to have had two children and three children (25% each) than four or more children (33%).
- Taken together, women were considerably more likely to have had three or more children than to have had only two children (58% vs 25%).
- By 1996, women of this age were more likely to have two children (39%) than three children (26%) and four or more children (15%). This pattern became more apparent toward the most recent census of 2016.
- The fall in the proportion of women of this age with four or more children was most striking, from 33% in 1981 to 11% in 2016.
- The family size of two children had become the most common by 1996, and this has remained stable since then (38-39%).
- Proportions of women having one child or no children have steadily increased since 1986, from 8% in 1986 to 14% in 2016 for one child, and from 9% in 1986 to 16% in 2016 for no children.
- Taken together, around 30% of women aged 45-49 years in 2016 had one child or no children, compared to 16-17% in 1981 and 1986.
Figure 4: Number of children women aged 45-49 had ever had, 1981-2016
Sources: ABS (1981-2016) Census of Population and Housing
Credit: Australian Institute of Family Studies 2020
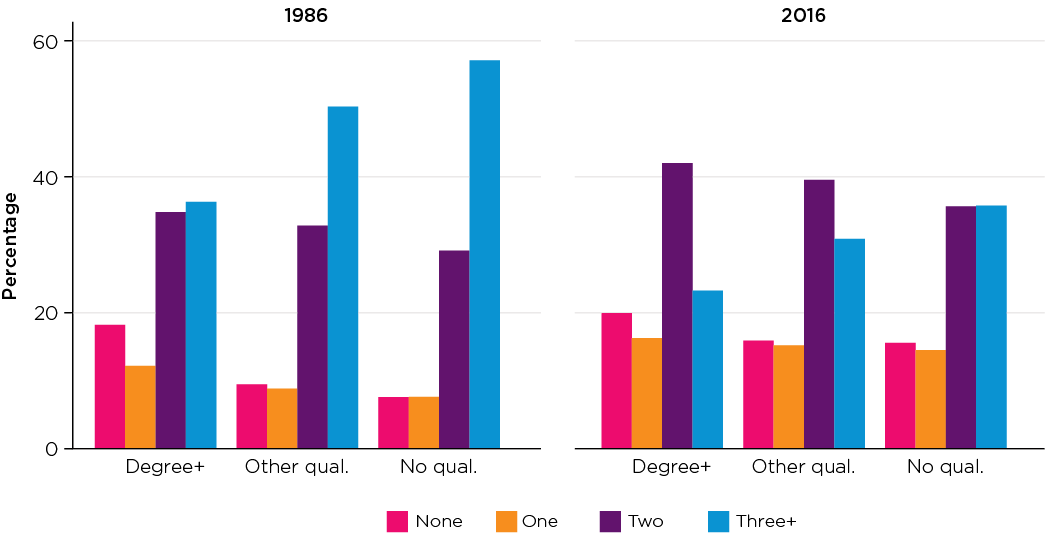
More educated women have fewer children
How many children a woman has is associated with her education level. Figure 5 shows the number of children born to women aged 45-49 years by their education level (i.e. degree or higher, other post-school qualification, and no qualification) in 1986 and 2016.
- In 1986, among women in their late forties, having at least three children was least common for those with a degree or higher (36%) and it was most common among those without a post-school qualification (56%). The proportion having no children was the highest among women in their late forties with a degree or higher qualification (18%) and the lowest among women without any post-school qualification (7%).
- In 2016, the patterns that were apparent in 1986 still applied; however, the differences across three education groups were less pronounced.
- For example, in 2016, 20% of women in their forties with a degree or higher qualification had no children; it was 15% for women of this age without a post-school qualification.
Figure 5: Number of children women aged 45-49 had ever had by education, 1986 and 2016
Sources: 1986 Census 1% Household sample file; 2016 Census, TableBuilder
Credit: Australian Institute of Family Studies 2020
Desire to have children still strong
While the total fertility rate has been at a historically low level, it appears that the desire to have children is strong, as shown in Figure 6. In the Household, Income and Labour Dynamics in Australia (HILDA) Survey, respondents in their childbearing years were asked how much they would want to have a child (or more children if they had any children) in the future, on a rating scale from 0 (definitely not want) to 10 (definitely want). Figure 5 focuses on respondents aged in their early twenties based on the data collected in Wave 18 (2018).
- While only a small proportion of young people in their early twenties had children (3% of men and 9% of women), the majority indicated that they would definitely or very much want to have children in the future.
- 36% of women in their early twenties and 29% of men of this age did not have children but definitely (i.e. rating of 10) wanted to have children in the future.
- Another 31% of women and 38% of men did not have children but indicated they would most likely want to have children (i.e. ratings of 7 to 9).
- Together, a large majority of the 20-24 year olds (70% of men and 76% of women) were either parents or very much wanted to become a parent.
- A very small proportion of the 20-24 year olds (5% of men and 6% of women) were firm that they definitely did not want to have any children. Similar proportions (6% of men and 7% of women) indicated they probably would not become parents.
Figure 6: Ratings of how much wanting a child in the future by gender, people aged 20-24
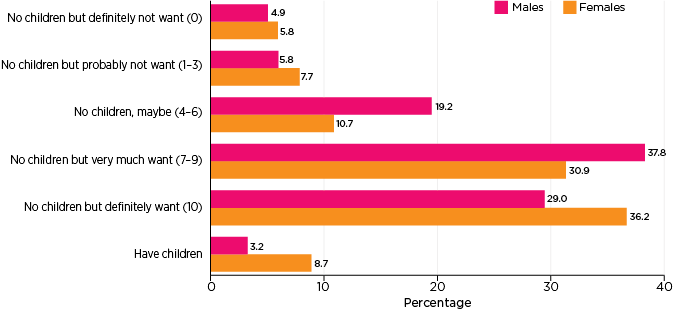
Note: How much respondent wanted to have a child ratings was on a 11-point scale from 0 (definitely not want) to 10 (definitely want). Ratings are shown in brackets.
Source: HILDA Wave 18 (2018)
Credit: Australian Institute of Family Studies 2020
Figure 7 further shows how likely the 20-24 years olds were to become parents, or their expectations regarding having children. The patterns were similar to the responses discussed regarding how much they would want to have children.
- The majority of the 20-24 years old (69% of men and 74% of women) either had children or were likely to become parents.
- 26% of men and 28% of women reported very likely (with rating of 10) to become parents.
- 39% of men and 37% of women did not have children but were likely to become parents.
- Very small proportions (4-6%) did not expect to become parents at all (rating of 0).
Figure 7: Ratings of likelihood to have a child in the future by gender, people aged 20-24
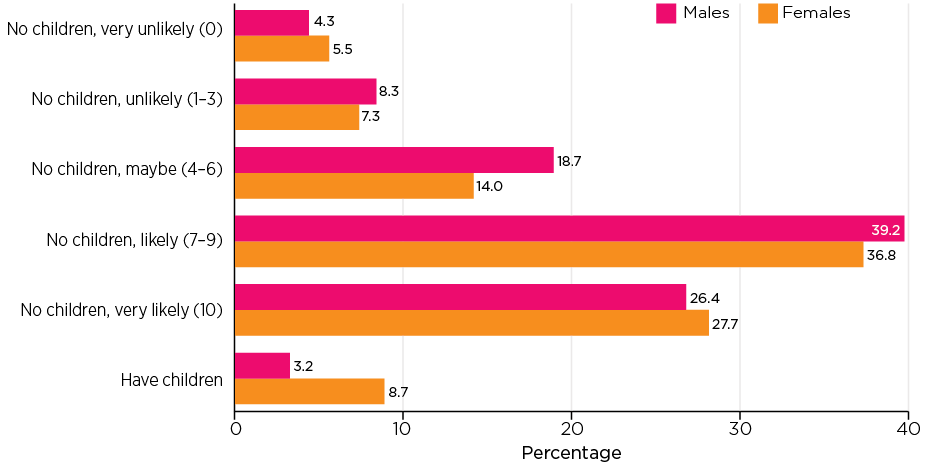
Note: Likelihood to have a child was on an 11-point rating scale (from 0 very unlikely to 10 very likely). Ratings are shown in brackets.
Source: HILDA Wave 18 (2018)
Credit: Australian Institute of Family Studies 2020
References
- Australian Bureau of Statistics (ABS). (various years). Births Australia (Catalogue no. 3301.0). Canberra: ABS.
- Australian Bureau of Statistics. (1983). Census of population and housing, 30 June 1981: Cross-classified characteristics of persons and dwellings Australia (Catalogue No. 2452.0). Canberra: ABS.
- Australian Bureau of Statistics. (1989). Census of population and housing, 30 June 1986: Cross-classified characteristics of persons and dwellings Australia (Catalogue No. 2498.0). Canberra: ABS.
- Australian Bureau of Statistics (2007). 2006 Census Community Profile Series T07: Number of children ever born by age of female for time series (Catalogue no. 2003.0). Canberra: ABS. Retrieved from quickstats.censusdata.abs.gov.au/census_services/getproduct/census/2006/communityprofile/0?opendocument
- Australian Bureau of Statistics. (2017). 2016 Census of Population and Housing - General community profile G24: Number of children ever born (Catalogue no. 2001.0). Canberra: ABS. Retrieved from quickstats.censusdata.abs.gov.au/census_services/getproduct/census/2016/communityprofile/036?opendocument
- Australian Bureau of Statistics. (2018). 2016 Census of population and housing, TableBuilder. Findings based on use of ABS TableBuilder data.
- Australian Bureau Of Statistics. (2019). Births Australia (Catalogue no. 3301.0). Canberra: ABS.
- Australian Institute of Health and Welfare (AIHW). (2019). Australia's mothers and babies 2017 - in brief (Data tables). Canberra: AIHW.
- Lancaster, P., Huang, J., & Pedisich, E. (1994). Australia's mothers and babies 1991 (Perinatal statistics series no.1). Canberra: AIHW.
- Laws, P. J., & Sullivan, E. A.(2004). Australia's mothers and babies 2001(Perinatal statistics series no. 13). Canberra: AIHW.
1 The total fertility level required to replace one generation with the next. It is about 2.1 in Australia (ABS, 2019).
The HILDA project was initiated and is funded by the Australian Government Department of Social Services (DSS) and is managed by the Melbourne Institute of Applied Economic and Social Research. The findings and views based on these data are those of the authors and should not be attributed to either DSS or the Melbourne Institute.
Featured images: © GettyImages/Marco_Piunti
19 July 2020