Families Then & Now: Housing

Many changes have occurred in Australia since the establishment of the Australian Institute of Family Studies in 1980. This snapshot outlines some of the changes in the housing arrangements of Australian families during this time.
Key trends
The trends in housing
Fewer people own their home outright
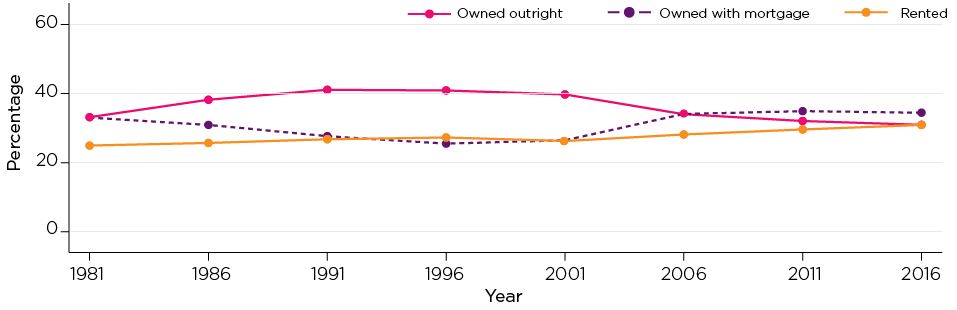
- Figure 1 shows that the proportion of households who owned their residence outright increased from 33% in 1981 to 41% in 1991 but has declined since 2001. The proportion was 31% in 2016.
- The proportion of households who owned their residence with a mortgage (i.e. purchasing) fell from 33% in 1991 to 26% in 1996 and has risen since 2001. By 2016, 34% of households were purchasing their own home.
- Together, the proportion of households owning their home either outright or with a mortgage increased from 66% in 1981 to 69% in 1991 but fell to 65% in 2016.
- The proportion of households renting their home increased from 25% in 1981 to 27% in 1991 and then remained stable until 2001. Since 2001, the proportion rose again and was 31% by 2016.1
Figure 1: Housing tenure, 1981-2016
Sources: Australian Bureau of Statistics (ABS) (various years) Censuses
Credit: Australian Institute of Family Studies 2020
Single parents more likely to rent
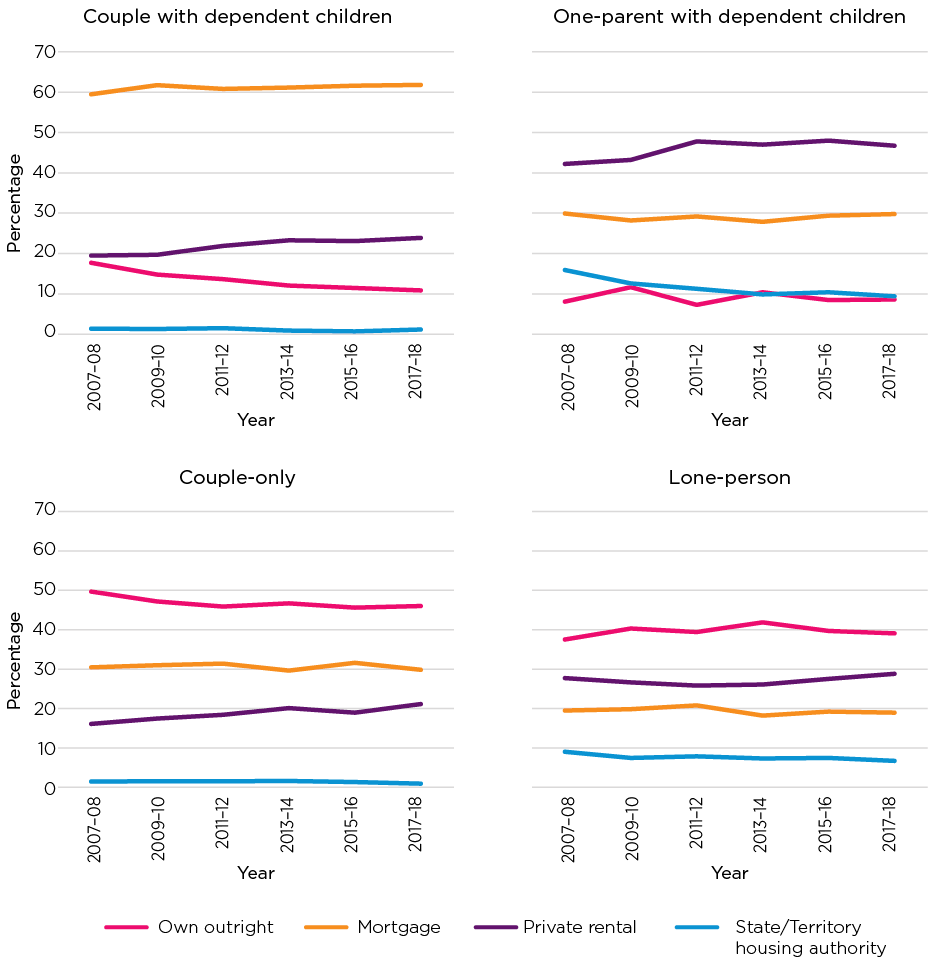
Figure 2 shows housing tenure according to four household types over a 10-year period from 2007-08 to 2017-18: couples with dependent children, one parent with dependent children, couples only and lone persons.
- Over the past decade, the percentage of couples with children who were paying off a mortgage remained quite stable, at around 60%.
- However, the percentage of couples with children who owned their home outright dropped from 20% in 2007-08 to 11% in 2017-18, and private rentals increased from 20% to 24%.
- Compared to couples with children, a much higher percentage of single-parent families were renting their home.
- The proportion of single-parent households that were renting increased from 42% in 2007-08 to 47% in 2017-18 while the proportion of single-parent households that were in public housing declined. The percentage of single parents who were paying off a mortgage remained quite stable, at around 30% over the last 10 years, and only around 10% of single parents owned their home outright.
- The percentage of couple-only households who owned their home outright has dropped slightly, from 50% in 2007-08 to 46% in 2017-18.
- The high percentage of home ownership among couple-only households is because this group includes older couples, many of who purchased their home some time ago, and have since paid off their mortgage.
- Around 40% of lone-person households owned their homes outright, and this pattern has remained quite steady over the last decade.
Figure 2: Housing tenure, by household type, 2007-08 to 2017-18
Source: ABS (various years) 4130.0 - Housing Occupancy and Costs, 2007-08 to 2017-18
Credit: Australian Institute of Family Studies 2020
Young people much less likely to own a home
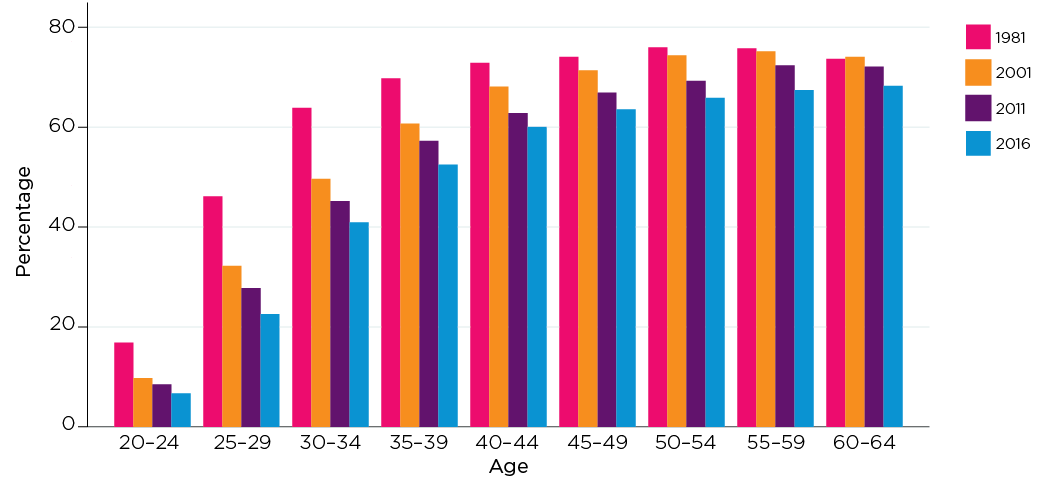
Figure 3 shows home ownership (either owned outright or purchasing) among people living in private dwellings by age group in selected census years from 1981 to 2016.
- Across all the years depicted in the figure, the proportion of people who owned their own home without or with a mortgage increased with age.
- The proportions of individuals who owned or were purchasing their home declined across all age groups between 1981 and 2016.
- The fall in home ownership was particularly marked among younger age groups. For example, the proportion of people in their early 30s who owned their home with or without a mortgage fell by 23 percentage points, from 64% in 1981 to 41% in 2016. By contrast, home ownership for people in their early 50s fell by 10 percentage points, from 76% in 1981 to 66% 2016.
Figure 3: Proportion of people who owned their home without or with a mortgage by age, selected years 1981-2016
Notes: If a dwelling was owned or being purchased, the household reference person and their partner (if they were living with a partner) were considered to be owning or purchasing the dwelling. Other household members were treated as not owning/purchasing the home in which they lived.
Sources: ABS (1981-2016) 1% Census household sample files
Credit: Australian Institute of Family Studies 2020
Most families live in a standalone house
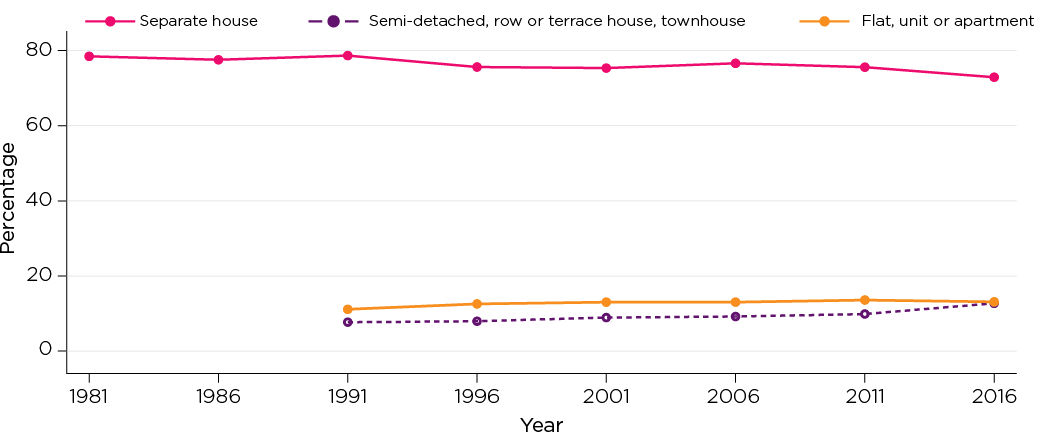
Data from the 2016 Census show that while separate houses still account for most homes in Australia (72%), there has been an increase in other forms of dwelling (as shown in Figure 4). By 2016, higher density residential development, such as flats, units, apartments, townhouses and semi-detached homes, made up 26% of all Australian housing (ABS, 2017).
Figure 4: Type of occupied dwellings, 1981-2016
Sources: ABS (various years) Censuses
Credit: Australian Institute of Family Studies 2020
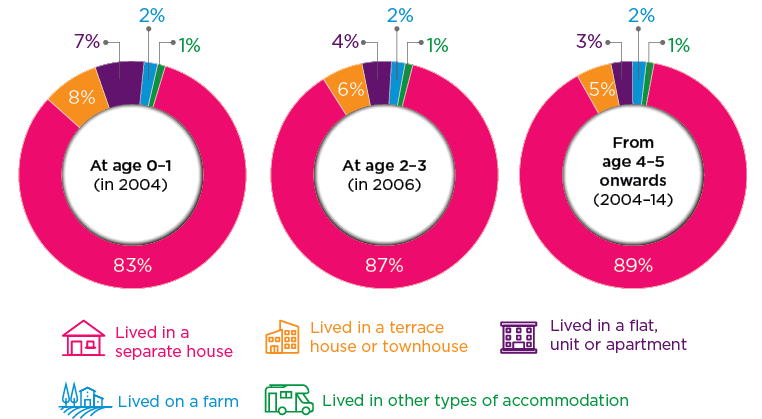
Data from the Longitudinal Study of Australian Children (LSAC) show that most children live in a separate (detached) house (Figure 5). In 2004, when the LSAC (B cohort) children were babies, 83% lived in a detached house. By age 2-3 years, 87% were living in a detached house; and from age 4-5 years onwards, the overall percentage of LSAC study children living in each type of housing remained very stable, with almost 90% living in a separate house (Warren, 2018). This is likely to be because of a preference among families for more living space, while single people and couples without children have a stronger preference for medium- and high-density housing.
Figure 5: Types of housing, Australian children
Credit: Australian Institute of Family Studies 2020
Less home ownership, higher housing costs
The cost of buying a house has increased substantially over the last two decades. By 2017-18, half of all Australian dwellings had a value of over $600,000, and among those who had a mortgage, half had a mortgage debt of at least $260,000 (Figure 6).
Figure 6: Dwelling and mortgage values (medians), 1994-95 to 2017-18
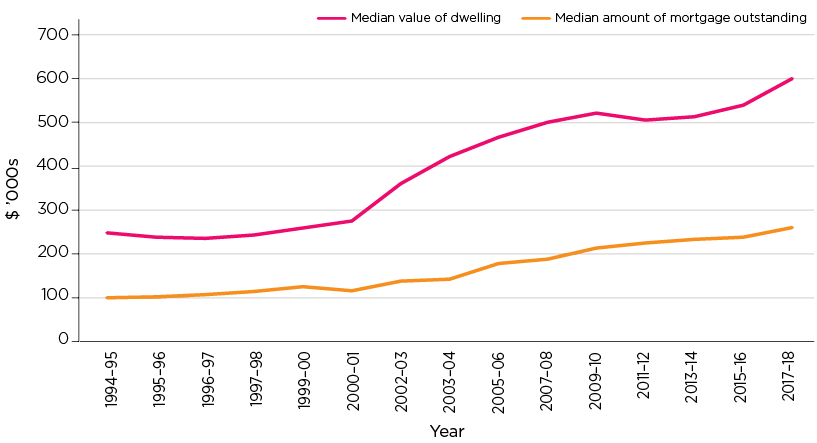
Note: Values adjusted for inflation to 2017-18 prices.
Source: ABS (2019) 4130.0 - Housing Occupancy and Costs, 2017-18
Credit: Australian Institute of Family Studies 2020
With the increase in housing prices, rent and mortgage payments have also increased considerably (Figure 7). For households paying off a mortgage, the average weekly payment was quite stable in the late 1990s, before increasing substantially between 2000 and 2008, in line with the increase in the value of dwellings. Average rent has also increased from (the 2017-18 equivalent of) $250 per week in 1994-95 to $399 per week in 2017-18.
Figure 7: Average weekly housing costs, 1994-95 to 2017-18
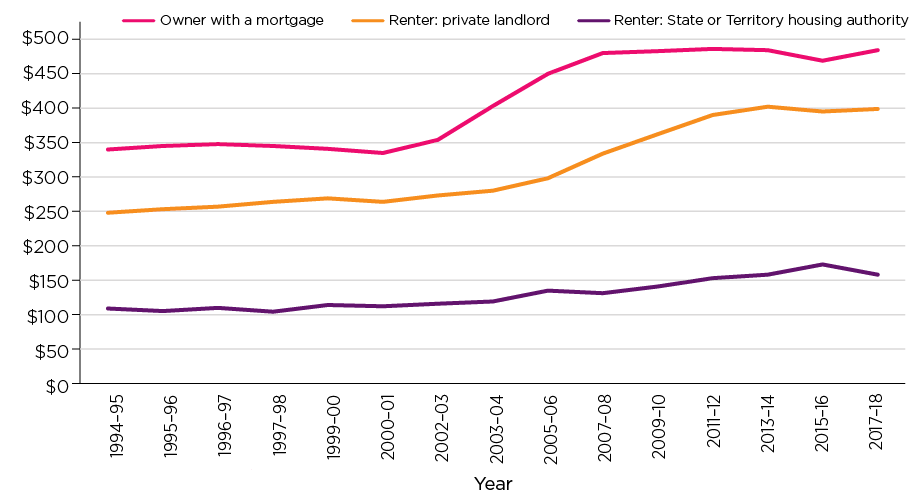
Note: Values adjusted for inflation to 2017-18 prices.
Source: ABS (2019) 4130.0 - Housing Occupancy and Costs, 2017-18
Credit: Australian Institute of Family Studies 2020
More room for children, higher housing costs
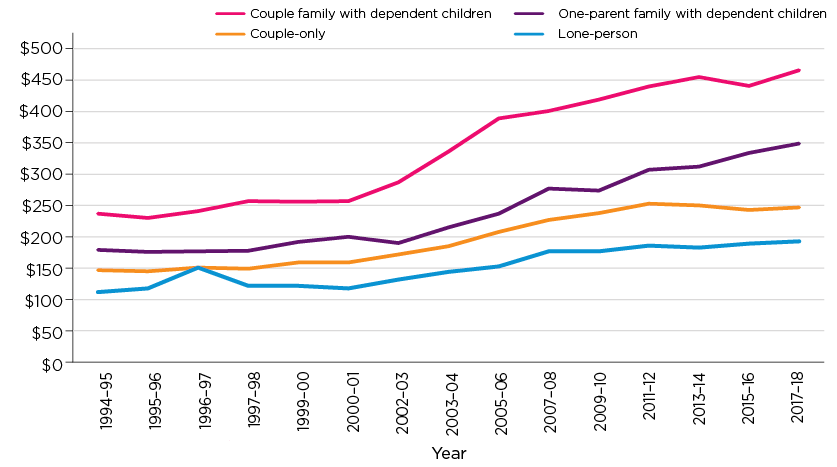
Figure 8 shows the average weekly housing costs for households of couples with dependent children, single parents with dependent children, couples only and lone persons. As a relatively high proportion of couples with dependent children were paying off a mortgage, average housing costs were higher for this family type than for single-parent households, where renting was more common.
Couple-only households and lone-person households had lower weekly housing costs, on average, than families with children. This is partly because one- or two-person households require fewer bedrooms than families with children, and also because these household types include older couples and individuals who purchased a home some time ago, and therefore have lower levels of mortgage debt (or own their home outright).
Figure 8: Average weekly housing costs, by household type, 1994-95 to 2017-18
Note: Values adjusted for inflation to 2017-18 prices.
Source: ABS (2019) 4130.0 - Housing Occupancy and Costs, 2017-18
Credit: Australian Institute of Family Studies 2020
Overall, the percentage of households that spent at least 30% of their gross household income on housing has increased from 14% of households in 1994-95 to 17% in 2017-18. While couples with children have the highest average housing costs, single-parent families spend a higher percentage of their income on housing. In 2017-18, single-parent families with dependent children spent 24% of their income on housing, on average, while couples with dependent children spent an average of 14% of their gross household income (Figure 9).
Figure 9: Housing costs as a percentage of gross household income (mean), 1994-95 to 2017-18

Source: ABS (2019) 4130.0 - Housing Occupancy and Costs, 2017-18
Credit: Australian Institute of Family Studies 2020
References
- Australian Bureau of Statistics (ABS). (various years). 4130.0 - Housing occupancy and costs, 2007-08 to 2017-18. Canberra: ABS.
- Australian Bureau of Statistics. (1983). 1981 Census household sample file (1%) - Confidentialised unit record file. Findings based on use of ABS Microdata. Canberra: ABS.
- Australian Bureau of Statistics. (1983). 1981 Census of population and housing - cross-classified characteristics of persons and dwellings (Cat no. 2452.0). Canberra: ABS.
- Australian Bureau of Statistics. (1989). 1986 Census of population and housing - summary characteristics of persons and dwellings (Cat no. 2485.0). Canberra: ABS.
- Australian Bureau of Statistics. (1993). 1991 Census of population and housing - Census characteristics of Australia (Cat no. 2710.0). Canberra: ABS.
- Australian Bureau of Statistics. (1994). 1991 Census household sample file (1%) - Confidentialised unit record file. Findings based on use of ABS Microdata. Canberra: ABS.
- Australian Bureau of Statistics. (2000). 1996 Census of population and housing - Basic community profile (Cat no. 2001.0) (Table: B14 Dwelling structure by tenure type). Canberra: ABS. Retrieved from quickstats.censusdata.abs.gov.au/census_services/getproduct/census/1996/communityprofile/0?opendocument&navpos=230
- Australian Bureau of Statistics. (2002). 2001 Census of population and housing - Basic community profile (Cat no. 2001.0) (Table: B18 Dwelling structure; B19 Dwelling structure by tenure type and landlord type). Canberra: ABS. Retrieved from quickstats.censusdata.abs.gov.au/census_services/getproduct/census/2001/communityprofile/0?opendocument
- Australian Bureau of Statistics. (2003). 2001 Census household sample file (1%) - Confidentialised unit record file. Findings based on use of ABS Microdata. Canberra: ABS.
- Australian Bureau of Statistics. (2007). 2006 Census of population and housing - Basic community profile (Cat no. 2001.0) (Table: B31 dwelling structure). Canberra: ABS. Retrieved from quickstats.censusdata.abs.gov.au/census_services/getproduct/census/2006/communityprofile/0?opendocument
- Australian Bureau of Statistics. (2012). 2011 Census of population and housing - Basic community profile (Cat no. 2001.0) (Table: B32 Tenure and landlord type by dwelling structure). Canberra: ABS. Retrieved from quickstats.censusdata.abs.gov.au/census_services/getproduct/census/2011/communityprofile/0?opendocument
- Australian Bureau of Statistics. (2013). 2011 Census household sample file (1%) - Confidentialised unit record file. Findings based on use of ABS Microdata. Canberra: ABS.
- Australian Bureau of Statistics. (2017). 2016 Census of population and housing - General community profile (Cat no. 2001.0) (Table: G32 Dwelling structure). Canberra: ABS. Retrieved from quickstats.censusdata.abs.gov.au/census_services/getproduct/census/2016/communityprofile/036?opendocument
- Australian Bureau of Statistics. (2019). 2016 Census household sample file (1%) - Confidentialised unit record file. Findings based on use of ABS Microdata. Canberra: ABS.
- Australian Bureau of Statistics. (2019). 4130.0 - Housing occupancy and costs, 2017-18. Canberra: ABS.
- Warren, D. (2018). Children's Housing Experiences. In Australian Institute of Family Studies (Ed.), Growing Up in Australia: The Longitudinal Study of Australian Children Annual Statistical Report 2017. Melbourne: Australian Institute of Family Studies.
1 Other housing types including 'Not Stated' were included in the total but the data were not shown in the figure.
Featured image: © GettyImages/Zarnell
14 July 2020