Gambling activity in Australia
Findings from wave 15 of the Household, Income and Labour Dynamics in Australia (HILDA) Survey
Executive Summary
This report provides an overview of gambling activity in Australia in 2015, with respect to participation, expenditure, and problems among regular gamblers. The report follows a format and style common to gambling prevalence studies conducted in Australia and elsewhere.
As with those studies, the report is intended as a reference document. It is written primarily for researchers and government officials who have an interest in Australian gambling statistics. This report makes a unique contribution to knowledge of gambling in Australia, since Australia has no prior history of surveying and reporting on gambling activity among regular gamblers at the national level.
The content consists primarily of descriptive statistics with a focus on population estimates. The statistics were obtained from cross-sectional analysis of Household, Income and Labour Dynamics in Australia (HILDA) Survey data, wave 15, which is the first wave to include gambling questions. The HILDA Survey was designed so that participants' responses (17,606 participants in wave 15) could be generalised to the Australian adult population.
The participation statistics include population-representative estimates of the proportion and number of Australians who spent money on up to ten common gambling activities (lotteries, instant scratch tickets, electronic gaming machines, race betting, sports betting, keno, casino table games, bingo, private betting and poker) in a typical month of 2015. The report refers almost entirely to these gamblers, which we refer to as regular gamblers.
Chapter 1 of this report provides the background to the study and details regarding study design and methodology. Chapters 2 and 3 respectively provide statistics regarding typical gambling participation and expenditure. Chapters 4 and 5 address participation and expenditure among adults who experienced gambling-related problems. In Chapter 6 gambling expenditure is positioned within the household budgets of low, middle and high-income households. As well, rates of financial stress are compared between households that contain members with and without gambling problems. Additional tables, including a comparison of the HILDA Survey gambling statistics with recent state/territory and national prevalence data and industry revenue data, can be found in the Appendices.
The report identifies an estimated 6.8 million regular gamblers in 2015, among whom lottery participation was very common (76%). Instant scratch tickets (22%) and electronic gaming machines (EGMs; 21%) followed, attracting 1.4 to 1.5 million gamblers. Less than a million gambled regularly on anything else, including racing (14%), sports betting (8%), keno (8%), casino table games (3%), bingo (3%), private betting (2%) and poker (2%). It was common for people to participate either solely in lotteries (59%), or a combination of lotteries and up to two additional activities.
While lotteries and instant scratch tickets were the most popular activities, individual gamblers spent comparatively little on these activities in a typical month, and therefore over the entirety of the year ($695 and $248 per year on average). Those who gambled on Electronic Gaming Machines spent a great deal more per year ($1,292 on average). So too did those who regularly gambled on races ($1,308), sports ($1,032), casino table games ($1,369), and particularly poker ($1,758).
Regular gamblers, viewed by activity, have quite different profiles. For example, compared to the Australian population:
- lottery participants were over-represented among older couples living without children;
- EGM participants were over-represented among people for whom welfare payments formed their main source of income;
- bingo participants were over-represented among retired women living alone;
- regular race or sports bettors were over-represented among men on higher incomes, yet the race bettors were more likely to be older and live in outer regional/remote areas; and
- sports bettors were more likely to be younger and live in an inner-regional area or major city.
Gambling problems are indicated in the HILDA Survey by endorsing one or more items on the Problem Gambling Severity Index (PGSI). According to the standard use of the PGSI, 1.1 million regular gamblers were estimated to have behaved in ways that caused or put them at risk of gambling-related problems.
Among this subset of regular gamblers, there were more sociodemographic similarities than differences. Those who experienced problems were generally more likely to be young, single, unemployed or not employed (excluding retirees and full-time students), Indigenous, men, living in rental accommodation, in a low socioeconomic area, and were more likely to draw their income from welfare payments than those who had no problems.
Those with problems were also more likely to participate regularly in certain activities. This led to rates of problems being particularly high among participants in six activities (EGMs, race betting, sports betting, casino table games, private betting, and poker) with almost 1-in-2 gamblers on any of these activities experiencing one or more issues.
Another thing those with problems had in common was higher than average spending on gambling. This was particularly so among EGM, race and sports betting participants. Those experiencing the greatest problems spent more than four times as much on these activities, and on gambling overall, as those without problems. Well over half of all expenditure by regular gamblers on these activities came from people who had problems.
Overall, more than forty percent of gambling expenditure by regular gamblers, aggregated across all activities, was accounted for by the 17% who experienced problems.
Gambling expenditure has significant financial ramifications for low-income households, particularly among households where gamblers experienced problems. Gamblers living in low-income households spent a much greater proportion of their household's total disposable income on gambling than high-income households (10% vs 1% on average) - this despite spending less in actual dollar terms ($1,662 vs $2,387).
Gamblers who had problems spent much more of their households' income on gambling than other regular gamblers, with those experiencing severe problems in low-income households spending an average 27% of their disposable household income on gambling - equivalent to four times their yearly household utility bills, or more than half the grocery bills for that income group.
Consistent with these patterns of expenditure, the households of those with gambling problems had a much greater proportion of stressful financial events. Inability to pay electricity, gas or telephone bills on time, and needing to ask friends or family for financial help, were common occurrences.
Future waves of the HILDA Survey will provide nationally representative longitudinal data with which to measure changes in gambling activity and effects on individuals and their households.
Glossary
| Term | Description |
|---|---|
| Bingo | A game in which players mark off numbers on cards as the numbers are drawn randomly, the winner being the first person to mark off all their numbers. |
| Casino table games | Casino games played at a table including roulette, craps and card games such as black jack and baccarat. Tables games usually involve a dealer and participants wager on the outcome of the game. |
| Expenditure (participant net loss / operator gross profit) | The net amount spent/lost or, in other words, the amount wagered less the amount won, by people who gamble. Conversely, by definition, it is gross profit (or gross winnings) due to the operators of each particular gambling activity. |
| Electronic Gaming Machines (EGMs) | Also known as "slots', "pokies', "poker machines" and "fruit machines'. EGMs usually have three or more computer-simulated reels which "spin" when a button is pushed. When winning symbols line up a prize is awarded. |
| Equivalised household disposable income | The total income of a household, after personal income tax and Medicare levy deductions, that is available for spending or saving, divided by the number of household members converted into equalised adults using the OECD equivalence scale. |
| Household composition | Single adult household (one adult aged 15 or more); Couple only household (2 persons aged 15+ who identify as a couple), Household with children (one or more adults aged 15+ living with one or more children aged less than 15); Multiple adult household (2 or more persons aged 15+, excluding couple only households). |
| Household income quintile | Households grouped according to total household income, from lowest to highest, with approximately 20% of households in each group. |
| Gambling | The placement of a wager or bet on the outcome of a future uncertain event. Participation may occur online or offline. The statistics presented in this publication include but are not limited to legalised regulated gambling activities operated by Australian businesses. They include for instance, private betting and in-play sports betting on offshore sites. |
| Gambling problems | Gambling problems are indicated by endorsing one or more items on the Problem Gambling Severity Index. The items include gambling behaviours that either caused or put people at risk of problems. |
| Grocery expenditure | Total household expenditure on food, cleaning products, pet food and personal care products. Does not include alcohol or tobacco. |
| Instant scratch tickets | Commonly known as "scratchies", where a player scratches a coating off the ticket to identify whether the ticket is a winner. |
| Keno | Keno is a rapid-draw game where a player gambles that their chosen numbers match any of the 20 numbers randomly selected from a group of 80 numbers via a computer system or a ball-draw device. |
| Lotto or lottery games | Common lotto or lottery games include Tattslotto, Gold Lotto, Lotto, X-Lotto and Powerball. Lotto is a game where a player selects any six numbers from 1 to 45 in anticipation that those numbers will be among eight numbered balls, randomly drawn from a ball-draw device containing 45 balls numbered from 1 to 45. The first six of the eight balls drawn are known as the "winning numbers" and the last two balls are called "supplementary numbers". Lotteries may also include less defined activities which broadly involve the purchase of a ticket, a draw and a prize. |
| Private betting | This may include unregulated informal betting on games such as cards or mah-jong, or other agreed-upon outcomes, often with friends or family. |
| Poker | Poker refers to a group of card games in which the winner of each hand is determined according to the combinations of players' cards, at least some of which remain hidden until the end of the hand. |
| Race betting | Wagering on the outcome of horse and greyhound races, excluding all sweeps. |
| Regular gamblers | Adults who spent money on one or more gambling activities in a typical month of 2015. |
| SEIFA | Socio-Economic Indexes for Areas (SEIFA) ranks areas in Australia according to relative socio-economic advantage and disadvantage. The indexes are based on information from the five-yearly Census. |
| Sports betting | Wagering on local, national or international sporting activities (other than horse and greyhound racing). |
| Significant difference (statistical) | A difference that is highly unlikely due to chance. |
| Utility expenditure | Total household expenditure on electricity bills, gas bills and other heating fuel such as firewood and heating oil. Does not include water, telephone or internet bills. |
| Weighted data | Data collected from survey participants are adjusted to represent the population from which the sample was drawn. For instance, data from the 17,606 wave 15 HILDA Survey participants are adjusted so that together they represent the total population of Australia. |
Key Findings
Chapter 2: Participation
- According to population estimates from the HILDA Survey, 6.8 million or 39% of Australian adults gambled in a typical month of 2015. They are referred to here as regular gamblers.
- Among the 6.8 million gamblers, participation in lotteries was most common (76%), followed by instant scratch tickets (22%) and electronic gaming machines (EGMs) (21%).
- Compared to the Australian adult population, regular gambling participants were substantially over-represented among males (i.e., 54% of gamblers were males versus 49% of Australian adults), people aged 50 and older, those who had ten years or less schooling or had completed a certificate/diploma, people who were retired, who lived alone or with their partner and no others, who lived outside a major city, and those who drew on welfare as their main source of income.
- There were wide-ranging sociodemographic differences between those who gambled regularly on each activity and the Australian adult population.
Chapter 3: Expenditure
- Typical monthly expenditure by the 6.8 million regular gamblers amounted to an estimated $8.6 billion dollars nationally for 2015. Lotteries (42%), EGMs (21%) and race betting (15%) accounted for most of this.
- Regular gamblers' average past-year expenditure was an estimated $1,272. Poker participants recorded the highest mean product expenditure ($1,785) and instant scratch tickets the lowest ($248).
- Gamblers generally spent around half their overall gambling outlay on a single product. Lotteries (79%) and keno (32%) were exceptions, accounting for substantially more and less of their respective participants' overall outlays.
- Mean expenditure was significantly higher than average among gamblers who were male, had completed schooling no further than year 10, were employed full-time, single, and lived with multiple adults. It was lower among gamblers who had a university degree, and lived in a house with children.
Chapter 4: Gambling problems and participation
- As measured using the PGSI, an estimated 7.9% or 1.39 million Australian adults had experienced one or more gambling-related problems in 2015. That is, their gambling behaviour caused or put them at risk of gambling problems. This included 1% or 193,000 who could be classified as "problem gamblers" - the most severe category.
- 80% of those who had experienced problems in the past year had gambled in a typical month of 2015
(i.e., regularly). - Much higher proportions of low-risk, moderate-risk and problem gamblers participated in EGMs, race betting, and sports betting, compared to non-problem gamblers. Problem gamblers also had much higher participation rates than any other group in casino table games (20%), poker (20%), and private betting (13%).
- Compared to non-problem gamblers, those who experienced problems were over-represented among people who were male, aged 18 to 29, Indigenous, were unemployed, or not employed (excluding students and retirees), single, renting, lived in a low socioeconomic area, had a low income, and drew their main source of income from welfare payments. They were under-represented among those who owned their own home, retirees, university graduates, and those who drew their main source of income from superannuation or investments.
Chapter 5: Gambling problems and expenditure
- Gamblers who had problems (i.e., the combined low-risk, moderate-risk and problem gamblers), representing 17% of regular gamblers, accounted for nearly half of all expenditure by regular gamblers in 2015 ($3.63b or 42%), and more than half of all expenditure by regular gamblers across EGMs, race betting, sports betting, casino table games and private betting (59-69%).
- Regular gamblers' mean expenditure was higher among adults in higher risk groups. Non-problem gamblers averaged $883 over the year whereas problem gamblers averaged $6,241.
- The strength of the relationship between expenditure and gambler risk status varied markedly across products. Lottery, keno and instant scratch ticket expenditure had the weakest connection. Race betting, EGMs and particularly sports betting expenditure had the strongest.
- Higher risk gamblers were likely to spend more on gambling overall, and spread their outlay over a range of activities rather than a single activity. Lower risk gamblers spent less overall and on fewer products.
Chapter 6: Gambling and the household budget
- Gamblers living in low-income households spent, on average, a much greater proportion of their household's total disposable income on gambling than high-income households (10% vs 1%) - this despite spending less in actual dollar terms ($1,662 vs $2,387).
- Higher risk gamblers spent greater proportions of their household's disposable income on gambling. Problem gamblers in low income households spent the greatest proportion (27%) - equivalent to four times the average yearly household utility bills, and more than half the grocery bills, of that income group.
- Households containing higher risk gamblers experienced a much larger proportion of stressful financial events than those containing non-problem gamblers. The most common were an inability to pay electricity, gas or telephone bills on time, and needing to ask friends or family for financial help.
1. Introduction
Background
Gambling is a common activity in Australia. Most adults participate at least once a year. The most recent gambling surveys put the national annual participation rate at around 64% (Dowling et al., 2016; Hing et al., 2014) and between 55-74% across the states and territories (Office of Economic and Statistical Research, 2012; Davidson et al., 2016; The Social Research Centre, 2013; Stevens et al., 2017; Sproston et al., 2012; ACIL Allen Consulting et al., 2014; Hare, 2015).
The gambling activities that Australians prefer are changing. Compared to two decades ago, far fewer now participate in activities that emphasise chance, including lotteries, scratch tickets, keno and Electronic Gaming Machines (EGMs). Much greater numbers now participate in activities that emphasise skill and experience in predicting the outcome, including some casino table games, horse and dog racing and especially sports (Armstrong et al. 2017).
The amount spent is substantial. In 2014/15, Australians gambled $191 billion and lost $22.7 billion across the range of available activities. This equates to $1,242 spent for every person aged 18 and over (Queensland Government Statistician's Office, 2016).
It means that, per capita, Australian adults are the largest spenders on gambling in the world, at around double the average of other Western countries (The Economist online, 2014, 2011, 2017).
Many see and experience gambling as a form of leisure and recreation. However, gambling can have serious repercussions for individuals, their families and society as a whole (Abbott et al., 2015). Between 5-12% of Australians are estimated to experience one or more gambling problems annually (Dowling et al., 2015; Hing et al., 2014), with rates ranging similarly widely across the states and territories (Office of Economic and Statistical Research, 2012; Davidson et al., 2016; The Social Research Centre, 2013; Stevens et al., 2017; Sproston et al., 2012; ACIL Allen Consulting et al., 2014; Hare, 2015). The burden of harm associated with these problems has been estimated to be of a similar magnitude to depressive disorder and alcohol misuse and dependence (Browne et al., 2016).
While numerous cross-sectional state/territory and some national gambling surveys have been performed, there was until recently no ongoing population-level survey of Australian gambling activity and the socio-economic characteristics of gamblers and their families. Longitudinal data with which to measure change over time in gambling activity and effects on individuals and families was similarly absent.
Inclusion of a gambling activity module within the Household, Income and Labour Dynamics in Australia survey (HILDA) is intended to address this need. HILDA is a nationally representative longitudinal panel study of Australian households which commenced in 2001. It provides data on a wide range of aspects of life around family dynamics, economic and subjective well-being and labour market dynamics.
Gambling questions were included for the first time in wave 15, connecting gambling activity in 2015 to these broad areas of life. The module comprises two components. The first measures the amount of expenditure on 10 different gambling activities during a "typical month"1. The focus on a "typical month" ensures the focus is on regular gambling, and thus effectively excludes the occasional or once-off expenditure.
The second component comprises the Problem Gambling Severity Index (PGSI; Ferris & Wynne, 2001) This includes nine questions used to identify people whose gambling behaviour caused them problems or put them at risk of problems, on a continuum of increasing severity.
The 12th annual statistical report of the HILDA Survey (Wooden and Wilkens, 2017) presented some initial findings in the chapter dedicated to gambling. They found that 39% of Australian adults participated in gambling activities in a typical month, with an average expenditure of $115 per month. As with previous studies, the HILDA Survey shows males are not only more likely to gamble, but they spend more on average and are more likely to experience gambling-related problems. While lottery was the most common activity, problem gambling is more common among participants in poker, electronic gaming machine users, and race and sports bettors. Most notably, while higher income and full-time employment were significant indicators of participation in gambling and of higher expenditure, it is the unemployed who are at greatest risk of developing problem gambling behaviours.
The intention of this report is to build on this work and provide a more detailed overview of gambling activity in Australia in 2015, in terms of participation, expenditure, and gambling problems among regular gamblers, as drawn from the HILDA self-report survey. The report follows a format and style common to gambling prevalence studies conducted in Australia and elsewhere. As with those studies, the report is intended as a reference document. It is written primarily for researchers and government officials who have an interest in Australian gambling statistics.
Overview of study design
Sample and response
The HILDA Survey commenced in 2001 with a nationally-representative sample of Australian households (residents in private dwellings).2 Wave 1 included 11,693 households, sampled from 488 areas across Australia, with members of 7,682 households, or 13,969 individuals, completing interviews. In wave 11 (2011), the sample was topped up with an additional 2,153 households (5,477 individuals) to address the issue of recent arrivals to Australia being under-represented in the HILDA sample.
This report focuses on data from the wave 15 survey which included a gambling question module for the first time. The fieldwork for wave 15 occurred between 28 July 2015 and 7 February 2016, with 98% of fieldwork completed by 31 December 2015. Wave 15 comprised 8,865 fully responding or 9,631 fully and partially responding households, comprising 17,606 responding individuals.
The gambling module formed part of the Self-Completion Questionnaire (SCQ), a paper form administered to every member of each household aged 15 years and over. The SCQ includes questions the respondents may prefer to not disclose in the presence of an interviewer or other household members. The response rate for these was 88%, with 15,245 persons responding to the gambling module.3
Gambling module
The gambling module consisted of two components relating to participation and problems. Participants were first asked whether they spent money on 10 gambling activities in a typical month, and roughly how much on average they spent on each (Table 1.1). Respondents were considered to be "activity participants" if they responded "yes" to the question of whether they spent money on the activity, even if their expenditure estimate was missing. However, only those with valid expenditure responses were included in expenditure calculations. Missing responses for "any expenditure in a typical month" on a given activity were coded to "no" for those participants who had replied "yes" to other activities. Participants with missing responses on all gambling expenditure questions were excluded from analysis.
In a typical month, roughly how much do you spend on the following activities? This includes money spent on-line (on a computer, mobile/smart phone, iPad etc.). If you are unsure, please make your best guess.
| Any expenditure on a typical month? | How much per month? (On average) | |
|---|---|---|
| Instant scratch tickets ("scratchies") | No/Yes | $ |
| Bingo | No/Yes | $ |
| Lotto or lottery games, like Powerball or Oz Lotto | No/Yes | $ |
| Keno | No/Yes | $ |
| Private betting (e.g., playing cards or mah-jong with friends and family) | No/Yes | $ |
| Poker | No/Yes | $ |
| Casino table games (e.g., blackjack, roulette) | No/Yes | $ |
| Poker machines ("pokies") or slot machines | No/Yes | $ |
| Betting on horse or dog races (but not sweeps) | No/Yes | $ |
| Betting on sports | No/Yes | $ |
The second component consisted of the Problem Gambling Severity Index (PGSI; Ferris and Wynne 2001). The PGSI consists of nine items that capture problematic gambling behaviour in the past 12 months, and the adverse consequences of gambling experienced in the past 12 months4. These items are shown in Table 1.2. Each item is rated on a 4-point scale, where 0 = Never and 3 = Almost always. Responses are summed to give a score between 0 and 27. The higher the score, the greater the problems or likelihood of problems.
Now thinking about the last 12 months …
| (Cross X one box on each line) | Never | Sometimes | Most of the time | Almost always |
|---|---|---|---|---|
| Have you bet more than you could really afford to lose? | ||||
| Have you needed to gamble with larger amounts of money to get the same feeling of excitement? | ||||
| When you gambled, did you go back another day to try and win back the money you lost? | ||||
| Have you borrowed money or sold anything to get money to gamble? | ||||
| Have you felt that you might have a problem with gambling? | ||||
| Has gambling caused you any health problems, including stress or anxiety? | ||||
| Have people criticized your betting or told you that you had a gambling problem, regardless of whether or not you thought it was true? | ||||
| Has your gambling caused any financial problems for you or your household? | ||||
| Have you felt guilty about the way you gamble or what happens when you gamble? |
All HILDA Survey participants were administered the PGSI, irrespective of whether they had gambled in a typical month. Each participant was assigned a gambling risk state according to the following risk thresholds:
| PGSI Score | Risk category |
|---|---|
| 0 | Non-problem gambler |
| 1-2 | Low-risk gambler |
| 3-7 | Moderate risk gambler |
| 8 or over | Problem gambler |
Non-problem gamblers were those who did not engage in problematic gambling behaviour or experience adverse consequences in the past 12 months from gambling. Low-risk and moderate-risk gamblers were those who reported low or moderate level problematic behaviour and/or consequences. They are considered as being at low to moderate risk of becoming problem gamblers. Problem gamblers were those who reported high level problematic behaviour and/or consequences.
Statistical analysis
The bulk of the report presents basic descriptive statistics, such as means and percentage distributions. Tables are based on the responding sample for each individual question (i.e., item non-response is excluded), and as such baseline numbers may vary slightly between tables. The sample sizes for each of the gambling activities, and for the categories derived from the PGSI are presented in Appendix B.
Unless otherwise stated, analysis is conducted at an individual responding person level (rather than household) and based on individual's responses. As monetised gambling is illegal under the age of 18, respondents aged 15-17 were excluded from analysis. The exception to this approach is Chapter 6, which addresses gambling expenditure as part of the wider household budget and therefore uses variables constructed from all household members' responses, and includes some analysis conducted at a household level.
Gambling participation and expenditure is analysed according to a set of demographic variables that are expected to be related to gambling behaviours. Some demographic variable percentages may not add to 100% as those which had small categories which did not readily collapse into broader categories are not presented (e.g., participants born outside of Australia, Asia or Europe) but were retained while calculating percentages. For further detail regarding the construction of individual variables for analysis, see Appendix C.
To reduce the impact of outliers on estimates of gambling expenditure, estimates were Winsorised whereby values were capped at the top and bottom 1%. An individual's overall expenditure was calculated by summing the individually capped expenditure values from each of the ten activities.
Standard errors of statistics are not presented in this report, instead estimates which have a relative standard error of between 30% and 50% are marked with # to indicate unreliable estimates and where caution is required when interpreting these estimates. Estimates with a standard error >50% were suppressed, with np (not presented) appearing in place of the estimate.
Confidence intervals for means were calculated at the 95% level, using weighted standard errors. Tests of statistical significance used survey weighted chi-square and t-tests. Statistical analyses were conducted using STATA v14.2.
Weighting
In order to generalise findings to the Australian population, HILDA Survey data was weighted to reflect the probability of households and individuals being selected in the complex-cross sectional survey. This report uses the Self-Completion Questionnaire (SCQ) weighting values provided in the HILDA Survey dataset. Details about the weighting process can be found elsewhere (Watson 2012). Throughout the report, these population weights were attached to the 14,453 SCQ respondents aged 18 or above to derive estimates of the proportion and number of adults in the population within each group of interest. Standard errors for weighted data were calculated using the delete-a-group Jackknife method, using replicate weights provided in the HILDA Survey dataset. Details are available elsewhere (Hayes 2008).
Comparison of HILDA data to other gambling statistics
Appendix A provides comparisons of the estimates produced from the HILDA data to estimates produced from other national and state/territory sources. There is considerable variation across data sources in respect to estimates of gambling participation and gambling expenditure. The key contributing factor to those differences is the focus on gambling "in a typical month" in HILDA, and so excluding less regular participation and expenditure. There is also considerable variation in rates of gambling problems. This is because the HILDA Survey administered the PGSI to a population representative sample, whereas gambling studies have only administered it to people who gambled in the past year.
1 The design of these gambling questions was undertaken in collaboration with the Melbourne Institute of Applied Economic and Social Research at the University of Melbourne and Australian Government Department of Social Services.
2 The survey was approved by the Human Research Ethics Committee of the University of Melbourne (1647030).
3 Further details on the structure of the HILDA Survey sample, including complete questionnaires, are available online: <https://melbourneinstitute.unimelb.edu.au/hilda>.
4 Whereas PGSI behavioural items refer to actions in the past twelve months, the adverse consequences reported in the past twelve months may be the legacy of prior problematic gambling behaviours. E.g., gambling-related financial hardship experienced in the past 12 months may be a consequence of gambling behaviour in prior years.
2. Gambling participation
Introduction
This chapter presents estimates of the prevalence of Australian adults (aged 18 years or over) who participated in one or more of 10 gambling activities in a typical month of 2015. People were considered to have participated, and to have been regular gamblers, if they spent money on a given activity in a typical month during the year. The report refers almost entirely to these gamblers. Less frequent gambling participation was not asked about in the HILDA survey. Estimates of the amounts spent on the 10 activities are the focus of Chapter 3.
The 10 activities include lotteries, instant scratch tickets, electronic gaming machines (EGMs), race betting, sports, keno, casino table games, bingo, private betting and poker.
Also estimated is the number of activities in which people typically participated, and the proportions of participants who engaged in each combination of activities.
Finally, participants in each activity are profiled and compared to the Australian adult population on a wide range of sociodemographic characteristics.
Key findings
- An estimated 39% of Australian adults - 6.8 million people - gambled in a typical month of 2015 (i.e., regularly).
- Among these 6.8 million regular gamblers, participation in lotteries was most common (76%), followed by instant scratch tickets (22%) and electronic gaming machines (21%).
- Approximately one third (38%) of gamblers participated in multiple activities.
- Compared to the Australian adult population, regular gambling participants were substantially over-represented among males (i.e., 54% of gamblers were males versus 49% of Australian adults), people aged 50 and older, those who had 10 years or less schooling or a certificate or diploma, people who were retired, who lived alone or with another adult, who lived outside a major city, and those who drew their main source of income from welfare payments.
- There were wide-ranging sociodemographic differences between those who gambled regularly on each activity and the Australian adult population.
Gambling participation
In a typical month of 2015, population weighted HILDA Survey estimates indicate that 39% of Australian adults gambled on one or more of the 10 activities listed in Table 2.1. Among these "regular gamblers", lottery participation was most common (76%). Other commonly reported activities were the regular purchase of instant scratch tickets (22%) and playing of electronic gaming machines (EGMs; 21%). Least likely to be a typical monthly event were casino table gambling, bingo, private betting and poker, with participation rates of 2-3% among those who gambled.
| Activity | Estimated number | Australian population | Regular gambling population |
|---|---|---|---|
| '000 | % | % | |
| Lottery | 5,186 | 29.6 | 76.2 |
| Instant scratch tickets | 1,495 | 8.5 | 22.0 |
| EGMs | 1,418 | 8.1 | 20.8 |
| Race betting | 975 | 5.6 | 14.3 |
| Sports betting | 574 | 3.3 | 8.4 |
| Keno | 549 | 3.1 | 8.1 |
| Casino table games | 192 | 1.1 | 2.8 |
| Bingo | 186 | 1.1 | 2.7 |
| Private betting | 155 | 0.9 | 2.3 |
| Poker | 132 | 0.8 | 1.9 |
| Any gambling | 6,809 | 38.9 | 100.0 |
Notes: Percentages based on weighted data. Percentages may not total 100% due to rounding.
Number of gambling activities
Table 2.2 shows the proportion of adults who participated in one or more of the 10 gambling activities in a typical month.
The survey found that almost one quarter (24%) of Australian adults spent money on a single activity in a typical month, while 15% participated in multiple activities. Among those who gambled, 38% spent money on more than one activity.
| Australian population | Regular gambling population | |
|---|---|---|
| Number of activities | % | % |
| 0 | 61.7 | - |
| 1 | 23.6 | 61.6 |
| 2 | 9.3 | 24.2 |
| 3 | 3.7 | 9.8 |
| 4+ | 1.7 | 4.4 |
Notes: Statistics based on weighted data. Percentages may not total 100% due to rounding.
Tables 2.3 and 2.4 show the proportion of gamblers who participated in each single activity, the mean number of activities that participants in each activity engaged in, and the proportion who engaged in additional activities. In these tables, the most common activity combinations in a typical month can be seen.
Most lottery participants (59%) gambled solely on that activity in a typical month. Gamblers who participated in any other activity usually participated in one or two additional activities (2.3 to 3.4 on average), and included lottery in the mix. For instance, as shown in Table 2.3, keno participants very rarely spent money on that activity alone (only 10% did). They usually spent money on three activities (2.9 on average). As shown in Table 2.4, the additional activities were most commonly the lotteries, which two thirds of keno players participated in regularly (67%), and EGMs, which half played regularly (48%).
| Participants in… | This activity only (%) | Mean number of activities |
|---|---|---|
| Lottery | 59.3 | 1.63 |
| Instant scratch tickets | 19.0 | 2.32 |
| EGMs | 25.4 | 2.46 |
| Race betting | 17.5 | 2.65 |
| Sports betting | 17.4 | 2.82 |
| Keno | 10.2 | 2.90 |
| Casino table games | 20.4 | 3.05 |
| Bingo | 28.0 | 2.71 |
| Private betting | 20.1 | 3.36 |
| Poker | 19.9 | 3.21 |
| Any gambling | 61.6 | 1.59 |
Notes: Statistics based on weighted data. Percentages may not total 100% due to rounding.
| Participation rate in other activities (%) | ||||||||||
|---|---|---|---|---|---|---|---|---|---|---|
| Lottery | Instant scratch tickets | EGMs | Race betting | Sports betting | Keno | Casino table games | Bingo | Private betting | Poker | |
| Lottery | - | 20.6 | 14.6 | 10.1 | 5.1 | 7.1 | 1.5 | 1.8 | 1.5 | 1.2 |
| Instant scratch tickets | 71.5 | - | 24.7 | 10.3 | 6.9 | 9.6 | 2.3 | 3.0 | 2.1 | 1.5 |
| EGMs | 53.3 | 26.1 | - | 20.1 | 10.8 | 18.7 | 5.4 | 4.8 | 3.2 | 3.3 |
| Race betting | 53.6 | 15.8 | 29.2 | - | 33.4 | 15.4 | 5.8 | 3.2 | 5.2 | 2.9 |
| Sports betting | 46.0 | 17.9 | 26.6 | 56.7 | - | 12.3 | 7.6 | 2.3 | 7.9 | 5.0 |
| Keno | 67.2 | 26.1 | 48.2 | 27.3 | 12.8 | - | 3.7 | 4.6 | 4.0 | 4.7 |
| Casino table games | 39.6 | 18.2 | 39.7 | 29.7 | 22.9 | 10.7 | - | 9.1 | 18.6 | 16.2 |
| Bingo | 50.8 | 24.2 | 36.7 | 16.7 | 7.1 | 13.6 | 9.4 | - | 9.2 | 2.9 |
| Private betting | 51.2 | 20.7 | 29.2 | 32.8 | 29.1 | 14.0 | 23.0 | 11.0 | - | 25.4 |
| Poker | 47.6 | 17.4 | 36.0 | 21.8 | 21.8 | 19.7 | 23.7 | 4.1 | 30.0 | - |
Notes: Percentages based on weighted data. Percentages may not total 100% due to rounding
Sociodemographic characteristics of regular gamblers
Table 2.5 shows the socioeconomic and demographic characteristics of regular gamblers in 2015. Their characteristics are compared to the Australian adult population.
Compared to the Australian adult population, a significantly higher proportion of regular gamblers were male. That is, 49% of Australian adults were male whereas 54% of regular gamblers were male. Regular gamblers were further over-represented among people aged 50 and older, those born in Europe, those who had 10 years or less schooling, or had certificate or diploma, people who were retired, who lived alone or with only their partner, who lived outside a major city, and those who drew their main source of income from welfare payments.
Note that the proportions provided in Table 2.5 can be used to estimate the national gambling participation rates for each demographic group, such as the percentage of Australians who were male gamblers. For example, we know that 38.9% of Australians were regular gamblers (Table 2.1), of whom 54.2% were male (Table 2.5). Therefore, 21% (54.2% of 38.9%) of Australians were male gamblers in 2015.
| Australian adults | Regular gamblers | |
|---|---|---|
| Subpopulation categories | % | % |
| Sex | ||
| Male | 49.0 | 54.2↑ |
| Female | 51.0 | 45.8↓ |
| Age group | ||
| 18-29 | 22.5 | 11.9↓ |
| 30-49 | 34.9 | 34.0 |
| 50-64 | 24.1 | 30.4↑ |
| 65+ | 18.6 | 23.8↑ |
| Indigenous Status | ||
| Non-Indigenous | 97.7 | 97.6 |
| Indigenous | 2.3 | 2.4 |
| Region of birth a | ||
| Australia | 69.7 | 71.9↑ |
| Europe | 10.8 | 11.9↑ |
| Asia | 10.7 | 7.3↓ |
| First Language spoken | ||
| English | 85.6 | 90.3↑ |
| Other | 14.4 | 9.7↓ |
| Highest education Level | ||
| Below year 10 | 8.1 | 9.2↑ |
| Completed year 10 | 15.3 | 19.0↑ |
| Completed year 12 | 15.8 | 13.0↓ |
| Certificate or diploma | 33.1 | 37.9↑ |
| Bachelors or higher | 27.7 | 20.9↓ |
| Employment | ||
| Employed full-time | 43.6 | 47.4↑ |
| Employed part-time | 20.1 | 16.3↓ |
| Unemployed-looking for work | 3.2 | 2.3↓ |
| Retired | 19.7 | 25.0↑ |
| Full-time student | 3.4 | 1.2↓ |
| Other not employed-not looking for work | 9.9 | 7.9↓ |
| Relationship status | ||
| Married/in a de facto relationship | 54.6 | 59.5↑ |
| Single | 45.4 | 40.5↓ |
| Household composition | ||
| Single adult household | 12.3 | 14.1↑ |
| Couple only household | 24.4 | 28.6↑ |
| Household with children | 30.3 | 25.6↓ |
| Multiple adult household | 33.0 | 31.7 |
| Housing tenure | ||
| Own outright | 17.3 | 18.3 |
| Own with mortgage | 52.7 | 53.3 |
| Rent | 27.7 | 26.0 |
| Remoteness | ||
| Major city | 72.5 | 69.1↓ |
| Inner regional | 18.2 | 20.0↑ |
| Outer regional/remote | 9.3 | 11.0↑ |
| SEIFA quintile b | ||
| Lowest | 19.6 | 19.7 |
| 2 | 18.2 | 19.6↑ |
| Middle | 19.3 | 19.8 |
| 4 | 20.6 | 20.0 |
| Highest | 22.4 | 21.0↓ |
| Equivalised disposable household income c | ||
| <$29,500 | 19.8 | 19.3 |
| $29,500-$41,499 | 20.4 | 19.4 |
| $41,500-$53,999 | 19.4 | 20.2 |
| $54,000-$73,499 | 20.2 | 20.8 |
| $73,500+ | 20.2 | 20.3 |
| Main source of household income | ||
| Wages/salary/business | 73.5 | 70.3↓ |
| Govt. pension/allowance/benefit | 18.2 | 20.7↑ |
| Superannuation/annuity/investment | 8.1 | 8.7 |
Notes: Percentages based on weighted data. Percentages may not total 100% due to rounding or non-response.
a Only region of origins representing >10% of the population are presented. b Socio-Economic Indexes for Areas 2011. c Household income after tax, weighted for size and composition of household. ↑ and ↓ are used to indicate values significantly above or below the general Australian population at p<.05.
Sociodemographic characteristics of regular gamblers by activity
Table 2.6 provides a sociodemographic breakdown of participants in each of the 10 activities. Their characteristics are compared to the Australian adult population.
As shown in the table, there were many significant sociodemographic differences between the activity participants and the Australian population. Given the large number of significant differences, only those which were considered substantial are described below.5
Lotteries. Compared to the Australian adult population, a substantially higher proportion of lottery participants were aged 50 and over. That is, while 43% of Australian adults were aged 50 and over, a much larger percentage (58%) of lottery players were aged 50 and over. A substantially higher proportion were also born in Europe, had 10 years or less of schooling or had completed a certificate or diploma, were retired, married/in a de facto relationship, and lived with only their partner.
Instant scratch tickets. A substantially higher proportion of participants were aged 50 and older, had 10 years or less of schooling, were retired, lived alone or with only their partner, and lived outside of a major city.
Electronic gaming machines. EGM players were substantially over-represented among those aged 50 and older, people who identified as Indigenous, who had 10 years or less of schooling or had completed a certificate or diploma, were retired, lived alone or with only their partner, lived in an inner regional area, those who had lowest incomes, and those who drew their main source of income from welfare payments.
Race betting. A substantially higher proportion of race bettors were male, aged between 50 and 64, born in Australia, had 10 years of schooling or had completed a certificate or diploma, were employed full-time, lived alone or with only their partner, and lived in an outer regional or remote area. Race bettors were further over-represented among those with the highest incomes.
Sports betting. Relative to the Australian adult population, a substantially higher proportion were male, younger than 50, Indigenous, born in Australia, had 12 years of schooling, were employed full-time, single, had the highest incomes, and drew their main source of income from employment.
Keno. Participants were substantially over-represented among males, people aged 30 and older, those who identified as Indigenous, had 10 years or less of schooling or had completed a certificate or diploma, were retired, lived alone, lived outside a major city, lived in a low socioeconomic area, and those who drew their main source of income from welfare payments.
Casino table games. A substantially higher proportion of participants were male, younger than 30, Indigenous, had 12 years of schooling, were employed full-time, single, lived with multiple adults, lived in a major city, lived in a high socioeconomic area, and drew their main source of income from employment.
Bingo. Compared to the Australian population, a substantially higher proportion of participants were female, aged 65 and over, had 10 years or less of schooling, were retired or not employed and not looking for work, lived alone, lived in the lowest socioeconomic areas, had the lowest incomes, and drew their main source of income from welfare payments.
Private betting. Participants were substantially over-represented among males, people born in Asia, and those who owned their own home with a mortgage.
Poker participants. Relative to the Australian adult population, a substantially higher proportion of poker players were male, did not have a university degree, were employed full-time, lived with multiple adults, and drew their main source of income from employment.
Note that the proportions provided in Table 2.6 can be used to estimate national regular gambling participation rates for each demographic group. For example, we know that 3.3% of Australians were regular sport bettors (Table 2.1), of whom 88% were male (Table 2.6). Therefore, 2.9% (88% of 3.3%) of Australians were male sports bettors and 0.4% (12% of 3.3%) of Australians were female sports bettors.
The table can also be viewed on pages 16–18 of the PDF.
| Australian adults | Lottery | Instant scratch tickets | EGMs | Race betting | Sports betting | Keno | Casino table games | Bingo | Private betting | Poker | |
|---|---|---|---|---|---|---|---|---|---|---|---|
| Subpopulation Categories | % | % | % | % | % | % | % | % | % | % | % |
| Sex | |||||||||||
| Male | 49.0 | 52.8↑ | 45.3↓ | 54.3↑ | 80.9↑ | 88.0↑ | 60.2↑ | 76.6↑ | 19.3↓ | 62.9↑ | 65.8↑ |
| Female | 51.0 | 47.2↓ | 54.7↑ | 45.7↓ | 19.1↓ | 12.0↓ | 39.8↓ | 23.4↓ | 80.7↑ | 37.1↓ | 34.2↓ |
| Age group | |||||||||||
| 18-29 | 22.5 | 6.2↓ | 12.5↓ | 16.1↓ | 15.5↓ | 32.7↑ | 10.0↓ | 46.2↑ | 8.0#↓ | 22.5 | 30.2 |
| 30-49 | 34.9 | 35.8 | 30.5↓ | 25.3↓ | 34.9 | 42.4↑ | 39.7 | 30.8 | 23.6 | 44.0 | 41.2 |
| 50-64 | 24.1 | 33.4↑ | 33.2↑ | 29.6↑ | 31.4↑ | 18.6 | 28.1 | 16.3 | 29.5 | 15.0 | 18.3 |
| 65+ | 18.6 | 24.6↑ | 23.8↑ | 29.0↑ | 18.2 | 6.3↓ | 22.1 | np | 38.9↑ | 18.5# | 10.3# |
| Indigenous status | |||||||||||
| Non-Indigenous | 97.7 | 98.1 | 96.9 | 95.1↓ | 96.4 | 95.4↓ | 94.5↓ | 95.0↓ | 95.0 | 97.1 | 95.5 |
| Indigenous | 2.3 | 1.9 | 3.1 | 4.9↑ | 3.6 | 4.6↑ | 5.5↑ | 5.0#↑ | 5.0# | np | np |
| Region of birth a | |||||||||||
| Australia | 69.7 | 69.7 | 72.8 | 78.1↑ | 80.7↑ | 82.0↑ | 78.8↑ | 68.6 | 65.2 | 59.0 | 63.3 |
| Europe | 10.8 | 13.3↑ | 10.0 | 12.2 | 8.8 | 6.0↓ | 11.9 | 4.0 | 14.6 | 8.4# | 10.3# |
| Asia | 10.7 | 8.0↓ | 6.3↓ | 3.8↓ | 3.6↓ | 3.1#↓ | 3.7↓ | 13.9 | 9.3 | 23.1#↑ | 14.9 |
| First language spoken | |||||||||||
| English | 85.6 | 89.3↑ | 91.2↑ | 94.2↑ | 95.0↑ | 96.6↑ | 95.4↑ | 82.4 | 82.4 | 77.6 | 77.4 |
| Other | 14.4 | 10.7↓ | 8.8↓ | 5.8↓ | 5.0#↓ | 3.4#↓ | 4.6#↓ | 17.6# | 17.6 | 22.4# | 22.6# |
| Highest education level | |||||||||||
| Below year 10 | 8.1 | 9.5↑ | 9.4 | 12.0↑ | 6.2 | 3.4#↓ | 12.5↑ | np | 23.9↑ | 12.8# | 7.6# |
| Completed year 10 | 15.3 | 19.0↑ | 20.4↑ | 21.6↑ | 20.2↑ | 14.7 | 22.1↑ | 14.8 | 29.3↑ | 11.6# | 18.7 |
| Completed year 12 | 15.8 | 11.1↓ | 11.9↓ | 16.5 | 15.8 | 22.0↑ | 13.4 | 27.6↑ | 8.3↓ | 9.8# | 13.3# |
| Certificate or Diploma | 33.1 | 39.1↑ | 36.6 | 38.9↑ | 40.5↑ | 33.3 | 42.3↑ | 34.6 | 28.7 | 36.5 | 45.0 |
| Bachelors or higher | 27.7 | 21.3↓ | 21.7↓ | 11.0↓ | 17.4↓ | 26.6 | 9.8↓ | 20.7 | np | 29.3 | 15.3↓ |
| Employment | |||||||||||
| Employed full-time | 43.6 | 48.7↑ | 43.4 | 38.9↓ | 55.5↑ | 70.4↑ | 47.7 | 59.9↑ | 24.1↓ | 56.7 | 64.7↑ |
| Employed part-time | 20.1 | 15.9↓ | 17.7 | 17.1↓ | 15.3↓ | 14.1↓ | 18.3 | 20.6 | 8.4#↓ | 16.8# | 12.6# |
| Unemployed-looking for work | 3.2 | 2.0↓ | 2.4 | 4.2 | 2.8# | 2.0# | 4.0 | 3.4# | 2.5# | np | np |
| Retired | 19.7 | 25.3↑ | 25.5↑ | 31.0↑ | 19.8 | 7.3↓ | 23.6↑ | np | 46.7↑ | 13.3# | 6.4#↓ |
| Full-time student | 3.4 | 0.4↓ | 1.6#↓ | 1.3#↓ | np | 2.6# | np | 4.7# | np | 5.0# | np |
| Other not employed-not looking for work | 9.9 | 7.6↓ | 9.4 | 7.5↓ | 4.5↓ | 3.5#↓ | 6.2↓ | np | 17.8↑ | np | np |
| Relationship status | |||||||||||
| Married/in a de facto relationship | 54.6 | 64.4↑ | 56.7 | 50.1↓ | 54.0 | 44.5↓ | 51.9 | 39.9↓ | 52.3 | 53.4 | 44.1 |
| Single | 45.4 | 35.6↓ | 43.3 | 49.9↑ | 46.0 | 55.5↑ | 48.1 | 60.1↑ | 47.7 | 46.6 | 55.9 |
| Household composition | |||||||||||
| Single adult household | 12.3 | 13.4↑ | 14.5↑ | 14.9↑ | 15.0↑ | 13.4 | 15.3↑ | 7.6↓ | 23.0↑ | 13.0 | 14.5 |
| Couple-only household | 24.4 | 29.9↑ | 28.4↑ | 30.5↑ | 29.5↑ | 24.0 | 27.0 | 10.9#↓ | 29.4 | 16.8 | 12.3↓ |
| Household with children | 30.3 | 26.3↓ | 22.4↓ | 16.4↓ | 25.1↓ | 24.4 | 20.7↓ | 22.3 | 20.2 | 31.3 | 25.4 |
| Multiple adult household | 33.0 | 30.5↓ | 34.7 | 38.3 | 30.4 | 38.3 | 37.0 | 59.2↑ | 27.4 | 38.8 | 47.9↑ |
| Housing tenure | |||||||||||
| Own outright | 17.3 | 19.0↑ | 18.5 | 19.5 | 19.0 | 15.4 | 16.4 | 14.2# | 12.2 | 10.7# | 9.9# |
| Own with mortgage | 52.7 | 55.1↑ | 50.6 | 49.6 | 53.5 | 54.9 | 52.2 | 61.7 | 50.4 | 68.3↑ | 57.0 |
| Rent | 27.7 | 23.5↓ | 28.4 | 28.4 | 25.6 | 28.7 | 27.7 | 23.8 | 32.1 | 19.7 | 31.1 |
| Remoteness | |||||||||||
| Major city | 72.5 | 69.7↓ | 65↓ | 64.8↓ | 66.8↓ | 77.1 | 53.5↓ | 86.0↑ | 66.2 | 75.9 | 79.7 |
| Inner regional | 18.2 | 19.2 | 21.8↑ | 24.3↑ | 19.8 | 16.8 | 28.4↑ | 7.5↓ | 23.6 | np | 14.8 |
| Outer regional/remote | 9.3 | 11.0↑ | 13.2↑ | 10.9 | 13.4↑ | 6.1↓ | 18.1↑ | 6.6# | 10.2 | 13.5 | 5.5# |
| SEIFA quintileb | |||||||||||
| Lowest | 19.6 | 19.0 | 21.8 | 27.6↑ | 22.2 | 19.6 | 32.3↑ | 10.3↓ | 41.2↑ | 18.0 | 14.6 |
| 2 | 18.2 | 19.8↑ | 18.3 | 20.3 | 19.6 | 14.8 | 23.8#↑ | 24.4 | 19.9 | 18.3 | 19.9 |
| Middle | 19.3 | 20.0 | 18.5 | 19.8 | 14.8↓ | 14.7↓ | 19.8# | 7.6↓ | 17.8 | 14.8 | 20.4# |
| 4 | 20.6 | 19.8 | 20.2 | 17.1↓ | 23.2 | 24.8 | 13.0↓ | 25.0 | 10.2↓ | 21.4 | 22.6 |
| Highest | 22.4 | 21.5 | 21.2 | 15.2↓ | 20.3 | 26.2 | 11.0↓ | 32.7 | np | 27.6 | 22.6# |
| Equivalised disposable household incomec | |||||||||||
| <$29,500 | 19.8 | 18.4↓ | 20.0 | 25.2↑ | 17.5 | 10.1↓ | 21.7 | 10.3 | 42.4↑ | 17.3 | 12.8 |
| $29,500-$41,499 | 20.4 | 19.4 | 18.9 | 19.6 | 17.5 | 17.5 | 18.5 | 14.2 | 16.0 | 18.1 | 21.1 |
| $41,500-$53,999 | 19.4 | 20.2 | 22.4 | 21.8 | 20.8 | 17.6 | 22.5 | 16.1 | 15.3 | 12.4 | 24.9 |
| $54,000-$73,499 | 20.2 | 21.0 | 20.2 | 19.4 | 19.2 | 23.4 | 21.7 | 33.8 | 17.4 | 25.0 | 23.5 |
| $73,500+ | 20.2 | 20.1 | 18.6 | 14.0↓ | 25.0↑ | 31.4↑ | 15.5 | 25.6 | 9.0 | 27.3 | 17.7 |
| Main source of household income | |||||||||||
| Wages/salary/business | 73.5 | 71.3↓ | 70.7 | 61.3↓ | 75.6 | 89.1↑ | 70.1 | 93.6↑ | 43.8↓ | 83.3↑ | 88.3↑ |
| Govt. pension/ allowance/ benefit | 18.2 | 19.6↑ | 20.7↑ | 29.3↑ | 17.2 | 7.2↓ | 22.4↑ | np | 50.6↑ | 13.8 | 11.7 |
| Superannuation/annuity/ investment | 8.1 | 8.8 | 8.2 | 9.2 | 7.3 | 3.5↓ | 7.3 | np | 5.6# | np | np |
Notes: Percentages based on weighted data. Percentages may not total 100% due to rounding or non-response. a Only region of births representing >10% of the population are presented. b Socio-Economic Indexes for Areas 2011. c Household income after tax, weighted for size and composition of household. # RSE between 30% and 50%. np - data not presented due to insufficient responses or RSE >50% ↑ and ↓ are used to indicate values significantly above or below the general Australian population at p<.05.
5 Differences of around twenty percent or greater between the proportion of Australians and proportion of gambling participants represented by a sociodemographic characteristic were considered substantial.
3. Gambling expenditure
Introduction
This chapter presents HILDA survey-based estimates of typical past-year expenditure by regular gamblers in 2015, derived from self-reported, typical monthly spends. This information is presented in two ways. First, estimates of national expenditure by all regular gamblers in Australia are presented, which takes into account the estimated number of people participating in each gambling activity, and their spending on those activities. The national estimates are presented for overall spending on gambling as well as for each activity. These estimates are also presented in terms of what proportion of spending is accounted for by each sociodemographic group. The other perspective shown here is the average expenditure among those who report spending on gambling overall, and on particular activities. This analysis also compares average spending across sociodemographic groups.
Mean expenditure estimates for the five most common activities (lotteries, instant scratch tickets, EGMs, race betting, sports betting) are further provided for each sociodemographic group (e.g. average expenditure on sports betting by male participants). Due to sample size limitations, this level of detail could not be accurately estimated for the remaining five activities (keno, casino table games, bingo, private betting, poker).
All estimates of past-year expenditure were calculated by multiplying regular gamblers' self-reported typical monthly spend by 12. The estimates therefore do not represent total gambling expenditure for the year, which would include amounts from high and low spend months, and expenditure on activities where participation was less than monthly.6
See Appendix A for a comparison between the HILDA survey-based estimates of regular gamblers' typical expenditure presented in this chapter, and total gambling expenditure reported by the Australian gambling industry.
Key findings
- Typical monthly expenditure by the 6.8 million regular gamblers amounted to an estimated $8.6 billion dollars nationally for 2015. Lotteries (42%), EGMs (21%) and race betting (15%) accounted for most of this.
- The majority of national gambling expenditure by regular gamblers was accounted for by participants who were male, aged 30-64, born in Australia, spoke English as a first language, had completed no more than 10 years of schooling, were employed full-time, married/in a de facto relationship, lived in a major city, had a high income, and drew their main source of income from employment.
- Typical past-year expenditure on gambling was an estimated average of $1,272 per regular participant. In terms of particular activities, poker recorded the highest average spend per participant ($1,785) and instant scratch tickets the lowest ($248).
- Gamblers generally spent around half of their overall gambling outlay on a single product. Lotteries (79%) and keno (32%) were exceptions, accounting for substantially more and less of their respective participants' overall outlays.
- Mean expenditure was significantly higher than average among gamblers who were male, had completed schooling no further than year 10, were employed full-time, single, and lived with multiple adults. It was lower among gamblers who had a university degree, and lived in a house with children.
- Mean expenditure was otherwise similar between gamblers with different sociodemographic characteristics, including those with low and high incomes and those whose main source of income was either a wage or welfare payment.
National gambling expenditure
Table 3.1 shows HILDA survey-based estimates of national past-year gambling expenditure by regular participants on each activity.
Typical monthly gambling expenditure by the 6.8 million regular gamblers amounted to approximately $8.6 billion dollars over 2015. Lotteries (42%), EGMs (21%) and race betting (15%) together accounted for around three quarters of this amount. Seven activities accounted for the remaining quarter.
| National expenditure | Proportion of national expenditure | |
|---|---|---|
| Activity | $M | % |
| Lottery | 3,577 | 41.6 |
| Instant scratch tickets | 368 | 4.3 |
| EGMs | 1,820 | 21.1 |
| Race betting | 1,265 | 14.7 |
| Sports betting | 579 | 6.7 |
| Keno | 226 | 2.6 |
| Casino table games | 256 | 3.0 |
| Bingo | 156 | 1.8 |
| Private betting | 134 | 1.6 |
| Poker | 228 | 2.7 |
| 8,609 | 100.0 |
Notes: Values are based on weighted data and capped expenditure. Percentages may not total 100% due to rounding. Expenditure calculations exclude those who reported they had participated in an activity in a typical month, but who did not report a dollar amount when prompted for the expenditure. See Appendix A for a comparison between these survey-based estimates and actual 'known' expenditure reported by industry
National gambling expenditure by sociodemographic characteristics
Table 3.2 shows HILDA survey-based estimates of national gambling expenditure, by regular gamblers, for each sociodemographic group.
The sociodemographic groups responsible for the highest proportion of gambling expenditure were males, those aged 50-64, those born in Australia, those who spoke English as a first language, who had a certificate or diploma, were employed full-time, were married/in a de facto relationship, lived in a multiple adult household with no children, owned their home with a mortgage, lived in a major city, those who had higher incomes, and drew their main source of income from employment.
| Total spend | Proportion of total | |
|---|---|---|
| Subpopulation categories | $M | % |
| Overall | ||
| All gamblers | 8,609 | 100.0 |
| Sex | ||
| Male | 5,509 | 64.0 |
| Female | 3,100 | 36.0 |
| Age group | ||
| 18-29 | 1,079 | 12.5 |
| 30-49 | 2,648 | 30.8 |
| 50-64 | 2,837 | 33.0 |
| 65+ | 2,046 | 23.8 |
| Indigenous status | ||
| Non-Indigenous | 8,366 | 97.2 |
| Indigenous | 243 | 2.8 |
| Region of birth a | ||
| Australia | 6,145 | 71.4 |
| Europe | 1,000 | 11.6 |
| Asia | 605 | 7.0 |
| First language spoken | ||
| English | 7,467 | 86.7 |
| Other | 923 | 10.7 |
| Highest education Level | ||
| Below year 10 | 769 | 8.9 |
| Completed year 10 | 1,813 | 21.1 |
| Completed year 12 | 1,172 | 13.6 |
| Certificate or diploma | 3,512 | 40.9 |
| Bachelors or higher | 1,328 | 15.5 |
| Employment | ||
| Employed full-time | 4,351 | 50.5 |
| Employed part-time | 1,226 | 14.2 |
| Unemployed-looking for work | 243 | 2.8 |
| Retired | 2,060 | 23.9 |
| Full-time student | np | - |
| Not employed-not looking for work | 629 | 7.3 |
| Relationship status | ||
| Married/in a de facto relationship | 4,818 | 56.0 |
| Single | 3,791 | 44.0 |
| Household composition | ||
| Single adult household | 1,311 | 15.2 |
| Couple only household | 2,471 | 28.7 |
| Household with children | 1,741 | 20.2 |
| Multiple adult household | 3,087 | 35.9 |
| Housing tenure | ||
| Own outright | 1,610 | 18.7 |
| Own with mortgage | 4,613 | 53.6 |
| Rent | 2,172 | 25.2 |
| Remoteness | ||
| Major city | 6,054 | 70.3 |
| Inner regional | 1,618 | 18.8 |
| Outer regional/remote | 937 | 10.9 |
| SEIFA quintile b | ||
| Lowest | 1,863 | 21.6 |
| 2 | 1,759 | 20.4 |
| Middle | 1,573 | 18.3 |
| 4 | 1,655 | 19.2 |
| Highest | 1,761 | 20.5 |
| Equivalised disposable household income c | ||
| <$29,500 | 1,579 | 18.3 |
| $29,500-$41,499 | 1,500 | 17.4 |
| $41,500-$53,999 | 1,770 | 20.6 |
| $54,000-$73,499 | 1,881 | 21.8 |
| $73,500+ | 1,879 | 21.8 |
| Main source of household income | ||
| Wages/salary/business | 6,103 | 70.9 |
| Govt. pension/allowance/benefit | 1,782 | 20.7 |
| Superannuation/annuity/investment | 708 | 8.2 |
Notes: Values are based on weighted data and capped expenditure. Percentages may not total 100% due to rounding or non-response. Expenditure calculations exclude those who reported they had participated in an activity in a typical month, but who did not report a dollar amount when prompted for the expenditure. a Only regions of birth representing >10% of the population are presented. b Socio-Economic Indexes for Areas 2011. c Household income after tax, weighted for size and composition of household.
National gambling expenditure on each activity by sociodemographic characteristics
Table 3.3 shows past-year expenditure on the five most common activities by regular gamblers in each sociodemographic group.
The sociodemographic groups that spent the most on each of the five activities were the same as those for overall expenditure, with a few exceptions:
- Females spent more than males on instant scratch tickets.
- People in lower income groups spent more on instant scratch tickets and EGMs than those with higher incomes.
- Those aged 18-29 spent more on sports betting compared to other age groups.
- Single people spent more on EGMs and sports betting than those who were married/in a de facto relationship.
The table can also be viewed on pages 23–24 of the PDF.
| Lottery | Instant scratch tickets | EGMs | Race betting | Sports betting | ||||||
|---|---|---|---|---|---|---|---|---|---|---|
| Subpopulation categories | $M | % | $M | % | $M | % | $M | % | $M | % |
| Overall | ||||||||||
| All activity participants | 3,577 | 100.0 | 368 | 100.0 | 1,820 | 100.0 | 1,265 | 100.0 | 579 | 100.0 |
| Sex | ||||||||||
| Male | 2,132 | 59.6 | 176 | 47.8 | 1,009 | 55.4 | 1,129 | 89.2 | 512 | 88.4 |
| Female | 1,445 | 40.4 | 192 | 52.2 | 812 | 44.6 | 137 | 10.8 | 67# | 11.6 |
| Age group | ||||||||||
| 18-29 | 125 | 3.5 | 37 | 10.1 | 216 | 11.9 | 191 | 15.1 | 229 | 39.6 |
| 30-49 | 1,138 | 31.8 | 107 | 29.1 | 467 | 25.7 | 393 | 31.1 | 223 | 38.5 |
| 50-64 | 1,322 | 37.0 | 131 | 35.6 | 606 | 33.3 | 457 | 36.1 | 82 | 14.2 |
| 65+ | 992 | 27.7 | 92 | 25.0 | 531 | 29.2 | 225 | 17.8 | np | - |
| Indigenous status | ||||||||||
| Non-Indigenous | 3,515 | 98.3 | 354 | 96.2 | 1,756 | 96.5 | 1,232 | 97.4 | 556 | 96.0 |
| Indigenous | 62 | 1.7 | 13# | 3.5 | 64 | 3.5 | 34# | 2.7 | 23# | 4.0 |
| Region of birtha | ||||||||||
| Australia | 2,491 | 69.6 | 267 | 72.6 | 1,299 | 71.4 | 1,025 | 81.0 | 432 | 74.6 |
| Europe | 483 | 13.5 | 31 | 8.4 | 253 | 13.9 | 128# | 10.1 | 30# | 5.2 |
| Asia | 248 | 6.9 | 29# | 7.9 | 133 | 7.3 | 23# | 1.8 | np | - |
| First language spoken | ||||||||||
| English | 3,125 | 87.4 | 317 | 86.1 | 1,609 | 88.4 | 1,199 | 94.8 | 520 | 89.8 |
| Other | 356 | 10.0 | 40# | 10.9 | 175# | 9.6 | 58# | 4.6 | np | - |
| Highest education level | ||||||||||
| Below year 10 | 315 | 8.8 | 42 | 11.6 | 234 | 12.9 | 52 | 4.2 | np | - |
| Completed year 10 | 737 | 20.6 | 77 | 21.0 | 441 | 24.2 | 247 | 19.6 | 99 | 17.2 |
| Completed year 12 | 406 | 11.4 | 31 | 8.6 | 260 | 14.3 | 201 | 16.0 | 107 | 18.5 |
| Certificate or Diploma | 1,498 | 42.0 | 152 | 41.5 | 685 | 37.6 | 544 | 43.1 | 214 | 36.9 |
| Bachelors or higher | 614 | 17.2 | 63 | 17.3 | 200 | 11.0 | 216 | 17.1 | 120 | 20.8 |
| Employment | ||||||||||
| Employed full-time | 1,760 | 49.2 | 162 | 44.1 | 766 | 42.1 | 762 | 60.2 | 360 | 62.1 |
| Employed part-time | 533 | 14.9 | 49 | 13.4 | 252 | 13.8 | 145 | 11.5 | 91# | 15.8 |
| Unemployed- looking for work | 53 | 1.5 | 7 | 2.0 | 79# | 4.3 | np | - | np | - |
| Retired | 975 | 27.3 | 100 | 27.2 | 537 | 29.5 | 229 | 18.1 | np | - |
| Full-time student | np | - | np | - | 8# | 0.4 | np | - | np | - |
| Not employed-not looking for work | 245 | 6.9 | 39 | 10.6 | 177 | 9.7 | np | - | 10# | 1.7 |
| Relationship status | ||||||||||
| Married/in a de facto relationship | 2,300 | 64.3 | 217 | 59.0 | 871 | 47.9 | 655 | 51.8 | 236 | 40.8 |
| Single | 1,278 | 35.7 | 151 | 41.0 | 950 | 52.2 | 610 | 48.2 | 343 | 59.2 |
| Household composition | ||||||||||
| Single adult household | 513 | 14.3 | 46 | 12.5 | 342 | 18.8 | 219 | 17.3 | 60 | 10.4 |
| Couple only household | 1,149 | 32.1 | 110 | 29.9 | 525 | 28.8 | 381 | 30.1 | 147 | 25.4 |
| Household with children | 776 | 21.7 | 81 | 22.0 | 290 | 15.9 | 240 | 19.0 | 104 | 18.0 |
| Multiple adult household | 1,139 | 31.8 | 130 | 35.4 | 664 | 36.5 | 426 | 33.6 | 268 | 46.3 |
| Housing tenure | ||||||||||
| Own outright | 732 | 20.5 | 61 | 16.6 | 333 | 18.3 | 263 | 20.8 | 136 | 23.5 |
| Own with mortgage | 1,973 | 55.2 | 188 | 51.1 | 934 | 51.3 | 645 | 51.0 | 274 | 47.3 |
| Rent | 765 | 21.4 | 112 | 30.4 | 525 | 28.8 | 308 | 24.3 | 160# | 27.6 |
| Remoteness | ||||||||||
| Major city | 2,445 | 68.4 | 236 | 64.1 | 1,286 | 70.7 | 867 | 68.5 | 480 | 82.9 |
| Inner regional | 726 | 20.3 | 78 | 21.2 | 364 | 20.0 | 230 | 18.2 | 62 | 10.7 |
| Outer regional/remote | 406 | 11.4 | 53 | 14.4 | 170 | 9.3 | 169 | 13.4 | 37# | 6.4 |
| SEIFA quintile b | ||||||||||
| Lowest | 712 | 19.9 | 92 | 25.0 | 482 | 26.5 | 265 | 20.9 | 67 | 11.6 |
| 2 | 775 | 21.7 | 71 | 19.3 | 359 | 19.7 | 276 | 21.8 | 73# | 12.6 |
| Middle | 677 | 18.9 | 66 | 17.9 | 360 | 19.8 | 161 | 12.7 | 84# | 14.5 |
| 4 | 731 | 20.4 | 75 | 20.4 | 294 | 16.2 | 260 | 20.6 | 156 | 26.9 |
| Highest | 682 | 19.1 | 64 | 17.4 | 326 | 17.9 | 304 | 24.0 | 199 | 34.4 |
| Equivalised disposable household income c | ||||||||||
| <$29,500 | 674 | 18.8 | 70 | 19.0 | 424 | 23.3 | 181 | 14.3 | 57# | 9.8 |
| $29,500-$41,499 | 644 | 18.0 | 76 | 20.7 | 296 | 16.3 | 239 | 18.9 | 109# | 18.8 |
| $41,500-$53,999 | 679 | 19.0 | 101 | 27.4 | 440 | 24.2 | 205 | 16.2 | 85# | 14.7 |
| $54,000-$73,499 | 758 | 21.2 | 63 | 17.1 | 403 | 22.1 | 268 | 21.2 | 152 | 26.3 |
| $73,500+ | 823 | 23.0 | 57 | 15.5 | 257 | 14.1 | 373 | 29.5 | 176 | 30.4 |
| Main source of household income | ||||||||||
| Wages/salary/business | 2,527 | 70.6 | 253 | 68.8 | 1,115 | 61.3 | 914 | 72.3 | 488 | 84.3 |
| Govt. pension/allowance/benefit | 744 | 20.8 | 89 | 24.2 | 539 | 29.6 | 212 | 16.8 | np | - |
| Superannuation/annuity/investment | 297 | 8.3 | 24 | 6.5 | 160 | 8.8 | 139 | 11.0 | np | - |
Notes: Values are based on weighted data and capped expenditure. Percentages may not add to 100% due to rounding or non-response. a Only regions of birth representing >10% of the population are presented.
b Socio-Economic Indexes for Areas 2011. c Household income after tax, weighted for size and composition of household. # RSE between 30% and 50%. np - data not presented due to insufficient responses or RSE >50%. Expenditure calculations exclude those who reported they had participated in an activity in a typical month, but who did not report a dollar amount when prompted for the expenditure.
Mean gambling expenditure
Table 3.4 presents mean expenditure on each activity by regular gamblers in 2015. The estimated amount activity participants spent across all regular gambling activities is included in the second column. The third column shows the mean proportion of their total typical gambling expenditure that the activity in question constituted. The annual dollar values reflect mean typical monthly expenditure multiplied by twelve.
The mean typical expenditure per gambler was $1,272 for 2015. Poker saw the highest mean spend per participant, followed by casino table games, race betting, EGMs and sports betting, all of which exceeded $1000.
Lottery participants spent most of their average gambling outlay for the year on this single activity (79%; a mean lottery spend of $695 would equate to a total gambling outlay of $878), whereas keno participants spent only one third of their gambling money on this activity. All other activities attracted somewhere around half of respective participants' average gambling outlay for the year, with private betting being the lowest of these (43%) and EGMs the highest (60%).
| Mean spend on activity | 95% CI | Estimated average total gambling expenditure | Proportion of total gambling spend accounted for by activity | |
|---|---|---|---|---|
| Activity | $ | $ | $ | % |
| Lottery | 695 | 658-733 | 878 | 79.2 |
| Instant scratch tickets | 248 | 215-281 | 622 | 39.9 |
| EGMs | 1,292 | 1,150-1,433 | 2,146 | 60.2 |
| Race betting | 1,308 | 1,140-1,477 | 2,502 | 52.3 |
| Sports betting | 1,032 | 767-1,296 | 2,305 | 44.8 |
| Keno | 425 | 354-497 | 1,310 | 32.4 |
| Casino table games | 1,369 | 962-1,776 | 2,566 | 53.4 |
| Bingo | 863 | 676-1,050 | 1,568 | 55.1 |
| Private betting | 898 | 633-1,163 | 2,080 | 43.2 |
| Poker # | 1,758 | 505-3,065 | 3,674 | 47.9 |
| All gamblers | 1,272 | 1,183-1,361 | - | 100.0 |
Notes: Values are based on weighted data and capped expenditure. Percentages may not total 100% due to rounding. Expenditure calculations exclude those who reported they had participated in an activity in a typical month, but who did not report a dollar amount when prompted for the expenditure. # RSE between 30% and 50%
Mean gambling expenditure by sociodemographic characteristics
Table 3.5 shows mean past-year gambling expenditure by participants in each sociodemographic group.
For the most part, mean gambling expenditure did not differ significantly across sociodemographic groups. Similar amounts were spent by people of different age, Indigenous status, country of birth, language spoken at home, housing tenure, remoteness, area economic advantage, income and source of income.
Gambling expenditure was significantly higher than average among male gamblers, those who had completed schooling no further than year 10, were employed full-time, single and lived with multiple adults.
Expenditure was lower than average among females, those aged 30-49, those who had a university degree, and lived in a household with children.
| Mean spend | 95% CI | |
|---|---|---|
| Subpopulation categories | $ | $ |
| Overall | ||
| All gamblers | 1,272 | 1,183-1,361 |
| Sex | ||
| Male | 1,499↑ | 1,374-1,625 |
| Female | 1003↓ | 922-1,083 |
| Age group | ||
| 18-29 | 1,341 | 963-1,720 |
| 30-49 | 1,148↓ | 1,009-1,286 |
| 50-64 | 1,381 | 1,204-1,557 |
| 65+ | 1,278 | 1,144-1,412 |
| Indigenous status | ||
| Non-Indigenous | 1,267 | 1,178-1,355 |
| Indigenous | 1,496 | 934-2,057 |
| Region of birth a | ||
| Australia | 1,262 | 1,182-1,342 |
| Europe | 1,242 | 982-1,503 |
| Asia | 1,218 | 765-1,671 |
| First language spoken | ||
| English | 1,245 | 1,176-1,314 |
| Other | 1,440 | 845-2,035 |
| Highest education Level | ||
| Below year 10 | 1,250 | 1,030-1,469 |
| Completed year 10 | 1,417↑ | 1,257-1,577 |
| Completed ear 12 | 1,336 | 988-1,685 |
| Certificate or diploma | 1,367 | 1,205-1,529 |
| Bachelor or higher | 942↓ | 791-1,093 |
| Employment | ||
| Employed full-time | 1,353↑ | 1,221-1,486 |
| Employed part-time | 1,117 | 966-1,268 |
| Unemployed-looking for work | 1,588 | 883-2,292 |
| Retired | 1,222 | 1,099-1,345 |
| Full-time student | 1,207 | 30-2,385 |
| Not employed-not looking for work | 1,190 | 824-1,556 |
| Relationship status | ||
| Married/in a de facto relationship | 1,195↓ | 1,087-1,302 |
| Single | 1,387↑ | 1,248-1,525 |
| Household composition | ||
| Single adult household | 1,372 | 1,199-1,545 |
| Couple only household | 1,278 | 1,140-1,417 |
| Household with children | 1,002↓ | 860-1,143 |
| Multiple adult household | 1,442↑ | 1,239-1,645 |
| Housing Tenure | ||
| Own outright | 1,298 | 1,116-1,480 |
| Own with mortgage | 1,282 | 1,181-1,382 |
| Rent | 1,237 | 1,079-1,394 |
| Remoteness | ||
| Major city | 1,294 | 1,167-1,421 |
| Inner regional | 1,202 | 1,094-1,311 |
| Outer regional/remote | 1,262 | 1,067-1,457 |
| SEIFA quintile b | ||
| Lowest | 1,400 | 1,221-1,580 |
| 2 | 1,327 | 1,163-1,491 |
| Middle | 1,178 | 989-1,366 |
| 4 | 1,224 | 1,087-1,361 |
| Highest | 1,236 | 1,029-1,443 |
| Equivalised disposable household income c | ||
| <$29,500 | 1,218 | 1,073-1,363 |
| $29,500-$41,499 | 1,142 | 998-1,287 |
| $41,500-$53,999 | 1,293 | 1,107-1,480 |
| $54,000-$73,499 | 1,331 | 1,150-1,512 |
| $73,500+ | 1,366 | 1,179-1,553 |
| Main source of household income | ||
| Wages/salary/business | 1,280 | 1,176-1,385 |
| Govt. pension/allowance/benefit | 1,280 | 1,124-1,437 |
| Superannuation/annuity/investment | 1,203 | 936-1,471 |
Notes: Values based on weighted data and capped expenditure. Percentages may not total 100% due to rounding or non-response. a Only regions of birth representing >10% of the population are presented. b Socio-Economic Indexes for Areas 2011. c Household income after tax, weighted for size and composition of household. ↑ and ↓ are used to indicate values significantly above or below overall mean spend at p<.05. Expenditure calculations exclude those who reported they had participated in an activity in a typical month, but who did not report a dollar amount when prompted for the expenditure.
Mean activity-level gambling expenditure by sociodemographic characteristics
Table 3.6 shows mean expenditure on the five most common activities by participant sociodemographic characteristics for 2015. Within each activity, mean expenditure by sociodemographic characteristic was compared to the overall activity mean expenditure. Participant sample sizes were too small to provide this level of detail reliably for the five remaining activities (keno, casino table games, bingo, private betting, poker).
Lottery expenditure was significantly higher than the mean spend of $695 among people who were male, aged 50 and over, and lived with their partner.
The mean spending on instant scratch ticket expenditure varied little across sociodemographic groups, with a yearly mean spend of $248overall.
Electronic gaming machine expenditure was significantly higher than the mean spend of $1,292 among people who lived alone, and lived in a major city.
Race betting expenditure was significantly higher than the mean spend of $1,308among people who were male. The yearly average for males on this activity ($1,442) was around double that for females ($741).
Among sports betting participants (with a mean spend of $1,032), differences by sociodemographic characteristics were largely not statistically significant, although there was some variation apparent for the socio-economic status of the region, and household income.
Overall, variation in spending was much greater across activities than across sociodemographic characteristics.
| Lottery | Instant scratch tickets | EGMs | Race betting | Sports betting | |
|---|---|---|---|---|---|
| Subpopulation categories | $ | $ | $ | $ | $ |
| Overall | |||||
| All activity participants | 695 | 248 | 1,292 | 1,308 | 1,032 |
| Sex | |||||
| Male | 782↑ | 261 | 1,311 | 1,442↑ | 1,034 |
| Female | 598↓ | 237 | 1,268 | 741↓ | 1,017# |
| Age group | |||||
| 18-29 | 395↓ | 199 | 951↓ | 1,263 | 1,238 |
| 30-49 | 615↓ | 235 | 1,306 | 1,159 | 932 |
| 50-64 | 767↑ | 267 | 1,452 | 1,505 | 804 |
| 65+ | 790↑ | 263 | 1,305 | 1,293 | np |
| Indigenous status | |||||
| Non-Indigenous | 696 | 247 | 1,311 | 1,321 | 1,041 |
| Indigenous | 634 | 286 | 926 | 969 | 850 |
| Region of birth a | |||||
| Australia | 695 | 246 | 1,179↓ | 1,310 | 940 |
| Europe | 709 | 209 | 1,459 | 1,553 | 859 |
| Asia | 599 | 318 | 2,577 | 662#↓ | np |
| First language spoken | |||||
| English | 693 | 238 | 1,235 | 1,327 | 986 |
| Other | 661 | 319 | 2,169# | 1,252# | np |
| Highest education level | |||||
| Below year 10 | 653 | 306 | 1,432 | 905 | np |
| Completed year 10 | 756 | 254 | 1,442 | 1,261 | 1,185 |
| Completed year 12 | 713 | 179↓ | 1,118 | 1,313 | 874 |
| Certificate or diploma | 744 | 280 | 1,245 | 1,391 | 1,150 |
| Bachelors or higher | 560↓ | 199 | 1,282 | 1,292 | 808 |
| Employment | |||||
| Employed full-time | 699 | 252 | 1,396 | 1,411 | 904 |
| Employed part-time | 655 | 188↓ | 1,042 | 972 | 1,135 |
| Unemployed-looking for work | 518↓ | 203 | 1,352 | 1,285 | np |
| Retired | 750 | 267 | 1,240 | 1,222 | np |
| Full-time student | 362 | 399# | 439#↓ | np | np |
| Not employed-not looking for work | 636 | 279 | 1,664 | 1,414# | 547#↓ |
| Relationship status | |||||
| Married/in a de facto relationship | 693 | 258 | 1,234 | 1,248 | 939 |
| Single | 700 | 235 | 1,349 | 1,379 | 1,108 |
| Household composition | |||||
| Single adult household | 743 | 215 | 1,645↑ | 1,516 | 795 |
| Couple only household | 749↑ | 261 | 1,223 | 1,328 | 1,088 |
| Household with children | 571↓ | 245 | 1,250 | 988↓ | 762 |
| Multiple adult household | 728 | 253 | 1,228 | 1,451 | 1,253 |
| Housing Tenure | |||||
| Own outright | 752 | 223 | 1,226 | 1,437 | 1,562 |
| Own with mortgage | 697 | 251 | 1,333 | 1,253 | 889 |
| Rent | 632 | 264 | 1,322 | 1,247 | 1,005 |
| Remoteness | |||||
| Major city | 681 | 245 | 1,410↑ | 1,337 | 1,103 |
| Inner regional | 735 | 241 | 1,063↓ | 1,220 | 681 |
| Outer regional/remote | 714 | 274 | 1,102 | 1,293 | 1,059# |
| SEIFA quintile b | |||||
| Lowest | 731 | 284 | 1,242 | 1,246 | 641↓ |
| 2 | 761 | 260 | 1,252 | 1,456 | 867# |
| Middle | 662 | 242 | 1,295 | 1,116 | 1,034# |
| 4 | 716 | 248 | 1,212 | 1,149 | 1,107 |
| Highest | 615↓ | 205 | 1,522 | 1,559 | 1,326 |
| Equivalised disposable household income c | |||||
| <$29,500 | 716 | 237 | 1,199 | 1,085 | 1,057# |
| $29,500-$41,499 | 641 | 269 | 1,073 | 1,405 | 1,119 |
| $41,500-$53,999 | 654 | 306 | 1,440 | 1,015 | 839# |
| $54,000-$73,499 | 701 | 212↓ | 1,463 | 1,439 | 1,146 |
| $73,500+ | 761 | 207 | 1,294 | 1,538 | 1,001 |
| Main source of household income | |||||
| Wages/salary/business | 688 | 241 | 1,288 | 1,246 | 970 |
| Govt. pension/allowance/benefit | 744 | 288 | 1,318 | 1,305 | np |
| Superannuation/annuity/investment | 653 | 202 | 1,225 | 1,963 | 2,407# |
Notes: Values based on weighted data and capped expenditure. Percentages may not total 100% due to rounding or non-response. a Only regions of birth representing >10% of the population are presented. b Socio-Economic Indexes for Areas 2011. c Household income after tax, weighted for size and composition of household. ↑ and ↓ are used to indicate values significantly above or below overall mean spend at p<.05. Expenditure calculations exclude those who reported they had participated in an activity in a typical month, but who did not report a dollar amount when prompted for the expenditure.
6 As noted in Section 1, to reduce the impact of outliers (extreme high and low values) on estimates of gambling expenditure, estimates were Winsorised whereby values were capped at the top and bottom 1%.
4. Gambling problems and participation
Introduction
This chapter presents statistics on gambling participation and sociodemographic characteristics for regular gamblers whose gambling behaviour caused or put them at risk of problems in 2015, as assessed by the Problem Gambling Severity Index (PGSI; Ferris & Wynne, 2001). These people are referred to in this report as having experienced gambling-related problems.
Statistics include population-representative estimates of the proportion and number of Australians and regular gamblers who belonged to four PGSI risk groups: non-problem gamblers, low-risk gamblers, moderate-risk gamblers, and problem gamblers. Non-problem gamblers did not engage in problematic gambling behaviour or experience adverse consequences in 2015. Low-risk and moderate-risk gamblers were those who reported low or moderate level problematic behaviour and/or consequences. They are considered as being at low to moderate risk of becoming problem gamblers. Problem gamblers were those who reported severe problematic behaviour and/or consequences.
Further included are activity participation rates for each risk group and a comparison of sociodemographic characteristics between non-problem gamblers and risk group members.
Key findings
Participation:
- 7.9% or 1.39 million Australian adults were estimated to have experienced one or more gambling-related problems in 2015 (PGSI scores of 1+). This included 1.1% or 193,000 who could be classified as "problem gamblers" (PGSI scores of 8+) - those with the most severe problems and most at risk of further problems.
- 80% of those who had experienced gambling-related problems in the past year had gambled in a typical month of 2015.
- Adults in higher risk groups participated in a higher number of activities.
- 32-46% of participants in each activity except lotteries and instant scratch tickets had experienced gambling-related problems.
- Problem gamblers appeared to comprise particularly high proportions of private betting (12%), casino table game (15%), and poker (22%) participants.
Sociodemographic characteristics:
- Across the various activities, gamblers who experienced problems were relatively similar to each other in terms of their characteristics. Those who did not experience problems, viewed by activity, had more distinct profiles.
- Compared to non-problem gamblers, those who experienced problems were significantly over-represented among people who were male, aged 18-29, Indigenous, unemployed or not employed (excluding retirees and full-time students), single, renting, people who lived in a low socioeconomic area, had a low income, and drew their main source of income from welfare payments. They were under-represented among those who owned their own home, retirees, and university graduates.
Prevalence of gambling problems
Table 4.1 shows the number and prevalence of non-problem gamblers, low risk, moderate risk, and problem gamblers, (1) among the Australian adult population, and (2) among adults who gambled in a typical month of 2015 (i.e., regularly).
It is estimated that around 1.39 million (7.9%) Australian adults experienced one or more gambling-related problems in 2015 (PGSI scores of 1+). This included 193,000 (1.1%) who could be classified as problem gamblers (PGSI scores of 8+) - the most severe category.
These numbers include Australians who may not have actually gambled in 2015 but nevertheless experienced problems in 2015 due to their gambling behaviour in years prior. For example, problem gambling in 2013 may have caused financial problems that stretched into 2015.
Around 80% of those who reported problems in 2015 had gambled in a typical month of that year. Specifically, 1.13 million (17%) regular gamblers experienced problems including 139,000 (2.1%) problem gamblers.
| Australian adult population a | Regular gambler population | |||||||
|---|---|---|---|---|---|---|---|---|
| Activity | Estimated number '000 | 95% CI '000 | % | 95% CI | Estimated number '000 | 95% CI '000 | % | 95% CI |
| Non-gambler &/or non-problem gambler | 16,082 b | 15,924-16,239 | 92.1 | 91.3-92.8 | 5,655 | 5,448-5,863 | 83.3 | 81.6-84.8 |
| Low risk gambler | 731 | 643-818 | 4.2 | 3.7-4.7 | 593 | 517-670 | 8.7 | 7.7-9.9 |
| Moderate risk gambler | 462 | 393-531 | 2.6 | 2.3-3.1 | 402 | 344-461 | 5.9 | 5.2-6.8 |
| Problem gambler | 193 | 150-237 | 1.1 | 0.88-1.4 | 139 | 102-176 | 2.1 | 1.6-2.7 |
| Any risk | 1,386 | 1,251-1,522 | 7.9 | 7.2-8.7 | 1,136 | 1,017-1,254 | 16.7 | 15.2-18.4 |
| Moderate risk/ problem gambler | 656 | 569-742 | 3.7 | 3.3-4.3 | 542 | 470-614 | 8.0 | 7.0-9.1 |
Notes: Values are based on weighted data. Percentages may not total 100% due to rounding. a Includes those surveyed in HILDA who did not gamble in a typical month but nevertheless reported experiencing PGSI gambling problems in the past year. They may have been infrequent gamblers, or their problems may have been caused by gambling activity in previous years. b Includes both non-gamblers and infrequent gamblers who reported no problems.
Number of activities by risk group
Table 4.2 shows the proportion of gamblers in each risk group who participated in one or more of the 10 gambling activities during a typical month.
The majority of non-problem gamblers regularly participated in only one activity (68%) whereas the majority of those who experienced problems regularly participated in multiple activities. Those in higher risk groups were likely to have participated in a higher number of activities.
| Number of regular activities | Regular gambling population | Non-problem gamblers | Low risk gamblers | Moderate risk gamblers | Problem gamblers |
|---|---|---|---|---|---|
| % | % | % | % | % | |
| 1 | 61.6 | 67.5 | 38.1 | 25.1 | 26.0 |
| 2 | 24.2 | 22.9 | 35.3 | 27.1 | 22.9 |
| 3 | 9.8 | 7.3 | 17.1 | 26.2 | 29.8 |
| 4+ | 4.4 | 2.3 | 9.5 | 21.6 | 21.3 |
Notes: Values based on weighted data. Percentages may not total 100% due to rounding.
Number and proportion of activity participants by risk group
Table 4.3 shows the number of Australian adults who gambled on each activity in a typical month by risk group membership.
Note that because around two fifths (38%) of gamblers spent money on multiple activities in a typical month, they are represented within their risk group for each of the activities they participated in. It is therefore not possible on the basis of these figures alone to ascribe the problems reported by an individual to any one particular activity.
| Lottery | Instant scratch tickets | EGMs | Race betting | Sports betting | Keno | Casino table games | Bingo | Private betting | Poker | |
|---|---|---|---|---|---|---|---|---|---|---|
| '000 | '000 | '000 | '000 | '000 | '000 | '000 | '000 | '000 | '000 | |
| Non-problem gambler | 4,489 | 1,217 | 829 | 572 | 340 | 369 | 106 | 127 | 84 | 70 |
| Low risk gambler | 368 | 118 | 259 | 190 | 99 | 69 | 28 | 36 | 25# | 9# |
| Moderate risk gambler | 246 | 120 | 244 | 164 | 98 | 88 | 29 | 15# | 22# | 23 |
| Problem gambler | 69 | 33 | 85 | 50 | 36 | 21 | 28# | 7# | 18# | 28# |
| Total | 5,172 | 1,487 | 1,418 | 975 | 574 | 548 | 192 | 185 | 148 | 130 |
| Any risk | 683 | 271 | 589 | 403 | 234 | 178 | 86 | 58 | 64 | 60 |
| Moderate risk / problem gambler | 315 | 152 | 330 | 214 | 134 | 109 | 58 | 22 | 39 | 51 |
Notes: Values are based on weighted data. # RSE between 30% and 50%.
Lotteries had vastly larger numbers of non-problem gamblers (4.48 million) than any other activity. However, lotteries (683,000) along with EGMs (589,000) also had the greatest numbers of participants from all three risk groups, including the largest numbers of problem gamblers. A large number of regular race betting participants experienced problems as well (403,000).
Bingo, poker, casino table games, and private betting attracted the least numbers of regular gamblers with problems, with less than 100,000 participating in each.
Table 4.4 shows that the prevalence of past-year gambling problems was lowest among people who participated in lotteries (13%) and instant scratch tickets (18%). Rates were much higher across all other products, with problems experienced by 32% of bingo participants up to 46% of poker participants. Problem gamblers comprised particularly high proportions of private betting (12%), casino table game (15%), and poker (22%) participants.
| Lottery | Instant scratch tickets | EGMs | Race betting | Sports betting | Keno | Casino table games | Bingo | Private betting | Poker | |
|---|---|---|---|---|---|---|---|---|---|---|
| % | % | % | % | % | % | % | % | % | % | |
| Non-problem gambler | 86.8 | 81.8 | 58.5 | 58.6 | 59.3 | 67.4 | 55.3 | 68.6 | 56.6 | 53.7 |
| Low risk gambler | 7.1 | 7.9 | 18.2 | 19.4 | 17.3 | 12.7 | 14.7 | 19.6 | 16.7# | 6.9# |
| Moderate risk gambler | 4.8 | 8.0 | 17.2 | 16.8 | 17.1 | 16.1 | 15.3 | 7.9# | 14.5# | 17.7 |
| Problem gambler | 1.3 | 2.2 | 6.0 | 5.1 | 6.3 | 3.8 | 14.7# | 3.9# | 12.1# | 21.7# |
| Total | 100.0 | 100.0 | 100.0 | 100.0 | 100.0 | 100.0 | 100.0 | 100.0 | 100.0 | 100.0 |
| Any risk | 13.2 | 18.2 | 41.5 | 41.4 | 40.7 | 32.6 | 44.7 | 31.5 | 43.4 | 46.3 |
| Moderate risk / Problem gambler | 6.1 | 10.3 | 23.3 | 21.9 | 23.4 | 19.9 | 30.0 | 11.9 | 26.7 | 39.4 |
Notes: Values are based on weighted data. Percentage may not add to 100% due to rounding. # RSE between 30% and 50%
Together, the data from Tables 4.3 and 4.4 provide unique and important perspectives on each activity. For instance, lotteries attracted the largest number of people with gambling-related problems, and yet, those with gambling-related problems constituted only a small proportion of those who participated in lotteries, due to its overwhelming popularity. Likewise, poker, casino table games, and private betting attracted a much lower number of people with problems compared to all other activities, and yet, those with gambling-related problems constituted a much higher proportion of all those who participated in these particular activities. In fact, poker attracted the least number of regular gamblers, but the highest proportion of those with problems.
Risk group activity participation rates
Table 4.5 shows the proportion of risk group members who participated in each activity in a typical month. This is a transposition of the results presented in Table 4.4 which showed the proportions of activity participants who belonged to each risk group.
The majority of gamblers within all risk groups regularly participated in lotteries. It was most popular among non-problem gamblers with 79% participating. Those without problems were fairly unlikely to participate in any other form of gambling other than scratch tickets (22%).
For every other activity, rates of participation were higher among gamblers who experienced problems. Participation rates were especially high for EGMs (44% of low risk gamblers up to 61% of moderate risk and problem gamblers) and race betting (32% of low risk gamblers, 41% of moderate risk and 36% of problem gamblers), attracting a third or more of all risk group members. Sports betting was relatively popular as well, attracting a quarter of all moderate risk (24%) and problem gamblers (26%).
Casino table games, poker and private betting attracted very low proportions of gamblers within all but the problem gambler group (i.e., 13% of problem gamblers participated in private betting, 20% in casino table games and poker).
| Lottery | Instant scratch tickets | EGMs | Race betting | Sports betting | Keno | Casino table games | Bingo | Private betting | Poker | |
|---|---|---|---|---|---|---|---|---|---|---|
| % | % | % | % | % | % | % | % | % | % | |
| Non-problem gambler | 79.4 | 21.5 | 14.7 | 10.1 | 6.0 | 6.5 | 1.9 | 2.3 | 1.5 | 1.2 |
| Low risk gambler | 62.0 | 19.9 | 43.6 | 31.9 | 16.7 | 11.7 | 4.8 | 6.1 | 4.2 | 1.5 |
| Moderate risk gambler | 61.0 | 29.7 | 60.7 | 40.7 | 24.4 | 22.0 | 7.3 | 3.7 | 5.3 | 5.7 |
| Problem gambler | 49.5 | 23.7 | 61.4 | 35.9 | 25.9 | 14.9 | 20.2 | 5.3 | 12.9 | 20.2 |
| All gamblers | 76.5 | 22.2 | 21.1 | 14.5 | 8.6 | 8.3 | 2.9 | 2.8 | 2.3 | 2.0 |
Notes: Values based on weighted data. Percentages may not total 100% due to rounding. Values may not add to totals due to missing PGSI values for some participants.
Sociodemographic characteristics of risk groups
Table 4.6 shows the socioeconomic and demographic characteristics of each risk group, initially setting aside information about the types of gambling activities. Non-problem gamblers were compared to those with problems to identify characteristics that distinguished between them.
The overall pattern was one where a significantly higher proportion of those with gambling problems were male, aged 18-29, Indigenous, were unemployed or not employed (excluding retirees and fulltime students), single, lived in a house they rented, lived in a low socioeconomic area, had a low income, and drew their main source of income from a welfare payment, compared to those without problems.
A significantly lower proportion of gamblers with problems lived with children, or only their partner, owned their home with a mortgage, had a university degree, and were retired.
| Gambling risk group | |||||
|---|---|---|---|---|---|
| Australian Adults | Non-problem | Low risk | Moderate risk | Problem gamblers | |
| Subpopulation categories | % | % | % | % | % |
| Sex | |||||
| Male | 49.0 | 51.5 | 62.9↑ | 69.2↑ | 64.9 |
| Female | 51.0 | 48.0 | 37.1↓ | 30.8↓ | 35.1 |
| Age group | |||||
| 18-29 | 22.5 | 10.9 | 16.4↑ | 13.7 | 27.4↑ |
| 30-49 | 34.9 | 34.1 | 33.2 | 35.6 | 32.4 |
| 50-64 | 24.1 | 30.4 | 29.2 | 30.8 | 29.1 |
| 65+ | 18.6 | 24.6 | 21.2 | 19.9 | 11.1#↓ |
| Indigenous status | |||||
| Non-Indigenous | 97.7 | 98.1 | 97.3 | 93.9↓ | 89.0↓ |
| Indigenous | 2.3 | 1.9 | 2.7# | 6.1↑ | 11.0#↑ |
| Region of birth a | |||||
| Australia | 69.7 | 71.6 | 73.5 | 72.3 | 73.7 |
| Europe | 10.8 | 12.3 | 11.4 | 9.4 | 6.4# |
| Asia | 10.7 | 7.2 | 8.7# | 5.3 | 15.6# |
| First language spoken | |||||
| English | 85.6 | 90.7 | 87.0 | 92.0 | 80.6 |
| Other | 14.4 | 9.3 | 13.0 | 8.0 | 19.4 |
| Highest education Level | |||||
| Below year 10 | 8.1 | 8.8 | 9.1 | 11.6 | 8.7 |
| Completed year 10 | 15.3 | 18.9 | 18.0 | 19.2 | 29.3 |
| Completed year 12 | 15.8 | 12.7 | 15.4 | 13.2 | 14.1 |
| Certificate or Diploma | 33.1 | 37.6 | 39.6 | 44.3 | 29.9 |
| Bachelors or higher | 27.7 | 22.0 | 18.0 | 11.6↓ | 18.0 |
| Employment | |||||
| Employed full-time | 43.6 | 47.6 | 45.3 | 53.3 | 37.2 |
| Employed part-time | 20.1 | 16.5 | 16.4 | 12.3 | 17.6# |
| Unemployed-looking for work | 3.2 | 1.8 | 3.0 | 5.0# | 11.5#↑ |
| Retired | 19.7 | 25.7 | 22.6 | 22.1 | 8.5#↓ |
| Full-time student | 3.4 | 0.9 | 3.4# | np | np |
| Other not employed-not looking for work | 9.9 | 7.6 | 9.3 | 6.2 | 20.0↑ |
| Relationship status | |||||
| Married/in a de facto relationship | 54.6 | 62.1 | 48.4↓ | 50.0↓ | 30.1↓ |
| Single | 45.4 | 37.9 | 51.6↑ | 50.0↑ | 69.9↑ |
| Household composition | |||||
| Single adult household | 12.3 | 13.6 | 15.3 | 17.6 | 19.7# |
| Couple only household | 24.4 | 29.2 | 27.0 | 26.7 | 18.5↓ |
| Household with children | 30.3 | 25.7 | 26.2 | 25.6 | 18.1↓ |
| Multiple adult household | 33.0 | 31.5 | 31.5 | 30.1 | 43.7 |
| Housing tenure | |||||
| Own outright | 17.3 | 19.0 | 16.2 | 14.7 | 11.8# |
| Own with mortgage | 52.7 | 54.5 | 45.8↓ | 51.5 | 39.1↓ |
| Rent | 27.7 | 24.3 | 34.8↑ | 30.9 | 45.8#↑ |
| Remoteness | |||||
| Major city | 72.5 | 68.8 | 69.9 | 71.8 | 77.0 |
| Inner regional | 18.2 | 19.8 | 21.9 | 18.0 | 17.2 |
| Outer regional/remote | 9.3 | 11.4 | 8.2 | 10.2 | 5.8#↓ |
| SEIFA quintile b | |||||
| Lowest | 19.6 | 18.3 | 25.4↑ | 28.7↑ | 20.5 |
| 2 | 18.2 | 19.8 | 17.3 | 22.2 | 13.3↓ |
| Middle | 19.3 | 20.0 | 20.3 | 15.3 | 20.5 |
| 4 | 20.6 | 20.7 | 17 | 17.4 | 13.6 |
| Highest | 22.4 | 21.2 | 20.1 | 16.5 | 32.1 |
| Equivalised disposable household income c | |||||
| <$29,500 | 19.8 | 18.2 | 25.0↑ | 23.9↑ | 20.2 |
| $29,500-$41,499 | 20.4 | 19.0 | 23.0 | 18.2 | 23.6 |
| $41,500-$53,999 | 19.4 | 20.4 | 18.1 | 21.5 | 19.4 |
| $54,000-$73,499 | 20.2 | 21.2 | 16.1↓ | 21.4 | 23.5 |
| $73,500+ | 20.2 | 21.2 | 17.8 | 15↓ | 13.3 |
| Main source of household income | |||||
| Wages/salary/business | 73.5 | 70.8 | 66.4 | 71.6 | 67.8 |
| Govt. pension/allowance/benefit | 18.2 | 19.7 | 26.5↑ | 23.6 | 21.2 |
| Superannuation/annuity/investment | 8.1 | 9.1 | 7.0 | 4.3↓ | 11.0# |
Notes: Percentages based on weighted data. Percentages may not total 100% due to rounding or non-response.
a Only regions of birth representing >10% of the population are presented. b Socio-Economic Indexes for Areas 2011. c Household income after tax, weighted for size and composition of household. # RSE between 30% and 50%. np - data not presented due to insufficient responses or RSE >50%. ↑ and ↓ are used to indicate values significantly above or below non-problem gamblers at p<.05.
Sociodemographic characteristics of risk groups by activity
This subsection provides a brief sociodemographic comparison of non-problem gamblers and those with problems among those who participated in lotteries, instant scratch tickets, EGMs, race betting or sports betting. Detailed tables are presented for each of these activities. Cell sample sizes were not large enough to examine the remaining activities at this level of detail.
These tables are largely provided for reference, and so only limited analysis is presented below, highlighting some key observations:
Lotteries: Compared to non-problem lottery participants, a higher proportion of participants who experienced problems were male, had a certificate or diploma-level qualification, were not employed, single, lived in a home they rented, lived in a low socioeconomic area, and had a low income (Table 4.7).
Instant scratch tickets: A higher proportion of participants who experienced problems were male, aged 18-29, were employed full-time, and lived in a home they rented, compared to non-problem participants (Table 4.8).
Electronic gaming machines: A higher proportion of problem participants were male, aged 30-49, single, lived alone or in a family with children, lived in a home they rented, and drew their main source of income from a welfare payment, compared to non-problem participants (Table 4.9).
Race betting: A higher proportion of participants with problems were male, single, and lived in a home they rented, compared to non-problem participants (Table 4.10).
Sports betting: A higher proportion of participants who experienced problems were male, aged 18-29, single, and lived in a home they rented, compared to non-problem participants (Table 4.11).
| Gambling risk group | |||||
|---|---|---|---|---|---|
| Australian adults | Non-problem | Low risk | Moderate risk | Problem | |
| Subpopulation categories | % | % | % | % | % |
| Sex | |||||
| Male | 49.0 | 51.5 | 57.0 | 69.1↑ | 66.0 |
| Female | 51.0 | 48.5 | 43.0 | 30.9↓ | 34.0 |
| Age group | |||||
| 18-29 | 22.5 | 6.0 | 7.6 | 4.8 | 17.3# |
| 30-49 | 34.9 | 36.3 | 31.4 | 36.0 | 33.2 |
| 50-64 | 24.1 | 32.7 | 38.1 | 36.6 | 40.5 |
| 65+ | 18.6 | 25.0 | 22.9 | 22.6 | 9.0# |
| Indigenous status | |||||
| Non-Indigenous | 97.7 | 98.4 | 98.0 | 96.8 | 82.0 |
| Indigenous | 2.3 | 1.6 | 2.0# | 3.2# | 18.0# |
| Region of birth a | |||||
| Australia | 69.7 | 69.6 | 69.9 | 67.6 | 74.9 |
| Europe | 10.8 | 13.3 | 13.9 | 13.1 | 12.9 |
| Asia | 10.7 | 8.1 | 9.7# | 5.5# | np |
| First language spoken | |||||
| English | 85.6 | 89.6 | 85.0 | 89.7 | 85.8 |
| Other | 14.4 | 10.4 | 15.0 | 10.3 | 14.2 |
| Highest education level | |||||
| Below year 10 | 8.1 | 9.2 | 9.7 | 11.2 | 9.4# |
| Completed year 10 | 15.3 | 18.8 | 20.3 | 18.4 | 30.9 |
| Completed year 12 | 15.8 | 10.8 | 11.3 | 14.1 | 17.9# |
| Certificate or diploma | 33.1 | 38.7 | 41.8 | 47.6↑ | 29.5 |
| Bachelors or higher | 27.7 | 22.5 | 16.9 | 8.8↓ | 12.3# |
| Employment | |||||
| Employed full-time | 43.6 | 48.6 | 48.9 | 55.3 | 44.4 |
| Employed part-time | 20.1 | 16.2 | 15.6 | 11.4 | 7.5#↓ |
| Unemployed-looking for work | 3.2 | 1.7 | 2.5 | np | np |
| Retired | 19.7 | 25.8 | 22.9 | 23.9 | 8.4↓ |
| Full-time student | 3.4 | 0.4# | np | np | np |
| Other not employed-not looking for work | 9.9 | 7.4 | 9.7 | 5.3# | 21.9↑ |
| Relationship status | |||||
| Married/in a de facto relationship | 54.6 | 66.1 | 54.2↓ | 57.0 | 35.9↓ |
| Single | 45.4 | 33.9 | 45.8↑ | 43.0 | 64.1↑ |
| Household composition | |||||
| Single adult household | 12.3 | 13.0 | 13.7 | 17.0 | 22.6 |
| Couple only household | 24.4 | 30.0 | 30.3 | 29.8 | 21.7# |
| Household with children | 30.3 | 26.7 | 23.9 | 22.7 | 17.3# |
| Multiple adult household | 33.0 | 30.3 | 32.1 | 30.5 | 38.4 |
| Housing tenure | |||||
| Own outright | 17.3 | 19.7 | 16.3 | 14.4 | np |
| Own with mortgage | 52.7 | 55.7 | 49.4 | 56.5 | 34.9↓ |
| Rent | 27.7 | 22.4 | 31.2↑ | 25.3 | 54.9↑ |
| Remoteness | |||||
| Major city | 72.5 | 69.8 | 69.7 | 71.5 | 72.0 |
| Inner regional | 18.2 | 19.0 | 21.4 | 17.0 | 21.1# |
| Outer regional/remote | 9.3 | 11.2 | 8.9 | 11.5 | np |
| SEIFA quintile b | |||||
| Lowest | 19.6 | 17.4 | 26.4↑ | 31.3↑ | 29.1 |
| 2 | 18.2 | 19.9 | 17.8 | 24.0 | 14.2# |
| Middle | 19.3 | 20.2 | 21.9 | 12.7↓ | 17.0# |
| 4 | 20.6 | 20.6 | 14.9↓ | 14.5 | 15.4# |
| Highest | 22.4 | 21.9 | 19.0 | 17.5 | 24.3 |
| Equivalised disposable household income c | |||||
| <$29,500 | 19.8 | 17.3 | 24.5 | 24.4 | 31.1 |
| $29,500-$41,499 | 20.4 | 19.5 | 19.9 | 18.7 | 15.7 |
| $41,500-$53,999 | 19.4 | 20.2 | 22.2 | 20.1 | 15.0# |
| $54,000-$73,499 | 20.2 | 21.2 | 17.5 | 21.7 | 19.8# |
| $73,500+ | 20.2 | 21.8 | 16.0↓ | 15.1 | 18.4# |
| Main source of household income | |||||
| Wages/salary/business | 73.5 | 71.9 | 66.2 | 71.7 | 63.2 |
| Govt. pension/allowance/benefit | 18.2 | 18.7 | 25.3 | 24.4 | 22.8 |
| Superannuation/annuity/investment | 8.1 | 9.1 | 8.2 | 3.9#↓ | 14.0# |
Notes: Percentages based on weighted data. Percentages may not total 100% due to rounding or non-response.
a Only regions of birth representing >10% of the population are presented. b Socio-Economic Indexes for Areas 2011. c Household income after tax, weighted for size and composition of household. # RSE between 30% and 50%. np - data not presented due to insufficient responses or RSE >50%. ↑ and ↓ are used to indicate values significantly above or below non-problem gamblers at p<.05.
| Gambling risk group | |||||
|---|---|---|---|---|---|
| Australian adults | Non-problem | Low risk | Moderate risk | Problem | |
| Subpopulation categories | % | % | % | % | % |
| Sex | |||||
| Male | 49.0 | 43.4 | 41.8 | 68.7↑ | 55.6 |
| Female | 51.0 | 56.6 | 58.2 | 31.3↓ | 44.4# |
| Age group | |||||
| 18-29 | 22.5 | 11.1 | 15.9 | 16.0 | 42.2#↑ |
| 30-49 | 34.9 | 29.9 | 28.8 | 39.7 | 30.0# |
| 50-64 | 24.1 | 32.9 | 36.5 | 30.3 | 27.8# |
| 65+ | 18.6 | 26.0 | 18.8 | 14.0#↓ | np |
| Indigenous status | |||||
| Non-Indigenous | 97.7 | 97.2 | 98.0 | 96.2 | 80.6# |
| Indigenous | 2.3 | 2.8 | 2.0 | np | np |
| Region of birth a | |||||
| Australia | 69.7 | 72.7 | 69.5 | 75.3 | 74.1 |
| Europe | 10.8 | 10.4 | 10.5# | 9.3# | np |
| Asia | 10.7 | 6.0 | 9.2# | np | np |
| First language spoken | |||||
| English | 85.6 | 91.9 | 81.5 | 96.1 | 78.8 |
| Other | 14.4 | 8.1 | 18.5# | 3.9 | 21.2 |
| Highest education level | |||||
| Below year 10 | 8.1 | 9.3 | 7.4# | 9.6# | np |
| Completed year 10 | 15.3 | 19.3 | 26.0 | 19.8 | 39.9# |
| Completed year 12 | 15.8 | 11.3 | 18.3 | 16.4 | np |
| Certificate or diploma | 33.1 | 36.8 | 32.4 | 43.5 | 25.9# |
| Bachelors or higher | 27.7 | 23.2 | 15.9 | 10.7#↓ | 29.0# |
| Employment | |||||
| Employed full-time | 43.6 | 42.8 | 36.9 | 61.8↑ | 33.1# |
| Employed part-time | 20.1 | 18.4 | 18.5 | 10.2↓ | np |
| Unemployed-looking for work | 3.2 | 1.5 | 3.7# | np | np |
| Retired | 19.7 | 27.3 | 21.6 | 16.6↓ | np |
| Full-time student | 3.4 | 1.0 | np | np | np |
| Other not employed-not looking for work | 9.9 | 9.0 | 16.9 | 4.3#↓ | 16.1# |
| Relationship status | |||||
| Married/in a de facto relationship | 54.6 | 58.3 | 48.7 | 53.1 | 32.3# |
| Single | 45.4 | 41.7 | 51.3 | 46.9 | 67.7 |
| Household composition | |||||
| Single adult household | 12.3 | 14.7 | 12.0 | 17.6 | np |
| Couple only household | 24.4 | 29.0 | 27.3 | 25.3 | np |
| Household with children | 30.3 | 21.6 | 26.8 | 22.2 | 23.7# |
| Multiple adult household | 33.0 | 34.7 | 33.9 | 34.8 | 37.8# |
| Housing Tenure | |||||
| Own outright | 17.3 | 19.0 | 23.0 | 15.1# | np |
| Own with mortgage | 52.7 | 51.5 | 36.9↓ | 55.2 | 44.2 |
| Rent | 27.7 | 27.0 | 38.1 | 27.4 | 55.8↑ |
| Remoteness | |||||
| Major city | 72.5 | 64.9 | 65.7 | 67.5 | 69.6 |
| Inner regional | 18.2 | 21.8 | 24.0 | 15.5# | np |
| Outer regional/remote | 9.3 | 13.3 | np | 17.0# | np |
| SEIFA quintile b | |||||
| Lowest | 19.6 | 19.8 | 32.9 | 26.2 | 29.6# |
| 2 | 18.2 | 18.4 | 18.1 | 21.1 | np |
| Middle | 19.3 | 19.4 | 16.1# | 13.2# | 17.8# |
| 4 | 20.6 | 20.9 | 15.4 | 21.1 | np |
| Highest | 22.4 | 21.6 | 17.5 | 18.4 | 34.1# |
| Equivalised disposable household income c | |||||
| <$29,500 | 19.8 | 19.2 | 23.3 | 20.5 | 34.3# |
| $29,500-$41,499 | 20.4 | 19.3 | 20.0# | 13.2 | np |
| $41,500-$53,999 | 19.4 | 22.6 | 25.6 | 21.6# | np |
| $54,000-$73,499 | 20.2 | 19.6 | 17.1# | 24.6 | 24.9# |
| $73,500+ | 20.2 | 19.2 | 14.0# | 20.1# | np |
| Main source of household income | |||||
| Wages/salary/business | 73.5 | 70.0 | 68.0 | 80.0 | 72.0 |
| Govt. pension/allowance/benefit | 18.2 | 20.7 | 27.7 | 15.1 | np |
| Superannuation/annuity/investment | 8.1 | 9.0 | 4.3#↓ | 3.2#↓ | np |
Notes: Percentages based on weighted data. Percentages may not total 100% due to rounding or non-response.
a Only regions of birth representing >10% of the population are presented. b Socio-Economic Indexes for Areas 2011. c Household income after tax, weighted for size and composition of household. # RSE between 30% and 50%. np - data not presented due to insufficient responses or RSE >50%. ↑ and ↓ are used to indicate values significantly above or below non-problem gamblers at p<.05.
| Gambling risk group | |||||
|---|---|---|---|---|---|
| Australian adults | Non-problem | Low risk | Moderate risk | Problem | |
| Subpopulation categories | % | % | % | % | % |
| Sex | |||||
| Male | 49.0 | 50.8 | 57.0 | 61.5↑ | 59.6 |
| Female | 51.0 | 49.2 | 43.0 | 38.5↓ | 40.4 |
| Age group | |||||
| 18-29 | 22.5 | 15.8 | 15.2 | 15.4 | 22.6# |
| 30-49 | 34.9 | 23.1 | 21.1 | 33.5↑ | 36.2 |
| 50-64 | 24.1 | 30.0 | 30.2 | 27.6 | 30.4 |
| 65+ | 18.6 | 31.1 | 33.5 | 23.5 | 10.8#↓ |
| Indigenous status | |||||
| Non-Indigenous | 97.7 | 96.6 | 96.5 | 91.4 | 87.4 |
| Indigenous | 2.3 | 3.4 | 3.5# | 8.6# | 12.6# |
| Region of birth a | |||||
| Australia | 69.7 | 80.0 | 75.7 | 73.6 | 79.2 |
| Europe | 10.8 | 12.4 | 14.1 | 10.7 | 9.2 |
| Asia | 10.7 | 2.2# | 6.2#↑ | 5.9# | np |
| First language spoken | |||||
| English | 85.6 | 96.3 | 89.3↓ | 93.4 | 90.6 |
| Other | 14.4 | 3.7# | 10.7↑ | 6.6# | 9.4# |
| Highest education level | |||||
| Below year 10 | 8.1 | 12.0 | 14.6 | 9.3 | 11.1# |
| Completed year 10 | 15.3 | 22.3 | 17.1 | 21.0 | 30.0 |
| Completed year 12 | 15.8 | 16.9 | 17.7 | 14.0 | 17.1# |
| Certificate or diploma | 33.1 | 37.6 | 40.3 | 44.6 | 31.5 |
| Bachelors or higher | 27.7 | 11.2 | 10.4 | 11.1 | 10.4# |
| Employment | |||||
| Employed full-time | 43.6 | 38.4 | 32.6 | 49.9↑ | 30.7 |
| Employed part-time | 20.1 | 17.1 | 19.4 | 12.6 | 23.5# |
| Unemployed-looking for work | 3.2 | 2.7 | 3.8# | 6.2# | 13.6# |
| Retired | 19.7 | 33.3 | 35.8 | 24.0↓ | 13.9#↓ |
| Full-time student | 3.4 | 1.0# | np | np | np |
| Other not employed-not looking for work | 9.9 | 7.4 | 5.9 | 5.7# | 18.4 |
| Relationship status | |||||
| Married/in a de facto relationship | 54.6 | 54.1 | 51.6 | 44.5 | 22.7↓ |
| Single | 45.4 | 45.9 | 48.4 | 55.5 | 77.3↑ |
| Household composition | |||||
| Single adult household | 12.3 | 12.0 | 15.8 | 20.1↑ | 24.7↑ |
| Couple only household | 24.4 | 32.3 | 32.9 | 27.8 | 12.6↓ |
| Household with children | 30.3 | 12.9 | 19.7 | 23.1↑ | 20.4 |
| Multiple adult household | 33.0 | 42.8 | 31.5↓ | 29.0↓ | 42.3 |
| Housing tenure | |||||
| Own outright | 17.3 | 20.0 | 21.4 | 16.4 | 17.4# |
| Own with mortgage | 52.7 | 53.6 | 46.3 | 46.8 | 29.2↓ |
| Rent | 27.7 | 23.8 | 30.5 | 34.3↑ | 50.3↑ |
| Remoteness | |||||
| Major city | 72.5 | 63.4 | 65.1 | 66.6 | 72.1 |
| Inner regional | 18.2 | 24.2 | 26.7 | 23.6 | 19.6 |
| Outer regional/remote | 9.3 | 12.3 | 8.1 | 9.8 | np |
| SEIFA quintile b | |||||
| Lowest | 19.6 | 27.1 | 29.0 | 30.0 | 22.3# |
| 2 | 18.2 | 20.3 | 18.4 | 22.7 | 19.4 |
| Middle | 19.3 | 20.0 | 20.4 | 17.3 | 23.4 |
| 4 | 20.6 | 17.6 | 17.6 | 15.5 | 14.8# |
| Highest | 22.4 | 15.1 | 14.5 | 14.6 | 20.1# |
| Equivalised disposable household income c | |||||
| <$29,500 | 19.8 | 23.2 | 29.0 | 27.7 | 26.3 |
| $29,500-$41,499 | 20.4 | 18.3 | 23.5 | 19.1 | 21.1 |
| $41,500-$53,999 | 19.4 | 22.9 | 20.5 | 20.3 | 18.9# |
| $54,000-$73,499 | 20.2 | 19.8 | 15.3 | 20.8 | 24.4 |
| $73,500+ | 20.2 | 15.8 | 11.7 | 12.1 | 9.4# |
| Main source of household income | |||||
| Wages/salary/business | 73.5 | 63.2 | 52.1↓ | 65.6 | 58.1 |
| Govt. pension/allowance/benefit | 18.2 | 26.5 | 38.7↑ | 28.5 | 29.8 |
| Superannuation/annuity/investment | 8.1 | 10.2 | 9.2 | 5.1#↓ | np |
Notes: Percentages based on weighted data. Percentages may not total 100% due to rounding or non-response.
a Only regions of birth representing >10% of the population are presented. b Socio-Economic Indexes for Areas 2011. c Household income after tax, weighted for size and composition of household. # RSE between 30% and 50%. np - data not presented due to insufficient responses or RSE >50%. ↑ and ↓ are used to indicate values significantly above or below non-problem gamblers at p<.05.
| Gambling Risk Group | |||||
|---|---|---|---|---|---|
| Australian adults | Non-problem | Low risk | Moderate risk | Problem | |
| Subpopulation categories | % | % | % | % | % |
| Sex | |||||
| Male | 49.0 | 74.0 | 90.0↑ | 91.9↑ | 89.4↑ |
| Female | 51.0 | 26.0 | 10.0↓ | 8.1#↓ | np |
| Age group | |||||
| 18-29 | 22.5 | 13.4 | 21.0 | 13.9 | 24.0# |
| 30-49 | 34.9 | 32.4 | 33.9 | 44.9 | 33.7 |
| 50-64 | 24.1 | 33.4 | 28.0 | 26.0 | 39.6 |
| 65+ | 18.6 | 20.8 | 17.1 | 15.1 | np |
| Indigenous Status | |||||
| Non-Indigenous | 97.7 | 97.8 | 97.2 | 93.3 | 87.5 |
| Indigenous | 2.3 | 2.2# | 2.8# | 6.7# | 12.5# |
| Region of birth a | |||||
| Australia | 69.7 | 82.3 | 77.4 | 77.9 | 84.7 |
| Europe | 10.8 | 7.8 | 10.7 | 9.6# | np |
| Asia | 10.7 | np | np | np | np |
| First language spoken | |||||
| English | 85.6 | 96.8 | 89.4 | 95.6 | 93.2 |
| Other | 14.4 | 3.2# | np | 4.4# | np |
| Highest education level | |||||
| Below year 10 | 8.1 | 4.7 | 8.9# | 8.4# | np |
| Completed year 10 | 15.3 | 23.4 | 13.9↓ | 14.0↓ | 26.8# |
| Completed year 12 | 15.8 | 14.8 | 19.3 | 16.9 | np |
| Certificate or diploma | 33.1 | 40.2 | 36.0 | 49.4 | 30.9 |
| Bachelors or higher | 27.7 | 16.9 | 22.0 | 11.4 | 24.7# |
| Employment | |||||
| Employed full-time | 43.6 | 54.4 | 54.4 | 60.3 | 56.9 |
| Employed part-time | 20.1 | 15.6 | 18.6 | 12.8 | 8.8# |
| Unemployed-looking for work | 3.2 | 2.3# | np | 6.2# | np |
| Retired | 19.7 | 22.0 | 18.3 | 18.2 | np |
| Full-time student | 3.4 | np | np | np | np |
| Other not employed-not looking for work | 9.9 | 4.2 | np | np | 18.4# |
| Relationship status | |||||
| Married/in a de facto relationship | 54.6 | 59.5 | 45.3↓ | 52.8 | 28.8#↓ |
| Single | 45.4 | 40.5 | 54.7↑ | 47.2 | 71.2↑ |
| Household composition | |||||
| Single adult household | 12.3 | 14.4 | 15.6 | 15.3 | 19.5# |
| Couple only household | 24.4 | 31.0 | 28.1 | 28.2 | 21.5# |
| Household with children | 30.3 | 24.9 | 23.7 | 27.9 | 22.6 |
| Multiple adult household | 33.0 | 29.7 | 32.6 | 28.6 | 36.4 |
| Housing tenure | |||||
| Own outright | 17.3 | 22.9 | 14.5 | 12.4↓ | np |
| Own with mortgage | 52.7 | 52.8 | 54.9 | 58.6 | 37.6 |
| Rent | 27.7 | 23.3 | 25.8 | 28.1 | 43.0↑ |
| Remoteness | |||||
| Major city | 72.5 | 63.8 | 69.4 | 73.2 | 70.3 |
| Inner regional | 18.2 | 21.2 | 20.7 | 14.1 | 18.7# |
| Outer regional/remote | 9.3 | 15.0 | 9.9 | 12.7 | np |
| SEIFA quintile b | |||||
| Lowest | 19.6 | 22.4 | 20.3 | 23.0 | 23.5# |
| 2 | 18.2 | 18.4 | 23.1 | 20.7 | 15.4# |
| Middle | 19.3 | 16.3 | 10.7 | 12.5 | 20.9# |
| 4 | 20.6 | 26.9 | 16.2↓ | 21.7# | 12.5#↓ |
| Highest | 22.4 | 16.0 | 29.7↑ | 22.1 | 27.7# |
| Equivalised disposable household income c | |||||
| <$29,500 | 19.8 | 15.0 | 22.0 | 20.3 | 20.3# |
| $29,500-$41,499 | 20.4 | 17.2 | 18.3 | 17.4 | 18.6# |
| $41,500-$53,999 | 19.4 | 23.6 | 15.1 | 19.9 | np |
| $54,000-$73,499 | 20.2 | 19.2 | 16.6 | 18.2 | 32.1 |
| $73,500+ | 20.2 | 25.1 | 28.0 | 24.3 | 14.6# |
| Main source of household income | |||||
| Wages/salary/business | 73.5 | 74.9 | 77.0 | 77.3 | 72.6 |
| Govt. pension/allowance/benefit | 18.2 | 16.9 | 15.5# | 19.2 | 20.3# |
| Superannuation/annuity/investment | 8.1 | 8.2 | 7.5# | 3.5#↓ | np |
Notes: Percentages based on weighted data. Percentages may not total 100% due to rounding or non-response.
a Only regions of birth representing >10% of the population are presented. b Socio-Economic Indexes for Areas 2011. c Household income after tax, weighted for size and composition of household. # RSE between 30% and 50%. np - data not presented due to insufficient responses or RSE >50%. ↑ and ↓ are used to indicate values significantly above or below non-problem gamblers at p<.05.
| Gambling Risk Group | |||||
|---|---|---|---|---|---|
| Australian adults | Non-problem | Low risk | Moderate risk | Problem | |
| Subpopulation categories | % | % | % | % | % |
| Sex | |||||
| Male | 49.0 | 84.1 | 92.6↑ | 96.3↑ | 89.7 |
| Female | 51.0 | 15.9 | 7.4#↓ | np | np |
| Age group | |||||
| 18-29 | 22.5 | 29.2 | 45.1↑ | 32.1 | 34.3# |
| 30-49 | 34.9 | 42.7 | 39.0 | 46.5 | 37.0# |
| 50-64 | 24.1 | 20.2 | 12.1# | 15.9# | 28.7# |
| 65+ | 18.6 | 7.9 | np | 5.4# | np |
| Indigenous status | |||||
| Non-Indigenous | 97.7 | 97.2 | 94.6 | 94.3 | 82.7 |
| Indigenous | 2.3 | 2.8# | 5.4# | np | np |
| Region of birth a | |||||
| Australia | 69.7 | 82.4 | 85.5 | 75.9 | 85.5 |
| Europe | 10.8 | 6.8# | np | np | np |
| Asia | 10.7 | np | np | np | np |
| First language spoken | |||||
| English | 85.6 | 97.5 | 95.7 | 97.3 | 87.6 |
| Other | 14.4 | np | np | np | np |
| Highest education level | |||||
| Below year 10 | 8.1 | 5.0# | np | np | np |
| Completed year 10 | 15.3 | 15.4 | 10.6# | 12.6# | 24.5# |
| Completed year 12 | 15.8 | 20.4 | 35.8 | 18.8# | np |
| Certificate or diploma | 33.1 | 29.7 | 25.9 | 52.0↑ | 36.4# |
| Bachelors or higher | 27.7 | 29.5 | 26.8 | 15.8# | 28.6# |
| Employment | |||||
| Employed full-time | 43.6 | 73.0 | 63.0 | 75.4 | 51.6 |
| Employed part-time | 20.1 | 11.9 | 21.2 | 13.6# | np |
| Unemployed-looking for work | 3.2 | np | np | np | np |
| Retired | 19.7 | 9.5 | 5.4# | np | np |
| Full-time student | 3.4# | np | np | np | np |
| Other not employed-not looking for work | 9.9 | 3.2 | np | np | np |
| Relationship status | |||||
| Married/in a de facto relationship | 54.6 | 50.7 | 28.8↓ | 44.8 | 29.3 |
| Single | 45.4 | 49.3 | 71.2↑ | 55.2 | 70.7 |
| Household composition | |||||
| Single adult household | 12.3 | 10.3 | 22.2 | 14.9 | np |
| Couple only household | 24.4 | 24.2 | 24.4 | 26.3 | np |
| Household with children | 30.3 | 25.1 | 18.9 | 30.0 | 16.7 |
| Multiple adult household | 33.0 | 40.4 | 34.5 | 28.8 | 54.4 |
| Housing tenure | |||||
| Own outright | 17.3 | 13.5 | 20.3 | 21.2 | np |
| Own with mortgage | 52.7 | 59.9 | 38.3↓ | 58.1 | 44.8 |
| Rent | 27.7 | 26.1 | 39.0 | 20.7# | 46.7↑ |
| Remoteness | |||||
| Major city | 72.5 | 75.6 | 79.3 | 81.2 | 74.4 |
| Inner regional | 18.2 | 18.1 | 15.5 | 13.1# | 18.0# |
| Outer regional/remote | 9.3 | 6.3 | np | 5.7# | np |
| SEIFA quintile b | |||||
| Lowest | 19.6 | 20.5 | 12.5# | 22.0 | 23.8 |
| 2 | 18.2 | 16.2 | 15.1 | 9.6# | np |
| Middle | 19.3 | 14.5 | 19.2 | 12.6# | np |
| 4 | 20.6 | 24.2 | 25.3# | 31.7# | 10.3#↓ |
| Highest | 22.4 | 24.6 | 27.9 | 24.2# | 41.7 |
| Equivalised disposable household income c | |||||
| <$29,500 | 19.8 | 10.5 | 8.3# | 8.0# | np |
| $29,500-$41,499 | 20.4 | 13.3 | 33.1↑ | 15.9# | np |
| $41,500-$53,999 | 19.4 | 18.7 | 6.9#↓ | 23.6# | np |
| $54,000-$73,499 | 20.2 | 23.9 | 21.4# | 20.7 | 31.1 |
| $73,500+ | 20.2 | 33.6 | 30.3 | 31.9 | np |
| Main source of household income | |||||
| Wages/salary/business | 73.5 | 87.9 | 94.2 | 91.9 | 78.6 |
| Govt. pension/allowance/benefit | 18.2 | 8.3 | np | 6.1# | np |
| Superannuation/annuity/investment | 8.1 | 3.4 | np | np | np |
Notes: Percentages based on weighted data. Percentages may not total 100% due to rounding or non-response.
a Only regions of birth representing >10% of the population are presented. b Socio-Economic Indexes for Areas 2011. c Household income after tax, weighted for size and composition of household. # RSE between 30% and 50%. np - data not presented due to insufficient responses or RSE >50%. ↑ and ↓ are used to indicate values significantly above or below non-problem gamblers at p<.05
5. Gambling problems and expenditure
Introduction
This chapter extends the previous ones, by examining the information on typical past-year expenditure by regular gamblers, in conjunction with the gambling problems risk groups described in the previous chapter (as assessed by the Problem Gambling Severity Index (PGSI; Ferris & Wynne, 2001). Estimates include national expenditure and mean expenditure by risk-level, both overall and on each activity.
As noted in Chapter 3, the estimates of expenditure were calculated by multiplying regular gamblers' self-reported typical monthly spend by 12. The estimates therefore do not represent total gambling expenditure for the year, which would include amounts from higher and lower spend months, and expenditure on activities where participation was less than monthly.7
Key findings
- Gamblers who had problems (i.e., the combined low-risk, moderate-risk and problem gamblers), representing 17% of regular gamblers, accounted for nearly half of all expenditure by regular gamblers in 2015 ($3.63b or 42%), and more than half of all expenditure by regular gamblers on EGMs, race betting, sports betting, casino table games and private betting (59-69%).
- The low risk, moderate risk and problem gambler groups each spent around one third of their typical gambling expenditure on EGMs (32-36%) and one fifth on race betting (19%-22%).
- Expenditure per gambler was higher among those in higher risk groups. Non-problem gamblers averaged $883 over the year whereas problem gamblers averaged $6,241.
- The strength of relationship between expenditure and gambler risk status varied markedly across products. Lottery, keno and instant scratch ticket expenditure had the weakest connection. Race betting, EGMs and particularly sports betting expenditure had a much stronger connection with risk.
- The biggest typical gambling outlays were made by problem gamblers who participated in race betting ($8,141 on average) and sports betting ($9,716 on average), noting that they spent at least half of these amounts on other activities.
National gambling expenditure by risk group
Table 5.1 shows HILDA survey-based estimates of national expenditure on each activity by regular participants belonging to each risk group. Figure 5.1 displays these estimates as proportions of national activity expenditure by risk group.
Non-problem gamblers, representing 83% of adults who gambled in a typical month, accounted for a little over half ($4.96b or 58%) of typical gambling expenditure by regular gamblers in 2015. Those who experienced gambling-related problems, representing 17% of typical monthly gamblers, accounted for a little under half ($3.63b or 42%).
In terms of specific activities, non-problem gamblers accounted for most of the money spent on lotteries ($2.87b or 80%) which was their highest-spend activity. They also accounted for the majority of money spent on instant scratch tickets and bingo.
Those with gambling problems accounted for the majority of money spent on EGMs, which was their highest spend activity ($1.23b or 67%), as well as casino table games, sports betting, race betting and private betting.
Non-problem gamblers and those with problems each accounted for around half of keno and poker expenditure.
| Non-problem gamblers | Low risk gamblers | Moderate risk gamblers | Problem gamblers | |||||
|---|---|---|---|---|---|---|---|---|
| Activity | $M | 95% CI | $M | 95% CI | $M | 95% CI | $M | 95% CI |
| Lottery | 2,874 | (2,700-3,048) | 362 | (284-439) | 262 | (175-348) | 76 | (38-115) |
| Instant scratch tickets | 277 | (237-317) | 44# | (15-73) | 30 | (17-43) | 15 | (2-29) |
| EGMs | 594 | (503-684) | 420 | (276-564) | 525 | (396-653) | 282# | (160-404) |
| Race betting | 502 | (426-579) | 241 | (173-309) | 335 | (246-424) | 187 | (86-288) |
| Sports betting | 229 | (153-306) | 86 | (50-123) | 131# | (50-212) | 132# | (23-242) |
| Keno | 125 | (90-159) | 39 | (25-53) | 47 | (22-72) | 15 | (4-26) |
| Casino table games | 79 | (41-117) | 61 | (1-121) | 42# | (11-73) | 75# | (14-135) |
| Bingo | 107 | (65-150) | 34 | (16-52) | 9 | (3-14) | 6 | (0-13) |
| Private betting | 53 | (28-79) | 9# | (2-15) | 41# | (8-74) | 27# | (1-54) |
| Poker | np | - | np | - | 58# | (9-108) | 36# | (10-63) |
| Any gambling | 4,963 | (4,668-5,257) | 1,302 | (1,002-1,603) | 1,478 | (1,217-1,740) | 853 | (550-1,156) |
Notes: Values based on weighted data and capped expenditure. Expenditure calculations exclude those who reported they had participated in an activity in a typical month, but who did not report a dollar amount when prompted for the expenditure. Expenditure may not add to totals due to missing PGSI values for some participants. # RSE between 30% and 50%. np - data not presented due to insufficient responses or RSE >50%.
Figure 5.1: Proportion of national past-year activity expenditure accounted for by each risk group
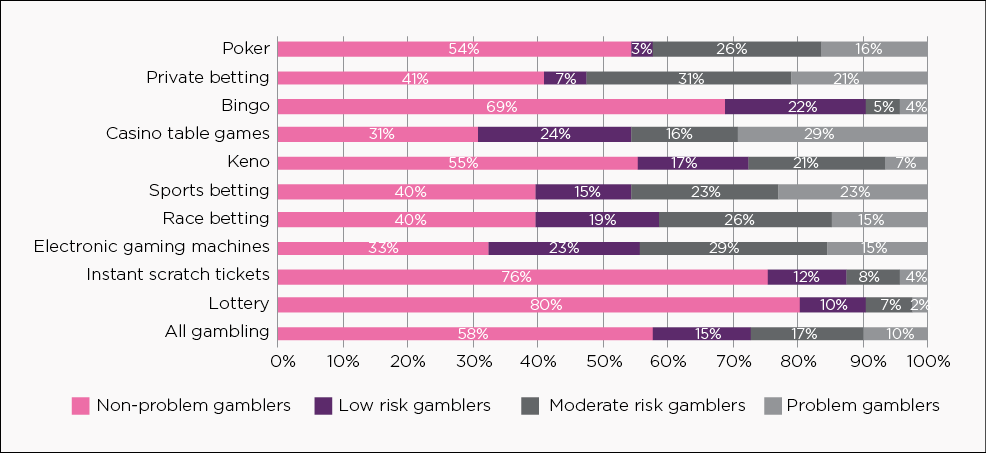
Figure 5.2 shows the proportion of each risk group's total regular expenditure spent on each activity.
The overall pattern was one where higher risk groups spent more of their total regular gambling outlay on EGMs, race betting, sports betting, and casino table games and less on lotteries and instant scratch tickets.
As a group, non-problem gamblers spent more than half of their total typical gambling outlay on lotteries (58%), with the remainder spread widely across other activities. In contrast, the low risk, moderate risk, and problem gamblers each spent around a third of their total gambling outlay on EGMs (32-35%) and a fifth on race betting (19-23%). Low risk and moderate risk gamblers also spent substantial portions on lotteries (28% and 18%) while problem gamblers spent more on sports betting (15%) than lotteries (9%).
Figure 5.2: Proportion of risk group expenditure on each activity
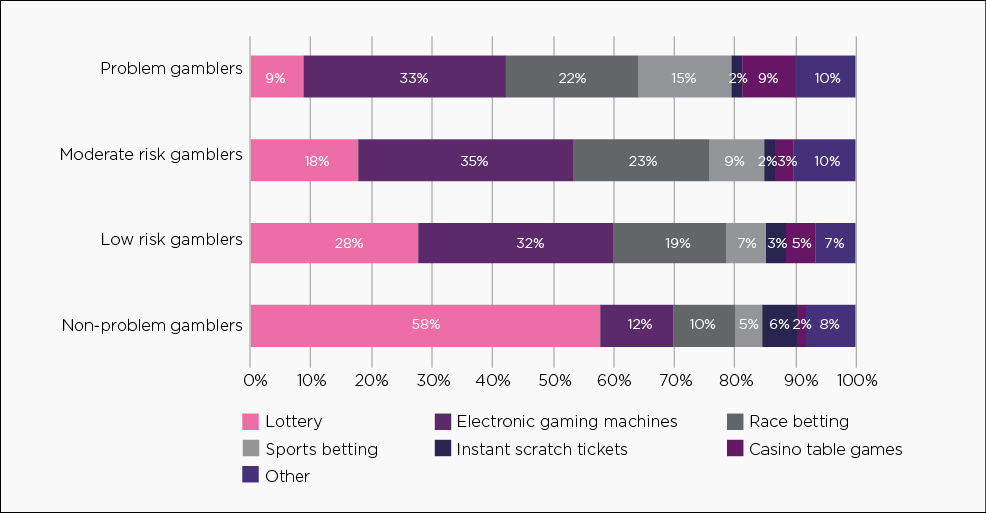
Mean gambling expenditure by risk group
Turning now to the perspective of individuals' spending, within each risk group, Table 5.2 and Figure 5.3 show estimates of mean past-year expenditure on the 10 gambling activities. Note that mean expenditure estimates for casino table games, bingo, private betting and poker were unreliable across most risk groups. This was because of small participant numbers within each risk group and the large variations in the expenditure they reported. While their means are provided, those marked as unreliable were not interpreted.
The table shows that average gambling expenditure was higher for adults in higher risk groups. Illustrating this, expenditure was lowest among non-problem gamblers whose typical monthly gambling amounted to an average of $883 per participant over 2015. Expenditure peaked among problem gamblers who spent seven times as much on average ($6,241).
With respect to the valid activity estimates for non-problem gamblers, yearly expenditure was low for keno ($353, on average) and instant scratch tickets ($229 on average), and for other activities averages were in the range of $645 for lottery up to $887 for race betting. Low-risk, moderate-risk and problem gamblers each spent substantially more on average on EGMs and race betting than on other products. Problem gamblers spent the highest amounts, on EGMs, race betting and sports betting ($3,343-3,910).
While all activities saw a higher spend among problem gamblers, what was also apparent was that the strength of relationship between expenditure and gambler risk status varied widely across products. Lottery, keno and instant scratch ticket expenditure showed the weakest rise across risk groups, with problem gambling participants spending twice as much on average as those without problems. EGM expenditure showed a much steeper rise, with problem gamblers spending five times as much as non-problem gamblers. Race and particularly sports betting expenditure showed an exponential rise across risk groups, with expenditure doubling between non-problem gamblers and moderate risk participants, and doubling or tripling again for problem gambling participants.
| Non-problem gamblers | Low risk gamblers | Moderate risk gamblers | Problem gamblers | |||||
|---|---|---|---|---|---|---|---|---|
| Activity | $ | 95% CI | $ | 95% CI | $ | 95% CI | $ | 95% CI |
| Lottery | 645 | (612-677) | 990↑ | (829-1,151) | 1,072↑ | (828-1,315) | 1,136↑ | (657-1,616) |
| Instant scratch tickets | 229 | (200-258) | 376 | (191-561) | 256 | (171-342) | 465# | (110-820) |
| EGMs | 720 | (628-811) | 1,623↑ | (1,195-2,052) | 2,177↑ | (1,820-2,534) | 3,343↑ | (2,275-4,411) |
| Race betting | 887 | (751-1,022) | 1,285↑ | (1,020-1,550) | 2,042↑ | (1,640-2,445) | 3,815↑ | (2,556-5,074) |
| Sports betting | 693 | (469-916) | 877 | (555-1,199) | 1,343 | (748-1,938) | 3,910↑ | (1,821-5,998) |
| Keno | 353 | (286-420) | 570↑ | (422-719) | 532 | (300-763) | 723 | (298-1,147) |
| Casino table games | 775 | (556-994) | 2,200# | (102-4,299) | 1,425# | (550-2,299) | 2,651# | (343-4,959) |
| Bingo | 872 | (657-1,087) | 926 | (544-1,309) | 579# | (195-964) | 995# | (5-1,984) |
| Private betting | 686 | (463-909) | 351# | (53-650) | 1,908# | (619-3,197) | 1,529↑ | (822-2,236) |
| Poker | np | - | 1,045# | (9-2,082) | 2,530# | (729-4,331) | 1,296 | (878-1,714) |
| Any gambling | 883 | (840-925) | 2,205↑ | (1,858-2,552) | 3,685↑ | (3,182-4,189) | 6,241↑ | (4,994-7,488) |
Notes: Values are based on weighted data and capped expenditure. Expenditure calculations exclude those who reported they had participated in an activity in a typical month, but who did not report a dollar amount when prompted for the expenditure. Expenditure may not add to totals due to missing PGSI values for some participants # RSE between 30% and 50%. np - data not presented due to insufficient responses or RSE >50%. ↑ and ↓ are used to indicate values significantly above or below non-problem gambler expenditure at p<.05.
Figure 5.3: Mean past-year expenditure by regular activity participants belonging to each risk group
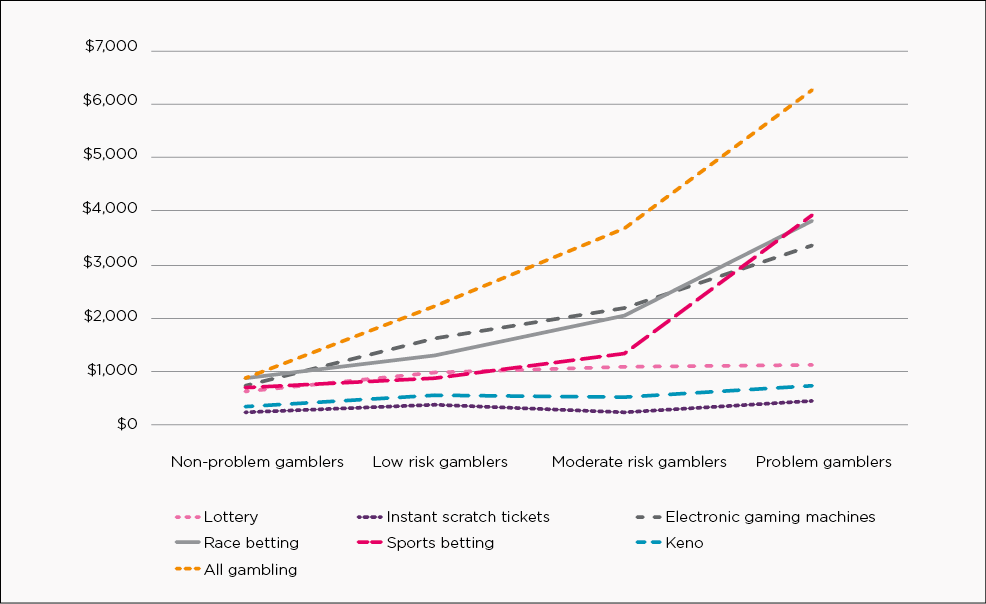
Table 5.3 shows participants' mean expenditure on each activity as a proportion of their total gambling outlay.
Non-problem gamblers who participated in any given activity spent the majority or close to the majority of their total personal gambling outlay on that activity. For instance, non-problem gamblers who participated in lotteries spent 84% on average of their total gambling outlay on that activity (e.g., the average spend of $645 would come from an estimated total outlay of $764).
Low-risk participants spent the majority of their money on single activities as well, except for those who participated in instant scratch tickets, keno, and potentially private betting, where the proportions outlaid were around 30%.
Among moderate-risk and problem gamblers, only race betting and EGMs attracted the majority of participants' total outlays (47% to 61%). Casino gaming, sports betting, and poker attracted 30% to 40% on average. Private betting, keno and instant scratch tickets attracted much less.
These findings are of course related to the findings presented earlier (see Table 4.2) in which we reported that non-problem gamblers often have only one regular gambling activity, while the moderate risk and problem gamblers often reported having multiple activities they participated in.
| Non-problem gamblers | Low risk gamblers | Moderate risk gamblers | Problem gamblers | |
|---|---|---|---|---|
| Activity | % | % | % | % |
| Lottery | 84.4 | 54.3 | 37.1 | 25.2 |
| Instant scratch tickets | 44.3 | 29.0 | 13.4 | 16.1# |
| EGMs | 59.8 | 61.4 | 59.7 | 61.4 |
| Race betting | 54.8 | 50.5 | 47.3 | 46.9 |
| Sports betting | 48.5 | 46.2 | 32.2 | 40.2 |
| Keno | 38.5 | 28.2 | 16.2 | 11.9 |
| Casino table games | 62.7 | 53.7 | 35.9 | 37.3 |
| Bingo | 63.6 | 42.1 | 35.3 | np |
| Private betting | 56.6 | 27.0# | 23.2# | 23.0# |
| Poker | 59.8 | 48.8# | 31.0 | 29.2 |
Notes: Values based on weighted data and capped expenditure. Expenditure calculations exclude those who reported they had participated in an activity in a typical month, but who did not report a dollar amount when prompted for the expenditure. Expenditure may not add to totals due to missing PGSI values for some participants # RSE between 30% and 50%. np - data not presented due to insufficient responses or RSE >50%.
Figure 5.4 shows mean past-year expenditure by activity participants, by risk group, on each activity and on gambling overall.
The figure shows that while higher risk gamblers generally spent more than lower risk gamblers on all the activities they participated in, those who participated in certain activities were likely to spend much more, on the activity and overall, than higher risk gamblers who participated in other activities.
For instance, higher risk gamblers who regularly participated in instant scratch tickets spent the least, on this activity and overall. Those who regularly participated in sports betting, spent the most, on this activity and overall.
The biggest mean gambling outlays were made by problem gamblers who participated in race betting ($8,141), and sports betting ($9,716), noting that they spent at least half of their outlays on other activities.
Together these findings illustrate the importance of considering gamblers' overall gambling outlay, not just their expenditure on a single product, when considering links between expenditure and problem gambling risk status. Higher risk gamblers are likely to spend more on gambling overall - particularly those attracted to EGMs, race and sports betting - and to spread their outlay over a range of activities rather than a single activity. Lower risk gamblers spend less overall and on fewer products.
Figure 5.4: Mean past-year activity expenditure and estimated total gambling expenditure by regular participants belonging to each risk group
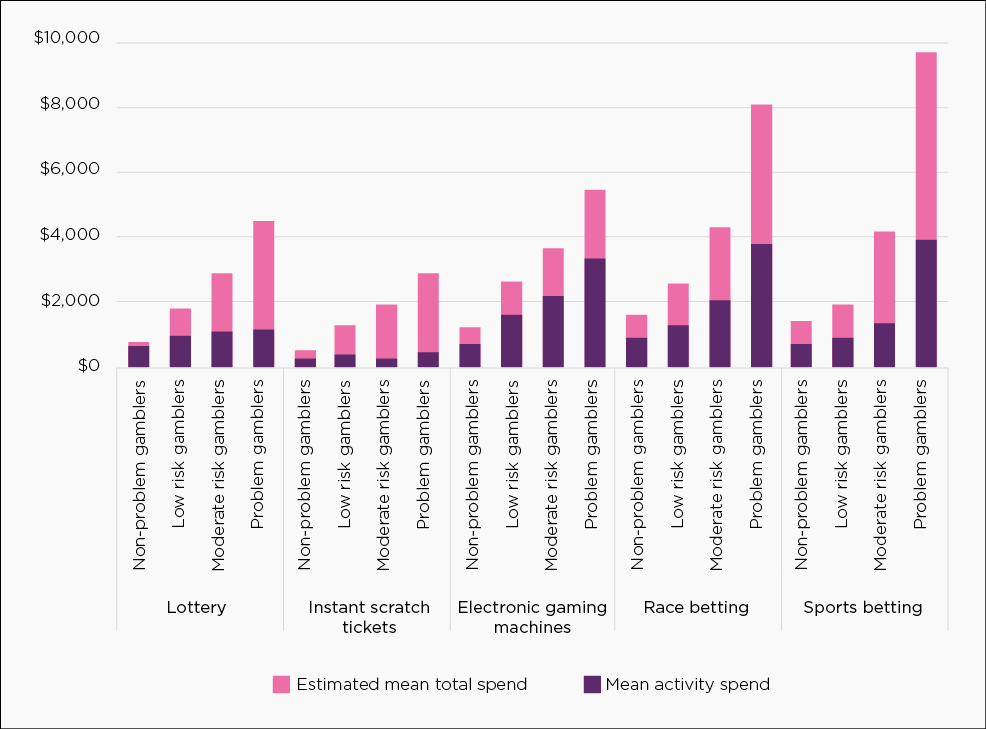
7 To reduce the impact of outliers on estimates of overall spend, expenditure estimates were run using a Winsorised technique where values were capped at the top and bottom 1%.
6. Gambling and the household budget
Introduction
This chapter presents gambling expenditure in the context of household budgets, and explores the impact of gambling expenditure on households of different income levels. Gambling expenditure is compared to spending on two essential consumable groups, groceries and utilities. Expenditure on these three groups is compared and examined as a proportion of the combined disposable income of all household members in homes containing a gambler. Expenditure patterns are examined across five household income quintiles ranging from low income to high income households, and also across risk groups. Rates of household financial stress are also compared across risk groups. Details of variables used are provided in Appendix C.
Key findings
- Gamblers in the lowest income quintile households spent a much greater proportion of their household incomes on gambling compared to those in the highest income households (10.4% vs 1.3%), despite a lower average spend in dollar terms ($1,661 vs $2,386).
- Higher risk gamblers within each household income quintile spent greater proportions of the household's disposable income on gambling. Problem gamblers in the lowest income households spent the greatest proportion (27%) - equivalent to four times the average yearly household utility bills, and more than half the grocery bills, of that income group.
- Households containing higher risk gamblers experienced a much higher rate of stressful financial events than those of lower risk gamblers. 51% of problem gamblers lived in households where someone had to ask for financial help; 27% were unable to pay the mortgage or rent on time.
Gambling expenditure as a proportion of household disposable income
Gamblers' households are the units of observation in this subsection, meaning that income refers to the sum of all household members' disposable incomes in homes containing a gambler. Gambling, grocery and utility expenditure likewise refer to the sum of all members' expenditure in homes containing a gambler. Table 6.1 shows that in gambling households there was an average of 1.4 regular gamblers. The mean number of gamblers per household was less in lower income households, reflecting their having a smaller average number of adults.
Table 6.1 shows that gamblers in lower income households spent a much greater proportion of their household's disposable income on gambling than middle and higher income households. Among households in the lowest income quintile, gamblers spent 10% of disposable income available to all members on their gambling activities. Among middle income homes, this was 2%. Among homes in the highest income quintile, this was only 1%.
Figure 6.1 expands on the expenditure information to also show the proportion of gambling households' disposable income spent on groceries8 and utilities9. Compared to expenditure on essential consumables, gambling accounted for a similar proportion of disposable income as utility bills across most households. Groceries accounted for four to six times as much. The lowest income households were an exception, with gambling accounting for 60% more disposable income than utilities.
| Disposable household income | Mean income | Mean household gambling expenditure | % of income spent on gambling | Mean number of adult household members | Mean number of adult household members who are gamblers |
|---|---|---|---|---|---|
| <$38,000 | 26,019 | 1,661 | 10.4 | 1.4 | 1.2 |
| $38,000-$63,749 | 51,371 | 1,806 | 3.6 | 1.8 | 1.3 |
| $63,750-$92,499 | 77,675 | 1,675 | 2.2 | 2.2 | 1.3 |
| $92,500-$131,999 | 110,921 | 2,035 | 1.9 | 2.5 | 1.4 |
| $132,000+ | 207,194 | 2,386 | 1.3 | 2.9 | 1.4 |
| All gambling households | 96,874 | 1,930 | 3.6 | 2.2 | 1.4 |
Notes: Values are based on weighted data and uncapped expenditure at a household level. Annual income and expenditure data are presented.
Figure 6.1: Proportion of gambling households' disposable income spent on groceries, utilities and gambling, by income quintile
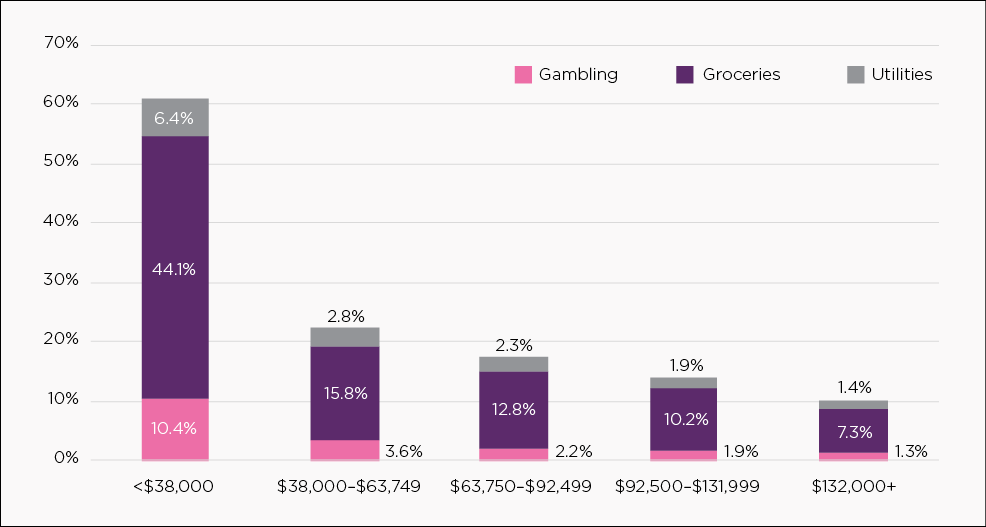
Gambling expenditure as a proportion of household income by risk group
Individuals' expenditure on gambling was further compared to the total disposable income brought into their household by all members, by risk group membership.
The pattern of lower income households spending a higher proportion of household income on gambling was even stronger when a member was a higher risk gambler (Figure 6.2). Table 6.2 provides further context to these findings, showing the dollar values these proportions represent for the average household income in each quintile.
A remarkable finding was the relative impact that problem gambling had on households with different income levels. Among homes in the lowest income quintile, problem gamblers spent an average of 27% of their households' disposable income on gambling. Among households in the highest income quintile, problem gamblers spent only 4% of household income.
Among non-problem gamblers, those in low income homes were spending on average about 5% of their total household budget on gambling, compared to 1% in middle income homes and 0.5% in high income homes. This figure (5%) is also higher than the percentage of total household income spent by problem gamblers from homes in the two highest income quintiles.
Figure 6.2: Proportion of gambling households' disposable income spent on gambling, by risk group and income quintile
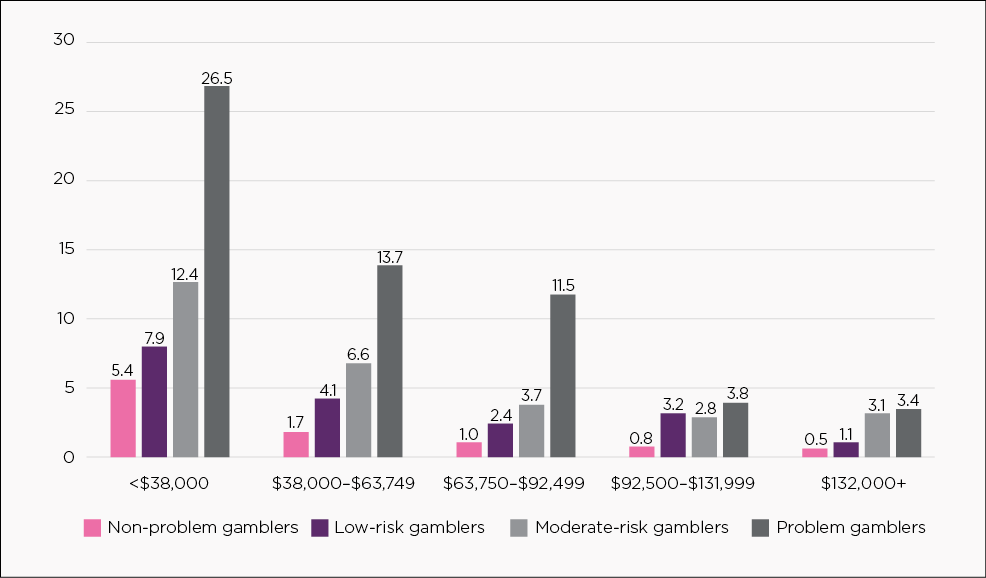
| Non-problem gamblers | low risk gamblers | Moderate risk gamblers | Problem gamblers | ||||||
|---|---|---|---|---|---|---|---|---|---|
| Disposable household income | Mean income | % spent | $ value | % spent | $ value | % spent | $ value | % spent | $ value |
| <$38,000 | 26,019 | 5.4 | 1,410 | 7.9 | 2,048 | 12.4 | 3,234 | 26.5# | 6,891 |
| $38,000-$63,749 | 51,371 | 1.7 | 889 | 4.1 | 2,127 | 6.6 | 3,389 | 13.7 | 7,033 |
| $63,750-$92,499 | 77,675 | 1.0 | 802 | 2.4 | 1,844 | 3.7 | 2,857 | 11.5 | 8,960 |
| $92,500-$131,999 | 110,921 | 0.8 | 862 | 3.2 | 3,515 | 2.8 | 3,130 | 3.8 | 4,247 |
| $132,000+ | 207,194 | 0.5 | 1,101 | 1.1 | 2,248 | 3.1 | 6,362 | 3.4 | 7,055 |
Notes: Values based on weighted data and capped expenditure at a participant level. Percentages may not total 100% due to rounding. Expenditure calculations exclude those who reported they had participated in an activity in a typical month, but who did not report a dollar amount when prompted for the expenditure. # RSE between 30% and 50%.
Financial stress
All household members aged 15 or above were asked whether they had experienced range of stressful events in the past year, such as going without meals or being unable to pay bills on time, due to a shortage of money. As financial stress may be experienced differently by different household members, these answers were combined to show whether any household member had experienced these events. Rates of household financial stress were compared across gambling risk groups to explore the relationship between gambling-related problems and household financial wellbeing. Table 6.3 presents the proportion of Australian adults and adult gamblers whose households experienced common stressful financial events in 2015.
It is evident that households containing gamblers who had problems experienced a much higher proportion of events than those of non-gamblers. Conversely, a lower proportion of non-problem gamblers' households experienced stressful financial events than those of non-gamblers. Risky gambling behaviour, but not gambling participation in and of itself, was associated with a higher likelihood of household members reporting any stressful financial event.
Most common to all risk groups were the experiences of being unable to pay electricity, gas or telephone bills on time, and needing to ask friends or family for financial help. Around one in five non-problem gamblers' households experienced these events, increasing across risk groups to one half of problem gamblers' households asking for help. Following the same pattern, a quarter of households containing problem gamblers were unable to pay the mortgage or rent on time, and went without meals - events experienced in less than one in 10 non-problem gamblers' households. The findings show that problematic gambling behaviour is strongly connected to the financial wellbeing of households.
| Australia | Regular gamblers | Non-gambler | Non-problem gambler | Low risk gambler | Moderate risk gambler | Problem gambler | |
|---|---|---|---|---|---|---|---|
| Someone in householda | % | % | % | % | % | % | % |
| Could not pay electricity, gas or telephone bills on time | 18.5 | 18.7 | 18.3 | 17.1 | 23.0 | 30.7↑ | 33.8↑ |
| Could not pay the mortgage or rent on time | 9.4 | 9.5 | 9.3 | 8.6 | 10.0 | 16.3↑ | 26.7↑ |
| Pawned or sold something | 8.9 | 8.6 | 9.1 | 7.7 | 11.6 | 11.6 | 28.0↑ |
| Went without meals | 5.5 | 4.8 | 5.9 | 3.9↓ | 6.2 | 9.9 | 21.4↑ |
| Was unable to heat home | 5.1 | 5.0 | 5.2 | 4.2 | 7.1 | 8.3 | 17.4↑ |
| Asked for financial help from friends or family | 19.7 | 17.7 | 21.0 | 15.7↓ | 23.7 | 25.8 | 50.8↑ |
| Asked for help from welfare/ community organisations | 6.4 | 5.6 | 6.9 | 4.5↓ | 11.1↑ | 8.5 | 18.5↑ |
| Experienced any event | 31.0 | 29.8 | 31.8 | 27.2↓ | 37.2 | 44.8↑ | 60.9↑ |
| Experienced two or more events | 18.6 | 18.3 | 18.7 | 16.4↓ | 23.3 | 29.1↑ | 44.2↑ |
Notes: Values based on weighted data. Percentages may not total 100% due to rounding. ↑ and ↓ are used to indicate values significantly above or below non-gamblers at p<.05 a - Combined response of all responding household members aged 15 or over
7. Conclusion
The new gambling questions included in the 2015 HILDA survey have enabled detailed analysis of regular gambling activity in Australia for the first time. This report has presented a compilation of statistics, taking the approach of describing the characteristics of regular gamblers and their gambling expenditure, describing the degree to which they experience gambling-related problems, and relating this to household income, expenditure, and financial stress. The format and style has followed that used in prior prevalence studies, such that it is intended as a resource for policy makers and researchers. Clearly, much more detailed research using this new data source is possible, and in the future, this can be extended with longitudinal gambling research. The research presented here has nevertheless highlighted the potential risks to households of gambling behaviours, and also the ways in which the characteristics of regular gamblers, and those participating in particular gambling activities, compare to the Australian population. This information is important in advancing our understanding of gambling activity in Australia.
Appendices
Appendix A: Comparisons with other Australian data sources
The statistics in this Appendix are intended to provide points of comparison between the HILDA Survey data and recent Australian gambling surveys.
Participation
Table 7.1 shows the past year participation rates reported in the most recent state and national gambling prevalence studies, alongside the monthly participation rates surveyed in the HILDA Survey.
Comparison with the two national gambling surveys suggests that the monthly gamblers identified in the HILDA Survey represented approximately 60% of Australians who gambled in the past year. Around two-thirds of past-year lottery participants were represented, indicating that most buy tickets on a regular basis. Casino table gaming was an occasional event for most, with only 15% of past-year participants represented in the HILDA Survey. Between 30-40% of past-year participants in all other activities appear likely to be regular gamblers.
| HILDA | National a | National b | NSW c | Vic d | Qld e | SA f | Tas g | ACT h | NT i | |
|---|---|---|---|---|---|---|---|---|---|---|
| Year of data collection | 2015 | 2012/ 2013 | 2011 | 2011 | 2014 | 2011/ 2012 | 2012 | 2013 | 2014 | 2015 |
| Lottery | 29.7 | 49.2 | 43.2 | 41 | 46.9 | 59 | 55.5 | 43.0 | 33.4 | 46.1 |
| Instant scratch tickets | 8.6 | 22.0 | 31.5 | 28 | 10.7 | na | 20.7 | 20.6 | 15.1 | 17.5 |
| EGMs | 8.2 | 20.7 | 19.4 | 27 | 16.7 | 30 | 26.5 | 18.6 | 30.2 | 22.9 |
| Race betting | 5.6 | 15.9 | 22.4 | 24 | 20.6 | 19 | 20.5 | 10.5 | 17.6 | 22.8 |
| Sports | 3.3 | 5.7 | 13.3 | 7 | 4.8 | 5 | 6.1 | 4.4 | 6.9 | 7.5 |
| Keno | 3.2 | 7.2 | 8.9 | 14 | 3.7 | 16 | 7.7 | 26.0 | 2.9 | 25.4 |
| Casino games | 1.1 | 5.9 | 8.7 | 6 | 5.1 | 6 | 6.1 | 6.3 | 5.8 | 13.4 |
| Bingo | 1.1 | 3.0 | 2.9 | 2 | 2.6 | 3 | na | 1.7 | na | 2.0 |
| Any gambling | 38.9 | 63.9 | 64.3 | 65 | 70.1 | 74 | 68.8 | 61.2 | 55.1 | 68.2 |
Notes: Excluding HILDA, all participation rates refer to past-year activity. Reference notations in table. Reference acronyms.
Sources: a Dowling et al., 2016; b Hing et al. 2014; c Sproston et al., 2012; d Hare, 2015; e Office of Economic and Statistical Research, 2012; f The Social Research Centre, 2013; g ACIL Allen Consulting et al., 2014; h Davidson et al., 2016; i Stevens et al., 2017.
Table 7.2 shows monthly participation rates reported by three Australian state and territory surveys. These are the only surveys to provide monthly participation statistics, and cover the smallest Australian jurisdictions. They nevertheless provide some points of comparison with the national monthly participation rates derived from the HILDA Survey. They illustrate the variability in activity participation between these jurisdictions and Australia as a whole.
| HILDA (National) | Tasmania 2013 a | ACT 2014 a | NT 2015 a | |
|---|---|---|---|---|
| Activity | Adult population (%) | |||
| Lottery | 29.7 | 23.1 | 16.3 | 15.2 |
| Instant scratch tickets | 8.6 | 5.4 | 3.5 | 2.7 |
| EGMs | 8.2 | 4.4 | 5.2 | 4.1 |
| Race betting | 5.6 | 3.4 | 2.8 | 4.6 |
| Sports betting | 3.3 | 1.5 | 2.6 | 2.7 |
| Keno | 3.2 | 7.8 | 0.2 | 5.3 |
| Casino table games | 1.1 | 0.7 | 0.7 | 0.8 |
| Bingo | 1.1 | 0.4 | 0.3 | 0.4 |
| Private betting | 0.9 | 0.5 | na | na |
| Poker | 0.8 | na | na | na |
| Any gambling | 38.9 | 34.1 | 24.9 | 37.2 |
| Gambling population b (%) | ||||
| Lottery | 76.5 | 67.7 | 65.5 | 40.8 |
| Instant scratch tickets | 22.2 | 15.8 | 14.1 | 7.0 |
| EGMs | 21.1 | 12.9 | 20.9 | 11.1 |
| Race betting | 14.5 | 10.0 | 11.2 | 12.2 |
| Sports betting | 8.6 | 4.4 | 10.4 | 6.8 |
| Keno | 8.3 | 22.9 | 0.8 | 14.3 |
| Casino table games | 2.9 | 2.1 | 2.8 | 2.2 |
| Bingo | 2.8 | 1.2 | 1.2 | 1.0 |
| Private betting | 2.3 | 1.5 | na | na |
| Poker | 2.0 | na | na | na |
| Any gambling | 100.0 | 100.0 | 100.0 | 100.0 |
Notes: na - not available. a calculated from data presented in report. b Any monthly gambling participation.
Sources: ACIL Allen Consulting et al., 2014; Davidson et al., 2016; Stevens, 2017.
Expenditure
Table 7.3 shows mean participant past-year expenditure by activity, derived from the HILDA Survey and the Tasmanian and Australian Capital Territory (ACT) prevalence surveys. These were the only Australian surveys to provide mean gambling expenditure statistics at the time of writing. As would be expected, the HILDA Survey estimates, which reflect the mean expenditure of regular gamblers, are much higher than the estimates from these two studies, which reflect the mean expenditure of those who gambled at least once in the past year.
| HILDA (National) 2015 | Tasmania 2013 a | ACT 2014 a | |
|---|---|---|---|
| $ | $ | $ | |
| Lottery | 695 | 448 | 337 |
| Instant scratch tickets | 248 | 94 | 72 |
| EGMs | 1,292 | 682 | 633 |
| Race betting | 1,308 | 1,186 | 309 |
| Sports betting | 1,032 | 551 | 200 |
| Keno | 425 | 286 | na |
| Casino table games | 1,369 | 395 | 225 |
| Bingo | 863 | 211 | na |
| Any gambling | 1,272 | 964 | 605 |
Notes: na - not available. a Mean spend per gambler (any participation in past year). HILDA Survey values based on weighted data and capped expenditure. All values expressed in 2015 dollars.
Sources: ACIL Allen Consulting et al., 2014; Davidson et al., 2016.
Table 7.4 shows total past-year gambling expenditure statistics supplied by the Australian gambling industry (Queensland Government Statistician's Office 2016), alongside totals derived from the HILDA, Tasmanian and ACT self-report surveys.
The total expenditure figures reported by industry are much higher overall than the estimates derived from the self-report surveys. A contributing factor is that the industry figures reflect the total past-year expenditure of all gamblers in the respective jurisdictions including tourists, whereas the Tasmanian and ACT survey figures reflect the sum of resident gamblers' typical expenditure in the past year. The surveys therefore exclude amounts from non-residents as well as untypically high spend events or periods on each activity. The HILDA Survey figure is even further limited to the past-year expenditure of regular resident gamblers on activities that they spent money on in a typical month. The amount gambled using overseas operators is also unknown, further limiting comparisons between Australian industry and gambler expenditure.
At the activity level, all three survey-based expenditure estimates for lotteries and instant scratch tickets are much higher than the figures reported by industry, whereas the estimates for race betting, EGMs and casino table games are much lower. In the case of lotteries and instant scratch tickets, it is clear that people over-estimate their expenditure. In the case of race betting, EGMs and casino table games, the difference is likely explained by a combination of "untypical" or unplanned over-expenditure, the expenditure of infrequent gamblers, and underestimations of expenditure by survey participants.
| Industry 14/15 | HILDA | Industry 12/13 | TAS 13 | Industry 13/14 | ACT 14 | |
|---|---|---|---|---|---|---|
| Activity | $M | $M | $M | $M | $M | $M |
| Lottery | 1,801 | 3,577 | 41.7 | 71.9 | 20.9 | 34.0 |
| Instant scratch tickets | 192.5 | 368 | 4.3 | 7.3 | 2.0 | 3.2 |
| EGMs a | 11,589 | 1,820 | 118.3 | 45.7 | 173.5 | 38.1 |
| Race betting | 2,815 | 1,265 | 41.1 | 47.2 | 23.4 | 16.4 |
| Sports betting | 815 | 579 | 1.9 | 8.4 | - | 4.2 |
| Keno | 330 | 226 | 30.4 | 27.6 | 0.7 | 0.4 |
| Total gambling expenditure b | 22,734 | 8,609 | 334.0 | 222.0 | 238.0 | 101.0 |
Notes: na - not available. HILDA values based on weighted data and capped expenditure. All values expressed in 2015 dollars. a Industry EGM expenditure data includes hotel and club but not casino expenditure. b Includes gambling activities not presented separately, such as casinos and bingo.
Sources: Queensland Government Statistician's Office, 2016; ACIL Allen Consulting et al., 2014; Davidson et al., 2016.
Gambling problems
Table 7.5 shows rates of gambling problems reported in recent Australian studies.
The HILDA Survey shows that 1.1% of Australian adults can be classified as problem gamblers. This is around twice the rate reported in most recent gambling studies. A major contributing factor is the HILDA Survey sampling frame. The HILDA Survey administers the PGSI to a population representative sample, whereas the gambling studies only administer it to people who gambled in the past year. The PGSI rates derived from the HILDA Survey therefore include people who may not have gambled in 2015, but nevertheless reported experiencing harms in 2015 associated with their prior gambling behaviour. For example, problem gambling in 2013 may have caused financial problems that stretched into 2015.
The HILDA Survey further shows that 2.1% of typical monthly gamblers could be classified as problem gamblers. This is around twice the rate among past-year gamblers reported in recent Australian surveys. This is because people with gambling problems participate more regularly than people without problems.
| Report | HILDA | National a | National b | NSW c | Vic d | Qld e | SA f | Tas g | ACT h | NT i |
|---|---|---|---|---|---|---|---|---|---|---|
| Year of data collection | 2015 | 2012/ 2013 | 2011 | 2011 | 2014 | 2011/ 2012 | 2012 | 2013 | 2014 | 2015 |
| Population (%) reporting gambling problems in the past year | ||||||||||
| Non-gambler & non-problem gambler | 92.1 | 94.7 | 88.0 | 87.9 | 87.5 | 92.5 | 89.7 | 93.7 | 94.3 | 88.3 |
| Low risk gambler | 4.2 | 3.0 | 7.7 | 8.4 | 8.9 | 5.2 | 7.1 | 3.9 | 4.2 | 8.1 |
| Moderate risk gambler | 2.6 | 1.9 | 3.7 | 2.9 | 2.8 | 1.9 | 2.5 | 1.8 | 1.1 | 2.9 |
| Problem gambler | 1.1 | 0.4 | 0.6 | 0.8 | 0.8 | 0.5 | 0.6 | 0.5 | 0.4 | 0.7 |
| Gambling population (%) | ||||||||||
| Non-problem gambler | 83.3 j | 91.7 | 81.4 | 81.3 | 82.2 | 89.7 | 85.2 | 89.9 | 89.5 | 84.6 |
| Low risk gambler | 8.7 j | 4.7 | 11.9 | 13.0 | 12.7 | 7.0 | 10.3 | 6.4 | 7.7 | 10.7 |
| Moderate risk gambler | 5.9 j | 3.0 | 5.8 | 4.5 | 4.0 | 2.6 | 3.6 | 2.9 | 2.1 | 3.8 |
| Problem gambler | 2.1 j | 0.6 | 1.0 | 1.2 | 1.2 | 0.7 | 0.9 | 0.8 | 0.8 | 0.9 |
Notes: Victoria, South Australia, and Queensland utilised a modified five response PGSI (Never=0, Rarely=1, Sometimes=1, Often=2, Always=3).
Sources: a Dowling et al., 2016; b Hing et al., 2014; c Sproston et al., 2012; d Hare, 2015; e Office of Economic and Statistical Research, 2012; f The Social Research Centre, 2013; g ACIL Allen Consulting et al., 2014; h Davidson et al., 2016; i Stevens et al., 2017; j Monthly gamblers only.
Appendix B: Supplementary tables
| Activity | Any expenditure on a typical month? | How much per month? (On average) |
|---|---|---|
| Lottery | 4,293 | 4,263 |
| Instant scratch tickets | 1,243 | 1,231 |
| Electronic gaming machines | 1,250 | 1,243 |
| Race betting | 818 | 810 |
| Sports betting | 474 | 461 |
| Keno | 496 | 484 |
| Casino table games | 125 | 121 |
| Bingo | 164 | 159 |
| Private betting | 115 | 110 |
| Poker | 102 | 97 |
| Any gambling | 5,742 | 5,709 |
Notes: only participants aged 18 and over are included
| HILDA Self-Completion Questionnaire respondents | Regular gamblers | |
|---|---|---|
| Activity | N | N |
| Non-gambler &/or non-problem gambler | 13,398 | 4,776 |
| Low risk gambler | 598 | 502 |
| Moderate risk gambler | 376 | 340 |
| Problem gambler | 157 | 115 |
| Respondents | 14,529 | 5,733 |
Notes: Only participants aged 18 and over are included
Appendix C: Variable definitions
| Subpopulation categories | HILDA Survey variable | Definition |
|---|---|---|
| Sex | OHGSEX | Male or female |
| Age group | OHGAGE | Grouped into age categories reflecting life stages, Young adult 18-29, early-middle age 30-49, later middle age 50-64, Older adults 65+ |
| Indigenous status | OANASTI | Not of Indigenous back ground or Indigenous (combined Aboriginal, Torres Strait Islander, and Aboriginal and Torres Strait Islander categories) |
| Region of birth a | OANCOB | Grouped based on Australian Standard Classification of Countries into those born in Australia, Europe (North-west Europe and Southern and Eastern Europe), Asia (South-East Asia, North-East Asia, South and Central Asia), Other (Oceania and Antarctica excluding Australia, North Africa and the Middle East, Americas, Sub-Saharan Africa) |
| First language spoken | OANENGF, OANLOTE | Modified "Is English the first language you learned to speak as a child?" to code those reporting they did not speak a language other than English as "yes" |
| Highest education level | OEDHISTS, OEDHIGH1 | Classified based on number of years of schooling completed and level of post-school education obtained. Categories reflect standard levels of education. Below year 10, Completed year 10/junior secondary, completed year 12/senior secondary, certificate or diploma (cert. III or IV, adv. diploma or diploma), bachelors or higher |
| Employment | OHGES | Employed full-time (35+ hours per week), employed part-time (<35 hours per week) unemployed but looking for work, retired, non-working student, not employed and not looking for work (includes home duties) |
| Relationship status | OMRCMS | Considered married or in a de facto relationship if they reported being married or living with someone in a relationship, otherwise single |
| Household composition | Adapted from OHHTYPE | Single adult household (one adult aged 15 or more), Couple only household (2 persons aged 15+ who identify as a couple), household with children (one or more adults aged 15+ with one or more children aged less than 15) multiple adult household (2 or more persons aged 15+, excluding couple only households) |
| Housing tenure | OHSTENR, OHSMGPD | Own outright, own with a mortgage, rent (or pay board). A small number of participants reported other living arrangements (either living rent free or in rent-buy scheme). While these participants were included in calculating percentages their data is not presented due to small numbers |
| Remoteness | OHHSRA | Using ASGS 2011 Remoteness Area. Outer regional, remote and very remote combined due to low numbers |
| SEIFA quintile | OHHSAD10 | Collapsed from SEIFA 2011 decile of index of relative socio-economic advantage/disadvantage |
| Equivalised disposable household income quintile | OHIFDITP, OHIFDITN | Total household disposable income was equivalised for household size using the "modified OECD" scale, the first adult in the household as having a weight of 1 point, each additional person who is 15 years or older allocated 0.5 points, and each child under the age of 15 allocated 0.3 points. Equivalised household disposable income was then divided into 5 categories of roughly equal size. (<$29,500, $29,500-41,499, $41,500-53,999, $54,000-73,499, $73,500+) |
| Main source of household income | OHIFISI, OHIFNISI, OHIWSFEI, OHIBIFIP, OHIBIFIN, OHIFPPI, OHIFINIP, OHIFININ, OHIFWFLF | Main source of household income was determined by the largest contributor to total household income from either (a) salaries and wages, and business income; (b) government pensions, allowances or benefits (includes parenting payments and non-income support payments); or (c) superannuation, annuities or investments (including private pensions). A very small number of households received no income, or income from other sources. These were retained when calculating percentages but not presented due to small numbers |
| Grocery spend | OHXYGRCI | Total household expenditure on groceries. Includes food, cleaning products, pet food and personal care products. Does not include alcohol or tobacco |
| Utility spend | OHXYUTLI | Total household expenditure on electricity bills, gas bills and other heating fuel such as firewood and heating oil. Does not include water, telephone or internet bills |
| Household income quintile | OHIFDITP, OHIFDITN | Total (unequivalised) disposable household income was divided into 5 roughly equal groups (<$38,000, $38,000-63,749, $63,750-92,249, $92,500-131,999, $132,000+) |
| Problem Gambling Severity Index | OGAPROB OGAMORE OGALARGE OGAHEALT OGAGUIL OGAFIN OGACRIT OGABORR OGAANDAY | Responses to 9 individual items scored from 0 to 4 were summed and categorised as per standard PGSI thresholds, 0: non-problem gambler, 1-2: Low risk gambler, 3-7: Moderate risk gambler, 8 or above: Problem gambler. The PGSI was administered to all participants, and unless otherwise noted figures represent the total population, regardless of gambling expenditure. |
| Lottery participation | OGALOTU | Answered yes to expenditure on lotto or lottery games a typical month |
| Instant scratch tickets participation | OGASCRU | Answered yes to expenditure on instant scratch tickets in a typical month |
| Electronic gaming machines participation | OGAPMU | Answered yes to expenditure on poker machines or slot machines in a typical month |
| Race betting participation | OGABETHU | Answered yes to expenditure betting on horse or dog racing (excluding sweeps) in a typical month |
| Sports betting participation | OGABETSU | Answered yes to expenditure betting on sports tickets in a typical month |
| Keno participation | OGAKENU | Answered yes to expenditure on keno in a typical month |
| Casino table games participation | OGACASU | Answered yes to expenditure on casino table (e.g., blackjack, roulette) games in a typical month |
| Bingo participation | OGABINU | Answered yes to expenditure on bingo in a typical month |
| Private betting participation | OGAPBETU | Answered yes to expenditure on private betting (e.g., playing cards or mah-jong with friends and family) in a typical month |
| Poker participation | OGAPOKU | Answered yes to expenditure on poker in a typical month |
| Any gambling participation | OGALOTU, OGASCRU, OGAPMU, OGABETHU, OGABETSU, OGAKENU, OGACASU, OGABINU, OGAPBETU, OGAPOKU | Answered yes to expenditure on at least one of the above gambling activities in a typical month |
| Annual lottery spends | OGALOTA | Average dollar spends per month multiplied by 12. Expenditure figures presented in this report have been capped at the top and bottom 1% using a Winsorising technique |
| Instant scratch tickets spend | OGASCRA | Average dollar spends per month multiplied by 12. Expenditure figures presented in this report have been capped at the top and bottom 1% using a Winsorising technique |
| Electronic gaming machines spend | OGAPMA | Average dollar spends per month multiplied by 12. Expenditure figures presented in this report have been capped at the top and bottom 1% using a Winsorising technique |
| Race betting spend | OGABETHA | Average dollar spends per month multiplied by 12. Expenditure figures presented in this report have been capped at the top and bottom 1% using a Winsorising technique |
| Sports betting spend | OGABETSA | Average dollar spends per month multiplied by 12. Expenditure figures presented in this report have been capped at the top and bottom 1% using a Winsorising technique |
| Keno spend | OGAKENA | Average dollar spends per month multiplied by 12. Expenditure figures presented in this report have been capped at the top and bottom 1% using a Winsorising technique |
| Casino table games spend | OGACASA | Average dollar spends per month multiplied by 12. Expenditure figures presented in this report have been capped at the top and bottom 1% using a Winsorising technique |
| Bingo spend | OGABINA | Average dollar spends per month multiplied by 12. Expenditure figures presented in this report have been capped at the top and bottom 1% using a Winsorising technique |
| Private betting spends | OGAPBETA | Average dollar spends per month multiplied by 12. Expenditure figures presented in this report have been capped at the top and bottom 1% using a Winsorising technique |
| Poker spend | OGAPOKA | Average dollar spends per month multiplied by 12. Expenditure figures presented in this report have been capped at the top and bottom 1% using a Winsorising technique |
| Total gambling spends | OGALOTA, OGASCRA, OGAPMA, OGABETHA, OGABETSA, OGAKENA, OGACASA, OGABINA, OGAPBETA, OGAPOKA | Sum of all annual capped expenditure on gambling activities |
| % household income spends | OGALOTA, OGASCRA, OGAPMA, OGABETHA, OGABETSA, OGAKENA, OGACASA, OGABINA, OGAPBETA, OGAPOKA, OHIFDITP, OHIFDITN | Total capped annual gambling expenditure divided by household disposable income |
References
- Abbott, M., Binde, P., Clark, L., Hodgins, D., Korn, D., Pereira, A., et al. (2015). Conceptual Framework of Harmful Gambling: An International Collaboration (Revised Edition). Guelph, Ontario, Canada: Gambling Research Exchange Ontario (GREO).
- ACIL Allen Consulting, Centre, T. S. R., & Centre , T. P. G. R. A. T. (2014). Third Social and Economic Impact Study of Gambling in Tasmania: Volume 2, 2013 Tasmanian Gambling Prevalence Survey. Melbourne.
- Armstrong, A. R., Thomas, A., & Abbott, M. (2017). Gambling participation, expenditure and risk of harm in Australia, 1997-1998 and 2010-2011. Journal of Gambling Studies, doi:10.1007/s10899-017-9708-0
- Browne, M., Langham, E., Rawat, V., Greer, N., Li, E., Rose, J., et al. (2016). Assessing gambling-related harm in Victoria: A public health perspective. Melbourne: Victorian Responsible Gambling Foundation.
- Davidson, T., Rodgers, B., Markham, F., & Taylor-Rodgers, E. (2016). Gambling expenditure in the ACT (2014): By level of problem gambling, type of activity, and socioeconomic and demographic characteristics. Canberra: ACT Gambling and Racing Commission.
- Dowling, N. A., Youssef, G. J., Jackson, A. C., Pennay, D. W., Francis, K. L., Pennay, A., et al. (2016). National estimates of Australian gambling prevalence: findings from a dual-frame omnibus survey. Addiction, 111(3), 420-435, doi:DOI: 10.1111/add.13176.
- The Economist online (2011). Gambling: The biggest losers. <www.economist.com/blogs/dailychart/2011/05/gambling>. Accessed 2 August 2017.
- The Economist online (2014). The house wins. <www.economist.com/blogs/graphicdetail/2014/02/daily-chart-0>. Accessed 2 August 2017.
- The Economist online (2017). The world's biggest gamblers. <www.economist.com/blogs/graphicdetail/2017/02/daily-chart-4>. Accessed 2 August 2017.
- Ferris, J., & Wynne, H. (2001). The Canadian Problem Gambling Index: Final report. (pp. 58). Ottowa: Canadian Centre on Substance Abuse.
- Hare, S. (2015). Study of gambling and health in Victoria. Melbourne: Victorian Responsible Gambling Foundation and Victorian Department of Justice and Regulation.
- Hayes, C. (2008). HILDA Standard Errors: A Users Guide. HILDA Project Technical Paper Series, 2(08).
- Hing, N., Gainsbury, S., Blaszczynski, A., Wood, R., Lubman, D., & Russell, A. (2014). Interactive gambling. Melbourne.
- Office of Economic and Statistical Research (2012). Queensland Household Gambling Survey 2011-12. In Department of Justice and Attorney-General (Ed.). Brisbane.
- Queensland Government Statistician's Office (2016). Australian gambling statistics, 32nd Edition. Brisbane: Queensland Treasury.
- The Social Research Centre (2013). Gambling Prevalence in South Australia (2012). Adelaide: Office for Problem Gambling.
- Sproston, K., Hing, N., & Palankay, C. (2012). Prevalence of Gambling and Problem Gambling in New South Wales. Sydney: NSW Office of Liquor, Gaming and Racing.
- Stevens, M., Thoss, M., & Barnes, T. (2017). 2015 Northern Territory gambling prevalence and wellbeing survey report. Darwin: Charles Darwin University.
- Watson, N. (2012). Longitudinal and Cross-sectional Weighting Methodology for the HILDA Survey. HILDA Project Technical Paper Series, 2(12).
- Wooden, M., & Wilkens, R. (2017). Gambling The Household, Income and Labour Dynamics in Australia Surey: Selected findings from Waves 1 to 15 (pp. 78-87). Melbourne: Melbourne Institute: Applied Economic & Social Research, The University of Melbourne.
The authors would like to thank all those colleagues who contributed to creating gambling questions for the HILDA survey and for their input into this report. In particular, we would like to thank:
- Doctor Anna Thomas, Australian Gambling Research Centre, Australian Institute of Family Studies
- Doctor Jennifer Baxter, Australian Institute of Family Studies
- Assistant Professor Nicki Dowling, Deakin University
- Professor Bryan Rodgers, Australian National University
- Acting Director Rachel Henry, Welfare Quarantining and Gambling Branch, Department of Social Services
- Professor Mark Wooden, Melbourne Institute of Applied Economic and Social Research, University of Melbourne
- Doctor Diana Warren, Australian Institute of Family Studies
- Director Anne Hollonds, Australian Institute of Family Studies
- And all of the participants who took part in the HILDA Survey and made this report possible.
Disclaimer
This report uses unit record data from the Household, Income and Labour Dynamics in Australia (HILDA) Survey. The HILDA Project was initiated and is funded by the Australian Government Department of Social Services (DSS) and is managed by the Melbourne Institute of Applied Economic and Social Research (Melbourne Institute). The findings and views reported in this paper, however, are those of the authors and should not be attributed to either DSS or the Melbourne Institute. As well, the views expressed may not reflect those of the Australian Institute of Family Studies or the Australian Government.
Cover photo: © iStockphoto/>welcomia
Armstrong, A., & Carroll, M. (2017). Gambling activity in Australia. Melbourne: Australian Gambling Research Centre, Australian Institute of Family Studies.
978-1-76016-157-6