Recently arrived humanitarian migrants
English skills, engagement in education and entrance into employment
Overview
"The settlement success of humanitarian migrants is likely to be affected by many factors. This Research Summary explores three of these factors: English language proficiency; possession or acquisition of educational qualifications that can assist with getting a job; and becoming employed. Using the Building a New Life in Australia (BNLA) study, we look at the skills humanitarian migrants came with when they arrived in Australia, their skill levels and employment 3–6 months later (Wave 1) and at annual intervals after that (at Wave 2 and Wave 3)1. We also examine any differences according to gender and age.
1 Weighted data are used in analyses. Analysis was based on 1,704 respondents who completed a Wave 1, Wave 2 and Wave 3 interview, unless otherwise stated.
Access to the BNLA data
The analyses reported here are based on Waves 1–3. The first three waves of BNLA data are now available to approved researchers from government, academic institutions and non-profit organisations. Details on how to apply for the BNLA data are available on the Department of Social Services website.
Key messages
-
English language proficiency improved as time in Australia increased. Almost 37% of study participants reported they could not understand English at all before their arrival and a similar proportion (40%) indicated they understood English “not well”. The proportion who could not understand English at all decreased to 22% at Wave 1, was 15% at Wave 2 and 11% at Wave 3. A large number (87%) have taken English language classes since arriving in Australia.
-
There was considerable diversity in participants’ educational backgrounds, although many came to Australia with relatively few years of education (15% reported no formal education and a further 18% had six or fewer years of schooling). Since their arrival, at Wave 1, 16% had undertaken other study beyond English classes. At Wave 2, 24% were studying or had studied since the previous wave. This was the case for 28% at Wave 3.
-
In their early months in Australia, few (6%) working age participants were in paid employment.2 The percentage rose as time in Australia increased (23% at Wave 3). Those not working were doing varied activities including studying or taking English classes, or looking after family. There was a link between improved English skills and increased likelihood of finding employment.
-
Most of those in paid employment in Australia were in relatively unskilled occupations (12% reported an occupation of manager or professional at Wave 1, prior to arrival 32% had worked in these two occupations).
-
Overall, more than four-fifths of participants at Wave 1 and around three-quarters of participants at Wave 2 and Wave 3 were engaged in some type of study or paid employment.
What is the Building a New Life in Australia study?
The Building a New Life in Australia (BNLA) study is tracing the settlement journey of almost 2,400 humanitarian migrants from their arrival in Australia. It will provide a better understanding of the factors that influence their settlement journey. The project will result in a broad evidence base to assist policy development and program improvement for humanitarian migrants in this country.
Study participants come from a wide range of national and cultural backgrounds and comprise humanitarian entrants who arrived in Australia via a number of different migration pathways. This includes those who were granted a humanitarian or refugee visa before their arrival in Australia (85%), hereafter referred to as the offshore group, as well as asylum seekers who sought and were granted a Permanent Protection visa after they had arrived, termed the onshore group (15%). Study members are living in metropolitan and nonmetropolitan areas, in all states and territories except the ACT. They are being interviewed once per year.
Key dates for the first three waves of data were:
- Wave 1: Interviews conducted between October 2013 and March 2014 (3–6 months after arrival in Australia for the offshore group or 3–6 months of being granted a permanent visa for the onshore group);
- Wave 2: Interviews conducted between October 2014 and February 2015;
- Wave 3: Interviews conducted between October 2015 and February 2016.
Many aspects of life are being assessed, including migration pathways and experiences; family demographics; housing and neighbourhood characteristics; English language proficiency and training; engagement in other educational study or training; employment; income; financial hardship; physical and mental health; self-sufficiency; community engagement and support; and perceptions of life in Australia. (For more information, see De Maio, Silbert, Jenkinson, & Smart, 2014 or the study’s first Fact Sheet by Jenkinson, Silbert, De Maio, & Edwards, 2016).
The analyses reported here are based on the BNLA Release 3.0 data. Unless otherwise stated, reported differences are statistically significant at a 5% level of significance. Analysis is restricted to participants who completed an interview in all three waves. Analysis in this report uses survey weights which can sometimes produce slightly different results from those using unweighted data.
English language proficiency
English language proficiency is a key determinant for positive social and economic outcomes for humanitarian migrants. Proficiency in English is highly important for gaining employment, income and hours worked (see Cobb-Clark, 2000; Khoo & McDonald, 2001; Law, 2012). Language skills also play an important role in contributing to positive social outcomes, the Joint Standing Committee on Migration (2013) reporting that English language proficiency can reduce the risk of social exclusion through reduction in language barriers.
English skills prior to arrival, at Wave 1, Wave 2 and at Wave 3
Respondents were asked to rate their understanding of spoken English and their ability to speak, read and write in English at the time of their Wave 1, Wave 2 and Wave 3 interviews. At the time of the Wave 1 interview they were also asked to reflect on these same dimensions of English proficiency before they came to Australia. They could answer “not at all”, “not well”, “well”, or “very well”.
At the Wave 1 interview, approximately 37% reported they could not understand English at all before their arrival and another 40% felt they understood English “not well”. The study data show clear improvements in language proficiency over time. The proportion who could not understand English at all had decreased to 22% when participants answered about their current language proficiency at Wave 1 (3–6 months after arrival), this proportion was 15% at Wave 2 and 11% at Wave 3, more than 2 years after their arrival (see Figure 1).
Across all four domains of English proficiency (understanding, speaking, reading and writing), only 11–17% reported having no English skills at all at the latest time-point (Wave 3). For each of the four aspects of language proficiency, the largest increase in language proficiency occurred in the first year after arrival in Australia. Language gains between Waves 2 and 3 were smaller, particularly for reading and writing.
There were clear gender differences in English skills, with more women than men reporting they could understand English “not at all” before arrival, at 3–6 months after arrival, and one and two years later (see Table 1). Similar gender differences were found in the other aspects of English proficiency (not shown here). As might be expected, there were differences by age, with adolescents having higher levels of English language skills when their outcomes were compared to humanitarian migrants aged 60 years and over. In particular, older humanitarian migrants reported the lowest levels of English language proficiency, with 41% of those aged 60 years and over not able to understand English “at all” at Wave 3 and a further 46% saying they understood English “not well” (Table 1).
Figure 1: English proficiency before arrival, at Wave 1, Wave 2, and Wave 3.

| Understanding of spoken English | Gender | Age (years) at Wave 1 | |||
|---|---|---|---|---|---|
| Men (%) | Women (%) | 15–17 (%) | 18–59 (%) | 60+ (%) | |
| Before arrival | |||||
| Very well | 5.2 | 2.6 | 2.8 | 4.0 | 4.7 |
| Well | 20.7 | 19.1 | 44.4 | 18.9 | 10.3 |
| Not well | 43.4 | 35.0 | 38.0 | 40.7 | 27.4 |
| Not at all | 30.8 | 43.4 | 14.8 | 36.4 | 57.5 |
| Total | 100.0 | 100.0 | 100.0 | 100.0 | 100.0 |
| n | 917 | 763 | 106 | 1,444 | 130 |
| Wave 1 | |||||
| Very well | 8.7 | 3.8 | 7.5 | 6.8 | 1.3 |
| Well | 32.0 | 26.2 | 51.4 | 28.7 | 16.4 |
| Not well | 44.9 | 39.5 | 38.9 | 43.7 | 30.7 |
| Not at all | 14.4 | 30.5 | 2.3 | 20.8 | 51.7 |
| Total | 100.0 | 100.0 | 100.0 | 100.0 | 100.0 |
| n | 916 | 766 | 106 | 1,446 | 130 |
| Wave 2 | |||||
| Very well | 8.0 | 6.4 | 13.5 | 7.3 | 0.6 |
| Well | 39.8 | 30.0 | 70.4 | 34.5 | 12.6 |
| Not well | 43.7 | 41.9 | 15.2 | 45.7 | 34.7 |
| Not at all | 8.6 | 21.6 | 0.9 | 12.6 | 52.0 |
| Total | 100.0 | 100.0 | 100.0 | 100.0 | 100.0 |
| n | 923 | 777 | 107 | 1,463 | 130 |
| Wave 3 | |||||
| Very well | 9.0 | 7.6 | 20.7 | 8.0 | 0.6 |
| Well | 45.1 | 34.7 | 61.6 | 41.0 | 12.5 |
| Not well | 38.6 | 42.2 | 15.6 | 41.7 | 45.6 |
| Not at all | 7.4 | 15.5 | 2.2 | 9.3 | 41.3 |
| Total | 100.0 | 100.0 | 100.0 | 100.0 | 100.0 |
| n | 922 | 759 | 107 | 1,445 | 129 |
Note: Percentages may not total exactly 100.0% due to rounding.
Studying English in Australia
The Australian Government assists humanitarian migrants to develop English language skills by providing free courses through its Adult Migrant English Program (AMEP). One likely reason for the improvement in English skills, evident from arrival in Australia through to Wave 3, is study members’ very high levels of participation in these courses. Only 13% had not taken any English classes since their arrival in Australia. There were some timing differences in when males and females took classes, with a lower proportion of females undertaking classes in Wave 1 (74% compared to 80% for males). However, by the time of the Wave 3 interview, there was no difference in the rates between males (87%) and females (86%), suggesting that humanitarian migrant women may delay taking up English language classes until later in their settlement journey. The most common reasons for not having undertaken English language classes at the time of the Wave 1 interview included: poor health, child care and other family caring responsibilities, and employment.
Information about participation in English language classes,3 further analysed by gender and age, is presented in Table 2. Almost all adolescents had received English language classes. However, those aged 60 or above had the lowest rates (see Table 2), with 42% never attending English language classes despite having the lowest levels of English proficiency at arrival (58% had no understanding of spoken English prior to their arrival in Australia, see Table 1).
Need for interpreting services
While participants’ English language skills were generally improving over time, most humanitarian migrants reported a need for interpreting services (93% in Wave 1, 91% in Wave 2 and 88% in Wave 3). In response to the question of how often they had been able to get interpreting assistance when they needed it, 61% had been “always” or “most of the time” at Wave 1 (when they had been in Australia for only 3–6 months). Fewer (49%) were able to obtain this level of assistance one year on (Wave 2) and fewer still at Wave 3 (44%).4 On the other hand, only 5% reported “never” being able to obtain interpreting assistance in Wave 1, although rates had increased to 14% in Wave 2 and 16% in Wave 3.5
A follow-up question in Waves 1 and 3 asked participants for reasons why they couldn’t get interpreting assistance when needed. At Wave 1, not knowing how to access an interpreter (42%) and interpreters not being available when needed (38%) were nominated as the most frequent reasons for not receiving interpreting assistance when needed. These responses were significantly less likely at Wave 3 (27% did not know how to access; 21% reported interpreters not available). Conversely, at Wave 1, 17% reported that they were told their English was too good to need an interpreter, and this proportion had more than doubled to 41% at the time of the Wave 3 interview. These trends suggest that the need for interpreting assistance was being relatively well met among newly arrived humanitarian migrants but that these needs persist and may be less well met later in the settlement journey.
3This could include participation in AMEP (Adult Migrant English Program), SEE (Skills for Education and Employment), secondary school, TAFE or other courses.
4The proportion (61%) who reported they could “always” or “most of the time” receive interpreting assistance at Wave 1 was significantly higher than the corresponding proportion at Wave 2 (49%) and Wave 3 (44%). The difference between the Wave 2 and Wave 3 proportion was not statistically significant.
5The Wave 1 proportion who reported they could “never” receive interpreting assistance was significantly lower than the Wave 2 and Wave 3 proportions. The difference between the Wave 2 and Wave 3 proportion was not statistically significant.
Education
Education beyond English classes can play an important role in successful settlement. Undertaking further education and vocational skills training is associated with humanitarian migrants securing employment (see Waxman, 2001). Humanitarian migrants face challenges that can hinder their participation in education after arrival, including the possibility of having experienced pre-migration trauma and disrupted education in their countries of origin (Oliff, 2010).
Educational attainment prior to coming to Australia
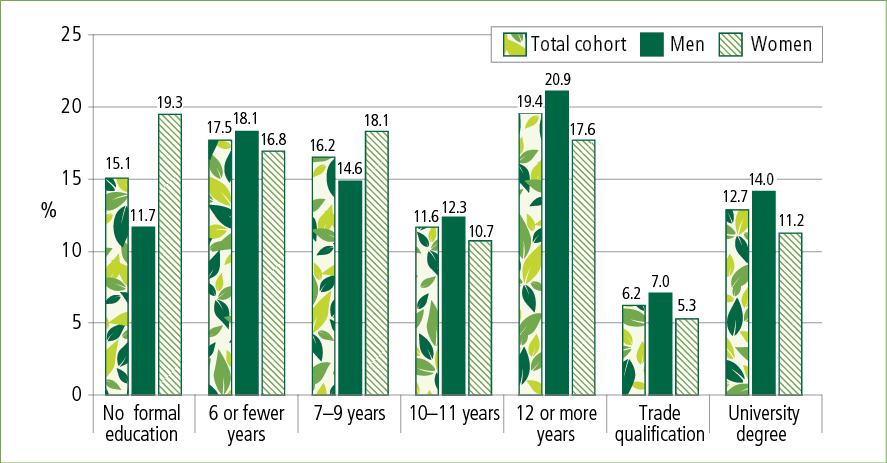
Many BNLA participants came to Australia with limited education. For example, 15% had never attended school and a further one-third had nine years or less of schooling (Figure 2). Around 20% had a post-secondary qualification of some kind. Women tended to be less educated than men; for instance, 19% of women had never attended school compared with 12% of men (Figure 2). Similarly, 35% of elderly humanitarian migrants had never attended school compared with 14% of other adults.
| When took English language classes | Gender | Age (years) at Wave 1 | Total | |||
|---|---|---|---|---|---|---|
| Men (%) | Women (%) | 15–17 (%) | 18–59 (%) | 60+ (%) | (%) | |
| Wave 1 only | 11.4 | 8.4 | 5.9 | 10.6 | 6.7 | 10.0 |
| Wave 1 and Wave 2 | 22.4 | 17.9 | 7.9 | 22.1 | 10.6 | 20.4 |
| Wave 1 and Wave 3 | 19.5 | 16.2 | 12.5 | 19.0 | 10.4 | 18.0 |
| Wave 2 only | 2.6 | 5.1 | 0.0 | 3.8 | 7.1 | 3.8 |
| Wave 2 and Wave 3 | 2.4 | 4.6 | 0.0 | 3.7 | 2.4 | 3.4 |
| Wave 3 only | 2.3 | 2.3 | 0.0 | 2.5 | 1.9 | 2.3 |
| All 3 waves | 26.9 | 31.5 | 72.2 | 26.4 | 18.8 | 29.0 |
| No English classes | 12.5 | 14.0 | 1.6 | 11.8 | 42.1 | 13.2 |
| Total | 100.0 | 100.0 | 100.0 | 100.0 | 100.0 | 100.0 |
| n | 926 | 778 | 107 | 1,466 | 131 | 1,704 |
Note: Percentages may not total exactly 100.0% due to rounding.
Taking other educational courses in Australia
Participants were also asked whether they had taken an educational course other than English language classes since coming to Australia, or between waves of the study. Overall, 16% had undertaken study by Wave 1. At Waves 2 and 3, 24% and 28% respectively were studying or had studied since the previous wave.
Similar percentages of men and women had taken an educational course other than English; those aged 18–59 had more often taken this type of course than those aged 60 years and over in later waves (24% vs 1% at Wave 2; and 28% vs 2% at Wave 3).
Information on whether participants planned to do any further study (other than English classes) was also collected in the study. Two-thirds of participants at Wave 1 reported that they aspired to take such courses. Putting together participation in English classes and other educational courses, only 10% had not taken some kind of educational course (either English language classes or other study course) since their arrival.
Employment
Employment is another area that can have a large bearing on settlement success. Economic self-sufficiency and labour force participation are important determinants of successful settlement (Khoo, 2012). Previous research has also shown that humanitarian migrants have a strong motivation to find work in their new host country but may face many barriers in securing employment (Hugo, 2011). The next section looks at paid employment before coming to Australia and since arrival for those aged 18–64 years (the major working years), the types of occupations humanitarian migrants were entering, and the degree to which these were commensurate with their pre-migration occupations.
Employment prior to coming to Australia
Because of the precise questions asked, labour force participation rates and unemployment rates cannot be calculated for the BNLA study. We report instead on the percentage of 18–64 year olds who undertook paid employment in the seven days prior to the interview. Further information about those not employed is also included in the study.
Just over half of 18–64 year olds at Wave 1 had been in paid employment (56%) at some point before they came to Australia, with this more common for males (73%) than females (34%). The onshore group (72%) were more likely to report having been in paid employment before coming to Australia than the offshore group (52%). Age differences in employment prior to and since arrival in Australia were not examined as these analyses were restricted to those aged 18–64 years.
Figure 2: Levels of educational attainment prior to coming to Australia for adults aged 18 years or over, by gender (Wave 1 respondents). Note: The percentages do not sum up to 100% as a small proportion answered ‘don’t know/prefer not to say’ and these responses are not shown in the graph.
Employment since coming to Australia
At Wave 1 (3–6 months after arrival for most), 6% of all 18–64 year olds (including those not in the labour force) were in paid employment. This had risen to 16% one year later (at Wave 2) and to 23% two years later (at Wave 3). Males in this age bracket were more likely to report being employed than females (10% vs 1% at Wave 1; 25% vs 4% at Wave 2; 36% vs 8% at Wave 3). Once having found paid employment, it seems that humanitarian migrants were also likely to report being in paid employment at later time points, with 72% of those who were in paid employment at Wave 1 also reporting paid employment at Wave 3.
As might be expected, as shown by the data in Table 3, having good English skills and higher levels of education prior to migration were both related to being in paid work in the early years of settlement in Australia. Nevertheless, among those with limited or no understanding of spoken English (those who reported “not at all” or “not well”, rates of paid employment increased from 2–4% in Wave 1 to 6–16% in Wave 3.6 Similarly, across all pre-migration educational groups, levels of paid employment increased substantially from Wave 1 to Wave 3 (Table 3).7
As previously described, a high proportion of respondents were undertaking English language classes and/or further study. For those who were not in paid work and not seeking work, the most common reasons reported by participants included health reasons (53%) and looking after their family or home (48%). 8 Women were more likely to report looking after their family or home as a reason for not seeking work (54%) when compared with men (33%).
| 18-64 year olds in paid work at Wave 1 (%) | 18-64 year olds in paid work at Wave 2 (%) | 18-64 year olds in paid work at Wave 3 (%) | |
|---|---|---|---|
| Understanding of spoken English at the same wave | |||
| Very well | 18.5 (n= 77) | 30.0 (n= 89) | 34.1 (n= 111) |
| Well | 9.6 (n= 399) | 22.0 (n= 510) | 32.3 (n= 599) |
| Not well | 4.1 (n= 684) | 11.8 (n= 743) | 16.1 (n= 678) |
| Not at all | 2.4 (n= 348) | 6.7 (n= 204) | 5.9 (n= 173) |
| Highest level of completed education before migration | |||
| University degree | 9.9 (n= 161) | 19.8 (n= 160) | 32.7 (n= 159) |
| Trade/technical qualification | 9.0 (n= 97) | 15.7 (n= 97) | 17.9 (n= 97) |
| 12+ years | 5.5 (n= 297) | 17.9 (n= 294) | 28.3 (n= 294) |
| 10-11 years | 6.4 (n= 163) | 18.1 (n= 172) | 28.6 (n= 181) |
| 7-9 years | 6.6 (n= 258) | 12.7 (n= 272) | 17.1 (n= 289) |
| 6 or fewer years | 4.4 (n= 310) | 15.6 (n= 314) | 21.3 (n= 319) |
| Never attended school | 4.4 (n= 225) | 12.4 (n= 224) | 12.7 (n= 226) |
Note: Cell values refer to the proportion of people with that characteristic in paid work at each wave. For example, 18.5% of all those who understood spoken English very well at Wave 1 reported being in paid work at Wave 1.
| ABS Standard Classification of Occupations | In this type of occupation before arrival (%) | In this type of occupation at Wave 1 (%) | In this type of occupation at Wave 2 (%) | In this type of occupation at Wave 3 (%) |
|---|---|---|---|---|
| Managers | 10.6 | 8.0 | 3.6 | 0.0 |
| Professionals | 21.3 | 3.5 | 6.4 | 6.2 |
| Technical/trades | 27.6 | 28.9 | 26.3 | 22.2 |
| Community/personal services | 8.8 | 9.3 | 12.7 | 12.1 |
| Clerical/administration | 3.1 | 0.0 | 1.6 | 1.0 |
| Sales | 3.8 | 0.0 | 5.9 | 5.3 |
| Machinery operators | 8.9 | 13.5 | 7.6 | 11.4 |
| Labourers | 15.9 | 36.8 | 35.9 | 41.8 |
| Total | 100.0 | 100.0 | 100.0 | 100.0 |
| n | 667 | 79 | 219 | 295 |
Notes: Cases where an occupation could not be assigned to the ABS Standard Classification of Occupations have been excluded from this analysis. Percentages may not total exactly 100.0% due to rounding.
Types of occupations worked in prior to and since coming to Australia
Noting that small percentages were in paid employment at each wave, the most common types of jobs the 18–64 year olds were obtaining in Australia were labouring (37% at Wave 1, 36% at Wave 2, and 42% at Wave 3), technicians/trades (29%, 26% and 22%), community/personal service (9%, 13% and 12%) and machinery operators (14%, 8% and 11%) (see Table 4). This contrasts with pre-migration occupations (Table 4), where technician/trades were most common (28%), and sizable percentages were professionals (21%). There were almost as many managers as there were labourers prior to migration (11% and 16%), whereas the percentage of managers dropped to 0% a few years after migration (Wave 3). In the early settlement years, many of those in paid employment were in relatively unskilled occupations.
While not shown in Table 4, those who had been managers prior to arrival in Australia had the highest rates of being in paid work (in any occupation) at the time of the Wave 3 interview (43%), followed by those who were working in community and personal services (33%) and technical/trades (32%) prior to arrival. Of those who were employed as labourers pre-migration, 27% reported being in paid employment at Wave 3.
6The difference in the proportion in paid employment of people who reported a “not well” understanding of spoken English between Wave 1 (4%) and Wave 3 (16%) was statistically significant. This difference was not statistically significant for the group who reported “not at all” understanding of spoken English.
7 Differences in the proportion in paid employment between Wave 1 and Wave 3 were statistically significant for all groups except those holding a trade/technical qualification.
8 Reported proportions are based on Wave 3 adult respondents aged 18-64 who were not currently in paid work, had not looked for a job in the past four weeks and did not want to get a job (n = 301).
Participation in work and study
Lastly, the degree to which humanitarian migrants were actively engaged in either study or work was explored. These analyses were restricted to those who were aged between 18 and 64 years at Wave 1 and include participants who are not in the labour force. Overall, 82% of the cohort was either in paid work or studying at Wave 1, 75% at Wave 2 and 73% at Wave 3. The decrease between waves was due to the smaller number of participants who were taking English language classes at Waves 2 and 3 compared to Wave 1. A higher percentage of males than females were in paid work or study (87% compared with 75% at Wave 1; 80% compared with 69% at Wave 2; and 78% compared to 67% in Wave 3).
Summary
The first three waves of data from the Building a New Life in Australia study have yielded important insights into the settlement journey of recently arrived humanitarian migrants to Australia. The analyses of English language proficiency, education and employment described here show the barriers faced by this group in their early years in Australia, particularly by older humanitarian migrants. Many had very limited English language skills and relatively few years of education upon arrival. However, the great majority was taking English language courses and English skills appeared to be improving substantially.
A gradual move into employment also seemed to be underway. Employment rates had increased significantly between the first and third waves of data collection, and over one-third of males were in employment by the time of Wave 3. Gaining paid employment appeared to be easier for those with higher levels of education and well-developed English skills. However, one of the challenges faced was the difficulty in securing jobs in Australia commensurate with previous qualifications and training.
Overall, more than four-fifths of participants at Wave 1 and around three-quarters of participants at Wave 2 and Wave 3 were engaged in some type of study (English language classes or other educational courses) or in paid employment. The decrease in the percentage studying or in paid employment in later waves was due to the smaller number of participants taking English classes. The findings highlight early settlement outcomes for humanitarian migrants in terms of English language proficiency, education and training, and employment. The BNLA data shows that some areas of participants’ lives, including gaining employment and English language skills, are improving over time. Some areas remain a challenge, notably finding employment in line with previous qualifications after arrival in Australia.
References
- Cobb-Clark, D. A. (2000). Do selection criteria make a difference? Visa category and the labour market status of immigrants to Australia. The Economic Record, 76, 15–31.
- De Maio J., Silbert M., Jenkinson, R., & Smart, D. (2014). Building a New Life in Australia: Introducing the longitudinal study of humanitarian migrants. Family Matters, 94, 5–14.
- Hugo, G. (2011). A significant contribution: The economic, social and civic contributions of first and second generation humanitarian entrants. Summary of findings. Canberra: Department of Immigration and Citizenship. Retrieved from <www.dss.gov.au/sites/default/files/documents/01_2014/economic-social-civic-contributions-booklet2011.pdf>.
- Jenkinson, R., Silbert, M., De Maio, J., & Edwards, B. (2016). Settlement experiences of recently arrived humanitarian migrants (Building a New Life in Australia Fact Sheet). Melbourne: Australian Institute of Family Studies. Retrieved from <aifs.gov.au/publications/settlement-experiences-recently-arrived-humanitarian-migrants>
- Joint Standing Committee on Migration. (2013). Inquiry into Migration and Multiculturalism in Australia. Canberra: The Parliament of the Commonwealth of Australia.
- Khoo, S-E. (2012). Key research questions for a longitudinal survey of refugees and other humanitarian migrants. Paper prepared for the Department of Immigration and Citizenship. Canberra: Department of Social Services. Retrieved from <www.dss.gov.au/our-responsibilities/families-and-children/publications-articles/key-research-questions-for-a-longitudinal-survey-of-refugee-and-other-humanitarian-migrants>
- Khoo, S-E., & McDonald P. (2001). Settlement indicators and benchmarks. Report submitted to the Department of Immigration and Multicultural Affairs. Canberra: Department of Social Services. Retrieved from <www.aphref.aph.gov.au_house_committee_mig_skillmig_subs_app20i-2.pdf>
- Law, V. (2012). English proficiency and labour supply of immigrants in Australia (Crawford School Research Paper No. 12). Retrieved from <ssrn.com/abstract=1942005>.
- Oliff, L. (2010). Finding the right time and place: Exploring post-compulsory education and training pathways for young people from refugee backgrounds in NSW. Sydney: Refugee Council of Australia. Retrieved from <www.refugeecouncil.org.au/publications/finding-right-time-place>
- Waxman, P. (2001). The economic adjustment of recently arrived Bosnian, Afghan and Iraqi Refugees in Sydney, Australia. International Migration Review, 35(2), 472–505.
This paper uses unit record data from the Building a New Life in Australia (BNLA). The study is conducted in partnership between the Department of Social Services (DSS) and the Australian Institute of Family Studies (AIFS). The findings and views reported in this paper, however, are those of the author and should not be attributed to DSS or AIFS. This research summary was commissioned by Settlement Policy Section, DSS. We thank DSS staff for their input to this research.
We extend very special thanks to the humanitarian migrants who participated in this study, especially for their wonderful support and generosity of time. We look forward to continuing to talk with them about their settlement journey in Australia.
Feature image: © iStockphoto/FatCamera
Smart, D., De Maio, J., Rioseco, P., & Edwards, B. (2017). English skills, engagement in education, and entrance into employment of recently arrived humanitarian migrants (Building a New Life in Australia Research Summary). Melbourne: Australian Institute of Family Studies.
978-1-76016-134-7
4 October 2017
Download Research report
Related publications

Settlement experiences of recently arrived humanitarian…
Wave 1 findings from the Building a New Life in Australia (BNLA) longitudinal study.

Settlement outcomes of humanitarian youth and active…
This research summary reports on how young people aged 15-25 years old from humanitarian backgrounds are settling in…

Housing outcomes for recently arrived humanitarian migrants
A discussion about the factors affecting the settlement success for recently arrived humanitarian migrants.