Families then and now: 1980-2010
You are in an archived section of the AIFS website
Since the Australian Institute of Family Studies (AIFS) began researching Australian families and society in 1980, Australian society has undergone enormous changes. This facts sheet, written in 2010 to mark AIFS’ 30th anniversary, looks back at the major changes over that period, including trends in household make-up, family types, marital status, birth rates, and parental employment and education. It is a fascinating snapshot of the changing nature of Australian family life over the turn of the millennium.
Key messages
- The proportion of all households comprising couple families living with dependent children decreased progressively, while the proportion containing couples living with no children increased. Households consisting of lone-parent families also increased (from less than 7% in 1976 to 11% by 2006).
- By 2007, women were more likely to have their first child in their early 30s than in their early 20s or teens (as they did in 1980 and before). The proportion of all new mothers who were in their early 30s increased from 12% in 1980 to 28% in 2007. The proportion of all new mothers who were in their late 30s also increased substantially (from 2% in 1980 to 12% in 2007).
- There was a significant increase in the rate of ex-nuptial births from 1980 (only 12.4% of babies born outside of marriage) to more than one-third of all babies born in 2008 (34.4%).
- Mothers increasingly moved into paid work. The proportion of mothers living with dependent children who were in paid work (both full and part-time work) increased from 43% in 1981 to 63% in 2009.
- In 2006, mothers were much more likely to have post-school qualifications than in 1986 (couple mothers: 26% vs 5%; lone mothers: 14% vs 5%).
- The proportion of preschool age children in formal childcare increased from 29% in 1987 to 45% in 2002.
Introduction
At the time Australian Institute of Family Studies commenced operations in 1980, the marriage rate was declining, and although the vast majority of couples were married, increasing proportions were cohabiting (i.e., in a de facto marriage). The divorce rate had peaked when the Family Law Act 1975 came into force in 1976 - the same year in which the fertility rate had fallen to below replacement level for the first time. By 1980, the divorce rate had subsided but was well above pre-1976 rates, while the fertility rate had continued its downward slide. Alarm bells were ringing about where the family was heading and whether it would even survive.
In this 30th anniversary year, it is timely to reflect on ways in which Australian families have changed over the life of the Institute and to consider some of the trends that were underway prior to its establishment. This Facts Sheet begins with a brief outline of trends in basic family structure, and then examines transitions that have contributed to these structural changes and some of the key ways in which family functioning has changed.
The focus of this Facts Sheet is on broad family trends. It is beyond its scope to examine the diversity that characterises an increasingly multicultural nation. Nor is it possible to address the complexities that are found in Indigenous families - complexities that include variations in understandings of the family system across some Indigenous communities.1
Relationship trends
As noted above, marriage rates prior to the 1980s were already declining, and cohabitation rates were rising - trends that have continued, with cohabitation becoming the normative pathway to marriage:
- The crude marriage rate (i.e., the number of marriages for every 1,000 members of the population) fell from 9.3 in 1970 to 7.4 in 1980, falling progressively to 5.3 in 2001 and only increasing slightly since then (to 5.5 in 2008).
- In 1975, only 16% of marriages were preceded by cohabitation, increasing to 23% just four years later. By 2008, however, 78% of those who married had lived together beforehand.
The divorce rate had been increasing in the 1960s and early 1970s, and soared after the Family Law Act 1975 came into force in 1976. By 1980, the number of divorces decreased, but remained above the level prior to the legislative changes. For example:
- The crude divorce rate (i.e., the number of divorces per 1,000 population) more than doubled between 1975 and 1976 (from 1.8 to 4.6), but fell to levels that have, nonetheless, remained much higher than before 1976 (between 2.2 and 2.9).
- The divorce rate was 2.7 in 1980 and declined progressively from 2.8 in 1999 to 2.2 in 2008.
Family law was therefore a very strong focus of the Institute at the outset.
Trends in household and family types
The size of households has progressively fallen over the 20th century and beginning of the 21st century. The 1911 Census revealed that the average household comprised 4.5 members. This fell to 3.5 in 1966 and to 3.0 in 1981. By 2006, the average household size was 2.6.
Families cross household boundaries and there is much communication, contact, caring and sharing among family members living in separate households. For example, grandparents, extended family members, friends and neighbours are a key source of child care for preschool-aged children For statistical purposes, however, attention is here directed to families within households.
Figure 1 shows the proportion of all family households that represent different "family types" in four Census periods, from 1976 to 2006. The figure shows that the direction of trends apparent between 1976 and 1986 has continued, leading to some very significant changes.
Figure 1. Family types, 1976-2006
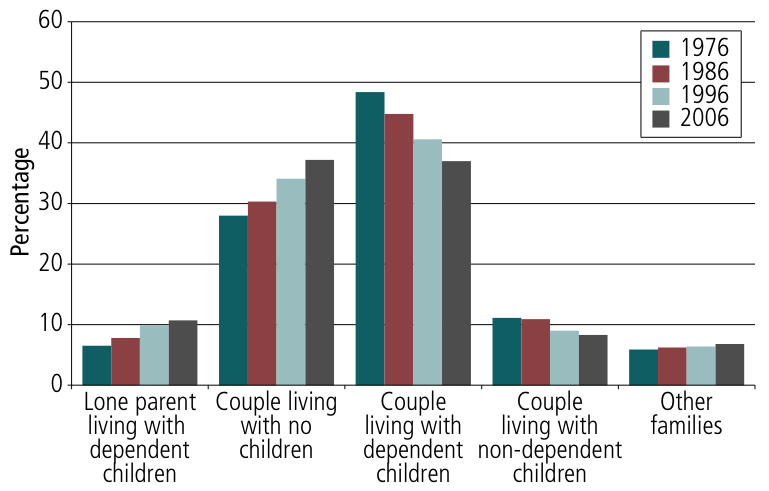
Note: "Other families" includes lone parents living with non-dependent children, and non-classifiable families, such as brothers and sisters living together.
Sources: ABS (2001, 2007)
Across all years except 2006, households containing couple families living with dependent children have been more common than those containing other family types. However, the proportion of all household comprising couple families living with dependent children has decreased progressively, while the proportion containing couples living with no children (dependent or otherwise)2 has increased progressively:
- In 1976, 48% of households were couple families living with dependent children and 28% were couples living with no children (dependent or otherwise).
- By 2006, there were equal numbers of households that were couple families with dependent children and couple families living with no children (dependent or otherwise) (37%).
Although far less common than families of couples living with no children and with dependent children, households consisting of lone-parent families have increased progressively (from less than 7% in 1976 to 11% by 2006). There has been a small decrease in households comprising couples living with non-dependent children and little change in those containing "other families".
Relationships within family households
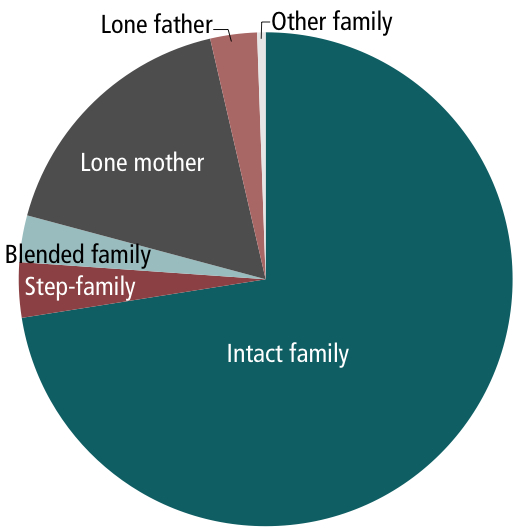
Not all lone-parent families are headed by mothers and not all couple families with children consist of children born of the current relationship. The Australian Bureau of Statistics (ABS) defines "intact families" as couple families comprising at least one child who is under 18 years old and who is the natural or adopted child of both partners, and there is no child who is a step-child to one of the partners.3 Where all children are step-children to one or both partners, then the family is called a "step-family", and where there is at least one step-child and at least one child who is the natural or adopted child of both partners, then the family is called a "blended family".4 Figure 2 shows the prevalence of such different family forms, among all families with children aged 0-17 years.
Figure 2. Relationships within the family, families with children aged 0-17 years, 2006-07
Source: ABS (2008a)
 In 2006-07:
- 72% of all families with a child under the age of 18 years were intact families;
- 17% were families headed by lone mothers;
- 4% were step-families;
- 3% were blended families; and
- another 3% were lone-parent families headed by fathers.
There has been little change in the relative proportions of such families over the decade 1997 to 2006-07. However, prior to 1997, there was a substantial increase in the proportion of families with children that were headed by a lone parent (father or mother). These proportions were:5
- 12% in 1980;
- 15% in 1990;
- 20% in 1997 (consistent with Figure 2); and
- 21% in 2008.
Marital status of lone parents
Given the increase in cohabitation rates, changes have also occurred in the marital status of parents. For example, while most lone parents living with dependent children have been married previously, lone parents today are less likely than in the past to have ever married.
About one in five lone parents living with dependent children in 1986 was never married, compared with around one in three in 2006.
The increase in the proportion of lone parents who have never married does not mean that these parents became lone parents when their children were born. Many of today's lone parents have separated from a de facto relationship.
Having children
By 1980, young people were remaining longer in education than they had in the past and women were increasingly embracing opportunities to complete secondary schooling, embark on post-secondary education and enter the paid workforce. The "golden days" of men's near universal employment were over, and with the decline in manufacturing, the demands for a better educated, skilled workforce increased. Education and employment trends in turn contributed to the postponement of marriage. With the wider availability of the contraceptive pill in the 1970s, women started to delay marriage and postpone having children.6 Feminism fuelled new aspirations for women beyond the confines of marriage and motherhood. Fundamental changes were occurring in society and flowing to family life.
Becoming parents
The age at which women have their first child has changed markedly, with the greatest changes being apparent in the proportion of women having their first child in their early twenties and early thirties (Figure 3). The decline in the proportions of women who gave birth to their first child as teenagers or when in their early twenties would have been greater than that apparent in Figure 3, given that the trends provided for the two earliest years presented (1963 and 1974) exclude the (typically young) mothers who gave birth outside marriage.
Figure 3. Age of new mothers, 1963 and 1980 (nuptial births only), and 1991 and 2007 (all births)
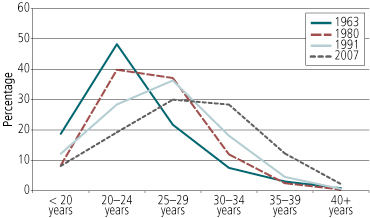
Note: The first two years represented exclude mothers who gave birth outside marriage.
Sources: ABS (1981); Commonwealth Bureau of Census and Statistics (1965); Lancaster, Huang & Pedisich (1994); Laws & Sullivan (2009)
In 1963, most commonly, women giving birth to their first child of the marriage were aged in their early twenties. The late twenties represented the second most common age, although births to teenage married women were also quite common in 1963, representing the third most common age. In 1980 and 1991, the early and late twenties continued to represent the most common ages of new mothers, but in 1991 new mothers were more likely to be in their late twenties than in their early twenties (28% vs 36%).
The early thirties was the third most likely age for becoming a mother in 1980 and 1991. That is, the proportion of new mothers who were teenagers was lower than the proportion in their early thirties (1980: 8% vs 12%; 1991: 12% vs 18%).
By 2007, women were more likely to have their first child when in their early thirties than in their early twenties or as teenagers. Just over one in four (28%) new mothers in 2007 were in their early thirties, 19% were in their early twenties, and 8% were teenagers.
Overall, the proportion of all new mothers who were their early thirties increased from 12% in 1980 to 28% in 2007. The proportion of all new mothers who were in their late thirties also increased substantially (from 2% in 1980 to 12% in 2007) and was higher in 2007 than the proportion who were teenagers.
Fertility trends
Despite advances in assisted reproduction technologies, the postponement of childbearing, coupled with relationship instability, substantially narrowed the window of opportunity for women having children.
The total fertility rate by 1980 had declined from 3.5 (babies per women) to 1.9 - that is, below the "replacement level" of 2.1. Nevertheless, concerns about the implications of this trend for the age structure of the population were yet to gain momentum.7
With the continuing decline of the fertility rate in the 1980s and 1990s, the reality that Australia was in the grip of a fertility crisis became very apparent. The alarm bells of the late 1990s reflected concerns about the intergenerational social and economic policy implications of the combination of population ageing and diminishing fertility. A key issue concerns whether or not there will remain a sufficient labour supply to support the elderly, taking into account the fact that the proportional representation of the other main dependent group (those too young to work) has been shrinking.
By 2001, the fertility rate had fallen to 1.7, but has since increased to just under 2.0.8
Completed fertility
As noted above, the increasing age at which women become new mothers poses restrictions on the number of children they are likely to have. In addition, ideals about the most appropriate time to have children, the appropriate preconditions for "starting a family" (e.g., owning a house, providing children with separate bedrooms, and perhaps sending them to private schools), and therefore ideals about family size were reinforced by changing trends, and in turn fuelled such trends. And while most women want to have children, not all achieve this.9
Figure 4 shows that, by age 40-44 years, the proportion of women who have had three or more children has fallen considerably since the 1980s, while the proportions who have had no children, or only one or two children has increased.
In 1981, women aged 40-44 years were only marginally more likely to have had two children than three children (29% vs 27%) or four or more children (28%). Taken together, women were considerably more likely to have had three or more children than to have had only two children (55% vs 29%).
Figure 4. Number of children ever born to women aged 40-44 years
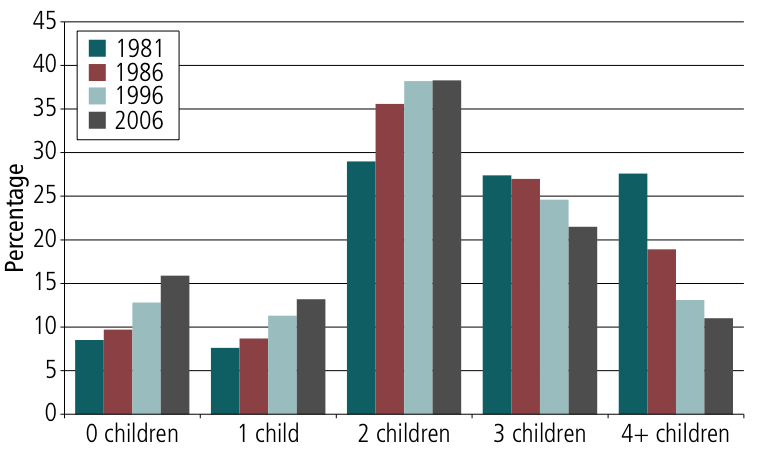
Sources: ABS (2002, 2008b)
By 1986, women of this age were considerably more likely to have given birth to two children than three children (36% vs 27%) or four or more children (19%). However, taken together, women were still more likely to have had three or more children than to have had two children (46% vs 36%)
In 1996 and 2006, the proportions of women aged 40-44 years who had given birth to two children were almost identical, though the proportions who had given birth to three children or to four or more children had decreased. In these more recent periods, women were more likely to have had two children than three or more children - a trend that was most marked in the most recent period (38% vs 25% in 1996; 38% vs 22% in 2006).
While two-child families now predominate, the number of women who had given birth to only one child increased progressively from 8% in 1981 to 13% in 2006.
In 1981, similar proportions of women aged in their early forties were childless or had given birth to only one child (9% and 8% respectively). By 2006, 16% of women were childless and 13% had given birth to only one child.10
Ex-nuptial births
Although most women wait until they are married before they have children, the proportion of babies born outside marriage has surged, with the beginnings of this trend emerging before the Institute commenced operation (Figure 5).
Through most of the 20th century, around 4-6% of all babies were born outside marriage. Upon pregnancy, unmarried women were pressured to either relinquish their baby for adoption or enter a "shotgun marriage", if this was possible. Induced abortion in those days was illegal:11
- In 1960, only 4.8% of babies were born outside marriage. This proportion had almost doubled by 1970 (8.3%) and increased to 12.4% in 1980.
- Twenty years later (2000), 29.3% of all babies were born outside marriage, increasing to 34.4% (i.e., just over one-third) in 2008.
However, this surge since at least the early 1990s can be mainly explained by an increase in the proportion of babies born to cohabiting couples.12 The proportion of babies born to women who were not living with the baby's father remained stable during this period.
Figure 5. Ex-nuptial births, 1901-2007
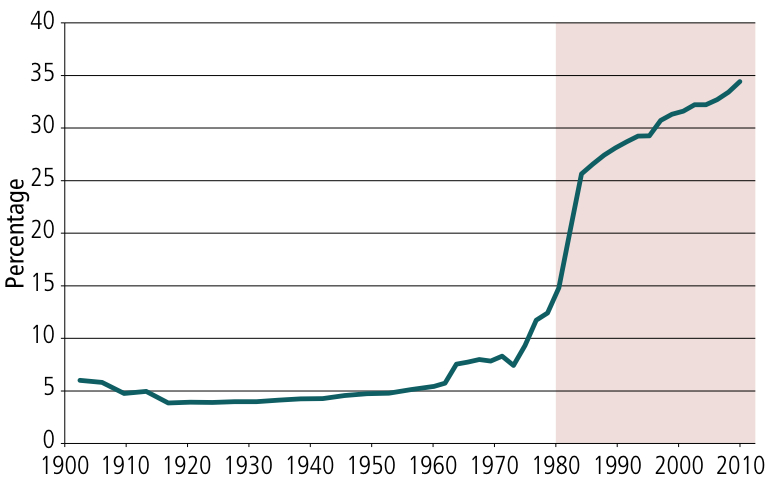
Sources: ABS, Births Australia (various years); Commonwealth Bureau of Census and Statistics (1964, 1973)
Parental employment
One of the most significant social trends of the 20th century has been the move of mothers into paid work, with widespread repercussions for family life, workplaces and community supports for families. It was not until the 1980s, however, that the impact of work on family life became a prominent policy issue, with the Institute emphasising this issue soon after it commenced operation.13
Figure 6 shows that the increase in the labour force participation of mothers with dependent children has continued during the last 30 years.
Figure 6. Rates of full-time and part-time employment, mothers with dependent children, 1981-2009
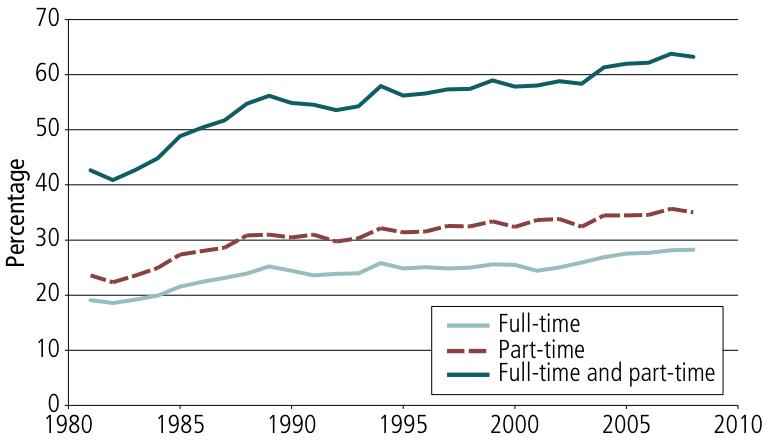
Sources: ABS Labour Force Status and Other Characteristics of Families, Australia (various years); ABS (2009a, 2009b)
The proportion of mothers living with dependent children who were in paid work increased from 43% in 1981 to 63% in 2009. This increase was apparent for both part-time and full-time work.
Across this period, mothers were consistently more likely to be in part-time than full-time paid work, although the difference between part-time and full-time rates is greater today than it was in 1981. In 1981, 19% of mothers were working full-time and 24% were working part-time, whereas in 2009, the proportions were 28% and 35%, respectively.
Figure 7 presents two sets of data on workforce participation patterns - one for couple families living with dependent children and the other for lone-mother families living with dependent children. The first set shows the proportion of couple families in which: (a) neither parent has paid work; (b) only one parent has paid work, and this entails fewer than 35 hours per week (here represented as "½ job"); (c) one parent works full-time (i.e., 35 or more hours per week) and the other is not in paid work; (d) one parent works full-time and the other part-time ("1½ jobs"); and (e) both parents work full-time. The second set shows the proportions of lone mothers who have no paid work, part-time work or full-time work.
Figure 7. Number of jobs among families with dependent children, 1983-2009
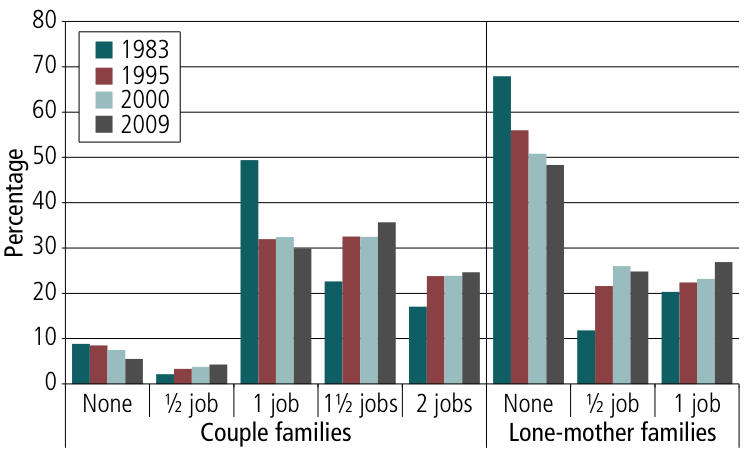
Sources: ABS Labour Force Status and Other Characteristics of Families, Australia (various years); ABS (2009a, 2009b)
In 1983, "single-income" couple families clearly predominated - representing almost half the families. In just under one-quarter of couple families, one parent held a full-time job, and the other worked part-time, while in only 17% of couple families, both parents worked full-time.
These trends changed markedly over the next 12 years. By 1995, the proportion of couple parents with one full-time and one-part-time job was much the same as the proportion with one full-time job only (33% vs 32% in 1995).
While most of the change occurred during the first 12 years of the 30-year period from 1980, it is noteworthy that, by 2009, there were more couple parents with a full-time and part-time job than with only one full-time job between them (representing 36% vs 30% of all couple families).
Across the three decades, the third most likely scenario was for both parents to have full-time work. The proportion of couple parents in this position increased from 17% in 1983 to 24% in 1995, and then increased only slightly to 25% in 2009.
There has been a consistent but small decrease in the proportion of couple parents with no job between them and a small increase in those with only one part-time job between them. In 1983, the majority of lone mothers (68%) had no paid work. This situation has become progressively less common, with just under half the lone mothers (48%) having no paid work in 2009.
Lone mothers' rates of both full-time and part-time work (especially the latter) increased over this period. Whereas in 1983 higher proportions of lone mothers had full-time than part-time paid work (20% vs 12%), in 2009, lone mothers were as likely to work full-time as part-time (27% worked full-time; 25% worked part-time).
Given that mothers continue to take most of the responsibility for caring for their children, the children's ages have an important bearing on their workforce participation.14 This can be seen in Figure 8, which shows the employment rates of couple mothers and lone mothers whose youngest child is either under 5 years old, 5-9 years old or 10-14 years old. Trends are shown for 1984 and 2009.
Figure 8. Employment rates of couple and lone mothers, by age of youngest child
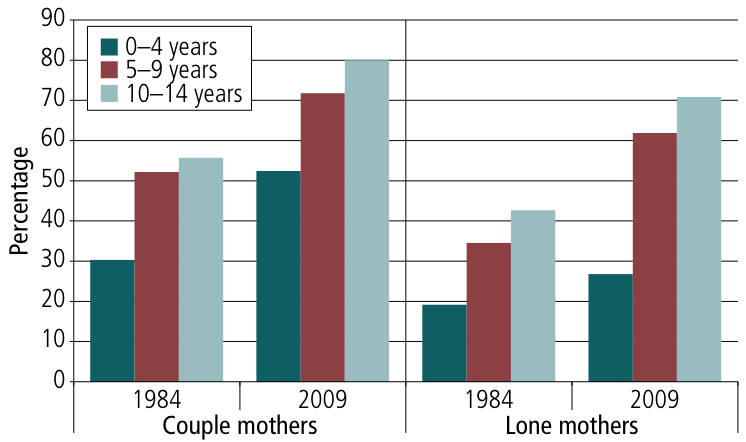
Sources: ABS (1985, 2009a)
In both 1984 and 2009, employment rates for couple and lone mothers increased as the age of the youngest child increased.
For both years, the three groups of lone mothers were less likely to be employed than couple mothers whose youngest child was of the same age.
For each of the six groups of mothers (couple and lone mothers whose youngest child was either under 5 years, 5-9 years or 10-14 years), employment rates were higher in 2009 than in 1984.
The level of increase in employment rates across the 15-year period was lowest for lone mothers whose youngest child was under 5 years old (from 19% in 1984 to 27% in 2009).
Among other groups, the levels of increase were fairly similar. For example:
- among lone mothers whose youngest child was 10-14 years, the proportion who were employed increased from 43% to 71%; and
- the employment rate for couple mothers whose youngest child was under 5 years old changed from 30% in 1984 to 52% in 2009, while that for couple mothers whose youngest child was 10-14 years changed from 56% to 80%.
Trends in mothers' education
As noted above, the decline in manufacturing led to increased demands for a skilled workforce in the 1980s and 1990s, spurring increasing numbers of young people to remain in the education system. This trend was particularly marked for girls, who had previously tended to leave school earlier than boys and were far less likely than boys to pursue tertiary education. The extent of increase in the educational attainment levels of couple and lone mothers from 1986 to 2006 is depicted in Figure 9.
Figure 9. Education of couple and lone mothers, 1986 and 2006

Sources: 2006 Census of Population and Housing (TableBuilder and 1 per cent household sample file)
In 2006, couple and lone mothers were both more likely to have post-school qualifications than in 1986 (couple mothers: 26% vs 5%; lone mothers: 14% vs 5%).
While prior investment in education can be a major resource for mothers who separate from their partner, lone mothers are less likely than couple mothers to have a post-school qualifications - a trend that is more marked in 2006 than in 1986:
- In 1986, this difference was largely due to the higher proportion of couple than lone mothers having a post-school qualification other than a degree (applying to 23% of couple mothers and 17% of lone mothers).
- In 2006, the difference was largely due to the higher proportion of couple than lone mothers having a degree (26% vs 14%).
Child care
The surge of mothers moving into paid work required changes in arrangements for the care of the children. While other relatives, especially grandparents, are an important source of child care,15 the chance of relatives (or friends) taking on this role depends on such factors as their health status, residential location, employment circumstances and quality of their relationship with the parents.
Grandparents are in a position to provide a unique combination of resources that derives from their status. For example, they can be companions, historians, emotional confidants, advisors, teachers, mentors, arbitrators, and role models. It appears that 12-13% of infants and 4-5 year old children see their grandparents every day, with 45-49% seeing them at least every week.16
Nevertheless, the progressive increase in mothers' workforce participation has generated an increasing demand for formal child care. The proportion of preschool age children in formal care, including preschool, increased from 29% in June 1987 to 37% some nine years later (March 1996) and to 45% another six years later (June 2002).17
Stability within change
Despite all the changes outlined above, some fundamental things about families do not change. Most importantly, they remain the basic unit of society - a unit in which much "communication, caring and sharing" occurs - and, importantly, the site in which most children are raised. As such, families play a central role in shaping the health and wellbeing of all immediate family members. To quote Thornton, Axinn, and Xie (2007), "today, as has been true for thousands of years, the family is still a primary unit of human interaction, providing the basis for both generational renewal and individual linkage to the larger society" (p. 3).
The Institute, likewise, has changed in some ways but remains the same in others. While the Institute's scope of research has broadened considerably and its name has changed (with the word "Australian" being added to "Institute of Family Studies" in 1986), its core functions remain the same, as set out in the Family Law Amendment Act 1979, Part XIVA. These include promoting the identification and understanding of factors affecting marital and family stability in Australia, thereby promoting "the protection of the family as the natural and fundamental group unit in society". From its inception, family stability has been understood broadly to encompass family wellbeing.
The identification of emerging family changes and the forces behind them is basic to this core function and has therefore has been an important focus of the Institute from its inception and will continue to be so in future years.
References
- Australian Bureau of Statistics. (1981). Births, Australia, 1980 (Cat. No. 3301.0). Canberra: ABS.
- Australia Bureau of Statistics. (1985). Labour force status and other characteristics of families, Australia 1984 (Cat. No. 6224.0). Canberra: ABS.
- Australian Bureau of Statistics. (1994). Child care, Australia, June 1993 (Cat. No. 4402.0). Canberra: ABS.
- Australian Bureau of Statistics. (1997). Child care, Australia, Jun 1996 (Cat. No. 4402.0). Canberra: ABS.
- Australian Bureau of Statistics. (2001). Yearbook Australia, 2001 (Cat. No. 1301.0). Canberra: ABS.
- Australian Bureau of Statistics. (2002). Births, Australia, 2001 (Cat. No. 3301.0). Canberra: ABS.
- Australian Bureau of Statistics. (2007). 2006 Census of Population and Housing: Census tables (Cat. No. 2068.0). Canberra: ABS.
- Australian Bureau of Statistics. (2008a). Family characteristics and transitions, Australia, 2006-07 (Cat. No. 4442.0). Canberra: ABS.
- Australian Bureau of Statistics. (2008b). Births, Australia, 2006 (Cat. No. 3301.0). Canberra: ABS.
- Australian Bureau of Statistics. (2009a). Labour Force Survey: Monthly family data, June 1994 to June 2004 (Datacube: ST FA4_jun94; Cat. No. 6224.0.55.001). Canberra: ABS.
- Australian Bureau of Statistics. (2009b). Labour Force Survey: Monthly family data, from August 2004 (Datacube: ST FA4_aug04; Cat. No. 6224.0.55.001). Canberra: ABS.
- Australian Bureau of Statistics. (2009c). Childhood education and care, Australia, June 2008 (Cat. No. 4402.0). Canberra: ABS.
- Australian Bureau of Statistics. (various years). Births, Australia (Cat. No. 3301.0). Canberra: ABS.
- Australia Bureau of Statistics (various years). Labour force status and other characteristics of families, Australia (Cat. No. 6224.0). Canberra: ABS.
- Baxter, J., Gray, M., & Hayes, A. (2010). The best start: Supporting happy, healthy childhoods (Facts Sheet). Melbourne: Australian Institute of Family Studies.
- Commonwealth Bureau of Census and Statistics. (1964). Demography 1963 (Bulletin No. 81). Canberra: Commonwealth Bureau of Census and Statistics.
- Commonwealth Bureau of Census and Statistics. (1973). Demography 1969 and 1970 (Bulletin No. 86). Canberra: Commonwealth Bureau of Census and Statistics.
- Commonwealth Bureau of Census and Statistics. (1965). Year book of the Commonwealth of Australia (No. 51). Canberra: Commonwealth Bureau of Census and Statistics
- Edgar, D. E. (1980). Introduction to Australian society: A sociological perspective. Sydney: Prentice-Hall.
- Gray. M., Misson, S., & Hayes, A. (2005). Young children and their grandparents. Family Matters, 72, 10-17.
- Hugo, G. (2007). Recent trends in Australian fertility. Ranzcog, 9(2), 11-13. Retrieved from <www.ranzcog.edu.au/publications/o-g_pdfs/O&G-Winter-2007/Recent trends in Australian fertility - Graeme Hugo.pdf>.
- Lancaster, P., Huang, J., & Pedisich, E. (1994). Australia's mothers and babies 1991 (Perinatal Statistics Series No. 1). Sydney: Australian Institute of Health and Welfare, National Perinatal Statistics Unit.
- Laws, P. & Sullivan, E. A. (2009). Australia's mothers and babies 2007 (Perinatal Statistics Series No. 23; Cat. No. PER 48). Sydney: Australian Institute of Health and Welfare, National Perinatal Statistics Unit.
- McDonald, P. (2005). Has the Australian fertility rate stopped falling? People and Place, 13(3), 1-5.
- McDonald, P., & Kippen, R. (1999). Population futures for Australia: The policy alternatives (Research Paper No. 5). Canberra: Parliamentary Library of Australia. Retrieved from <www.aph.gov.au/library/pubs/rp/1999-2000/2000rp05.htm>.
- Morphy, F. (2006). Lost in translation? Remote Indigenous households and definitions of the family. Family Matters, 73, 23-31.
- Qu, L., & Weston, R. (2008, 9-11 July). Parental cohabitation and children's wellbeing. Paper presented at the 10th Australian Institute of Family Studies Conference, Melbourne.
- Rapoport, R., & Rapoport, R. N. (1981). Work and the family (Discussion Paper No. 3). Melbourne: Australian Institute of Family Studies.
- Thornton, A., Axinn, W. G., & Xie, Y. (2007). Marriage and cohabitation. Chicago: University of Chicago Press.
- Weston, R., Qu, L., Parker, R., & Alexander, M. (2004). "It's not for lack of wanting kids": A report on the Fertility Decision Making Project (Research Report No. 11). Melbourne: Australian Institute of Family Studies.
- Whiteford, P. (2009). Family joblessness in Australia. Canberra: Social Inclusion Unit, Department of the Prime Minister and Cabinet.
Endnotes
1 As Morphy (2006) well illustrates, the understandings of family systems in some Indigenous communities can differ markedly from those of the “Anglo-Celtic” system, in ways that do not allow ready translation from one system to the other.
2 It is important to note that couple families living with no children comprise young couples who have not yet had children, couples who have remained childless, older couples whose children have left home, and couples for whom at least one member has repartnered and may have children living elsewhere.
3 Intact families may also contain other children, such as foster children.
4 This terminology is used by the ABS (e.g., ABS, 2008a).
5 Based on ABS Labour Force Survey Data reported by Whiteford (2009).
6 The contraceptive pill was introduced in 1961 but was only inducted on the Pharmaceutical Benefits List in 1972, thereby reducing its costs substantially. The rate of take-up was moderated by concerns about possible unknown health side-effects of this new form of contraception.
7 McDonald and Kippen (1999) noted that the report of the National Population Inquiry (the Borrie Report, 1978) made “almost no mention” of ageing as a future policy issue, given that the fall in the fertility and mortality rates that occurred subsequently were not anticipated.
8 Some authors have pointed out that estimates of the total fertility rate are influenced by whether or not births are registered and, if they are, by the period between the births and their registration. Much of the recent fall and then rise in apparent fertility rates may have resulted from improvements in the accuracy of birth registrations (see Hugo, 2007; McDonald, 2005).
9 For a discussion of these various issues, see Weston, Qu, Parker, and Alexander (2004).
10 Research by Weston et al. (2004) suggested that most Australians aged 20–39 years wanted at least two children, with women being more likely than men to want three or more children. Only a small proportion of men and women wanted one child.
11 Laws pertaining to induced abortion vary in each state and territory, and national data on the number of induced abortions each year are not available.
12 Qu & Weston (2008).
13 Examples include Edgar (1980) and Rapoport and Rapoport (1981).
14 It is important to point out, however, that increasing proportions of fathers are playing an active role in their children’s lives (see Baxter, Gray, and Hayes, 2010, for an outline of the time fathers spend with their young children).
15 See Gray, Misson, and Hayes (2005).
16 Gray et al. (2005).
17 ABS (1994, 1997, 2009c).