Poker activity in Australia
Overview
This Research Summary details findings on poker activity in Australia. The findings were derived from analysis of the 2015 Household, Income and Labour Dynamics in Australia (HILDA) Survey.1 The HILDA Survey is designed so that findings can be generalised to the Australian adult population.
Survey-based estimates show that in 2015, approximately 132,000 Australian adults regularly gambled on poker. Most poker players were men, employed full-time, and aged below 50. Their typical expenditure on poker amounted to around $1,700 each over the year. Nearly half experienced one or more gambling-related problems.
1 For a more detailed analysis of gambling activity in Australia, see Armstrong & Carroll, 2017. Further details about the HILDA Survey are available online: <melbourneinstitute.unimelb.edu.au/hilda>. The HILDA Project was initiated and is funded by the Australian Government Department of Social Services (DSS) and is managed by the Melbourne Institute of Applied Economic and Social Research (Melbourne Institute). The findings and views reported in this paper, however, are those of the authors and should not be attributed to either DSS or the Melbourne Institute.
Key messages
-
In 2015, an estimated 132,000 Australians regularly gambled on poker. It was the least popular regular activity among the 10 common gambling activities surveyed.
-
Most poker players were men (66%), aged below 50 (71%), and working full-time (65%).
-
The estimated annual spend was $1,758 per regular poker player. This was the highest average spend on a single activity compared to all other gambling activities.
-
Compared to other gambling activities, poker had the highest proportion of regular participants with one or more gambling-related problems (46% of players), including 39% who experienced moderate to severe problems.
Poker participation
An estimated 132,000 Australian adults gambled on poker in a typical month of 2015, including those who played poker in person and online.2 They represented 0.8% of Australian adults, or 1.9% of those who gambled in a typical month (i.e., regular gamblers). This made it the least popular regular activity among 10 of the most common gambling activities in Australia.3
Nationally, regular players' typical poker expenditure amounted to roughly $228 million dollars over the year. This equated to an estimated annual spend of $1,758 per regular poker player.4 This was the highest average amount spent on a single activity, when expenditure on all 10 activities was compared.
Poker players also spent a considerable amount of money across a range of other gambling activities, with poker making up 48% of an estimated average total gambling expenditure of $3,674 (Figure 1).
Figure 1: Average proportion of poker players' gambling expenditure spent on each activity

2 The HILDA survey did not distinguish between online and offline gambling activity.
3 The 10 activities included lotteries, instant scratch tickets, electronic gaming machines (EGMs, also known as poker machines or "pokies"), race betting, sports betting, keno, casino table games, bingo, private betting and poker. For detailed statistics on all 10 activities, see Armstrong & Carroll, 2017a.
4 The HILDA Survey captured information about expenditure in a typical month, and annual expenditure has been estimated from that by multiplying by 12.
Demographics
The majority of regular poker players were male (66%), aged below 50 (71%), and in full-time employment (65%). The proportion of poker players with a university degree was low (15%) compared to the proportion of Australian adults with a degree (28%).
Gambling problems
In 2015, 46% of all regular poker players - 60,000 adults - experienced one or more gambling-related problems during the year (Table 1). That is, their gambling behaviour caused or put them at risk of harm.5
Around 39% of regular poker players - 51,000 adults - experienced problems considered to be moderate or severe.
Put another way, regular poker players mostly experienced either no gambling problems, or moderate to severe problems. Very few regular poker players experienced low-level problems.
Compared to other activities, poker was associated with the highest rate of gambling-related problems, including the highest rate of moderate to severe problems.
| Gambling problem severity | Regular gamblers (%) | Regular poker players (%) |
|---|---|---|
| No problems | 83.3 | 53.7 |
| Low-level problems | 8.7 | 6.9ɫ |
| Moderate problems, or severe problems ("problem gamblers") | 8.0 | 39.4 |
| Any problems | 16.7 | 46.3 |
Note: Each subcategory column totals approximately 100%. ɫ Relative Standard Error (RSE) between 30% and 50% - value is unreliable due to the small sample and should be interpreted with caution.
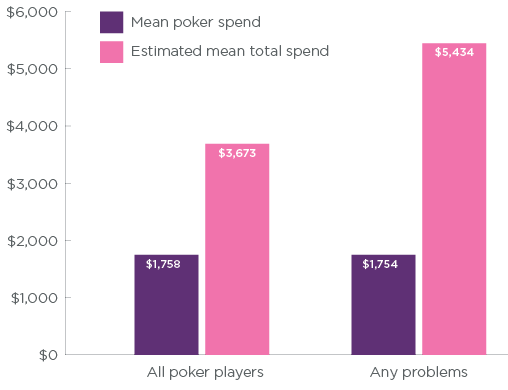
Poker players who experienced gambling-related problems spent a similar amount on poker to the average poker player ($1,754 vs $1,758). However, those who experienced gambling-related problems had much higher gambling expenditure overall (estimated total outlay $5,434 vs $3,673 for the average poker player) with poker accounting for, on average, only a third (32%) of their total outlay, compared to half (48%) of the outlay of the average poker player (Figure 2).
Figure 2: Average expenditure by regular poker players in 2015
Put another way, in a typical month, close to half of all poker expenditure by regular gamblers - 45 cents in every dollar - was accounted for by those who experienced any sort of gambling problem.
5 HILDA Survey participants reported gambling-related problems on the Problem Gambling Severity Index (PGSI; Ferris & Wynne, 2001). The PGSI consists of nine items that capture problematic behaviour and harm caused by gambling in the past 12 months. The higher the score, the greater the gambling-related problems. Non-problem gamblers report no problematic gambling behaviour or harm. Low-risk and moderate-risk gamblers report low or moderate level problematic behaviour and/or consequences. They are considered as being at low to moderate risk of becoming problem gamblers. Problem gamblers report severe problematic behaviour and/or consequences.
Types of problems
In 2015, well over a third of players (38%) felt they might have a gambling problem. Over a third bet more than they could afford to lose (37%), and returned on another day to try and win back the money they had lost (36%). Around a quarter of players had been criticised or told that they had a gambling problem (24%), and had caused financial problems for themselves or their households (23%). Gambling had caused physical or mental health problems for a quarter of players (26%). These rates of problems were higher than the rates among regular participants in any other gambling activity surveyed. These problems stemmed from players' overall gambling activity, rather than poker alone.
Households containing regular poker players were also much more likely to experience financial problems than the average Australian household. Well over a third of households containing a poker player had members who reported asking family or friends for financial help during the year (38% of poker households vs 20% of Australian households). One in five had household members who reported that they could not pay the rent or mortgage on time (21% vs 9% of Australian households).
Conclusion
Our analysis of the 2015 HILDA survey data shows that very few Australians play poker regularly. Among those that do, there is a very high rate of moderate to severe gambling problems, and a high rate of financial problems within their households.
References & further reading
- Armstrong, A., & Carroll, M. (2017a). Gambling activity in Australia. Melbourne: Australian Gambling Research Centre, Australian Institute of Family Studies.
- Armstrong, A., & Carroll, M. (2017b). Race betting in Australia. Melbourne: Australian Gambling Research Centre, Australian Institute of Family Studies.
- Armstrong, A., & Carroll, M. (2017c). Sports betting in Australia. Melbourne: Australian Gambling Research Centre, Australian Institute of Family Studies.
Views expressed in this publication are those of the individual authors and may not reflect those of the Australian Institute of Family Studies or the Australian Government.
Featured image: pixabay.com/fielperson
Armstrong, A. R., & Carroll, M. (2018). Poker activity in Australia. Melbourne: Australian Gambling Research Centre, Australian Institute of Family Studies.
15 February 2018