Digital technology use in the child, youth and family sector
Child welfare mobile apps and technology
Introduction
This resource sheet provides a summary of findings from a survey exploring how professionals in the child, youth and family sector use digital technology. The Child Family Community Australia (CFCA) information exchange conducted the survey in 2017 in response to a gap in the literature about how professionals in this sector were using digital technology for their work.
This study was primarily intended to inform the development of CFCA publications and resources for the sector. An earlier version of these findings was presented at the Family and Relationship Services Australia (FRSA) conference in November 2017.
Background
Australian families are increasingly using the internet to procure goods and services but anecdotal reports suggest social services have been slow to take up digital technology and move online.
Growing internet use in Australia
Australian Bureau of Statistics (ABS) research conducted during 2014 and 2015 found that 85% of Australians were internet users, with this figure highest in the 15–17 years age group (99%), and lowest in the over-65 years age group (51%) (ABS, 2016). People aged 15–17 years spent the most time online, with an average of 18 hours spent online for personal use each week (ABS, 2016).
Of households with children under 15, 97% had access to the internet, with an average of seven internet-connected devices in each household (ABS, 2016). Almost two-thirds (61%) of all internet users had used the internet to purchase or order goods or services in the last three months (ABS, 2016).
The rates of internet use among Australians have been consistently increasing (ABS, 2014, 2016), so it is likely that current rates of internet use are higher than the rates reported here.
A lack of research in social services’ digital technology use
There is a significant gap in research on the online provision or procurement of social services in Australia. It is unclear to what extent social services are using digital technology and what the effects of this use might be. There is also a lack of research exploring service users’ preferences for using digital technology when accessing services.
In 2013, CFCA published the paper Using Technology in Service Delivery to Families, Children and Young People, which discussed how the innovative use of technology could add value to service provision for the child, youth and family sector (Knight & Hunter, 2013). The authors noted that there was limited empirical research to guide practice and that the bulk of existing research focused on young people (Knight & Hunter, 2013).
CFCA stakeholders consistently identified digital technology use as an issue for the sector in 2015 and 2016 and, during this period, CFCA staff and stakeholders had conversations about the risks and opportunities with digital technology use. These discussions suggested that the child, youth and family sector was grappling with a number of issues:
- whether and how to use digital technology;
- a wide variation in the way that different agencies were or were not using digital technology;
- limited research on the efficacy of digital technology in social service provision; and
- research and resources that lagged behind practice.
In 2016, CFCA began a scoping process to identify what type of resources on which digital technology topics would best meet the needs of the sector. A literature search was conducted on digital technology use in the child, youth and family sector, which found that little empirical research has been published on this topic. The limited literature was reviewed and a process of targeted consultation with sector professionals and academics working in this space was conducted.
The findings from the consultation further highlighted the significant gap in knowledge that exists. While the consultation identified some examples of innovative digital technology use and some examples of digital technology not being used (or cases where digital technology could be used better), it was not clear if or how digital technology was being used by agencies delivering child, youth and family services. It was also unclear what support existed for those using digital technology or how CFCA could support agencies and practitioners working in this space.
The survey
CFCA developed a survey to explore if and how digital technology was being used in the sector, and to identify perceived risks and opportunities with digital technology use.
Defining digital technology
Digital technology was defined in the survey as social media services, applications (apps) and online services used for work; for example, to record or share information with clients. The survey sought to understand how individual sector professionals use digital technology for their work. Digital technology use undertaken by an agency (e.g. an organisation’s Facebook page) was excluded, as were the use of computers, email and web browsing, as it was assumed that all participants would be using these forms of digital technology for work.
Survey scope
Methodology
The survey was informed by a literature scan and targeted consultation with sector and academic experts. The survey consisted of 19 questions collecting both qualitative and quantitative data, which gained exemption from the Australian Institute of Family Studies’ (AIFS) ethics committee as the purpose of the data collection was to obtain sector feedback on future CFCA resource development. The target group for the survey was practitioners, managers and policy makers in the child, youth and family sector. The survey was promoted to the sector in May 2017 through the fortnightly CFCA NEWS and through CFCA networks.
Participation
CFCA received 365 complete responses to the survey. The respondents were from a wide range of organisations, locations, age groups and job roles. Data is not available on the demographics of professionals working in the child, youth and family sector in Australia, so it is not clear how representative this sample is.
Gender
The majority of respondents to the survey were female (79%), and a much smaller number of respondents were male (15%). A further 7% of survey respondents selected another option (e.g. non-binary) or chose not to record their gender.1
Type of organisation
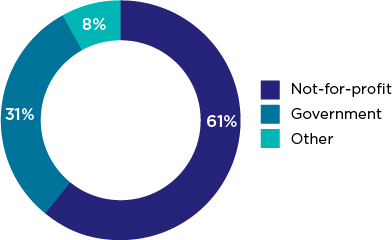
The majority of survey respondents worked in the not-for-profit or community sector (61%). Approximately one-third (31%) worked for government, with most of these respondents working for state or territory governments (Figure 1). The final 8% of survey respondents were from a range of different agencies, working in education or research, for a peak body or lobby group, self-employed or working in a private business.
Figure 1: Survey respondents by organisational sector
Geographic location of respondents
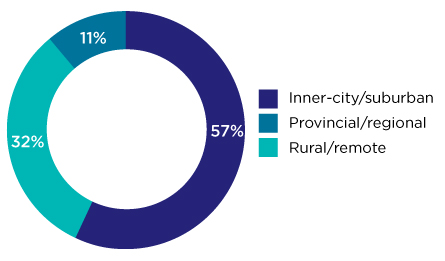
Over half of survey respondents worked in metropolitan areas (57%), with almost one-third (32%) working in regional areas, and 11% working in rural or remote areas (Figure 2).
Figure 2: Geographic location of respondents
Age of respondents
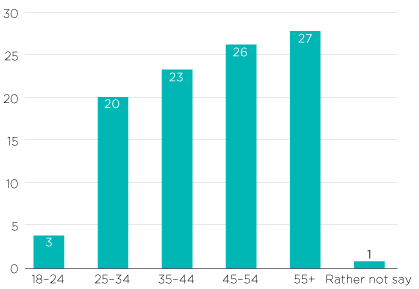
The majority of respondents were aged over 25 years, with respondents fairly equally distributed between the 25–34, 35–44, 45–54 and 55-plus age groups (Figure 3). Only 3% of respondents were aged between 18–24 and 1% of respondents declined to record their age.
Figure 3: Age of respondents
Main positions of respondents
The respondents held a broad range of positions (Figure 4). Practitioners and service or program managers represented over two-thirds of the survey respondents. Of the remaining third, 11% worked in education (in all levels from early childhood through to tertiary), 6% worked in administration (including people working in policy roles), 6% worked in research positions, 5% were senior leaders (CEOs, directors or executive managers), and just over 3% worked in other roles such as in communications, or as librarians or lawyers.
Figure 4: Main position of respondents

Note: Percentages do not add up to exactly 100 due to rounding.
1 Percentages do not add up to 100. Some respondents selected more than one option.
Digital technology use - the results
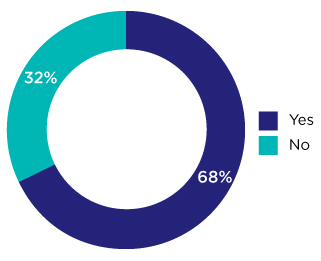
When asked if they used digital technology at work, 68% confirmed they did (Figure 5). Of this group, 81% used digital technology every day or almost every day.
Figure 5: Digital technology use in the workplace
The survey included an open question asking respondents what kinds of digital technology they used in their workplace. Responses were varied and included information about devices (although not what the devices were used for), particular apps or platforms that were used (e.g. Skype, WhatsApp), and what they used digital technology for.
Responses were grouped into categories and social media (predominantly Facebook other than the organisation’s page) was the most commonly used form of digital technology, used by 50% of digital technology users. Other commonly used types of digital technology were online content and services (such as YouTube videos, creative software or online training), devices (such as smartphones or tablets), collaboration or communication technology (such as virtual meeting programs or file-sharing services), and apps.
Survey respondents were asked to select from a range of options outlining how they used digital technology at work (respondents could select multiple options):
- to share information with colleagues (72%);
- to keep up to date with news and emerging practices (69%);
- to communicate with clients or potential clients (63%); and
- to monitor or check-in on clients (29%).
Characteristics of non-digital technology users
In reviewing the characteristics of the non-digital technology users surveyed, there were no major differences when considering geographic location. Slightly more non-digital technology users reported working in metropolitan areas (34%) than in rural and remote areas (24%). There was also little variance according to age, with the age spread of non-digital technology users reflecting the age spread of survey respondents and fairly equally spread across the four age groups above 25 years.
Of all organisation types, people working for the Commonwealth government were least likely to use digital technology (60% of Commonwealth government employees reported not using digital technology at work), although these results should be interpreted with caution because of a low response rate from Commonwealth government employees. More state government employees reported not using digital technology at work (41%), compared with survey respondents in the not-for-profit or community sector (28%). Of all the non-digital technology users, people working in family relationships services or child protection made up almost half of the group.
Reasons for non-use
When non-digital technology users were asked why they didn’t use digital technology at work, the most common reason was barriers to use (37%) such as outdated equipment, poor telecommunications service or a lack of organisational support. Other reasons were a lack of knowledge or experience with digital technology (19%), concerns about using digital technology (18%), not viewing digital technology as useful (19%), or the use of digital technology was prohibited in their workplace (18%).
Characteristics of digital technology users
There were no significant differences between digital technology users and non-digital technology users that were surveyed in terms of age or geographic location; however, males were more likely to use digital technology than females, with 83% of males reporting they used digital technology for work compared to 66% of females (p = 0.012).2 When reviewing the characteristics of digital technology users, some other interesting patterns were observed.
The majority of digital technology users reported being very comfortable or comfortable with using digital technology (70%). A large percentage of survey respondents working in education (all levels from early childhood to tertiary) were digital technology users at work, as were people working in local government, although due to small sample sizes from these groups, these results should be interpreted with caution.
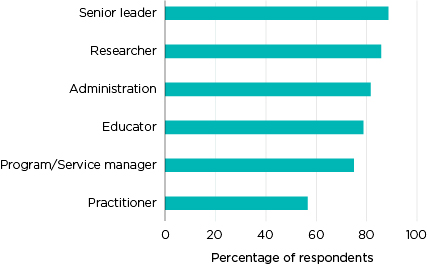
The likelihood that a survey respondent used digital technology at work increased with their level of seniority in their organisation; senior leaders – CEOs and directors – were most likely to use digital technology at work (89%), followed by program and service managers (75%), with practitioners less likely to use digital technology (56%) (see Figure 6).
Figure 6: Respondents using digital technology at work, by job role
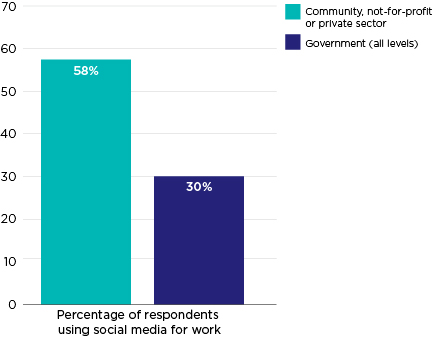
The survey also found differences in digital technology use between different types of organisations. This was most pronounced when we examined social media use (Figure 7). Almost twice as many survey respondents working in not-for-profit or community agencies reported using social media for work (58%), when compared with survey respondents working in the government sector (30%).
Figure 7: Social media use, by agency type
Support for digital technology use
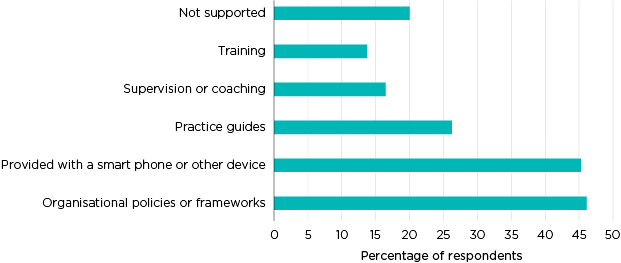
Overall, the survey found that there was limited support to facilitate the use of digital technology within the sector. The most common form of support provided was organisational policies or frameworks, which 46% of digital technology users reported. Around 45% of digital technology users had been provided with a smart phone or other device and smaller numbers of users had been provided with other forms of support, as shown in Figure 8.
One-fifth of digital technology users reported that they had not been supported. This finding confirmed what CFCA had heard anecdotally and through targeted consultation: that while significant numbers of professionals in the child, youth and family sector are using digital technology as part of their work, the resources and policies to support the use of digital technology is lagging behind.
Figure 8: Organisational support for digital technology users, by type
Risks
Survey respondents were asked to identify risks or issues (either current or potential) that they saw with digital technology use, either in their agency or in the sector. Figure 9 depicts the risks or issues they identified. Only 3% indicated that they did not perceive any risks or issues with the use of digital technology.
Figure 9: Risks or issues with the use of digital technology at work or in the social services sector, as identified by survey respondents

Data security was identified as a risk in the qualitative data:
There is always the security risks associated with all levels of information gathering and dispersion when using digital technology. When multi-national companies and governments cannot be completely secure digitally, how is the small organisation to cope, technically and financially. (Program manager, Not-for-profit)
This was supported by quantitative data findings. The most commonly identified risk was client privacy and confidentiality (75%), followed by the privacy and confidentiality of workers (61%). Over half of survey respondents also identified ethical and legal risks and client/staff boundaries as risks or issues.
Some survey respondents suggested that digital technology would reduce the amount of face-to-face contact between people and that this would have a negative impact:
I don’t like the way digital technology is changing communication between people. I believe in the positive effects of human contact and fear that this is more and more replaced by digital technology. (Practitioner, Not-for-profit)
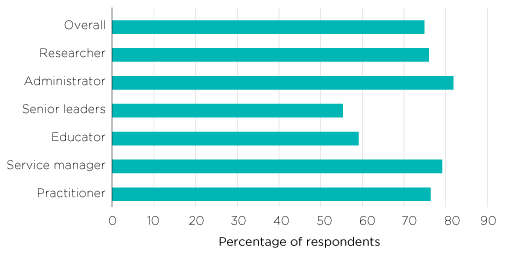
Risks were perceived differently by people with different roles. Figure 10 examines client privacy and confidentiality, which was identified by 75% of survey respondents as a risk associated with the use of digital technology. Reflecting an overall pattern, this was identified as a risk by only 56% of senior leaders, who consistently identified less risks with the use of digital technology than survey respondents in other positions. Administrators were more likely to identify client privacy and confidentiality as a risk of digital technology use (82%) when compared to other positions.
Figure 10: Risk to client privacy and confidentiality, by position
Although not captured in the quantitative data, digital technology as an inefficiency and cause of additional work was mentioned in the qualitative data. This was identified in the blurring boundaries between work and home:
We have no choice but to use technology in our work, even though it creates more work than what it should. Technology invades every aspect of life, work and social media. It has become harder to work around and only provides us with less family time and more work time. (Administrator, Local government)
Some professionals also identified that digital technology use was creating more work through inefficiencies:
Easy-to-use and responsive technology would probably enhance our work. At the moment, the various data collection interfaces are mostly taking time away from the core of our work. Too much screen work and not enough time to build relationships with the families and children. (Program manager, Not-for-profit)
Opportunities
The survey included an open question asking respondents what they saw as current and potential uses of digital technology in their workplace or in the social services sector. Responses were thematically analysed and grouped into categories. Figure 11 shows these categories and the percentage of respondents who identified a use or potential use in each of those categories.
Figure 11: Opportunities for potential digital technology use at work or in the social services sector, as identified by survey respondents
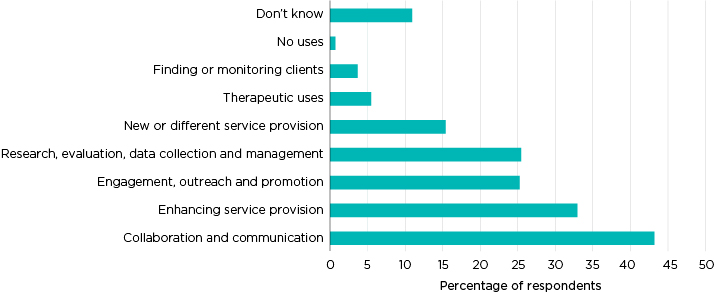
Collaboration and communication was the most frequently identified use of digital technology (43%), followed by enhancing service provision (33%). Enhancing service provision included responses that identified how digital technology could be used to make services more efficient or effective (e.g. sending electronic reminders to clients or using digital technology to enhance worker safety). A quarter of respondents identified uses for digital technology in the areas of research, data collection and evaluation, as well as for engagement, outreach and promotion.
Uses for digital technology that went beyond enhancing existing services to providing services differently (e.g. using digital technology: as a complement to or replacement for face-to-face meetings, particularly in remote areas; to connect clients to each other for peer support; and to provide online groups) were identified by 15% of respondents. Senior leaders were more likely to identify the potential of digital technology for new or different service provision (23%) than respondents with other roles.
Many survey respondents identified the need to use digital technology to connect with service users:
As a sector, we need to connect with families in the spaces that they are comfortable with and safe in, and digital technology is one of them. (Program manager, Not-for-profit)
Around one-tenth of respondents couldn’t identify uses or potential uses of digital technology in the sector. This reflects the qualitative data, with a number of survey respondents noting that digital technology has potential but they were unsure of how it could be applied to their work:
If departmental officers were exposed to a wider range of technologies, then this could inspire new ideas for service delivery to our clients. (Practitioner, Not-for-profit)
Balancing risks and opportunities
While there were small numbers of survey respondents who viewed digital technology as either risk-free or too risky to use, many survey respondents are balancing the risks of digital technology use with the opportunities:
I see the amazing benefits and immediacy of digital technologies but I also see the risks for privacy violations and [the] issue of client/worker boundary can become very blurred if good policies and monitoring is not in place around use of digital technologies professionally. (Researcher, Not-for-profit)
Barriers to use
When non-digital technology users were asked their reasons for not using digital technology, many of them identified barriers such as a lack of organisational support and outdated equipment. Several survey respondents (both digital technology users and non-digital technology users) used the final qualitative comments section at the end of the survey to detail the barriers they experienced to using digital technology. Several identified the financial challenges experienced by not-for-profit agencies, particularly smaller agencies, who do not have the resources to purchase equipment:
Technology is out of [the] price range for most smaller community organisations. (Program manager, Not-for-profit)
Other respondents used the open questions to describe innovative uses of digital technology within their agencies, demonstrating the existence of pockets of innovation within the sector. However, dissemination of these innovative examples of practice is not taking place in any significant way; many respondents identified a lack of knowledge around what digital technology exists as a barrier to use.
Limitations
This study was primarily intended to inform the development of CFCA publications and resources, so it is not a representative sample of professionals in the child, youth and family services sector. There are also other limitations that should be considered: recruitment for and the completion of this survey was undertaken online, so results may be biased towards professionals that are already comfortable using digital technology. Although inclusion and exclusion criteria for digital technology were defined in the opening to the survey, it is possible that some respondents did not read this or misinterpreted it; therefore, the findings on digital technology users may include respondents who would otherwise have been categorised as non-technology users or vice versa.
Furthermore, while this survey identified some interesting differences in digital technology use between different sectors and positions, interpretation of these findings is limited by the lack of research that exists in this area. This survey has identified many areas that would benefit from further research.
2 The p value was calculated using chi square analysis and binary gender with other gender categories and missing data excluded.
Discussion
A notable number of professionals in the child, youth and family sector reported concerns about digital technology use, and these concerns should be acknowledged and addressed in future research, policy or resources produced in this space. Support is needed for agencies and individual workers to understand and mitigate the risks of using digital technology in the workplace, particularly ethical risks and risks around privacy and confidentiality. This is an area the social work field has begun to engage with (McAuliffe & Nipperess, 2017) and it remains a complex and evolving area (Reamer, 2017). While there are some guidelines in place to explore and address these ethical risks (e.g. Australian Association of Social Workers [AASW], 2016a, 2016b), it appears from this survey that for many professionals these risks have not yet been adequately addressed or mitigated.
While the skills and knowledge of individual staff members is frequently understood to be a barrier to digital technology use (Dunn, 2014; Knight & Hunter, 2013), this survey identified that there are other barriers to digital technology use in this sector, including cost, inefficiencies and inadequate organisational support. The costs of purchasing and maintaining digital technology is a significant barrier to use for all agencies (Infoxchange, 2016) but these survey findings suggest that this is particularly the case in smaller agencies. While digital technology use is understood to improve efficiency and effectiveness (Infoxchange, 2016), this has not been the experience of all survey respondents.
There is also a lack of research evidence about what works with digital technology use (Chan & Holosko, 2016), which contributes to the complexity of ethical issues identified by sector professionals (McAuliffe & Nipperess, 2017). There is little research evidence that examines how service users want to interact with services using digital technology, or about the impact of digital technology use on the efficacy of service delivery. There is also limited organisational support for digital technology users; there is very little training or practical resources that can guide practice in this area, and many workers are operating without organisational policies.
Further reading
- CFCA information exchange, Using technology in service delivery to families, children and young people
- National Child Welfare Workforce Institute, Child welfare mobile apps and technology
- Infoxchange: Technology for social justice website
- The Guardian, What does it take to make digital technology work in children’s services?
References
Australian Association of Social Workers (AASW). (July 2016a). Ethics and practice guideline – Social media, information and communications technologies: Part 2. Melbourne: AASW. Retrieved from <www.aasw.asn.au/practitioner-resources/ethics-and-practice-guidelines/ethical-guidelines>.
AASW. (July 2016b). Ethics and practice guideline – Social media, information and communications technologies: Part 3. Melbourne: AASW. Retrieved from <www.aasw.asn.au/practitioner-resources/ethics-and-practice-guidelines/ethical-guidelines>.
Australian Bureau of Statistics (ABS). (2014). 8146.0 Household use of information technology, Australia, 2010–11. Canberra: ABS. Retrieved from <www.abs.gov.au/AUSSTATS/[email protected]/Previousproducts/D11394A54F8B9ED1CA25796600152C62?opendocument>.
ABS. (2016). 8146.0 Household use of information technology, Australia, 2014–15. Canberra: ABS. Retrieved from <www.abs.gov.au/ausstats/[email protected]/mf/8146.0>.
Chan, C., & Holosko, M. J. (2016). A review of information and communication technology enhanced social work interventions. Research on Social Work Practice, 26(1), 88–100.
Dunn, S. (2014). Digital capabilities in social care: Survey report. Leeds, UK: Skills for Care.
Infoxchange. (2016). Digital technology in the not-for-profit sector. Infoxchange; Connecting UP; TechSoup New Zealand. Retrieved from <www.infoxchange.org/sites/default/files/digital_technologies_in_the_nfp_sector_-_31_may_2016.pdf>.
Knight, K., & Hunter, C. (2013). Using technology in service delivery to families, children and young people (CFCA Paper No. 17). Melbourne: AIFS.
McAuliffe, D., & Nipperess, S. (2017). e-Professionalism and the ethical use of technology in social work. Australian Social Work, 70(2), 131–134.
Reamer, F. G. (2017). Evolving ethical standards in the digital age. Australian Social Work, 70(2), 148–159.
About the author
This resource sheet was authored by Jessica Smart, Senior Research Officer with the CFCA information exchange.
Acknowledgements
The author would like to thank Megan Carrol and Ken Knight for their assistance with the survey and data analysis.
Featured image: © GettyImages/PeopleImages
3 July 2018