The growing over-representation of Aboriginal and Torres Strait Islander children in care
You are in an archived section of the AIFS website
In late 2017, the Family Matters campaign released its second annual report, The Family Matters Report 2017: Measuring trends to turn the tide on the over-representation of Aboriginal and Torres Strait Islander children in out-of-home care in Australia.
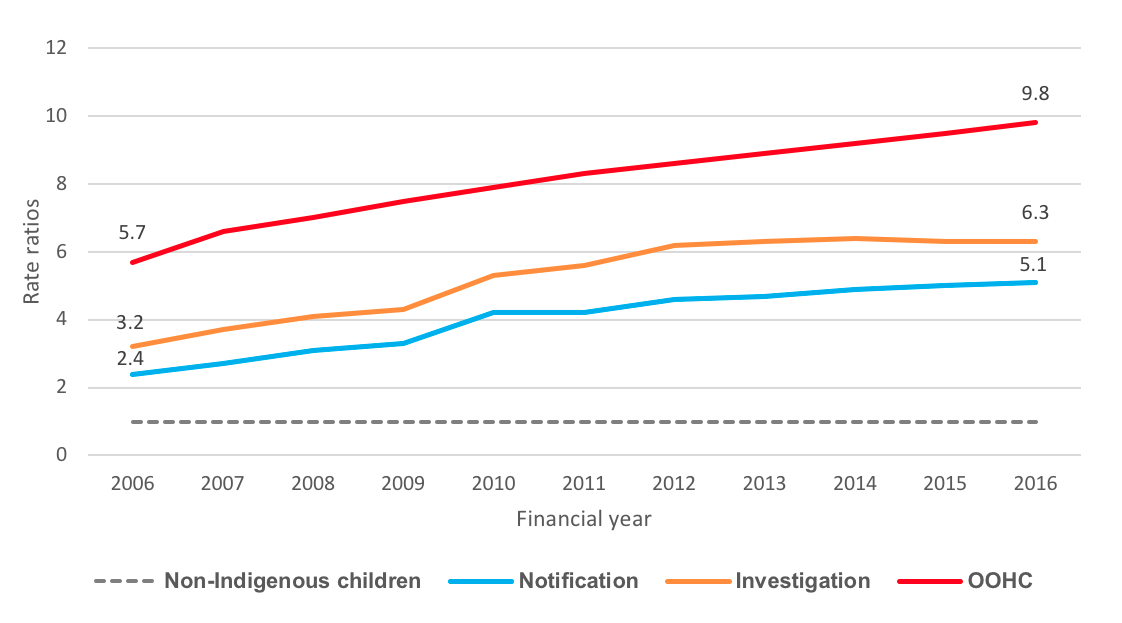
The report emphasises that the over-representation of Aboriginal and Torres Strait Islander children in out-of-home care (OOHC) has continued to grow since the release of the first Family Matters report in 2016. In 2015–16, Aboriginal and Torres Strait Islander children were far more likely to have been reported to child protection services (5.1 times as likely), investigated by child protection (6.3 times as likely) and placed into OOHC (9.8 times as likely) than non-Indigenous children – rates that have steadily worsened over the last 10 years, as shown in the figure below.
Rate ratios comparing Aboriginal and Torres Strait Islander and non-Indigenous children involved with child protection in Australia, 2006–20161
At the same time, The Family Matters Report 2017 notes that Aboriginal and Torres Strait Islander children and families were less likely to access universal or targeted services, such as early childhood education or intensive family services, which would help prevent entry into OOHC.
To monitor progress over time, the report identifies and analyses the available data relating to Aboriginal and Torres Strait Islander children in OOHC. It does this in three main parts:
- Over-representation in OOHC
- Social, economic and community-level factors
- Participation in decision making and respect for culture
Over-representation in OOHC
The report presents a detailed picture of the dynamics of Aboriginal and Torres Strait Islander children’s involvement in child protection.
This part includes new data on Aboriginal and Torres Strait Islander children’s entry into OOHC. Admission rates for Aboriginal and Torres Strait Islander children have increased from 13 to 15 per 1,000 children between 2011–12 and 2015–16. In comparison, the rates for non-Indigenous children remained relatively stable at just under 2 per 1,000 children during the same period. The report identifies significant gaps in the child protection data collected by government agencies that continue to prevent a clearer understanding of children’s movements in and out of care, their length of stay and their reunification with their families.
Social, economic and community-level factors
This part of the report discusses a range of social, economic and community-level factors that the Family Matters campaign has identified as driving over-representation of Aboriginal and Torres Strait Islander children in OOHC.
These factors include both high rates of social and economic disadvantage, such as poverty, over-crowded housing and domestic violence, as well as lower access to services that would prevent entry into OOHC, such as early childhood education and childcare. The Family Matters report presents data showing that Aboriginal and Torres Strait Islander children access early childhood education and childcare at significantly lower rates than non-Indigenous children and, simultaneously, they are more than twice as likely to be developmentally vulnerable in two or more domains2 in their first year of education compared to non-Indigenous children.
Participation in decision making and respect for culture
In its third main part, the Family Matters report examines the extent to which Aboriginal and Torres Strait Islander peoples are actively supported to participate in decisions that affect their lives and the extent to which their children’s connection to culture is maintained while in OOHC. This includes indicators that measure:
- Degree of compliance with the placement element of the Aboriginal and Torres Strait Islander Child Placement Principle by child protection and OOHC agencies
- Completion rates and quality of cultural support planning for children by child protection agencies
- Level of resources and quality of legislative provisions for Aboriginal and Torres Strait Islander participation in decision making and community-controlled services.
As in previous parts, the report highlights several gaps in the data that would help provide a better understanding of how service systems can be improved for Aboriginal and Torres Strait Islander children and families. Among its recommendations, the report highlights the need to collect a broader suite of data on compliance with the Aboriginal and Torres Strait Islander Child Placement Principle and the level of investment in community-controlled organisations.
Download the report via the Family Matters website: http://www.familymatters.org.au/family-matters-state-2017/
For solutions proposed by the Family Matters campaign, see the accompanying Family Matters Roadmap report: http://www.familymatters.org.au/the-solutions/
References
Family Matters – Strong Communities. Strong Culture. Stronger Children., SNAICC – National Voice for our Children, Griffith University, University of Melbourne. (2017). The Family Matters Report 2017: Measuring trends to turn the tide on the over-representation of Aboriginal and Torres Strait Islander children in out-of-home care in Australia. Melbourne: SNAICC – National Voice for our Children. Retrieved from http://www.familymatters.org.au/family-matters-state-2017
Steering Committee for the Review of Government Service Provision. (2016). Report on Government Services 2016. Canberra: Productivity Commission. Retrieved from http://www.pc.gov.au/research/ongoing/report-on-government-services/2016
Steering Committee for the Review of Government Service Provision. (2017). Report on Government Services 2017. Canberra: Productivity Commission. Retrieved from https://www.pc.gov.au/research/ongoing/report-on-government-services/2017
Footnotes
1. Notes for the figure reproduced from The Family Matters Report 2017 (page 28):
- Children involved with child protection measured at 30 June each financial year.
- Rates for years 2011–2015 were calculated using revised population estimates based on the 2011 Census and should not be compared with rates calculated using populations based on previous Censuses. However, all figures are included to demonstrate the steady increase and disparity between Indigenous and non-Indigenous children across all points on the child protection continuum.
- Rates for notification and investigation from 2011–2015 were taken from the Report on Government Services (Steering Committee for the Review of Government Service Provision, 2016). The rates were derived from unpublished data from state and territory governments.
- Rates from 2006–2010 were taken from Steering Committee for the Review of Government Service Provision (2016). The rates were derived from unpublished Australian Institute of Health and Welfare (AIHW) data collected for Child Protection Australia.
Source: 2006 data from Chapter 15 Child protection services (Steering Committee for the Review of Government Service Provision, 2016)
Source: 2007–2016 data from Chapter 16 Child protection services (Steering Committee for the Review of Government Service Provision, 2017)
Feature image is by Ben Searcy, courtesy of Family Matters South Australia. Image taken during SA National Week of Action – Key Event in Rundle Mall Adelaide.
7 May 2018