Use of health services among children at risk of social‑emotional problems
Opportunities for early intervention
Overview
Using data from both Growing Up in Australia: The Longitudinal Study of Australian Children (LSAC) and Medicare, this paper examines patterns of health and support service use among Australian children, especially among those at elevated risk of experiencing poor social-emotional wellbeing and psychological adjustment.
Social-emotional wellbeing and psychological adjustment were assessed using the Strengths and Difficulties Questionnaire over five data collection periods or 'waves'; that is, every two years from when children were aged 4-5 to 12-13 years. Specifically, children were assessed to determine their 'risk' of experiencing emotional symptoms, conduct problems, hyperactivity, conduct problems and low prosocial skills. Descriptive analyses examined differences in health service use at each timepoint; multivariate longitudinal analyses more comprehensively investigated the characteristics of children and their families who were most likely to access various types of professional support in Australia, with a focus on the effect of elevated risk of experiencing poor social-emotional wellbeing and psychological adjustment on service use among Australian children and families.
This research was commissioned by Emerging Minds: The National Workforce Centre for Child Mental Health.
Key messages
-
The percentages of children using specific medical services as reported by parents varied with age; however, overall, general practitioners (GPs) were the most commonly used service by study children.
-
Children at increased risk of social-emotional problems had higher rates of contact with various service types, including psychiatric and behavioural therapy services, other medical professionals including GPs, paediatricians and speech therapists, in addition to hospital emergency and outpatient services.
-
Medicare data indicated that the usage rates of paediatricians, GPs specifically in relation to mental health concerns, and psychologists were consistently - and significantly - higher among children at risk of experiencing psychosocial adjustment issues such as hyperactivity, emotional symptoms, and conduct and peer problems across all ages.
-
Despite this, substantial proportions of children at elevated risk of experiencing poor social-emotional wellbeing and psychological adjustment were not accessing services that are more likely to specifically address these issues in children, including psychiatric and behavioural therapy services, paediatricians and psychologists.
-
Importantly, our findings also indicated a degree of unmet need for professional support or intervention among study children and their families - through both patterns found in Medicare service use as well as via parental reports. This was particularly the case for families with children with elevated risk of experiencing poor social-emotional outcomes.
Abbreviations
| ABS | Australian Bureau of Statistics |
|---|---|
| ACIR | Australian Childhood Immunisation Records |
| ACT | Australian Capital Territory |
| ADA | Australian Dental Association |
| AIFS | Australian Institute of Family Studies |
| AIHW | Australian Institute of Health and Welfare |
| AMHOCN | Australian Mental Health Outcomes and Classification Network |
| DSS | Department of Social Services |
| FSE | Full Service Equivalent |
| GP | General Practitioner |
| HIC | Health Insurance Commission |
| LOTE | Language other than English |
| LSAC | Longitudinal Study of Australian Children |
| MBS | Medicare Benefits Schedule |
| NSW | New South Wales |
| OR | Odds ratio |
| PBS | Pharmaceutical Benefits Scheme |
| PRC | Parenting Research Centre |
| SDQ | Strengths and Difficulties Questionnaire |
| SEIFA | Socio-Economic Indexes for Areas |
| UK | United Kingdom |
Introduction
Delivering services that adequately and appropriately meet the needs of the community is a fundamental challenge faced by systems in Australia, including health care systems. In Australia, Medicare provides access to free or subsidised treatment by frontline health professionals such as doctors, specialists and optometrists under the Medicare Benefits Schedule (MBS). Medicare further provides lower-cost prescription medicine and free care to patients in public hospitals and, for vulnerable groups such as children in low-income households, the services of dentists and other allied health professionals are also subsidised.
Official data indicate that the proportion of young Australians (<25 years) accessing MBS-subsidised primary mental health care services increases with age, peaking during young adulthood (18-<25 years). Specifically, during 2014-15, around 1% of preschool-aged children (0-<5 years) had contact with MBS-subsidised primary mental health services, compared to 6% of primary school-aged children (5-<12 years), 8% of adolescents (secondary school age; i.e. 12-<18 years), and 10% of youths/young adults (Steering Committee for the Review of Government Service Provision, 2016). Importantly, research indicates that poor psychological adjustment during childhood can affect future contact with the health care system; for example, over 2% of mental health-related emergency department 'occasions of service' in Australian public hospitals during 2012-13 were estimated to result from behavioural and emotional disorders with onset usually in childhood and adolescence (Steering Committee for the Review of Government Service Provision, 2016).
In 2016-17, Australia's total expenditure on health was estimated at $180.7 billion, equating to more than $7,400 per person (Australian Institute of Health and Welfare [AIHW], 2018). Given this, and in the context of higher rates of contact with health care services among children and adolescents experiencing - or at risk of - social and/or emotional problems (Schieve et al., 2012), early intervention and prevention initiatives may reduce both the prevalence of poor psychological adjustment among Australians over the life course and the resultant costs to the country's health care system.
Yet study findings indicate that a degree of unmet need for professional support and intervention continues to exist among Australian children. For example, a recent analysis of data from the 2013-14 Australian Survey of Mental Health and Wellbeing indicated that only around 12% of children aged 6-17 years with mental disorders received sufficient contact to be classified as receiving 'minimally adequate treatment' (Sawyer, Reece, Sawyer, Hiscock, & Lawrence, 2018). Among parents and carers surveyed for the Australian Child and Adolescent Survey of Mental Health and Wellbeing, also during 2013-14, over one-quarter (27%) reported that their child or adolescent (aged 4-17 years) needed help for emotional or behavioural problems in the previous 12 months; however, only 17% of children and adolescents had used services for such concerns during that time (Lawrence et al., 2015). Further, using data from Growing Up in Australia: The Longitudinal Study of Australian Children (LSAC) and matched Medicare data, Hiscock and colleagues (2019) found that fewer than one quarter of children identified as having a mental health problem had seen a mental health professional in the 18 months following their most recent LSAC interview.
To address unmet need, poor psychological health and the associated outcomes among Australian children, and in consideration of the substantial cost of public health care (from both consumer and provider perspectives), it is of significant policy interest to comprehensively examine the level and nature of health care service use among Australian children. This includes the identification of psychosocial and socio-economic factors predictive of service engagement. Such information could inform targeted education, prevention and referral programs with the intention of engaging 'at risk' children with suitable professional support and early intervention, and educating parents and children's various caregivers1 about effective methods of improving children's short- and long-term health, wellbeing and overall quality of life (Newman, 2012).
In this paper, data from LSAC and the MBS are used to examine children's use of certain Australian health care services, and to explore differences in the percentage of children using these services, depending on their levels of psychological adjustment, including issues such as emotional problems, conduct problems and hyperactivity.
Specifically, we sought to investigate:
- patterns of health care service use among children over time
- the socio-demographic and familial characteristics of children accessing various Australian health care services, via parents' self-report and MBS data
- whether children classified as experiencing elevated risk of developing social-emotional problems accessed health care services at greater rates than other children.
1 Diverse health service providers and support networks, such as maternal and child health nurses, hospital emergency staff, and school guidance counsellors, may also be able to provide valuable forms of early assistance, intervention or appropriate referrals for children at risk of mental health problems and their families.
Data and methodology
The Longitudinal Study of Australian Children
LSAC is undertaken in a partnership between the Department of Social Services (DSS), the Australian Institute of Family Studies (AIFS) and the Australian Bureau of Statistics (ABS). The study follows two cohorts of children who were selected from across Australia - children in the B cohort ('babies' at Wave 1) were born between March 2003 and February 2004, and children in the K cohort ('kindergarten' at Wave 1) were born between March 1999 and February 2000.
The sampling frame for LSAC was created using the Health Insurance Commission's Medicare database, a comprehensive database of Australia's population. A stratified sample of postcodes was subsequently generated, from which a sample of children was selected, and their families invited to participate in the study. The final sample, comprising 54% of these families, was broadly representative of Australian children (Soloff, Lawrence, & Johnstone, 2005). The first wave of LSAC interviews was conducted between March 2004 and January 2005; since then, families are interviewed every two years. For a detailed description of the design of LSAC, see: Gray and Smart (2009).
In general, LSAC gathers comprehensive, nationally representative data on important aspects of a child's life, including their experiences within families and communities, child care experiences, and experiences in early education. LSAC data also provide substantial information about various aspects of children's development, including physical and mental health; motor skills; social, cognitive and emotional development; and language, literacy and numeracy. LSAC was designed with the study child as the main focus of the study. Reports from different types of respondents are sought to obtain information about the child's behaviour in different contexts. Specifically, information is collected from: the child (including physical measurements, cognitive testing and, depending on the age of the child, interviews); the parent who knows most about the child ('primary carer'); any secondary parent in the household (biological, adoptive or step-parents); home-based and centre-based carers for preschool children who are regularly in non-parental care; and teachers for school-aged children. From Wave 2, information has also been obtained from the parent who lives in a separate household than the primary carer but who still has contact with the child.
At the time of writing, data from seven main waves of the survey were available, collected in 2004, 2006, 2008, 2010, 2012, 2014 and 2016. For this paper, analyses focused on children in the LSAC B cohort, particularly on children aged between 4-5 and 12-13 years, given this was the most under-investigated group of children regarding mental health outcomes. For the B cohort, the Wave 1 sample consisted of 5,107 observations. Just over 90% of the Wave 1 sample was retained at Wave 2; in subsequent waves, over 95% of the sample completed at least one follow-up interview. The Wave 7 sample comprised 66% of the original Wave 1 sample.
Matched MBS data
Analyses of MBS data afford opportunities to supplement parental reports of their children's health service use by analysing official usage data for various service types. Data linkage with official health care system databases allows objective investigations of service use trends among LSAC children over time; for instance, such data are not biased by social desirability concerns or recall issues, as is the case with self-report information (Althubaiti, 2016).
In Wave 1 of LSAC (2004), the vast majority (97%) of all study children's parents gave consent for their children's data to be linked with comprehensive Medicare Australia information on an ongoing basis; approximately 96% of B cohort children's parents consented to the MBS data linkage (N = 4,875). Medicare Australia information includes study children's usage history details relating to the MBS, Pharmaceutical Benefits Scheme (PBS), and Australian Childhood Immunisation Records (ACIR) services. Linkage was successful for 93% of children (incomplete consent forms resulted in data not being released for around 400 children). In consideration of this study's aims and objectives (outlined above), our analyses used only LSAC children's MBS data.
At the time of writing, records were available for MBS services accessed by study children between January 2002 (i.e. birth for the LSAC B cohort) and early 2017, resulting in a dataset comprising 502,334 observations (service visits) for the B cohort. Information in the dataset included: children's unique identification number (used to link the datasets), MBS item number and category (for service classification), date of service, date of processing, schedule fee, provider charge, out-of-pocket amount (if applicable), and benefit paid (if applicable).
A number of limitations affected the utility of MBS service use information by study children and the efficiency with which the MBS data could be analysed, including issues relating to data completeness, integrity and quality, such as data entry errors or service misclassifications (e.g. 'geriatric' classifications for services provided for children and adolescents), missing data and inconsistent variable formats. In addition, while item numbers were available to assist with the classification of all MBS service visits by study children over the data collection period, generic umbrella categories (e.g. 'management of bulkbilled services', 'other non-referred professional attendance', 'health assessments') precluded comprehensive examination of services provided, service providers' professional specialty/ies, and reasons for service use. Additionally, item numbers may become obsolete; once this occurs, they are removed from the MBS Online item number cache2 along with comprehensive details regarding their respective service classifications, fees, benefits, patient eligibility criteria, etc.).3
Measures
Parents' reports of children's use of health care services
In LSAC there are two sources of data available regarding children's use of health services. Firstly, the study child's primary carer - usually their mother - is asked whether the study child has used a range of health services in the 12 months prior to their LSAC interview at each wave. The list of health services includes:
- general practitioners (GPs)
- paediatrician
- psychiatric services or behavioural therapy
- other specialists
- speech therapy
- hospital emergency services
- hospital outpatient services
- dental services.
Children's use of health care services: MBS data
While parents' responses indicated if a health service has been used in the previous 12 months, they were not asked about how many times each type of service was accessed by study children. For some types of services, the matched MBS data can provide additional insights into frequency of service use. For the purposes of this study, the MBS service types assessed were chosen to reflect those included in the LSAC survey. The service types explored using MBS data comprised:
- four types of GP visits (note that all four GP categories are mutually exclusive):
- service provided at any location and lasted <20 minutes
- service provided at any location and lasted ≥20 minutes
- service provided after hours
- service provided was mental health-specific
- paediatrician
- psychologist
- other specialists.
For each of these services, we created indicators of whether the service had been used during the two years prior to each wave of LSAC data collection, in addition to frequency of service access. The two-year period was chosen (vs a shorter time frame, such as one year) to more comprehensively examine rates of MBS service use further to those identified in the self-report data, and in consideration of the two-year period (approximately) between each data collection wave, especially given that a shorter time frame would not capture all instances of MBS service use during that time.
To gauge unmet need for - and difficulties accessing - professional support, parents were asked if study children had needed any of these services in the past 12 months but were unable to access them.
Use of mental health and support services at the household level
Further to questions about health service use by study children, parents were asked whether anyone in their household had used any of the following services in the 12 months prior to the LSAC interview:
- parenting education
- family support group
- phone or internet helpline
- adult mental health services
- relationship counselling
- other counselling
- disability services.
As in relation to health service use by the study child, to gauge unmet need for - and difficulties accessing - professional support at the household level, parents were asked if family members had needed any of these services but were unable to access them.
Measures of child and adolescent social-emotional wellbeing: The Strengths and Difficulties Questionnaire (SDQ)
The social and emotional outcomes analysed in this report are based on children's scores on the Strengths and Difficulties Questionnaire (SDQ). The SDQ is a brief behavioural screening questionnaire designed to measure the psychological adjustment - that is, risk of experiencing social-emotional problems - of children aged between three and 16 years. This scale has been widely implemented and evidence of its psychometric properties has been demonstrated in a large number of studies, including those using Australian data (Hawes & Dadds, 2004; Stone, Otten, Engels, Vermulst, & Janssens, 2010). It is not intended to be used as a diagnostic instrument, but rather a measure of problematic emotions and behaviours across a range, from 'normative' to 'highly elevated' (Stone et al., 2010).
The SDQ Problems Subscale consists of 20 items, some positive and others negative, where each item describes an attribute of the child's behaviour (Goodman, 1999). The 20 items are divided into four scales, each comprising five items:
- hyperactivity/inattention (e.g. is restless, overactive, cannot stay still for long)
- conduct problems (e.g. often fights with other children or bullies them)
- emotional symptoms (e.g. has many fears and is easily scared)
- peer problems (e.g. is rather solitary, tends to play alone).
The primary carer of the study child indicates whether each item is: 'not true', 'somewhat true' or 'certainly true' of the child, and responses are scored 0, 1 or 2, respectively, such that higher scores indicate more problematic behaviour. Each of the four subscales therefore has a range of 0-10, with higher scores indicating a greater risk of clinically significant problems.
The full SDQ questionnaire consists of 25 items,4 with an additional five items measuring prosocial behaviours (e.g. is considerate of other people's feelings; shares readily with other children; helpful if someone is hurt, upset or feeling ill; kind to younger children; often volunteers to help others). This scale also has a range of 0-10; however, lower scores on the prosocial scale indicate a higher risk of social problems (Goodman, 1999).
For each subscale, cut points have been derived from UK samples to indicate the presence of elevated symptom levels (Australian Mental Health Outcomes and Classification Network, 2005). For the analyses presented here, consolidated indicators of 'slightly raised' and 'high' risk are used, as the number of observations for children at high risk of significant problems was too small for reliable estimates. The percentages of boys and girls exhibiting a raised or high (hereafter: 'elevated') risk of significant problems, for each SDQ subscale, are shown in Table 1.
| SDQ component | Age 4-5 (2008) % | Age 6-7 (2010) % | Age 8-9 (2012) % | Age 10-11 (2014) % | Age 12-13 (2016) % |
|---|---|---|---|---|---|
| Boys | |||||
| Emotional symptoms | 19.6 | 16.7 | 16.9 | 19.5 | 17.4* |
| Conduct problems | 23.1 | 28.2* | 23.0* | 18.1 | 16.2 |
| Hyperactivity | 18.3* | 24.1* | 25.4* | 23.3* | 19.9* |
| Peer problems | 23.5* | 25.1* | 25.7* | 26.6 | 27.2* |
| SDQ Total Difficulties score | 22.0 | 20.5* | 20.4* | 18.0* | 16.2 |
| Prosocial behaviour | 32.6* | 12.6* | 11.4* | 8.8* | 12.6* |
| Total, n | 1,972 | 2,173 | 2,062 | 1,888 | 1,711 |
| Girls | |||||
| Emotional symptoms | 21.8 | 18.3 | 20.0 | 22.1 | 26.1 |
| Conduct problems | 21.3 | 19.7 | 16.7 | 15.1 | 13.3 |
| Hyperactivity | 10.9 | 13.5 | 15.1 | 11.5 | 11.3 |
| Peer problems | 18.9 | 19.8 | 21.0 | 22.9 | 21.4 |
| SDQ Total Difficulties score | 16.8 | 12.9 | 14.1 | 12.9 | 14.4 |
| Prosocial behaviour | 19.3 | 4.4 | 2.9 | 4.5 | 7.9 |
| Total, n | 1,852 | 2,038 | 1,945 | 1,775 | 1,623 |
| All | |||||
| Emotional symptoms | 20.7 | 17.5 | 18.4 | 20.8 | 21.6 |
| Conduct problems | 22.2 | 24.1 | 19.9 | 16.7 | 14.8 |
| Hyperactivity | 14.7 | 18.9 | 20.4 | 17.6 | 15.7 |
| Peer problems | 21.2 | 22.5 | 23.4 | 24.8 | 24.3 |
| SDQ total score | 19.4 | 16.8 | 17.4 | 15.5 | 15.3 |
| Prosocial behaviour | 26.1 | 8.6 | 7.3 | 6.7 | 10.3 |
| Total, N | 3,824 | 4,211 | 4,007 | 3,663 | 3,334 |
Note: *Indicates a statistically significant difference (95% significance level) in percentage for boys vs girls.
Source: LSAC Waves 3-7, B cohort, weighted
For some subscales, the percentage of boys categorised as being at elevated risk of problems is significantly higher than that for girls. For example, across all age groups, the percentage of boys at elevated risk of problems related to hyperactivity was significantly higher for boys than for girls; at ages 6-7 and 8-9, a higher percentage of boys than girls were at risk of conduct problems; and at age 4-5, almost one third of boys, but only 20% of girls, were at risk of problems related to prosocial behaviour. At age 12-13, the percentage of girls who were at elevated risk of emotional symptoms and peer problems was significantly higher than that for boys.
Measures used in the multivariate analysis
The explanatory variables used in the multivariate analyses captured a range of characteristics known to be related to social-emotional outcomes and also with access to - and use of - health care services. These variables can be categorised into three groups:
- Characteristics of the study child - age group, gender, Aboriginal and/or Torres Strait Islander status, language other than English (LOTE) spoken at home, birth order, parent-reported physical health, and special health care needs.
- Characteristics of their household - parental income, receipt of income support, parents' education, parents' physical and mental health, private health insurance coverage, single or two-parent household, and whether a household member other than the study child had a physical health condition or disability.
- Characteristics of where they live - whether they resided in a major city, inner regional, outer regional or remote area, and level of economic advantage of their neighbourhood (SEIFA score).
Family-level use of services may differ depending on whether a family member has a long-term health condition or disability, and whether the household member with health difficulties was an adult or a child. Given this, for our analyses of service use by household members, the indicator of whether a household member - other than the study child - had a disability or long-term health condition was replaced by five indicators of whether the study child's mother, father, sibling, grandparent or other household member had a disability or long-term health condition.
Specific details about these measures (e.g. information on use of specific validated tools) can be found in Appendix B.
Statistical analyses
This report first provides descriptive evidence of rates of health service use by study children according to both parental reports and MBS data, followed by service use by family members. Descriptive findings are also presented for the relationship between children's social-emotional wellbeing and use of health services, for the children themselves and also for household members.
As mentioned previously, we were interested in the use of health services at the time that social-emotional difficulties were in the very early stages, when intervention would be of most benefit. For this reason, we examined children's use of health services in the 12- or 24-month period prior to the LSAC interview in which information about social-emotional problems (related to the child's behaviour in the previous six months) was collected, rather than the use of health services of children who had already been identified as being at risk of social-emotional issues. In any case, it is important to note that while the SDQ measures used refer to the child's behaviour in the six months to one year prior to their LSAC interview, the outcome measures - use of health services - refer to the period 12-24 months prior to the LSAC interview.
Multivariate analyses were used to account for a variety of factors related to both social-emotional outcomes and health service use (using both self-report and MBS data; Tables 6-8). Random effects logistic regression models were used, pooling five waves of data (Waves 3-7, corresponding with ages 4-5 to 12-13).5
For analyses of the MBS data where information was available regarding frequency of service use, random effects Poisson and negative binomial regressions were employed due to: the non-normal distribution of the study data, the capacity of these statistical approaches to estimate the relationship between 'exposure' variables (e.g. psychosocial or socio-economic factors) and outcomes when the outcome is 'count' or frequency information comprising positive (non-negative) integers (such as the number of times a study child accessed a particular service), and their ability to inform generalisations of findings to wider populations (specifically in relation to the use of random vs fixed effects). Negative binomial regression was used especially for its sensitivity in identifying significant associations when the outcome variable comprises a large number of zero values (i.e. for service types accessed relatively infrequently to others, such as psychologists vs GPs for less than 20 minutes). All analyses were conducted using Stata version 15.1.
Results
Overall use of health and support services
The percentage of children using specific medical services, as reported by parents, varied with age. For example, around 94% of children had used any of the services investigated at age 4-5, compared to approximately 89% at age 12-13 (Table 2). Overall, the most commonly accessed service among children was a GP; at least two thirds of children had accessed a GP at least once in the last 12 months at every age.
| Service | Age 4-5 (2008) % | Age 6-7 (2010) % | Age 8-9 (2012) % | Age 10-11 (2014) % | Age 12-13 (2016) % |
|---|---|---|---|---|---|
| General practitioner | 77.6 | 73.1 | 67.3 | 66.8 | 66.8 |
| Paediatrician | 8.1 | 8.5 | 8.7 | 8.6 | 6.5 |
| Other specialist | 10.8 | 11.5 | 12.1 | 12.8 | 13.9 |
| Hospital emergency | 19.0 | 14.6 | 15.8 | 16.1 | 16.9 |
| Hospital outpatient services | 6.4 | 5.9 | 6.0 | 6.5 | 7.0 |
| Psychiatric services or behavioural therapy | 2.8 | 4.5 | 6.2 | 6.7 | 7.5 |
| Guidance counsellor | 1.1 | 3.4 | 4.5 | 5.3 | 6.2 |
| Speech therapy | 12.6 | 9.4 | 5.5 | 3.5 | 2.0 |
| Dental services | 33.7 | 55.9 | 62.3 | 65.4 | 67.8 |
| Used any of the above | 93.6 | 89.9 | 89.1 | 89.9 | 89.2 |
| Needed any of the above, but could not get | 7.9 | 5.7 | 4.2 | 3.5 | 3.5 |
| Total, N | 4,385 | 4,237 | 4,048 | 3,696 | 3,299 |
Source: LSAC Waves 3-7, B cohort, weighted
Paediatricians specialise in the health and development of babies, teenagers and adolescents; however, referrals to a paediatrician are usually only required if a child has an ongoing or underlying health concern that needs to be monitored and treated by a specialist (these consultations often incur out-of-pocket expenses). LSAC data show that while almost 40% of children aged 0-1 year had seen a paediatrician in the previous 12 months (Warren, 2018), less than 10% of children over the age of 4-5 had visited a paediatrician in the past year.
Almost one in five 4-5 year olds had been to hospital emergency in the previous 12 months. From age 6-7, the percentage of children who had accessed hospital emergency services remained quite stable, at around 15-16%. In comparison, around 6-7% of children had used any hospital outpatient services in the previous 12 months across all age groups.
The percentage of children using speech therapy services decreased considerably with age, from 13% of 4-5 year olds to 2% of 12-13 year olds. This decline could be considered unsurprising given that, with appropriate treatment (especially at an early age), many speech and language difficulties can be resolved (Law, Zeng, Lindsay, & Beecham, 2012).
Conversely, the percentage of children who had used psychiatric services or behavioural therapy increased with age - from 3% of 4-5 year olds to 7.5% of 12-13 year olds. Use of guidance counsellors also increased as children got older - from 1% of children at age 4-5 to 6% at age 12-13. The increase after age 6-7 is likely because guidance counsellors are mainly school counsellors; in addition to providing course and career guidance for secondary students, guidance counsellors in primary schools mainly encourage school attendance and provide information about, and referrals to, other support agencies for children who may benefit from these services.
The Australian Dental Association (ADA) recommends that children should initially see a dentist when their first tooth becomes visible, and subsequently have dental check-ups every six months (ADA, 2016). Given these recommendations, the proportion of children who had seen a dentist in the previous 12 months was lower than would be expected at each time point, even in the teenage years and despite an increase in the rate of dentist access over the study period. Specifically, only 34% of 4-5 year olds had been to a dentist in the previous 12 months, compared to 56% of 6-7 year olds and 68% of 12-13 year olds.
Difficulties accessing health services
Visits to medical practitioners in the early years of childhood depend mainly on the physical and mental health of the child and the need for specific health services. Difficulties accessing services are likely to be related to a variety of factors, including location and availability of services (particularly in regional and remote areas), as well as knowledge of services and how to navigate complicated systems and referral processes. For some, concerns about confidentiality and poor previous experiences with health practitioners may be barriers to accessing services (Cummings & Kang, 2012). In addition, appointments with medical practitioners such as paediatricians, dentists and other specialists can involve considerable out-of-pocket expenses. It is therefore likely that visits to such service providers also depend, at least partly, on household income and whether the family is covered by private health insurance.
As indicated in Table 2, although most parents reported no difficulties with access to health services for their child in the past 12 months, 8% reported problems accessing health services when their child was aged 4-5. For parents of children aged eight and older, the percentage reporting difficulties with service access reduced to around 4%.
Using LSAC data, Warren (2018) found that difficulties accessing health services were more common among families in regional and remote areas than for those living in metropolitan areas. This finding is consistent with research from the AIHW (2017), which showed that people living in remote and very remote areas generally have poorer access to - and less frequently engage with - health services than people in regional areas and major cities.
LSAC findings also provide evidence of difficulties related to the cost of health services, with families in the lowest quartile of equivalised income, and those without private health insurance, more likely to report trouble accessing services. Language difficulties and knowledge about how to access services also appeared to be a factor; among families with young children, those who spoke a LOTE were more likely to have reported difficulties accessing health services (Warren, 2018).
Overall use of MBS services
Table 3 lists the percentages of LSAC study children who had used each of the MBS service types assessed in our analyses at least once in the two years prior to interview during Waves 3-7 of data collection. The service type children most commonly engaged with during this time period was a GP for 20 minutes or less. Although the percentage of children accessing this service decreased at each subsequent wave, it remained above 80% throughout the whole study period. This finding generally accords with the self-report data regarding GP use in Table 2 above; specifically, that GPs were the most commonly accessed service among study children, according to parental reports; however, the MBS data provide more context regarding the types of service commonly provided by GPs.
Also reflecting a finding identified in Table 2: the percentages of children accessing a paediatrician at each wave were stable-decreasing as children got older. The MBS figures are notably higher than the parental report data in Table 2, which is likely due to differences in service use rates during the past year (parental data) versus past two years (MBS).
The after-hour services of GPs were used by a substantial minority of the cohort throughout the follow-up period, ranging from nearly one third (31.4%) at age 4-5, to close to one quarter (22.9%) at age 12-13. In contrast to these decreasing rates, and corresponding with the LSAC cohort's increasing age, the percentages of children accessing psychologists and GPs for mental health-specific concerns rose as children got older.
| Service | Age 4-5 (2008) % | Age 6-7 (2010) % | Age 8-9 (2012) % | Age 10-11 (2014) % | Age 12-13 (2016) % |
|---|---|---|---|---|---|
| General practitioner | |||||
| 1. <20 minutes | 92.3 | 88.4 | 85.3 | 82.0 | 80.3 |
| 2. ≥20 minutes | 20.6 | 13.4 | 14.6 | 18.4 | 23.4 |
| 3. Mental health-specific concerns | 0.8 | 3.1 | 6.1 | 8.0 | 9.5 |
| 4. After hours | 31.4 | 27.2 | 25.2 | 22.5 | 22.9 |
| Paediatrician | 14.0 | 12.6 | 14.5 | 13.3 | 12.3 |
| Psychologist | 0.8 | 2.9 | 5.2 | 7.4 | 7.9 |
| Other specialist | 16.3 | 16.0 | 12.9 | 11.7 | 12.2 |
| Use of any service | 93.9 | 90.4 | 88.3 | 86.2 | 84.6 |
Source: LSAC Waves 3-7, B cohort, and MBS data, years 2008-16
The figures listed in Table 4 detail the average number of visits to each MBS service type (and range) by children's age. Reflecting high usage rates of GPs for less than 20 minutes, this service type was also the most frequently visited by study children at each age, ranging from a mean of 7.0 at 4-5 years to 4.5 at ages 10-11 and 12-13. In contrast, the utilisation frequency of other GP service options (i.e. 20 or more minutes, for mental health-specific concerns and after hours) appeared to remain relatively stable across the follow-up period. Overall, the average frequency of visiting any service type decreased slightly between ages 4-5 and 12-13, from 8.6 to 6.6, respectively.6
| Service | Mean frequency and range | ||||
|---|---|---|---|---|---|
| Age 4-5 (2008) | Age 6-7 (2010) | Age 8-9 (2012) | Age 10-11 (2014) | Age 12-13 (2016) | |
| General practitioner | |||||
| 1. <20 minutes | 7.0 (1-48) | 5.7 (1-48) | 4.9 (1-49) | 4.5 (1-47) | 4.5 (1-38) |
| 2. ≥20 minutes | 1.5 (1-12) | 1.4 (1-18) | 1.4 (1-7) | 1.5 (1-12) | 1.5 (1-11) |
| 3. Mental health-specific concerns | 1.3 (1-3) | 1.3 (1-5) | 1.4 (1-6) | 1.4 (1-5) | 1.6 (1-14) |
| 4. After hours | 1.9 (1-19) | 1.9 (1-19) | 1.8 (1-27) | 1.6 (1-13) | 1.7 (1-12) |
| Paediatrician | 2.5 (1-33) | 2.8 (1-30) | 2.9 (1-44) | 2.9 (1-31) | 3.1 (1-30) |
| Psychologist | 4.3 (1-17) | 4.4 (1-18) | 5.9 (1-31) | 5.8 (1-28) | 5.5 (1-20) |
| Other specialist | 4.3 (1-17) | 2.1 (1-27) | 2.0 (1-15) | 1.7 (1-9) | 2.0 (1-15) |
| Use of any service | 8.6 (1-69) | 7.3 (1-60) | 6.7 (1-56) | 6.3 (1-60) | 6.6 (1-71) |
Note: Means and ranges calculated for children who engaged with services during each two-year period prior to interviews (i.e. zero values were excluded).
Source: LSAC Waves 3-7, B cohort, and MBS data, years 2008-16
Use of counselling and support services at the family level
As was the case for children's use of health services, use of professional support options such as parenting education, family support groups, counselling and other mental health services at the household level depends on the need for these services; that is, whether any household members have physical or mental health issues that require these services. Across all age groups, around one quarter of parents reported using some type of support service for a family member, with 'Other counselling' being the most commonly reported service used (Table 5).
| Service | Age 4-5 (2008) % | Age 6-7 (2010) % | Age 8-9 (2012) % | Age 10-11 (2014) % | Age 12-13 (2016) % |
|---|---|---|---|---|---|
| Parenting education | 7.6 | 5.5 | 4.0 | 4.5 | 3.9 |
| Family support group | 2.9 | 2.2 | 0.6 | 1.2 | 1.1 |
| Phone or internet helpline | 6.7 | 4.3 | 2.0 | 3.0 | 2.5 |
| Adult mental health services | 3.5 | 4.3 | 2.8 | 4.7 | 5.2 |
| Relationship counselling | 4.9 | 4.8 | 2.4 | 4.1 | 3.4 |
| Other counselling | 8.9 | 10.9 | 6.4 | 11.6 | 12.6 |
| Disability services | 1.8 | 1.9 | 1.4 | 2.4 | 3.2 |
| Used any of the above | 26.6 | 23.7 | 18.4 | 23.4 | 23.4 |
| Needed any of the above, but could not get | 3.4 | 1.9 | 2.8 | 2.6 | 2.2 |
| Total, N | 4,385 | 4,237 | 4,048 | 3,696 | 3,299 |
Source: LSAC Waves 3-7, B cohort, weighted
The percentages of families who had used services such as parenting education and phone or internet helplines decreased with the age of the study child, while for other services, such as adult mental health services and other counselling, levels of use increased slightly as the study children got older. Notably, very few parents reported difficulties accessing these services; this suggests that, for most families, support for emotional issues is available when needed.
Parents' reports of children's use of health services, by social-emotional outcomes
Across all age groups, there were significant - and often substantial - differences in children's use of a range of health services as per parental reports, according to whether or not they had an elevated (i.e. raised or high) risk of social-emotional problems. These differences are described below for each of the SDQ subscales of emotional symptoms, hyperactivity, conduct problems, peer problems and pro-social behaviour.7
Psychiatric or behavioural therapy services
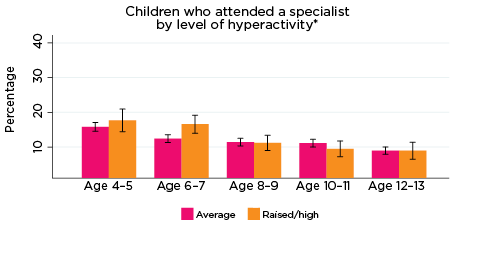
For all five SDQ subscales and across all age groups (4-5 to 12-13), the percentage of children who used psychiatric or behavioural therapy services in the previous 12 months was significantly higher among those with higher levels of social-emotional problems (Figure 1).
Figure 1: Use of psychiatric or behavioral therapy services, by social-emotional outcomes


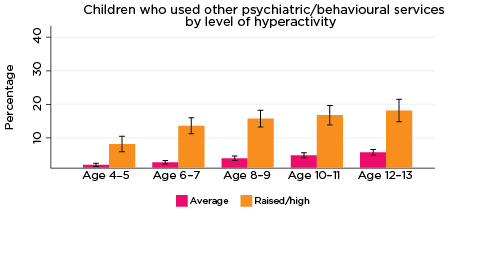
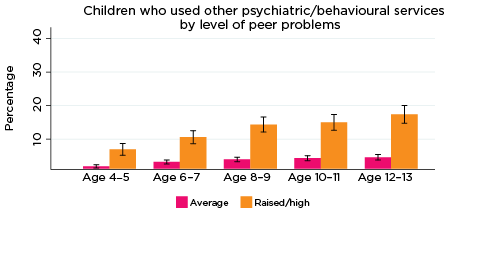

Notes: Use of service in the last 12 months. 95% confidence intervals are shown by 'I' bars in each column. Where confidence intervals for the groups being compared do not overlap, this indicates that the values are significantly different. N = 3,823 (age 4-5), 4,206 (age 6-7), 3,998 (age 8-9), 3,656 (age 10-11), 3,271 (age 12-13).
Source: LSAC Waves 3-7, B cohort, weighted
In addition, the percentage of children who had been to psychiatric or behavioural therapy services increased substantially with age. For example:
- Among children with elevated levels of emotional symptoms, the percentage of children who had used psychiatric or behavioural therapy services increased from 6% at age 4-5 to 22% at age 12-13. In contrast, among children with lower levels of emotional symptoms, the percentage who had used psychiatric or behavioural therapy services increased from 2% at age 4-5 to 4% at age 12-13.
- Among children with elevated levels of peer problems, the percentage who had used psychiatric or behavioural therapy services increased from 7% at age 4-5 to 17% at age 12-13. For children with lower levels of peer problems, the percentage who had used psychiatric or behavioural therapy services increased from 2% at age 4-5 to 4% at age 12-13.
Paediatrician
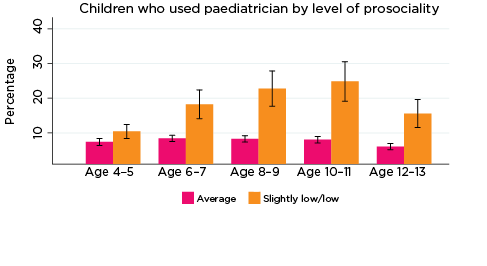
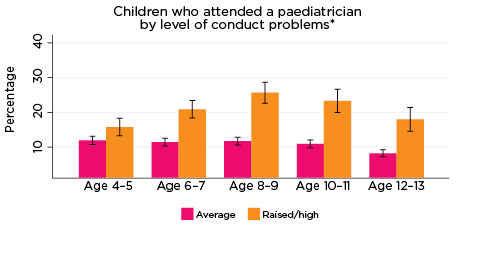
As was the case for psychiatric and behavioural therapy services, the percentage of children who had a consultation with a paediatrician in the previous 12 months was significantly higher among those with elevated levels of social-emotional problems across all age groups and for all five SDQ subscales (Figure 2). The only exception was for prosocial behaviour at age 4-5.
Differences in the percentages of children who had seen a paediatrician, according to whether there was a risk of social-emotional problems, were substantial, ranging from three percentage points for those with elevated levels of conduct problems at age 4-5 (10% compared to 7%), to 19 percentage points for those with elevated levels of hyperactivity at age 10-11 (24% vs 5%).
Figure 2: Use of paediatricians, by social-emotional outcomes

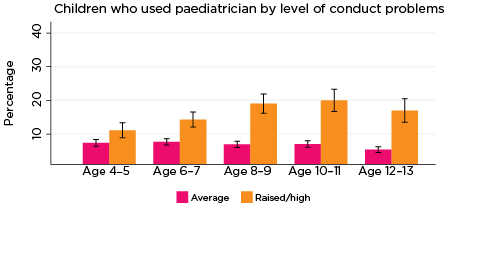
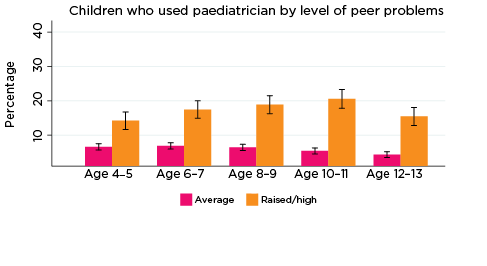
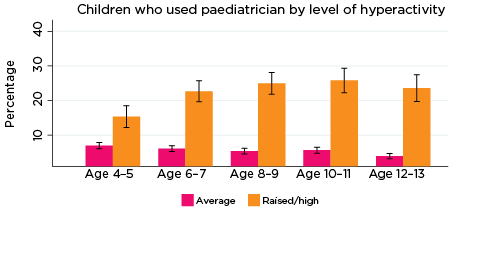
Notes: Use of paediatrician in the last 12 months. 95% confidence intervals are shown by 'I' bars in each column. Where confidence intervals for the groups being compared do not overlap, this indicates that the values are significantly different. N = 3,823 (age 4-5), 4,206 (age 6-7), 3,998 (age 8-9), 3,656 (age 10-11), 3,271 (age 12-13).
Source: LSAC Waves 3-7, B cohort, weighted
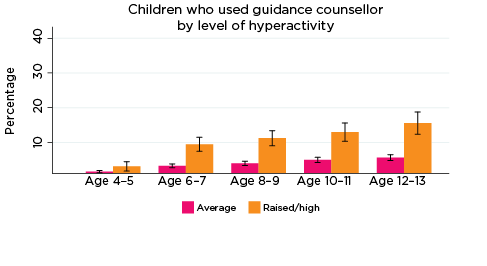
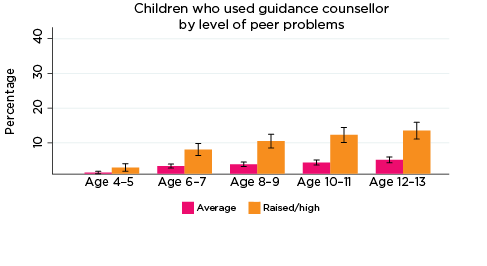
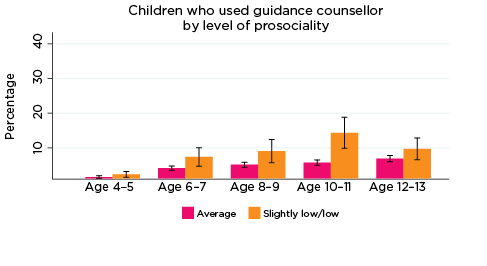
Guidance counsellor
The percentage of children who had used guidance counsellor services in the previous 12 months was significantly higher among those with elevated levels of emotional symptoms, conduct problems, hyperactivity and peer problems from ages 6-7 to 12-13, and also among children with lower levels of prosocial behaviour at ages 8-9 and 10-11 (Figure 3). For example:
- Among children with elevated levels of emotional symptoms at age 6-7, 10% had used guidance counsellor services in the past 12 months, compared to 2% of children with lower levels of emotional symptoms.
- Among those with elevated levels of conduct problems at age 12-13, 16% had used guidance counsellor services, compared to 5% for other 12-13 year olds.
- Among adolescents with lower levels of prosocial behaviour at age 10-11, 13% had used guidance counsellor services in the previous 12 months, compared to 5% of other children aged 10-11.
Figure 3: Use of guidance counsellor services, by social-emotional outcomes
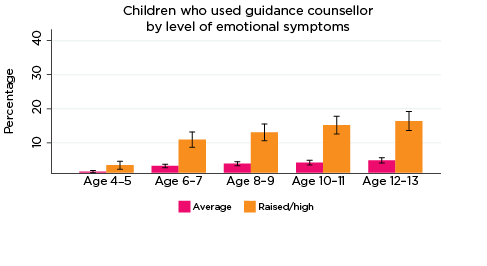
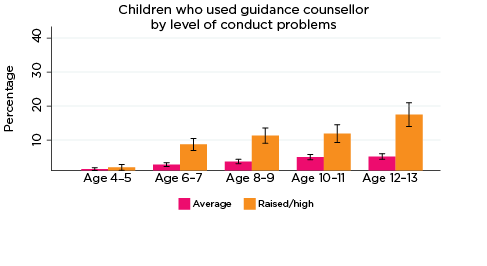
Notes: Use of guidance counsellor in the last 12 months. 95% confidence intervals are shown by 'I' bars in each column. Where confidence intervals for the groups being compared do not overlap, this indicates that the values are significantly different. N = 3,823 (age 4-5), 4,206 (age 6-7), 3,998 (age 8-9), 3,656 (age 10-11), 3,271 (age 12-13).
Source: LSAC Waves 3-7, B cohort, weighted
The lack of statistical significance regarding the percentage of children who had used guidance counsellor services at age 4-5 is likely because guidance counsellors are usually a service provided at school, and the number of parents reporting that their children had used this service at age 4-5 was very small.
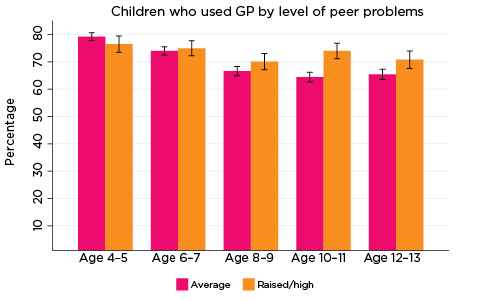
General practitioner
The percentage of children whose parents reported at least one consultation with a GP in the previous 12 months was significantly higher among those with elevated levels of:
- emotional symptoms from ages 6-7 to 12-13. This difference increased with age. At age 6-7, 79% of children with elevated levels of emotional symptoms had seen a GP in the past 12 months, compared to 73% of other children. At age 12-13, 78% of those with elevated levels of emotional symptoms had seen a GP, compared to 64% of other children (Figure 4).
- hyperactivity at ages 8-9, 10-11 and 12-13. Across these three age groups, almost three quarters (72-73%) of children with increased risk of problems related to hyperactivity had been to a GP in the past 12 months, compared to around two thirds of other children in these age groups.
- peer problems at ages 10-11 and 12-13. Among those with elevated levels of peer problems at ages 10-11 and 12-13, the percentage who had seen a GP in the past 12 months was 74% and 71%, respectively, compared to around 66% of other children at both ages.
Figure 4: Use of GP services, by social-emotional outcomes
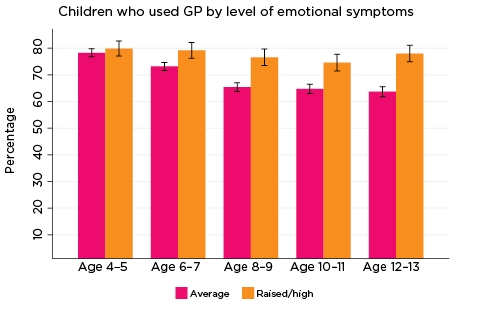

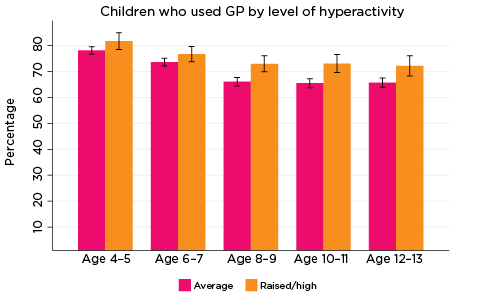
Notes: Use of general practitioner in the last 12 months. 95% confidence intervals are shown by 'I' bars in each column. Where confidence intervals for the groups being compared do not overlap, this indicates that the values are significantly different. N = 3,823 (age 4-5), 4,206 (age 6-7), 3,998 (age 8-9), 3,656 (age 10-11), 3,271 (age 12-13).
Source: LSAC Waves 3-7, B cohort, weighted
Across all age groups, there were no significant differences in the percentage of children who had used GP services in the previous 12 months, according to their levels of conduct problems or prosocial behaviour.
Emergency department
The percentage of children who had been to a hospital emergency department in the previous 12 months was significantly higher among those with elevated levels of:
- emotional symptoms at 6-7, 8-9 and 12-13. At ages 6-7 and 8-9, one in five (20%) of children with increased levels of emotional symptoms had been to emergency, compared to 14-15% of other children. At age 12-13 the difference was larger, with 23% for children with elevated levels of emotional symptoms having been to emergency, compared to 15% for children with lower levels (Figure 5).
- conduct problems at ages 4-5, 8-9 and 12-13. At age 4-5, almost one quarter (24%) of children with elevated levels of conduct problems had been to emergency, compared to one in five (19%) of other children. At age 12-13, the difference was larger, with one in four adolescents with elevated risk of conduct problems having been to emergency in the past 12 months, compared to around one in six (16%) of other children.
- hyperactivity at ages 4-5, 6-7 and 8-9. At age 4-5, one in four children with elevated levels of hyperactivity had been to the emergency department, compared to one in five (21%) children with lower levels of hyperactivity. At ages 6-7 and 8-9, the difference was larger, with 21% of children with elevated levels of hyperactivity having been to emergency, compared to 15% of other children.
- peer problems at ages 6-7 and 8-9. Around 20% of children with an increased risk of peer problems had been to the emergency department at ages 6-7 and 8-9, compared to 14% of other children in these age groups.
Figure 5: Use of emergency department, by social-emotional outcomes


Notes: Emergency attendance in the last 12 months. 95% confidence intervals are shown by 'I' bars in each column. Where confidence intervals for the groups being compared do not overlap, this indicates that the values are significantly different. N = 3,823 (age 4-5), 4,206 (age 6-7), 3,998 (age 8-9), 3,656 (age 10-11), 3,271 (age 12-13).
Source: LSAC Waves 3-7, B cohort, weighted
Across all age groups, there were no significant differences in the percentage of children who had been to the emergency department in the previous 12 months, according to their level of prosocial behaviour.
Hospital outpatient services
The percentage of children who had accessed hospital outpatient services in the previous 12 months was significantly higher among those with elevated levels of:
- emotional symptoms at ages 6-7, 8-9 and 10-11. Among children with elevated levels of emotional symptoms, 9-11% had been to hospital outpatient services, compared to 5-6% of children with lower levels of emotional symptoms (Figure 6).
- conduct problems, at age 8-9 only. Among those with elevated levels of conduct problems at age 8-9, 10% had accessed hospital outpatient services, compared to 5% for other children aged 8-9.
- hyperactivity at ages 6-7 and 8-9. At both ages, 11% of children with elevated levels of hyperactivity had been to hospital outpatient services, compared to 5% of other children.
- peer problems at ages 4-5, 6-7 and 8-9. For children in these three age groups, 9% of those with elevated levels of peer problems had accessed hospital outpatient services in the past 12 months, compared to 5-6% of children with lower levels of peer problems.
Figure 6: Use of hospital outpatient services, by social-emotional outcomes
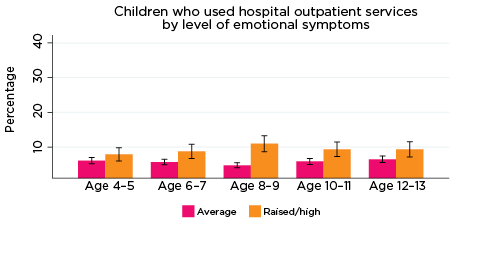


Notes: Use of outpatient services in the last 12 months. 95% confidence intervals are shown by 'I' bars in each column. Where confidence intervals for the groups being compared do not overlap, this indicates that the values are significantly different. N = 3,823 (age 4-5), 4,206 (age 6-7), 3,998 (age 8-9), 3,656 (age 10-11), 3,271 (age 12-13).
Source: LSAC Waves 3-7, B cohort, weighted
At age 10-11, but not at other ages, the percentage of children who had accessed hospital outpatient services in the previous 12 months was significantly higher among those with lower levels of prosocial behaviour (12% compared to 5% for children with higher levels of prosocial behaviour).
Speech therapy
The percentage of children who had been to a speech therapist in the previous 12 months declined considerably with age - from 13% of 4-5 year olds to 4% of 10-11 year olds and 2% of 12-13 year olds. However, there were still significant differences in the percentage of study children who had used this service, according to their social-emotional outcomes. For example, among children with elevated levels of hyperactivity, the percentage of children who had been to a speech therapist decreased from 20% for 4-5 year olds to 5% for 12-13 year olds. For children with lower levels of hyperactivity, the percentage of children who had used speech therapy services was 12% at age 4-5, and 1% at age 12-13 (Figure 7).
Figure 7: Use of speech therapy services, by social-emotional outcomes
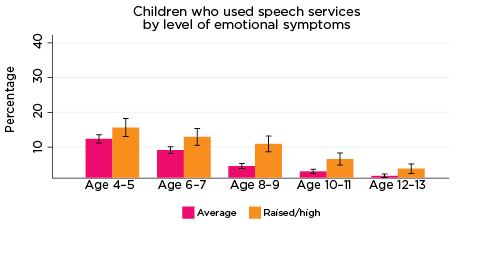
Notes: Speech service use in the last 12 months. 95% confidence intervals are shown by 'I' bars in each column. Where confidence intervals for the groups being compared do not overlap, this indicates that the values are significantly different. N = 3,823 (age 4-5), 4,206 (age 6-7), 3,998 (age 8-9), 3,656 (age 10-11), 3,271 (age 12-13).
Source: LSAC Waves 3-7, B cohort, weighted
These results suggest that, at least for some children, poor social-emotional outcomes may be related to a physical health condition or disability, such as hearing loss. Indeed, research has demonstrated that speech and hearing difficulties may lead to poorer social-emotional outcomes among children (as measured by the SDQ) (Stevenson, Kreppner, Pimperton, Worsfold, & Kennedy, 2015). Therefore, the use of specific health services may not necessarily be to treat the emotional symptoms, but emotional symptoms may be related to difficulties arising from the health condition requiring medical treatment.
Dental services
The percentage of children who had been to the dentist in the previous 12 months was significantly lower among those with elevated levels of:
- conduct problems and hyperactivity at age 8-9. Among those with elevated levels of conduct problems or hyperactivity at age 8-9, 58% had been to the dentist, compared to 64% for other children aged 8-9 (Figure 8).
- peer problems at ages 4-5, 8-9, 10-11 and 12-13. For example, at age 12-13, 59% of those with elevated levels of peer problems had been to the dentist, compared to 71% of other children aged 12-13.
Figure 8: Use of dental services, by social-emotional outcomes


Notes: Dental service use in the last 12 months. 95% confidence intervals are shown by 'I' bars in each column. Where confidence intervals for the groups being compared do not overlap, this indicates that the values are significantly different. N = 3,823 (age 4-5), 4,206 (age 6-7), 3,998 (age 8-9), 3,656 (age 10-11), 3,271 (age 12-13).
Source: LSAC Waves 3-7, B cohort, weighted
At age 8-9, but not at other ages, the percentage of children who had been to the dentist in the previous 12 months was significantly reduced among those with lower levels of prosocial behaviour (55% compared to 63% for children with higher levels of prosocial behaviour).
It is possible that children with hyperactivity, conduct problems or lower levels of prosocial skills are more difficult to take to the dentist, or that dental services are less of a priority for parents when children have issues that require ongoing medical treatments. Indeed, research has shown that dental care is one of the most commonly cited unmet health concerns for children with other health care needs (Lewis, 2009).
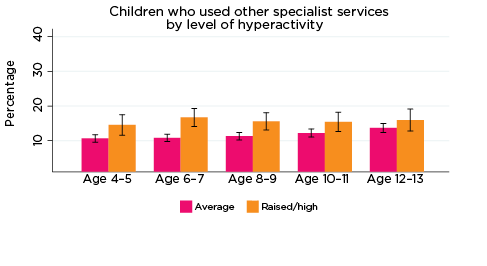
Other specialists
The percentage of children who had used other specialist services in the previous 12 months was significantly higher among those with elevated levels of:
- hyperactivity at ages 6-7 and 8-9. Among children in these two age groups, 16-17% of those with elevated levels of hyperactivity used other specialists in the past 12 months, compared to 11% for other children aged 6-7 and 8-9.
- peer problems at age 8-9 only. Among children with elevated levels of peer problems at age 8-9, 15% had used other specialist services, compared to 11% of children with lower levels of peer problems at that age (Figure 9).
Across all age groups, there were no significant differences in the percentage of children who had used other specialist services in the previous 12 months, according to their level of emotional symptoms, conduct problems or prosocial behaviour. This lack of statistical significance may be because 'other specialists' covers a broad range of services, some of which are related to social-emotional problems, while others are not.
Figure 9: Use of other specialist services, by social-emotional outcomes
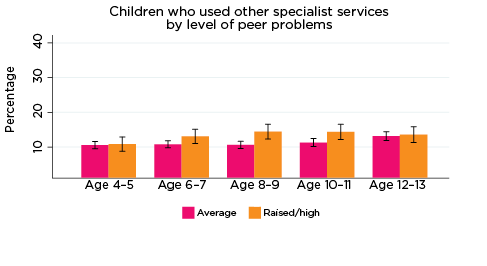
Notes: Use of service in the last 12 months. 95% confidence intervals are shown by 'I' bars in each column. Where confidence intervals for the groups being compared do not overlap, this indicates that the values are significantly different. N = 3,823 (age 4-5), 4,206 (age 6-7), 3,998 (age 8-9), 3,656 (age 10-11), 3,271 (age 12-13).
Source: LSAC Waves 3-7, B cohort, weighted
Access to health services
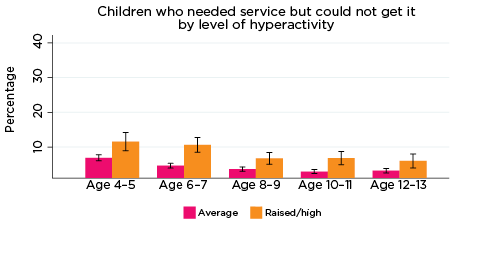
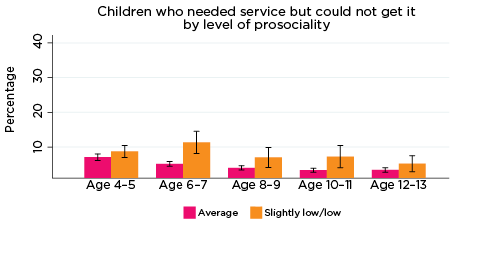
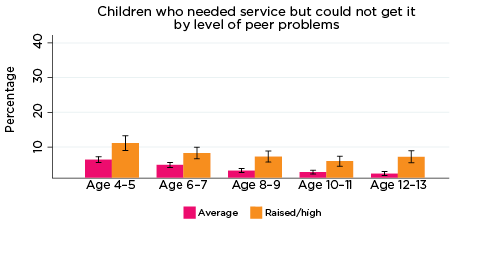
The percentage of parents who reported that they had needed health services for their child in the previous 12 months, but were not able to get them, was significantly higher among parents whose children had elevated levels of risk of social-emotional problems. For example, among parents of children with elevated levels of risk of conduct problems at all ages, the percentage who reported experiencing difficulties accessing services ranged from 11% when their children were aged 4-5, to 7% when children were aged 12-13. Among parents of children with a lower risk of conduct problems, the percentage reporting difficulties accessing services ranged from 7% when their children were aged 4-5, to 3% when their children were aged 10-11 and 12-13 (Figure 10).
Figure 10: Difficulties accessing health services, by social-emotional outcomes
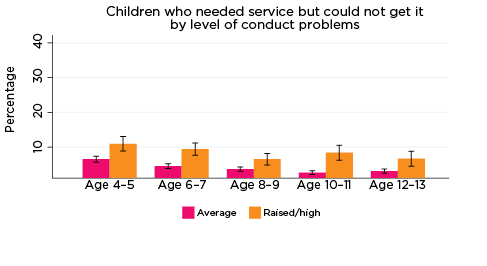
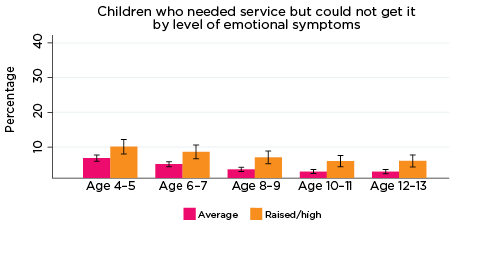
Notes: Needed service in the last 12 months. 95% confidence intervals are shown by 'I' bars in each column. Where confidence intervals for the groups being compared do not overlap, this indicates that the values are significantly different. N = 3,823 (age 4-5), 4,206 (age 6-7), 3,998 (age 8-9), 3,656 (age 10-11), 3,271 (age 12-13).
Source: LSAC Waves 3-7, B cohort, weighted
Children's use of MBS services, by social-emotional outcomes
This section details children's use of various MBS services - GPs, psychologists, paediatricians and specialists - as per the linked Medicare data. Each figure in this section indicates children's use of services in the two years prior to their/their parents' interview at each LSAC wave with respect to rankings on each of the SDQ subscales of emotional symptoms, hyperactivity, conduct problems, peer problems and pro-social behaviour.
GP for less than 20 minutes
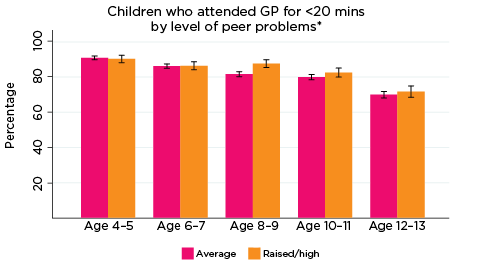
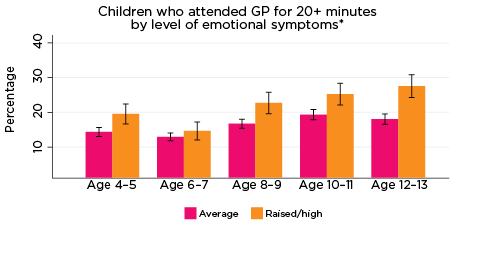
The most commonly used service type among LSAC children overall was a GP for less than 20 minutes. As demonstrated in Figure 11, regardless of the level or type of psychological adjustment symptom, use of GPs for less than 20 minutes tended to decrease as children got older; at age 4-5, around 92% of children had accessed a GP for less than 20 minutes in the two years prior to interview, compared to approximately 80% at age 12-13. Perhaps due - in part - to the high rate of use of this type of service (i.e. given the small numbers of children not in contact with GPs for less than 20 minutes), there were very few significant differences among children regarding use of GP services for less than 20 minutes in relation to level/type of psychological symptom measured by the SDQ. One exception was in relation to the level of emotional symptoms: at ages 8-9 and 12-13, a significantly higher number of children with elevated risk of experiencing emotional symptoms had accessed a GP for less than 20 minutes in the two years prior to interview, compared to those with average risk (90% vs 84% and 84% vs 79%, respectively).
Figure 11: Use of GPs for less than 20 minutes, by psychological adjustment symptoms and age
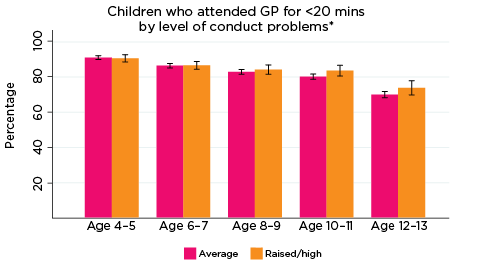
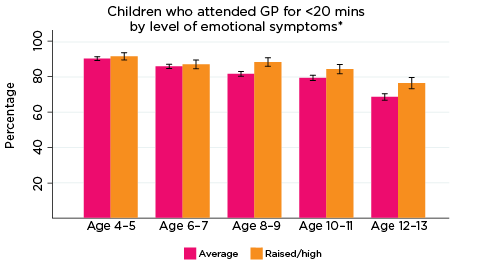

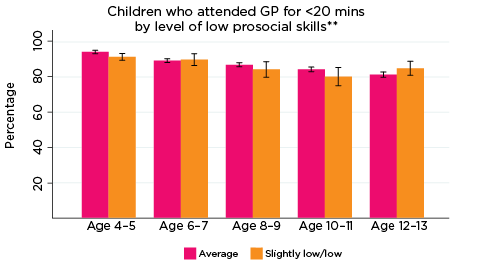
Notes: * GP attendance corresponding with years of data collection; i.e. 2008/09-2016/17. ** Service attendance during two years prior to each interview. 95% confidence intervals are shown by 'I' bars in each column. Where confidence intervals for the groups being compared do not overlap, this indicates that the values are significantly different. N = 3,693 (age 4-5), 4,060 (age 6-7), 3,881 (age 8-9), 3,539 (age 10-11), 3,281 (age 12-13).
Source: LSAC Waves 3-7, B cohort and MBS data, weighted
GP for 20 minutes or longer
The use of GP services for 20 or more minutes typically decreased between the ages of 4-5 and 6-7 years, before increasing over the remainder of the data collection period (Figure 12). Increasing rates of use following the age of 6-7 appeared to be influenced largely by children at elevated risk of experiencing emotional symptoms, hyperactivity and peer problems. There were numerous significant differences among the cohort in relation to these indicators of psychological adjustment; for example, at age 12-13, 29% of children at elevated risk of experiencing peer problems had accessed a GP for ≥20 minutes in the past two years, compared to 22% of those with average risk. In contrast, there were no significant differences in rates of use of GP services for 20 or more minutes with regard to levels of risk of experiencing conduct problems or having low prosocial skills.
Figure 12: Use of GPs ≥20 minutes, by psychological adjustment symptoms and age
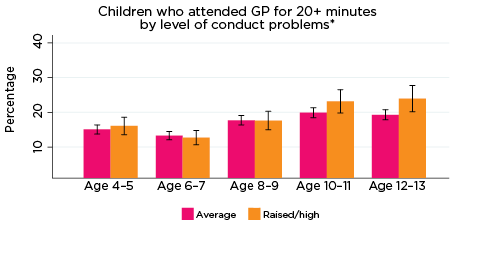
Notes: * GP attendance corresponding with years of data collection; i.e. 2008/09-2016/17. ** Service attendance during two years prior to each interview. 95% confidence intervals are shown by 'I' bars in each column. Where confidence intervals for the groups being compared do not overlap, this indicates that the values are significantly different. N = 3,693 (age 4-5), 4,060 (age 6-7), 3,881 (age 8-9), 3,539 (age 10-11), 3,281 (age 12-13).
Source: LSAC Waves 3-7, B cohort and MBS data, weighted
GP for mental health concerns
Use of GP services specifically for mental health concerns tended to increase steadily as children got older (Figure 13). There were significant differences in the use of GPs for mental health concerns in the past two years in relation to levels of risk of poor psychological adjustment, specifically with regard to risk of experiencing emotional symptoms, conduct and peer problems, and hyperactivity. For example, at age 10-11, approximately 16% of children with elevated risk of experiencing conduct problems had accessed a GP for mental health concerns in the past two years, compared to around 7% of children experiencing only average risk. Similarly, at the same age, 16% of children with elevated risk of experiencing hyperactivity had accessed a GP specifically in relation to mental health, compared to 8% of those with only average risk of hyperactivity. In contrast, children at elevated risk of experiencing low pro-social skills used GPs for mental health concerns at significantly higher rates than those with average risk at ages 6-7, 10-11 and 12-13, but not at ages 4-5 or 8-9. Nevertheless, overall, these findings indicate that experiencing poor psychological adjustment as young as age 4-5 years can affect rates of service use among Australian children.
Figure 13: Use of GP services for mental health concerns, by psychological adjustment and age


Notes: * GP (mental health) utilisation corresponding with years of data collection; i.e. 2008/09-2016/17.
** Service attendance during two years prior to each interview. 95% confidence intervals are shown by 'I' bars in each column. Where confidence intervals for the groups being compared do not overlap, this indicates that the values are significantly different. N = 3,693 (age 4-5), 4,060 (age 6-7), 3,881 (age 8-9), 3,539 (age 10-11), 3,281 (age 12-13).
Source: LSAC Waves 3-7, B cohort and MBS data, weighted
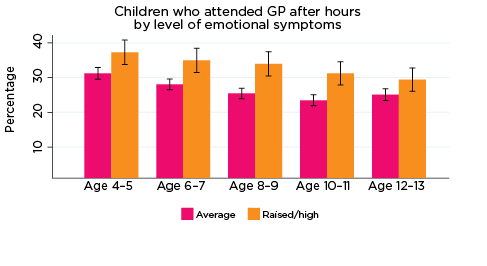
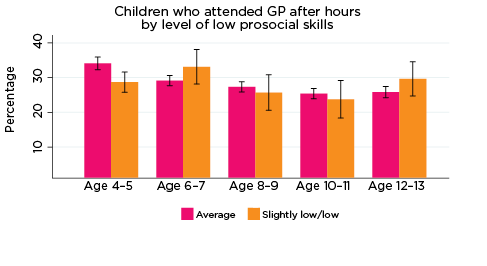
After-hours GP services
Overall, usage rates of after-hours GP services decreased slightly as children got older (Figure 14). One exception to this was in relation to level of prosocial skills; rates of using after-hours GP services were somewhat inconsistent among children with elevated risk of experiencing low prosocial skills in particular - 28% of this group had accessed a GP after hours at age 4-5, followed by 33% at age 6-7, 25% at 8-9, 23% at 10-11, and 30% at 12-13 years.
Regarding the remaining SDQ indicators of psychological adjustment, children at elevated risk of experiencing emotional symptoms were consistently significantly more likely to have accessed a GP after hours between the ages of 4-5 and 10-11 compared to children with only average risk of experiencing emotional symptoms; however, the difference between the groups was not significant at age 12-13. Few other significant differences were observed; however, children at elevated risk of experiencing peer problems were significantly more likely to have used after-hours GP services at ages 8-9 and 10-11, compared to children with only average risk of peer problems.
Figure 14: Use of after-hours GP services, by psychological adjustment and age

Notes: Service attendance during two years prior to each interview. 95% confidence intervals are shown by 'I' bars in each column. Where confidence intervals for the groups being compared do not overlap, this indicates that the values are significantly different. N = 3,693 (age 4-5), 4,060 (age 6-7), 3,881 (age 8-9), 3,539 (age 10-11), 3,281 (age 12-13).
Source: LSAC Waves 3-7, B cohort and MBS data, weighted
Paediatrician
Reflecting the self-report findings above, there were distinct patterns observed among the MBS data with regard to study children's access to paediatricians (Figure 15). Notably, regardless of the type of psychological adjustment indicator, among those at elevated risk of experiencing emotional symptoms, conduct problems, hyperactivity, peer problems or low prosocial skills, the use of paediatricians typically increased from age 4-5 and peaked at age 8-9 years, before decreasing for the remainder of the data collection period. Conversely, among children with only average risk of experiencing any of the SDQ indicators of psychological adjustment, rates of access to paediatricians typically remained stable-decreasing over time. In accord with these opposing trends, there were significant differences between the rates of paediatrician access among children at elevated risk of poor psychological adjustment across all indicators and age-groups, barring low prosocial skills at age 4-5.
Figure 15: Use of paediatricians, by psychological adjustment and age


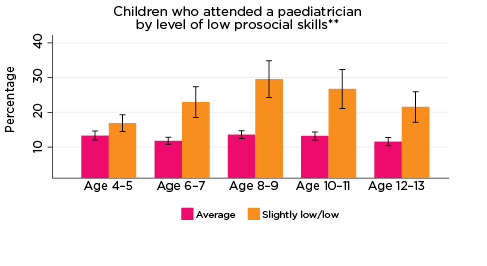
Notes: * Paediatrician corresponding with years of data collection; i.e. 2008/09-2016/17. ** Service attendance during two years prior to each interview. 95% confidence intervals are shown by 'I' bars in each column. Where confidence intervals for the groups being compared do not overlap, this indicates that the values are significantly different. N = 3,693 (age 4-5), 4,060 (age 6-7), 3,881 (age 8-9), 3,539 (age 10-11), 3,281 (age 12-13).
Source: LSAC Waves 3-7, B cohort and MBS data, weighted
Psychologists
Psychologist services were typically accessed at lower rates compared to the other MBS service types investigated for this study (Figure 16). Regardless, across the SDQ 'Problem' indicators, children at elevated risk of experiencing emotional symptoms, conduct problems, hyperactivity or peer problems were typically significantly more likely to have accessed a psychologist in the prior two years, compared to children with just average risk of experiencing these issues. For example, at age 10-11, around 20% of children at elevated risk of experiencing emotional problems had accessed a psychologist in the last two years, compared to only 4% of children with average risk of emotional problems.
Rates of use of psychologists among children at elevated risk of emotional symptoms, hyperactivity and peer problems appeared to follow a similar pattern, increasing between the ages of 4-5, peaking at age 10-11, then decreasing at age 12-13. In contrast, among children at risk of experiencing low prosocial skills, the peak utilisation rate of psychologist services occurred at age 12-13. Among children at elevated risk of conduct problems, the rate of use of psychologists increased until age 8-9 and remained relatively stable following then.
Significant differences were observed between the percentages of children at elevated risk of experiencing emotional symptoms, conduct problems, hyperactivity and peer problems across all ages, compared to those with only average risk levels. Children at elevated risk of experiencing low prosocial skills had accessed psychologists at significantly greater rates at ages 6-7, 8-9 and 12-13.
Figure 16: Use of psychologist services, by psychological adjustment and age


Notes: * Psychologist utilisation corresponding with years of data collection; i.e. 2008/09-2016/17. ** Service attendance during two years prior to each interview. 95% confidence intervals are shown by 'I' bars in each column. Where confidence intervals for the groups being compared do not overlap, this indicates that the values are significantly different. N = 3,693 (age 4-5), 4,060 (age 6-7), 3,881 (age 8-9), 3,539 (age 10-11), 3,281 (age 12-13).
Source: LSAC Waves 3-7, B cohort and MBS data, weighted
Specialists
In general, the use of specialist services typically decreased as children got older (Figure 17). Although a greater percentage of children with elevated risk of experiencing any of the SDQ indicators of poor psychological adjustment more frequently accessed specialists compared to those with average risk, there were few significant differences between the groups. Exceptions included children at elevated risk of experiencing emotional symptoms at age 12-13 (approximately 12% vs 8%, respectively), and children at elevated risk of experiencing hyperactivity at age 6-7 (17% vs 12%, respectively). The relatively low rates of specialist use compared to other service types investigated here, especially GPs, is possibly a reflection of barriers to health care types such as specialists, including cost and navigating complex referral systems.
Figure 17: Use of specialist services, by psychological adjustment and age
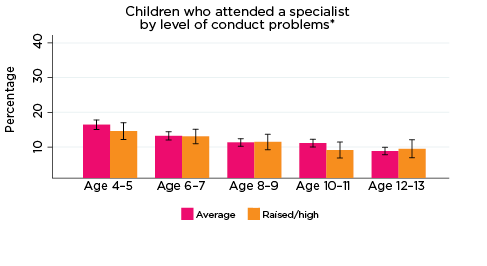


Notes: * Specialist utilisation corresponding with years of data collection; i.e. 2008/09-2016/17. ** Service attendance during two years prior to each interview. 95% confidence intervals are shown by 'I' bars in each column. Where confidence intervals for the groups being compared do not overlap, this indicates that the values are significantly different. N = 3,693 (age 4-5), 4,060 (age 6-7), 3,881 (age 8-9), 3,539 (age 10-11), 3,281 (age 12-13).
Source: LSAC Waves 3-7, B cohort and MBS data, weighted
Summary
Among children with an increased risk of social-emotional problems or poor psychological adjustment, such as emotional symptoms, conduct problems, hyperactivity, peer problems and poor social skills, levels of use of a range of health services were often significantly higher than for children with lower - i.e. 'normative' - risk of adverse social-emotional outcomes. For example, across all age groups and all SDQ subscales, the use of psychiatric and behavioural therapy services was significantly higher among those with elevated risk of problems. Nevertheless, among this group, only around 20% - one in five - had used psychiatric and behavioural therapy services in the previous 12 months.
Although this is likely because, for many children and adolescents in the 'raised or high' risk of problems category, they are not at a stage where they require these types of services, it is possible that some children at risk of adverse social-emotional outcomes are experiencing unmet need. Indeed, the percentage of parents who reported that they had needed health services for their child in the previous 12 months, but were unable to get them, was significantly higher among those whose children had elevated levels of risk of social-emotional problems.
Apart from psychiatric and behavioural therapy services, children at increased risk of social-emotional problems had higher rates of contact with other medical professionals including GPs, paediatricians and speech therapists, as well as hospital emergency and outpatient services. Importantly, this suggests there is an opportunity for such medical professionals to identify children who may be at risk of mental health problems at an early stage and to provide parents with advice or referrals to practitioners and services that may prevent these issues from becoming more serious.
Regarding MBS data, the utilisation rates of three distinct service types were consistently - and significantly - higher among children at risk of experiencing poor psychological adjustment or social-emotional issues: paediatricians, GPs specifically for mental health concerns, and psychologists. Although usage rates over time differed for these services (e.g. use of paediatricians tended to peak among 'at risk' children around the age of 8-9 years, whereas rates of accessing GPs for mental health concerns gradually increased among this group as children got older, likely due to the 'appropriateness' or applicability of service types as children mature), these findings provide a strong indication of the impact of experiencing psychological adjustment issues on children, their families and service providers.
In contrast to the above findings, there were minimal differences between children experiencing elevated risk of social-emotional problems and other children across all age groups in relation to accessing specialists and GPs for less than 20 minutes. The latter finding is possibly a result of the high utilisation rate of GP services for less than 20 minutes among study children in general - it was the most commonly and frequently accessed service type by far (see Appendix C for more detailed findings regarding frequency of MBS service use by risk of social-emotional outcomes).
Multivariate analysis - Children's use of health services
While the previous section demonstrated that children who are at increased risk of social-emotional issues are often more likely to use a range of health services, it should be noted that these relationships are not 'causal'. It may be the case that some children with raised levels of social-emotional problems may also be experiencing other health problems that require use of these health services. For some children with ongoing health conditions or disabilities, these conditions may themselves lead to lower levels of social-emotional wellbeing. This is likely to be the case for peer problems in particular. For example, if a child is being bullied due to physical limitations or appearance, this can lead to social-emotional issues.
Table 6 details the findings of multivariate analyses investigating associations with service use and controlling for characteristics of the child and their family that have been shown to be related to health service use (e.g. the child's physical health). Overall, findings indicated that children with increased risk of social-emotional problems had significantly higher odds of service use in the past 12 months.8
| Odds ratio | |||||||||
|---|---|---|---|---|---|---|---|---|---|
| Paediatrician | General practitioner | Psychiatric services | Other specialist | Hospital emergency | Guidance counsellor | Hospital outpatient | Speech therapy | Dental | |
| Emotional symptoms | 1.51*** | 1.37*** | 3.29*** | 0.92 | 1.08 | 2.65*** | 1.14 | 1.20 | 1.03 |
| Hyperactivity | 2.81*** | 1.08 | 2.03*** | 1.24** | 1.16* | 1.77*** | 1.15 | 2.13*** | 1.01 |
| Conduct problems | 1.08 | 0.92 | 1.72*** | 0.88 | 1.11 | 1.68*** | 0.98 | 0.88 | 0.97 |
| Peer problems | 1.88*** | 1.02 | 2.02*** | 1.07 | 1.05 | 1.51*** | 1.09 | 1.49*** | 0.80*** |
| Low prosocial skills | 1.19 | 0.96 | 1.55*** | 1.24* | 0.96 | 0.84 | 1.02 | 1.17 | 0.93 |
| Age group (ref. = Age 4-5) | |||||||||
| Age 6-7 | 1.00 | 0.71*** | 2.00*** | 1.10 | 0.66*** | 3.33*** | 0.91 | 0.54*** | 3.03*** |
| Age 8-9 | 0.78* | 0.48*** | 2.40*** | 1.15 | 0.73*** | 4.10*** | 0.87 | 0.21*** | 4.03*** |
| Age 10-11 | 0.74* | 0.40*** | 2.90*** | 1.19* | 0.77*** | 4.87*** | 0.96 | 0.11*** | 4.71*** |
| Age 12-13 | 0.48*** | 0.41*** | 3.18*** | 1.39*** | 0.84* | 5.71*** | 1.08 | 0.05*** | 5.09*** |
| Boys | 1.36** | 0.93 | 1.30** | 0.96 | 1.16** | 1.04 | 1.10 | 2.29*** | 0.84*** |
| Aboriginal and Torres Strait Islander | 1.60 | 0.94 | 0.53 | 1.08 | 0.68* | 0.65 | 1.03 | 0.80 | 0.79 |
| LOTE | 0.84 | 0.93 | 0.45*** | 0.78* | 0.77* | 0.55** | 0.68* | 0.50** | 0.80* |
| Birth order (ref. = Oldest child) | |||||||||
| Middle child/Twin | 0.76* | 0.68*** | 0.70** | 0.97 | 1.02 | 0.86 | 1.04 | 1.32 | 1.00 |
| Youngest child | 0.74** | 0.74*** | 0.71** | 0.91 | 0.98 | 0.89 | 1.01 | 1.34* | 1.04 |
| Only child | 0.79 | 1.17 | 0.92 | 0.83 | 1.11 | 0.74 | 1.14 | 0.93 | 0.89 |
| Region of residence (ref. = Major city) | |||||||||
| Inner regional | 1.14 | 0.67*** | 1.11 | 0.95 | 1.20** | 1.18 | 0.85 | 0.84 | 0.91 |
| Outer regional or remote | 0.74 | 0.57*** | 0.69* | 0.81* | 1.22* | 0.96 | 1.18 | 0.61** | 1.07 |
| Neighbourhood advantage (ref. = Lowest 25%) | |||||||||
| Middle 50% | 0.93 | 1.13* | 1.32* | 1.16 | 0.91 | 1.04 | 1.00 | 0.89 | 1.07 |
| Top 25% | 0.88 | 1.17 | 1.26 | 1.06 | 0.87 | 1.19 | 0.79 | 0.91 | 1.28*** |
| Parents' education (ref. = Year 12 or below) | |||||||||
| Certificate or diploma | 1.57** | 1.27** | 1.41 | 1.07 | 1.08 | 0.84 | 1.41* | 0.99 | 1.05 |
| Degree | 1.60** | 1.16 | 1.49* | 1.27* | 1.00 | 0.84 | 1.18 | 1.04 | 1.16 |
| Private health insurance | 1.14 | 1.27*** | 1.15 | 1.43*** | 0.98 | 1.15 | 0.88 | 1.21 | 1.61*** |
| Study child in fair or poor health | 2.20*** | 1.50* | 1.10 | 2.20*** | 2.14*** | 0.41 | 2.70*** | 1.79* | 1.14 |
| Special health care needs | 11.73*** | 3.22*** | 4.84*** | 3.05*** | 1.67*** | 2.27*** | 3.50*** | 4.16*** | 1.05 |
| Parental income (ref. = Lowest 25%) | |||||||||
| 2nd | 1.17 | 1.13 | 1.08 | 1.09 | 1.03 | 0.63** | 0.94 | 1.40* | 1.01 |
| 3rd | 1.20 | 1.29** | 1.14 | 1.10 | 1.12 | 0.76 | 0.90 | 1.22 | 1.18* |
| 4th (Top 25%) | 1.42* | 1.18* | 1.27 | 1.28* | 1.22* | 0.80 | 1.02 | 1.08 | 1.21* |
| Income support | 1.18 | 1.02 | 0.98 | 1.18 | 1.00 | 0.85 | 0.90 | 1.65* | 0.97 |
| Mother poor mental health | 1.11 | 1.24** | 1.10 | 1.09 | 1.23** | 1.56*** | 1.16 | 1.08 | 0.96 |
| Father poor mental health | 1.03 | 0.93 | 1.51* | 0.71* | 0.98 | 0.93 | 1.27 | 0.94 | 0.88 |
| Mother poor physical health | 1.32* | 1.09 | 1.01 | 1.07 | 1.10 | 1.09 | 0.99 | 1.29 | 0.90 |
| Father poor physical health | 0.92 | 1.02 | 0.89 | 1.03 | 1.16 | 1.05 | 0.91 | 0.91 | 1.11 |
| Single-parent household | 1.07 | 0.94 | 1.83*** | 1.02 | 1.07 | 2.61*** | 1.13 | 0.74 | 1.09 |
| Household member with a health condition or disability | 1.34* | 1.42*** | 1.28 | 1.17 | 1.14 | 1.27 | 1.15 | 1.10 | 1.10 |
Notes: Random effects logistic regression models, ORs reported. * p < 0.05, ** p < 0.01, *** p < 0.001. LOTE = Language other than English. Data pooled across five waves, N = 18,093.
Source: LSAC Waves 3-7, B cohort
After controlling for a range of socio-demographic characteristics, the odds of having used psychiatric or behavioural therapy services were significantly higher among those with elevated levels of risk on all five subscales of the SDQ. Compared to those with normative levels on the SDQ subscale, the odds of using psychiatric and behavioural services:
- more than tripled for children with elevated risk of emotional symptoms
- doubled for those with elevated risk of hyperactivity or peer problems
- were 1.7 times higher for those with elevated risk of conduct problems
- were 1.5 times higher among children with lower prosocial skills.
For other services, there were increased odds of service use among children with elevated levels on some, but not all, of the SDQ subscales.
- Compared to children with normative levels of emotional symptoms, for those with elevated levels:
- The odds of having seen a paediatrician in the previous 12 months were 1.5 times higher.
- The odds of having been to a GP in the previous 12 months were 1.4 times higher.
- The odds of having used guidance counsellor services were almost tripled (OR = 2.7).
- Compared to children with lower scores on the conduct problems scale, for those with elevated levels of risk of conduct problems, the odds of having used guidance counselling services were 1.7 times higher.
- Compared to children with lower scores on the hyperactivity scale, for those with elevated levels of hyperactivity:
- The odds of having seen a paediatrician in the previous 12 months were almost tripled (OR = 2.8).
- The odds of having seen a speech therapist were more than doubled (OR = 2.1).
- The odds of having used guidance counselling services were almost doubled (OR = 1.8).
- The odds of using other specialists were increased by 24 percentage points.
- The odds of having been to hospital emergency were 16 percentage points higher.
- Compared to children with lower scores on the peer problems scale, for those with elevated levels of peer problems:
- The odds of having been to a paediatrician in the previous 12 months were almost doubled (OR = 1.9).
- The odds of using speech therapy were 1.5 times higher (OR = 1.5).
- However, the odds of having been to a dentist were reduced by 20 percentage points (OR = 0.8).
Although the use of health services depends primarily on the child's specific health needs, other factors that may influence whether or not a child uses the services include: the cost of services, access to services, waiting times, parents' awareness of the services available for their children, and their ability to navigate the referral system for specialist services. Considering this, the following characteristics of the study child and their parents were found to be related to their use of specific health services (Appendix B):
Differences in children's health service use by age
Use of GP, paediatrician, hospital emergency and speech therapy services decreased with the age of the study child. For example, compared to children aged 4-5:
- The odds of having used GP services were reduced by 60 percentage points for 10-11 and 12-13 year olds.
- The odds of having used a paediatrician were reduced by over 20 percentage points for 8-9 and 10-11 year olds, and halved (reduced by over 50 percentage points) for 12-13 year olds.
- The odds of having been to hospital emergency were reduced by 34 percentage points for 6-7 year olds, and by 16% points for 12-13 year olds.
- The odds of using speech therapy were almost halved (reduced by 45 percentage points) for 6-7 year olds, reduced by 80 percentage points for 8-9 year olds, and reduced by 95 percentage points for 12-13 year olds.
On the other hand, the odds of using some services increased with the age of the study child. Compared to 4-5 year olds:
- The odds of using psychiatric or behavioural therapy services were more than doubled for 6-7, 8-9 and 10-11 year olds, and more than tripled for 12-13 year olds.
- The odds of using other specialist services were increased by almost 40 percentage points for 12-13 year olds (not significant differences for other age groups).
- The odds of having been to a dentist in the previous 12 months were tripled for 6-7 year olds, and five times higher for 12-13 year olds.
Characteristics of the study child
After controlling for a range of socio-demographic characteristics, children whose parents reported them to be in 'fair or poor' health had higher odds of using a range of health services. For example, compared to children whose parents said they were in 'good, very good or excellent' health, the odds of having been to a GP, other specialist, and hospital emergency were more than doubled among children whose parents said they were in 'fair or poor' health, and the odds of having been to hospital outpatient services were almost tripled (OR = 2.7). Similarly, compared to other children, those who were reported to have special health care needs had increased odds of using all health care services apart from dental services, with odds ranging from 1.7 times higher for hospital emergency, to almost 12 times higher for GP services. Other characteristics, including gender, birth order and whether the study child spoke a LOTE at home, were also related to health service use. For example:
- Compared to girls, the odds of having been to a paediatrician, hospital emergency and psychiatric or behavioural therapy were significantly higher for boys (OR = 1.4, 1.2 and 1.3, respectively), the odds of having been to a speech therapist were more than doubled (OR = 2.3), while the odds of having been to a dentist were significantly lower (OR = 0.84).9
- For children with Indigenous backgrounds, the odds of having been to a hospital emergency department were reduced by 32 percentage points, compared to those for non-Indigenous children. However, for other health services, there were no significant differences according to Aboriginal and Torres Strait Islander status.
- With the exception of GPs and paediatricians, the odds of having had an appointment with a medical practitioner were significantly lower for children who spoke a LOTE at home, compared to those who only spoke English. For example, compared to children who spoke only English at home, the odds of seeing a speech therapist were halved for those who spoke a LOTE, and the odds of having used psychiatric or behavioural therapy services were more than halved (OR = 0.45). This may be due to barriers including a lack of information about medical services available or other difficulties negotiating the health care system among parents from non-English speaking backgrounds.
- While there were no significant differences in service use by first-born and only children, the odds of having seen a GP or paediatrician, or used psychiatric or behavioural therapy services, were reduced by 25-30 percentage points for middle and youngest children (compared to first-born children). These differences in service use may be a result of parents being more anxious about the health of their first-born child, and therefore consulting GPs and other health professionals quite frequently. With second and subsequent children, parents are likely to be more experienced in terms of common childhood health issues, and may be less likely to consult with health professionals about minor health concerns such as coughs and colds, cuts and scrapes.
- On the other hand, compared to first-born children, the odds of having used speech therapy services were increased by 30 percentage points for children who were the youngest child in the family.
- Compared to children who were living with two parents, the odds of having used psychiatric or behavioural therapy services in the previous 12 months were almost doubled for children in single-parent households (OR = 1.83). However, for other health services, there was no significant difference in service use among children in single-parent households, compared to those in two-parent households.
Differences by socio-economic status
For some health services, such as paediatricians, there are likely to be either considerable out-of-pocket expenses or considerable waiting periods. Compared to children in households in the lowest 25% of equivalised parental income:
- The odds of having seen a paediatrician in the past 12 months were 1.4 times higher among children in households comprising the top quarter of the parental income distribution.
- The odds of having seen a GP in the past 12 months were 1.2 to 1.3 times higher among children in households in the top half of the parental income distribution.
- The odds of having used other specialist services or hospital emergency were significantly higher.
- Speech therapy was 1.4 times higher among those in the second quartile of the parental income distribution (25th to 50th percentage), and also significantly higher in children in families whose main source of income was a government pension (OR = 1.65).
There were significant differences in the odds of having used health services depending on whether the child's family had private hospital insurance coverage. Compared to those whose families did not have private hospital coverage, for children with private hospital insurance, the odds of having seen a GP were 1.3 times higher, the odds of having used other specialist services were 1.4 times higher, and the odds of having been to a dentist were 1.6 times higher.
When thinking about these results, it is important to keep in mind that private hospital insurance coverage is much more common for children in higher income households, with 73% of children in the households in the highest quartile of equivalised household income covered by private hospital insurance, compared to 23% in the lowest quartile. This suggests that, among families who choose to purchase private health insurance, there is a higher overall level of use of health services.
There were also some differences in the odds of service use depending on the level of advantage or disadvantage of the neighbourhood that the children lived in. Compared to those who lived in neighbourhoods with SEIFA scores in the lowest 25% of the distribution, the odds of having seen a GP were increased by 13 percentage points and the odds of having used psychiatric or behavioural therapy services were increased by 32 percentage points for children living in neighbourhoods in the middle 50% of the SEIFA distribution; and the odds of having been to a dentist were 28 percentage points higher for those living in the most advantaged neighbourhoods (top 25% of the SEIFA scale).
Parents' education is also a significant factor associated with children's use of health services. Compared to children whose parents did not have a post-school qualification:
- The odds of having seen a paediatrician in the previous 12 months were 1.6 times higher among children with at least one parent with a post-school qualification.
- The odds of having been to a GP were 1.3 times higher for those with at least one parent with a certificate or diploma level qualification.
- The odds of having been to hospital emergency were 1.4 times higher among those with at least one parent with a post-school qualification.
- The odds of using psychiatric or behavioural therapy services were approximately 1.5 times higher for children with at least one parent with a degree qualification.
Access to health services - differences by region of residence
People living in remote areas of Australia may need to travel long distances to attend health services or receive specialised treatment. Data from the 2014-15 National Health Survey indicate that people living in inner, outer regional or remote areas of Australia were less likely than those in major cities to have visited a GP or dentist in the last 12 months (ABS, 2017). Estimates using the LSAC data show differences in children's use of health services depending on whether the child lived in a major city or a regional or remote area. While there were no significant differences in the odds of having seen a paediatrician, used hospital outpatient services or been to a dentist, compared to children living in a major city:
- The odds of having seen a GP were 33 percentage points lower for children who lived in an inner regional area, and 43 percentage points lower for those in outer regional or remote areas.
- For children living in inner regional, outer regional or remote areas, the odds of having been to Hospital Emergency were 1.2 times higher. This may be a result of families in regional areas using hospital services as a substitute for GP visits. This finding is consistent with estimates of emergency hospital admissions, by remoteness, for the general population, which show that in 2013-14, the rate for emergency hospital admissions involving surgery was highest for people living in very remote areas (22 per 1,000 population) and fell with decreasing remoteness to be lowest among people living in major cities (12 per 1,000). A 2015 study by the National Health Performance Authority (2015) has shown connections between the lack of access to GPs and the number of people visiting emergency departments, particularly in rural areas, where there is less distinction drawn between going to see your GP if you have an acute problem and going to the hospital, where you might be seen by a GP anyway.
- For children living in outer regional or remote areas, the odds of having used psychiatric or behavioural therapy services, other specialist services and speech therapy services were significantly lower, with ORs of 0.69, 0.81 and 0.61, respectively. This suggests that access to some specialist services in regional and remote areas may be a problem for some families.
Differences in children's service use, by parents' physical and mental health
Parents' physical and mental health, and the health of other household members, may be associated with children's use of health services. In some families, these conditions may be an obstacle to seeking out and using services (e.g. if a parent's physical health issues affect their mobility). In other cases, if other family members are attending appointments with health service providers, it may increase the likelihood of a child using these services (e.g. if a parent makes an GP appointment for more than one family member on the same day). After controlling for a range of other factors:
- Compared to other children, the odds of having been to a paediatrician are 1.3 times higher; and the odds of having seen a GP are 1.4 times higher, for children with a family member with a long-term health condition or disability.
- Compared to children whose mother was in good health, the odds of having been to a paediatrician were 1.3 times higher for those whose mother was in fair or poor health (no differences depending on father's physical health).
- Children whose mother had raised levels of psychological distress (poor mental health) had higher odds of having been to a GP (OR = 1.2) and also higher odds of having been to hospital emergency (OR = 1.2) than children whose mother had lower levels of psychological distress. On the other hand, children whose father had raised levels of psychological distress were more likely to have used psychiatric or behavioural therapy services (OR = 1.5), but had reduced odds of having used other medical specialists (OR = 0.7).
Children's use of MBS services (LSAC-MBS data linkage)
Table 7 lists the ORs for associations between exposures and use (yes/no) of each MBS service type included in our analyses. After accounting for other socio-demographic and psychosocial factors, being classified as having elevated risk of experiencing emotional symptoms - according to the SDQ - was consistently associated with significantly higher odds of accessing most service types, excluding visits with GPs lasting less than 20 minutes. Indeed, the odds of accessing a psychologist or a GP for mental health-specific reasons were greater than four times higher among children with raised/high emotional symptoms compared to those with average emotional symptoms (ORs = 4.15 and 4.26, respectively; Table 7).
Elevated risk of experiencing emotional symptoms, hyperactivity, and conduct and peer problems was associated with increased odds of accessing psychologists and GPs for mental health-specific reasons. Similarly, elevated risk of emotional symptoms, hyperactivity and peer problems was associated with greater odds of accessing a paediatrician (ORs = 1.38, 2.07 and 1.40, respectively).
Compared to the other indicators of psychosocial adjustment measured by the SDQ and included in our analyses, elevated risk of experiencing low prosocial skills was not significantly associated with the use of any MBS service types. Low prosocial skills were independently associated with reduced odds of accessing a GP after hours (OR = 0.82) and a GP for less than 20 minutes (OR = 0.77).
Regarding trends associated with age and MBS service use:
- The odds of accessing a GP for less than 20 minutes, a GP after hours, a paediatrician and specialist were generally decreasing-stable as age increased.
- Conversely, the odds of accessing a GP for 20 minutes or more, a GP for mental health-specific reasons, and a psychologist generally increased with rising age.
| OR | |||||||
|---|---|---|---|---|---|---|---|
| GP <20 mins. | GP ≥20 mins. | GP: After hours | GP: Mental health-specific | Paediatrician | Specialist | Psychologist | |
| Emotional symptoms | 1.17 | 1.23** | 1.25** | 4.26*** | 1.38*** | 1.27** | 4.15*** |
| Hyperactivity | 1.14 | 1.08 | 0.97 | 1.72*** | 2.07*** | 1.05 | 1.67*** |
| Conduct problems | 1.08 | 1.07 | 1.08 | 1.73*** | 1.15 | 0.99 | 1.75*** |
| Peer problems | 1.12 | 0.99 | 1.11 | 1.41** | 1.40*** | 0.99 | 1.62*** |
| Low prosocial skills | 0.77* | 1.00 | 0.82* | 1.07 | 1.18 | 1.04 | 1.17 |
| Age group (ref. = Age 4-5) | |||||||
| Age 6-7 | 0.54*** | 0.54*** | 0.77*** | 4.68*** | 0.77** | 1.00 | 5.36*** |
| Age 8-9 | 0.37*** | 0.59*** | 0.66*** | 10.78*** | 0.83* | 0.72*** | 10.46*** |
| Age 10-11 | 0.27*** | 0.81** | 0.54*** | 16.25*** | 0.72** | 0.60*** | 17.51*** |
| Age 12-13 | 0.25*** | 1.17* | 0.56*** | 20.74*** | 0.65*** | 0.65*** | 18.73*** |
| Boys | 0.95 | 1.01 | 1.07 | 1.09 | 1.25** | 1.11 | 1.31* |
| Aboriginal and Torres Strait Islander | 1.01 | 1.47* | 0.91 | 0.63 | 0.82 | 0.91 | 0.55 |
| LOTE | 1.57** | 1.25* | 2.39*** | 0.50** | 1.14 | 1.17 | 0.63* |
| Birth order (ref. = Oldest) | |||||||
| Middle child/Twin | 0.61*** | 0.47*** | 0.79** | 0.72* | 0.75* | 0.94 | 0.66** |
| Youngest | 0.72*** | 0.84** | 0.86* | 0.60*** | 0.78** | 0.77** | 0.55*** |
| Only child | 1.26 | 1.25* | 1.06 | 0.80 | 0.94 | 1.15 | 0.93 |
| Region of residence (ref. = Major city) | |||||||
| Inner regional | 0.75** | 0.91 | 0.31*** | 0.88 | 0.86 | 0.94 | 0.83 |
| Outer regional or remote | 0.59*** | 0.88 | 0.29*** | 0.43*** | 0.65** | 0.55*** | 0.36*** |
| Neighbourhood advantage (ref. = Lowest 25%) | |||||||
| Middle 50% | 1.10 | 1.26** | 1.07 | 1.12 | 1.02 | 1.00 | 1.28 |
| Top 25% | 0.97 | 1.30** | 0.85 | 1.02 | 1.09 | 0.98 | 1.28 |
| Parents' education (ref. = Year 12 or below) | |||||||
| Certificate or diploma | 1.23 | 1.13 | 1.05 | 1.29 | 1.21 | 1.12 | 1.32 |
| Degree | 0.89 | 1.22 | 0.84 | 1.19 | 1.22 | 1.24 | 1.23 |
| Private health insurance | 1.17 | 0.99 | 0.89 | 1.43** | 1.57*** | 1.71*** | 1.53** |
| Study child in fair or poor health | 1.26 | 1.26** | 1.33** | 1.02 | 1.49*** | 1.23* | 1.15 |
| Special health care needs | 2.84*** | 2.47*** | 1.34*** | 3.39*** | 9.38*** | 2.08*** | 3.81*** |
| Parental income (ref. = Lowest 25%) | |||||||
| 2nd | 1.14 | 0.96 | 1.17 | 1.06 | 1.10 | 1.20 | 1.17 |
| 3rd | 1.19 | 1.04 | 1.25* | 0.86 | 1.02 | 1.14 | 0.98 |
| 4th (Top 25%) | 1.11 | 1.02 | 1.17 | 0.71 | 1.12 | 1.22 | 0.87 |
| Income support | 1.03 | 1.05 | 1.06 | 0.95 | 1.37* | 0.94 | 0.82 |
| Mother poor mental health | 1.11 | 1.10 | 0.93 | 1.05 | 1.02 | 1.05 | 1.10 |
| Father poor mental health | 1.06 | 1.19 | 1.25* | 1.67* | 1.13 | 1.31* | 1.32 |
| Mother poor physical health | 1.09 | 1.02 | 0.96 | 1.01 | 1.21 | 1.02 | 0.94 |
| Father poor physical health | 1.17 | 0.90 | 1.11 | 0.64* | 0.86 | 0.86 | 0.84 |
| Single-parent household | 1.05 | 0.95 | 1.03 | 1.64** | 1.02 | 0.92 | 1.68** |
| Household member with a health condition or disability | 0.93 | 1.12 | 1.12 | 1.08 | 1.07 | 0.90 | 1.25 |
| Single-parent household | 1.05 | 0.95 | 1.03 | 1.64** | 1.02 | 0.92 | 1.68** |
| Household member with a health condition or disability | 0.93 | 1.12 | 1.12 | 1.08 | 1.07 | 0.90 | 1.25 |
Notes: ORs from random effects logistic regressions (N = 17,492); ***, ** and * indicate statistical significance at the 0.1, 1 and 5% levels, respectively. LOTE = Language other than English.
Source: LSAC Waves 3 to 7, unweighted and MBS data for 2008-16
There were few significant differences in the odds of MBS service use by gender; being a boy was associated with increased odds of accessing a paediatrician or psychologist. Similarly, self-classifying as Aboriginal and Torres Strait Islander was only significantly associated with increased odds of accessing one service type: a GP for at least 20 minutes.
Overall, only a small number of indicators of greater socio-economic advantage were independently associated with MBS service use:
- Residing in neighbourhoods with greater socio-economic advantage (according to SEIFA classifications) was independently associated with greater odds of accessing a GP for 20 or more minutes.
- Having a parental income in the third-highest tier (of four) was significantly associated with greater odds of accessing a GP after hours.
The multivariate analysis produced findings that could be considered unsurprising; for example, having special health care needs was independently associated with greater odds of accessing all service types. Further, children with older siblings (as per 'birth order') were typically significantly less likely to engage with services. Having private health insurance was independently associated with greater odds of accessing paediatricians, psychologists, other specialists and GPs for mental-health specific purposes.
Residing in a single-parent household was significantly associated with engaging with psychologist services, and also GPs for mental health purposes.
There was some evidence that parental health was associated with service engagement among study children; poor mental health among fathers was independently associated with accessing GPs for mental health purposes, whereas poor maternal physical health was significantly associated with use of paediatricians.
One of the most important findings from the multivariate analyses in Table 7 was the relationship between geographical residential location and service use. Specifically, residing in outer regional or remote areas of Australia was independently associated with lower odds of accessing most service types: a GP for less than 20 minutes, after hours or for mental health-specific reasons, in addition to paediatricians, specialists and psychologists. Research has demonstrated the persistent nature of this issue in Australia, a problem resulting from inadequate availability of - and access to - appropriate services in non-metropolitan areas of the country (Wakerman & Humphreys, 2019).10 It suggests that children residing in such areas of the country are less likely to receive appropriate and adequate professional support when needed. These findings also reflect those of other analyses involving LSAC data outlined above (see 'Difficulties accessing health services' and 'Access to health services - differences by region of residence').
Frequency of MBS service use
Appendix C includes tables detailing the frequency of use of each of the MBS services according to risk of social-emotional problems at each time-point, on a bivariate level. Overall, experiencing elevated risk of emotional symptoms, conduct problems, hyperactivity or peer problems was associated with significantly higher rates of accessing any service at all ages, except for conduct problems at age 4-5. In comparison, elevated risk of low prosocial skills was only associated with a significantly higher rate of any service access at age 12-13. Elevated risk of any adverse social-emotional outcomes was associated with significantly higher rates of engaging with psychologists at every age, in addition to GPs for mental health-specific concerns at all ages except for 6-7 in relation to prosocial skills. The use of paediatricians was also typically higher at all ages and for every social-emotional outcome, except for conduct problems at age 4-5.
Further to the above multivariate findings detailed in Table 7, the results of multivariate analyses exploring associations between the same factors and frequency of MBS service use are listed in Table 8. Overall, there were few differences between the factors identified as predictors of service use (yes/no), and those that influenced frequency of service engagement. Regarding indicators of psychological adjustment (as measured by the SDQ), elevated risk of experiencing emotional symptoms was consistently independently associated with more frequent use of all service types, particularly psychologists and GPs for mental health-specific purposes (both had incidence rate ratios greater than three). Similar to the above, elevated risk of experiencing emotional symptoms, hyperactivity, and conduct and peer problems was associated with more frequent use of paediatricians, psychologists and GPs for mental health-specific reasons.
The aforementioned trends in associations between age group and service use were also reflected in the multivariate findings regarding service use frequency:
- Increasing age was significantly associated with decreasing-stable frequency of engagement with the following services: a GP for less than 20 minutes, a GP after hours, paediatricians and specialists.
- In contrast, increasing age was significantly associated with increasing frequency of use of GPs for 20 minutes or more, GPs for mental health-specific reasons, and psychologists.
Increased frequency of service use by study children was typically associated with fair or poor health and special health care needs. Decreased frequency of service use corresponded with birth order; that is, younger siblings tended to access services less frequently. Having private health insurance was independently associated with more frequent use of GPs for mental health purposes, paediatricians, psychologists and other specialists, but decreased frequency of GPs after hours.
In relation to socio-economic status, residing in neighbourhoods with greater advantage (middle 50% and top 25%) predicted greater frequency of use of GPs for 20 minutes or more. Residing in the middle 50% of neighbourhoods, as per advantage classification, was significantly associated with more frequent use of psychologist services, compared to the lowest 25%.
Residing in a single-parent household was significantly associated with more frequent use of GPs for mental health purposes, and psychologists.
Geographical residential location was also significantly associated with service use frequency; specifically, the more remote study children's residential locations were, the less frequently they engaged with most service types (excluding GPs for 20 minutes or more).
| OR | |||||||
|---|---|---|---|---|---|---|---|
| GP <20 mins | GP >20 mins | GP: After hours | GP: Mental health-specific | Paediatrician | Specialist | Psychologist | |
| Emotional symptoms | 1.10*** | 1.22*** | 1.15** | 3.11*** | 1.24*** | 1.16* | 3.32*** |
| Hyperactivity | 1.02 | 1.10 | 1.03 | 1.40*** | 1.66*** | 1.04 | 1.39*** |
| Conduct problems | 1.00 | 1.00 | 0.97 | 1.52*** | 1.12* | 1.01 | 1.46*** |
| Peer problems | 1.02 | 1.02 | 1.02 | 1.23* | 1.22*** | 1.02 | 1.48*** |
| Low prosocial skills | 0.97 | 1.00 | 0.90* | 1.00 | 1.07 | 1.07 | 1.06 |
| Age group (ref. = Age 4-5) | |||||||
| Age 6-7 | 0.79*** | 0.57*** | 0.85*** | 3.76*** | 0.86* | 0.99 | 4.22*** |
| Age 8-9 | 0.66*** | 0.62*** | 0.74*** | 7.56*** | 0.92 | 0.74*** | 7.27*** |
| Age 10-11 | 0.57*** | 0.82*** | 0.61*** | 10.05*** | 0.86* | 0.61*** | 10.59*** |
| Age 12-13 | 0.56*** | 1.09 | 0.67*** | 12.48*** | 0.80** | 0.69*** | 11.09*** |
| Boys | 0.99 | 1.01 | 1.05 | 1.09 | 1.19** | 1.09 | 1.26** |
| Aboriginal and Torres Strait Islander | 0.98 | 1.35* | 1.05 | 0.71 | 1.01 | 0.96 | 0.68 |
| LOTE | 1.29*** | 1.16 | 1.86*** | 0.58** | 1.11 | 1.18 | 0.71* |
| Birth order (ref. = Oldest) | |||||||
| Middle child/Twin | 0.82*** | 0.80*** | 0.89* | 0.76* | 0.81** | 0.89 | 0.74** |
| Youngest | 0.89*** | 0.88* | 0.90* | 0.67*** | 0.86* | 0.82** | 0.65*** |
| Only child | 1.15*** | 1.18* | 1.02 | 0.84 | 1.00 | 1.06 | 0.95 |
| Region of residence (ref. = Major city) | |||||||
| Inner regional | 0.83*** | 0.93 | 0.41*** | 0.81* | 0.91 | 0.94 | 0.81* |
| Outer regional or remote | 0.79*** | 0.90 | 0.38*** | 0.47*** | 0.74** | 0.59*** | 0.42*** |
| Neighbourhood advantage (ref. = Lowest 25%) | |||||||
| Middle 50% | 0.99 | 1.19** | 1.02 | 1.06 | 1.03 | 0.98 | 1.20* |
| Top 25% | 0.95 | 1.24** | 0.87* | 0.96 | 1.08 | 0.59 | 1.21 |
| Parents' education (ref. = Year 12 or below) | |||||||
| Certificate or diploma | 1.06 | 1.12 | 1.04 | 1.27 | 1.20 | 1.08 | 1.27 |
| Degree | 0.95 | 1.21* | 0.89 | 1.14 | 1.21 | 1.19 | 1.20 |
| Private health insurance | 1.05* | 1.01 | 0.90* | 1.29** | 1.39*** | 1.54*** | 1.38*** |
| Study child in fair or poor health | 1.11*** | 1.16** | 1.15** | 0.99 | 1.23** | 1.18** | 1.04 |
| Special health care needs | 1.39*** | 2.05*** | 1.34*** | 2.64*** | 5.96*** | 1.92*** | 3.09*** |
| Parental income (ref. = Lowest 25%) | |||||||
| 2nd | 1.03 | 0.97 | 1.08 | 1.05 | 1.06 | 1.15 | 1.15 |
| 3rd | 1.03 | 1.02 | 1.18** | 0.86 | 0.93 | 1.12 | 1.02 |
| 4th (Top 25%) | 1.05 | 0.99 | 1.12 | 0.75* | 1.02 | 1.15 | 0.89 |
| Income support | 1.04 | 1.06 | 1.09 | 0.98 | 1.38** | 0.87 | 0.94 |
| Mother poor mental health | 1.03 | 1.12 | 0.99 | 1.07 | 1.10 | 1.13 | 1.05 |
| Father poor mental health | 1.04 | 1.12 | 1.13 | 1.45* | 1.07 | 1.11 | 1.13 |
| Mother poor physical health | 1.02 | 1.03 | 0.95 | 1.06 | 1.21* | 0.94 | 0.89 |
| Father poor physical health | 1.00 | 0.93 | 1.11 | 0.64* | 0.89 | 0.90 | 0.89 |
| Single-parent household | 0.98 | 0.95 | 1.03 | 1.31* | 0.95 | 0.96 | 1.37* |
| Household member with a health condition or disability | 1.01 | 1.02 | 1.09 | 1.15 | 0.99 | 0.94 | 1.18 |
Notes: Coefficients from random effects negative binomial regressions (N = 4,272; 17,492 observations); ***, ** and * indicate statistical significance at the 0.1, 1 and 5% levels respectively. LOTE = Language other than English.
Source: LSAC Waves 3 to 7, unweighted and MBS data for 2008-16
Use of counselling and mental health support services at the family level
Parenting education
The percentages of parents who reported that they, or someone in their family, had used parenting education services in the previous 12 months were significantly higher among those whose children had elevated levels of:
- conduct problems at ages 8-9 and 10-11. Among children in these two age groups, 7% of those with elevated levels of conduct problems had parents who reported that their family had used parenting education services in the past 12 months, compared to 3-4% for other children aged 8-9 and 10-11 (Figure 18).
- hyperactivity across all age groups. Among parents of children with elevated levels of hyperactivity, the percentage who reported using parenting education services ranged from 7%, when children were aged 8-9, 10-11 and 12-13, to 16%, when children were aged 4-5. Among parents of children with lower levels of hyperactivity, the percentage who reported using parenting education services ranged from 3% when their children were aged 12-13 to 7% when their children were aged 4-5.
- peer problems at ages 8-9 and 12-13. Among children in these two age groups, 6% of those with elevated levels of peer problems had parents who reported that their family had used parenting education services in the past 12 months, compared to 3% for other children aged 8-9 and 10-11.
Figure 18: Family-level use of parenting education, by social-emotional outcomes of the study child
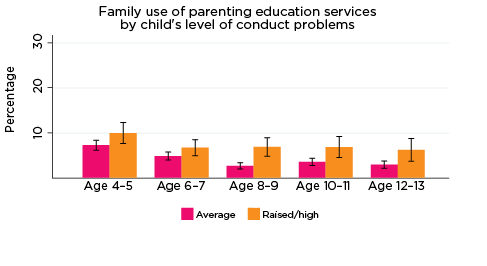

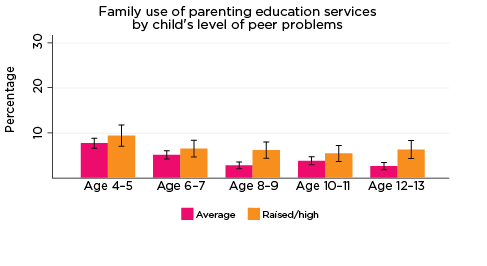
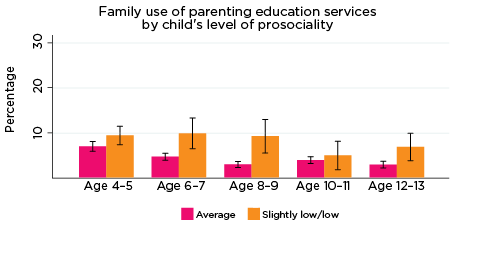
Notes: Use of the service in the last 12 months. 95% confidence intervals are shown by 'I' bars in each column. Where confidence intervals for the groups being compared do not overlap, this indicates that the values are significantly different. N = 3,823 (age 4-5), 4,206 (age 6-7), 3,998 (age 8-9), 3,656 (age 10-11), 3,271 (age 12-13).
Source: LSAC Waves 3-7, B cohort, weighted
Additionally, at ages 6-7, 8-9 and 12-13, the percentage of parents who reported using parenting education services in the previous 12 months was significantly higher among those whose children had lower levels of prosocial behaviour (7-10%) compared to those whose children had higher levels of prosocial behaviour (4-5%).
Across all age groups, there were no significant differences in the percentages of parents who used parenting education services, according to their children's levels of emotional symptoms.
Relationship counselling
The percentages of parents who reported that they, or someone in their family, had used relationship counselling services in the previous 12 months were significantly higher among those whose children had elevated levels of:
- emotional symptoms at ages 4-5 and 10-11. Among children in these two age groups, 8% of those with elevated levels of conduct problems had parents who reported that their family had used relationship counselling services in the past 12 months, compared to 5% and 3%, respectively, for other children aged 4-5 and 10-11 (Figure 19).
- conduct problems, at age 6-7 only. Among children aged 6-7, 7% of those with elevated levels of conduct problems had parents who reported that their family had used relationship counselling services in the past 12 months, compared to 4% for other children aged 6-7.
- hyperactivity at ages 8-9 and 12-13. Among parents of children with elevated levels of hyperactivity at ages 8-9 and 12-13, the percentage who reported using relationship counselling services were 4% and 6%, respectively, compared to 2% and 3% for children with lower levels of hyperactivity.
- At age 8-9 only, the percentage of parents who reported using relationship counselling services in the previous 12 months was significantly higher among those whose children had lower levels of prosocial behaviour (8% compared to 5% for those whose children had higher levels of prosocial behaviour).
Figure 19: Family-level use of relationship counselling, by social-emotional outcomes of the study child

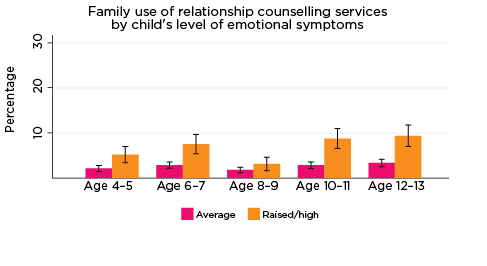
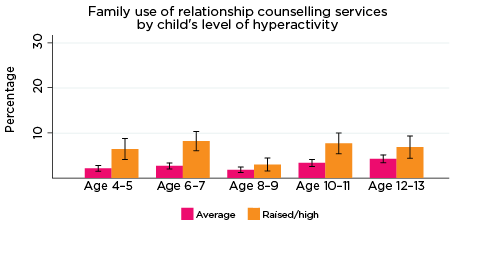
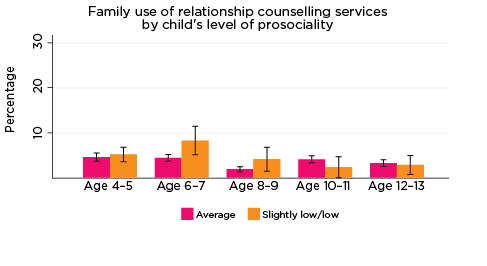
Notes: Use of the service in the last 12 months. 95% confidence intervals are shown by 'I' bars in each column. Where confidence intervals for the groups being compared do not overlap, this indicates that the values are significantly different. N = 3,823 (age 4-5), 4,206 (age 6-7), 3,998 (age 8-9), 3,656 (age 10-11), 3,271 (age 12-13).
Source: LSAC Waves 3-7, B cohort, weighted
Across all age groups, there were no significant differences in the percentage of parents who used relationship counselling services, according to their children's levels of peer problems.
Adult mental health services
The percentages of parents who reported that they, or someone in their family, had used adult mental health services in the previous 12 months was significantly higher among those whose children had elevated levels of:
- emotional symptoms at all ages except 8-9. At age 4-5, 6% of those with elevated levels of conduct problems had parents who reported that their family had used adult mental health services in the past 12 months, compared to 3% for other 4-5 year olds. At age 10-11, 10% of those with elevated levels of conduct problems had parents who reported that their family had used adult mental health services in the past 12 months, compared to 4% for other 10-11 year olds (Figure 20).
- conduct problems at ages 6-7 and 10-11. Among children in these age groups, 6-7% of those with elevated levels of conduct problems had parents who reported that their family had used adult mental health services in the past 12 months, compared to 3-4% for other children aged 6-7.
- hyperactivity at ages 4-5, 6-7 and 10-11. Among parents of children with elevated levels of hyperactivity in these age groups, the percentage who reported using adult mental health services was 7-8%, compared to 3-4% for parents of children with lower levels of hyperactivity.
- peer problems at ages 6-7 and 10-11. Among parents of children with elevated levels of peer problems at ages 6-7 and 10-11, the percentage who reported using adult mental health services were 7%, compared to 4% for parents of children with lower levels of peer problems.
At ages 6-7 and 10-11, the percentages of parents who reported using adult mental health services in the previous 12 months were significantly higher among those whose children had lower levels of prosocial behaviour (8-10% compared to 4% for those whose children had higher levels of prosocial behaviour).
Figure 20: Family-level use of adult mental health services, by social-emotional outcomes of the study child
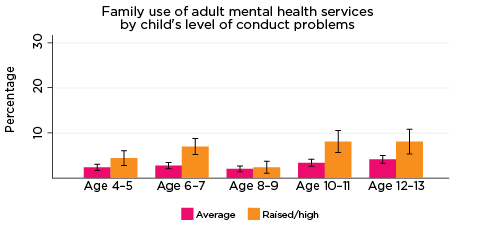

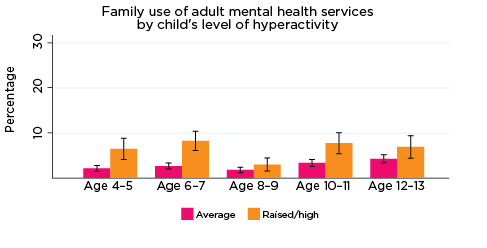
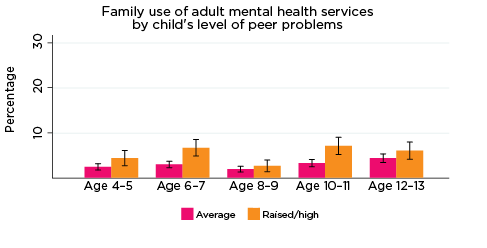

Notes: Use of the service in the last 12 months. 95% confidence intervals are shown by 'I' bars in each column. Where confidence intervals for the groups being compared do not overlap, this indicates that the values are significantly different. N = 3,823 (age 4-5), 4,206 (age 6-7), 3,998 (age 8-9), 3,656 (age 10-11), 3,271 (age 12-13).
Source: LSAC Waves 3-7, B cohort, weighted
Other counselling services
The percentages of parents who reported that they, or someone in their family, had used other counselling services in the previous 12 months were significantly higher among those whose children had elevated levels of:
- emotional symptoms at ages 6-7, 10-11 and 12-13. Among children in these age groups, around 20% of those with elevated levels of conduct problems had parents who reported that their family had used other counselling services in the past 12 months, compared to approximately 10% for other children in these age groups (Figure 21).
- conduct problems, at ages 6-7 and 10-11. Among children in these age groups, 14% of 6-7 year olds and 18% of 10-11 year olds with elevated levels of conduct problems had parents who reported that their family had used other counselling services in the past 12 months, compared to 10% for other children aged 6-7.
- hyperactivity at age 10-11 only. Among parents of children with elevated levels of hyperactivity at age 10-11, the percentage who reported using other counselling services was 17%, compared to 11% for parents of children with lower levels of hyperactivity.
- peer problems at ages 6-7 and 10-11. Among parents of children with elevated levels of peer problems at ages 6-7 and 10-11, the percentage who reported using other counselling services was 14-15%, compared to 10-11% for parents of children with lower levels of peer problems.
Across all age groups, there were no significant differences in the percentage of parents who used other counselling services, according to their children's levels of prosocial behaviour.
Figure 21: Family-level use of other counselling services, by social-emotional outcomes of the study child
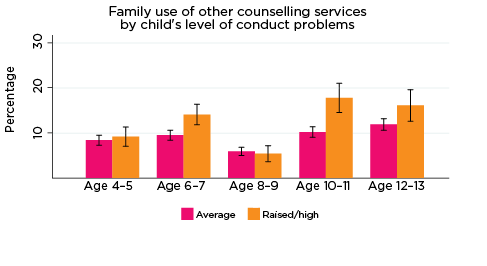
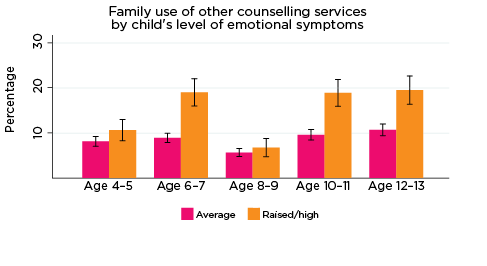
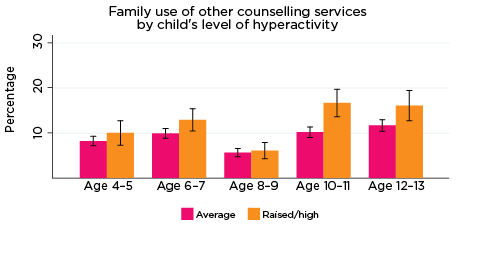
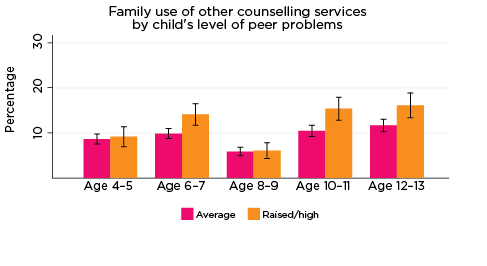
Notes: Use of the service in the last 12 months. 95% confidence intervals are shown by 'I' bars in each column. Where confidence intervals for the groups being compared do not overlap, this indicates that the values are significantly different. N = 3,823 (age 4-5), 4,206 (age 6-7), 3,998 (age 8-9), 3,656 (age 10-11), 3,271 (age 12-13).
Source: LSAC Waves 3-7, B cohort, weighted
Family support groups
The percentages of parents who reported that they, or someone in their family, had used a family support group in the previous 12 months were significantly higher among those whose children had elevated levels of social-emotional difficulties, particularly at age 6-7 (Figure 22). At this age, the percentage of parents of children with elevated levels of symptoms on any of the five SDQ subscales who used family support groups was around 4-5%, compared to 2% for other families with children aged 6-7 years.
The only other significant result was at age 10-11, where a higher percentage of parents of children with elevated levels of emotional symptoms reported using family support groups (3% compared to 1% for other families with 10-11 year olds).
Figure 22: Family-level use of family support groups, by social-emotional outcomes of the study child
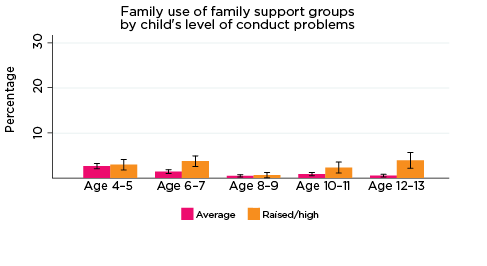
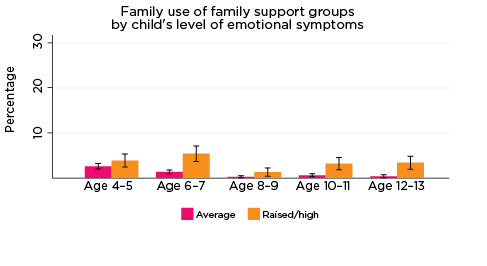
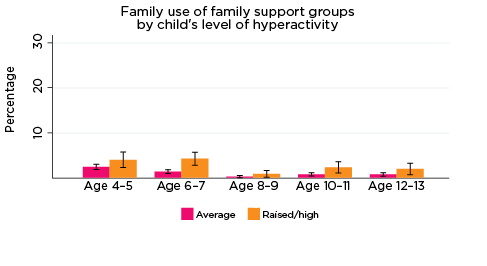
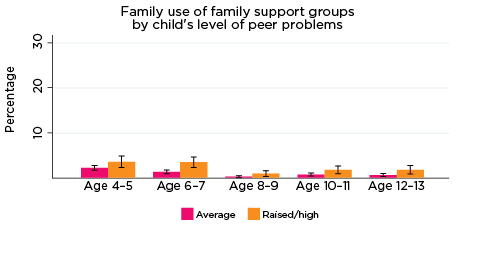

Notes: ^ Estimate for 'slightly low/low' not reliable N = 23. Use of service in the last 12 months. 95% confidence intervals are shown by 'I' bars in each column. Where confidence intervals for the groups being compared do not overlap, this indicates that the values are significantly different. N = 3,823 (age 4-5), 4,206 (age 6-7), 3,998 (age 8-9), 3,656 (age 10-11), 3,271 (age 12-13).
Source: LSAC Waves 3-7, B cohort, weighted
Phone or internet help services
The percentages of parents who reported that they, or someone in their family, had used phone or internet help services in the previous 12 months were significantly higher among those whose children had elevated levels of:
- emotional symptoms at ages 6-7 and 10-11. Among children in these age groups, 7-8% of those with elevated levels of emotional symptoms had parents who reported that their family had used phone or internet help services in the past 12 months, compared to 2-4% for other children in these age groups (Figure 23).
- conduct problems, at age 8-9 only. Among children aged 8-9, 4% of those with elevated levels of conduct problems had parents who reported that their family had used phone or internet help services in the past 12 months, compared to 2% for other children aged 8-9.
Figure 23: Family-level use of phone or internet help services, by social-emotional outcomes of the study child
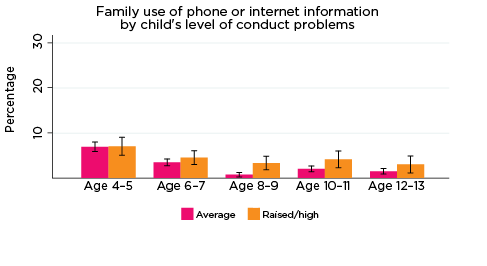

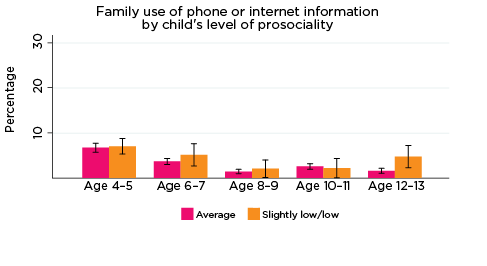
Notes: Use of service in the last 12 months. 95% confidence intervals are shown by 'I' bars in each column. Where confidence intervals for the groups being compared do not overlap, this indicates that the values are significantly different. N = 3,823 (age 4-5), 4,206 (age 6-7), 3,998 (age 8-9), 3,656 (age 10-11), 3,271 (age 12-13).
Source: LSAC Waves 3-7, B cohort, weighted
At age 12-13 only, the percentage of parents who reported using phone or internet help services in the previous 12 months was significantly higher among those whose children had lower levels of prosocial behaviour (5% compared to 2% for those whose children had higher levels of prosocial behaviour).
Across all age groups, there were no significant differences in the percentage of parents who used phone or internet help services, according to their children's levels of hyperactivity or peer problems.
Disability services
The percentages of parents who reported that they, or someone in their family, had used disability services in the previous 12 months were significantly higher among those whose children had elevated levels of:
- emotional symptoms at ages 6-7, 8-9, 10-11 and 12-13. Among children in these age groups, 3-5% of those with elevated levels of conduct problems had parents who reported that their family had used disability services in the past 12 months, compared to 1-2% for other children in these age groups (Figure 24).
- conduct problems or peer problems at ages 6-7, 8-9, 10-11 and 12-13. Among children in these age groups, 3-4% of 6-7, 8-9 and 10-11 year olds and 8% of 12-13 year olds with elevated levels of conduct problems or peer problems had parents who reported that their family had used disability services in the past 12 months, compared to 1-2% for other children in these age groups.
- hyperactivity at ages 4-5, 6-7 and 8-9. Among parents of children with elevated levels of hyperactivity in these three age groups, the percentage who reported using disability services was 3-5%, compared to 1-2% for parents of children with lower levels of hyperactivity.
At age 4-5 only, the percentage of parents who reported using disability services in the previous 12 months was significantly higher among those whose children had lower levels of prosocial behaviour (54% compared to 2% for those whose children had higher levels of prosocial behaviour).
Figure 24: Family-level use of disability services, by social-emotional outcomes of the study child
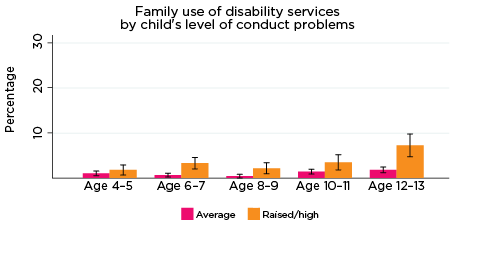
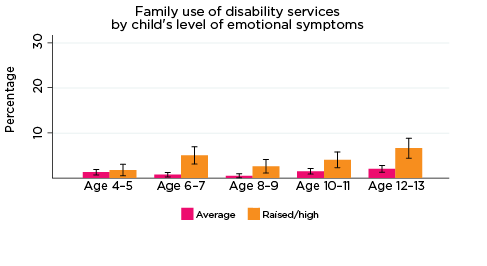
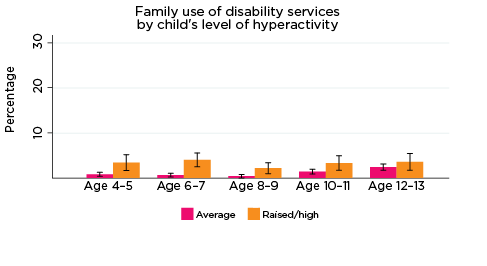
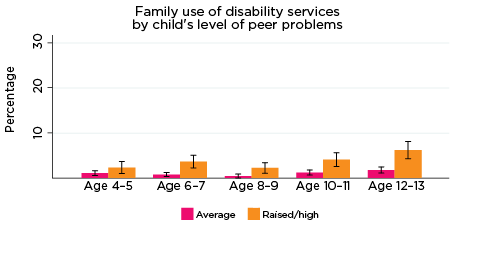
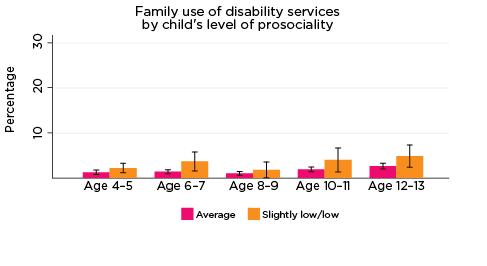
Notes: Use of service in the last 12 months. 95% confidence intervals are shown by 'I' bars in each column. Where confidence intervals for the groups being compared do not overlap, this indicates that the values are significantly different. N = 3,823 (age 4-5), 4,206 (age 6-7), 3,998 (age 8-9), 3,656 (age 10-11), 3,271 (age 12-13).
Source: LSAC Waves 3-7, B cohort, weighted
Access to mental health and support services at the family level
The percentage of parents who reported that they had needed counselling or support services for their family in the previous 12 months, but were not able to get those services, was significantly higher among parents whose children had elevated levels of risk of social-emotional problems. For example, among parents of children with elevated levels of risk of conduct problems, the percentage who reported that they had difficulties accessing services was 4-5%, compared to 1-2% for parents whose children had lower levels of conduct problems (Figure 25).
Figure 25: Difficulties accessing services at the family level, by social-emotional outcomes of the study child
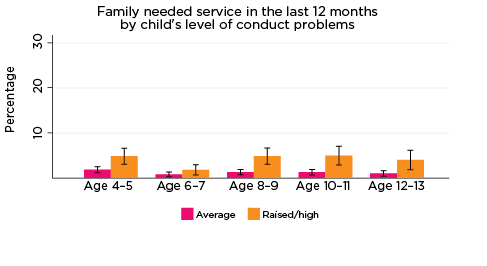


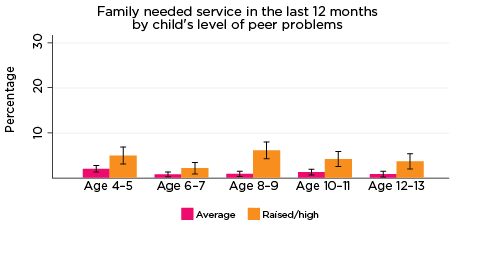
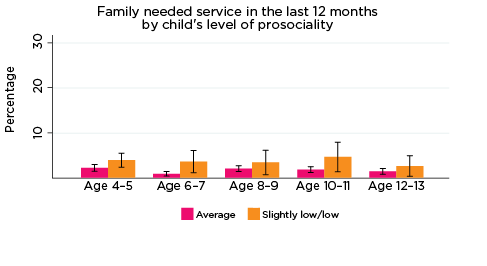
Notes: 95% confidence intervals are shown by 'I' bars in each column. Where confidence intervals for the groups being compared do not overlap, this indicates that the values are significantly different. N = 3,823 (age 4-5), 4,206 (age 6-7), 3,998 (age 8-9), 3,656 (age 10-11), 3,271 (age 12-13).
Source: LSAC Waves 3-7, B cohort, weighted
Among parents of children with a lower risk of peer problems, the percentage who reported that they had difficulties accessing services was 4-6%, compared to 1-2% for parents whose children had lower levels of conduct problems. There were no significant differences in the percentage of parents reporting difficulties accessing counselling or support services according to their child's level of prosocial behaviour.
Summary
At the family level, there were significant differences in the use of counselling and other mental health support services according to the risk of social-emotional difficulties among study children. This was particularly the case for parenting education, counselling (relationship counselling and adult mental health services), and family support groups.
These results suggest that families with children at risk of social-emotional problems generally have a higher rate of contact with mental health support services. Importantly, family-level contact with such services may provide opportunities for identifying and assisting with social-emotional outcomes among at-risk children; that is, intervening early before issues become more serious. For example, a relationship counsellor may provide support or advice for parents to address their child's emotional issues or behavioural problems, or recommend appropriate services for the child.
Multivariate analysis - family members' use of health and support services
Compared to the results concerning use of health services for the study children themselves, the multivariate analysis related to use of support services at the family level showed fewer significant associations between social-emotional symptoms of the study child and use of services by family members (Table 9). It is likely that, in many households, these services were used for household members other than the study child themselves.
| Odds ratio | |||||||
|---|---|---|---|---|---|---|---|
| Parenting education | Relationship counselling | Other counselling | Family support group | Phone or internet | Adult mental health services | Disability services | |
| Emotional symptoms | 1.25* | 1.10 | 1.34*** | 1.98*** | 1.44** | 1.41** | 1.23 |
| Hyperactivity | 1.24 | 1.05 | 1.05 | 1.31 | 1.12 | 1.37* | 1.49 |
| Conduct problems | 1.22 | 1.11 | 1.11 | 0.95 | 1.35* | 1.07 | 1.07 |
| Peer problems | 1.13 | 1.19 | 0.93 | 1.16 | 1.00 | 0.84 | 1.29 |
| Low prosocial skills | 1.25 | 1.01 | 0.99 | 1.56* | 0.94 | 0.97 | 1.30 |
| Age group (ref. = Age 4-5) | |||||||
| Age 6-7 | 0.69*** | 0.95 | 1.18 | 0.65* | 0.46*** | 1.21 | 0.92 |
| Age 8-9 | 0.39*** | 0.37*** | 0.55*** | 0.13*** | 0.18*** | 0.69* | 0.48** |
| Age 10-11 | 0.49*** | 0.71** | 1.24* | 0.32*** | 0.29*** | 1.26 | 1.01 |
| Age 12-13 | 0.39*** | 0.53*** | 1.28** | 0.23*** | 0.19*** | 1.31 | 1.22 |
| Male | 1.28** | 0.89 | 0.91 | 1.42* | 1.15 | 0.97 | 1.19 |
| Aboriginal and Torres Strait Islander | 1.02 | 1.34 | 1.21 | 1.12 | 0.43* | 1.61 | 0.63 |
| LOTE | 0.46*** | 0.54** | 0.46*** | 0.59 | 0.33*** | 0.48** | 0.75 |
| Birth order (ref. = Oldest child) | |||||||
| Middle child/Twin | 0.61*** | 0.98 | 1.08 | 1.00 | 0.69** | 0.93 | 0.98 |
| Youngest child | 0.46*** | 0.82 | 1.41*** | 0.50*** | 0.41*** | 0.93 | 1.01 |
| Only child | 0.64** | 0.62* | 1.00 | 0.74 | 0.48*** | 0.97 | 0.92 |
| Region of residence (ref. = Major city) | |||||||
| Inner regional | 1.03 | 1.13 | 1.12 | 0.92 | 0.83 | 1.01 | 0.71 |
| Outer regional or remote | 1.02 | 1.00 | 0.98 | 1.36 | 0.66* | 1.07 | 0.91 |
| Neighbourhood advantage (ref. = Lowest 25%) | |||||||
| Middle 50% | 1.13 | 1.18 | 1.20* | 1.23 | 1.05 | 1.21 | 0.98 |
| Top 25% | 1.43* | 1.31 | 1.24* | 1.31 | 0.92 | 1.06 | 1.02 |
| Parents' education (ref. = Year 12 or below) | |||||||
| Certificate or diploma | 1.11 | 1.06 | 1.31* | 1.28 | 1.12 | 1.87** | 1.14 |
| Degree | 1.60** | 1.37 | 1.52*** | 1.46 | 1.85** | 1.88** | 1.31 |
| Private health insurance | 1.67*** | 1.24 | 1.09 | 0.85 | 1.25 | 1.21 | 1.09 |
| Study child in fair or poor health | 1.10 | 1.04 | 1.01 | 1.05 | 1.33 | 1.13 | 1.45 |
| Special health care needs | 1.39** | 1.34* | 1.30** | 2.54*** | 1.33* | 1.48** | 3.34*** |
| Parental income (ref. = Lowest 25%) | |||||||
| 2nd | 0.95 | 0.96 | 0.91 | 0.64* | 1.16 | 1.02 | 0.73 |
| 3rd | 1.02 | 0.82 | 0.91 | 0.70 | 1.07 | 0.91 | 0.56* |
| 4th (Top 25%) | 1.01 | 1.03 | 0.94 | 0.49** | 1.06 | 0.81 | 0.64 |
| Income support | 1.12 | 0.86 | 1.07 | 1.09 | 0.89 | 1.73** | 2.08* |
| Mother poor mental health | 1.23 | 2.05*** | 2.51*** | 1.47 | 1.67*** | 4.31*** | 2.26*** |
| Father poor mental health | 0.85 | 2.28*** | 1.91*** | 0.94 | 0.82 | 2.60*** | 1.26 |
| Mother poor physical health | 1.20 | 1.11 | 1.26* | 1.28 | 1.12 | 1.73*** | 1.53 |
| Father poor physical health | 1.22 | 1.07 | 1.11 | 1.28 | 1.17 | 1.27 | 1.17 |
| Single-parent household | 1.72** | 4.63*** | 2.67*** | 1.08 | 1.55* | 1.10 | 0.52 |
| Mother has a health condition or disability | 1.68* | 0.59 | 1.11 | 0.81 | 1.76* | 1.33 | 0.83 |
| Father has a health condition or disability | 1.20 | 1.45 | 1.49* | 0.81 | 0.97 | 2.31*** | 2.86** |
| Sibling has a health condition or disability | 3.10*** | 1.43 | 1.85*** | 8.42*** | 2.19** | 1.62* | 30.25*** |
| Resident grandparent has a health condition or disability | 1.22 | 1.07 | 1.45 | 0.60 | 0.21 | 0.96 | 2.67 |
| Other household member has a health condition or disability | 1.78 | 3.98 | 0.36 | - | 1.23 | 3.38 | 76.36*** |
Notes: Random effects logistic regression * p < .05; ** p < .01; *** p < .001. ORs reported. N = 18,093.
Source: LSAC Waves 3-7, B cohort, data pooled across five waves
The emotional symptoms subscale showed the strongest association with service use at the household level. After controlling for a range of characteristics of the study child and their family, compared to those with normative levels of emotional symptoms, the odds of someone in the study child's household having:
- been to parenting education were 25 percentage points higher
- been to other counselling were 34 percentage points higher
- been to a family support group were doubled
- used phone or internet help service were 44 percentage points higher
- used adult mental health services were 41 percentage points higher.
There were three other statistically significant results concerning the use of services by household members:
- Compared to children who scored lower on the hyperactivity scale, for those with an elevated risk of hyperactivity, the odds of someone in their household using adult mental health services were increased by 37 percentage points.
- Compared to children who scored lower on the conduct problems scale, for those with an elevated risk of hyperactivity, the odds of someone in their household using adult mental health services were increased by 35 percentage points.
- Compared to children who scored higher on the prosocial skills scale, for those at risk of social problems, the odds of someone in their household having attended a family support group were 1.6 times higher.
Other factors were shown to be related to the use of support services at a household level:
- Special health care needs - While there was no significant difference in the odds of using these support services depending on the parent's rating of the study child's physical health, there were some differences according to whether the study child was reported to have special health care needs. Compared to other children, for children with special health care needs, the odds of the family having used:
- relationship counselling, other counselling and phone or internet help services were 1.3 times higher
- parenting education were 1.4 times higher
- adult mental health services were 1.5 times higher
- family support group more than doubled (OR 2.5)
- disability services were more than tripled (OR = 3.3).
- Age of the study child - The odds of having used parenting education, relationship counselling, family support groups and phone or internet help services are generally lower at older ages compared to when the study child was aged 4-5. However, the odds of family members having used other counselling services were significantly higher when the study children were aged 10-11 and 12-13 than when the study children were 4-5 years old.
- Gender of the study child - The odds of having used parenting services and family support groups were significantly higher in families where the study child was a boy, compared to households in which the study child was a girl.
- Indigenous status - Compared to other families, the odds of having used phone or internet help services were 40 percentage points lower if the study child was Aboriginal and Torres Strait Islander.
- Birth order - Compared to families in which the study child was the oldest child in the family:
- Those in which the study child was a middle child or twin had significantly lower odds of using parenting education services (OR = 0.6) and phone or internet help services (OR = 0.7).
- Those in which the study child was the youngest child in the family had significantly reduced odds of having used parenting education, family support groups and phone or internet help services, but higher odds of having used other counselling services.
- Those in which the study child was the only child had significantly reduced odds of having used relationship counselling, parenting education and phone or internet help services.
- Language - Compared to families in which the study child spoke only English, the odds of having used parenting education, other counselling, phone or internet services and adult mental health services were more than halved, and the odds of having used relationship counselling were almost halved (OR = 0.54) for families where the study child spoke a LOTE at home.
- Region of residence - While there were no significant differences in the odds of using 'face-to-face' support services such as parenting education or relationship counselling, compared to families who lived in major cities, the odds of having used phone or internet help services were reduced by 33 percentage points for families who lived in outer regional or remote areas.
- Neighbourhood advantage/disadvantage - Compared to families who lived in the least advantaged neighbourhoods, families who lived in the most advantaged neighbourhoods had increased odds of having used parenting education services (OR = 1.4), and families who lived in in more advantaged neighbourhoods (top 75%) had increased odds of using other counselling services (OR = 1.2).
- Family structure - Compared to two-parent families, single-parent families had increased odds of having used parenting education (OR = 1.7), relationship counselling (OR = 4.6) and other counselling services (OR = 2.7). Presumably for many single-parent families, these services were used during or after a separation or divorce.
- Parents' education - compared to households in which no parent had completed any post-school education:
- The odds of having used adult mental health services were almost doubled (OR = 1.9) in households where at least one parent had completed some post-school education.
- The odds of having used other counselling services were 1.3 times higher if a parent had completed a certificate or diploma; and 1.5 times higher if at least one parent had a university qualification.
- The odds of having used phone or internet help services were almost doubled (OR = 1.9), and the odds of having attended parenting education were 1.6 times higher, if at least one parent had a degree.
- Parental income - After controlling for a range of other characteristics of the study child and their family, there were relatively few significant results related to parental income:
- Compared to families in the lowest quartile of household incomes, those with incomes in the second quartile had reduced odds of having used a family support group (OR = 0.6), as did families in the top 25% of the equivalised parental income distribution (OR = 0.5).
- Families whose main source of income was government income support payments had increased odds of having used adult mental health services (OR = 1.7) and disability services (OR = 2.1). This result is likely to be due to the fact that those who require these services are also more likely to be eligible for these income support payments due to a health condition or disability.
- Private health insurance coverage was generally not related to the use of mental health support services, presumably because, for most private 'extras' policies, coverage for these types of services is limited. The only exception was for parenting education, for which the odds of use was significantly higher among those who had private health insurance, compared to families who did not.
- Parents' mental health - The odds of having used mental health support services were increased significantly in households in which a parent had raised levels of psychological distress. For example, compared to households in which the mother (or father) had low levels of psychological distress (measured by the Kessler K6 psychological distress scale), the odds of having used relationship counselling, adult mental health services or other counselling services were significantly higher if the mother had raised levels of psychological distress.
- Parents' physical health - While there were no differences in the odds of use of support services according to whether the father of the study child was in fair or poor health, the odds of the family having used Adult Mental Health Services and Other Counselling services were significantly higher (OR = 1.3 and 1.7, respectively) in households where the mother was in fair or poor health, compared to those in which the mother was in good, very good or excellent health;
- Disability status of household members - Not surprisingly, the odds of having used disability services were increased substantially if a household member had a long-term health condition or disability. The odds of using some other services were also increased if a household member had a health condition or disability. For example:
- The odds of having used parenting education services and phone or internet help services were significantly higher (OR = 1.7 and 1.8, respectively) in households in which the mother had a long-term health condition or disability, compared to those who did not.
- The odds of having used adult mental health services and other counselling services were significantly higher (OR = 2.3 and 1.5, respectively) in households in which the father had a long-term health condition or disability, compared to those who did not.
- The odds of having used parenting education services were more than tripled, and the odds of using a family support group were around eight times higher, if the study child had a sibling with a long-term health condition or disability, compared to those who did not.
In summary, the use of counselling and support services was significantly higher among families in which the study child had an elevated risk of social-emotional problems, particularly if the study child was at increased risk of emotional problems. Compared to other families, the odds of having used parenting education, family support groups, adult mental health services, other counselling services and phone or internet help services were significantly higher in families where the study child was at increased risk of emotional problems. Further, the odds of having used adult mental health services were significantly higher in families where the study child had an elevated risk of hyperactivity or conduct problems; the odds of having attended a family support group were increased for families in which the study child had showed lower levels of prosocial behaviour.
These results suggest that, even if these services were used by family members for reasons other than the social-emotional issues of the study child, there may be opportunities for mental health professionals to identify, and potentially assist with, issues faced by the children in the family.
2 www9.health.gov.au/mbs/search.cfm
3 A complete list of current and past MBS item numbers is available at: www.mbsonline.gov.au/internet/mbsonline/publishing.nsf/Content/ED28842309B2CD13CA2580F7008294BE/$File/201705_ITEMMAP_INPUT.TXT
Note: Only cursory classification information is provided for each item number at this location (e.g. information relating to fees, benefits, etc. is not available).
4 See Appendix A for a complete list of the SDQ items.
5 The random effects model accounts for unobserved individual-specific characteristics. The assumption made in a random effects model is that the individual specific effects are uncorrelated with the independent variable.
6 Appendix C includes the findings of bivariate analyses investigating frequency of MBS service use by risk of experiencing adverse social-emotional outcomes.
7 Details of all statistically significant differences in use of health services, for each SDQ subscale, are provided in Appendix D.
8 Odds rations (ORs) for all measures included in the model are presented in Appendix Table B3. ORs are centred around 1, with an OR between 0 and 1 indicating a decrease in the odds of having used a service and an OR above 1 indicating an increase in the odds of having used a service. For example, the OR related to children with elevated levels of emotional symptoms having used psychiatric services is 3.29. This indicates that compared to children with lower scores on the emotional symptoms scale, the odds of having used psychiatric services are more than tripled (3.3 times the odds). For dental services, the OR related to children with an elevated risk of peer problems is 0.8. This suggests that compared to children with a lower risk of peer problems, the odds of having used dental services is 80% of the odds (i.e. the odds of having seen a dentist are reduced by 20 percentage points for those with an elevated risk of peer problems).
9 A United States study by Black, Vahratian, and Hoffman (2015) shows that boys aged 3-17 are more likely than girls to have a voice, speech, language or swallowing disorder (9.6% compared to 5.7%, respectively).
10 Figures from the Australian Medical Association indicate that, in 2015-16, there were fewer GPs in outer regional, remote and very remote areas of Australia compared to major Australian cities (97.4 full service equivalent [FSE] GPs per 100,000 people vs 99.4 FSE GPs per 100,000 people, respectively, overall). The differences in rates of FSE GPs in each state and territory differs quite substantially; see: ama.com.au/article/general-practice-facts
11 An incidence rate ratio is the ratio of two incidence rates. Incidence rates represent the number of new cases or occurrences of a chosen outcome or event over a specified period or the person-time at risk. In our analyses (Table 8), the person-time at risk period is the two years prior to each interview, with the outcome being the number of service visits during that time. Similar to ORs, an incidence rate ratio greater than 1.0 indicates that children comprising the exposure category (e.g. residing in outer regional or remote areas) are significantly more likely to access the chosen service type compared to children in the reference category (major city). An incidence rate ratio less than 1.0 is the inverse of this.
Conclusion and policy implications
This paper examined children's use of Australian health care services using prospective data from both the Longitudinal Study of Australian Children (LSAC) and the Medicare Benefits Schedule (MBS). A focus was on identifying the socio-demographic, psychosocial and familial characteristics of study children with higher rates of health care service access between the ages of 4-5 and 12-13 years. In particular, we investigated whether service utilisation patterns differed during this period according to children's psychological adjustment, indicated by elevated (vs 'normative') risk of experiencing emotional symptoms, conduct problems, hyperactivity, peer problems and poor social skills (as assessed by the SDQ).
LSAC self-report data (from study children's parents) indicated that GPs were a key form of professional health care support for study children and their families; indeed, GPs were the most commonly accessed service type at every age. The MBS data supported this, demonstrating that study children accessed GPs (specifically: GPs for less than 20 minutes) more commonly and more frequently than any other type of service. Given factors including low cost and high levels of familiarity, accessibility and availability compared to other service types, this finding is not particularly unexpected and is supported by previous research and official statistics (e.g. Steering Committee for the Review of Government Service Provision, 2016). However, it does highlight the crucial role that GPs occupy in meeting the immediate needs of Australian children and families and as gatekeepers to the wider health care system.
This is particularly important in consideration of our findings from analyses of both the MBS and self-report data; children at elevated risk of experiencing the symptoms of poor psychological adjustment - as measured by the SDQ - were significantly more likely to access GPs at many time-points compared to children at average risk of experiencing emotional symptoms, conduct problems, hyperactivity, peer problems and/or poor social skills. In particular, the MBS data showed that children at elevated risk of experiencing social-emotional problems were typically more likely to access GPs specifically in relation to mental health concerns and, to a lesser extent, to use GPs after hours. Evidently, in the context of already substantial workloads among GPs in general (Thompson & Walter, 2016), it appears that GPs need to be sufficiently educated about the unique and dynamic needs of children in addition to being knowledgeable about efficient referral mechanisms to services that might be better suited to addressing specific psychosocial and health concerns among Australians.
Among children with an increased risk of social-emotional or psychological adjustment difficulties, levels of health service utilisation were, typically, significantly higher in comparison to children who were at a lower risk of poor social-emotional outcomes or psychological adjustment. Specifically, children at increased risk of social-emotional problems had higher rates of contact with numerous health and social support service types, including Paediatricians, Speech Therapists, Guidance Counsellors, as well as Hospital Emergency and Outpatient services and different classifications of services provided by GPs (e.g., after hours and specifically for mental health concerns). Additionally, the MBS data indicated that children with elevated risk of adverse social-emotional outcomes were accessing numerous services significantly more frequently throughout childhood and adolescence. This suggests there are valuable opportunities for frontline medical, health and social support professionals - other than GPs - to identify children who may be at risk of mental health problems and to provide parents with advice or referrals to services that may prevent these issues from progressing into more serious mental health issues. Indeed, previous work by the Australian Government's Productivity Commission indicated that, to alleviate the burden of referring service users on GPs, other professionals (e.g., physician assistants) could aid in this capacity (Productivity Commission, 2017). Researchers (e.g. Stiffman, Pescosolido & Cabassa, 2004) have even offered that non-health care professionals (e.g., juvenile justice authorities, teachers) and non-professionals (primarily: parents) are integral to engaging at risk children with suitable services, given their regular contact with such children. Indeed, our findings demonstrate that the odds of accessing a Guidance Counsellor (i.e. a professional working in a non-health specific field) are higher among children at elevated risk of experiencing emotional symptoms, conduct problems, hyperactivity and peer problems, compared to those with only average risk of experiencing such concerns. Therefore, equipping professionals in such roles with the adequate knowledge and skills to identify and assist children at elevated risk of adverse social-emotional outcomes could be an important step towards intervening earlier to help at risk children.
In general, analyses of MBS data did affirm that children at elevated risk of experiencing socio-emotional symptoms were especially more likely to engage with most service types investigated in our analyses. An important finding from the MBS analyses was the indication that residing in more regional or remote locations (compared to major Australian cities) significantly reduced the likelihood that children would engage with certain service types, along with being associated with a decreased frequency of service use. This finding was supported by the self-report LSAC data and previous research (AIHW, 2017), and suggests that children and families residing in rural and regional areas of the country are not engaging with services to the same extent as their metropolitan counterparts; that is, it is likely that such children are experiencing unmet health care needs.
Regardless of geographical location, however, our findings did indicate that unmet need for health care services is a problem for a considerable minority of Australian children and their families, especially for those with elevated levels of risk of social-emotional problems. For example, among parents of children with elevated levels of risk of conduct problems (at any age), the percentage who reported experiencing difficulties accessing services ranged from 11% when children were aged 4-5, to 7% when children were aged 12-13. In comparison, among parents of children with average risk of experiencing conduct problems, the percentage reporting difficulties accessing services ranged from 7% at age 4-5, to 3% when children were aged 10-11 and 12-13. Such findings suggest the existence of personal, social and/or structural barriers to the utilisation of health and support services for some children and their families, and highlight the need to improve access to appropriate professional support to address poor health and wellbeing among Australians, especially for families with children at elevated levels of risk of social-emotional problems.
At the family level, there were significant differences in the use of counselling and other mental health support services, if the study child had an increased risk of social-emotional problems. This was particularly the case for parenting education, counselling, and family support groups. As families with children at risk of social-emotional problems generally have a higher rate of contact with mental health support services, this may also provide opportunities for identifying and assisting with social-emotional outcomes for children - intervening early before issues become more serious.
References
- Althubaiti, A. (2016). Information bias in health research: Definition, pitfalls, and adjustment methods. Journal of Multidisciplinary Healthcare, 9, 211-217.
- Australian Bureau of Statistics (ABS). (2017). Australian Health Survey: Health service usage and health related actions, 2014-15. ABS Cat. No. 4364.0.55.002. Canberra: ABS.
- Australian Dental Association (ADA). (2016). When should my child first see the dentist? St Leonards, NSW: ADA. Retrieved from www.ada.org.au/getattachment/Your-Dental-Health/Resources-for-Professionals/Resources-for-Children-0-11/When-should-my-child-first-see-the-dentist/When-should-my-child-first-see-the-dentist_.pdf.aspx
- Australian Institute of Health and Welfare (AIHW). (2017). Rural and remote health (Web report). Canberra: AIHW. Retrieved from www.aihw.gov.au/reports/rural-health/rural-remote-health/contents/rural-health
- AIHW. (2018). Health expenditure Australia 2016-17 (Health and welfare expenditure series no. 64). Cat. no. HWE 74. Canberra: AIHW. Retrieved from www.aihw.gov.au/getmedia/e8d37b7d-2b52-4662-a85f-01eb176f6844/aihw-hwe-...
- Australian Mental Health Outcomes and Classification Network (AMHOCN). (2005). Strengths and Difficulties Questionnaire: Training manual. Parramatta, NSW: AMHOCN.
- Black, L. I., Vahratian, A. & Hoffman H. J. (2015). Communication disorders and use of intervention services among children aged 3-17 years: United States, 2012 (NCHS data brief, no. 205). Hyattsville, MD: National Center for Health Statistics.
- Cummings, M. & Kang, M. (2012). Youth health services: Improving access to primary care. Australian Family Physician, 41(5), 339-341.
- Daraganova, G. (2017). Self-harm and suicidal behaviour of young people aged 14-15 years old. In Australian Institute of Family Studies (AIFS) (Eds.), Growing Up in Australia: The Longitudinal Study of Australian Children Annual Statistical Report 2016 (pp. 119-44). Melbourne: AIFS.
- Department of Education. (2017). Maternal & Child Health Services Annual Report 2015-2016. Melbourne: Department of Education. Retrieved from: www.education.vic.gov.au/Documents/childhood/providers/support/2015-16VictoriaStatewidereport.pdf
- Goodman, R. (1999). The extended version of the Strengths and Difficulties Questionnaire as a guide to child psychiatric caseness and consequent burden. Journal of Child Psychology and Psychiatry, 40(5), 791-799.
- Gray, M., & Smart, D. (2009). Growing Up in Australia: The Longitudinal Study of Australian Children. A valuable new data source for economists. Australian Economic Review, 42(3), 367-376.
- Hawes, D. J., & Dadds, M. R. (2004). Australian data and psychometric properties of the Strengths and Difficulties Questionnaire. Australian and New Zealand Journal of Psychiatry, 38(8), 644-651.
- Hiscock, H., Mulraney, M., Efron, D. Freed, G., Coghill, D., Sciberras, E. et al. (2019). Use and predictors of health services among Australian children with mental health problems: A national prospective study. Australian Journal of Psychology, 71(2).
- Kessler, R. C., Barker, P. R., Colpe, L. J., Epstein, J. F., Gfroerer, J. C., Hiripi, E. et al. (2003). Screening for serious mental illness in the general population. Archives of General Psychiatry, 60(2), 184-189.
- Law, J., Zeng, B., Lindsay, G., & Beecham, J. (2012). Cost-effectiveness of interventions for children with speech, language and communication needs (SLCN): A review using the Drummond and Jefferson (1996) 'Referee's Checklist'. International Journal of Language & Communication Disorders, 47(1), 1-10.
- Lawrence, D., Johnson, S., Hafekost, J., Boterhoven De Haan, K., Sawyer, M., Ainley, J. & Zubrick., S. R. (2015). The mental health of children and adolescents: Report on the second Australian Child and Adolescent Survey of Mental Health and Wellbeing. Canberra: Department of Health.
- Lewis, C. W. (2009). Dental care and children with special health care Needs: A population-based perspective. Academic Pediatrics, 9(6): 420-426.
- National Health Performance Authority. (2015). Australians' experiences with access to health care in 2013-14. Canberra: National Health Performance Authority.
- Newman, L. (2012). Getting in early: identification of risk in early childhood. Australian and New Zealand Journal of Psychiatry, 46(8), 697-699.
- Productivity Commission. (2017). Introducing competition and informed user choice into human services: Reforms to human services (Report No. 85). Canberra: Productivity Commission. Retrieved from nla.gov.au/nla.obj-632382774/view
- Sawyer, M. G., Reece, C. E., Sawyer, A. C., Hiscock, H., & Lawrence, D. (2018). Adequacy of treatment for child and adolescent mental disorders in Australia: A national study. Australian and New Zealand Journal of Psychiatry, 53(4), 326-335.
- Schieve, L. A., Gonzalez, V., Boulet, S. L., Visser, S. N., Rice, C. E., Van Naarden Braun, K., & Boyle, C. A. (2012). Concurrent medical conditions and health care use and needs among children with learning and behavioral developmental disabilities, National Health Interview Survey, 2006-2010. Research in Developmental Disabilities, 33(2), 467-476.
- Soloff, C., Lawrence, D., & Johnstone, R. (2005). Sample Design (LSAC Technical Paper No. 1). Melbourne: Australian Institute of Family Studies. Retrieved from growingupinaustralia.gov.au/sites/default/files/tp1.pdf
- Steering Committee for the Review of Government Service Provision. (2016). Report on Government Services 2016: Volume E. Health. Canberra: Productivity Commission.
- Stevenson, J., Kreppner, J., Pimperton, H., Worsfold, S., & Kennedy, C. (2015). Emotional and behavioural difficulties in children and adolescents with hearing impairment: a systematic review and meta-analysis. European Child and Adolescent Psychiatry, 24(5), 477-496.
- Stiffman, A. R., Pescosolido, B., & Cabassa, L. J. (2004). Building a model to understand youth service access: The gateway provider model. Mental Health Services Research, 6(4), 189-198.
- Stone, L. L., Otten, R., Engels, R. C., Vermulst, A. A., & Janssens, J. M. (2010). Psychometric properties of the parent and teacher versions of the Strengths and Difficulties Questionnaire for 4- to 12-year-olds: A review. Clinical Child and Family Psychology Review, 13(3), 254-274.
- Thompson, M. & Walter, F. (2016). Increases in general practice workload in England. The Lancet, 387(10035), 2270-2271.
- Wakerman, J., & Humphreys, J. S. (2019). 'Better health in the bush': why we urgently need a national rural and remote health strategy. Medical Journal of Australia, 210(5), 202-204.
- Ware, J. E., Nelson, E. C., Sherbourne, C. D., & Stewart, A. L. (1992). Preliminary Tests of a 6-Item General Health Survey. In Stewart, A. L. & Ware, J. E. (Eds.), Measuring Functioning and Well-Being: The Medical Outcomes Study Approach (pp. 291-303). Durham, N.C.: Duke University Press.
- Warren, D. (2018). Children's use of Health Care Services. In Australian Institute of Family Studies (Eds.), Growing Up in Australia: The Longitudinal Study of Australian Children Annual Statistical Report 2017 (pp. 125-142). Melbourne: AIFS. Retrieved from aifs.gov.au/publications/guia-annual-statistical-report-2017
Appendix A: Full SDQ questionnaire items
| Emotional problems scale |
|---|
| Often complains of headaches … (I get a lot of headaches …) |
| Many worries … (I worry a lot) |
| Often unhappy, downhearted … (I am often unhappy …) |
| Nervous or clingy in new situations … (I am nervous in new situations …) |
| Many fears, easily scared (I have many fears …) |
| Conduct problems scale |
| Often has temper tantrums or hot tempers (I get very angry) |
| Generally obedient … (I usually do as I am told) |
| Often fights with other children … (I fight a lot) |
| Often lies or cheats (I am often accused of lying or cheating) |
| Steals from home, school or elsewhere (I take things that are not mine) |
| Hyperactivity scale |
| Restless, overactive … (I am restless …) |
| Constantly fidgeting or squirming (I am constantly fidgeting …) |
| Easily distracted, concentration wanders (I am easily distracted) |
| Thinks things out before acting (I think before I do things) |
| Sees tasks through to the end … (I finish the work I am doing) |
| Peer problems scale |
| Rather solitary, tends to play alone (I am usually on my own) |
| Has at least one good friend (I have one good friend or more) |
| Generally liked by other children (Other people my age generally like me) |
| Picked on or bullied by other children … (Other children or young people pick on me) |
| Gets on better with adults than with other children (I get on better than with people my age) |
| Prosocial scale |
| Considerate of other people's feelings (I try to be nice to other people) |
| Shares readily with other children … (I usually share with others) |
| Helpful if someone is hurt … (I am helpful if someone is hurt …) |
| Kind to younger children (I am kind to younger children) |
| Often volunteers to help others … (I often volunteer to help others) |
Appendix B: Measures included in multivariate analyses
Equivalised parental income
'Equivalised household income' refers to household income adjusted for household size. Household income is divided by an equivalising factor (1 for the first adult + 0.5 for all other adults (aged 15 and over) + 0.3 for all children under the age of 15).
Parental education
'Parents' education' refers to the highest education level of either resident parent.
Receipt of income support
Parents were considered to have received 'income support' if either parent reported receiving any type of 'government pension or allowance' (e.g. unemployment benefits) as income.
Private health insurance
Private health insurance coverage was measured in Wave 1 (2004), but these are data used in all waves.
Special health care needs
Children were considered to have special health care needs if their primary carer reported that they had a condition that lasted, or was expected to last, for at least 12 months that causes the child to use medicine prescribed by a doctor (other than vitamins) or more medical care, mental health or educational services than other children.
Study child/mother/father in poor physical health
Based on parents' ratings of their own physical health, on a scale from 1 'Poor', 2 'Fair', 3 'Good', 4 'Very Good', and 5 'Excellent'. This global health measure was from the SF-6 (Ware, Nelson, Sherbourne, & Stewart, 1992). The indicator is set to 1 if either parent reported being in 'poor' or 'fair' health, and 0 otherwise.
Mother/Father in poor mental health
Measured using the Kessler K6 screening scale (Kessler et al., 2003). Parent 2 answered six items relating to the past four weeks. Examples include: 'In the past 4 weeks about how often did you feel nervous?', and 'In the past 4 weeks about how often did you feel that everything was an effort? Each of the six items was reverse coded. The six items were then summed (provided there was no missing data for any item) and dichotomised into 0-12 (low psychological distress) or 13+ (high psychological distress). The indicator was then set to 1 if one or both resident parents had high psychological distress, 0 for a single-parent household with a parent with low psychological distress, or 0 for two-parent households where both parents had low psychological distress.
Neighbourhood advantage/disadvantage
Measured using the SEIFA Index of Relative Socio-economic Advantage and Disadvantage (IRSAD) for children's home neighbourhood. Classified into population-weighted quartiles. The middle two categories were then collapsed to give three categories: 'lowest 25%', 'middle 50%' and 'highest 25%'. Higher scores indicate the most advantaged areas.
Appendix C: Frequency of service use by risk of experiencing social-emotional symptoms
| Service | Age 4-5 (2008) | Age 6-7 (2010) | Age 8-9 (2012) | Age 10-11 (2014) | Age 12-13 (2016) | |||||
|---|---|---|---|---|---|---|---|---|---|---|
| N N = 2,984 | Y N = 709 | N N = 3,416 | Y N = 644 | N N = 3,210 | Y N = 671 | N N = 2,864 | Y N = 685 | N N = 2,589 | Y N = 647 | |
| General practitioner | ||||||||||
| 1. <20 minutes | 6.155 | 7.130*** | 4.802 | 5.986*** | 3.954 | 5.401*** | 3.430 | 4.742*** | 3.347 | 4.740*** |
| 2. ≥20 minutes | 0.298 | 0.375* | 0.168 | 0.269*** | 0.173 | 0.335*** | 0.245 | 0.368* | 0.313 | 0.570*** |
| 3. Mental health-specific concerns | 0.004 | 0.028*** | 0.022 | 0.132*** | 0.053 | 0.234*** | 0.062 | 0.311*** | 0.068 | 0.474*** |
| 4. After hours | 0.540 | 0.767*** | 0.484 | 0.637*** | 0.433 | 0.562*** | 0.341 | 0.479*** | 0.381 | 0.467 |
| Paediatrician | 0.268 | 0.608*** | 0.268 | 0.846*** | 0.304 | 0.903*** | 0.310 | 0.726*** | 0.264 | 0.833*** |
| Psychologist | 0.014 | 0.086*** | 0.078 | 0.408*** | 0.196 | 0.879*** | 0.237 | 1.216*** | 0.206 | 1.359*** |
| Other specialist | 0.324 | 0.425 | 0.316 | 0.469*** | 0.239 | 0.332* | 0.197 | 0.225 | 0.211 | 0.388*** |
| Total | 7.602 | 9.419*** | 6.138 | 8.747*** | 5.353 | 8.647*** | 4.821 | 8.066*** | 4.790 | 8.832*** |
Notes: * p < 0.05, **p < 0.01, ***p < 0.001; significant differences assessed using the Wilcoxon signed-rank test. Means service visits calculated for children with elevated risk of emotional symptoms vs those without during each two-year period prior to interviews (i.e. zero values not excluded).
Source: LSAC Waves 3-7, B cohort, and MBS data, years 2008-16, unweighted
| Service | Age 4-5 (2008) | Age 6-7 (2010) | Age 8-9 (2012) | Age 10-11 (2014) | Age 12-13 (2016) | |||||
|---|---|---|---|---|---|---|---|---|---|---|
| N N = 2,918 | Y N = 776 | N N = 3,184 | Y N = 876 | N N = 3,166 | Y N = 715 | N N = 3,006 | Y N = 543 | N N = 2,815 | Y N = 421 | |
| General practitioner | ||||||||||
| 1. <20 minutes | 6.281 | 6.570 | 4.930 | 5.205 | 4.175 | 4.334 | 3.601 | 4.138*** | 3.546 | 4.159** |
| 2. ≥20 minutes | 0.306 | 0.336 | 0.183 | 0.189 | 0.192 | 0.241** | 0.250 | 0.376** | 0.342 | 0.518*** |
| 3. Mental health-specific concerns | 0.004 | 0.027*** | 0.024 | 0.094*** | 0.062 | 0.185*** | 0.082 | 0.267*** | 0.117 | 0.366*** |
| 4. After hours | 0.577 | 0.608 | 0.507 | 0.515 | 0.442 | 0.516 | 0.356 | 0.431* | 0.387 | 0.477 |
| Paediatrician | 0.303 | 0.446 | 0.296 | 0.590*** | 0.322 | 0.789*** | 0.303 | 0.873*** | 0.324 | 0.734*** |
| Psychologist | 0.011 | 0.090* | 0.076 | 0.328*** | 0.221 | 0.727*** | 0.323 | 1.004*** | 0.367 | 0.900*** |
| Other specialist | 0.342 | 0.347 | 0.336 | 0.354 | 0.251 | 0.274 | 0.199 | 0.219 | 0.249 | 0.226 |
| Total | 7.825 | 8.424 | 6.352 | 7.275** | 5.663 | 7.066*** | 5.111 | 7.308*** | 5.331 | 7.380*** |
Notes: * p < 0.05, **p < 0.01, ***p < 0.001; significant differences assessed using the Wilcoxon signed-rank test. Means service visits calculated for children with elevated risk of emotional symptoms vs those without during each two-year period prior to interviews (i.e. zero values not excluded).
Source: LSAC Waves 3-7, B cohort, and MBS data, years 2008-16, unweighted
| Service | Age 4-5 (2008) | Age 6-7 (2010) | Age 8-9 (2012) | Age 10-11 (2014) | Age 12-13 (2016) | |||||
|---|---|---|---|---|---|---|---|---|---|---|
| N N = 3,213 | Y N = 749 | N N = 3,340 | Y N = 720 | N N = 3,118 | Y N = 763 | N N = 2,954 | Y N = 595 | N N = 2,766 | Y N = 469 | |
| General practitioner | ||||||||||
| 1. <20 minutes | 6.218 | 7.129** | 4.864 | 5.574*** | 4.090 | 4.668*** | 3.578 | 4.207*** | 3.561 | 4.002** |
| 2. ≥20 minutes | 0.299 | 0.401* | 0.173 | 0.236** | 0.183 | 0.273** | 0.246 | 0.380*** | 0.345 | 0.484** |
| 3. Mental health-specific concerns | 0.004 | 0.042*** | 0.024 | 0.111*** | 0.058 | 0.191*** | 0.084 | 0.240*** | 0.124 | 0.301*** |
| 4. After hours | 0.566 | 0.699 | 0.496 | 0.567 | 0.433 | 0.549** | 0.360 | 0.407 | 0.382 | 0.495 |
| Paediatrician | 0.282 | 0.678*** | 0.262 | 0.811*** | 0.243 | 1.081*** | 0.242 | 1.124*** | 0.279 | 0.959*** |
| Psychologist | 0.012 | 0.136*** | 0.062 | 0.447*** | 0.214 | 0.723*** | 0.304 | 1.034*** | 0.390 | 0.712*** |
| Other specialist | 0.330 | 0.432 | 0.320 | 0.432*** | 0.231 | 0.353 | 0.206 | 0.180 | 0.252 | 0.203 |
| Total | 7.711 | 9.518*** | 6.201 | 8.178*** | 5.453 | 7.839*** | 5.020 | 7.571*** | 5.332 | 7.156*** |
Notes: * p < 0.05, **p < 0.01, ***p < 0.001; significant differences assessed using the Wilcoxon signed-rank test. Means service visits calculated for children with elevated risk of emotional symptoms vs those without during each two-year period prior to interviews (i.e. zero values not excluded).
Source: LSAC Waves 3-7, B cohort, and MBS data, years 2008-16, unweighted
| Service | Age 4-5 (2008) | Age 6-7 (2010) | Age 8-9 (2012) | Age 10-11 (2014) | Age 12-13 (2016) | |||||
|---|---|---|---|---|---|---|---|---|---|---|
| N N = 2,977 | Y N = 716 | N N = 3,253 | Y N = 807 | N N = 3,043 | Y N = 838 | N N = 2,754 | Y N = 795 | N N = 2,520 | Y N = 716 | |
| General practitioner | ||||||||||
| 1. <20 minutes | 6.268 | 6.645 | 4.883 | 5.421** | 4.041 | 4.797*** | 3.434 | 4.546*** | 3.459 | 4.212*** |
| 2. ≥20 minutes | 0.304 | 0.348 | 0.177 | 0.212* | 0.184 | 0.263** | 0.248 | 0.342** | 0.322 | 0.515*** |
| 3. Mental health-specific concerns | 0.005 | 0.025*** | 0.026 | 0.094*** | 0.059 | 0.175*** | 0.076 | 0.229*** | 0.107 | 0.297*** |
| 4. After hours | 0.576 | 0.615 | 0.493 | 0.571* | 0.428 | 0.557*** | 0.343 | 0.452** | 0.394 | 0.415 |
| Paediatrician | 0.265 | 0.619*** | 0.269 | 0.726*** | 0.289 | 0.839*** | 0.283 | 0.762*** | 0.286 | 0.701*** |
| Psychologist | 0.018 | 0.067*** | 0.088 | 0.301*** | 0.229 | 0.623*** | 0.282 | 0.923*** | 0.288 | 0.961*** |
| Other specialist | 0.327 | 0.409 | 0.325 | 0.401* | 0.246 | 0.288 | 0.193 | 0.234* | 0.237 | 0.277 |
| Total | 7.763 | 8.728* | 6.260 | 7.727*** | 5.476 | 7.542*** | 4.858 | 7.488*** | 5.092 | 7.378*** |
Notes: * p < 0.05 **p < 0.01 ***p < 0.001; significant differences assessed using the Wilcoxon signed-rank test. Means service visits calculated for children with elevated risk of emotional symptoms vs those without during each two-year period prior to interviews (i.e., zero values not excluded).
Source: LSAC Waves 3-7, B cohort, and MBS data, years 2008-16, unweighted
| Service | Age 4-5 (2008) | Age 6-7 (2010) | Age 8-9 (2012) | Age 10-11 (2014) | Age 12-13 (2016) | |||||
|---|---|---|---|---|---|---|---|---|---|---|
| N N = 2,745 | Y N = 952 | N N = 3,743 | Y N = 317 | N N = 3,602 | Y N = 279 | N N = 3,326 | Y N = 223 | N N = 2,933 | Y N = 303 | |
| General practitioner | ||||||||||
| 1. <20 minutes | 6.415 | 6.124 | 4.992 | 4.953 | 4.226 | 3.921 | 3.691 | 3.565 | 3.581 | 4.056 |
| 2. ≥20 minutes | 0.310 | 0.317 | 0.185 | 0.177 | 0.199 | 0.222 | 0.264 | 0.341 | 0.345 | 0.551* |
| 3. Mental health-specific concerns | 0.006 | 0.018** | 0.033 | 0.110 | 0.078 | 0.168*** | 0.103 | 0.220*** | 0.128 | 0.353*** |
| 4. After hours | 0.604 | 0.525* | 0.501 | 0.593 | 0.459 | 0.412 | 0.363 | 0.439 | 0.388 | 0.495 |
| Paediatrician | 0.294 | 0.445** | 0.327 | 0.744*** | 0.376 | 0.821*** | 0.353 | 0.942*** | 0.349 | 0.653*** |
| Psychologist | 0.016 | 0.010** | 0.104 | 0.438*** | 0.292 | 0.595*** | 0.411 | 0.650*** | 0.385 | 0.934*** |
| Other specialist | 0.331 | 0.376* | 0.342 | 0.315 | 0.260 | 0.194 | 0.203 | 0.193 | 0.248 | 0.224 |
| Total | 7.977 | 7.866 | 6.486 | 7.331 | 5.890 | 6.333 | 5.37 | 6.350* | 5.436 | 7.267*** |
Notes: * p < 0.05 **p < 0.01 ***p < 0.001; significant differences assessed using the Wilcoxon signed-rank test. Means service visits calculated for children with elevated risk of emotional symptoms vs those without during each two-year period prior to interviews (i.e. zero values not excluded).
Source: LSAC Waves 3-7, B cohort, and MBS data, years 2008-16, unweighted
Appendix D: Differences in use of health services, by social-emotional outcomes and age
| Service type | Emotional symptoms | Conduct problems | Hyperactivity | Peer problems | Prosocial behaviour |
|---|---|---|---|---|---|
| General practitioner | |||||
| 4-5 | |||||
| 6-7 | 79% vs 73% | ||||
| 8-9 | 77% vs 65% | 73% vs 66% | |||
| 10-11 | 75% vs 65% | 73% vs 65% | 74% vs 64% | ||
| 12-13 | 78% vs 64% | 72% vs 66% | 71% vs 65% | ||
| Emergency department | |||||
| 4-5 | 24% vs 19% | 25% vs 19% | |||
| 6-7 | 20% vs 14% | 21% vs 14% | 19% vs 14% | ||
| 8-9 | 20% vs 15% | 19% vs 15% | 21% vs 15% | 21% vs 14% | |
| 10-11 | |||||
| 12-13 | 23% vs 15% | 24% vs 16% | |||
| Hospital outpatient | |||||
| 4-5 | 9% vs 6% | ||||
| 6-7 | 9% vs 6% | 11% vs 5% | 9% vs 6% | ||
| 8-9 | 11% vs 5% | 10% vs 5% | 11% vs 5% | 9% vs 5% | |
| 10-11 | 9% vs 6% | 12% vs 6% | |||
| 12-13 | |||||
| Paediatrician | |||||
| 4-5 | 11% vs 7% | 10% vs 7% | 14% vs 7% | 13% vs 6% | |
| 6-7 | 19% vs 6% | 13% vs 7% | 21% vs 6% | 16% vs 6% | 17% vs 8% |
| 8-9 | 17% vs 7% | 18% vs 6% | 23% vs 5% | 18% vs 6% | 21% vs 8% |
| 10-11 | 18% vs 6% | 19% vs 7% | 24% vs 5% | 19% vs 5% | 23% vs 8% |
| 12-13 | 15% vs 4% | 16% vs 5% | 22% vs 4% | 14% vs 4% | 15% vs 6% |
| Speech therapy | |||||
| 4-5 | 15% vs 12% | 20% vs12% | 18% vs 11% | 17% vs 11% | |
| 6-7 | 13% vs 9% | 12% vs 9% | 17% vs 8% | 14% vs 8% | 16% vs 9% |
| 8-9 | 11% vs 4% | 8% vs 5% | 15% vs 3% | 9% vs 4% | 11% vs 5% |
| 10-11 | 6% vs 3% | 6% vs3% | 8% vs 3% | 7% vs 2% | 7% vs 3% |
| 12-13 | 5% vs 1% | 4% vs 1% | |||
| Dental services^ | |||||
| 4-5 | 30% vs 37% | ||||
| 6-7 | |||||
| 8-9 | 58% vs 64% | 58% vs 64% | 53% vs 65% | 55% vs 63% | |
| 10-11 | 61% vs 67% | ||||
| 12-13 | 59% vs 71% | ||||
| Guidance counsellor | |||||
| 4-5 | |||||
| 6-7 | 10% vs 2% | 8% vs 2% | 8% vs 3% | 7% vs 3% | |
| 8-9 | 12% vs 3% | 10% vs 3% | 10% vs 3% | 9% vs 3% | 8% vs 4% |
| 10-11 | 14% vs 3% | 11% vs 4% | 12% vs 4% | 11% vs 4% | 13% vs 5% |
| 12-13 | 15% vs 4% | 16% vs 5% | 14% vs 5% | 12% vs 4% | |
| Psychiatric or behavioural services | |||||
| 4-5 | 6% vs 2% | 6% vs 2% | 8% vs 2% | 7% vs 2% | 5% vs 2% |
| 6-7 | 13% vs 3% | 11% vs 3% | 13% vs 3% | 10% vs 3% | 15% vs 4% |
| 8-9 | 16% vs 4% | 16% vs 4% | 16% vs 4% | 14% vs 4% | 17% vs 5% |
| 10-11 | 18% vs 4% | 15% vs 5% | 17% vs 5% | 15% vs 4% | 17% vs 6% |
| 12-13 | 22% vs 4% | 20% vs 5% | 18% vs 6% | 17% vs 4% | 18% vs 6% |
| Other specialists | |||||
| 4-5 | |||||
| 6-7 | 17% vs 11% | ||||
| 8-9 | 16% vs 11% | 15% vs 11% | |||
| 10-11 | |||||
| 12-13 | |||||
| Need services but could not get | |||||
| 4-5 | 11% vs 7% | 12% vs 7% | 12% vs 7% | ||
| 6-7 | 9% vs 5% | 10% vs 4% | 11% vs 5% | 9% vs 5% | 12% vs 5% |
| 8-9 | 7% vs 4% | 7% vs 4% | 7% vs 4% | 7% vs 3% | |
| 10-11 | 6% vs 3% | 9% vs 3% | 7% vs 3% | 6% vs 3% | 7% vs 3% |
| 12-13 | 6% vs 3% | 7% vs 3% | 6% vs 3% | 7% vs 2% | |
Note: Estimates reported only if children who are at increased risk of problems had higher levels of service use at the 95% significance level. ^For dental services, use of services is lower for the group of children at elevated risk of social-emotional problems than for other children. N = 3,821 (Age 4-5), 4,206 (Age 6-7), 3,998 (Age 8-9), 3,656 (Age 10-11), 3,271 (Age 12-13).
Source: LSAC Waves 3-7, B cohort, 2008-16, weighted
| Service type | Emotional symptoms | Conduct problems | Hyperactivity | Peer problems | Prosocial behaviour |
|---|---|---|---|---|---|
| Parenting education | |||||
| 4-5 | 12% vs 7% | ||||
| 6-7 | 8% vs 5% | 10% vs 5% | |||
| 8-9 | 7% vs 3% | 7% vs 3% | 6% vs 3% | 9% vs 4% | |
| 10-11 | 7% vs 4% | 7% vs 4% | |||
| 12-13 | 7% vs 3% | 6% vs 3% | 7% vs 4% | ||
| Relationship counselling | |||||
| 4-5 | 8% vs 5% | ||||
| 6-7 | 7% vs 4% | ||||
| 8-9 | 4% vs 2% | 8% vs 5% | |||
| 10-11 | 8% vs 3% | ||||
| 12-13 | 6% vs 3% | ||||
| Other counselling | |||||
| 4-5 | |||||
| 6-7 | 20% vs 9% | 14% vs 10% | 14% vs 10% | ||
| 8-9 | |||||
| 10-11 | 19% vs 10% | 18% vs 10% | 17% vs 11% | 15% vs 11% | |
| 12-13 | 19% vs 11% | ||||
| Family support groups | |||||
| 4-5 | |||||
| 6-7 | 5% vs 2% | 4% vs 2% | 4% vs 2% | 4% vs 2% | 6% vs 2% |
| 8-9 | |||||
| 10-11 | 3% vs 1% | ||||
| 12-13 | |||||
| Phone or internet help services | |||||
| 4-5 | |||||
| 6-7 | 7% vs 4% | ||||
| 8-9 | 4% vs 2% | ||||
| 10-11 | 6% vs 2% | ||||
| 12-13 | 5% vs 2% | ||||
| Adult mental health services | |||||
| 4-5 | 6% vs 3% | 7% vs 3% | |||
| 6-7 | 8% vs 4% | 7% vs 3% | 8% vs 3% | 7% vs 4% | 8% vs 4% |
| 8-9 | |||||
| 10-11 | 9% vs 4% | 8% vs 4% | 8% vs 4% | 7% vs 4% | 10% vs 4% |
| 12-13 | 10% vs 4% | ||||
| Disability services | |||||
| 4-5 | 4% vs 2% | 4% vs 2% | |||
| 6-7 | 5% vs 1% | 4% vs 1% | 5% vs 1% | 4% vs 1% | |
| 8-9 | 3% vs 1% | 3% vs 1% | 3% vs 1% | 3% vs 1% | |
| 10-11 | 4% vs 2% | 4% vs 2% | 4% vs 2% | ||
| 12-13 | 6% vs 2% | 8% vs 2% | 6% vs 2% | ||
| Need services but could not get | |||||
| 4-5 | 5% vs 1% | 5% vs 3% | |||
| 6-7 | 4% vs 1% | ||||
| 8-9 | 6% vs 2% | 5% vs 2% | 5% vs 2% | 6% vs 2% | |
| 10-11 | 5% vs 2% | 5% vs 2% | 4% vs 2% | ||
| 12-13 | 5% vs 2% | 4% vs 2% | 4% vs 2% | ||
Notes: Estimates reported only if children who are at increased risk of problems had significantly higher levels of service use at the 95% significance level. N= 3,821 (Age 4-5), 4,206 (Age 6-7), 3,998 (Age 8-9), 3,656 (Age 10-11), 3,271 (Age 12-13).
Source: LSAC Waves 3-7, B cohort, 2008-16, weighted
The research presented in this paper was commissioned by the Parenting Research Centre (PRC) for the National Workforce Centre for Child Mental Health (Emerging Minds). The National Workforce Centre for Child Mental Health is funded by the Australian Government Department of Health under the National Support for Child and Youth Mental Health Program. The PRC, subcontracted by the National Workforce Centre for Child Mental Health, fulfilled the role of Contract and Project Manager for this work in collaboration with the Australian Institute of Family Studies (AIFS). Growing Up in Australia: The Longitudinal Study of Australian Children is conducted in partnership between the Department of Social Services (DSS), AIFS and the Australian Bureau of Statistics (ABS). The views reported in this report are those of the authors and should not be attributed to DSS, AIFS, ABS, PRC or the National Workforce Centre for Child Mental Health. The authors also thank Elly Robinson and Catherine Wade for their valuable feedback.
Featured image: © GettyImages//SeventyFour
26 March 2020