Working Together to Care for Kids
A survey of foster and relative/kinship carers
Overview
AIFS was commissioned and funded by the Department of Social Services (DSS) to conduct the survey Working Together to Care for Kids: A Survey of Foster and Relative/kinship Carers. This national survey involved telephone interviews with 2,203 foster and relative/kinship carers in late 2016 and was aimed at providing a better understanding of the characteristics and needs of the carers of children who are living in out-of-home care in Australia.
Key messages
-
The study found that relative/kinship carers were more likely to be older, to report lower educational attainments, and to be from an Aboriginal or Torres Strait Islander background.
-
Relative/kinship carers were less likely to live with a partner and to be not as well-off as foster carers.
-
Many carers reported that they were coping despite difficulties, and felt that they were making a positive difference to a child's life.
-
However the study identified that there is the need to better inform and prepare carers for their role and to provide more support while children are in their care.
Executive summary
AIFS was commissioned and funded by the Department of Social Services (DSS) to conduct the survey Working Together to Care for Kids: A Survey of Foster and Relative/kinship Carers (also known as the 'Working Together to Care for Kids Survey', or WTCKS). This national survey involved telephone interviews with 2,203 foster and relative/kinship carers in late 2016 and was aimed at providing a better understanding of the characteristics and needs of the carers of children who are living in out-of-home care in Australia. Participants in this survey were foster and relative/kinship carers who were registered as formal carers (i.e., had at least one child in care under 18 years of age living with them) at 31 December 2015 in all jurisdictions except the Northern Territory.1 Most questions relating to children who were placed under the carers' care were directed to one child (referred to as "study child" or "study children").
Key findings
Characteristics of carers
This study provided significant insight into the socio-demographic characteristics of the participating carers (n = 2,203: relative/kinship: 53%; foster: 47%). The vast majority of carers were female (relative/kinship: 87%; foster: 88%) with a mean age of 53 years. Nearly one-half of carers were aged between 50 and 64 years, and substantial proportions were aged 65-69 years (12%) or 70 years and older (6%). Over one-tenth of carers were Indigenous, a higher percentage than there is in the general population. Most carers under 65 years of age were not in paid employment. Nearly one-half of carers had two or more children in out-of-home care at the time of the survey, with one-fifth having three or more children in their care.
The majority of carers had an annual gross household income of less than $60,000, while one-fifth of carers were relying on less than $30,000. Carers had lower levels of annual gross household income when compared to general Australian households. In addition, a greater proportion of carers lived in public housing compared to the general population, according to HILDA. While these data suggest that carers were financially not as well-off as the general Australian household, most carers reported that they were "reasonably comfortable".
Relative/kinship carers were more likely to be older, to report lower educational attainments, and to be from an Aboriginal or Torres Strait Islander background and less likely to live with a partner. In addition, relative/kinship carers were not as well-off as foster carers. Male carers were more likely to be older than female carers and were more likely to report higher educational attainment, to be in paid employment and to live with a partner.
Care experience
Most carers reported that they were approached by their jurisdictional department or agency about becoming a carer for the study child, although this was more common for foster carers than relative/kinship carers. A substantial minority of relative/kinship carers were asked by the child's parents or a family member to care for the study child.
The mean age of study children was 9 years old and the median duration that they had been living with their current carer was 3.4 years. Although just under one-half of carers reported that the study children were in their care for two years or less, over one-tenth reported a much longer duration (at least 10 years). Foster carers were more likely than relative/kinship carers to have cared for the study child for less than one year.
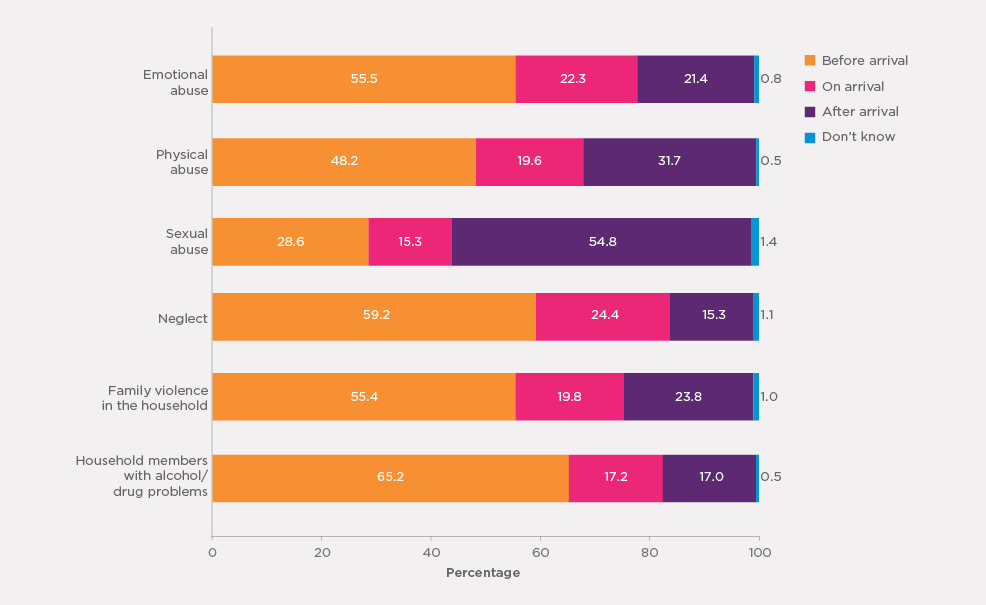
Most carers (86%) reported being aware that the study child in their care had experienced or been exposed to at least one of six indicators of abuse, neglect and problems at home. The most common indicators reported as experienced by study children were having lived with household member(s) who had alcohol or drug use problems (72%), followed by neglect (68%), family violence (62%) and emotional abuse (55%).
Although most carers were aware of the study child's experience of the various indicators of abuse/neglect prior to their arrival in their household, a significant minority of carers only became aware of such prior history after the study child had been in their care. In instances of sexual abuse, a majority (55%) of carers reported that they had not learned of its occurrence until after the child was in their care.
One-third of carers also reported that the study child had been diagnosed with at least one type of developmental condition - intellectual disability, a physical disability, diagnosed behavioural problems, or diagnosed mental health conditions. The most commonly reported developmental conditions were intellectual disabilities (18%) and behavioural problems (15%). Foster carers were more likely than relative/kinship carers to indicate that the study child had at least one of the four developmental conditions. In many cases, especially in regards to physical disabilities, carers were aware of these conditions prior to the study child coming to live with them, but it was also relatively common for the carer not to become aware of these conditions until or after the study child's arrival, and this was more apparent for foster carers than relative/kinship carers.
Overall, most carers (61%) reported that they were provided with adequate information about the study child's history before they came into their care, with relative/kinship carers being more likely than foster carers to believe this was the case (69% vs 52%). Importantly, however, more than one-third of carers reported that they were not provided with adequate information about the study child prior to their arrival, with this view being more prevalent for foster carers than for relative/kinship carers (46% vs 27%).
While a majority of the study children's birth parents were reported to remain alive, the degree and type of parental contact the children had varied. The study children had face-to-face contact less frequently with their father than their mother. One-third of study children had seen their mother at least once a month while less than one-fifth had seen their father at least once a month. Nearly one-third of study children had not seen their father in the past six months and over one-tenth did not see their mother. 2 Almost half of the study children had some degree of other contact with their mother, such as talking on the phone, emailing or contacting each other via social media, while just over a third of study children had this level of contact with their father.
Services and support
Access to support services
The vast majority of these carers (90%) had used at least one service for helping them look after the children who were placed in their care in the past, with over half (54%) having ever used three or more services over time. Over two-thirds of carers had received at least one type of services in the past six months. More than one-half of participating carers reported accessing carer support staff from their government child protection department and child counselling/psychologist services.
Overall, for most types of services, foster carers were more likely than relative/kinship carers to report having received support. Eight in ten foster carers had received at least one type of service support in the past six months. In contrast, less than six in ten relative/kinship carers had received at least one type of service, meaning that four in ten relative/kinship carers had not received services in the past six months at the time of their interview. Overall, carers perceived the services they had received to be "very helpful" or "fairly helpful", with only a minority indicating that the services received were unhelpful.
Overall, eight in ten carers reported that they currently required at least one service (regardless of whether they were currently using it). The number of carers who reported having current needs for at least one type of service was greater than the number of carers who reported having received at least one type of service in the past six months, demonstrating the extent of carers' needs for support. Indeed, two thirds of carers had one service need that was not met. Counselling/psychologist services were the most commonly nominated by carers as being currently needed, followed by carer support staff from a government child protection department, respite care services and carer support teams from non-government organisations and agencies. The analysis also revealed that substantial proportions of carers had current needs for these services but had not received the services in the past six months or never had. Almost half of the carers with a need for at least one type of services (nearly four in ten carers overall) said that they had some difficulty in getting the professional support they needed, with the most commonly reported barrier being long waiting lists/low support staff availability.
Training
Participating carers were asked about how well prepared they felt for their caring role, with almost two-thirds indicating that they felt very well or well prepared. Almost two-thirds of carers also reported that they had attended some form of training course or workshop to assist them in their caring role, with 40% undertaking training in the past year.
There were, however, large differences between foster and relative/kinship carers in regards to training, with over nine in ten foster carers reporting that they had undertaken some form of training, in comparison to only just over a third of relative/kinship carers.
Among carers who had not attended any training, views were mixed about whether it would have been helpful to do so, particularly among relative/kinship carers. Together, these data suggest that relative/kinship carers may have less access to training than foster carers and that when training opportunities arise, relative/kinship carers may be taking them up less frequently than foster carers.
Contact with caseworker/carer support worker and other carer families
While the majority of carers were in contact with a caseworker/carer support worker at least once a month, foster carers tended to have more frequent contact than relative/kinship carers. For relative/kinship carers, their caseworker/carer support worker was most likely to be from a government department, while for foster carers, they were equally likely to be from a non-government organisation as a government department. Overall, carers were satisfied with the advice or assistance they received from their caseworker/carer support worker in regards to their most recent contact.
Just under one-half reported that they had met other carer families through a carer support group or on a social basis, but foster carers were much more likely to report this type of contact than relative/kinship carers.
Rewards and challenges
Most carers (i.e., over 90%) strongly agreed/agreed that they could make a positive difference in the life of a child in care, that they could provide the child with a positive family experience, and that it was a rewarding experience to care for these children. Nevertheless, carers also revealed the significant challenges they had faced in carrying out their caring role. Nearly one-half agreed that caring for children in out-of-home care was stressful, and an even higher proportion agreed that it was difficult to manage their behaviours, and that these children required more time or effort than other children of the same age.
Approximately one-half of carers agreed that the allowances received for the study child were adequate and that they were well supported by agencies/services. However, nearly one-quarter of carers felt that allowances were inadequate to care for the study child and three in ten did not feel well supported by agencies/services in meeting the study child's needs. This dissatisfaction was more prevalent among relative/kinship carers than foster carers, and was particularly evident among carers looking after the study children who had experienced or were exposed to at least four types of abuse/violence/neglect.
Although carers had a strong sense of reward, nearly one-half reported that they were unlikely or very unlikely to care for another child in the future, with relative/kinship carers being more likely than foster carers to express this view. Carers reporting higher levels of care challenges and a lack of support were also less likely to be a carer again.
Carer wellbeing and family relationships
Overall, carers reported positively on their wellbeing and family relationships. The majority of carers rated their health as "excellent" or "very good", with relatively high levels of vitality and mental health. While the majority of carers were highly satisfied with their life, some carers fared less well. Male carers rated more poorly than female carers on their general health, and male carers were also less satisfied with life, and less satisfied with family relationships. Relative/kinship carers also rated less well on their general health compared to foster carers and almost one in four relative/kinship carer had a disability or medical condition that was likely to last for six months or more.
Although relative/kinship carers provided lower ratings of life satisfaction when compared to foster carers, they were more satisfied with their own relationship with the study child, their partner's relationship with the study child, and how the study child got along with the other children in the household. This is likely to reflect the established relationships and bond with the study child.
Significant care challenges and lack of support were found to be associated with poorer carer wellbeing and family relationships for carers.
Conclusion
This report has examined the characteristics of foster and relative/kinship carers and of study children, together with carers' experiences of the circumstances relating to how the study children came into their care and their experience of service use, support and training received in carrying out their caring role. It has also examined the rewards and challenges of being a carer and the wellbeing of carers and their family relationships, including those concerning the study children, and the link between their wellbeing and family relationships and their care experiences.
Overall, while many carers reported that they were coping well in their caring roles despite the challenging circumstances and complexities associated with caring for a child in an out-of-home-care placement, this study identified that there is the need to better inform and prepare carers for their role and to provide more support while children are in their care, given the variety of needs that are likely to emerge over time. While service provision and support clearly remains important for both foster and relative/kinship carers, the findings suggest that more may be required to assist relative/kinship carers in particular, in order to increase availability and their participation in and/or uptake of services/training. The results from this study also highlight positives emerging from the caring experience, with carers reporting that they could make a real difference to a child's life and that they find being a carer a rewarding undertaking.
1 Note that in New South Wales the OOHC system includes NGOs, and these NGOs drew the samples following the same procedure but with the care type undefined.
2 The survey did not ask about the study child's prior maltreatments associated with parents and it is not possible to assess whether the lack of contact for some study children was linked with such a history.
1. Introduction
This report presents important findings from the Working Together to Care for Kids Survey (WTCKS), a collaborative project between the Australian Institute of Family Studies (AIFS) and the Australian Government Department of Social Services (DSS). The primary objective of this survey is to better understand the characteristics and needs of the foster and relative/kinship carers of the vulnerable children who are living in out-of-home care in Australia. These findings can be used to better inform government policies and practices in support of these carers.
AIFS designed, developed and implemented a national survey, in consultation with DSS, as well as the study's working group that included at least one representative from each jurisdiction. The survey was conducted during September and November 2016 and entailed telephone interviews with 2,203 foster and relative/kinship carers.3 This section first provides some background against which the study was conducted and then outlines the structure of this report.
1.1 Background
There are significant numbers of Australian children who live in out-of-home care. According to the Australian Institute of Health and Welfare (AIHW), in their annual publication on child protection data, there were 46,448 children aged 0-17 years who were in out-of-home care (representing 8.6 per 1,000 Australian children) at 30 June 2016, compared to 37,648 children at 30 June 2011 (representing 7.3 per 1,000 children) (AIHW, 2017, 2012). The majority of the children at 30 June 2016 were living with foster or relative/kinship carers in home-based care arrangements: 39% in foster care, 49% in relative/kinship care (AIHW, 2017).4
The current study focuses on these two groups of formal carers: foster and relative/kinship carers. These carers have formal care arrangements that involve some form of legal or statutory child protection intervention, whereas informal care may occur in circumstances where a private arrangement is made without legal or statutory child protection intervention. Although the Australian jurisdictions vary in how these care types are defined and governed, they can broadly be described as follows:
Relative or kinship care involves placing a child or young person with a relative or someone they already know. A relative/kinship carer could be any of the following: a biological relative of the child; a person who is not a biologically related but who has a legal, social or other relationship with the child and/or birth parent(s); and/or a person from the child's or family's community (in accordance with their culture) (AIHW, 2017). In Indigenous communities, "kin" may also be someone who shares a cultural connection with the child (Bromfield & Osborn, 2007). While there may be a preference for out-of-home-care children to be placed with a family member or someone close to them whenever possible (i.e., in a relative/kinship care placement), sometimes this is not possible. Aboriginal and Torres Strait Islander children in out-of-home care are to be placed according to the Aboriginal and Torres Strait Islander Child Placement Principle developed over three decades ago, which was designed to place children with carers who can maintain their familial, cultural and community connection. Nevertheless, Arney, Iannos, Chong, McDougall, and Parkinson (2015) found that the Principle guided only a minority of placements for Aboriginal and Torres Strait Islander children.
Foster care is where a family or an individual care for other people's children in their own home and the caregiver is authorised by the state or territory to look after the children. Although the specific requirements to be a carer vary between jurisdictions, prospective carers must complete an assessment/accreditation process in order to be formally recognised as a foster carer in their jurisdiction and thereby be eligible to care for a child. For both foster care and relative/kinship care, the caregiver may be financially reimbursed (or offered financial reimbursement but decline the offer) by their state or territory (AIHW, 2017).
Much of the research on carers who look after children in out-of-home care focuses on specific states or territories. Rosier and Hunter (2016), in their audit review of research and evaluation projects on child protection between 2011 and 2015, observed that research in child protection, including that with a focus on carers, tended to be qualitative and based on small sample sizes. Indeed, more than half of the research projects between 2011 and 2015, and the majority of studies conducted earlier, were based on sample sizes fewer than 100. A study with a nationally representative and relatively large sample of carers was needed to provide a national picture of carers and understand their care experiences and needs.
The available research on foster and relative/kinship carers has highlighted a number of important issues, both in regards to the differences between these two types of carers, as well as their general views of and experiences within their caring role. An important point to note is that the perceptions and expectations of the role of carers of out-of-home-care children can vary considerably between various stakeholders - including government departments, child protection workers, the children in out-of-home care, the community in general, and carers themselves (Blythe, Halcomb, Wilkes, & Jackson, 2013). This can potentially make intervention or assistance difficult.
It has been reported that there is ambiguity about the role of the foster carer in the Australian community. The ambiguity is at least in part due to the complexity of the child protection system, including that it is administrated by government and non-government (NGO) organisations and also governed by legislation, policies and protocols that vary between each state and territory. And while there can be significant disagreement between foster carers themselves regarding their role, Blythe et al. (2013) found that female foster carers tended to perceive themselves as mothers to the long-term foster children in their care, but as foster carers for children in their short-term care. Furthermore, Schofield, Beek, Ward, and Biggart (2013) differentiated between foster carers who were able to move flexibly between being both a professional carer and a parent to a child in out-of-home care and others who struggled to manage different role expectations and demands; this again highlights the different ways in which carers can perceive their role and also the potential for this to change over time as well as issues related to the professional-personal structure of the carer role.
The foster care literature has indicated a number of challenges associated with fostering. For example, there can be emotional and psychological difficulties, particularly in regards to attachment issues with foster children after they have transitioned from their care (e.g., to a permanent placement or to be reunified with their birth parents). In addition, the complex needs and behavioural issues that are often associated with children in out-of-home care can have a negative impact on carers and their families. Some foster carers have also indicated that the role has placed them under financial strain, due to factors such as a lower capacity to engage in paid employment and inadequate state reimbursement (McHugh, 2006; Wilks & Wise, 2011). A survey conducted by Wilks and Wise (2011) of foster carers in Victoria also found a proportion of carers identified "system challenges" as a barrier in their caring roles, such as insufficient agency/department support and their frustration with the system.
On the other hand, foster carers have identified a number of rewards associated with fostering. These include feeling that they are making a difference in children's lives and seeing children in out-of-home care respond well to living in a safe and secure home. Furthermore, foster carers often view the role as an opportunity to "give back" and make a difference to the community, and may gain purpose and personal fulfilment as a result of doing so. There can also be a positive impact on the wider fostering family, by drawing its members closer together and encouraging growth and maturation in carers' birth children (McHugh et al., 2004; Wilks & Wise, 2011).
Research on relative/kinship carers indicates that economic disadvantage, stress, health issues and a lack of resources are issues commonly faced by relative/kinship carers (Bromfield, Higgins, Higgins, & Richardson, 2007; Dunne & Kettler, 2006). Economic disadvantage in relative/kinship families compared to foster care families has been consistently found in the literature - this is likely to be at least partly due to a higher proportion of relative/kinship carers being single parents and/or older. It has been suggested that these issues can negatively affect the caring capacity of these carers, in conjunction with the various and complex needs of the children in their care and managing family relationships (including with birth parents). Hence, it is important that support, interventions and training cater to the individual needs of relative/kinship carers. This could be achieved through consulting with carers and improving communication between carers and the relevant service professionals (Portengen & van der Neut, 1999; Waldman & Wheal, 1999; cf. Dunne & Kettler, 2006; Golding, 2004).
In addition, an Australian study of grandparent relative/kinship carers, which involved interviews with 55 service providers and policy-makers from New South Wales, South Australia and the Northern Territory, found that these carers are often lacking the timely and accessible information and support they require (valentine, Jenkins, Brennan, & Cass, 2013). The study concluded that this may impact on both their material and emotional wellbeing.
There is also some research evidence to suggest that carers are able to cope better with the demands of caring with appropriate service support. For example, data from a UK study of adolescents in foster care indicated that the levels of strain experienced by foster carers can be mitigated by enhanced support; for example, the regular availability of and assistance provided by the child's caseworker (Farmer, Lipscombe, & Moyers, 2005). Training may also be an important factor for carers, both initially and ongoing, to ensure that carers' expectations are managed and they feel equipped for their caring roles (Randle, Ernst, Leisch, & Dolnicar, 2016). For example, the results from a British study of foster carers found that those who undertook a counselling skills training course had greater confidence in their ability to look after children's mental health and emotional needs (Mosuro, Malcolm, & Guishard-Pine, 2014).
Current research on carers of out-of-home-care children indicates that both foster and relative/kinship carers have different and somewhat complex needs, which may not always be consistently met from a service provision and training perspective. A national study that investigates aspects such as their support needs, and their views and experiences, has been lacking. Australia, like many countries in the Western world, has been experiencing difficulties with the recruitment and retention of carers, and is increasingly reliant on older carers and former carers (Wilks & Wise, 2011). It is important to gain a greater understanding of what motivates these individuals to become carers and what could be done to better support them in their roles. Recognising the significant role that the carers play in shaping the lives and development of children in care, the Second Action Plan 2012-2015 of the National Framework for Protecting Australia's Children 2009-2020 (National Framework) (DSS, 2011, p. 6) stated:
The provision of support that is timely and responsive to the needs of carers and the children and young people they are caring for, and ongoing quality training and development, will help carers deliver the best care possible in often complex or challenging circumstances.
Meeting carers' support needs is now part of the national standards for improving the quality of care to children and younger people in care. In this context, the current study was conducted to better understand their needs, thoughts and motivations and, ultimately, enable support to be better targeted to these individuals.
1.2 Structure of this report
The next section outlines the methodology of the survey. Section 3 depicts characteristics of foster and relative/kinship carers. Circumstances surrounding the time that children in out-of-home care came to the carer's households are discussed in Section 4. Section 5 focuses on carers' experience of service support and training support. The two following sections (6 and 7) examine carers' views on motivations and challenges in providing their care to the vulnerable children and their wellbeing. The final section summarises the key findings of this report.
This report aims to provide a national picture of foster and relative/kinship carers of children in out-of-home care and bring together the multiple and complex challenges carers face, including those around services. This report does not provide findings at state and territory levels, given all the differences in carer services between states/territories such as child protection legislation, service eligibility and provision models.
3 Responding carers were from all of the Australian states and territories, with the exception of the Northern Territory.
4 There is some limitation in data comparability due to differences in the definition of placement types and reporting between states and territories, see Figure 5.3, AIHW (2017), pp.50 & 65.
2. Methodology
This study focuses on formal carers (foster and relative/kinship) who look after one or more out-of-home-care child under 18 years of age in their household. The sample of the study was drawn from carer registration databases across the states and territories (i.e., jurisdictions). This section outlines the target population on which the sample was based, sampling procedures, data collection, questionnaire design and fieldwork outcomes. It also outlines the data weighting procedures for the final sample to adjust for differential probability of sample selection.
2.1 The study population and sample
The population for this study was foster and relative/kinship carers who were registered as formal carers in state and territory departments responsible for child protection across Australia and had at least one child under 18 years of age in out-of-home care who was living with them at 31 December 2015. The population definition applied to all jurisdictions except the Northern Territory (the Northern Territory did not participate in the survey due to some legislative and administrative barriers.)
The sample selection process involved engaging with the study's Working Group representatives from each of the participating jurisdictions. Sample selection was household-based and stratified by jurisdiction and care type (foster carer households and relative/kinship carer households). The main sample process in the jurisdictions (except the Australian Capital Territory (ACT) and Tasmania) involved a randomly extracted sample from foster care and relative/kinship households at a ratio of seven in every ten of these carer households in their database. In New South Wales (NSW), the out-of-home-care system includes non-government organisations (NGOs), which drew samples using the same procedure but with the care type undefined. Given their small carer populations, all foster and relative/kinship households in the ACT and Tasmania were selected.
Each jurisdiction then sent a letter, in early to mid 2016, to the primary carers within the selected households informing them that their contact details may be divulged to a reputable research fieldwork agency for this study, and providing them with the opportunity to contact their jurisdiction within a specified time frame if they did not wish to be contacted for the study. A flyer outlining the purpose and other aspects of the study was sent with the letter. The proportion of carers who contacted their jurisdiction to advise that they did not wish to be contacted for the study was 2-4% across the four jurisdictions that provided this information.5
The sampling process was implemented slightly differently in Victoria due to the administrative requirements and privacy legislation in place in this jurisdiction; the main variation was that the Department of Health and Human Services (DHHS), Victoria, directly approached the carers and this was done by the selected fieldwork company (the Social Research Centre) on behalf of DHHS.
2.2 The survey content domains
The survey went through an extensive developmental process, which involved the research team at AIFS, DSS representatives and the Working Group, as well as the fieldwork company, the Social Research Centre (SRC), at the programming stage. The final survey instrument that was programmed for the main studies was comprised of the following modules:
Introduction (confirming who the qualifying respondent carer might be):
Screening (ascertaining the number of children currently in out-of-home care in the household and/or in care within the past six months);
Section A: The child in out-of-home care and household composition;
Section B: The carer's caring experience and child wellbeing;
Section C: Services and supports;
Section D: Motivations and challenges;
Section E: Carer wellbeing and family relationships; and
Section F: Demographics.
2.3 The fieldwork
The pilot study for the WTCKS was conducted in early August 2016 to test the survey questions and length as well as the effectiveness of the survey instrument. A total of 105 pilot interviews were completed, which led to further improvement in the instrument such as the clarity of some questions and survey flow. The main fieldwork period began in early September 2016 and concluded in early November 2016.
Carers who no longer had a child currently in their care as part of the out-of-home-care system but had done so in the past six months could still be considered in-scope for the survey. Carer interviews were terminated if it was discovered the respondent had not been a formally registered primary carer of at least one child aged under 18 (in either a foster or relative/kinship care arrangement) in the past six months. This was due to the consideration of difficulties in recalling information about the child and other information such as service use if the child had left more than six months ago. If the respondent had cared for more than one child in the past six months, a random selection process was applied to identify a "study child", who would be the reference child for several questions throughout the survey. This meant that the age of each child was recorded and one was selected at random, with preference given to the child/children who were currently in care, if applicable.
The SRC made contact with 5,275 carers. The final sample size was 2,203 interviews, representing 42% of the selected sample members. The numbers of interviews across participating jurisdictions by care type are shown in Table 2.1. A relatively small proportion (n = 151 or 7%) of interviews were conducted with carers who did not currently have a child in their care. The average interview duration was 33 minutes.
| Strata | Final achieved interviews n (%) |
|---|---|
| NSW NGO* | 411 (18.7) |
| NSW Kinship | 384 (17.4) |
| NSW Foster | 236 (10.7) |
| NSW total | 1,031 (46.8) |
| Vic. Kinship | 266 (12.1) |
| Vic. Foster | 154 (7.0) |
| Vic. total | 420 (19.1) |
| Qld Kinship | 128 (5.8) |
| Qld Foster | 235 (10.7) |
| Qld total | 363 (16.5) |
| SA Kinship | 76 (3.4) |
| SA Foster | 65 (3.0) |
| SA total | 141 (6.4) |
| WA Kinship | 102 (4.6) |
| WA Foster | 73 (3.3) |
| WA total | 175 (7.9) |
| Tas. Kinship | 20 (00.9) |
| Tas. Foster | 20 (0.9) |
| Tas. Total | 40 (1.8) |
| ACT Kinship | 20 (0.9) |
| ACT Foster | 13 (0.6) |
| ACT total | 33 (1.5) |
| Total | 2,203 (100) |
Note: * The care type was unavailable for responding carers from NSW NGOs. The care type was derived based on the carer's relationship to the child in out-of-home care.
Table 2.2 shows the details of call outcomes. The number of refusals was small. The numbers not leading to an interview were typically due to non-contacts (e.g., no answer, answering machines or disconnected phone services).
| Call outcome | n (%) | Notes |
|---|---|---|
| Interviews | 2,203 (42) | |
| Refusals | 319 (6) | |
| Appointments | 177 (3) | Appointments were made but did not lead to actual interviews. |
| Out-of-scope* | 126 (2) | Predominantly involved sample members who had not been caring for a child in a foster or relative/ kinship care placement within the past six months. |
| Non-contacts** | 1,507 (29) | Predominantly involved calls where there was no answer or the call went straight to an answering machine. |
| Unusable sample*** | 873 (17) | Of the unusable sample, 75% (n = 657) involved the number being disconnected/receiving a Telstra message. |
| Other**** | 70 (1) | Predominantly involved the carer identifying a LOTE (Language other than English) as their first language. |
| Total initiated sample | 5,275 (100) |
The cooperation rate is another way of considering response rate. Based on the known call outcomes, it is defined as the total number of interviews as a proportion of the total number of interviews plus all refusals. The cooperation rate for the main data collection was 87%. Table 2.3 shows that the cooperation rate varied somewhat across the stratification criteria of carer type and jurisdiction, with the main difference being the higher cooperation rate for Tasmania, which is likely due to its small sample size. The cooperation rate was also slightly higher in foster carer and NGO households in comparison to relative/kinship carer households.
| Stratification variable | Interviews (n) | Refusals (n) | Cooperation rate (%) |
|---|---|---|---|
| Carer type | |||
| Relative/kinship | 996 | 179 | 85 |
| Foster | 796 | 90 | 90 |
| NGO | 411 | 50 | 89 |
| Jurisdiction | |||
| NSW | 1,031 | 142 | 88 |
| Vic. | 420 | 59 | 88 |
| Qld | 363 | 60 | 86 |
| SA | 141 | 22 | 87 |
| WA | 175 | 29 | 86 |
| Tas. | 40 | 1 | 98 |
| ACT | 33 | 6 | 85 |
| Total | 2,203 | 319 | 87 |
2.4 Data weighting
As described above, the cooperation rates varied across the participating jurisdictions and care types. A data weighting procedure was applied in an attempt to adjust for differential responses and differential coverage (e.g., oversampling of small jurisdictions). Jurisdiction, care type (foster care, relative/kinship care, care type unspecified) and SEIFA Index of Relative Socio-Economic Disadvantage (quintiles) were used in the final weighting. The results of logistic regression of having a completed interview with three variables (jurisdiction, care type and quintile of the index of relative socio-economic disadvantage) suggest that the three variables were linked with the likelihood of participation in the study. For example, carers in the top quintile of the index of relative socio-economic disadvantage were more likely than those in the bottom quintile to participate in the study.6
Survey weights were computed using the ipfweight algorithm (also known as iterative proportional fitting or raking) in Stata (Mannheim).7 This procedure performs a stepwise adjustment of survey sampling weights to achieve known population margins. The computed weights ranged from 0.7 to 1.79.
5 The data on the extent to which carers did not wish to be part of the study for ACT, NSW and Vic. were not available. For NSW, the NGOs sent out the letters but accurate/complete information could not be traced back.
6 While other variables such as age and gender may be important for data weighting, the variables were not provided by all the participating jurisdictions.
7 See <ideas.repec.org/c/boc/bocode/s457353.html> for further information. Retrieved 9/1/2017.
3. Characteristics of carers
This section focuses on the demographic characteristics of the carers who participated in the survey, including their financial circumstances. Data on the number and age of children in care is also provided.
3.1 Care type and gender of carers
For the purpose of survey stratification, care type as reported by jurisdictions was used. However, respondents who were recruited from the database of NGOs did not have a care type. A small number of respondents (n = 20) were interviewed but not originally listed as a primary carer of children in the household.
For these reasons, care type in this report was derived according to the respondent's report of their relationship with the study child.8
As shown in Figure 3.1:
- forty-seven per cent were foster carers; and
- fifty-three per cent were relative/kinship carers.
The distribution of the two groups of carers in the study is similar to the data of out-of-home care reported by AIHW. AIHW (2015) suggests that of carer households with a placement during 2012-13, 47% were foster carer households and 53% were relative/kinship carer households.
Among relative/kinship carers:
- the majority (66%) were grandparents to the study child in their care (including a small number of great-grandparents);
- twenty-seven per cent were uncles or aunties to the study child; and
- the remainder (7%) were other relatives (e.g., cousins, siblings and so on). (These results are not shown in Figure 3.1.)
The great majority of carers (88%) were female, and only 12% were male. Gender distributions were similar between the two types of carers, with 12% of males among foster carers and 13% among the relative/kinship group.
The distributions of foster and relative/kinship carers were similar between men and women:
- Forty-five per cent of male carers and 48% of female carers were foster carers.
- Relative/kinship carers accounted for 55% and 42% of male and female carers respectively. (These results are not shown in Figure 3.1.)
Figure 3.1: Carers by care type and by gender

Note: Percentages are based on weighted data.
3.2 Children in out-of-home care
Table 3.1 shows the age and gender of study children as well as the number of children in out-of-home care that carers were looking after at the time of interview and in the six months prior to the interview.
- The mean age of study children was 9 years old.
- The most common age group of study children was 5-11 years (44%), followed by under five years (23%).
- Eighteen per cent were 12-14 years and 15% were 15-18 years.9
- The mean ages of study children for the two groups of carers were similar.
- There were slightly more boys than girls among study children (52% vs 48%), and this pattern applied to both groups of carers.
- The mean age of study children cared for by male carers was older than that of study children with female carers. For example, 18% of study children looked after by male carers were 15 years old and over, compared to 14% of those children in the care of female carers, while 24% of study children in the care of female carers were under five years, compared to 17% among those who were looked after by male carers.
The distributions of the number of children in out-of-home care who were looked after by carers at the time of interview and in the six months prior to the interview were broadly similar, with one child being the most common.
- At the time of interview, just under one-half of carers looked after one child in out-of-home care (45%) and just over one-quarter (27%) had two children in their care. One-fifth (22%) of carers had three or more children and a small proportion (7%) reported that a child had left within the past six months and they did not have any children in out-of-home care who were living with them at the time of interview.
- Relative/kinship carers were more likely to have one child in their care compared with foster carers (50% vs 37% at the time of interview). Conversely, multiple children in out-of-home care were more common among foster carers than they were for relative/kinship carers.
- Formally caring for a large number of children in out-of-home care (four or more) was slightly more common for female carers than for male carers (10% vs 7%) and the proportion of children who had left was slightly higher for male carers than for female carers (8% vs 7%). Nevertheless, the broader patterns were similar between male and female carers.
| Care type | Carer's gender | |||||
|---|---|---|---|---|---|---|
| Foster carers (%) | Relative/kinship carers (%) | Males (%) | Females (%) | All a (%) | ||
| Age of study child | ||||||
| 0-4 | 22.8 | 23.4 | 17.2 | 24.0 | 23.1 | |
| 5-11 | 42.5 | 46.1 | 47.2 | 44.0 | 44.4 | |
| 12-14 | 19.1 | 16.3 | 17.4 | 17.7 | 17.7 | |
| 15-18 | 15.6 | 14.1 | 18.2 | 14.3 | 14.8 | |
| Total | 100.0 | 100.0 | 100.0 | 100.0 | 100.0 | |
| Mean | 9.0 | 8.8 | 9.5 | 8.8* | 8.9 | |
| SD | (5.2) | (4.3) | (4.6) | 4.8 | 4.8 | |
| Gender of study child | ||||||
| Boys | 52.9 | 50.6 | 56.1 | 51.0 | 51.6 | |
| Girls | 47.1 | 49.4 | 43.9 | 49.0 | 48.4 | |
| Total | 100.0 | 100.0 | 100.0 | 100.0 | 100.0 | |
| Whether study child is indigenous | ||||||
| Yes | 30.7 | 31.9 | 30.2 | 31.6 | 31.4 | |
| No | 69.3 | 68.1 | 69.8 | 68.4 | 68.6 | |
| Total | 100.0 | 100.0 | 100.0 | 100.0 | 100.0 | |
| Number of children in out-of-home care currently in household | *** | *** | ||||
| 0 | 7.8 | 6.0 | 8.2 | 6.6 | 6.8 | |
| 1 | 38.6 | 50.1 | 45.3 | 44.5 | 44.6 | |
| 2 | 28.2 | 25.8 | 26.0 | 27.1 | 26.9 | |
| 3 | 13.7 | 11.3 | 14.9 | 12.1 | 12.5 | |
| 4+ | 11.7 | 6.8 | 5.7 | 9.6 | 9.1 | |
| Total | 100.0 | 100.0 | 100.0 | 100.0 | 100.0 | |
| Number of children in out-of-home care in household currently and in last 6 months | *** | *** | ||||
| 1 | 34.1 | 49.4 | 45.3 | 41.6 | 42.1 | |
| 2 | 27.5 | 28.9 | 28.0 | 28.2 | 28.2 | |
| 3 | 17.9 | 13.0 | 17.3 | 15.0 | 15.3 | |
| 4+ | 20.6 | 8.8 | 9.4 | 15.1 | 14.4 | |
| Total | 100.0 | 100.0 | 100.0 | 100.0 | 100.0 | |
| Number of carers b | 1,196 | 1,005 | 267 | 1,935 | 2,203 | |
Notes: Percentages and means are based on weighted data and sample sizes on unweighted data. For each variable relating to the children, a design-based chi-square test was used to assess statistically significant difference between foster carers and relative/kinship carers, and between male and female carers (*p < .05; **p < .01; ***p < .001). Percentages may not total exactly 100.0% due to rounding. a Includes carers whose care type couldn't be ascertained or gender was missing. b Sample sizes varied slightly across variables due to non-responses to specific variables.
3.3 Selected characteristics of carers
The selected socio-demographic characteristics of carers are presented in Table 3.2).
- The mean age of carers was 53 years. Nearly one-half were 50-64 years old, and less than one-quarter were aged in their 40s. There were more carers who were aged 65 years or older than there were under 40 years old (15% vs 12%). It is also worth noting that 6% of carers were aged 70 years and over (data not shown in the table).
- The majority of carers (62%) were living with a partner.
- The proportion of carers who were Indigenous was 12%. Whereas the percentage of Indigenous people within the national population is 3%, based on the 2011 Census (ABS, 2013).
- One-half of carers did not have any post-school qualification and four in ten did not complete secondary school. Less than one-fifth had a degree or higher qualification, and one-third had another post-school qualification (i.e., lower than a degree).
- Of carers under 65 years old, more than one-half (56%) were not in paid work, and part-time employment was more common than full-time employment, with 25% and 19% in part-time and full-time employment, respectively.
Foster and relative/kinship carers differed in socio-demographic characteristics.
- Relative/kinship carers were older than foster carers (mean age: 54.5 years vs 51.4 years). Nearly one-fifth of relative/kinship carers were 65 years old or older, compared to one-tenth of foster carers. This reflects the fact that most relative/kinship carers were grandparents to the children in their care.
- Relative/kinship carers were less likely to live with a partner than foster carers (58% vs 67%).
- Relative/kinship carers were more likely than foster carers to be Indigenous (16% vs 8%), but slightly less likely to be born overseas (13% vs 17%).
- Lower educational attainments (i.e., non-completion of secondary school) were more common among relative/kinship carers than foster carers. This is partly due to the differential age profiles between the two groups - foster carers being younger, on average, by about three years. There was also a lower employment rate among relative/kinship carers aged under 65 years.
- There were also apparent differences between male and female carers in some characteristics.
- Male carers were older than female carers (54.7 years vs 52.8 years). The proportion of those who were aged 65 years and older was 21% among male carers, compared to 14% of female carers.
- Male carers had a higher level of education than female carers. For example, a higher proportion of male carers than female carers had a degree or higher qualification (23% vs 17%). The gender difference in education was not statistically significant, due to the small sample of male carers.
- Male carers under 65 years old were more likely than female carers to be employed (56% vs 43%), most commonly on a full-time basis (46% vs 16%).
- In addition, a higher proportion of male carers than female carers lived with a partner (77% vs 60%).
| Care type | Carer's gender | ||||
|---|---|---|---|---|---|
| Foster carers (%) | Relative/kinship carers (%) | Males (%) | Females (%) | All a (%) | |
| Age | |||||
| Under 40 years | 11.5 | 12.5 | 10.8 | 12.2 | 12.1 |
| 40-49 | 31.8 | 16.0 | 17.4 | 24.4 | 23.5 |
| 50-64 | 46.0 | 52.4 | 51.4 | 49.0 | 49.3 |
| 65+ | 10.8 | 19.1 | 20.5 | 14.4 | 15.2 |
| Total | 100.0 | 100.0 | 100.0 | 100.0 | 100.0 |
| Mean | 51.4 | 54.5*** | 54.7 | 52.8* | 53.0 |
| SD | 10.9 | 11.1 | 11.3 | 11.2 | 11.2 |
| Educational attainment | *** | ||||
| Degree+ | 24.7 | 11.5 | 23.2 | 17.0 | 17.7 |
| Other post-school qualification | 35.3 | 30.1 | 38.1 | 31.9 | 32.6 |
| Year 12 | 10.3 | 8.2 | 5.4 | 9.7 | 9.2 |
| Year 11 or lower | 29.8 | 50.2 | 33.3 | 41.4 | 40.4 |
| Total | 100.0 | 100.0 | 100.0 | 100.0 | 100 |
| Employment status,carers aged under 65 years | *** | *** | |||
| Full time | 21.3 | 17.0 | 46.2 | 15.6 | 19.1 |
| Part time | 27.2 | 23.3 | 10.1 | 27.3 | 25.3 |
| Not employed | 51.5 | 59.7 | 43.7 | 57.1 | 55.5 |
| Total | 100.0 | 100.0 | 100.0 | 100.0 | 100 |
| Whether living with a partner | *** | *** | |||
| Yes | 67.3 | 57.6 | 77.4 | 60.0 | 62.2 |
| No | 32.7 | 42.4 | 22.6 | 40.0 | 37.8 |
| Total | 100.0 | 100.0 | 100.0 | 100.0 | 100 |
| Indigenous status | *** | ||||
| Indigenous | 7.7 | 15.8 | 10.1 | 12.3 | 12 |
| Non-indigenous | 92.3 | 84.2 | 89.9 | 87.7 | 88 |
| Total | 100.0 | 100.0 | 100.0 | 100.0 | 100 |
| Country of birth | ns | ||||
| Australia | 82.7 | 86.6 | 84.9 | 84.7 | 84.8 |
| Overseas | 17.3 | 13.4 | 15.1 | 15.3 | 15.2 |
| Total | 100.0 | 100.0 | 100.0 | 100.0 | 100 |
| Number of carers b | 1,196 | 1,004 | 267 | 1,935 | 2,203 |
Notes: Percentages and other figures are based on weighted data and sample sizes on unweighted data. For each characteristic variable, a design-based chi-square test was used to assess statistically significant difference between foster carers and relative/kinship carers, and between male and female carers (*p < .05; **p < .01; ***p < .001). Percentages may not total exactly 100.0% due to rounding. a Includes carers whose care type couldn't be ascertained or gender was missing. b Sample sizes varied slightly across variables due to non-responses to specific variables.
Table 3.3 depicts carers' financial circumstances. Financial circumstances were measured using annual gross household income, housing tenure, number of financial hardships experienced in the past year, and self-assessed financial situation. The number of financial hardships was measured by asking carers whether they had experienced any of eight specific events in the last 12 months due to a shortage of money, with the events including incidences such as inability to pay utility bills, car registrations, rent or mortgage on time; inability to heat the home; missing meals; selling something; or seeking financial assistance from family/friends or a welfare/community agency. The table shows the extent to which carers experienced none, one hardship or multiple hardships.
Carers' assessments of their financial circumstances were based on their responses to being asked how they felt that they and their family were getting along financially, given their current needs and financial responsibilities. Six response options were provided (prosperous, very comfortable, reasonably comfortable, just getting by, poor and very poor). The table shows responses in four groups - prosperous or very comfortable, reasonably comfortable, just getting by, poor or very poor.
- Just over one-half of carers (54%) had an annual gross household income under $60,000, with over one-fifth under $30,000. One-quarter of carers reported that their annual gross household income was between $60,000 and $99,999, while just one-fifth had a gross household income consisting of $100,000 or more.10
- How do carers' household income levels compare with Australian households overall? To address this question, the data collected from the Household, Income and Labour Dynamics in Australia (HILDA) survey11 in 2014 were analysed. The results suggest that carers had a lower household income compared with overall Australian households.
- Of the households in HILDA data collected in 2014, 16% had an annual gross household income under $30,000 (here called "low income"), while 37% had a level of annual gross household income of at least $100,000 (here called "high income"). By contrast, a higher proportion of carers was in the low household income group (22%) and a lower proportion was in the high household income group (21%).
- In terms of housing, one-quarter of carers reported that they owned their home outright and 40% were purchasing. Close to one-quarter were renting privately and one-tenth were on public housing. The proportion of carers who were living in public housing was higher than for general households in Australia according to HILDA 2014 (11% vs 4%). This is consistent with the lower level of household income among carers than generally across Australian households.
- The majority of carers reported that they did not experience any of the specified financial hardship events in the past 12 months. One-tenth of carers experienced one form of hardship while 14% reported experiencing at least two hardships. HILDA also collected this data and their results were similar to the reports of the carers.12
- Although the results above suggest that carers were financially not as well-off as Australian households overall, few carers considered that they and their families were poor or very poor (less than 1%). Instead, the most common response was that they were reasonably comfortable (58%), followed by feeling that they were just getting by (25%). Seventeen per cent of carers said they were prosperous or very comfortable. HILDA also collected this data and the responses to this question in HILDA 2014 were similar to those by carers in this study.13
Foster carers and relative/kinship carers differed in their financial circumstances. With each measure, relative/kinship carers were less well-off financially than foster carers.
- A higher proportion of relative/kinship carers than foster carers was in the lowest category of annual gross household income (< $30,000) (28% vs 16%), while a higher proportion of foster carers than relative/kinship carers was in the top category of household income ($100,000+) (30% vs 13%).
- Higher proportions of relative/kinship carers than foster carers were in private rental (26% vs 20%) or in public housing (15% vs 5%).
- Relative/kinship carers were more likely than foster carers to experience multiple financial hardships (19% vs 8%).
- Compared with foster carers, relative/kinship carers were more likely to report that they and their families were financially just getting by, poor or very poor (33% vs 17%).
The difference in financial circumstances between male and female carers was less apparent than that between foster and relative/kinship carers.
- Compared with male carers, a higher proportion of female carers was in the lowest category of annual gross household income (less than $30,000) (23% vs 17%) and a lower proportion was in the highest category ($100,000+) (20% vs 28%).
- Male and female carers were similar in terms of housing tenure, their experience of financial hardships and self-assessed financial situation.
| Care type | Carer's gender | ||||
|---|---|---|---|---|---|
| Foster carers (%) | Relative/kinship carers (%) | Males (%) | Females (%) | All a (%) | |
| Annual gross household income | *** | * | |||
| < $30 k | 16.0 | 27.7 | 17.2 | 22.7 | 22.0 |
| $30-59 k | 26.5 | 37.8 | 28.0 | 32.8 | 32.2 |
| $60-99 k | 27.8 | 22.0 | 27.0 | 24.6 | 24.9 |
| $100+ k | 29.8 | 12.5 | 27.7 | 19.9 | 20.9 |
| Total | 100.0 | 100.0 | 100.0 | 100.0 | 100.0 |
| Housing tenure | *** | ||||
| Own outright | 25.0 | 24.7 | 27.2 | 24.5 | 24.9 |
| Purchasing | 48.5 | 31.9 | 42.8 | 39.3 | 39.7 |
| Private rental | 19.6 | 26.4 | 19.7 | 23.7 | 23.2 |
| Public housing | 5.4 | 15.1 | 9.1 | 10.8 | 10.5 |
| Other | 1.4 | 1.9 | 1.3 | 1.7 | 1.7 |
| Total | 100.0 | 100.0 | 100.0 | 100.0 | 100.0 |
| Number financial hardships experienced in the past year | *** | ||||
| None | 83.5 | 70.7 | 75.9 | 76.9 | 76.8 |
| One | 8.4 | 10.9 | 9.3 | 9.7 | 9.7 |
| Two or more | 8.1 | 18.5 | 14.8 | 13.4 | 13.6 |
| Total | 100.0 | 100.0 | 100.0 | 100.0 | 100.0 |
| Self-assessed financial circumstances | *** | ||||
| Prosperous/very comfortable | 22.3 | 11.5 | 13.8 | 17.0 | 16.6 |
| Reasonably comfortable | 60.5 | 55.8 | 60.0 | 57.8 | 58.1 |
| Just getting by | 17.0 | 31.4 | 25.8 | 24.4 | 24.5 |
| Poor, very poor | 0.3 | 1.4 | 0.5 | 0.9 | 0.8 |
| Total | 100.0 | 100.0 | 100.0 | 100.0 | 100.0 |
| Number of carers b | 1,196 | 1,004 | 267 | 1,935 | 2,203 |
Notes: Percentages and other figures are based on weighted data and sample sizes on unweighted data. For each characteristic variable, a design-based chi-square test was used to assess statistically significant differences between foster carers and relative/kinship carers, and between male and female carers (*p < .05; **p < .01; ***p < .001). Percentages may not total exactly 100.0% due to rounding. a Includes carers whose care type couldn't be ascertained or gender was missing. b Sample sizes varied slightly across variables due to non-responses to specific variables.
3.4 Summary
Among the responding carers, a slightly higher proportion were relative/kinship carers (53%) as compared to foster carers (47%), with the great majority of carers being female in both groups (87% and 88% respectively). The majority of relative/kinship carers (66%) were grandparents to the study children. The distribution of the two care types was similar to the national data on carers in the child protection systems across Australia (AIHW, 2015).
Carers were 53 years old on average, with nearly one-half aged 50-64 years of age, and with a further 12% of carers aged 65 years or older. A small proportion of carers (6%) was aged 70 years or older. Most carers had no post-school qualifications, including four in ten who had not completed secondary education, and more than half of the carers under 65 years of age were not in paid employment. There were some differences in the socio-demographic characteristics of foster carers and relative/kinship carers, with the latter group reporting lower educational attainments. They were also more likely to be older and to be from an Aboriginal or Torres Strait Islander background but less likely to live with a partner. When considering both carer groups, male carers were more likely to be older than female carers and were more likely to live with a partner, report higher educational attainment and be in paid employment.
The mean age of the study children was 9 years, with similar mean ages for the two carer groups and slightly more male than female children among the study children. More than four in ten study children were of primary school age (5-11 years) and close to one-quarter were pre-school aged (under 5 years).
The data showed that the majority of carers had an annual gross household income of less than $60,000, while one-fifth of carers relied on less than $30,000. Carers had lower levels of annual gross household income compared to general Australian households. Furthermore, a greater proportion of carers lived in public housing compared to the general population, according to HILDA. Although the data suggests that carers were not as financially well-off as Australian households, most carers reported themselves to be "reasonably comfortable". Of note, however, compared to foster carers, relative/kinship carers were more likely to have low annual gross household incomes, to live in private rental or public housing and to report experiencing financial hardship.
8 For two carers, care type could not be determined.
9 The survey was meant to focus on carers with children under 18 years in out-of-home care; however, eight carers with a child who had just turned 18 were included in the survey.
10 Gross household income includes income from all sources (e.g., wages, pensions, income supports, allowances, etc.).
11 The HILDA project was initiated and is funded by the Australian Government Department of Social Services (DSS) and is managed by the Melbourne Institute of Applied Economic and Social Research (Melbourne Institute). The findings and views reported in this paper, however, are those of the authors and should not be attributed to either DSS or the Melbourne Institute.
12 It should be noted that HILDA collected this data in a self-completed questionnaire from all respondents aged 15 years and older. The HILDA sample is younger than the sample of carers in this study. The mean age of the HILDA sample in 2014 was 45 years, compared to 53 years for carers in this study.
13 See Footnote 12 for differences between this study and HILDA in how this data were collected and the mean age of respondents.
4. Care experience
Children in out-of-home care have often experienced abuse, neglect or other traumatic events that can lead to severe consequences for their development and wellbeing, in addition to immediate harm (e.g., Frederico, Jackson, & Black, 2009). This complexity of children's prior experience and developmental needs can present significant challenges for carers. The survey assessed the carers' experiences from a range of aspects, including how the children came to be in their care, how long carers had looked after the study child and, in particular, the timing of knowing about the study child's prior history of abuse, neglect and problems at home as well as the child's developmental and health disorders.
4.1 Becoming the study child's carer
Carers were asked how the study child came into their care - whether they were approached by their jurisdictional department, by the study child's parents or family members, or had volunteered to look after the study child. Their responses are shown in Table 4.1.
- The most common response by carers was that they were approached by their jurisdictional department or agency (64%); the next most common response was having volunteered before any approach by a department or agency (29%).
- Over one-tenth (12%) reported that they were asked by the child's parents or family members to look after the child. A very small proportion said that the study child transitioned from a temporary care arrangement to a long-term arrangement in their care.
- Foster carers were more likely to report that they were approached by a department or agency compared to relative/kinship carers (76% vs 53%).
- A substantial minority of relative/kinship carers (20%) said that they were asked by the child's parents or family members to look after the child, which was much less commonly reported by foster carers (2%).
- A very small proportion of foster carers became the formal carer of the study child from a temporary arrangement, which is a pattern that does not apply to relative/kinship carers. On the other hand, for a small proportion of relative/kinship carers, the study child came into their care from a court order or via the study child's own request.
- Reports of male carers and female carers were similar regarding how the study child came into their care.
| Care type | Carer's gender |
All a | |||
|---|---|---|---|---|---|
| Foster carers (%) | Relative/kinship carers (%) | Males (%) | Females (%) | ||
| Approached by a department or agency | 76.2 | 52.8 | 61.5 | 64.2 | 63.9 |
| Volunteered before any approach by a department or agency | 22.6 | 34.4 | 32.8 | 28.3 | 28.9 |
| Influenced by participating in a Family Group Conference/planning meeting (WA only) | 0.1 | 0.0 | 0.0 | 0.1 | 0.1 |
| Approached by study child's parent(s) or family member(s) | 2.1 | 20.1 | 8.5 | 12.0 | 11.6 |
| Transitioned from respite/temporary care | 0.7 | - | 0.0 | 0.4 | 0.3 |
| Court order | - | 1.4 | 2.9 | 0.5 | 0.8 |
| Approached by study child him/herself | - | 1.5 | 0.8 | 0.8 | 0.8 |
| Other | 1.4 | 2.2 | 1.8 | 1.8 | 1.8 |
| Two or more reasons | 3.1 | 11.0 | 8.4 | 7.1 | 7.2 |
| Number of carers | 1,193 | 999 | 264 | 1,929 | 2,194 |
Notes: Percentages are based on weighted data and sample sizes on unweighted data. A small number of respondents who either refused or opted "Don't know" were excluded from the analysis (0.4%). Multiple responses and percentages may exceed exactly 100% in total. a Includes carers whose care type couldn't be ascertained or gender was missing.
Further analysis was carried out by dividing relative/kinship carers into two groups: grandparents and other relatives. The analysis indicates that how study children came into their care differed somewhat between the group groups (results not shown in Table 4.1):
- Grandparents were more likely than other relative/kinship carers to report that a department or agency approached them (56% vs 46%).
- Other relative/kinship carers were more likely than grandparents to report that one of the study child's parents or family members asked them to look after the child (29% vs 15%).
Only grandparents reported that that the study child was in their care as a result of a court order, none of the other relative/kinship carers reported this.
4.2 Number of times and duration of looking after study child
While relative/kinship carers would be likely to have known the study child before he/she came into their care, some foster carers may have also known their study child. Some carers may have looked after the study child previously. The extent to which the study child had lived with the carer previously is presented in Figure 4.1.
- The great majority of carers reported that the study child had only lived with them once, that is, the current episode (88%). Nine per cent reported that the study child had lived with them once previously and an even smaller proportion (4%) said that the study child had lived with them in two separate periods.
- Given the likelihood of having an established relationship with the study child, it is not surprising that a higher proportion of relative/kinship carers than foster carers reported that the study child had previously lived with them (14% vs 10%).
- Further analysis revealed that grandparent carers were more likely than other relative/kinship carers to have previously had the study child living with them (16% vs 11%).
- There was no gender difference among carers in whether carers had previously had the study child living with them.
Figure 4.1: Number of times that study child came to live in the household (including current episode), by care type and gender of carers
Note: Percentages are based on weighted data.
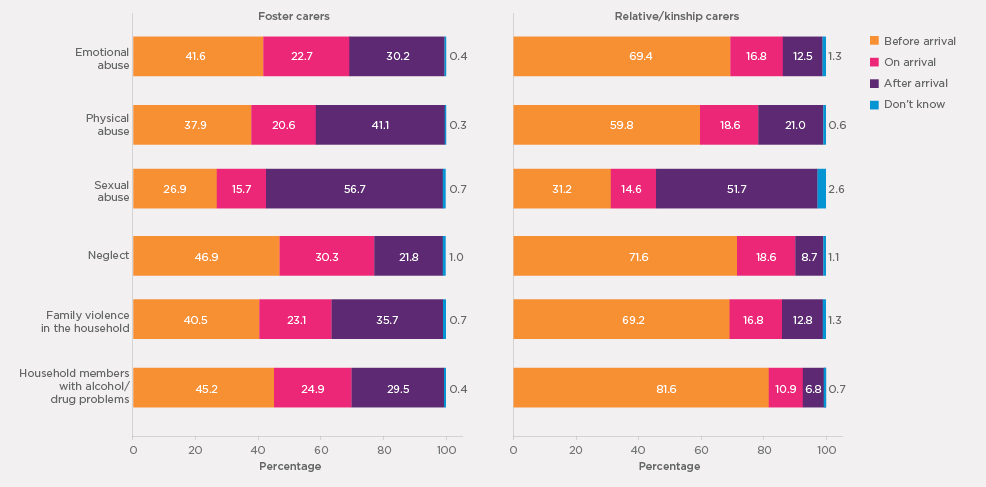
Figure 4.3 shows when carers learned of study children's previous experiences of abuse, neglect or problems at home by care type. Foster carers and relative/kinship carers differed somewhat in terms of when they were informed about the study child's past experiences.
- Regarding sexual abuse that study children experienced in the past, both foster and relative/kinship carers typically reported that they learned this information after their study child was living with them (57% and 52% respectively).
- Regarding the other five types of abuse/neglect experiences that study children had experienced in the past, foster carers were much more likely than relative/kinship carers to become aware of what happened after their study child was living with them:
- emotional abuse: 30% vs 13%
- physical abuse: 41% vs 21%
- neglect: 22% vs 9%
- family violence in the household: 36% vs 12%
- household member(s) with alcohol or drug use problems: 30% vs 7%.
Figure 4.3: The stage at which carers became aware of the study child's previous experiences of abuse and/or neglect, by care type
Note: Percentages are based on weighted data.
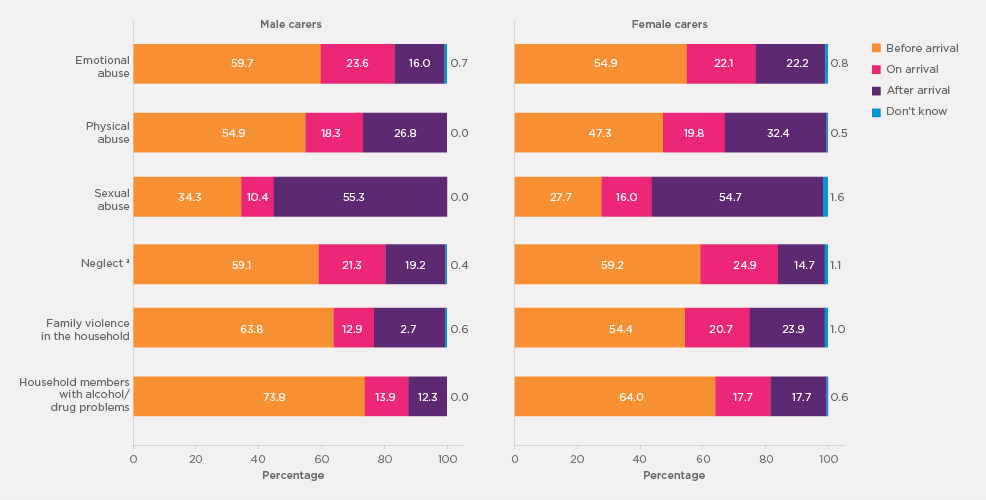
Figure 4.4 shows when carers learned of study children's experiences of abuse and/or neglect in the past by gender.
- A greater proportion of male carers than female carers reported learning about the study child's prior experiences before their arrival, except with neglect:
- emotional abuse: 60% vs 55%
- physical abuse: 55% vs 47%
- sexual abuse: 34% vs 28%
- family violence: 64% vs 54%
- alcohol/drug problems on the part of household members: 74% vs 64%.
Figure 4.4: The stage at which carers became aware of the study child's previous experiences of abuse and/or neglect, by carer gender
Note: Percentages are based on weighted data. a Base on a small number (n = 30)
Carers were asked to report on how they became aware of each indicator of the study child's abuse and/or neglect, that is, who provided the carer with the information. Carers' responses are presented in Table 4.5, which also shows results by care type and by gender of carers.
- In relation to each indicator of abuse and neglect, a caseworker or official was most commonly reported as the source of information for the carers (38-50%).
- The second most common responses were that carers knew, had witnessed or suspected it (25-46%), except in the case of sexual abuse (8%).
- The next two less common, but significant, sources were the study child themselves (9-33%) and the study child's family (11-19%).
- Of the six indicators of abuse and neglect, the study child as a source of information was the highest in relation to sexual abuse (33%), followed by physical abuse (27%), while it was 9-20% for the other forms.
- Small proportions of carers reported other sources (e.g., psychologist, found out by themselves) (5% or lower).
How carers became aware of the prior experiences of abuse and/or neglect of study children differed between the two types of carers.
Higher proportions of foster carers than relative/kinship carers reported that they were advised by a caseworker or other official (49-71% vs 18-28%), while relative/kinship carers were more likely to report that they had witnessed or suspected each form (13-75% vs 5-12%).
- The majority of foster carers reported that they were advised by a caseworker or other official (56-71%), but this was lower in the case of sexual abuse (49%). The second most common source reported was the study child themselves.
- Relative/kinship carers most commonly reported that they had witnessed or suspected the abuse and/or neglect experiences (44-75%), except for experiences of sexual abuse, which were more commonly disclosed by the study child (34%). Approximately one-quarter or fewer carers in this group reported that they became aware of the study child's abuse/neglect experiences from a caseworker or other official. Somewhat lower proportions of relative/kinship carers became aware of the child's experiences because of a disclosure from the study child but were more frequently told by another member of the child's family.
Male and female carers were similar in their reports of sources of knowledge about the study child's prior experiences.
| Emotional abuse | Physical abuse | Sexual abuse | Neglect | Family violence in the household | Household members with alcohol/drug use problems | |
|---|---|---|---|---|---|---|
| Foster carers | % | % | % | % | % | % |
| I knew the family and had witnessed or suspected it | 12.0 | 7.9 | 5.1 | 10.9 | 9.1 | 11.0 |
| A caseworker/other official | 59.6 | 56.3 | 49.3 | 70.9 | 67.3 | 70.3 |
| Study child told me | 22.1 | 29.4 | 31.9 | 12.4 | 17.9 | 13.1 |
| A family member of study child | 10.2 | 9.5 | 9.6 | 9.2 | 15.8 | 12.7 |
| I found it out | 6.9 | 5.6 | 12.2 | 5.0 | 1.2 | 0.8 |
| Psychologist | 2.2 | 2.7 | 6.4 | 2.1 | 2.1 | 1.8 |
| Other | 5.1 | 4.8 | 3.6 | 4.8 | 3.7 | 4.3 |
| Don't know | 1.3 | 1.4 | 0.0 | 1.1 | 0.4 | 0.7 |
| Number of carers | 697 | 498 | 136 | 865 | 745 | 827 |
| Relative/kinship carers | % | % | % | % | % | % |
| I knew the family and had witnessed or suspected it | 61.4 | 43.7 | 12.8 | 59.9 | 56.4 | 75.1 |
| A caseworker/other official | 22.4 | 24.6 | 17.9 | 28.3 | 22.8 | 19.6 |
| Study child told me | 17.3 | 24.2 | 33.7 | 8.3 | 13.5 | 6.3 |
| A family member of study child | 15.3 | 20.7 | 16.9 | 13.1 | 22.5 | 15.0 |
| I found it out | 2.5 | 2.4 | 11.0 | 2.4 | 0.4 | 0.3 |
| Psychologist | 1.2 | 3.8 | 7.7 | 0.4 | 0.5 | 0.5 |
| Other | 4.7 | 5.2 | 3.2 | 5.0 | 6.0 | 3.1 |
| Don't know | 1.0 | 1.8 | 0.0 | 0.6 | 0.3 | 0.8 |
| Number of carers | 517 | 330 | 62 | 648 | 609 | 75 |
| Male carers | % | % | % | % | % | % |
| I knew the family and had witnessed or suspected it | 38.8 | 21.7 | 10.4 | 33.1 | 42.5 | 49.8 |
| A caseworker/other official | 47.0 | 49.7 | 31.9 | 50.5 | 44.0 | 40.1 |
| Study child told me | 23.2 | 27.0 | 45.6 | 13.8 | 17.9 | 8.3 |
| A family member of study child | 12.2 | 7.8 | 4.2 | 11.2 | 14.7 | 10.7 |
| I found it out | 2.1 | 2.8 | 6.8 | 1.0 | 0.6 | 1.1 |
| Psychologist | 0.6 | 6.5 | 11.5 | 0.4 | 0.0 | 1.8 |
| Other | 4.1 | 5.7 | 3.5 | 4.7 | 5.5 | 2.4 |
| Don't know | 1.2 | 3.0 | 0.0 | 1.0 | 0.6 | 0.5 |
| Number of carers | 142 | 107 | 27 | 179 | 147 | 183 |
| Female carers | % | % | % | % | % | % |
| I knew the family and had witnessed or suspected it | 36.2 | 25.2 | 7.6 | 35.6 | 32.6 | 45.6 |
| A caseworker/other official | 40.4 | 40.2 | 38.4 | 49.6 | 44.2 | 42.8 |
| Study child told me | 19.2 | 26.9 | 30.5 | 9.9 | 15.4 | 9.6 |
| A family member of study child | 12.8 | 15.7 | 13.6 | 11.1 | 19.9 | 14.4 |
| I found it out | 5.1 | 4.3 | 12.5 | 4.1 | 0.8 | 0.4 |
| Psychologist | 1.9 | 2.7 | 6.1 | 1.4 | 1.4 | 1.0 |
| Other | 5.0 | 4.9 | 3.4 | 5.0 | 4.8 | 3.8 |
| Don't know | 1.1 | 1.4 | 0.0 | 0.8 | 0.3 | 0.9 |
| Number of carers | 1,073 | 722 | 171 | 1,335 | 1,209 | 1,400 |
| All | % | % | % | % | % | % |
| I knew the family and had witnessed or suspected it | 36.5 | 24.7 | 8.0 | 35.3 | 33.7 | 46.1 |
| A caseworker/other official | 41.2 | 41.4 | 37.5 | 49.7 | 44.1 | 42.5 |
| Study child told me | 19.7 | 26.9 | 32.6 | 10.4 | 15.7 | 9.4 |
| A family member of study child | 12.7 | 14.7 | 12.3 | 11.1 | 19.3 | 13.9 |
| I found it out | 4.7 | 4.1 | 11.7 | 3.7 | 0.8 | 0.5 |
| Psychologist | 1.7 | 3.2 | 6.9 | 1.3 | 1.2 | 1.1 |
| Other | 4.9 | 5.0 | 3.5 | 4.9 | 4.9 | 3.7 |
| Don't know | 1.1 | 1.6 | 0.0 | 0.8 | 0.4 | 0.8 |
| Number of carers | 1,215 | 829 | 198 | 1,514 | 1,356 | 1,583 |
Notes: Percentages are based on weighted data and sample sizes are unweighted. Multiple responses and the sum of column percentages may exceed 100% and statistical test is not applied.
4.4 Study children's developmental conditions before current placement
Carers were asked whether the study child had each of the following developmental conditions when he/she came to live with them: a) an intellectual disability; b) a physical disability; c) diagnosed behavioural problems (e.g., attention deficit hyperactivity disorder, conduct disorders); or d) diagnosed mental health conditions (e.g., depression, anxiety). Figure 4.5 shows responses to each condition by all carers; responses by the two groups of carers are presented in Figure 4.6 while the results by gender are shown in Figure 4.7.
- Eighteen per cent of carers reported that their study child had an intellectual disability and 15% reported their study children had a diagnosed behavioural problem, while a physical disability and mental health conditions were each reported by 12% of carers. Over one-third of carers reported that the study child had at least one type of developmental condition.
- While the two groups of carers were similar in their reports of the study child having a physical disability and being diagnosed with mental health conditions (11-13%), the reports differed in that:
- Foster carers were more likely than relative/kinship carers to indicate that their study child had an intellectual disability (20% vs 16%) and was diagnosed with behavioural problems (17% vs 12%).
- Overall, a higher proportion of foster carers than relative/kinship carers reported that the study child had at least one type of developmental condition (38% vs 32%).
- Male and female carers also differed somewhat regarding study children's developmental conditions.
- Male carers were more likely than female carers to report that the study child had been diagnosed with mental health conditions (17% vs 12%).
- Reports of the other three developmental conditions were similar between male and female carers.
- Overall, a slightly higher proportion of male carers than female carers reported that the study child has at least one developmental condition (38% vs 34%).
Figure 4.5: Proportions of carers reporting that the study child had prior developmental conditions
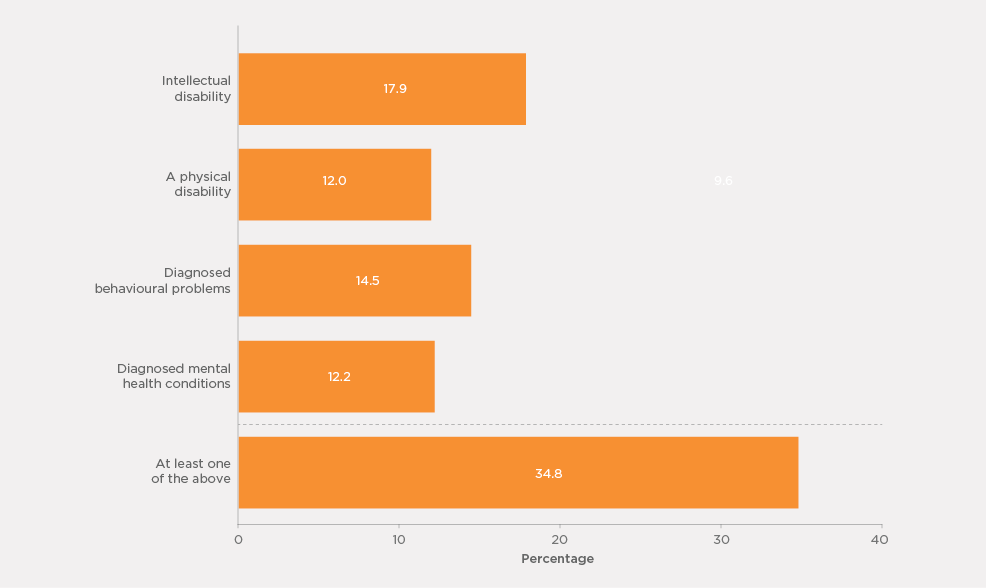
Notes: Percentages are based on weighted data. Responses "Don't know" (2-3% across the items) were included in the analysis in computing percentages of reporting of having the knowledge of the study child's developmental conditions.
Figure 4.6: Proportions of carers reporting that the study child had prior developmental conditions, by care type
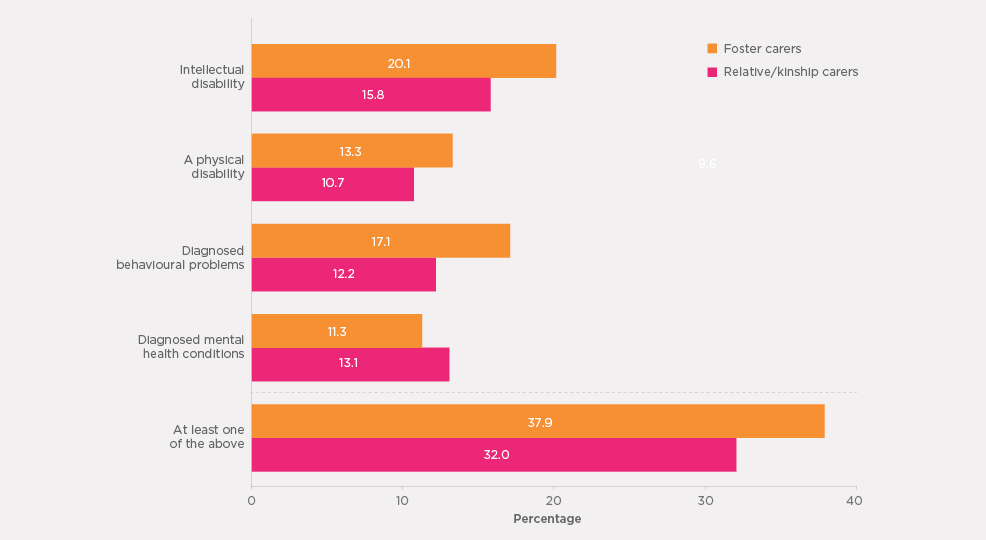
Notes: Percentages are based on weighted data. Responses of "Don't know" (2-3% across the items) were included in the analysis in computing percentages of reporting of having the knowledge of the study child's developmental conditions.
Figure 4.7: Proportions of carers reporting that the study child had prior developmental conditions, by carer's gender

Notes: Percentages are based on weighted data. Responses of "Don't know" (2-3% across the items) were included in the analysis in computing percentages of reporting of having the knowledge of the study child's developmental conditions.
Figure 4.8 shows when carers became aware of the study child's developmental conditions, and reports by the two groups of carers are presented in Figure 4.9.15
- For the physical disabilities and diagnosed behavioural problems of study children, carers were more likely to be aware of these conditions before the child arrived rather than after their arrival:
- physical disability: 46% before the child's arrival, 28% after the child's arrival; and
- diagnosed behavioural problems: 44% vs 34%.
- For study children diagnosed with mental health conditions, it was the opposite pattern - awareness was more likely after the study child's arrival than before their arrival:
- diagnosed mental health conditions: 33% before arriving, 44% after arriving.
- For study children with intellectual disabilities, similar proportions of carers reported that their awareness of the conditions came before or after the study child's arrival (38% and 39%).
The overall patterns in the timing of carers' awareness of study children's developmental conditions were similar between the two groups of carers. Relative/kinship carers were more likely than foster carers to report that they were aware before the study child's arrival, except when it came to diagnosed mental health conditions:
- intellectual disability: 44% of relative/kinship carers, 33% of foster carers;
- physical disability: 50% of relative/kinship carers, 44% of foster carers; and
- diagnosed behavioural problems: 47% of relative/kinship carers, 41% of foster carers.
Figure 4.8: Carers who knew study children's developmental conditions, when they became aware of the conditions
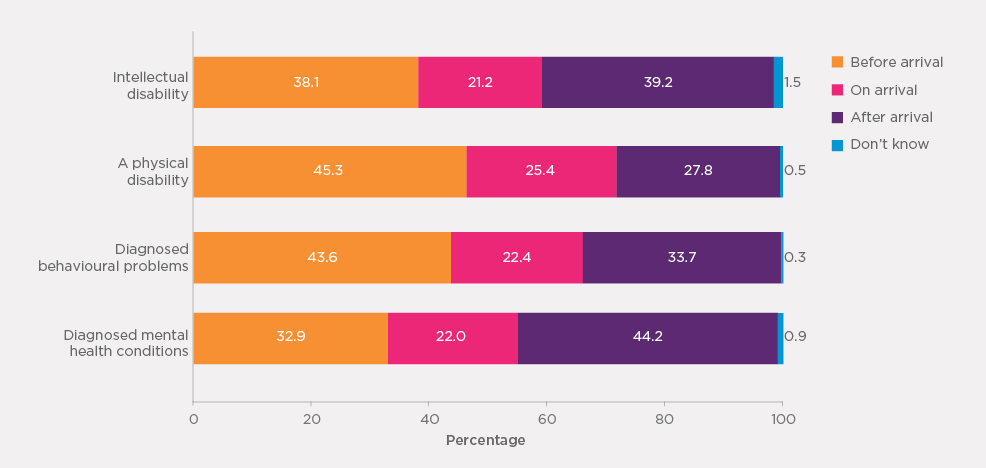
Note: Percentages are based on weighted data. Unweighted sample sizes: n = 263-392
Figure 4.9: Carers who knew of study children's developmental conditions, when they became aware of the conditions by care type
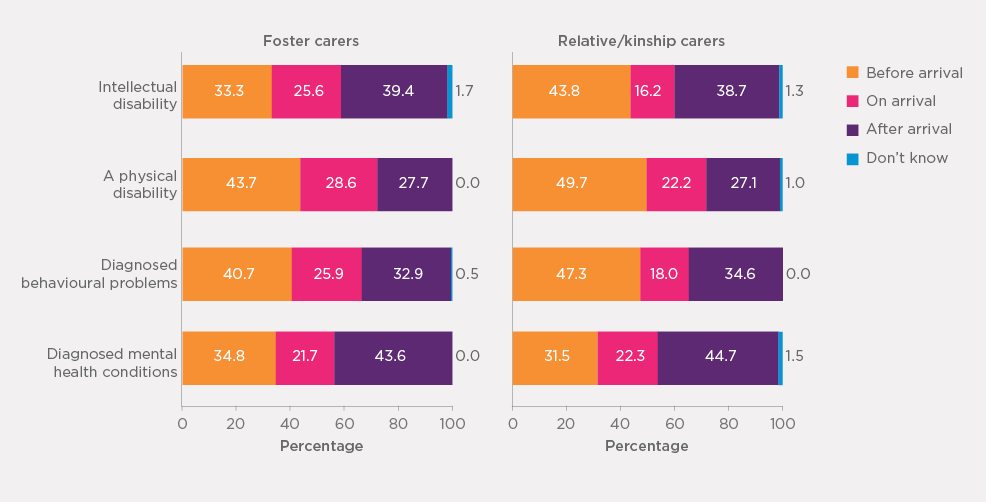
Note: Percentages are based on weighted data. Unweighted sample sizes: foster carers n = 132-235; relative/kinship carers, n = 109-156.
Table 4.6 shows how carers came to know about the study child's developmental conditions.
- Carers who were aware of their study child's developmental conditions most commonly reported that they found it out themselves (36-43%).
- Between 22% and 29% of carers said that they were told by a medical or health professional about the study child's conditions, and similar proportions (23-32%) mentioned a caseworker or other official as the source of information.
- A slightly less common source was that carers either witnessed or suspected the study child's developmental condition (16-23%).
- Nearly one-fifth (19%) said that they learned about their study child's intellectual disability from the child's school teachers, but school teachers were a much less common source of information for study children's other developmental conditions.
- There are similarities but also differences between foster and relative/kinship carers in their sources of information about the study children's developmental conditions.
- Although both groups of carers commonly reported that they detected the study child's developmental conditions themselves, this pattern is more apparent for relative/kinship carers than for foster carers.
- For foster carers, a caseworker or other official was more often mentioned as a source of knowledge in relation to the study child's conditions than self-observation, with the exception of an intellectual disability.
- In contrast, for relative/kinship carers, self-observation since living with the study child was most commonly reported as a source of knowledge of their study child's conditions.
- Medical/health professionals were another important source of knowledge about study children's developmental conditions for both groups of carers.
- Relative/kinship carers were more likely than foster carers to report that they had witnessed it (because they knew the child's family before the child was in their care).
| Intellectual disability | Physical disability | Diagnosed behavioural problem | Diagnosed mental health conditions | |
|---|---|---|---|---|
| Foster carers | % | % | % | % |
| I knew the family and had witnessed/suspected it | 8.0 | 12.7 | 8.4 | 4.3 |
| A caseworker/other official | 33.9 | 40.1 | 43.5 | 52.7 |
| School/school teacher | 16.4 | 0.6 | 7.1 | 5.2 |
| Medical/health professional | 22.9 | 24.1 | 24.3 | 24.1 |
| I detected it | 40.0 | 37.6 | 31.6 | 29.0 |
| A family member of study child | 0.8 | 0.0 | 1.1 | 0.0 |
| A previous carer of study child | 4.7 | 4.3 | 7.4 | 4.0 |
| Someone else told me | 10.2 | 8.0 | 13.9 | 10.5 |
| Don't know | 0.9 | 0.0 | 0.0 | 0.0 |
| Number of carers | 236 | 155 | 198 | 133 |
| Relative/kinship carers | % | % | % | % |
| I knew the family and had witnessed/suspected it | 28.8 | 34.1% | 30.2% | 24.2 |
| A caseworker/other official | 9.8 | 11.9 | 15.1 | 16.1 |
| School/school teacher | 21.6 | 3.7 | 11.8 | 7.1 |
| Medical/health professional | 20.2 | 24.6 | 26.6 | 33.6 |
| I detected it | 46.2 | 37.7 | 41.2 | 44.6 |
| A family member of study child | 1.5 | 1.7 | 4.3 | 2.8 |
| A previous carer of study child | 0.6 | 2.7 | 1.6 | 1.4 |
| Someone else told me | 5.6 | 6.9 | 11.6 | 10.0 |
| Don't know | 0.0 | 0.0 | 0.79 | 1.47 |
| Number of carers | 157 | 109 | 124 | 131 |
| All | ||||
| I knew the family and had witnessed/suspected it | 17.6 | 22.7 | 18.1 | 15.5 |
| A caseworker/other official | 22.6 | 26.6 | 30.9 | 32.1 |
| School/school teacher | 19.1 | 2.5 | 9.2 | 6.3 |
| Medical/health professional | 21.6 | 24.2 | 25.3 | 29.4 |
| I detected it | 42.7 | 37.5 | 35.9 | 37.8 |
| A family member of study child | 1.1 | 0.8 | 2.5 | 1.6 |
| A previous carer of study child | 2.8 | 3.5 | 4.8 | 2.5 |
| Someone else told me | 8.1 | 7.5 | 12.9 | 10.2 |
| Don't know | 0.5 | 0.0 | 0.3 | 0.8 |
| Number of carers | 394 | 265 | 322 | 264 |
Notes: Percentages are based on weighted data and sample sizes are unweighted. Multiple responses mean the sum of column percentages may exceed 100% and statistical test is not applied.
4.5 Adequacy of provision of study child's history
The study further inquired about carers' views on whether they were provided with adequate information about the study child's history, such as his/her family home environment, medical conditions or any other information that would have been helpful. Figure 4.10 shows carers' responses overall as well by care type and by carer's gender.
- The majority of carers (61%) confirmed that they felt they were provided with adequate information about the study child's history before he or she came into their care. However, more than one-third (36%) held the opposite view, indicating that they were not provided with adequate information before the study child came into their care. The small remainder (4%) opted for "don't know" as to whether they had adequate information about the study child's history.
- Relative/kinship carers were more likely than foster carers to consider that the information provided about the study child's history was adequate before he or she came into their care (69% vs 52%). Relative/kinship carers would have previously observed and learned about the study child's history when interacting with the child's family or looking after the study child informally (e.g., providing childcare).
- A slightly higher proportion of male carers than female carers reported that they had adequate knowledge about the study child's history (66% vs 60%).
Figure 4.10: Proportion of carers who reported receiving adequate information about study child by care type and by carer's gender
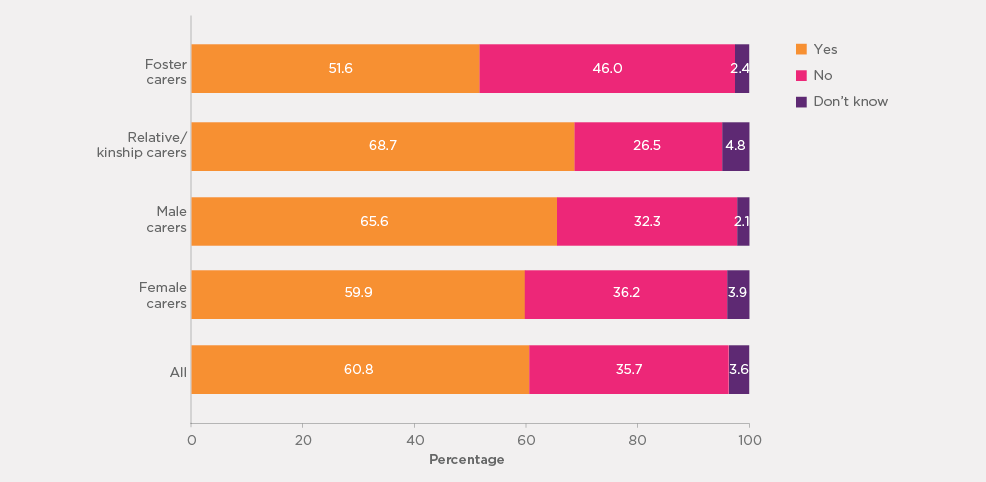
Note: Percentages are based on weighted data.
Figure 4.11 depicts carers' views about the adequacy of the study child's information they were provided with by the number of the study child's indicators of abuse/neglect and developmental conditions that carers learned of after the study child's arrival. Carers who were not aware that the study child had any prior experience of abuse, neglect, problems at parental home or any developmental conditions were excluded from the analysis.
- It is not surprising that carers who reported being unaware of the highest number of prior experiences (of abuse/neglect) and developmental conditions prior to the study child's arrival were most likely to indicate that they were given inadequate information about the study child's history. Conversely, carers who did learn of any or only one prior experience or developmental condition after the study child's arrival were more likely to believe they were provided with adequate information.
- Only one-quarter of carers who learned of at least four of the study child's abuse/neglect experiences and/or developmental conditions after the study child's arrival felt that they were provided with adequate information about the child's history.
- Less than half (39-44%) of carers who learned of two or three of the study child's abuse/neglect experiences and/or developmental conditions after the child's arrival reported that they were provided with adequate information.
- About two-thirds (62-69%) of carers who learned of one or none of the study child's abuse/neglect experiences and/or developmental conditions after their arrival felt they had been provided with adequate information.
Figure 4.11: Proportion of carers who reported being given adequate information about the study child by the number of issues they learned of after the child arrived
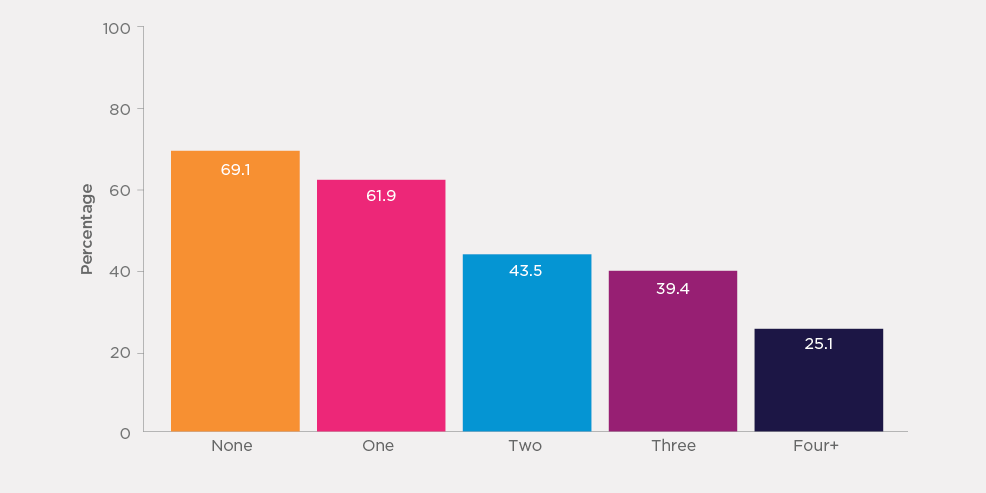
Note: Percentages are based on weighted data.
4.6 Contact between study children and their parents
Children come to out-of-home care for a range of reasons, including the death of either or both of their parents. For children whose parent(s) are alive, it is important that they maintain contact with their parents unless doing so would seriously compromise their safety. This is also required by state/territory child protection legislation and is consistent with the United Nations Convention on the Rights of the Child. This section examines the level of contact, either face-to-face or by other means, between study children and their parents, and if there is no contact, the reasons for the lack of contact.
The majority of carers reported that their study child's parents were alive, with 94% reporting the study child's mother was alive and 81% reporting the study child's father was alive. Some study children's parents were deceased - for 5% of study children, the mother was reported as deceased and for 6% the father was reported as deceased. The remainder of the carers reported that they did not know whether the study child's parents were alive (father's status unknown: 13%; mother's status unknown: 1%). It is worth noting that a slightly higher proportion of foster carers than relative/kinship carers reported that they didn't know whether the study child's father was alive (15% vs 12%), also a slightly higher proportion of male carers than female carers didn't know whether the study child's father was alive (16% vs 13%). These results are not presented in any table.
For study children with one or both parents alive, carers' reports of the frequency of contact between the study child and their parent(s) in the six months prior to the interview are shown in Table 4.7.
- In relation to face-to-face contact between study children and their own parents:
- One-fifth of study children had face-to-face contact with their mother at least once every fortnight, while a lower proportion (17%) saw their father at least once every fortnight.
- Only 5% of study children had face-to-face contact with their mother on most days in the past six months, and a similar proportion also saw their father most days. Eleven per cent of study children saw their mother and 8% saw their father at least once a week.
- Face-to-face contact with mothers and fathers at least once a month was reported for 13% of children in relation to their mother and 8% in relation to their father, with the most common reports of contact being less than once a month with both mothers (37%) and fathers (30%).
- In the six-month period, nearly one-third of study children did not see their father, while 13% did not see their mother.
- Therefore, overall, study children were more likely to have face-to-face contact with their mother than with their father.
- One-fifth of study children had face-to-face contact with their mother at least once every fortnight, while a lower proportion (17%) saw their father at least once every fortnight.
- Apart from face-to-face contact, study children also had other kinds of contact with their parents such as via social media, phone and so on. It should be noted that carers may not have been aware of some non-face-to-face contact between older children and their parents (e.g., Facebook) and the results may underestimate non-face-to-face contact between the children and their parents:
- Just under one-half of study children had contact with their mother through other forms (i.e., non-face-to-face) in the past six months and over one-third had non-face-to-face contact with their father.
- Close to one-fifth of study children had non-face-to-face contact with their mother and 14% had non-face-to-face contact with their father at least once a fortnight or more frequently.
Carers who reported that the study child did not have any face-to-face contact with their mother, father or both were asked about reasons for the lack of face-to-face contact. The most common reasons that the carers reported were that the study child's parent(s) chose not to see the child. Other less common reasons included that seeing the parent(s) was not part of the carer plan for the study child and that the whereabouts of the parent(s) was not known.
| Child-mother contact | Child-father contact | |||
|---|---|---|---|---|
| Face-to-face (%) | Other contacta (%) | Face-to-face (%) | Other contacta (%) | |
| Most days | 3.6 | 4.5 | 3.7 | 4.2 |
| At least once a week | 10.7 | 11.0 | 8.4 | 7.8 |
| At least once a fortnight | 5.7 | 3.7 | 5.1 | 2.4 |
| At least once a month | 13.0 | 5.1 | 8.0 | 4.5 |
| Less often | 36.8 | 16.5 | 30.3 | 13.6 |
| Patterns varied | 16.8 | 6.0 | 11.6 | 4.9 |
| Not in the period | 13.3 | 53.2 | 32.9 | 62.7 |
| Total | 100.0 | 100.0 | 100.0 | 100.0 |
| Number of carers | 1,912 | 1,876 | 1,637 | 1,613 |
Notes: Percentages are based on weighted data and sample sizes are unweighted. aIncludes phone, email, social media, Skype or in other ways. Excludes a small number of study children whose parents were living in the same household with the carer or didn't know the level of contact (about 1% for each of the four groups by parent gender and type of contact). Sum of percentages may exceed 100% due to rounding.
Figure 4.12 shows frequency of face-to-face contact between study children and their fathers and mothers by study children's age.
- The study children were more likely to be reported as having no face-to-face contact with their father as compared with their mother. This pattern is apparent for all age groups of study children.
- Children were more likely to be reported as having face-to-face contact with their parent at least once per fortnight, or more often, if they were younger in age. This regularity of contact was reported more frequently for children aged up to four years, and was greater in relation to contact with mothers (31%) than fathers (21%).
- The most commonly reported frequency of face-to-face contact for children in each age group was monthly contact, except for children's face-to-face contact with their father when they were aged 15-18 years, which was no face-to-face contact.
- Having no face-to-face contact with their mother and father was more common among older study children than for younger study children.
Figure 4.12: Frequency of face-to-face contact of study children with father and mother by age of study children
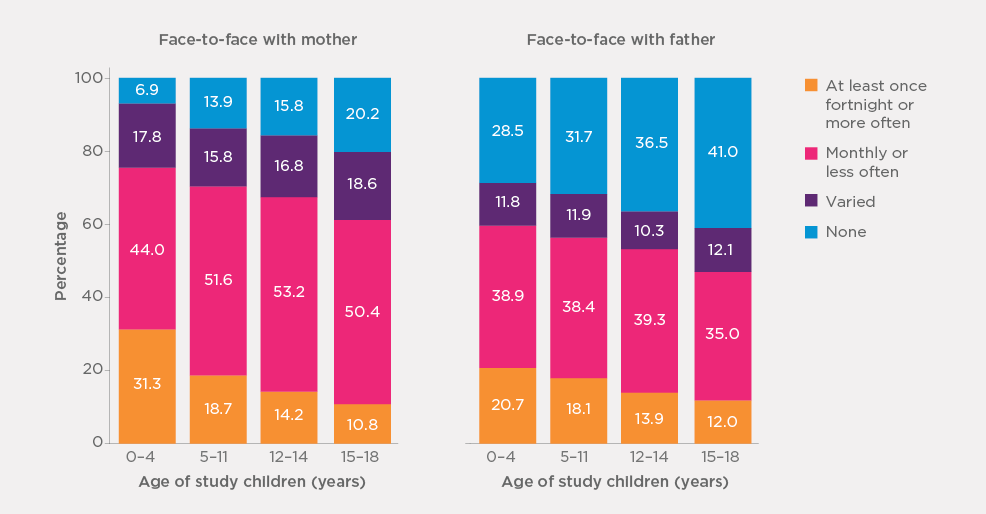
Note: Percentages are based on weighted data.
The frequency of other forms of contact between study children and each parent according to the children's age is shown in Figure 4.13.
- For study children in the youngest (under five years) and oldest (15-18 years) age groups, other forms of contact were more commonly reported with their mother than with their father. The patterns of the two age groups in the middle (5-11 years and 12-14 years) were less apparent.
- Unlike the patterns in face-to-face contact with each parent, other forms of contact with each parent were more commonly reported if children were older.
Figure 4.13: Frequency of other contact of study children with father and mother by age of study children
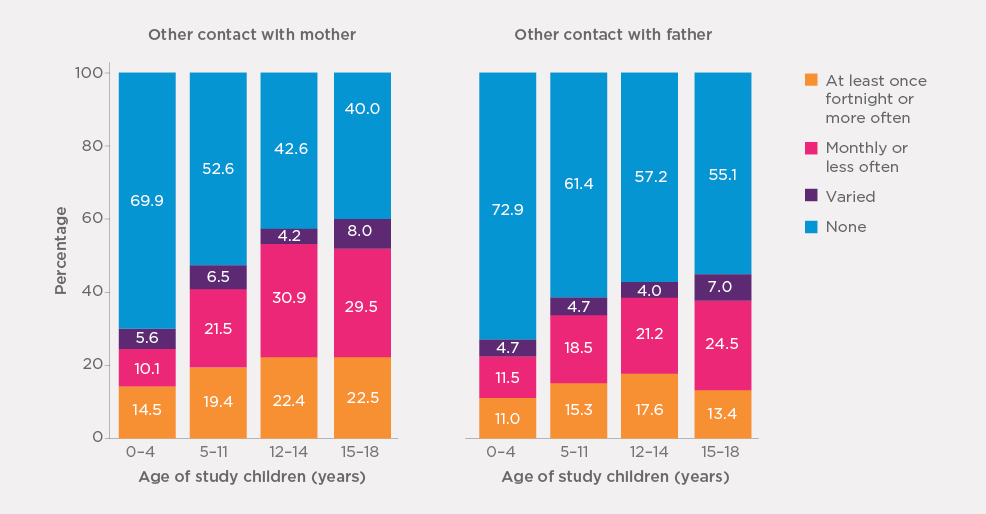
Note: Percentages are based on weighted data.
Patterns of contact between study children and their own parents differed between the two care types, as shown in Figure 4.14.
Reports of contact (face-to-face and other forms of contact) between study children and their mothers and fathers were more commonly made in relation to children placed with relative/kinship carers than for those placed with foster carers.
- Consistent with the discussion above in relation to child-mother and child-father contact, regardless of care type and forms of contact (face-to-face, non-face-to-face), reports of contact "at least once a fortnight or more often" or "monthly or less often" were more likely made in relation to contact with mothers than with fathers.
Figure 4.14: Frequency of face-to-face and other contact of study children with father and mother, by care type

Note: Percentages are based on weighted data.
4.7 Summary
This section of the survey collected important information regarding the care experience, including how the respondents became the study child's carer, how long they had taken care of the study child for, the study children's previous experience of abuse, neglect and problems at home, developmental conditions experienced by the study child, the carer's knowledge of the study child's history and the study child's level of contact with their parents.
Most carers were approached by their jurisdictional department or agency about becoming a carer for the study child, although this was more common for foster carers than relative/kinship carers. Relative/kinship carers more likely than foster carers to be approached by the child's parents or a family member or offer their care for the child.
The majority of respondents reported that this was the first time that the study child was in their care. Relative/kinship carers, and specifically grandparents, were more likely to have had the study child live with them previously. The median duration that the study child had been living with their current carer was 3.4 years. There was a spread across both shorter and longer time periods. Just under one-half of carers reported that the study child had been in their care for up to two years, with 14% of study children living with their carer for less than one year and 31% for 1-2 years. Nearly one-fifth of carers reported that the study child had been in their care between five and eight years, with a further 13% having had the child in their care for at least 10 years. Foster carers were more likely than relative/kinship carers to have cared for the study child for less than one year (19% vs 9%).
Most carers were aware that many study children (86%) had experienced or been exposed to at least one indicator of abuse/neglect, including emotional abuse, physical abuse, sexual abuse, neglect, violence in the study child's household, and a household member(s) with alcohol or drug use problems. Only 14% of carers reported that they were not aware that the study child had any such previous experience before coming into their care. The most common indicator of abuse/neglect experienced by study children was identified as having a household member(s) with alcohol or drug use problems (72%), followed by neglect (68%), family violence in the study child's household (62%) and emotional abuse (55%). More than one-tenth of carers were aware that the study child had experienced sexual abuse. Relative/kinship carers were more likely than foster carers to indicate that they were aware of the study child's problems at home, and were somewhat less likely to report being aware of the study child's past experiences of abuse, neglect, and problems at home, with the exception of sexual abuse. In addition, male carers were more likely than female carers to become aware of the study child's past experience of abuse/neglect.
Although most carers were aware of the various indicators of abuse/neglect experienced by the study child prior to them arriving at their household, substantial proportions of carers learned of the child's prior experience of abuse/neglect after the child was in their care. In instances of sexual abuse, only 29% of carers were aware of its occurrence beforehand. The majority (55%) did not learn of it until after the child had begun to live in their household. Higher proportions of foster carers than relative/kinship carers reported that they had become aware of the study child's past experience of abuse/neglect after the child came into their care, while relative/kinship carers were more likely than foster carers to have knowledge of the child's past experience before the child came into their care.
One-third of carers reported that the study child had been diagnosed with at least one type of developmental condition - intellectual disability, a physical disability, diagnosed behavioural problems, or diagnosed mental health conditions. The most common developmental conditions that the study children had were intellectual disabilities (18%), followed by behavioural problems (15%). Foster carers were more likely than relative/kinship carers to indicate that the study child had been diagnosed with an intellectual disability or behavioural problem, and were also more likely to indicate that the study child had been diagnosed with at least one of the four developmental conditions. A slightly higher proportion of male carers than female carers reported that the study child had at least one type of these developmental conditions.
In many cases, especially in regards to physical disabilities and diagnosed behavioural problems, carers were aware of these conditions prior to the study child coming to live with them, but it was also relatively common for the carer to become aware of these conditions after the study child's arrival at the household, especially regarding diagnosed behavioural problems (34%). For study children diagnosed with mental health conditions, it was the opposite pattern - carers' awareness was more likely after the study child's arrival than before their arrival.
Relative/kinship carers were more likely than foster carers to report being aware of conditions/behaviours before the study child's arrival except when it came to diagnosed mental health conditions. Both groups of carers were more likely to learn of the child's diagnosed mental health conditions after the child came into their care rather than before the child came into their care (44-45% vs 32-35%).
Overall, most carers (61%) did believe that they were provided with adequate information about the study child's history before they came into their care, with relative/kinship carers being more likely than foster carers to believe this to be the case (69% vs 52%). It is important to note, however, that a substantial proportion of carers (over one-third) reported that they were not provided with adequate information about the study child prior to their arrival, with this view being more common for foster carers than for relative/kinship carers (46% vs 27%). Carers who became aware of the study child's prior experiences of abuse, neglect and household problems and developmental conditions after he/she came into their care were more likely to express that they did not have the adequate information about the study child compared to other carers.
The majority of the study children's parents were still alive. For children where parents were alive, the degree and type of contact the children had with their birth parent(s) varied. For example, one-third of study children had contact with their birth mother at least once a month, but 37% had contact less often, and a further 30% had had variable or no face-to-face contact over the past six months. The trends were also somewhat similar for the study child's father, although the study children had face-to-face contact less frequent with their father than their mother, with 17% having face-to-face contact at least once a month. No face-to-face contact was more prevalent for fathers than for mothers (33% vs 13%).
Almost half of the study children also had some degree of other contact with their mother, such as talking on the phone, emailing or contacting each other via social media, while just over a third of study children had this level of contact with their father. The patterns of contact between study children and their parents varied according to their age. The frequency of face-to-face contact between study children and their parents fell with the increasing age of children, and having no face-to-face contact with parents was more common among older children than younger children. However, older children were more likely than younger children to contact their parents via other forms.
14 Qu, Weston, Moloney and colleagues (2014) analysed data of the Longitudinal Study of Separated Parents (2008-2012) and reported that of fathers and mothers who reported safety concerns for their children and/or themselves as a result of children's contact with the other parent, the other parent's alcohol or drug use was reported as one of the main sources for generating safety concerns.
15 Results by gender are not shown due to small numbers for male carers (n = 35-45)
5. Services and support
This section presents the findings of analyses relating to the services and support section of the survey, looking at which services carers have used to assist them in caring for children, how helpful these services have been and what additional services they might need.
Carers were also asked about whether they had any difficulties in getting the professional support they needed and what training they had received for their role. Finally, carers were questioned about their contact with their caseworker/carer support worker and their level of contact with other foster or relative/kinship care families. Analyses were conducted overall and for carer type.
5.1 Types of services and supports used by carers
Table 5.1 displays the proportion of carers who reported ever receiving each type of support while caring for a child (for the study child or other children who came into their care), while Table 5.2 shows the proportion of carers who received each type of service support within the past six months (or for study children who were no longer in the household, the last six months that they were present).
- The most common types of services that carers reported ever receiving (with frequencies over 50%) were carer support staff from a government child protection department and child counselling/psychologist services.
- Carer support teams from non-government organisations and agencies (39%) and respite care services (34%) were the next most common services carers received.
- Overall, 90% of carers had received at least one service, with 54% receiving three or more in their time as carers.
- The proportion of carers who reported having contacted with each type of service in the last six months was much lower compared to the proportion of carers having ever used it (2.9-25% vs 15-56%). In other words, many carers had received the services more than six months ago. Over two-thirds of carers had received at least one type of service in the past six months.
There were significant differences between the care types regarding the type and number of services received.
- Foster carers tended to report higher contact with services compared to relative/kinship carers. They were also more likely to have contact with a greater number of services in their time as carers (e.g., 70% of foster carers, in comparison to 40% of relative/kinship carers, reported receiving three or more services).
- Across the service types, there was a similar pattern of results for services in the past six months, with foster carers tending to have individual services more often for children in their care.
| Service type | Foster carers (%) | Relative/ kinship carers (%) | Overall (%) |
|---|---|---|---|
| Carer support staff from government child protection department | 50.0 | 60.5*** | 55.5 |
| Carer support teams from non-government organisations and agencies | 51.5 | 26.9*** | 38.6 |
| Foster carer advisory groups | 25.9 | 13.1*** | 19.1 |
| Carer support organisations and groups | 30.4 | 17.0*** | 23.3 |
| After hours and crisis services | 30.6 | 9.0*** | 19.2 |
| Respite care services | 46.8 | 21.7*** | 33.6 |
| Child counselling/psychologist services | 64.5 | 42.8*** | 53.0 |
| Disability support services | 23.1 | 10.1*** | 16.3 |
| Transport services | 25.5 | 12.7*** | 18.7 |
| Legal advice or representation in regards to child/children | 14.0 | 15.0 | 14.5 |
| A specialised out-of-home-care agency for Aboriginal and/or Torres Strait Islander childa | 7.1 | 4.3** | 5.6 |
| Services relating to child's learning/educationb | 1.0 | 0.5 | 0.7 |
| Other health professionalsb | 1.5 | 0.6 | 1.0 |
| Other service (not listed above) | 2.6 | 1.8 | 2.2 |
| Total number of different services EVER received | |||
| 0 | 4.8 | 14.7*** | 10.1 |
| 1 | 10.6 | 25.2 | 18.3 |
| 2 | 14.8 | 20.0 | 17.6 |
| 3 | 18.2 | 15.4 | 16.7 |
| 4 | 17.2 | 11.1 | 14.0 |
| 5 | 13.3 | 7.0 | 10.0 |
| 6 or more | 21.2 | 6.5 | 13.5 |
| Number of respondents | 1,196 | 1,005 | 2,203 |
Notes: Percentages are based on weighted data. A design-based chi-square test was used to assess statistically significant differences between foster carers and relative/kinship carers. (*p < .05; **p < .01; ***p < .001). aOnly asked of carers whose study children or other children in out-of-home care in the household were earlier identified as being of Aboriginal and/or Torres Strait Islander origin. bAn additional response option created after its identification as a common "other (specify)" response.
| Service type | All carers | Carers who ever received each service | ||||
|---|---|---|---|---|---|---|
| Foster (%) | Relative/kinship (%) | All (%) | Foster (%) | Relative/kinship (%) | All (%) | |
| Carer support staff from government child protection department | 24.5 | 25.8 | 25.1 | 49.0 | 42.7* | 45.4 |
| Carer support teams from non-government organisations and agencies | 33.6 | 12.9*** | 22.7 | 65.6 | 48.2*** | 59.1 |
| Foster carer advisory groups | 9.6 | 4.2*** | 6.7 | 37.0 | 32.1 | 35.2 |
| Carer support organisations and groups | 12.8 | 6.2*** | 9.3 | 42.1 | 36.6 | 40.0 |
| After hours and crisis services | 9.1 | 1.9*** | 5.3 | 29.6 | 21.3 | 27.6 |
| Respite care services | 29.7 | 11.7*** | 20.2 | 63.3 | 53.7* | 60.0 |
| Child counselling/psychologist services | 42.2 | 24.1*** | 32.6 | 65.3 | 56.4** | 61.6 |
| Disability support services | 12.3 | 5.7*** | 8.8 | 53.4 | 56.3 | 54.4 |
| Transport services | 15.2 | 7.2*** | 11.0 | 59.7 | 56.7 | 58.6 |
| Legal advice or representation in regards to child/children | 4.5 | 4.1 | 4.3 | 32.2 | 27.6 | 29.7 |
| A specialised out-of-home-care agency for Aboriginal and/or Torres Strait Islander childa | 3.8 | 2.1* | 2.9 | 53.2 | 50.5 | 52.1 |
| Any of the above (incl. other) | 81.0 | 56.4 | 68.0 | |||
| Number of carers | 1,196 | 1,005 | 2,203 | 70~772 | 39~606 | 109~1,208 |
Notes: Percentages are based on weighted data and small numbers of respondents' "Don't know" were included in calculating percentages (0.01%-1% of all carers across the items listed). Sample sizes are unweighted. For each item, a design-based chi-square test was used to assess statistically significant differences between foster carers and relative/kinship carers. (*p < .05; **p < .01; ***p < .001). aOnly asked of study children earlier identified as being of Aboriginal and/or Torres Strait Islander origin.
5.2 Perceived helpfulness of services received
The carers who had contact with services in the past six months were asked how helpful they had found each service, with their responses presented in Figure 5.1). In this figure, views about services are ordered according to the proportions of carers who reported "very helpful" for the 11 types of services (from the highest to the lowest).
- Carers tended to perceive services as being very or fairly helpful. Overall, at least 80% of carers who had used each service had found it to be very/fairly helpful, with 46-69% of carers reporting very helpful and 25-34% reporting fairly helpful.
- Perceived helpfulness varied across the service types.
- The proportion of carers who considered the type service as very helpful was highest for carers who used transport and respite care services (68-69%), followed by those who used the services of disability support, legal advice or representation for children in OOHC, and care support staff from non-government organisations and agencies (59-61%).
- The assessment that the service was "very helpful" was lowest for care support staff from government child protection departments (46%), followed by specialised OOHC agency for Aboriginal and/or Torres Strait Islander children (48%).
Figure 5.1: Carers' views on helpfulness of services received, carers who had services in the past six months

Notes: Percentages are based on weighted data. Unweighted sample sizes range from 131 to 750. aOnly asked of study children earlier identified as being of Aboriginal and/or Torres Strait Islander origin.
Carers' views on the helpfulness of the services received were similar between foster and relative/kinship carers, with most carers reporting the services used were either "very helpful" or "fairly helpful" as shown in Figure 5.2. Nevertheless, a slightly higher proportion of foster carers than relative/kinship carers considered the services received to be "very helpful" regarding transport services (71% vs 66%) and foster carer advisory groups (57% vs 52%). On the other hand, higher proportions of relative/kinship carers than foster carers reported the following services as "very helpful": disability support services (69% vs 57%), carer support organisations and groups (64% vs 56%), care support staff from non-government organisations and agencies (64% vs 57%), and a specialised OOHC agency for Indigenous children (52% vs 45%).16 Despite the overall similar assessments about services received between foster and relative/kinship carers, it should be kept mind that relative/kinships carers were less likely than foster carers to receive most types of services.
Figure 5.2: Carers' views on the helpfulness of services received in the past six months, by care type
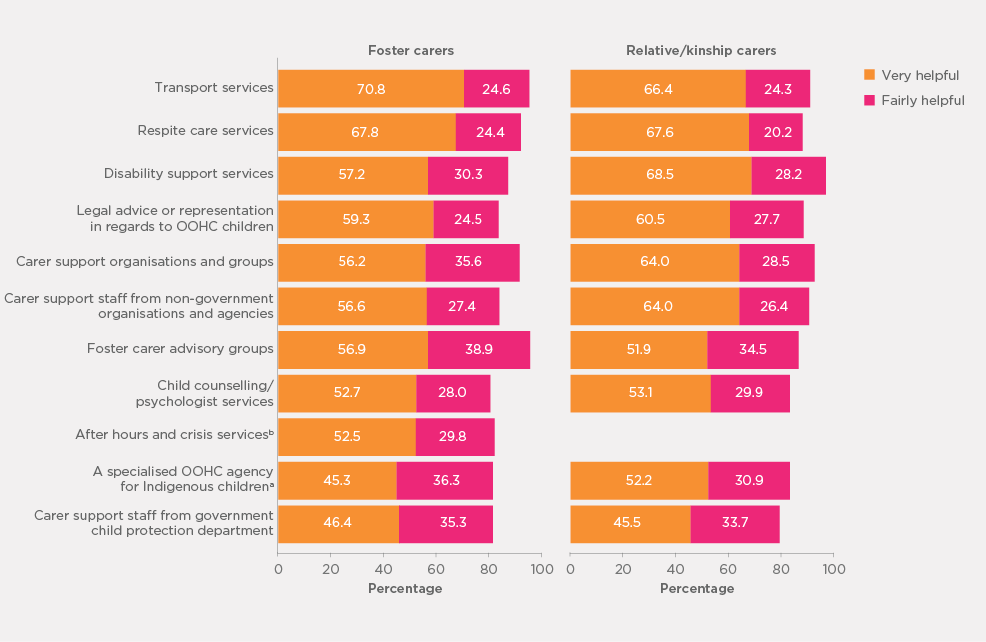
Notes: Percentages are based on weighted data. Unweighted sample sizes range from 111 to 506 for foster carers and from 43 to 258 for relative/kinship carers. aOnly asked of study children earlier identified as being of Aboriginal and/or Torres Strait Islander origin. bResults for relative/kinship carers are not shown due to small numbers.
5.3 Service needs
Table 5.3 displays the proportion of carers who identified that they currently required each type of support, or in cases where the study child was no longer present in the household, the services the carer required in the past six months while the study child was still living in the household.
- Carers' reports indicate that child counselling/psychologist services were the most needed (50%), followed by carer support staff from the government child protection department (43%).
- Respite care services and carer support teams from non-government organisations and agencies were also needed by over one-third of carers (both at 36%).
- Approximately one-quarter of carers reported a need for carer support organisations and groups (29%) and foster carer advisory groups (24%).
- There was some variation between the care types regarding their need for the various services. More specifically, foster carers tended to cite a higher current need than relative/kinship carers for services, including carer support teams from non-government organisations and groups, after hours and crisis services, respite care services and transport services.
| Service type | Foster (%) | Relative/ kinship (%) | All (%) |
|---|---|---|---|
| Carer support staff from government child protection department | 43.8 | 42.1 | 42.9 |
| Carer support teams from non-government organisations and agencies | 46.1 | 26.7*** | 35.9 |
| Foster carer advisory groups | 29.8 | 18.8*** | 24.0 |
| Carer support organisations and groups | 32.8 | 24.8*** | 28.6 |
| After hours and crisis services | 25.4 | 12.9*** | 18.8 |
| Respite care services | 42.8 | 29.9*** | 36.0 |
| Child counselling/psychologist services | 57.7 | 42.5*** | 49.7 |
| Disability support services | 27.9 | 15.2*** | 21.2 |
| Transport services | 25.6 | 14.3*** | 19.6 |
| Legal advice or representation in regards to child/children | 17.9 | 19.3 | 18.6 |
| A specialised out-of-home-care agency for Aboriginal and/or Torres Strait Islander childb | 12.3 | 8.6** | 10.3 |
| Services relating to child's learning/educationb | 2.4 | 1.1* | 1.7 |
| Other health professionalsc | 0.9 | 0.5 | 0.7 |
| Other financial supportc | 0.5 | 0.6 | 0.6 |
| Any of the above | 86.5 | 72.0*** | 78.8 |
| Number of respondents | 1,196 | 1,005 | 2,203 |
Notes: Percentages are based on weighted data, small numbers of respondents' "Don't know" were included in calculating percentages (0.02%). A design-based chi-square test was used to assess statistically significant differences between foster carers and relative/kinship carers. (*p < .05; **p < .01; ** p < .001). aCarers may currently use the service. bOnly asked of study children earlier identified as being of Aboriginal and/or Torres Strait Islander origin. cAn additional response option created after its identification as a common "other (specify)" response.
The analysis also revealed the unmet service needs of carers. "Unmet service needs" were defined as instances where carers reported that they currently needed a service but had not received it in the last six months or had never received the service. Figure 5.3 shows the analysis of unmet needs for services and Figure 5.4 the results by care type.
- Overall nearly two thirds of carers (64%) had one or more unmet service need.
- As shown in Figure 5.3, the most common unmet service need was carer support staff from a government child protection department (25%), followed by child counselling/psychologist services and carer support organisations and groups (both at 22%).
- The unmet service need was also relatively high for respite care services and foster carer advisory groups (both 19%).
Figure 5.4 shows that foster and relative/kinship carers were relatively similar regarding the unmet service needs they identified, although there were some differences.
- Foster carers were more likely to indicate an unmet need overall and for several services, including foster care advisory groups, after hours and crisis services and disability support services.
- The unmet need for respite care services was higher for relative/kinship carers than for foster carers.
Figure 5.3: Carers with unmet service needs (i.e., currently need the services but not receive in the past six months or never received)
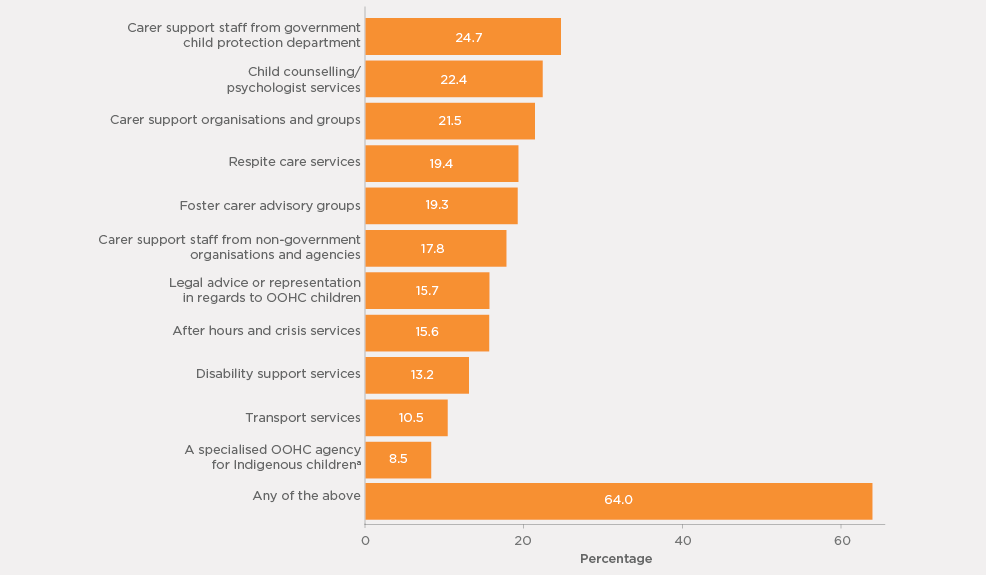
Notes: Percentages are based on weighted data. aOnly asked of study children earlier identified as being of Aboriginal and/or Torres Strait Islander origin.
Figure 5.4: Carers with unmet service needs (i.e., currently need the services but not receive in the past six months or never received) by care type
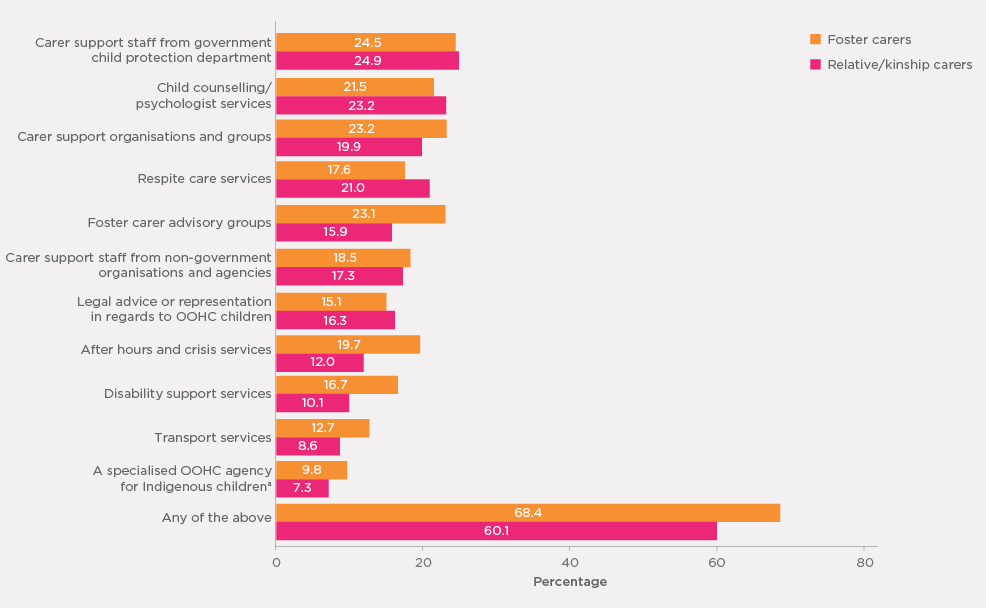
Notes: Percentages are based on weighted data. aOnly asked of study children earlier identified as being of Aboriginal and/or Torres Strait Islander origin.
The survey also investigated the extent to which carers who reported currently having a need for services had any difficulty in getting the professional support required. Their responses are summarised in Figure 5.5.
- Almost half of carers currently having a need for services (47%) said that they had some difficulty getting the professional support they needed (i.e., 37% of the total sample), and 51% reported otherwise (i.e., no difficulty). A small number (2%) were not certain whether they had had any difficulty in getting the support they needed.
- The reports on this issue were similar between foster and relative/kinship carers.
- A higher proportion of male carers than female carers reported having had some difficulty in getting the support from the services they currently need (48% vs 42%).
Figure 5.5: Proportions of carers with service needs who reported having any difficulty in getting the professional support, by care type and by gender
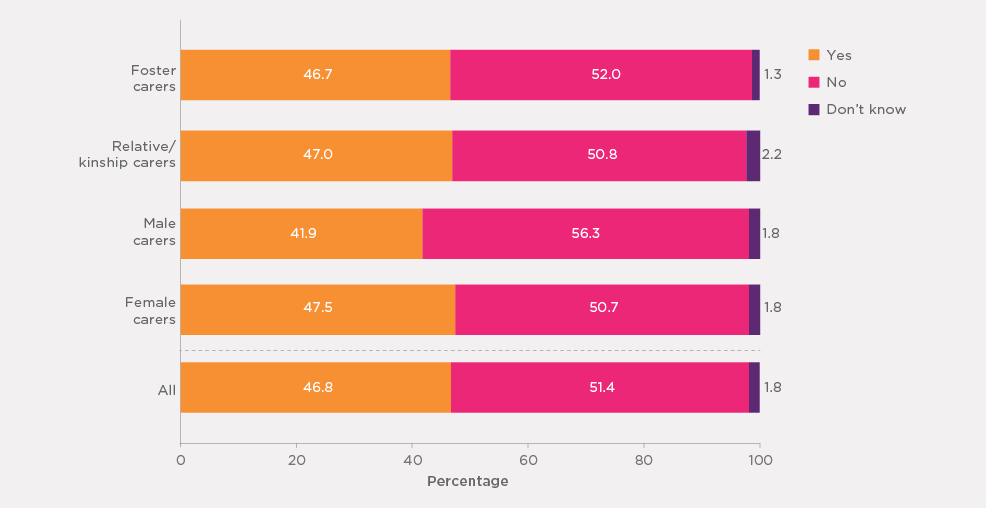
Note: Percentages are based on weighted data.
Carers who indicated having had some difficulty in getting the services that they currently required also provided reasons for feeling this way (or barriers to getting the support required) (Table 5.4).
- Table 5.4 shows that long waiting lists/low availability of support staff were the most common barriers to accessing required services, reported by 45% of carers in this group.
- Other important reasons included no appropriate services, lack of awareness of services available, cost and agency-related issues (e.g., bureaucracy, poor communication) (21-27%).
- Overall patterns in barriers were similar between foster and relative/kinship carers and between male and female carers. However:
- A slightly higher proportion of relative/kinship carers than foster carers reported that not being aware of what was available was an issue for them.
- Male carers were slightly more likely than female carers to report agency-related issues (26% vs 20%).
Barriers | Care type | Carer's gender |
All (%) | ||
|---|---|---|---|---|---|
| Foster carers (%) | Relative/kinship carers (%) | Males (%) | Females (%) | ||
| No appropriate services | 23.1 | 20.5 | 23.8 | 21.6 | 21.9 |
| Worried seeking support may lead people to think you are incapable | 6.4 | 5.2 | 5.6 | 5.9 | 5.8 |
| Too far to travel/problems with transport | 15.6 | 12.7 | 11.3 | 14.6 | 14.2 |
| Long waiting lists/support staff availability | 48.8 | 43.9 | 48.9 | 46.1 | 46.4 |
| Cost of the service | 21.5 | 20.7 | 18.1 | 21.5 | 21.1 |
| Not aware of what's available | 23.1 | 31.6 | 30.2 | 26.8 | 27.2 |
| Lack of services/support availablea | 12.2 | 13.3 | 11.9 | 12.8 | 12.7 |
| Agency problems (e.g., bureaucracy, poor communication, slow to respond)a | 22.7 | 18.9 | 26.0 | 20.2 | 20.9 |
| Not allowed/entitled by agencya | 3.0 | 2.3 | 2.1 | 2.8 | 2.7 |
| Lack of responsiveness/ action/continuity from caseworkersa | 10.0 | 8.4 | 6.8 | 9.5 | 9.2 |
| Other | 7.7 | 11.2 | 11.1 | 9.2 | 9.4 |
| Number of carersb | 487 | 335 | 92 | 730 | 822 |
Notes: Percentages are based on weighted data. The sum of responses may exceed 100% due to multiple responses. aResponses were recorded based on carers' verbatim responses. bOnly includes carers who said that they had difficulties accessing services.
5.4 Grandparent Adviser Phone Line
Carers were asked whether they were aware of the Grandparent Adviser Phone Line and, if so, whether they had accessed it and how helpful it was to them.
- Many carers were not aware of the Grandparent Adviser Phone Line:
- twenty-eight per cent of all carers were aware of this service, 72% were not;
- a higher proportion of relative/kinship carers than foster carers reported their awareness of the service (32% vs 23%). Nearly four out of ten grandparent carers (39%) said they knew about the adviser phone line.
- One-quarter (25%) of carers (grandparent carers and other carers) who knew about the adviser phone line said that they had accessed it, which means that 7% of all carers interviewed had used it. Grandparent carers who knew about the service were more likely than other relative/kinship carers and foster carers to report having accessed the service (39%, 9% and 14%, respectively).
- Among carers who had accessed the adviser phone line, two-thirds (66%) reported that the service provided by the phone line was "very helpful", another 14% indicated that it was "fairly helpful", while "not very helpful" and "not helpful at all" were reported by 10% and 9%, respectively. A small proportion (2%) of the carers who used the service did not know whether the service provided was helpful to them or not.
5.5 Carer training and preparedness for the caring role
As discussed in Sections 4.3 and 4.4, carers reported that most study children either had prior history of abuse or were exposed to family violence or alcohol or substance abuse before coming to live with the carer, and a substantial minority also had one or more developmental conditions. More importantly, many carers learned of the study child's prior history and developmental conditions after the child came into their care. Some carers may not have been well prepared to look after the study child. Providing carers with training courses or workshops can support them with skills to deal with children's difficult behaviours and better cope with caring demands. These issues were investigated in the survey.
Preparedness for the caring role
Figure 5.6 shows carers' reports of how well they considered themselves to be prepared or trained for their current caring role.
- Almost two-thirds (64%) of carers felt that they were very well/well prepared for their caring role, with the higher proportion feeling very well prepared compared to those feeling well prepared (43% and 21% respectively)
- One-fifth reported that they were adequately prepared for their caring role, while the remainder (16%) felt that they were poorly or very poorly prepared.
- Although both carer types and genders were very positive in terms of being prepared for their caring role, slight differences were apparent.
- Foster carers were slightly more likely to feel very well or well prepared (at 68%) than relative/kinship carers (60%). A higher proportion of relative/kinship carers than foster carers reported that they were poorly or very poorly prepared (22% vs 11%).
- A higher proportion of female carers than male carers felt very well prepared (44% vs 36%).
Figure 5.6: How well carers were prepared for their current caring role
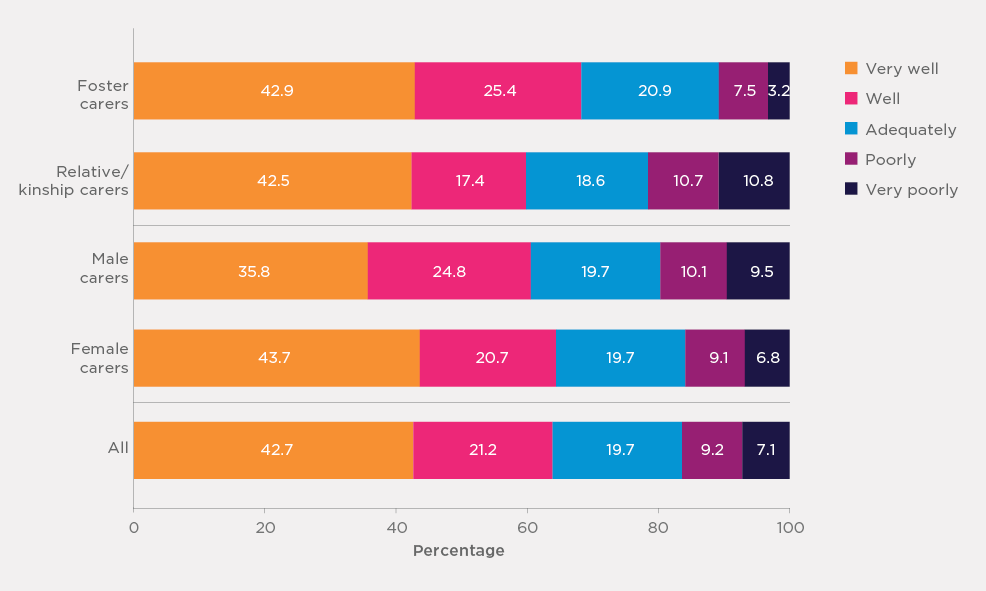
Note: Percentages are based on weighted data.
Among the carers who said that they felt poorly or very poorly prepared for this role, a sub-group of carers (n = 46) were randomly selected and asked why they felt this way. The first main theme to emerge from the analysis of these carers' responses was that inadequate training/support was available (identified by n = 25 carers; 19 or 64% of whom were foster carers). Direct quotes from carers exemplifying this theme are as follows:
I haven't been trained at all - I've been relying on parental instinct and just knowledge of being a parent. (Foster carer)
I was thrown in the deep end by the Child Protection Department - the children were only coming here for a short term, but they are still here. We had very little support at the start. (Relative/ kinship carer)
They just assume that you know how to cope and look after the child. (Foster carer)
There's no training for kinship ... we've raised five children between us - we've never been offered formal training to deal with the complexities of a foster child. (Relative/kinship carer)
Another theme to arise from the analysis of carers' responses was carers feeling unprepared for the "realities" of caring for a child in out-of-home care (identified by n = 9 carers; 78% of whom were foster carers). Responses reflective of this theme were:
All of the training done on paper in the classroom is not what can help you get through the day-to-day. (Foster carer)
When we did our initial module course, there were a lot of things that were, I guess, glossed over ... Doesn't give you the most realistic view into fostering. (Foster carer)
Overall, therefore, carers' open-ended responses as to why they felt poorly/very poorly prepared for the role tended to indicate that they believed that the training available was inadequate to support them through the initial stages of when the child was coming into their care and/or that the training they did receive was not adequate in preparing them for the challenges they would face in their caring roles.
Carer training and carers' views about training received
Carers were asked whether they had ever attended any training courses, whether they had attended any in the last 12 months and, if they had attended any in the last 12 months, who organised the training.
- The majority of carers (62%) reported that they had attended some training courses or workshops to help them in their caring role, while 38% reported having never undertaken any training.
- Four in ten carers said that they had undertaken training in the past 12 months.
Patterns in receiving training were very different between the two types of carers.
- Regarding whether they had undertaken any training courses/workshops, 92% of foster carers reported that they had, in comparison to just over a third (35%) of relative/kinship carers.
- The contrast was also apparent regarding training received in the past 12 months, with 54% of foster carers reporting that they had, compared to 16% of relative/kinship carers.
- There were slight differences between male and female carers in carer training.
- Female carers were slightly more likely than male carers to indicate that they had received any training (63% vs 56%).
- Female carers were slightly more likely than male carers to report that they had attended any training in the last 12 months (35% vs 27%).
Regarding who had organised the recent training course/workshops, the following were the responses by the carers who had undertaken training in the last 12 months (Figure 5.7):
- Training through an OOHC agency was most common (60%), followed by training through a jurisdictional child protection department (23%) or through a carer support group (16%), with a small number of carers using self-help or online materials (2%).
- The reports differed somewhat between foster carers and relative/kinship carers regarding who organised the training courses/workshops they attended in the last 12 months:
- More foster carers than relative/kinship carers reported that the training they received was through their OOHC agency (66% vs 42%).
- Relative/kinship carers were more likely than foster carers to report that their training was through their child protection department (39% vs 18%).
Figure 5.7: Carers' reports of who organised training course/workshops attended in the last 12 months
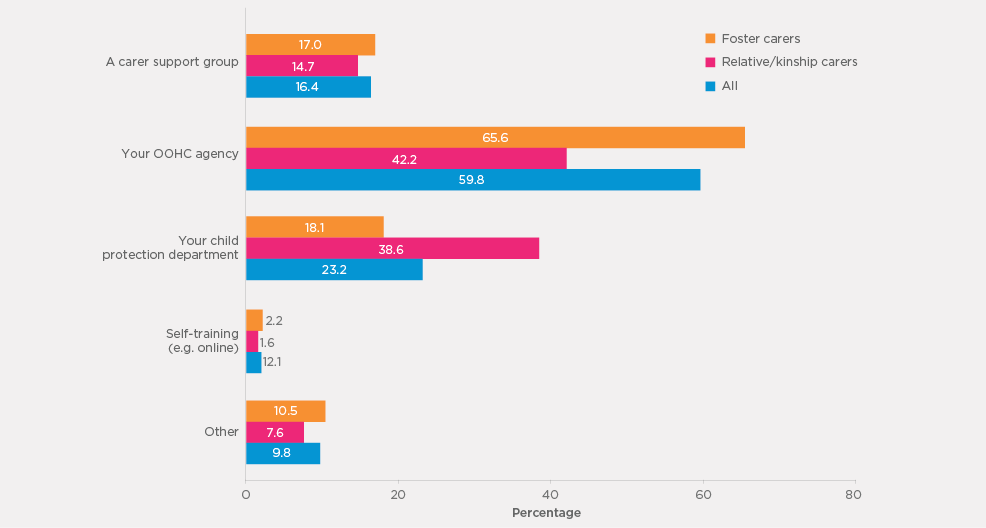
Note: Percentages are based on weighted data.
Views about carer training
Carers' views about the helpfulness of the training received were very positive.
- The vast majority of carers who had undertaken a training course/workshop in the past 12 months found it to be very or fairly helpful, regardless of whether it was delivered through a carer support group, an OOHC agency or a child protection department.
- Fifty-nine per cent reported that the training received was very helpful and 31% found it fairly helpful.
- Only 9% considered the training was not very helpful or not helpful at all, and the remainder was not sure.
- Foster and relative/kinship carers were similar in their views about the helpfulness of the training received.
The carers who had not received any training were asked whether they felt attending training courses/workshops would be helpful to assist them as a carer.
- Thirty-nine per cent indicated that it would be either very helpful or fairly helpful and 19% reported it would be a little helpful, while 42% thought it would not be helpful at all.
- Foster carers who had never received any training were more likely than relative/kinship carers to believe that attending training courses/workshops would be very or fairly helpful (56% vs 38%).
A sample of carers who indicated that training would have been very or fairly helpful were asked about what types of training courses/workshops would have been helpful (n = 39). The most common type of training identified was to assist carers in coping with the children's emotional and behavioural issues, including those that are a result of trauma experienced by the child (identified by n = 19 carers; 13 or 68% of whom were relative/kinship carers). Quotes from carers on this theme are as follows:
Anything to help to support the emotional issues that arise with the children and gain a better understanding of the behavioural issues that may arise. (Relative/kinship carer)
Courses that help you with child difficulties and how you can help them with their difficulties. (Relative/kinship carer)
Dealing with trauma ... things around mental health first aid. (Foster carer)
A small number of carers (n = 4), also indicated that support groups/networks would have been helpful:
Dealing with their learning and development, stages in their growth from experienced people who have been parents ... I don't really have a network of women around me. (Relative/kinship carer)
5.6 Contact with caseworker or carer support worker and other carer families
Caseworkers or carer support workers are an important source of support for carers; for example, they can provide direct support or information and services referral. For some carers, it is also important to meet other care families to share their experiences and information, be connected with other carer families and build a support network. Carers' experiences on these aspects of the carer experience are the focus of this section.
Contact with caseworkers or carer support workers
Table 5.5 shows carers' reports regarding how often they had contact with a caseworker or carer support worker about the study child, including forms other than face-to-face (phone, email etc.), overall and by carer type and gender.
- More than one-third of carers (38%) reported that they had contact (including phone, email, etc.) with a caseworker or carer support worker at least fortnightly, and a further 31% reported monthly contact. Less frequent contact or varied contact was reported by 19% and 6% respectively, while 6% had no contact with a caseworker or care support worker.
- The patterns of contact with caseworkers or carer support workers differed somewhat between foster and relative/kinship carers.
- Foster carers were significantly more likely than relative/kinship carers to have more frequent contact with a carer support worker about the study child (i.e., 52% of foster carers had at least fortnightly contact, in comparison to 25% of relative/kinship carers).
- Despite the minority, no contact with any caseworker or carer support worker was more common among relative/kinship carers than it was for foster carers (10% vs 1%).
- Male and female carers were similar in reports of their contact with a caseworker or carer support worker.
| Care type | Carer's gender |
All (%) | |||
|---|---|---|---|---|---|
| Foster carers (%) | Relative/kinship carers (%) | Males (%) | Females (%) | ||
| Weekly | 32.6 | 11.3*** | 17.2 | 21.9 | 21.3 |
| Fortnightly | 19.9 | 13.6 | 15.4 | 16.7 | 16.5 |
| Monthly | 31.2 | 30.6 | 31.9 | 30.8 | 30.9 |
| 1-4 times a year | 11.2 | 26.5 | 22.2 | 18.9 | 19.3 |
| Varies | 3.9 | 8.3 | 5.7 | 6.3 | 6.2 |
| No contact at all | 1.3 | 9.8 | 7.7 | 5.5 | 5.8 |
| Number of carers | 1,090 | 930 | 241 | 1,780 | 2,022 |
Notes: Percentages are based on weighted data. The sum of responses may exceed 100% due to rounding. Excludes carers with a response of "don't know".
Carers who had been in contact with a caseworker or carer support worker typically indicated that the caseworker or carer support worker was from a government department (70%), while caseworkers or carer support workers from non-government organisations or carer support groups were mentioned by just over one-third (35%). A small number of carers (less than 2%) did not know where the caseworker or carer support worker they contacted was from. It should be noted that some carers had contact with more than one caseworker or carer support worker from government or non-government organisations (7%).
The caseworker or carer support worker for relative/kinship carers was much more likely to be from a government department (85%) than a non-government organisation (16%). For foster carers, carer support workers were equally likely to be from a government department or non-government organisation (54-55%). Male carers and female carers were also similar in their reports about where their caseworker or carer support worker was from.
Carers who had contact with a caseworker or carer support worker were asked how satisfied or dissatisfied they were with the advice or assistance they received in their most recent contact. Figure 5.8 shows a positive picture of carers' views in this regard.
- Three-quarters reported they were either very satisfied or satisfied with the advice or assistance they received.
- Fourteen per cent were either dissatisfied or very dissatisfied and the remainder (11%) were neither satisfied nor dissatisfied.
- Although a positive picture prevailed for both foster and relative/kinship carers, foster carers were slightly more positive in their reports of satisfaction with the advice or assistance received.
- Male and female carers were similarly satisfied with the advice or assistance received.
Figure 5.8: Carers' satisfaction with advice or assistance received in their most recent contact with caseworkers or carer support workers
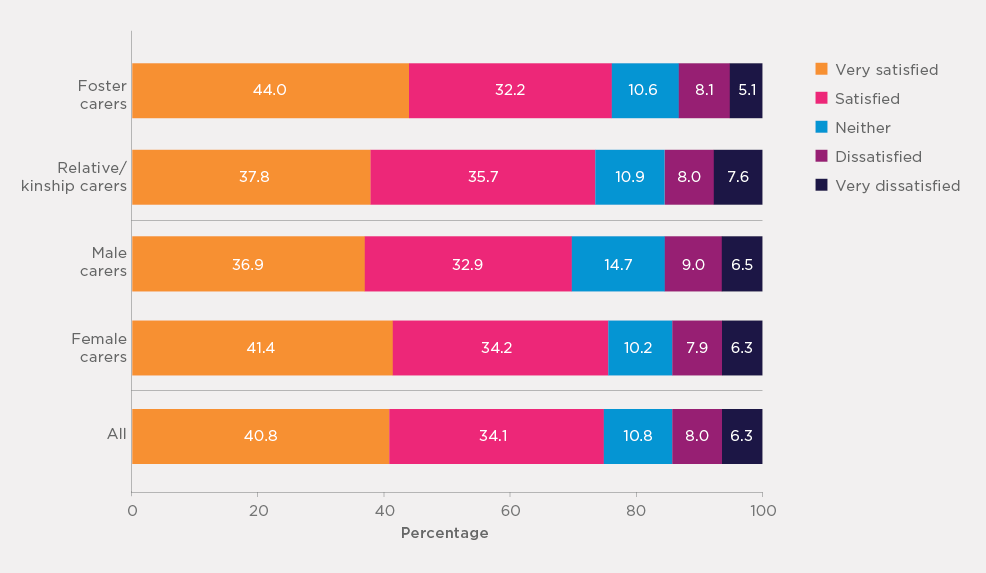
Note: Percentages are based on weighted data.
A sample of carers (n = 49) who indicated that they were dissatisfied or very dissatisfied with the most recent contact they had with their caseworker/carer support worker were asked to explain why they were dissatisfied. The first common theme identified from carers' responses was a lack of understanding and/or professionalism from their caseworker (identified by n = 14 carers; 8 or 57% of whom were foster carers). Responses such as the following were provided:
I have a very young caseworker who has never had children and who gives only very textbook advice that isn't real. It's not the real world. (Foster carer)
Just don't feel that they're listening to us and being supportive to the child's best interest. Not putting the child first. (Foster carer)
The caseworker does not behave professionally and is very rude. She is very confronting. The foster child says the caseworker is scary. (Foster carer)
Another common theme identified from carers' responses as to why they were dissatisfied with their most recent caseworker contact was communication difficulties (e.g., phone calls not being returned, no reply to emails and a lack of consultation; identified by n = 13 carers; 9 or 69% of whom were foster carers). Examples of responses received in regards to this theme are:
The caseworker is very difficult to contact - very rarely responds back or acts on queries. (Foster carer)
It's been a week and they still haven't replied to an email about situations that have come and gone already. (Foster carer)
A small number of carers (n = 4) also indicated that their dissatisfaction with their most recent contact with their caseworker was due to a lack of accountability and responsiveness, with the following quotes as examples:
No action, numerous requests made and no action. (Foster carer)
I had trouble with another foster child and I asked for help from child safety and they palmed it off. (Foster carer)
Overall, it appears that many carers who had indicated dissatisfaction with their most recent caseworker contact were unhappy due to a perceived lack of professionalism and/or not following through with communication and delivering on what the carer thought they should be. This sentiment was expressed more frequently by foster carers than relative/kinship carers.
Contact with other carer families
Carers' reports of meeting other carer families through a carer support group or on a social basis are shown in Table 5.6.
- Around one-half of carers (48%) reported that they had met other carer families through a carer support group or on a social basis. One in seven carers (14%) met other carer families at least once fortnightly and a similar proportion met other carer families every month. The remainder either met other carer families a few times a year (18%) or less than once a year (2%)
- There were some differences between foster carers and relative/kinship carers and between male and female carers regarding meeting other carer families, with the frequency of contact being also slightly higher for foster care families and for male carers.
- Foster carers were much more likely to meet with other carer families than relative/kinship carers (65% vs 32%). In contrast, relative/kinship carers were more likely than foster carers to have never met other carer families (68% vs 35%).
- A slightly higher proportion of male carers than female carers had never met other carer families (59% vs 52%).
| Care type | Carer's gender |
All (%) | |||
|---|---|---|---|---|---|
| Foster carers (%) | Relative/kinship carers (%) | Males (%) | Females (%) | ||
| Fortnightly or more often | 20.7 | 8.7*** | 9.3 | 15.1* | 14.4 |
| Monthly | 17.4 | 9.7 | 10.7 | 13.7 | 13.3 |
| 1-6 times a year | 25.0 | 11.3 | 18.4 | 17.7 | 17.7 |
| Less often | 2.1 | 2.1 | 2.6 | 2.0 | 2.1 |
| Never | 34.9 | 68.2 | 59.0 | 51.5 | 52.5 |
| Number of carers | 1,182 | 1,001 | 264 | 1,920 | 2,185 |
Notes: Percentages are based on weighted data. The sum of responses may exceed 100% due to rounding. Excludes carers with a response of "don't know".
Carers who had met with other carer families provided positive views about opportunities to meet such families.
- One-third (35%) reported that they were very satisfied, and 43% were satisfied. Only 6% were either dissatisfied or very dissatisfied. The remainder (15%) had the view of being neither satisfied or dissatisfied.
- The positive views about these opportunities of meeting other carer families were apparent regardless of care types and gender of carers, with 77-80% of the groups reporting to be either satisfied or very satisfied.
Of note, for carers who had not met with other foster or relative/kinship carers, only 37% said they would like to have this contact.
5.7 Summary
This section focused on the information collected in the survey regarding services and supports available to assist carers in their caring role. While this mainly applied to the services used by the carer for the children in their care (study child and other children in care), the survey also collected information about the training and professional support carers had received, and the level of contact with their caseworker/carer support worker and other foster or relative/kinship care families.
Service use
The vast majority of carers (90%) had used at least one service for caring for the study child and or other children who were placed in their care, with over half (54%) using three or more services. Over two-thirds of carers had received at least one type of services in the past six months. Over half of carers indicated that they had contacted with carer support staff from their government child protection department and child counselling/psychologist services.
Overall, foster carers had received more services than relative/kinship carers, with the one exception being carer support staff from the government child protection department, of whom a greater proportion of relative/kinship carers than foster carers reported using. Eight in ten foster carers received at least one type of service support in the past six months while less than six in ten relative/kinship carers received at least one type of service.
When asked about the services they currently needed, the most commonly identified service was child counselling/psychologist services (at 50%), followed by carer support staff from a government child protection department (43%), and respite care services and carer support teams from non-government organisations and agencies (both at 36%). These services were also identified as commonly having unmet service needs. Overall, nearly eight in ten carers reported currently needing at least one service (regardless of whether they were currently using it) and two thirds of carers had unmet needs for at least one type of service. Foster carers were more likely than relative/kinship carers to indicate a service need.
Almost half (47%) of carers with a need for at least one type of service (nearly four in ten carers overall) said that they had some difficulty in getting the professional support they needed, with the most commonly reported barrier being long waiting lists/low support staff availability.
In relation to the Grandparent Adviser Phone Line, just over a quarter of carers were aware of this service, with one-quarter of the carers who were aware of it reporting that they had used it and generally reflecting positively on their experience. These data suggest that there exists an opportunity for services to be targeted or promoted to all carers more effectively, so they can be made aware of the service and its purpose, and use it when they required.
Carers' preparedness for the caring role and training
Carers were asked about how well prepared they felt for the caring role, with almost two-thirds (64%) indicating that they felt very well or well prepared. Nevertheless, 16% said that they were poor or very poorly prepared for their caring role, with a higher proportion of foster carers than relative/kinship carers reporting this (22% vs 11%).
Almost two-thirds of carers (62%) also reported that they had attended some form of training course or workshop to assist them in their caring role, with 40% undertaking training in the past year. There were large differences between foster and relative/kinship carers in regards to training, with 92% of foster carers reporting that they had received some form of training, in comparison to only just over a third (35%) of relative/kinship carers.
Training was most commonly received through carers' out-of-home-care agencies and, generally speaking, carers who had attended a training course or workshop in the past year had found it to be helpful. It is important to note that among carers who had not attended any training, views were mixed about whether it would have been helpful to do so, particularly among relative/kinship carers; more specifically, only 38% of relative/kinship carers who had not attended training thought it would have been helpful, compared to 56% of foster carers.
Contact with caseworker/carer support worker and other carer families
The majority of carers were in contact with a caseworker/carer support worker at least once a month, with foster carers tending to have more frequent contact than relative/kinship carers. For relative/kinship carers, their caseworker/carer support worker was most likely to be from a government department, while for foster carers, the contact was equally likely to be from a government department or non-government caseworker/care support worker. Overall, carers were satisfied with the advice or assistance received from their caseworker/carer support worker in their most recent contact, with only 14% expressing dissatisfaction.
Finally, carers were asked about the level of contact they had had with other carer families. Just under one-half reported that they had met other carer families through a carer support group or on a social basis. Foster carers (at 65%) were much more likely to report this type of contact than relative/kinship carers (at 32%).
Similar to the results for training, not all carers who reported an absence of this type of support believed that they needed it or would like to have this contact (i.e., only 37% said they would like to have it). Hence, while the results indicate on the one hand that there may be a need for greater carer support groups or social contact, particularly for relative/kinship families, not all carers feel they require this type of support or would use it, even if it were available.
16 The analysis by gender is not shown due to small sample sizes of male carers who used each of the services.
6. Rewards and challenges
To better understand the experiences of carers the survey also examined their attitudes about being a carer. This included understanding the extent to which they thought they could make a difference to the lives of children in their care (the rewards) and the challenges of being a carer. Carers were also asked whether they would consider looking after another child in the future.
6.1 Rewards and challenges
Carers were asked of their agreement or disagreement with a series of statements that considered both the rewards and the challenges they experienced in caring for a child/children in out-of-home care. These questions sought to understand their overall experiences of being a carer for children in out-of-home care, not just for the study child (although some carers may not have cared for any other children). Carers' responses are summarised in Table 6.1.
- Almost all (over 90%) of carers strongly agreed/agreed that they could make a positive difference in the life of a child, provide the child with a positive family experience, and that looking after a child was a rewarding experience. The majority of carers also indicated that their family was happy for the child to be living with them (88%).
- Not surprisingly, carers also faced various challenges in looking after children in out-of-home care. Almost half (48%) of carers strongly agreed/agreed that looking after a child was very stressful, and 63% of carers strongly agreed/agreed that managing a child's behaviour was difficult, and that looking after a child in out-of-home care required more time/effort than another child of the same age and gender.
- However, two-thirds (67%) of carers disagreed/strongly disagreed that caring for a child had a negative effect on their relationship with other family members, while over half (54%) disagreed/strongly disagreed that caring for a child made it difficult for them to meet other family/work responsibilities, and that they were monitored too closely in looking after a child as part of an out-of-home-care placement (57%).
- Two-thirds (67%) of carers strongly agreed/agreed that they had adequate financial resources to care for a child, and 57% strongly agreed/agreed it was important for the child to keep in contact with their birth parents.
- It is also worth noting that most carers (88%) felt they should be provided with legal assistance to sort out care arrangements if needed.
| Care type | Carer's gender | All (%) | |||
|---|---|---|---|---|---|
| Foster carers (%) | Relative/kinship carers (%) | Males (%) | Females (%) | ||
| (1) I can make a positive difference in the life of a child | |||||
| Strongly agree/agree | 97.6 | 96.0 | 97.2 | 96.7 | 96.8 |
| Mixed feelings | 2.0 | 2.9 | 1.8 | 2.6 | 2.5 |
| Disagree/strongly disagree | 0.4 | 1.1 | 1.0 | 0.7 | 0.7 |
| Total | 100.0 | 100.0 | 100.0 | 100.0 | 100.0 |
| (2) I can provide a child with a positive family experience | |||||
| Strongly agree/agree | 97.8 | 95.3** | 95.3 | 96.6 | 96.4 |
| Mixed feelings | 1.9 | 3.2 | 3.6 | 2.4 | 2.6 |
| Disagree/strongly disagree | 0.3 | 1.5 | 1.1 | 1.0 | 1.0 |
| Total | 100.0 | 100.0 | 100.0 | 100.0 | 100.0 |
| (3) Looking after a child is a rewarding experience | |||||
| Strongly agree/agree | 92.5 | 90.1* | 90.9 | 91.3 | 91.2 |
| Mixed feelings | 7.1 | 8.7 | 7.8 | 7.9 | 7.9 |
| Disagree/strongly disagree | 0.4 | 1.3 | 1.3 | 0.8 | 0.9 |
| Total | 100.0 | 100.0 | 100.0 | 100.0 | 100.0 |
| (4) Managing a child's behaviour is difficult | |||||
| Strongly agree/agree | 68.7 | 57.3*** | 66.4 | 62.1 | 62.7 |
| Mixed feelings | 18.9 | 19.2 | 17.1 | 19.4 | 19.1 |
| Disagree/strongly disagree | 12.4 | 23.5 | 16.6 | 18.5 | 18.2 |
| Total | 100.0 | 100.0 | 100.0 | 100.0 | 100.0 |
| (5) My family is happy for a child to live with us in out-of-home care | |||||
| Strongly agree/agree | 91.7 | 85.2*** | 86.3 | 88.6* | 88.3 |
| Mixed feelings | 6.7 | 11.7 | 9.1 | 9.3 | 9.3 |
| Disagree/strongly disagree | 1.6 | 3.1 | 4.6 | 2.0 | 2.4 |
| Total | 100.0 | 100.0 | 100.0 | 100.0 | 100.0 |
| (6) Caring for a child makes it difficult for me to meet other family/work responsibilities | |||||
| Strongly agree/agree | 28.6 | 33.9** | 28.8 | 31.7 | 31.4 |
| Mixed feelings | 17.2 | 12.9 | 16.7 | 14.6 | 14.9 |
| Disagree/strongly disagree | 54.3 | 53.3 | 54.5 | 53.6 | 53.7 |
| Total | 100.0 | 100.0 | 100.0 | 100.0 | 100.0 |
| (7) Caring for a child in out-of-home care has a negative effect on my relationship with other family members | |||||
| Strongly agree/agree | 12.6 | 18.3*** | 17.7 | 15.2 | 15.6 |
| Mixed feelings | 17.4 | 18.0 | 17.4 | 17.8 | 17.7 |
| Disagree/strongly disagree | 70.0 | 63.7 | 64.8 | 67.0 | 66.7 |
| Total | 100.0 | 100.0 | 100.0 | 100.0 | 100.0 |
| (8) Looking after a child in out-of-home care is very stressful | |||||
| Strongly agree/agree | 50.8 | 45.1*** | 48.4 | 47.6 | 47.8 |
| Mixed feelings | 29.2 | 25.8 | 26.3 | 27.7 | 27.5 |
| Disagree/strongly disagree | 20.0 | 29.1 | 25.3 | 24.7 | 24.8 |
| Total | 100.0 | 100.0 | 100.0 | 100.0 | 100.0 |
| (9) Looking after a child in out-of-home care requires more time/effort than another child of the same age and gender | |||||
| Strongly agree/agree | 72.2 | 53.7*** | 62.3 | 62.6 | 62.5 |
| Mixed feelings | 12.9 | 13.4 | 11.3 | 13.4 | 13.2 |
| Disagree/strongly disagree | 14.9 | 32.9 | 26.4 | 24.0 | 24.3 |
| Total | 100.0 | 100.0 | 100.0 | 100.0 | 100.0 |
| (10) I have the financial resources to adequately care for a child in out-of-home care | |||||
| Strongly agree/agree | 69.0 | 65.0 | 64.6 | 67.2 | 66.9 |
| Mixed feelings | 18.8 | 19.8 | 19.3 | 19.3 | 19.3 |
| Disagree/strongly disagree | 12.2 | 15.2 | 16.1 | 13.5 | 13.8 |
| Total | 100.0 | 100.0 | 100.0 | 100.0 | 100.0 |
| (11) It is important for a child in out-of-home care to keep in contact with their parents | |||||
| Strongly agree/agree | 57.3 | 56.6*** | 54.6 | 57.3 | 56.9 |
| Mixed feelings | 37.5 | 34.0 | 35.7 | 35.7 | 35.7 |
| Disagree/strongly disagree | 5.2 | 9.4 | 9.8 | 7.0 | 7.4 |
| Total | 100.0 | 100.0 | 100.0 | 100.0 | 100.0 |
| (12) I'm monitored too closely in looking after a child in out-of-home care | |||||
| Strongly agree/agree | 25.3 | 25.7 | 22.8 | 25.9 | 25.5 |
| Mixed feelings | 19.6 | 15.7 | 17.8 | 17.5 | 17.5 |
| Disagree/strongly disagree | 55.1 | 58.7 | 59.4 | 56.6 | 57.0 |
| Total | 100.0 | 100.0 | 100.0 | 100.0 | 100.0 |
| (13) Carers should be provided with legal assistance to sort out care arrangements if required | |||||
| Strongly agree/agree | 81.1 | 90.8*** | 86.8 | 86.0 | 86.1 |
| Mixed feelings | 14.0 | 6.2 | 8.9 | 10.1 | 9.9 |
| Disagree/strongly disagree | 4.9 | 3.1 | 4.3 | 3.9 | 3.9 |
| Total | 100.0 | 100.0 | 100.0 | 100.0 | 100.0 |
| Number of respondents | 1,172~1,194 | 971~997 | 260~267 | 1,903~1,925 | 2,154~2,192 |
Notes: Percentages are based on weighted data and small numbers of respondents' "Don't know" answers are excluded from the analysis for each item. Sample sizes are unweighted (0.5% to 2% across 13 times). For each item, design-based chi-square test was used to assess statistically significant differences between foster carers and relative/kinship carers. (*p < .05; **p < .01; ***p < .001). Percentages may not total exactly 100.0% due to rounding.
Patterns of agreement and disagreement with the statements were similar between male and female carers, as well as between foster and relative/kinship carers. Nevertheless, there were differences between foster and relative/kinship carers regarding some statements on challenges and difficulties.
- Foster carers were more likely than relative/kinship carers to strongly agree/agree that managing a child's behaviour is difficult (69% vs 57%), that looking after a child as part of an out-of-home-care placement required more time and effort than another child of the same age and gender (72% vs 54%), and that looking after a child in out-of-home care was very stressful (51% vs 45%).
- On the other hand, foster carers were also more likely to strongly agree/agree that their family was happy for a child to live with them (92% vs 85%), and less likely than relative/kinship carers to strongly agree/agree that caring for a child made it difficult for them to meet other family/work responsibilities (29% vs 34%).
Table 6.2 focuses on carers' level of agreement or disagreement to a set of statements relating to their perceived level of support in caring for the study child.
- Most relative/kinship carers (72%) strongly agreed/agreed that there was no other relative who was able to look after the study child.
- Two-thirds of carers (66%) agreed that the contact arrangements with the study child's parents were manageable.
- A slightly higher proportion of foster carers than relative/kinship carers agreed that the contact arrangements with the study child's biological parents were manageable (71% vs 63%).
- Only one-half (51%) of carers strongly agreed/agreed that the allowances received for looking after the study child were adequate to meet the financial costs and time they put into caring for them, while 66% agreed that they felt well-supported by government/non-government agencies and carer support services in meeting the health and mental health needs of the study child.
- Foster carers were slightly more likely than relative/kinship carers to feel supported by agencies/services in meeting the study child's needs (59% vs 54%).
| Care type | Carer's gender | All (%) | |||
|---|---|---|---|---|---|
| Foster carers (%) | Relative/kinship carers (%) | Males (%) | Females (%) | ||
| (1) No other relative to look after study child (kinship care only) | |||||
| Strongly agree/agree | - | 71.5 | 65.2 | 72.4 | - |
| Mixed feelings | - | 9.4 | 10.9 | 9.1 | - |
| Disagree/strongly disagree | - | 19.1 | 23.9 | 18.5 | - |
| Total | - | 100.0 | 100.0 | 100.0 | - |
| (2) Allowances received were adequate to care for study child | |||||
| Strongly agree/agree | 48.5 | 53.4 | 50.0 | 51.1 | 51.0 |
| Mixed feelings | 19.7 | 17.9 | 16.9 | 19.1 | 18.2 |
| Disagree/strongly disagree | 31.8 | 28.7 | 33.2 | 29.8 | 30.2 |
| Total | 100.0 | 100.0 | 100.0 | 100.0 | 100.0 |
| (3) Contact arrangements with study child's biological parent(s) were manageable | |||||
| Strongly agree/agree | 70.5 | 62.8** | 67.0 | 65.9 | 66.1 |
| Mixed feelings | 16.6 | 21.7 | 16.1 | 20.0 | 19.5 |
| Disagree/strongly disagree | 13.0 | 15.5 | 16.9 | 14.0 | 14.4 |
| Total | 100.0 | 100.0 | 100.0 | 100.0 | 100.0 |
| (4) Felt supported by agencies/services in meeting study child's needs | |||||
| Strongly agree/agree | 59.2 | 53.6** | 55.7 | 56.3 | 56.3 |
| Mixed feelings | 20.3 | 19.2 | 20.3 | 19.7 | 19.8 |
| Disagree/strongly disagree | 20.5 | 27.2 | 24.0 | 24.0 | 24.0 |
| Total | 100.0 | 100.0 | 100.0 | 100.0 | 100.0 |
| Number of carers | 802~1,186 | 962~999 | 120~261 | 841~1,916 | 962~2,178 |
Note: Percentages are based on weighted data and small numbers of respondents' "Don't know" answers were excluded from the analysis for each item. Sample sizes are unweighted. For each item, design-based chi-square test was used to assess statistically significant differences between foster carers and relative/kinship carers. (*p < .05; **p < .01; ***p < .001). Percentages may not total exactly 100.0% due to rounding.
6.2 Rewards and challenges by care experiences
Analyses were also undertaken to explore the relationship between carers' views on both the rewards and challenges they experienced in caring for a child in OOHC and their own or the study child's characteristics, as well as their care circumstances. Given the large number of items measuring both the rewards and challenges they have experienced, a principal component analysis on the 13 items (as shown in Table 6.1) was undertaken, with two scales derived. The first scale was based on four items: "I can make a positive difference in the life of out-of-home-care child", "I can provide an out-of-home-care child a positive family experience", "Looking after an out-of-home-care child is a rewarding experience", and "My family is happy for an out-of-home-care child to live with us". The second scale was derived from five items: "Managing an out-of-home-care child's behaviour is difficult", "Caring for an out-of-home-care child makes it difficult for me to meet my other family/work responsibilities", "Caring for an out-of-home-care child has a negative effect on my family relationships", "Looking after an out-of-home-care child is stressful", and "Looking after an out-of-home-care child requires much more time and effort than would be required for looking after virtually any other child of the same age and gender". Responses to each item were scored from "1" (strongly disagree) to "5" (strongly agree). Each of the two scales was formed by taking the mean of responses to the component items. To make the scales easier to interpret, each scale was then rescaled to 0-10. The first scale is referred to as the "rewards scale", with a higher score indicating higher perceived rewards for caring for out-of-home-care children (mean score: 8.89). The second scale is referred to as the "challenges scale", with higher scores suggesting greater challenges or difficulties (mean score: 5.36).17
Table 6.3 shows the mean scores for the rewards and challenges scales by care experiences. The top panel displays the number of types of abuse/violence that study children experienced (including whether there was family violence in their original home, and whether any household members had alcohol or addiction problems) while the lower panel is in regards to whether the study child had any developmental condition(s).
- There was no link between carers' mean scores on the rewards scale and number of types of abuse/violence that the study children had experienced. However, carers whose study child had at least one developmental condition had a slightly (but statistically significant) lower mean rewards scale score compared to carers looking after a study child without any developmental conditions.
- Patterns regarding the challenges scale were different. The more forms of abuse, neglect or problems that study children had experienced, the significantly higher level of challenges carers felt, with mean scores ranging from 4.5 for carers caring for study children without any such experience to 5.8 for carers caring for study children with prior experience of four or more forms of abuse/violence. Likewise, carers looking after study children with developmental conditions indicated a significantly higher level of challenges than carers looking after study children without known developmental conditions.
| Rewards scale | Challenges scale | |
|---|---|---|
| Number of types of abuse/violence that study child experienced or was exposed to | ||
| None | 8.94 | 4.51 |
| 1 | 8.94 | 4.81** |
| 2 | 8.82 | 5.04*** |
| 3 | 8.79 | 5.30*** |
| 4+ | 8.91 | 5.83*** |
| Whether study child had any developmental condition | ||
| No | 8.95 | 5.17 |
| Yes | 8.77** | 5.71*** |
Note: Mean scores are based on weighted data. aStatistically significant difference in mean scores between the reference group (none) and each of other groups was tested based on regression (*p < .05; **p < .01; ***p < .001). bStatistically significant difference in mean scores between study children with and without any developmental conditions was tested based on regression.
Table 6.4 shows the proportions of carers who agreed or strongly agreed with each of the statements relating to study children by number of indicators of abuse, neglect and problems at home that the study child had experienced and also by whether the child had any developmental condition.
- Overall, carers who looked after a child with multiple forms of abuse, neglect or problems at home were less likely than other carers to feel that they received adequate allowances, that contact with the child's parents was manageable, and that they were well supported in meeting the child's health and mental health needs. For example:
- Comparing carers who reported that the child had previously experienced at least four indicators of abuse, neglect or problems at home with those who were aware of none or one indicator of abuse, neglect or problems at home that the child had experienced, the proportions in agreement with:
- received adequate allowances for looking after the study child: 46% vs 57%
- contact arrangement with the study child's parents were manageable: 63% vs 72-74%; and
- well supported by agencies and services in meeting the health and mental health needs of the study child: 52% vs 59-62%.
- Comparing carers who reported that the child had previously experienced at least four indicators of abuse, neglect or problems at home with those who were aware of none or one indicator of abuse, neglect or problems at home that the child had experienced, the proportions in agreement with:
| No other relatives able to look after the study child (%) | Allowances received are adequate (%) | Contact arrangement with the study child's parents are manageable (%) | Well supported by agencies and support services in meeting the health and mental health needs of the study child (%) | |
|---|---|---|---|---|
| Number of indicators of abuse, neglect and problems at home that the study child previously experienced | ||||
| None | 65.9 | 56.5 *** | 71.6 * | 61.8 *** |
| 1 | 72.0 | 57.0 | 73.5 | 59.4 |
| 2 | 68.2 | 56.2 | 67.8 | 60.9 |
| 3 | 70.1 | 53.0 | 64.5 | 61.9 |
| 4+ | 74.6 | 46.1 | 62.8 | 50.8 |
| Whether study child had any developmental condition | ||||
| No | 28.5 | 47.4 | 65.8 | 58.3* |
| Yes | 28.4 | 51.9 | 66.6 | 52.4 |
Notes: Percentages are based on weighted data. For each item, a design-based chi-square test was used to assess statistically significant difference across a number of indicators, and between study children with and without any developmental condition (*p < .05; **p < .01; ***p < .001).
6.3 Likelihood of looking after other children in out-of-home care in the future
Carers were asked about the likelihood of being a formal carer of another child in the future. Figure 6.1 summarises carers' responses overall, by care type and by gender.
- Overall, four in ten carers indicated that they were either likely or very likely to look after another child in the future. However, nearly one-half of carers (49%) held the opposite view, that they were unlikely or very unlikely to do so in the future.
- Views on the likelihood of looking after another child were very different between foster and relative/kinship carers, and also somewhat different between male and female carers.
- Foster carers were much more likely than relative/kinship carers to express that they would be a carer once again (58% vs 26%).
- A higher proportion of female carers than male carers reported that they would be a carer again in the future (42% vs 33%).
Figure 6.1: How likely carers were to look after another child in out-of-home care in the future, by care type and by gender
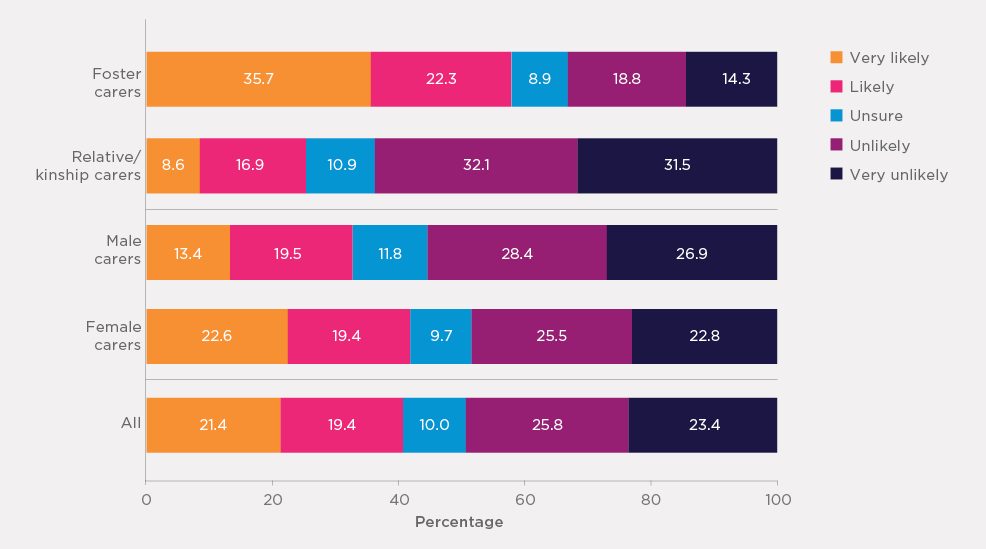
Note: Percentages are based on weighted data.
To explore what factors other than care type and gender may influence a carer's intention to care for another child in the future, a logistic regression analysis was conducted. The regression sought to answer the following questions:
- To what extent was the likelihood of looking after other children in the future linked with carers' reports of motivations and challenges?
- Was the likelihood of continuing in a caring role in the future also linked with other factors such as carers' demographic characteristics?
The results for the regression analysis are shown in Table 6.5. In this analysis, very likely and likely to be a carer again are coded as 1, and other than likely (unsure, unlikely, and very unlikely) is coded as 0. The table presents the odds ratios (see Box 1 for interpretation of odds ratios) of the likelihood of being a carer in the future for each variable. Three models were conducted, with the first model containing the rewards and challenges scales, along with the other variables. The second model contained the two items of whether carers believed they received adequate allowances for looking after the study child and whether they felt well supported. Finally, the third model contained both sets of variables.
- Consistent with the patterns discussed earlier in this section, the likelihood of reporting an intention to be a carer in the future was lower for relative/kinship carers than foster carers.
- Older carers (aged 40 years or older) were more likely to report intentions of being a carer in the future compared with younger carers (under 40 years).
- Carers living with a partner were also less likely than carers who were single to report that they were likely to be a carer in the future, which may reflect the impact of caring for children in out-of-home care on a couple's relationship.
- Carers looking after study children aged 5 years and older were less likely than those caring for pre-school study children (under 5 years) to express a desire to look after another child in the future.
- Looking after study children who experienced (and/or were exposed to) four or more forms of violence/abuse/neglect was associated with a lower likelihood of considering caring for another child.
- Higher reward scale scores (i.e., higher perceptions of caring for a child as rewarding) were associated with a higher likelihood of being a carer in the future, while higher challenges scale scores (i.e., facing greater challenges in looking after children) were linked with a lower likelihood of being a carer in the future. These patterns were still evident after controlling for carers' views about allowances, the level of support received, carers' characteristics and the study child's age.
- The higher level of agreement with the statements on receiving adequate allowances for caring for study children and feeling well supported by government and agencies was associated with a higher likelihood of being a carer in the future (as shown in Model 2). The effects were either largely reduced or no longer statistically significant once controlling for the rewards and challenges scales.
| Model 1 | Model 2 | Model 3 | |
|---|---|---|---|
| Relative/kinship carer | 0.24*** | 0.24*** | 0.24*** |
| Female | 1.24 | 1.25 | 1.24 |
| Age of carer | |||
| (less than 40 years) | |||
| 40-49 | 0.63** | 0.64** | 0.63** |
| 50-64 | 0.62** | 0.60*** | 0.62** |
| 65+ | 0.42*** | 0.39*** | 0.41*** |
| Living with a partner | 0.64*** | 0.64*** | 0.64*** |
| Study child's age | |||
| (under 5 years) | |||
| 5-11 | 0.61*** | 0.58*** | 0.61*** |
| 12-14 | 0.64** | 0.59*** | 0.64** |
| 15-18 | 0.68* | 0.62** | 0.68* |
| Number of abuse/neglect that study child experienced or was exposed to | |||
| none | |||
| 1 | 0.84 | 0.83 | 0.84 |
| 2 | 1.32 | 1.26 | 1.32 |
| 3 | 1.09 | 0.98 | 1.07 |
| 4+ | 1.45* | 1.37* | 1.46* |
| Study child had developmental issue/condition | 1.07 | 1.04 | 1.08 |
| Reward scale (0-10) | 1.29*** | 1.27*** | |
| Challenge scale (0-10) | 0.94** | 0.94* | |
| Level of agreement that the allowances received for the study child are adequate (1-5, from strongly disagree to strongly agree) | 1.03 | 1.02 | |
| Level of agreement with feeling well supported by agencies and service providers (1-5, from strongly disagree to strongly agree) | 1.14** | 1.08 | |
| Constant | 0.42 | 1.86* | 0.32* |
| Chi square | 373.84 | 343.33 | 379.47 |
| Degree of freedom | 16 | 16 | 18 |
| Pseudo r2 | 0.13 | 0.11 | 0.13 |
| Number of carers | 2,156 | 2,184 | 2,155 |
Notes: For categorical variables, the reference category is shown in brackets. *p < .05, **p < .01, ***p < .001.
Box 1: Interpretation of logistics regression odds ratios
The likelihood of looking after another child in out-of-home care in the future was coded as a binary variable (1 if very likely or likely, 0 if unsure, unlikely or very unlikely) and therefore logistic regression was used. Odds ratio is a relative measure, here indicating how the "odds" of being likely to look after another child would be given a specific characteristic (e.g., female carers) compared to the "odds" of a reference group (e.g., male carers). If an odds ratio of 1 indicates no difference between the group in interest and the reference group, an odds ratio of less than 1 indicates that the group in interest had a lower likelihood relative to the reference group while an odds ratio of greater than 1 means a higher likelihood. For example, in Model 1, the odds ratio for female carers is 1.24, which means that the odds of likely looking after another child for female carers was 1.24 times of that of male carers. However, this was not statistically significant.
Among the carers who said that they were unlikely or very unlikely to be the formal carer of another child in out-of-home care in the future, a sub-group of carers (n = 99) was randomly selected and asked why they felt this way. The first main theme to emerge from the analysis of these carers' responses was that they felt too old to continue as a carer in the future (identified by n = 37 carers; with approximately half being foster carers and the other half being relative/kinship carers). Direct quotes from carers on this theme are as follows:
I am getting too old! I want to travel when they grow up. (Relative/kinship carer)
I'm in my 70s - 71 now - although I can look after other kids, I'd be worried being at the age I'm at now if I had another child put into my care. (Relative/kinship carer)
I am getting a bit old and tired. (Foster carer)
Another theme to arise from the analysis of carers' responses of why they did not see themselves continuing as a formal carer in the future was the stress/emotional investment associated with being a carer (identified by n = 11 carers; 64% of whom were foster carers). Responses reflective of this theme were:
It's an emotional rollercoaster. It takes its toll on you. (Relative/kinship carer)
I'm close to burnt out and over fighting the bureaucracy. It's not the children, it's the bureaucracy. (Foster carer)
A third theme to emerge was that some carers felt that they already had responsibility for enough children and could not envisage caring for any more children in the foreseeable future (identified by n = 15 carers; with approximately half being foster carers and the other half being relative/kinship carers). Responses from carers on this theme are as follows:
We have four children in the house, and that's stretching us as much as we can go, maybe we can when they've grown. (Relative/kinship carer)
I'm a single parent and have four children to care for currently. I'm not Wonder Woman. (Relative/kinship carer)
A final theme to emerge from the responses of a number of relative/kinship carers (n = 20) is that they were not expecting there to be any more relatives that would require care in the future, as exemplified by responses such as:
Because most of my nieces and nephews are all grown up now, I've had pretty much all of them over the years. (Relative/kinship carer)
I do it for my family (no other children expected to be in this situation). (Relative/kinship carer)
6.4 Summary
The analysis in this section revealed that carers in general saw caring for children in out-of-home-care as a rewarding experience that contributed to improving the lives of these vulnerable children. Specifically, regardless of care type and gender, the vast majority of carers (over 90%) strongly agreed/agreed that they could make a positive difference in the life of a child, provide them with a positive family experience, and that it was a rewarding experience to care for these children.
Nevertheless, carers also revealed the significant challenges they had faced in carrying out their caring role. Nearly one-half agreed that caring for children in out-of-home care was stressful, and an even higher proportion agreed that it was difficult to manage children's behaviours and that these children required more time or effort than other children of the same age. These views were particularly salient among foster carers. It is not surprising that carers reported more challenges if children had previously experienced or been exposed to more types of abuse/violence/neglect, or had one or more developmental conditions.
Carers were also asked for their views on allowances received and support provided by agencies/services during their time of looking after the study child. Around one-half of carers agreed that the allowances received for the study child were adequate and that they were well supported by agencies/services. However, nearly one-quarter felt that the allowances received were not adequate to care for the study child and three in ten did not feel well supported by agencies/services in meeting the study child's needs. The feelings of there being inadequate allowances and support were more prevalent among relative/kinship carers than foster carers. Such feelings were also particularly evident among carers looking after study children who had experienced or were exposed to at least four types of abuse/violence/neglect, which is not surprising given the varying levels of support needs reported by carers for the children in their care (as outlined earlier in this report) across services such as respite care, child counselling/psychology services, and disability support services.
Although carers had a strong sense of benevolence and rewards, views on how likely they were to look after another child in the future were split, with four in ten indicating they were likely or very likely and nearly one-half reporting the opposite (i.e., unlikely or very unlikely). While the majority of foster carers were likely to be a carer again in the future, the majority of relative/kinship carers felt it was unlikely they would be a carer again. This pattern was also reflected in the finding that seven in ten relative/kinship carers said that the study child came into their care because no other relatives were able to look after the study child. Their care experience also influenced carers' outlook of being a carer again in the future. A greater likelihood of being a carer again in the future was associated with a higher sense of rewards, a lower level of challenges, the perception of receiving adequate allowances and feeling well supported in meeting the study child's needs.
For carers who indicated that they were unlikely to care for another child in the future and who responded to the open-ended question as to why, some said that it was because they felt they were getting "too old" and they had other things that they wanted to move on to in life, such as travelling. Other carers indicated that the emotional investment that is required to care for a child in out-of-home care had taken its toll, while some carers also said that their hands were already too full (with either their own and/or other children in out-of-home care) to take on any additional children in the foreseeable future. While there was a relatively even split between foster and relative/kinship carers in regards to how often they cited these various reasons for not being likely to take on another child in the future, a further reason commonly provided by relative/kinship carers was that they were not expecting there to be any additional relatives who would require an out-of-home-care placement.
17 Regarding internal consistency, Cronbach's alpha was .65 for the rewards scale, and it was .77 for the challenges scale.
7. Carer wellbeing and family relationships
Most of the study children were reported to have experienced and/or been exposed to different (and often multiple) forms of violence, abuse, neglect or other family issues, and a proportion of study children was reported by their carers as having at least one developmental condition. Many carers also indicated significant challenges in their everyday care of the children, which was associated with a lower likelihood of looking after other children in the future. This section examines how carers are doing themselves, how their family relationships are in the context of caring for children in out-of-home care, and the extent to which these factors are associated with their care experience.
7.1 General patterns of carers' wellbeing and family relationships
The aspects of carers' wellbeing investigated as part of the survey included carers' physical and mental health, the presence of any long-term medical conditions/disabilities (for carers and their partners), and carers' overall satisfaction with life. The results from these wellbeing measures are presented in Table 7.1. The table also shows the results by care type and by gender of carers.
Regarding carers' general health:
- The majority of carers (60%) rated their health as "excellent" or "very good", with a further 28% rating their health as "good". Only 12% of carers believed that, in general, their health was "fair" or "poor".
- Close to one-quarter of carers (23%) indicated that they had a disability or medical condition that was likely to last for six months or more and cause them difficulties in everyday life. In addition, one-fifth (21%) of carers living with a partner reported that their partner had a disability or such a medical condition.
- Reports of general health differed to some extent by care type:
- When comparing the care types for self-rated health, relative/kinship carers were less likely to rate their health as being "excellent" or "very good" in comparison to foster carers (53% vs 67%), with conversely, relative/kinship carers being more likely than foster carers to rate their health as being "fair" or "poor" (16% vs 8%).
- Relative/kinship carers were more likely than foster carers to say that they had a disability or medical condition that was likely to last for six months or more (28% vs 18%, and, if living with a partner, that their partner had a disability or medical condition (26% vs 16%).
- Patterns in relation to general health also differed between male and female carers:
- A higher proportion of female carers than male carers rated their health as "excellent" or "very good"
(61% vs 51%). - Also, a higher proportion of male carers than female carers had a disability or medical condition (30% vs 22%), but the reports on whether their partner had a disability or medical condition were similar between male and female carers.
- A higher proportion of female carers than male carers rated their health as "excellent" or "very good"
| Care type | Carer's gender | All (%) | |||
|---|---|---|---|---|---|
| Foster carers (%) | Relative/kinship carers (%) | Males (%) | Females (%) | ||
| General health (self-rated) | |||||
| Excellent or very good | 67.0 | 53.4*** | 51.0 | 61.1*** | 59.9 |
| Good | 25.2 | 30.1 | 29.8 | 27.6 | 27.8 |
| Fair or poor | 7.8 | 16.5 | 19.2 | 11.3 | 12.3 |
| Total | 100.0 | 100.0 | 100.0 | 100.0 | 100.0 |
| Vitality (SF-36) | |||||
| Mean | 64.8 | 62.9* | 64.2 | 63.8 | 63.8 |
| SD | 19.6 | 19.5 | 18.4 | 20.0 | 19.8 |
| Mental health (SF-36) | |||||
| Mean | 81.4 | 79.1*** | 79.9 | 80.3 | 80.2 |
| SD | 14.3 | 15.4 | 15.8 | 15.1 | 15.2 |
| Medical conditions/disabilities (respondent carer) | |||||
| Yes | 17.9 | 28.2*** | 29.9 | 22.3** | 23.3 |
| No | 82.1 | 71.8 | 70.1 | 77.7 | 76.7 |
| Total | 100.0 | 100.0 | 100.0 | 100.0 | 100.0 |
| Medical conditions/disabilities (partner) | |||||
| Yes | 16.2 | 26.2*** | 21.9 | 20.9 | 21.1 |
| No | 83.8 | 73.8 | 78.1 | 79.1 | 79.0 |
| Total | 100.0 | 100.0 | 100.0 | 100.0 | 100.0 |
| Overall life satisfaction (rated from 0-10) | |||||
| High satisfaction (8-10) | 81.9 | 73.6*** | 71.0 | 78.5* | 77.6 |
| Moderate (5-7) | 17.2 | 22.9 | 25.6 | 19.4 | 20.2 |
| Low satisfaction (0-4) | 0.9 | 3.5 | 3.4 | 2.1 | 2.2 |
| Total | 100.0 | 100.0 | 100.0 | 100.0 | 100.0 |
| Mean | 8.4 | 8.1*** | 8.0 | 8.3* | 8.3 |
| SD | 1.4 | 1.5 | 1.6 | 1.5 | 1.5 |
| Number of carers | 1,188~1,194 | 1,001~1,004 | 263~266 | 1,924~1,933 | 2,191~2,199 |
Notes: Percentages are based on weighted data and small numbers of respondents' "Don't know" answers were excluded from the analysis for each item. Sample sizes are unweighted. For each item, a design-based chi-square test was used to assess statistically significant differences between foster carers and relative/kinship carers. (*p < .05; **p < .01; ***p < .001). Percentages may not total exactly 100.0% due to rounding.
Two scales shown in Table 7.1 are the vitality and mental health scales that are part of the SF-36 (the 36-Item Short-Form Survey; Ware, Snow, Kosinski, & Gandek, 1993). The Vitality scale was derived from responses to four items (e.g., feeling tired and "worn out", having lots of energy in the previous four weeks), with scores ranging from 0-100 and higher scores indicating higher energy levels. The Mental Health scale was based on five items (e.g., feeling nervous, whether he/she was a happy person), with scores ranging from 0-100 and higher scores indicating better mental health.
- The overall mean score for vitality was 64 on a scale of 0-100. The mean scores between foster and relative/kinship carers and between male and female cares were similar (63-65).
- For mental health, the overall mean was 80 on a scale of 0-100, suggesting carers tended to positively assess their mental health.
- Mean scores of the two scales were similar between male and female carers, but slightly differed between foster and relative/kinship carers.
- There was a marginal significant difference between the care types, with foster carers faring better in both measures (vitality mean scores: 65 vs 63; mental health mean scores: 81 vs 79). Although significant, the differences between the care types for these measures were quite small.
Carers were asked to rate their level of satisfaction with their life as a whole, where 0 was "completely dissatisfied" and 10 was "completely satisfied". "Low satisfaction" was classified as a score from 0-4, "moderate satisfaction" was a score of 5-7, and "high satisfaction" was a score of 8-10.
- Overall, the mean rating of life satisfaction was 8.3, indicating that carers were generally satisfied with their life overall. The majority (78%) of carers reported high levels of satisfaction with their lives.
- While carers tended to have high ratings for their overall life satisfaction, foster carers were more satisfied with their life in comparison to relative/kinship carers. The proportion of carers who were highly satisfied with their life (i.e., provided ratings of 8-10) was 82% for foster carers and 74% for relative/kinships carers.
- Female carers reported higher levels of life satisfaction than male carers (high satisfaction: 79% vs 71%)
Carers' ratings on their satisfaction with various family relationships including their relationship with the study child are shown in Table 7.2. The figure shows mean ratings of satisfaction with the following relationships: a) your relationship with the study child; b) your partner's relationship with the study child; c) how the study child got along with other children in the household; d) your relationship with your partner; and e) your relationship with your children in the household. (The rating options ranged from 0 = "completely dissatisfied" to 10 = "completely satisfied".)
Regarding relationships with study children:
- Carers' ratings of their satisfaction with their relationship with the study child were high, with the mean rating of 9.0 on a scale of 0-10, and 87% providing ratings of 8-10 (indicating high satisfaction).
- Carers living with a partner also rated high levels of satisfaction with their partner's relationship with the study child, with the mean rating being 8.9, and 85% being highly satisfied (ratings of 8-10).
- Carers who had their own children (including step-children) in the household were also satisfied overall with how the study child got along with other children in the household, with a mean rating of 8.9, and 69% being highly satisfied (ratings of 8-10).
While carers generally expressed high levels of satisfaction with their relationships concerning study children, there were some differences between foster and relative/kinship carers and between male and female carers.
- Ratings of satisfaction with these types of relationships by foster carers were slightly lower than they were for relative/kinship carers. For example, the proportions of carers who reported high satisfaction (ratings of 8-10) by care type were different in regard to:
- the carer's own relationship with the study child: 83% of foster carers, compared to 89% of relative/kinship carers;
- their partner's relationship with the study child: 83% of foster carers, compared to 88% of relative/kinship carers; and
- how the study child got along with other children: 66% of foster carers, compared to 72% of relative/kinship carers.
- Male carers were less satisfied with these relationships relating to study children. For example, the proportions of male and female carers who reported high satisfaction were:
- the carer's own relationship with the study child: 81% of male carers and 88% of female carers; and
- their partner's relationship with the study child: 81% of male carers and 86% of female carers.
| Care type | Carer's gender | All (%) | |||
|---|---|---|---|---|---|
| Foster carers (%) | Relative/kinship carers (%) | Males (%) | Females (%) | ||
| Your relationship with study child | |||||
| High satisfaction (8-10) | 83.4 | 89.8*** | 80.6 | 87.7** | 86.8 |
| Moderate satisfaction (5-7) | 15.0 | 8.9 | 17.2 | 11.0 | 11.8 |
| Low satisfaction (0-4) | 1.6 | 1.3 | 2.3 | 1.3 | 1.4 |
| Total | 100.0 | 100.0 | 100.0 | 100.0 | 100.0 |
| Mean | 8.79 | 9.12*** | 8.65 | 9.01 | 8.96 |
| SD | 1.66 | 1.30 | 1.55 | 1.46 | 1.48 |
| Number of carers | 1,186 | 1,001 | 265 | 1,923 | 2,189 |
| You partner's relationship with study child | |||||
| High satisfaction (8-10) | 82.6 | 87.9** | 81.0 | 85.9** | 85.1 |
| Moderate satisfaction (5-7) | 16.1 | 10.1 | 14.7 | 12.9 | 13.3 |
| Low satisfaction (0-4) | 1.3 | 2.0 | 4.3 | 1.1 | 1.6 |
| Total | 100.0 | 100.0 | 100.0 | 100.0 | 100.0 |
| Mean | 8.77 | 9.01** | 8.65 | 8.93** | 8.88 |
| SD | 1.58 | 1.44 | 1.86 | 1.45 | 1.53 |
| Number of carers | 796 | 571 | 203 | 1,164 | 1,368 |
| How study child gets along with other children in the household | |||||
| High satisfaction (8-10) | 66.3 | 71.8* | 63.0 | 69.8 | 69.0 |
| Moderate satisfaction (5-7) | 26.9 | 24.0 | 28.7 | 25.1 | 25.5 |
| Low satisfaction (0-4) | 6.8 | 4.1 | 8.3 | 5.1 | 5.5 |
| Total | 100.0 | 100.0 | 100.0 | 100.0 | 100.0 |
| Mean | 7.95 | 8.26** | 7.85 | 8.13* | 8.10 |
| SD | 2.21 | 1.78 | 2.16 | 1.98 | 2.01 |
| Number of carers | 867 | 623 | 174 | 1,318 | 1,492 |
| Your relationship with partner | |||||
| High satisfaction (8-10) | 92.0 | 89.7 | 87.1 | 91.7*** | 90.9 |
| Moderate satisfaction (5-7) | 7.2 | 8.0 | 8.1 | 7.4 | 7.6 |
| Low satisfaction (0-4) | 0.8 | 2.3 | 4.8 | 0.9 | 1.5 |
| Total | 100.0 | 100.0 | 100.0 | 100.0 | 100.0 |
| Mean | 9.15 | 9.11 | 8.86 | 9.18* | 9.13 |
| SD | 1.32 | 1.38 | 1.72 | 1.28 | 1.37 |
| Number of carers | 800 | 573 | 206 | 1167 | 1374 |
| Your relationship with your children in the household | |||||
| High satisfaction (8-10) | 91.9 | 90.9 | 90.4 | 91.6* | 91.4 |
| Moderate satisfaction (5-7) | 7.9 | 7.1 | 5.4 | 7.8 | 7.5 |
| Low satisfaction (0-4) | 0.2 | 2.0 | 4.2 | 0.7 | 1.1 |
| Total | 100.0 | 100.0 | 100.0 | 100.0 | 100.0 |
| Mean | 9.12 | 9.11 | 8.82 | 9.16 | 9.12 |
| SD | 1.15 | 1.29 | 1.57 | 1.19 | 1.24 |
| Number of carers | 396 | 270 | 71 | 596 | 667 |
Notes: Percentages are based on weighted data and small numbers of respondents' "Don't know" answers were excluded from the analysis for each item. Sample sizes are unweighted. For each item, a design-based chi-square test was used to assess statistically significant differences between foster carers and relative/kinship carers, statistically significant deference in mean ratings between foster carers and relative/kinship carers and male and female carers based on regression (*p < .05; **p < .01; ***p < .001). Percentages may not total exactly 100.0% due to rounding.
In relation to carers' own relationships with their partner and with their children in the household, carers also provided an overall positive picture, with mean ratings of 9.1 for both sets of relationships, and 91% being highly satisfied. Foster and relative/kinship carers shared similar views. Both male and female carers also reported high levels of satisfaction with their relationship with their partner and with their children. Nevertheless, the proportion of male carers who were highly satisfied with their relationship with their partner was slightly lower than it was for female carers (87% vs 92%).
7.2 Carers' wellbeing and family relationships and their carer experience
The following analysis examines whether carers' wellbeing measures and their satisfaction with family relationships were associated with their care experience. A multivariate analysis approach was adopted to control for various factors that may have affected carers' wellbeing (e.g., demographic characteristics, financial circumstances) and potentially confounded the results. An OLS regression was applied to three wellbeing measures and carers' satisfaction with five types of relationships. The three wellbeing measures were: the vitality scale, the mental health scale, and life satisfaction. Care experiences included: the number of indicators of abuse and/or neglect that study children experienced (including whether there was family violence in their original home, whether any household members had alcohol or addiction problems); whether the study child had any known developmental conditions; the rewards and challenges scales; and carers' levels of agreement/disagreement that adequate allowances were received and they felt supported by agencies/services in meeting the needs of the study child. The results are shown in Table 7.3.
- Study children's prior history of indicators of abuse/neglect appeared to be associated with lower levels of carer vitality, lower carer satisfaction with their relationship with the study child, and lower carer satisfaction with the relationship between the study child and other children in the household. Compared with carers whose study children had no such experience:
- Carers who cared for study children with three or more indicators of abuse/neglect reported lower levels of vitality.
- Carers who cared for study children with four or more indicators of abuse/neglect were less satisfied with their relationship with the study child, and with how the study child got along with other children in the household.
- Carers' wellbeing and family relationships were also associated with their views on rewards and challenges:
- Carers who reported a greater sense of reward in looking after children were more likely to report higher levels of wellbeing - that is, a higher vitality level, better mental health, higher satisfaction with life, and higher levels of satisfaction with each of the five types of family relationships.
- Carers who reported facing greater challenges in caring for children also reported lower scores on the wellbeing measures - that is, lower levels of vitality, poorer mental health, lower levels of satisfaction with life, and lower satisfaction with each of the five sets of family relationships.
- The perceived adequacy of the allowance received by carers was associated with two sets of relationships concerning study children. The stronger views of carers on the inadequacy of allowances received were linked with lower satisfaction in their relationship with the study child, and also with the relationship between their partner and the study child.
- Carers who felt well supported by agencies and services tended to report better wellbeing - that is, higher levels of vitality, better mental health, greater satisfaction with life, and better outcomes on family relationships (i.e., more highly satisfied with each of the five types of relationships).
| Vitality | Mental health | Life satisfaction | Your relationship with study child | Your partner's relationship with study child | How study child gets along with other children in the household | Your relationship with partner | Your relationship with your children in the household | |
|---|---|---|---|---|---|---|---|---|
| Relative/kinship carer | -1.372 | -1.123 | -0.199*** | 0.360*** | 0.275*** | 0.410*** | 0.012 | 0.009 |
| Female | -1.024 | -0.126 | 0.237** | 0.270** | 0.268** | 0.18 | 0.268** | 0.227 |
| Age of carer | ||||||||
| (less than 40 years) | ||||||||
| 40-49 | 3.501** | 0.727 | 0.136 | 0.251* | 0.188 | 0.324* | 0.205 | 0.071 |
| 50-64 | 3.106* | 0.145 | 0.074 | 0.432*** | 0.389** | 0.146 | 0.258* | 0.045 |
| 65+ | 1.869 | -0.531 | 0.249* | 0.492*** | 0.459** | 0.207 | 0.296* | 0.372 |
| Living with a partner | -1.763* | -0.923 | 0.057 | -0.155** | (omitted) | 0.035 | (omitted) | -0.103 |
| Study child's age | ||||||||
| (under 5 years) | ||||||||
| 5-11 | 2.498* | 0.039 | 0.083 | -0.276*** | -0.321*** | -0.675*** | -0.104 | 0.027 |
| 12-14 | 2.600* | 0.162 | 0.017 | -0.720*** | -0.775*** | -0.951*** | -0.249* | -0.166 |
| 15-18 | 2.479 | 0.15 | 0.061 | -0.776*** | -0.742*** | -0.972*** | -0.018 | -0.159 |
| Financial hardships | ||||||||
| (None) | ||||||||
| One | -1.567 | -1.282 | 0.078 | 0.074 | 0.072 | 0.079 | -0.231 | 0.083 |
| Two or more | -4.810*** | -4.222*** | -0.358*** | -0.122 | -0.138 | 0.06 | -0.455*** | -0.305* |
| Self-assessed financial circumstances | ||||||||
| (Prosperous/very comfortable) | ||||||||
| Reasonably comfortable | -4.932*** | -2.826*** | -0.323*** | 0.053 | 0.041 | 0.089 | -0.086 | 0.005 |
| Just getting by/poor/very poor | -8.204*** | -4.093*** | -0.418*** | 0.088 | 0.197 | 0.077 | 0.124 | 0.043 |
| Number of abuse/neglect that study child experienced or was exposed to | ||||||||
| None | ||||||||
| 1 | -1.272 | -2.307* | 0.203 | 0.076 | 0.099 | 0.147 | 0.18 | -0.066 |
| 2 | 0.087 | -0.406 | 0.227* | 0.042 | 0.16 | -0.012 | 0.219 | 0.035 |
| 3 | -3.598** | -1.239 | 0.188 | -0.109 | 0.017 | -0.363* | 0.233 | -0.283 |
| 4+ | -2.590* | -1.172 | 0.152 | -0.284** | -0.099 | -0.544*** | 0.259* | -0.025 |
| Study child had developmental issue/condition | -0.682 | 0.297 | 0.012 | -0.009 | -0.024 | -0.078 | 0.108 | 0.02 |
| Motivation scale (0-10) | 0.692* | 1.328*** | 0.196*** | 0.350*** | 0.311*** | 0.266*** | 0.164*** | 0.146*** |
| Challenge scale (0-10) | -3.226*** | -2.167*** | -0.189*** | -0.150*** | -0.185*** | -0.271*** | -0.147*** | -0.156*** |
| Level of agreement that the allowances received for the study child are adequate (1-5, from strongly disagree to strongly agree) | 0.455 | 0.09 | 0.011 | -0.059* | -0.063* | -0.034 | -0.025 | -0.05 |
| Level of agreement with feeling well supported by agencies and service providers (1-5, from strongly disagree to strongly agree) | 1.227*** | 1.143*** | 0.156*** | 0.111*** | 0.090** | 0.157*** | 0.111*** | 0.151*** |
| Constant | 75.545*** | 81.353*** | 6.863*** | 6.243*** | 6.680*** | 7.058*** | 7.654*** | 8.219*** |
| Adjusted r2 | 0.231 | 0.197 | 0.213 | 0.271 | 0.234 | 0.237 | 0.126 | 0.163 |
| Number of carers | 2140 | 2143 | 2138 | 2136 | 1339 | 1463 | 1346 | 656 |
Note: For categorical variables, reference group is indicated in brackets. *p < .05, **p < .01, ***p < .001.
Box 2: Interpretation of coefficients of OLS regression
OLS coefficients represent the change in the dependent variable for each unit change in an independent variable. For example, in relation to results of vitality, the coefficient for carers living with a partner is -1.78, this means that the vitality score is reduced by 1.78 for carers living with a partner compared to carers living without a partner.
7.3 Summary
Overall, carers reported positively on their wellbeing and family relationships. The majority of carers rated their health as "excellent" or "very good", with relatively high levels of vitality and mental health. More importantly, the majority of carers were highly satisfied with their life and each of the five types of family relationships. These patterns were apparent regardless of care type and gender.
Despite the overall positive picture, some carers fared less well. Relative/kinship carers rated less well on their general health compared to foster carers. It is worth noting that close to one in four relative/kinship carers had a disability or medical condition that was likely to last for six months or more and caused some difficulty in their everyday life. Relative/kinship carers also reported lower levels of life satisfaction compared to foster carers. However, relative/kinship carers were more satisfied than foster carers with the three types of relationships concerning the study child: their own relationship with the study child, their partner's relationship with the study child, and how the study child got along with the other children in the household. This is likely to reflect that relative/kinship carers and their families had already established a relationship and bonded with the study child and, of course, some may have already looked after the study child informally in the past.
Male carers also appeared to fare less well on some wellbeing measures and family relationships compared to female carers. Specifically, male carers rated more poorly than female carers on their general health, and male carers were also less satisfied with life, and less satisfied with family relationships.
Negative care experiences and lack of support were found to be associated with poorer wellbeing and family relationships for carers. Specifically, carers who reported facing greater challenges in caring for children in out-of-home care (particularly those children who had experienced multiple types of maltreatment) and carers who did not feel well supported by agencies/services in meeting the study child's needs reported lower levels of wellbeing (lower level of energy, poorer mental health, lower life satisfaction) and lower satisfaction with family relationships.
8. Summary and conclusion
The objective of this report was to provide broad findings from the Working Together to Care for Kids survey in order to assist in better understanding the characteristics and needs of foster and relative/kinship carers of vulnerable children in Australia who have been unable to live with their parents (and, hence, are living in out-of-home care). It was proposed that doing so would assist in informing government policies and practices designed to support these carers.
This report has examined the characteristics of foster and relative/kinship carers and of study children, and carers' experiences including:
- the circumstances relating to how the study children came in their care;
- their experience of service use including barriers to accessing services and support from caseworkers or carer support workers;
- training received in carrying out their caring role;
- the rewards and challenges of being a carer of children in out-of-home care;
- carers' wellbeing and quality of their family relationships, including those concerning study children; and
- the link between their wellbeing and quality of family relationships and their care experiences.
As well as considering these factors in regard to carers overall, the report also compared foster and relative/kinship carers and male and female carers.
Demographics
Among the carers who participated in this study, there were slightly more relative/kinship carers than foster carers (53% vs 47%). Grandparents made up to two-thirds of relative/kinship carers. Most of the carers were female (88%), and this pattern was consistent across both types of carers. The mean age of carers was 53 years. Nearly one-half of carers were between 50 and 64 years old, over one-third were under 50 years of age, while 15% were over 65 years of age. Over one-tenth of carers self-identified as Indigenous, higher than the Indigenous population proportion at the national level and consistent with the over-representation of Indigenous families in contact with the child protection system. Less than one-half of carers under 65 years of age were in paid work, with the majority of those who were in paid work holding part-time employment.
Foster and relative/kinship carers differed across some characteristics. Compared to foster carers, relative/kinship carers were older (by three years on average), were more likely to have lower education levels, and were less likely to be in paid work (57% vs 67% in paid work if under 65 years). Relative/kinship carers were more likely than foster carers to self-identify as Indigenous.
The study children (i.e., the randomly selected child in out-of-home care when there was more than one present in the household) were 9 years old on average, with 5-11 years being the most common age group. Approximately half of the carer households had two or more children in out-of-home care in the household, aside from the study child, with this being more common in foster than relative/kinship carer households.
The majority of carers had an annual gross household income of less than $60,000. One-fifth of carers reported an annual gross household income of less than $30,000. Compared with Australian general population households in the HILDA (2014) data, carers in this study tended to have lower levels of household income. For example, over one-third of households in HILDA had an annual gross household income of more than $100,000, while only one-fifth of carers in this study reported this household income. The proportion of carers living in public housing was 11%, which is higher than that found in HILDA (4%). While this data suggests that carers were financially less well-off on average than Australian households as identified in HILDA, most carers reported that they were "reasonably comfortable" financially. Relative/kinship carers were less well-off financially than foster carers.
Carer experiences and the study child's background
One of the key objectives of the survey was to have a better understanding of carers' experiences in looking after a child and the circumstances in which the child came into their care. For many carers (close to two-thirds), the study child came into their care after being approached by their jurisdictional department or agency, which was more common for foster carers than for relative/kinship carers (76% vs 53%). Not surprisingly, relative/kinship carers were more likely than foster carers to be asked by the study child's parents or a family member to care for the child.
The median duration that carers had looked after their study child was three to four years. However, carers' reports on the period of time that the study child was in their care varied widely. Just under one-half of carers reported that the study child had stayed with them for less than two years. However, over one-fifth had looked after the study child for at least 10 years. Foster carers were more likely than relative/kinship carers to have cared for the study child for a short duration (e.g., less than one year).
Carers were asked about their knowledge of whether the study child had experienced a number of indicators of abuse and/or neglect before coming into their care. Most carers reported being aware of the study child being subjected to at least one indicator of abuse/and or neglect. Only 14% of carers reported that, to their knowledge, the child had not had any such experience prior to coming into their care. Carers most commonly reported being aware that the study child had been exposed to family violence, household members with alcohol or drug use problems and/or neglect prior to coming into their care (62-72%). More than one-half of carers knew that the study child had previously experienced emotional abuse and a significant minority had the knowledge of the study child's prior experience of physical abuse. One-tenth of carers were aware that the study child had experienced sexual abuse before coming into their care. Given that many relative/kinship carers were related to the study child in their care, it is not surprising that relative/kinship carers were more likely than foster carers to report their awareness of any previous experiences of abuse, neglect and household problems that the study child had had.
While it is to be somewhat expected that many children who have been placed in OOHC may have experienced some form of abuse and/or violence in the past, it is interesting to know that the majority of carers (both foster and relative/kinship) who knew of the study children's prior experiences appear to have become aware of these before the study children entered their care. Nevertheless, a significant minority of carers only became aware of such prior history of their study child after the child's arrival. For sexual abuse, in particular, it appears that many carers were not aware of its alleged occurrence until after the study child had come into their care, rather than before or upon the child's arrival. Furthermore, male carers were more likely than female carers to become aware the study children's prior history before the child's arrival.
Carers' reports indicate that over one-third of the study children had already been diagnosed with at least one type of developmental condition. These conditions included intellectual and physical disabilities, diagnosed behavioural problems (e.g., attention deficit hyperactivity disorder) and diagnosed mental health conditions (e.g., anxiety, depression). Foster carers were more likely than relative/kinships carers to indicate that they were aware that the study child had any developmental conditions. Also, a slightly higher proportion of male carers than female carers reported that the study child had at least one type of these developmental conditions.
In many cases, especially in regards to physical disabilities and diagnosed behavioural problems, carers were aware of these conditions prior to the study child coming to live with them, but it was also relatively common for the carer to become aware of these conditions after the study child's arrival at the household, especially regarding diagnosed mental health conditions (44%). It was apparent that in significant proportions of foster and relative/kinship care placements that carers learned of their study child's prior developmental conditions after the child was in their care, especially in relation to the study child's mental health conditions.
Overall, the majority of carers felt they had adequate information about the study child's history before he/she came into their care. However, more than one-third felt the opposite, with this view being more prevalent for foster carers than for relative/kinship carers (46% vs 27%). Carers who became aware of the study child's prior experiences of abuse, neglect and household problems and developmental conditions after he/she came into their care were more likely to express that they did not have the adequate information about the study child compared to other carers.
The majority of study children maintained some contact (face-to-face or other forms) with their mother and/or father, although the degree and type of contact between study children and their parents varied. For example, one-third of study children were reported to have had contact with their mother at least once per month, but 37% had contact less often than that, and a further 30% had had variable or no face-to-face contact over the past six months. The trends were also somewhat similar for the study child's father, although the study children had face-to-face contact less frequently with their father than their mother, and no face-to-face contact was more common for fathers than for mothers (33% vs 13%).
Almost half of study children also had some degree of other (non-face-to-face) contact with their mother according to carers, such as talking on the phone, emailing or contacting each other via social media. This was also the case for just over a third of study children in regards to their father. An important trend was that parental contact declined with the increasing age of children. This suggests that there are opportunities for workers to improve the support provided to carers in maintaining contact with parents as children grow older.
Service use and support
Another important objective of the survey was to understand more about the various services and types of support available to carers and what they found to be most useful or beneficial for both themselves and the child. The majority of carers had contact with services to at least some degree - 90% of carers had received at least one service in their time as a carer and 68% received at least one type in the past six months. Those with contact with services found them to be helpful. The most common services carers had past contact with in regards to a child in out-of-home care included carer support staff from a government child protection department and child counselling/psychologist services, with over half of all carers using these services at some stage.
There was a large discrepancy between foster and relative/kinship carers in regards to service experiences, with foster carers much more likely than relative/kinship carers to report having contact with a range of services; fewer than six in ten relative/kinship carers who reported experiences with at least one service in the past had used one in the past six months, whereas the over eight in ten foster carers had used a service in the past six months. Foster carers were also more likely to indicate that they were currently using or needed specific services than relative/kinship carers were. It is possible that relative/kinship carers use services less often because they may not have the same access to them as foster carers do or access to information about them, although it may also be the case that relative/kinship carers may be more hesitant in considering or seeking help from a service than foster carers because of a variety of reasons and barriers (e.g., valentine et al., 2013). It is important to note that carers who had experienced particular services generally reported them to be helpful; hence, for services that had been undertaken during the past six months, it was relatively uncommon for carers to indicate that they were not of some benefit.
When carers were asked about service needs (i.e., services they currently needed, regardless of whether they were using them at the time or not), half of all carers identified a "need" for child counselling/psychologist services, followed by assistance from the government child protection department in the jurisdiction where the carer lived. These two types of services were also identified as the most common "unmet service need", meaning that carers currently needed these services but had not received them. Therefore, there is a demand for these essential services for children and carers that, according to carers' responses, is not currently being met. One-third of carers also currently needed carer support from non-government organisations or agencies and respite care services. Overall, eight in ten carers had a need for at least one type of service and two thirds of carers had a service need that was not met. Carers indicated that long waiting lists were the most common barrier to accessing the service(s) they needed.
A somewhat similar trend to service experiences was present for carer training; foster carers were much more likely than relative/kinship carers to indicate that they had undertaken some form of training course/workshop in the past (92% vs 35%), as well as specifically within the past year (54% vs 16%). The vast majority of carers who had participated in training reported that they found it helpful. While the four in ten carers who had not undertaken any training in the past year thought it would have been helpful to have been able to do so - foster carers were more likely to believe this to be the case than relative/kinship carers.
Therefore, it appears that relative/kinship carers may have less accessibility to training than foster carers and that when training opportunities arise, relative/kinship carers may be taking them up less frequently than foster carers. When carers who thought that participating in training would have been helpful were asked about what type of training would be valuable to them, the most common responses related to managing behavioural issues associated with the children and training that assisted carers in dealing with the trauma experienced by these children.
These findings perhaps tie in to some degree with the results presented above, indicating that carers are often not aware of study children's experiences of indicators of abuse/neglect and/or developmental conditions until after the child arrives at or begins living in the household. That is, it appears a proportion of carers may require additional services or training to help them in caring for children and the complexities/challenges it can involve. Similarly, while most carers felt they were well prepared for their caring role, some carers did not feel this way, suggesting that the training and/or ongoing support offered was inadequate and they felt they were not fully equipped for the complex "realities" of caring for a child.
There were also discrepancies between foster and relative/kinship carers in regards to carer support worker contact/support and the extent to which they had contact with other foster and relative/kinship care families. Although foster carers were more likely than relative/kinship carers to have contact with a carer support worker and another caring family, it is important to note that many carers, irrespective of care type, did not have this form of contact or support (e.g., just under half of foster carers had developed a carer development plan with their carer support worker, while only a quarter of relative/kinship carers had one).
Finally, in regards to the Grandparent Adviser Phone Line, just over a quarter of carers were aware of this service and only one-quarter of those had actually used it. Most of the carers who had contact with the Grandparent Advisor Phone Line found it to be at least "fairly helpful". Taken in conjunction with the other services and unmet service needs, these findings indicate an opportunity for services to be available, targeted or promoted to all carers more effectively, so they can be made aware of the service and its purpose, and use it when they need to.
Carer rewards and challenges
Extending on the themes already identified in regards to the challenges associated with caring for children in out-of-home care, carers also identified a number of rewards associated with their caring role. While both foster and relative/kinship carers did tend to agree that, for example, "managing a child's behaviour is difficult" and "looking after a child in out-of-home care requires more time and effort than another child of the same gender", it was also evident that the caring role was a fulfilling experience for many carers. This was reflected in the vast majority of carers who indicated that they could "make a positive difference in the life of a child in out-of-home care", "provide a child in out-of-home care with a positive family experience", and agreed that "looking after a child in out-of-home care is a rewarding experience".
Foster and relative/kinship carers also tended to have relatively similar views in regards to the rewards and challenges of their roles as carers. On some measures, however, foster carers did on occasion indicate experiencing a greater degree of challenges than relative/kinship carers. Carers reported more challenges if the children had previously experienced or been exposed to more types of abuse/violence/neglect and/or had developmental conditions.
Also related to the findings discussed for services and supports above, carers' views were somewhat mixed in regards to whether the allowances they received were adequate to care for the study child. There were also mixed reports about the extent to which carers felt supported by agencies/services in meeting the study child's needs (i.e., just over one-half of carers indicated allowances were adequate, with a similar proportion agreeing that they felt supported by agencies/services, and the remainder with mixed feelings about or disagreeing with these statements). The feelings of lack of financial and service support were more salient among relative/kinship carers than foster carers, and for carers who looked after children with a history of abuse, neglect or problems at home.
Views on how likely they were to look after another child in the future were split, with four in ten indicating they were likely or very likely, but nearly one-half reporting the opposite (i.e., unlikely or very unlikely). Relative/kinship carers were much less likely than foster carers to indicate that they would take on the responsibility of being the formal carer for another child in the future. While the majority of foster carers were likely to be a carer again in the future, the majority of relative/kinship carers felt it was unlikely they would be a carer again. This pattern was also reflected in the finding that seven in ten relative/kinship carers said that the study child came into their care because no other relatives were able to look after them.
Care experience also influenced carers' outlook of being a carer again in the future. A greater likelihood of being a carer again in the future was associated with a higher sense of rewards, a lower level of challenges, the perception of receiving adequate allowances, and feeling well supported in meeting the study child's needs.
Carer wellbeing and family relationships
Overall, carers reported positively on their wellbeing and family relationships. Carers generally appeared to be in good physical and mental health, or at least perceive themselves to be healthy. Relative/kinship carers did tend to rate their health more poorly than foster carers and reported a higher level of long-term medical conditions/disabilities. While carers' overall life satisfaction also tended to be quite high, again, it was slightly more positive for foster carers than relative/kinship carers. These findings may be at least partly attributable to the older age of relative/kinship carers, but they could also indicate that these carers are more likely to need support for their role as carers, particularly with close to three in ten reporting a long-term medical condition or disability.
Overall, carers reported relatively high levels of satisfaction across various relationships within the caregiving household, including their own and their partner's relationship with the study child, the study child's relationship with other children in the household, and their own relationship with their partner. Negative care experiences and lack of support were found to be associated with poorer wellbeing and family relationships for carers. Where the study child had experienced higher numbers of different types of abuse/neglect prior to coming into care, carers reported lower personal wellbeing.
Conclusion
Overall, this study has revealed several important and interesting findings regarding the carers of children in out-of-home care in Australia. Many carers are coping well in their caring roles despite the challenging circumstances and complexities associated with caring for the children and service gaps. It also appears that there is the capacity for better preparing carers for their role before a child comes into their care, training opportunities before and after starting as a carer, as well as continuing to provide more support while children are in their care as different needs emerge over time. The various discrepancies in findings between foster and relative/kinship carers also indicate that more may need to be done to assist relative/kinship carers in particular, in order to increase availability and their participation in and/or uptake of services/training, as they were more likely to feel a lack of support in their caring roles compare to foster carers (although improved service provision and support clearly remains important for both foster and relative/kinship carers).
Across the various issues addressed, one of the important themes was the degree of harm suffered by the study child. Consistent with previous research on multi-type maltreatment (e.g., Higgins, 2004; Price-Robertson, Higgins, & Vassallo, 2013), this study found that multiple indicators of abuse, neglect and problems at home were common. Where the study child had experienced higher numbers of different types of abuse/neglect prior to coming into care, carers faced greater challenges, reported lower personal wellbeing and were less likely to be a carer for other children in the out-of-home-care system in the future.
The results from this study also indicate that many positives emerge from the caring experience at a personal level; carers genuinely appear to perceive that they can make a real difference to a child's life and find being a carer very rewarding.
9. References
- Arney, F., Iannos, M., Chong, A., McDougall, S., & Parkinson, S. (2015). Enhancing the implementation of the Aboriginal and Torres Strait Islander Child Placement Principle: Policy and practice considerations (CFCA paper no. 34). Melbourne: Australian Institute of Family Studies.
- Australian Bureau of Statistics (ABS). (2013). Estimates of Aboriginal and Torres Strait Islander Australians, June 2011 (Catalogue no. 3239.0.55.001). Canberra: ABS.
- Australian Institute of Health and Welfare (2012). Child Protection Australia: 2010-11 (Child Welfare series no. 53 (Cat. No. CWS 41). Canberra: AIHW.
- Australian Institute of Health and Welfare. (2015). Child protection Australia: 2013-14 (Child Welfare series no. 61. (Cat. No. CWS 52). Canberra: AIHW.
- Australian Institute of Health and Welfare (2017). Child Protection Australia: 2015-16 (Child Welfare series no. 66 (Cat. No. CWS 60). Canberra: AIHW.
- Blythe, S. L., Halcomb, E. J., Wilkes, L., & Jackson, D. (2013). Perceptions of long-term female foster-carers: I'm not a carer, I'm a mother. British Journal of Social Work, 43, 1056-1072.
- Bromfield, L., & Osborn, A. (2007). Research Brief: Kinship care (NCPC Research Brief No. 10). Melbourne: Australian Institute of Family Studies.
- Bromfield, L., Higgins, J. R., Higgins, D., & Richardson, N. (2007). Barriers, incentives and strategies to enhance recruitment of Indigenous carers (Promising Practices in Out-of-Home Carer for Aboriginal and Torres Strait Islander Carers and Young People: Strengths and Barriers: Paper 2). Melbourne: Australian Institute of Family Studies.
- Department of Social Services (DSS). (2011). An outline of national standards for out-of-home care: a priority project under the National Framework for Protecting Australia's Children 2009-2020. Canberra: DSS.
- Dunne, E. G., & Kettler, L. J. (2006). Social and emotional issues of children in kinship foster care and stressors on kinship carers. Children Australia, 31, 22-29.
- Farmer, E., Lipscombe, J., & Moyers, S. (2005). Foster carer strain and its impact on parenting and placement outcomes for adolescents. British Journal of Social Work, 35, 237-253.
- Frederico, M., Jackson, A., & Black, C. (2009). Understanding the impact of abuse and neglect on children and young people referred to a therapeutic program. Journal of Family Studies, 14, 342-361.
- Golding, K. (2004). Providing specialist psychologist support to foster carers: A consultation model. Child and Adolescent Mental Health, 9, 71-76.
- Higgins, D. J. (2004). The importance of degree versus type of maltreatment: A cluster analysis of child abuse types. The Journal of Psychology, 138, 303-324.
- McHugh, M. (2006). Indirect costs of fostering and their impact on carers. Communities, Children and Families Australia, 1, 73-85.
- McHugh, M., McNab, J., Smyth, C., Chalmers, J., Siminski, P., & Saunders, P. (2004). The availability of foster carers: Main report. Sydney: Social Policy Research Centre, University of New South Wales.
- Mosuro, S., Malcolm, D., & Guishard-Pine, J. (2014). Mental health awareness and coping in foster carers: The impact of a counselling skills intervention. Educational & Child Psychology, 31, 64-70.
- Qu, L., Weston, R., Moloney, L., Kaspiew, R. & Dunstan, J. (2014). Post-separation parenting, property and relationship Dynamics after five years. Melbourne: Australian Institute of Family Studies
- Portengen, R., & Van der Neut, B. (1999). Assessing family strengths: A family system approach. In Greef R. (ed), Fostering Kinship: An international perspective on kinship foster care. Aldershot: Ashgate.
- Price-Robertson, R., Higgins, D., & Vassallo, S. (2013). Multi-type maltreatment and polyvictimisation: A comparison of two research frameworks. Family Matters, 93, 84-98. Melbourne: Australian Institute of Family Studies. Retrieved from <www.aifs.gov.au/institute/pubs/fm2013/fm93/fm93h.html>.
- Randle, M., Ernst, D., Leisch, F., & Dolnicar, S. (2016). What makes foster carers think about quitting? Recommendations for improved retention of foster carers. Child & Family Social Work, 2016, 1-12.
- Rosier, K., & Hunter, K. (2016). Protecting Australia's children: Research and evaluation audit, 2011-2015. Overview of findings. Melbourne: Australian Institute of Family Studies. Retrieved from <aifs.gov.au/cfca/protecting-australias-children-research-and-evaluation-register-2011-2015-overview-findings>.
- Schofield, G., Beek, M., Ward, E., & Biggart, L. (2013). Professional foster carer and committed parent: Role conflict and the role enrichment at the interface between work and family in long-term foster care. Child & Family Social Work, 18(1), 46-56.
- valentine, k., Jenkins, B., Brennan, D., & Cass, B. (2013). Information provision to grandparent kinship carers: Responding to their unique needs. Australian Social Work, 66, 425-439.
- Waldman, J., & Wheal A. (1999). Training needs of friends and families who are foster carers. In Greeff R (ed), Fostering Kinship: An international perspective on kinship foster care. Aldershot: Ashgate.
- Ware, J. E., Snow, K. K., Kosinski, M. & Gandek, B. (1993). SF-36 Health Survey: Manual and interpretation guide. Boston, MA: The Health Institute, New England Medical Center.
- Wilks, S., & Wise, S. (2011). The care factor: Rewards and challenges of raising foster children. Melbourne: Anglicare Victoria.
This report was commissioned by the Australian Government Department of Social Services (DSS). We are very grateful for all the support and assistance provided by DSS staff, especially Linda Pascal, Shelley Barrenger, Marianne Madden, Bridget Anyon, Sarah Ball and Melek Byrne, throughout the project. We would also like to acknowledge the valuable support we received from the Inter-Jurisdictional Working Group in providing the sample and feedback on the survey questionnaire.
We extend our special thanks to all the carers who participated in the study. This report would not have been possible without their generous contribution of time and their willingness to share their experiences.
We would particularly like to acknowledge the contribution made by Professor Daryl Higgins, former Deputy Director (Research) at the Australian Institute of Family Studies (AIFS), to the development of the project. We thank him for his advice and significant support during much of the course of the project and his insightful comments on the report. We also acknowledge the contribution made by Ruth Weston to the survey design.
Our special thanks go to Anne Hollonds, Director of AIFS, for her unflagging support, and Kelly Hand, Deputy Director (Research), for her support provided during the course of the project. We are also very grateful to Dr Briony Horsfall for her very helpful comments.
Notwithstanding the generous assistance from many people, we are responsible for any shortcomings or errors in this report. The findings and view reported in this report are those of the authors and cannot be attributed to DSS or AIFS.
Feature image: © iStockphoto/monkeybusinessimages
Qu, L., Lahausse, J. & Carson, R. (2018). Working Together to Care for Kids: A survey of foster and relative/kinship carers. (Research Report). Melbourne: Australian Institute of Family Studies.
978-1-76016-147-7
6 May 2018
Download Research report
Related publications

Working Together to Care for Kids: Carer service use and…
This Research Snapshot focuses on carers' reports on their access to and views on service support.
Working Together to Care for Kids: Carer support and…
This Research Snapshot focuses on carers' reports on training they had received and the degree of contact with their…

Working Together to Care for Kids: Carers' wellbeing and…
This Research Snapshot directs attention to carers' wellbeing and their family relationships.