Births in Australia
You are in an archived section of the AIFS website
March 2022
Lixia Qu, Jennifer Baxter, Megan Carroll
Maturing mums and fewer bubs
Key messages
-
The total fertility rate has fallen over recent years. It was 1.58 in 2020, the lowest rate on record.
-
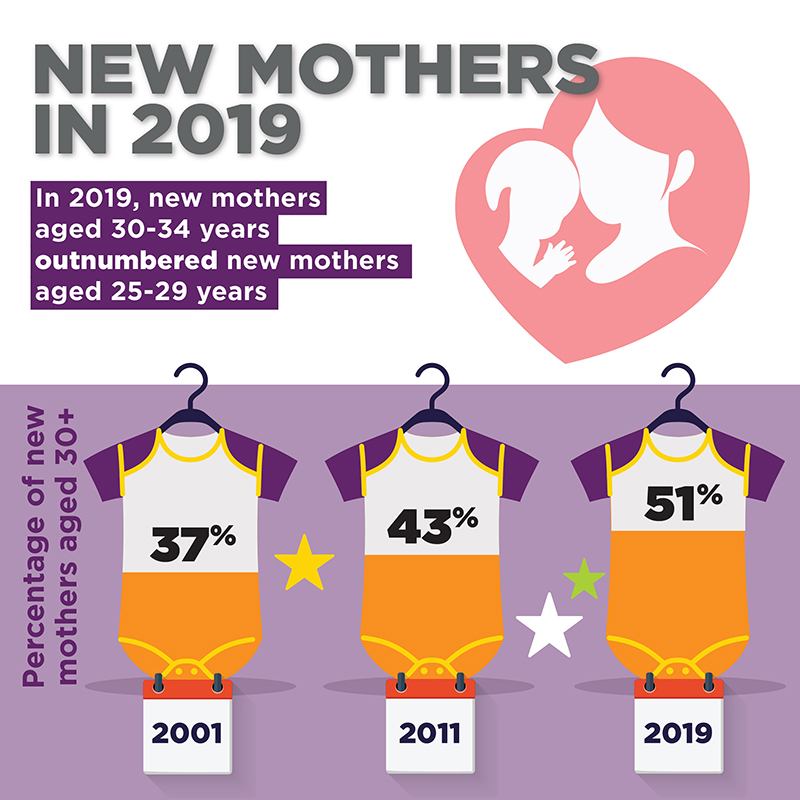
The age at which women have their first child has increased. In 2019, 51% of first births were to women aged over 30, representing a significant rise from 23% in 1991 and 37% in 2001.
-
The proportion of births born outside marriage has remained steady since the late 2000s, although an upward trend has emerged in the last few years. In 2020, 36% of births were outside marriage.
-
The size of Australian families has become smaller with women having fewer children in general. Two children has become the most common family size and larger families have become rarer. Only children and no children have also been on the rise.
Number of births and fertility rate
According to the Australian Bureau of Statistics (ABS), there were 294,369 new births registered in 2020, the lowest number recorded in the last decade. The total fertility rate, a measure that gives the average number of children a woman would have during her lifetime should she experience the age-specific fertility rates present at the time, was 1.58 in 2020, the lowest level ever recorded.
Figure 1 shows the changes in the number of births and total fertility rate since 1921. The total fertility rate fell in the 1920s and early 1930s. After reaching a trough of 2.11 in 1934, during the Great Depression, it rose until the early 1960s. The highest total fertility rate since 1921 was 3.55 in 1961, after which it mostly fell in the following two decades. The total fertility rate fell sharply after the contraceptive pill became available in 1961 and stabilised in the late 1960s. It had another steep decline after the pill was placed on the Pharmaceutical Benefits Scheme list in 1972. After stabilising in the 1980s, it fell in small progressive steps in the 1990s. Following a rise around the beginning of the millennium, the fertility rate reached 2.02 by 2008. It has been trending down since then.
Since 1976, Australia's total fertility rate has been below replacement level (about 2.1 babies per woman). Replacement level is the level at which a population is replaced from one generation to the next without immigration.
The fertility data are as reported by the Australian Bureau of Statistics (ABS), with the ABS reporting all births that were registered in Australia up to December 2020. Some births from one year (particularly from November and December) will not be registered and counted until the following year (e.g. because either the parents did not register the birth or the application for birth registration could not be processed in time). The extent to which there was an increased number of births affected by a lag in registration in 2020 is not yet known, although differences in the changes of births by state and territory suggest a COVID-related administrative effect on the data.
Figure 1: Number of births and total fertility rate, 1921–2020
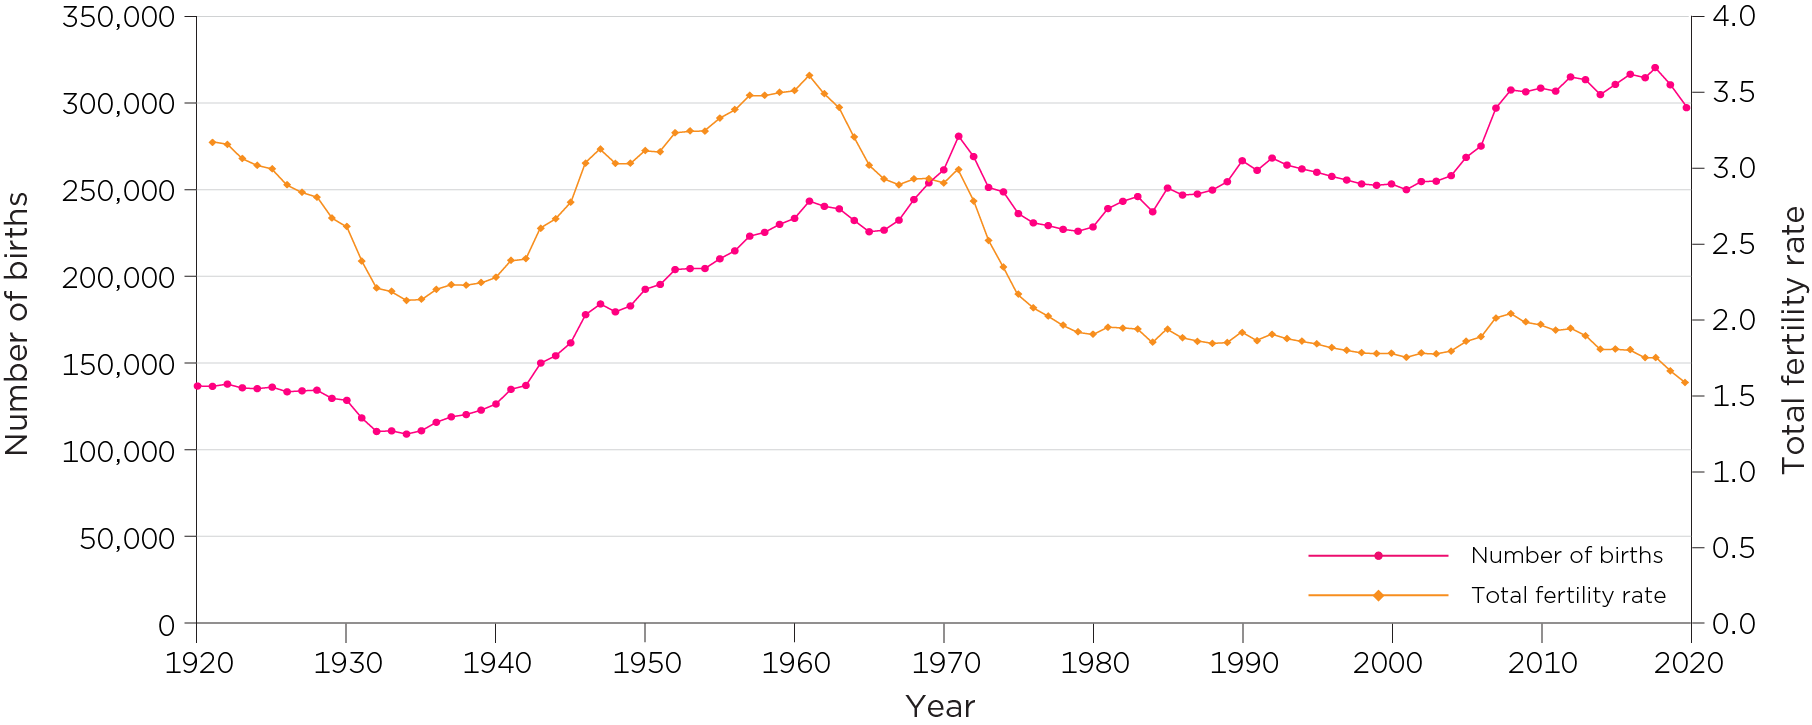
Note: Total is the average number of children a woman would have during her lifetime should she experience the age-specific fertility rates present at the time.
Source: ABS, (various years), Births, Australia (Cat. No. 3301.0)
Age-specific fertility rate
The trends in fertility can be explored with the age-specific fertility rate, which is the number of births to women within a particular age group, per 1,000 women in that age group. Figure 2 presents age-specific fertility rates over time, starting in 1920. Similar to the general trend in the total fertility rate described above, the age-specific fertility rates fell in the 1920s and early 1930s and rose in the 1940s.
- The fertility rates for women in their twenties (20–24 years and 25–29 years) continued to rise in the 1950s. The decline in the age of first marriage and the steep rise in fertility among women aged 20–24 and 25–29 years who were married contributed to the rising fertility rate during the period from the late 1940s to the early 1960s. From the 1950s to the mid-1970s, the fertility rates of women aged 20–24 and 25–29 were markedly higher than that of all other groups.
- While the age-specific fertility rates were increasing for women in their twenties during the 1950s, they were stable for women aged 30–34 years and showed a downward trend for those aged 35–39 years. That is, women were starting their families at a younger age, which may lead to them achieving their desired family size at a relatively younger age, rather than continuing to have more children through their late thirties.
- The impacts of the contraceptive pill on fertility, noted in the section above, were apparent in all age groups, but especially so for women aged in their twenties. Rapid declines in fertility were apparent after 1961 and again after 1972, especially for women aged 20–24 and 25–29 years.
- The fertility rates of those aged in their thirties have mostly increased since the early 1980s, while the fertility rates for women in their twenties has continued to fall. This reflects the trend of women delaying the commencement of starting a family (see the discussion below on age of first-time mothers).
- Since 2000, the fertility rate of women in their early thirties has been higher than all other groups. However, the fertility rate for women aged 30−34 has been trending down over the last decade while the fertility rate for women aged 35−39 has remained stable since 2008.
- The teenage fertility rate rose during the 1960s, which was consistent with the pattern of decline in age at first marriage (See the fact sheet on Marriages).1 However, the rate declined from the early 1970s, with the pill becoming more readily available and affordable. The fall in the fertility rates for those in their teens and 20s has also been influenced by social changes such as young people’s, and particular women’s, increased participation in formal schooling and tertiary education, women’s increased labour force participation, and changes in family-related values and attitudes (for discussions see Jain & McDonald, 1997; Weston, Qu, Parker, & Alexander, 2004).
These trends are closely connected to the historical trends in relationship formation, and also educational attainment and workforce participation (see e.g. Jain & McDonald, 1997).
Figure 2: Age-specific fertility rates, 1921–2020

Sources: ABS, (2008), Australian historical statistics (Cat. No. 3105.0.65.001); ABS, (various years), Births, Australia (Cat. No. 3301.0)
Age of first-time mothers
Statistics on the age of first-time mothers comes from data collected on births and the term refers to the age at which a woman gave birth to their first child. The statistics on the age of first-time mothers is shown in Figure 3 for selected years. These patterns reflect the trends in the age-specific fertility rates described above.
Note that, historically, data on the age of first-time mothers excluded mothers who gave birth outside marriage, with ex-nuptial births having previously been much less common than in recent years (see Figure 4). The data in Figure 4 for 1961, 1971 and 1981 therefore only include the births to married women.
- In 1961 and 1971, nearly half of first-time mothers were aged 20–24 years. Nearly six in 10 first-time mothers were under 25 years. The pattern would be even more pronounced had the ex-nuptial births been included, given that mothers who gave birth outside marriage were likely younger.
- In 1981 and 1991, women most commonly had their first child in their twenties, with the proportions of first-time mothers aged 25–29 years being higher compared to 1961 and 1971 (36%–37% vs 21%–25%).
- The proportion of first-time mothers aged 20–24 years declined sharply from 49% in 1961 to 28% in 1991, and down to 15% in 2019. Similarly, the proportion of first-time mothers who were teenagers also declined from 17% in 1961 and 18% in 1971 to 4% in 2019.
- The percentage of women having their first child over the age of 30 rose from up to 15% prior to 1981, to 23% in 1991, and 43% in 2011. By 2019, one-half of first-time mothers (51%) were 30 years or over. The proportion of first-time mothers who were aged 35 years and older also increased markedly. Prior to 1991, it was uncommon for women to start childbearing at age 35 years or older (up to 5%). By 2019, 17% of first-time mothers were aged 35 years or older.
- Despite these trends, a significant proportion of women still have a first birth in their late twenties, with the number only declining slowly from 36% in 1991 to 31% in 2019.
Figure 3: Age of first-time mothers, selected years, 1961–2019
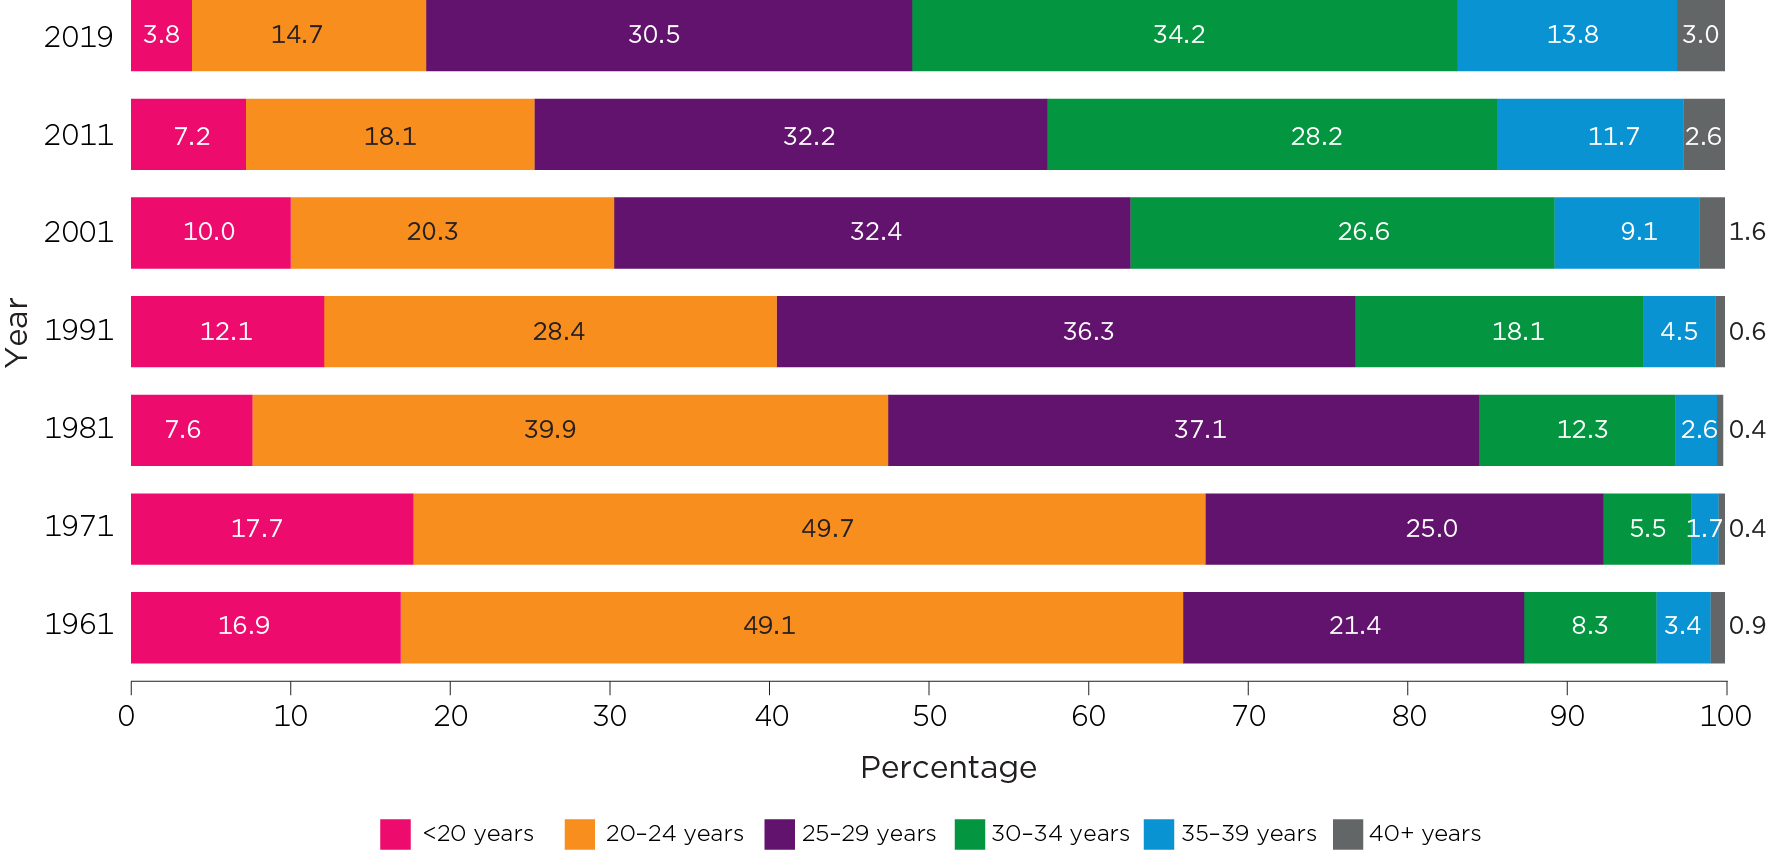
Note: The data for 1961, 1971 and 1981 excluded mothers who first gave birth outside marriage.
Sources: ABS, (1963, 1973), Australian Yearbook (Catalogue No. 1301.0); Australian Institute of Health and Welfare, (2021), Australia's mothers and babies 2019—data tables (Table 1.2); Lancaster, Huang, & Pedisich, (1994), Australia’s mothers and babies 1991 (Perinatal statistics series no.1); Laws & Sullivan, (2004), Australia’s mothers and babies 2001; Li, Zeki, Hilder, & Sullivan, (2013), Australia’s mothers and babies 2011
Births outside marriage
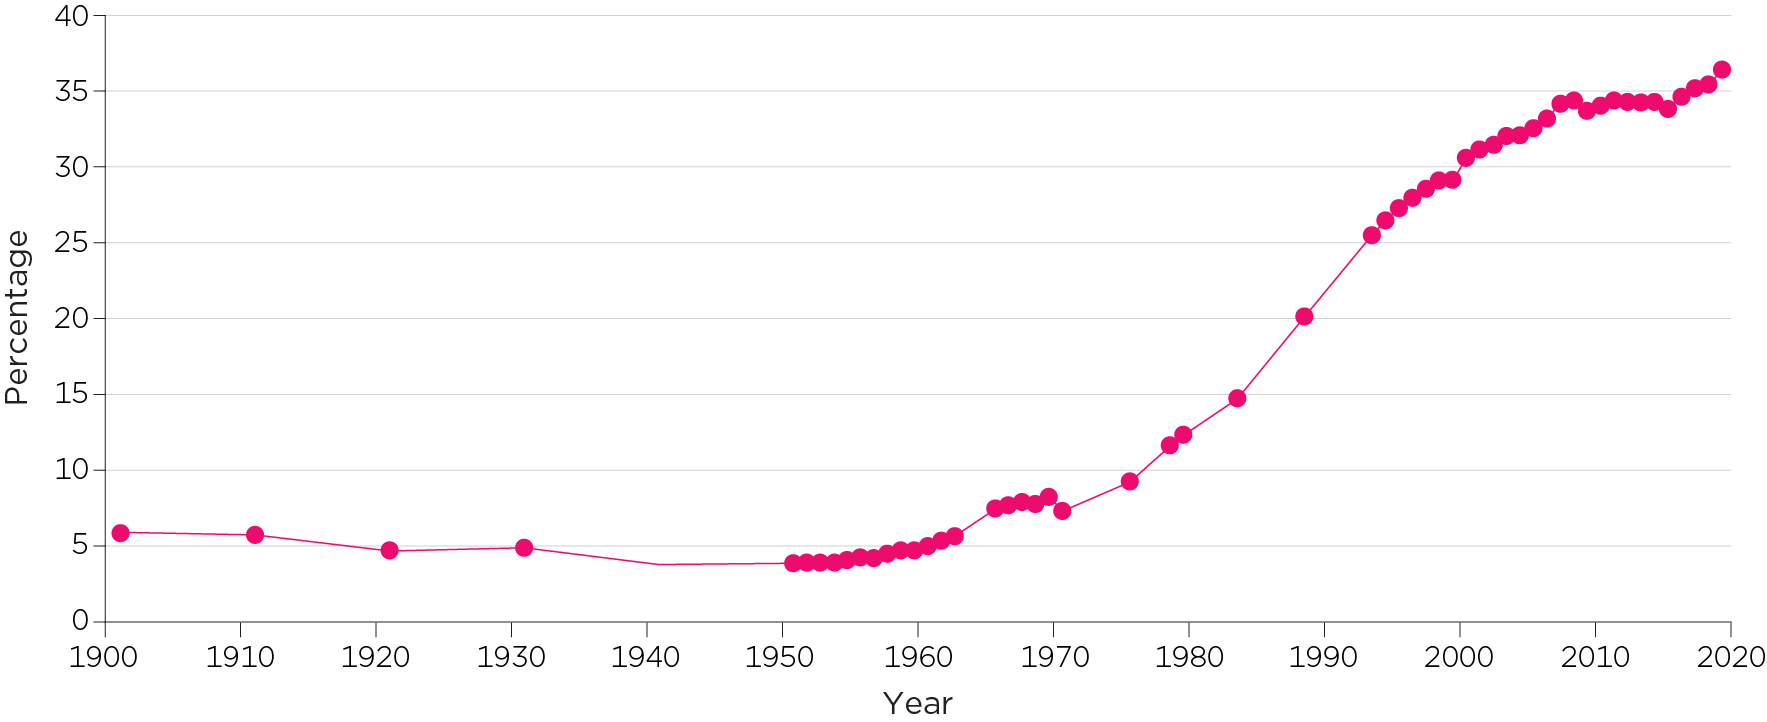
For the first half of the twentieth century, around 4%–6% of all births occurred outside marriage, rising to 8% in the late 1960s (Figure 4).2 Consistent with the rise in cohabitation (for further details, see Families then and now: Couple relationships), there has been a steady increase in these births since the 1970s:
- In 1971, only 7% of births were ex-nuptial, compared to 36% in 2020.
- The rate of births outside marriage has stayed relatively steady since 2008, sitting at just over a third of all births. From 2017 there has been a slight trend upwards and by 2020, 36% of births occurred outside marriage.
Figure 4: Ex-nuptial births, 1901–2020
Sources: ABS, (various years), Births Australia (Cat. No. 3301.0); Commonwealth Bureau of Census and Statistics, (1964, 1973), Demography (Bulletin No. 63 & 86
In recent data, most births outside marriage have paternity acknowledged, which means the biological father’s and mother’s names appear on the application for a birth certificate. The percentage that are paternity acknowledged among ex-nuptial births has fluctuated between 88% and 91% over the last two decades. In 2020, 89% of births born outside marriages were paternity acknowledged.
Figure 5 shows that the proportion of births born outside marriage was highest in the Northern Territory (59% in 2020) and lowest in the ACT (28%). The rate of paternity acknowledgements among births born outside marriage was highest in Victoria (94% in 2020) and lowest in the Northern Territory (72% in 2020).
Figure 5: Ex-nuptial births by state/territory, 2020
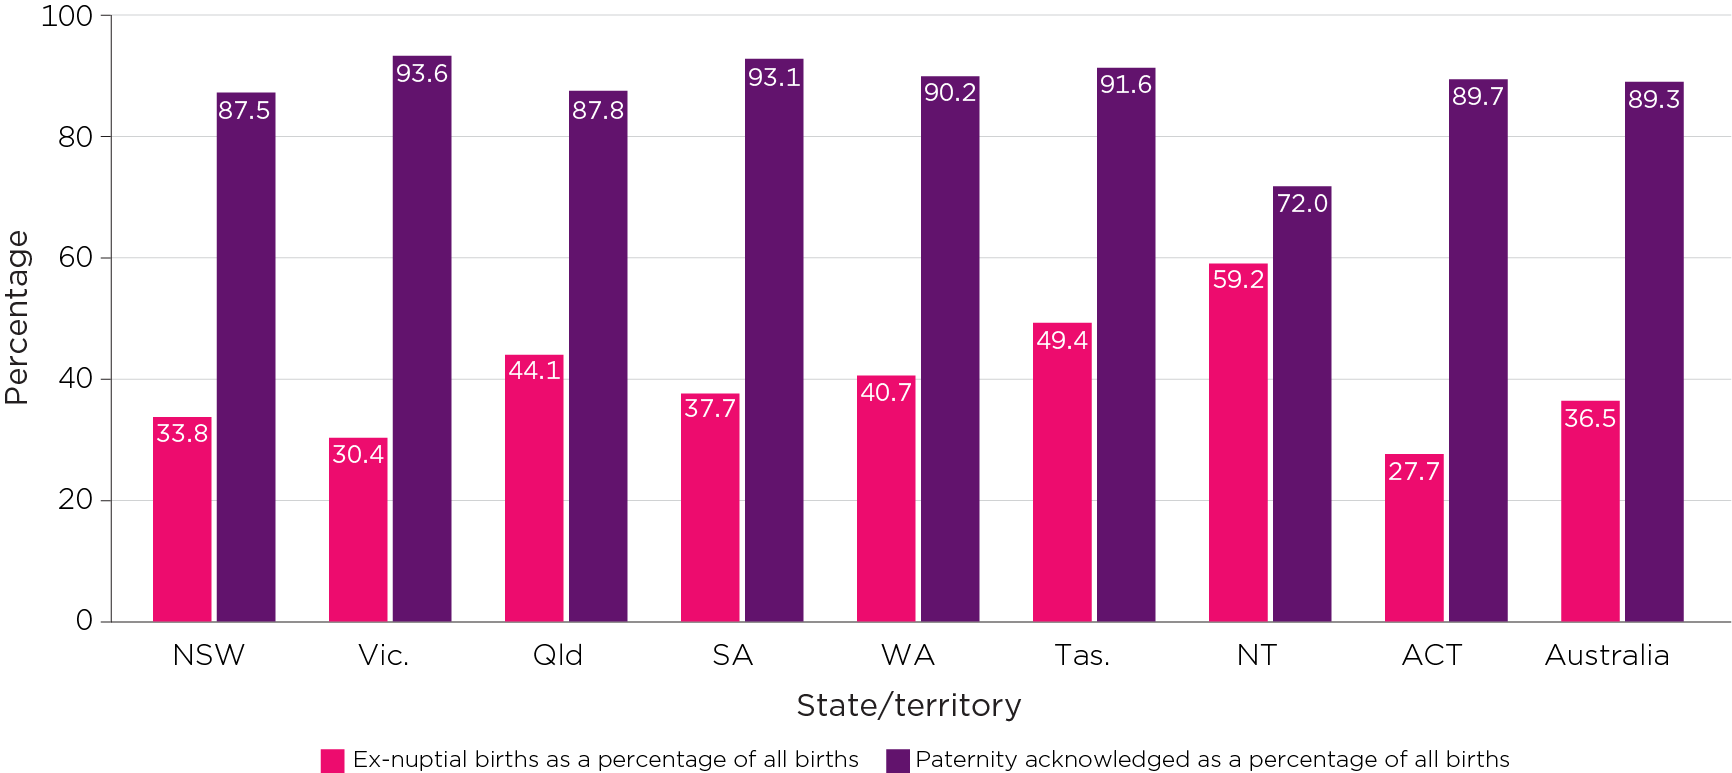
Source: ABS, (2021), Births, summary by state3
There are some differences by the age of the mother in both the incidence of having a birth outside of marriage and also of paternity acknowledgement (Figure 6 and Figure 7).
The distribution of mothers’ ages is quite different according to whether or not births are within marriage (Figure 7). Ex-nuptial births are more often to younger mothers compared to nuptial births.
Figure 6: Number of births by nuptial/paternity acknowledgement status and age of mothers, 2020
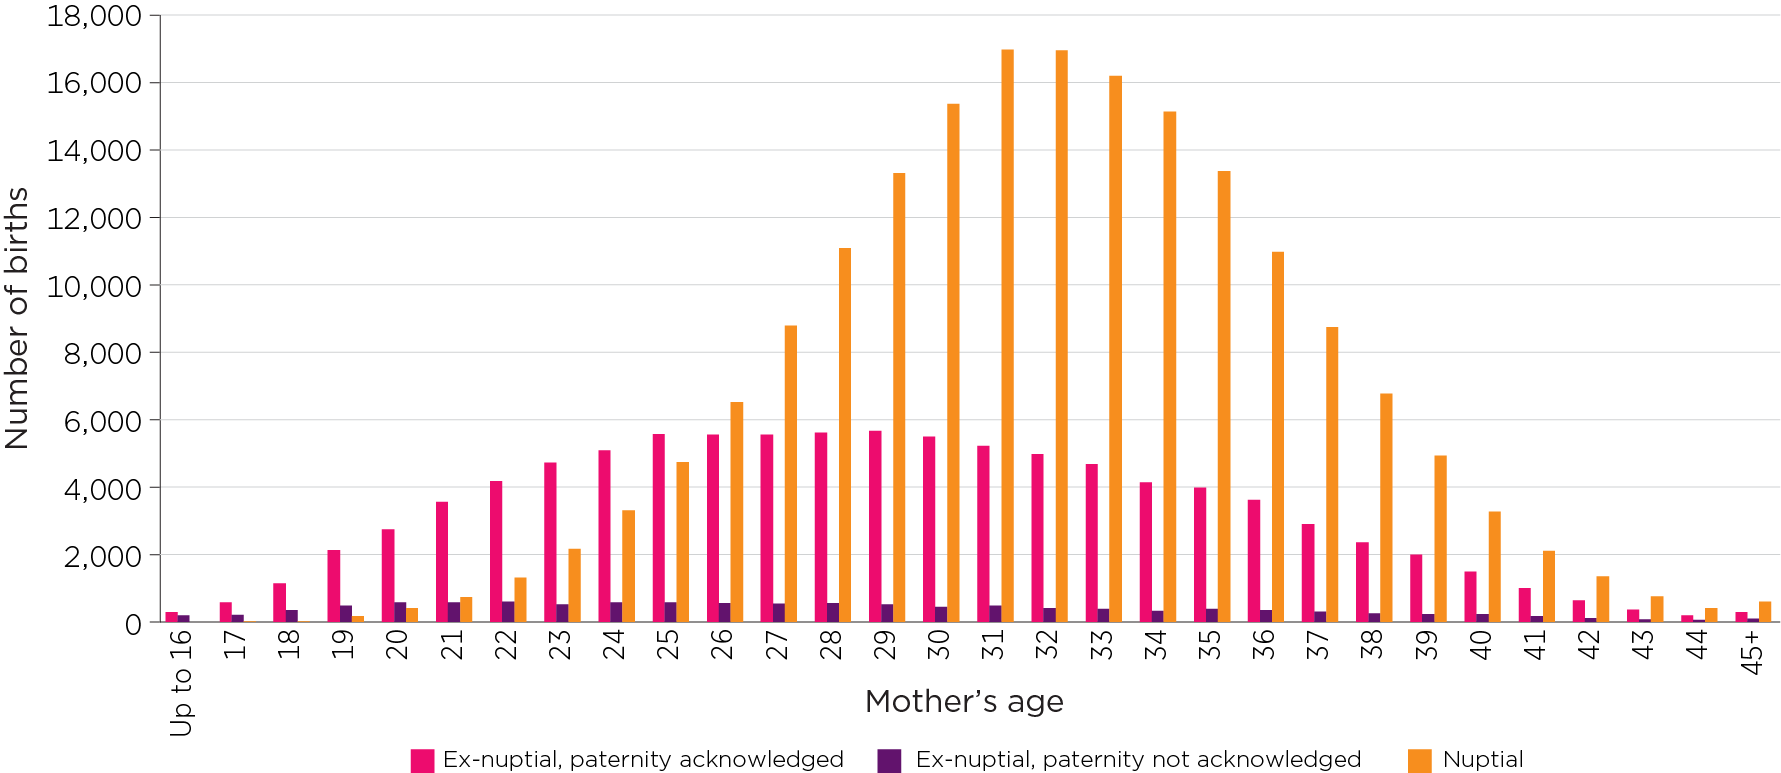
Source: ABS, (2021), Births, Australia, 2020
Age-related differences are especially apparent in Figure 7, which shows, at each age, the proportion of births that are nuptial and ex-nuptial; and of those that are ex-nuptial, the proportion in which paternity is acknowledged.
Paternity acknowledgement was high at all ages, even for the youngest mothers, although it increased by age for mothers up to about 25 years. After 25, the proportion of paternity acknowledged births (among ex-nuptial births) remained quite stable at just over 90% until 40 years of age. After this, the proportion was somewhat lower for mothers aged 40 years and older.
Analysis of data relating to ex-nuptial births and births born to women without a partner in the 1990s and early 2000s by Qu and Weston (2012) indicated that the majority of ex-nuptial births occurred among cohabiting couples.
Figure 7: Proportion of births outside marriage and proportion of ex-nuptial births with paternity acknowledgement by age of mothers, 2020
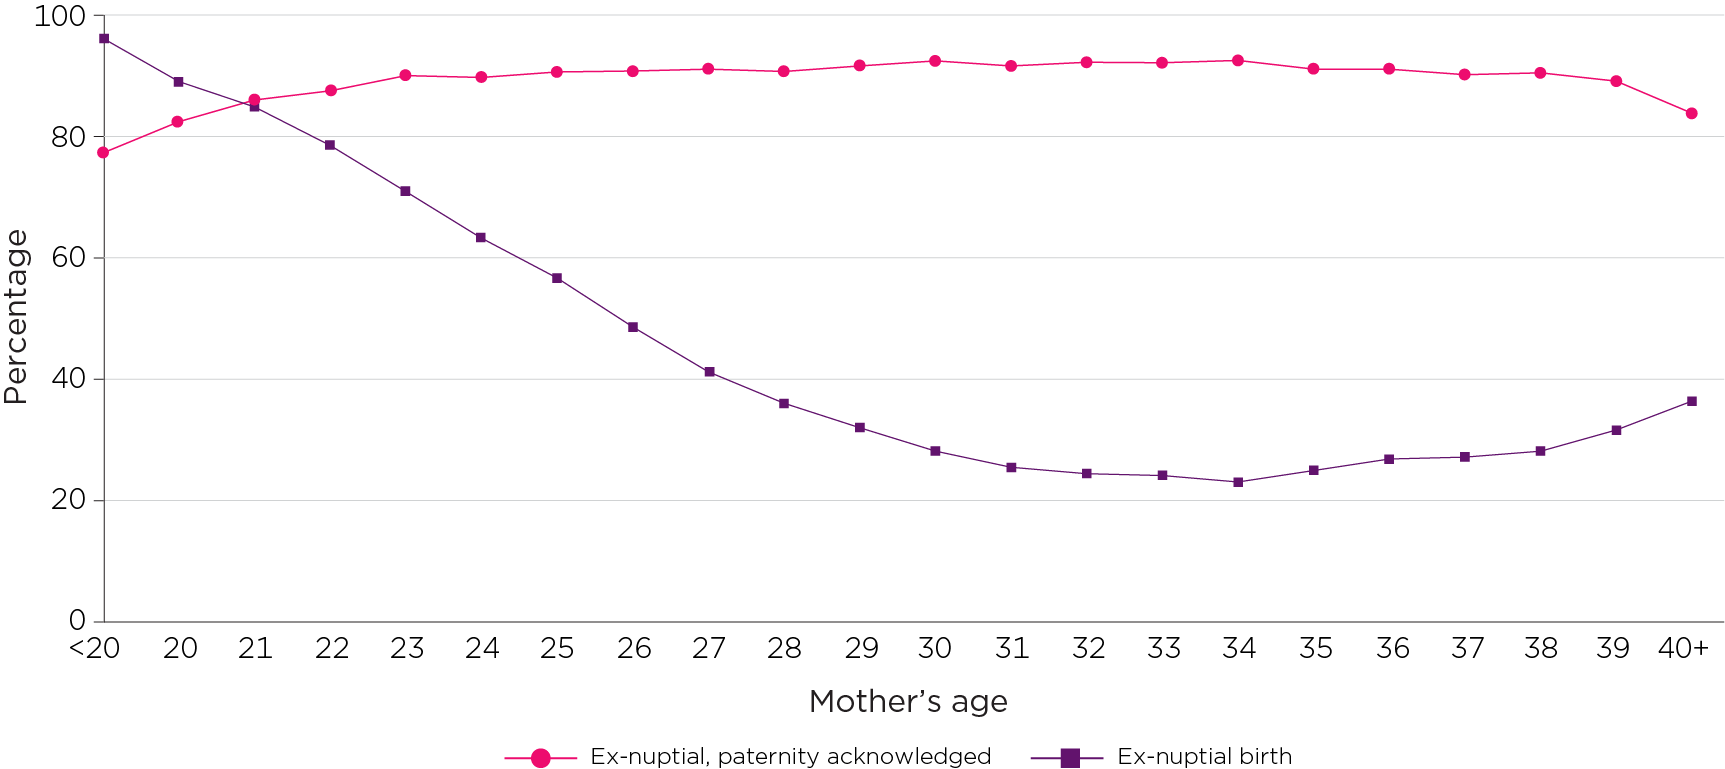
Source: ABS, (2021), Births, Australia, 2020
Number of children women aged 45–49 years ever had
The fertility data presented above focuses on births at different points in time to derive different rates of fertility. Another perspective on fertility is gained by looking at how many children women have ever had at different ages. Trends in the number of children that 45-49 year old women have ever had provides insights into trends in complete fertility, given most women have completed their childbearing by these ages.
There is a lag evident when comparing the completed fertility of 45–49 year old women at a point in time to when peak childbearing was likely to occur for those women. For example, women aged 45–49 in 1981 were 25–29 in 1961 (at which time they likely already had one or two children according to the fertility data). In comparison, women aged 45–49 in 2016 were 25–29 in 1996. In 1996 the fertility rate for 25–29 year olds was around half of the peak in 1961, and, at this time, the average age of first birth was rising rapidly. Figure 8 shows that, by age 45–49 years, the proportion of women who have had three or more children has fallen considerably since the 1980s, which is consistent with the changes in fertility patterns.
The proportions of 45–49 year olds in 2016 who have had no children or only one or two children has increased.
- In 1981, women aged 45–49 years were less likely to have had two children and three children (25% each) than four or more children (33%).
- Taken together, women were considerably more likely to have had three or more children than to have had only two children (58% vs 25%).
- By 1996, women of this age were more likely to have had two children (39%) than three children (26%) or four or more children (15%). This pattern became more apparent prior to the most recent census in 2016.
- The fall in the proportion of women in the 45–49 age group with four or more children was most striking, from 33% in 1981 to 11% in 2016.
- The family size of two children had become the most common by 1996, and this has remained stable since then (38%–39%).
- Proportions of women having one child or no children have steadily increased since 1986, from 8% in 1986 to 14% in 2016 for one child, and from 9% in 1986 to 16% in 2016 for no children.
- Taken together, around 30% of women aged 45–49 years in 2016 had one child or no children, compared to 16%–17% in 1981 and 1986.
Figure 8: Number of children women aged 45–49 had ever had, 1981–2016
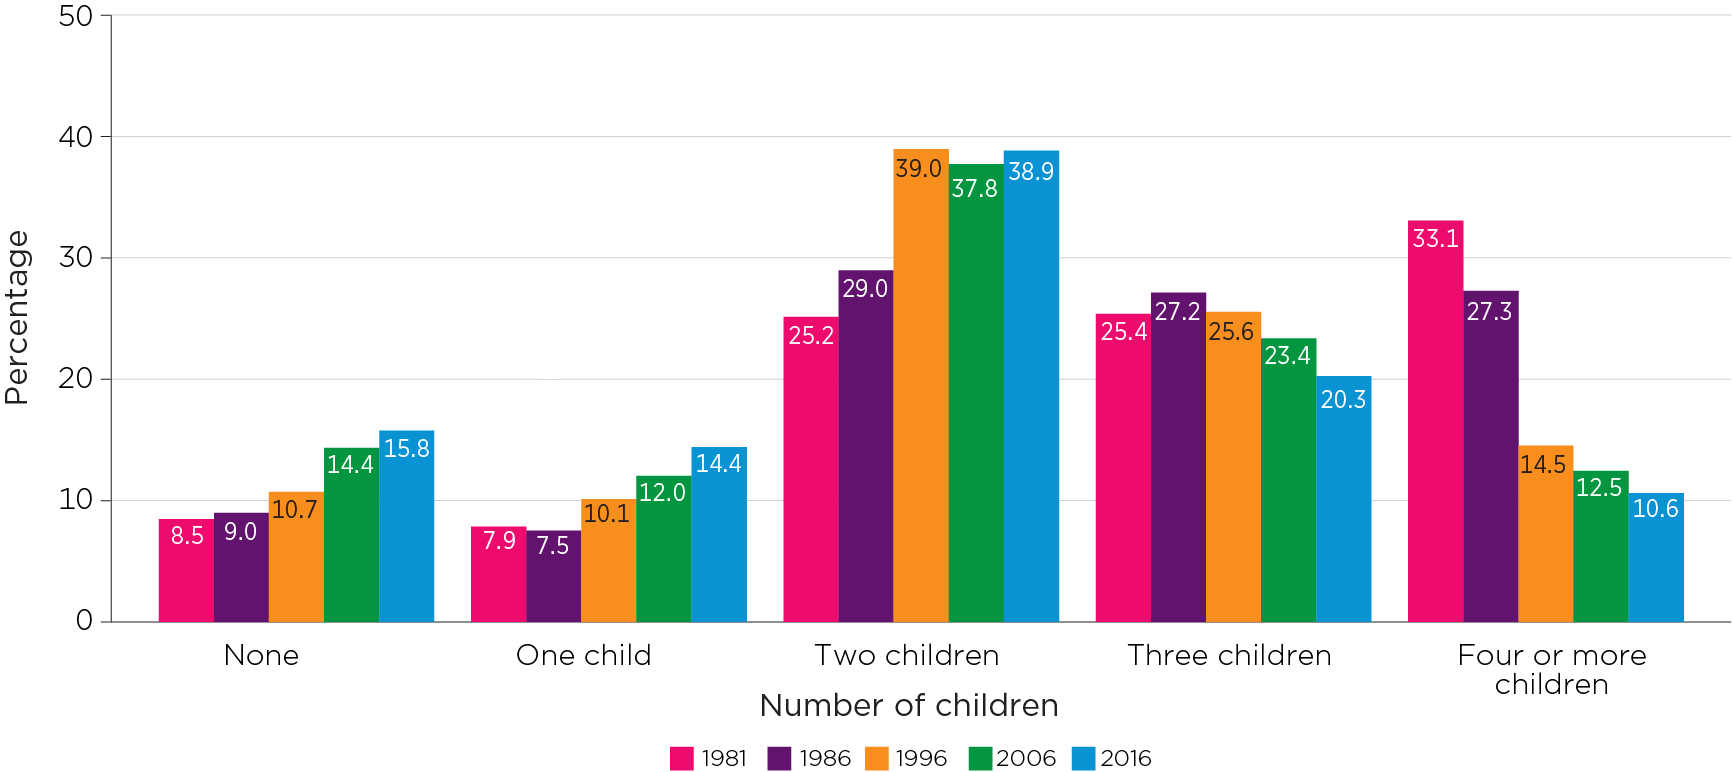
Source: ABS, (1981–2016), Census of Population and Housing
References
Australian Bureau of Statistics (ABS). (Various years). Births, Australia (Catalogue No. 3301.0). Canberra: ABS.
Australian Bureau of Statistics. (1963). Australian Yearbook (Catalogue No. 1301.0).
Australian Bureau of Statistics. (1973). Australian Yearbook (Catalogue No. 1301.0).
Australian Bureau of Statistics. (1983). Census of population and housing, 30 June 1981: Cross-classified characteristics of persons and dwellings Australia (Catalogue No. 2452.0). Canberra: ABS.
Australian Bureau of Statistics. (1989). Census of population and housing, 30 June 1986: Cross-classified characteristics of persons and dwellings Australia (Catalogue No. 2498.0). Canberra: ABS.
Australian Bureau of Statistics (2007). 2006 Census Community Profile Series T07: Number of children ever born by age of female for time series (Catalogue no. 2003.0). Canberra: ABS. Retrieved from quickstats.censusdata.abs.gov.au/census_services/getproduct/census/2006/communityprofile/0?opendocument
Australian Bureau of Statistics. (2008). Australian historical statistics (Catalogue. No. 3105.0.65.001).
Australian Bureau of Statistics. (2017). 2016 Census of Population and Housing - General community profile G24: Number of children ever born (Catalogue no. 2001.0). Canberra: ABS. Retrieved from quickstats.censusdata.abs.gov.au/census_services/getproduct/census/2016/communityprofile/036?opendocument
Australian Bureau of Statistics. (2021). Births, Australia, 2020. Retrieved from www.abs.gov.au/statistics/people/population/births-australia/2020
Australian Bureau of Statistics. (2021). Births, summary by state. Retrieved from quickstats.censusdata.abs.gov.au/census_services/getproduct/census/2006/communityprofile/0?opendocument
Australian Institute of Health and Welfare (AIHW). (2021). Australia's mothers and babies 2019 – data tables (Table 1.2). Retrieved from www.aihw.gov.au/reports/mothers-babies/australias-mothers-babies/data
Commonwealth Bureau of Census and Statistics (ABS). (1964). Demography (Bulletin No. 63). Canberra: ABS.
Commonwealth Bureau of Census and Statistics (ABS). (1973). Demography (Bulletin No. 86). Canberra: ABS.
Jain, S. K., & McDonald, P. F. (1997). Fertility of Australian birth cohorts: Components and differentials. Journal of the Australian Population Association, 14(1), 31–46.
Lancaster, P., Huang, J., & Pedisich, E. (1994). Australia’s mothers and babies 1991 (Perinatal statistics series no.1). Canberra: Australian Institute of Health and Welfare.
Laws, P.J., & Sullivan, E. A. (2004). Australia’s mothers and babies 2001 (Perinatal statistics series no. 13). Canberra: Australian Institute of Health and Welfare.
Li, Z., Zeki, R., Hilder, L., & Sullivan, E. A. (2013). Australia’s mothers and babies 2011 (Perinatal statistics series no. 28). Canberra: Australian Institute of Health and Welfare.
McDonald, P. (1995). Families in Australia: A socio-demographic perspective. Melbourne: Australian Institute of Family Studies.
Qu, L., & Weston, R. (2012). Parental social marital status and children’s wellbeing (Occasional Paper no.46). Canberra: Australian Department of Social Services.
Weston, R., Qu, L., Parker, R., & Alexander, M. (2004). ‘It’s not for lack of wanting kids’: A report on the Fertility Decision Making Project (Research Report no. 11). Melbourne: Australian Institute of Family Studies.
1 McDonald (1995) noted that about one-quarter of brides were pregnant at the time of marriage. There was this tension between the desire to be sexually active and the social stigma associated with premarital sex in the 1950s and 1960s. Premarital pregnancies led some couples to enter a hasty marriage.
2 These data are derived from birth registrations. There are differences across jurisdictions and over time in the way parents These data are derived from birth registrations. There are differences across jurisdictions and over time in the way parents other than birth parents (e.g. for same-sex parents) can be acknowledged on the birth certificates. This section uses the data as provided by the ABS, which reports births as being nuptial (within marriage), ex-nuptial (paternity acknowledged; that is, the father named on the birth certificate), or ex-nuptial (paternity not acknowledged).
3 Retrieved from explore.data.abs.gov.au/vis?tm=births&pg=0&df%5bds%5d=ABS_ABS_TOPICS&df%5bid%5d=BIRTHS_SUMMARY&df%5bag%5d=ABS&df%5bvs%5d=1.0.0&hc%5bMeasure%5d=Births&pd=2020%2C&dq=7%2B10%2B9%2B8%2B1..A&ly%5brw%5d=MEASURE&ly%5bcl%5d=REGION
