Families and family composition
Overall family trends
There were 6.73 million families across Australia in 2021, according to the census. This count of families focuses on who people usually lived with, when household members identify that they are related by relationship or by blood. It does not include one-person households and group households.
In 2021, families included:
- 2,608,834 couples without children (39%)
- 2,424,680 couples with dependent children (36%) – that is, with children up to 14 years or dependent students aged 15–24 years
- 674,059 one-parent families with dependent children (10%)
- 519,457 couples with non-dependent children (children aged over 25 years or children aged 15–24 years who are not full-time students) (8%)
- 394,202 one-parent families with non-dependent children (6%)
- 108,941 other families, such as siblings or other related people living together (<2%).
Figure 1 shows the trends from 1981 to 2021:
- The proportion of couple families without children has increased and the proportion with children has decreased, consistent with expectations with an ageing population.
- One-parent families with dependent children, as a proportion of all families, were under 9% in 1981 and 1991, increased to 10.7% in 2001, but has remained at a similar level since then.
- One-parent families with non-dependent children represented 4% of all families in 1981, the proportion has shown an upward trend, rising to 6% in 2021.
There was considerable stability in these distributions over the period 2011–21 compared to the preceding decades.
Figure 1: The proportion of couple families without children continues to rise
Proportion of Australian families by type,1991–2021

Note: Dependent children include children aged under 15 years and full-time students aged 15–24 years.
Sources: ABS 1981–2021 Censuses
Families and households across ages
Figure 2 presents how, in 2021, the composition of families and households that people lived in varied by age. Figure 2 shows distinct patterns across five-year age groups, reflecting different stages in the life course:
- At childhood, most live in a couple-parent family, with the vast majority living with biological parents, although some diversity of arrangements increases as children grow and living in a one-parent family becomes more common (see Figure 6 for more on this).
- In the 15–19 years age group, most young people are still living with one or two parents. Some are living in non-private dwellings (such as schools) while small numbers are living in other households (including group households) and other family types.
- The next age group, at 20–24 years, sees large shifts in living arrangements. While many still live at home (see also Young people living with parents), there is a large increase in young people living in other households, and also forming their own family households and living with a partner. Living in ‘other’ households, such as group households, is common at 20–24 years.
- As young people start forming their own families, their family living arrangements change, with many from ages 20–24 years onwards living in their own couple-only family or as a couple with children. The proportion of adults living in couple families with children peaks at 40–44 years, and then falls for older age groups. Adults living in a couple-only family initially peaks at 25–29 years, and then declines when young couples started having children. Living in a couple-only family starts increasing again after 40–44 years, as children start leaving home. The proportion declines from 70–74 years, when it becomes more common for one of the partners to have died.
- Looking at those living in a one-parent family, the proportion was particularly high at 10–14 years and 15–19 years (21% and 22% respectively). Living in one-parent families was also more common for age groups 40–44, 45–49 and 50–54 years, compared to other age groups older than 25 years.
Figure 2: Family composition changes with life stage, but living with family is common at all ages
Proportion of people in different family and household type by age, 2021
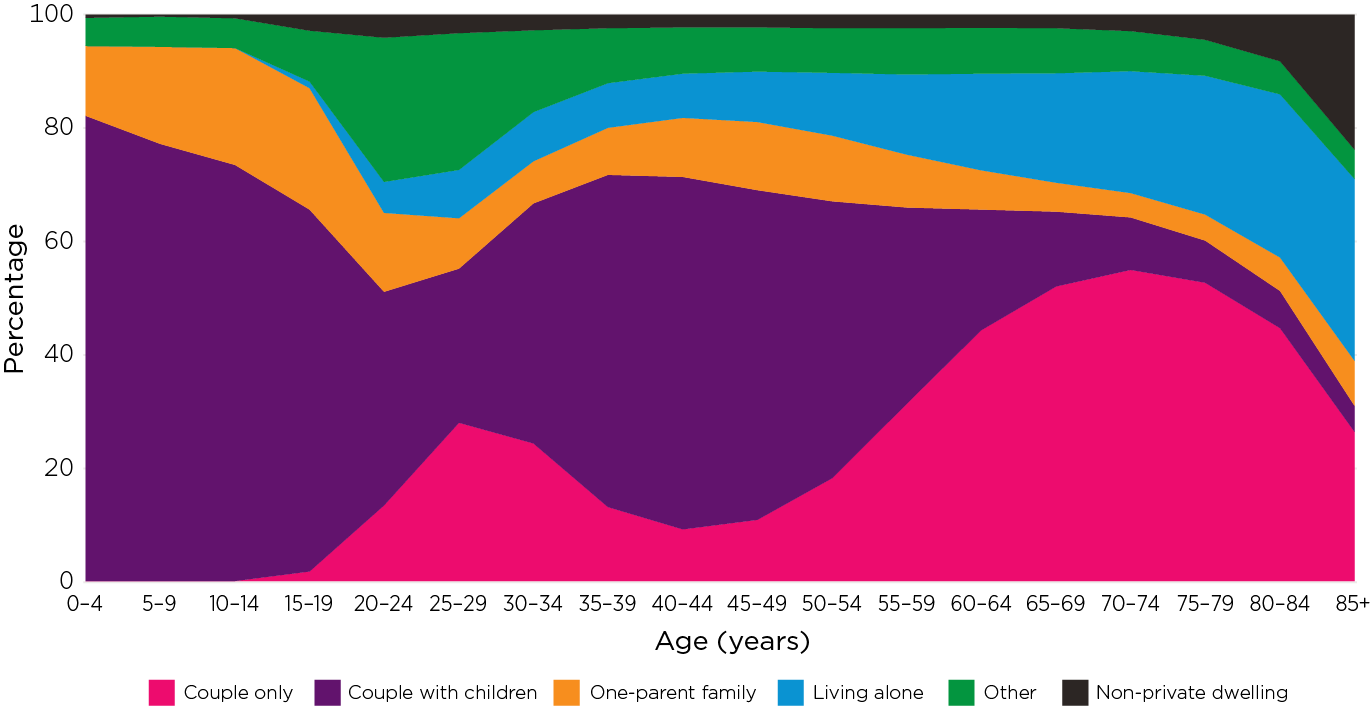
Note: ‘Other’ includes people in group households, unclassifiable households, and people living as non-family members in various family types, as well as families other than the three family types presented in the figure.
Sources: ABS 2021 Census TableBuilder
Families with dependent children
Single- and couple-parent families with dependent children
Figure 3 shows that the number of one-parent families with dependent children has increased over time. As a percentage of families with dependent children, one-parent families with dependent children increased from 16% in 1981 to 23% in 2006, though has fallen slightly since then, to 22% in 2021.
Although most single parents with dependent children were single mothers, single fathers as a proportion of single parents with dependent children increased slightly from 14% in 2006 to 18% in 2021.
Figure 3: The number of one-parent families with dependent children has increased but, as a proportion of families with dependent children, the trend is stable
One-parent families with dependent children as percentage of all families with dependent children, selected years, 1981–2021
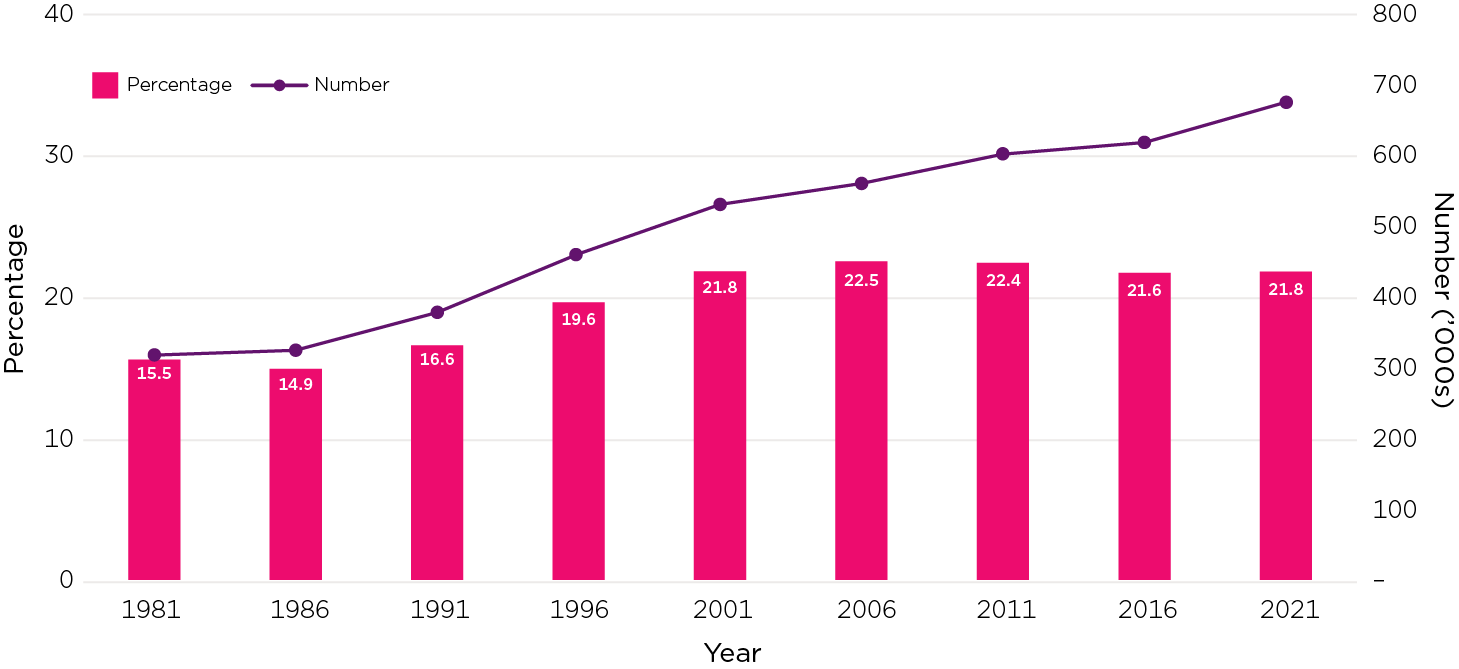
Note: Dependent children include children aged under 15 years and full-time students aged 15–24 years.
Sources: ABS 1981–2021 Censuses
How many dependent children in families with children?
In Australian families, two children have become the most common family size, reflecting the fall in the number of children women ever had at the end of their reproductive years (see Births in Australia). Looking back over the past 10 years (using three censuses), there are only small changes in family size, indicating the trend of having fewer children has slowed down.
- Over the three censuses, couples with dependent children typically had two children (43%–44%) or one dependent child (35%–36%). Having three or more dependent children was less common among couples (20%–22%). (These counts do not include children living elsewhere).
- One-parent families had fewer dependent children compared to couple families. Across the three census years, one-parent families most commonly had one dependent child (51%–52%) or two dependent children (32%–34%). Having three or more dependent children was uncommon among one-parent families (15%–16%).
- The patterns in the number of children in couple- and one-parent families with dependent children were similar across the three census years, although:
- The proportion of the couples with three or more dependent children trended down, and the proportions with one or two dependent children rose slightly.
- For one-parent families, the proportion with two dependent children increased slightly from 32% in 2011 to 34% in 2021.
Figure 4: The number of dependent children in families has remained stable in the past decade
Number of dependent children in couple- and one-parent families with dependent children
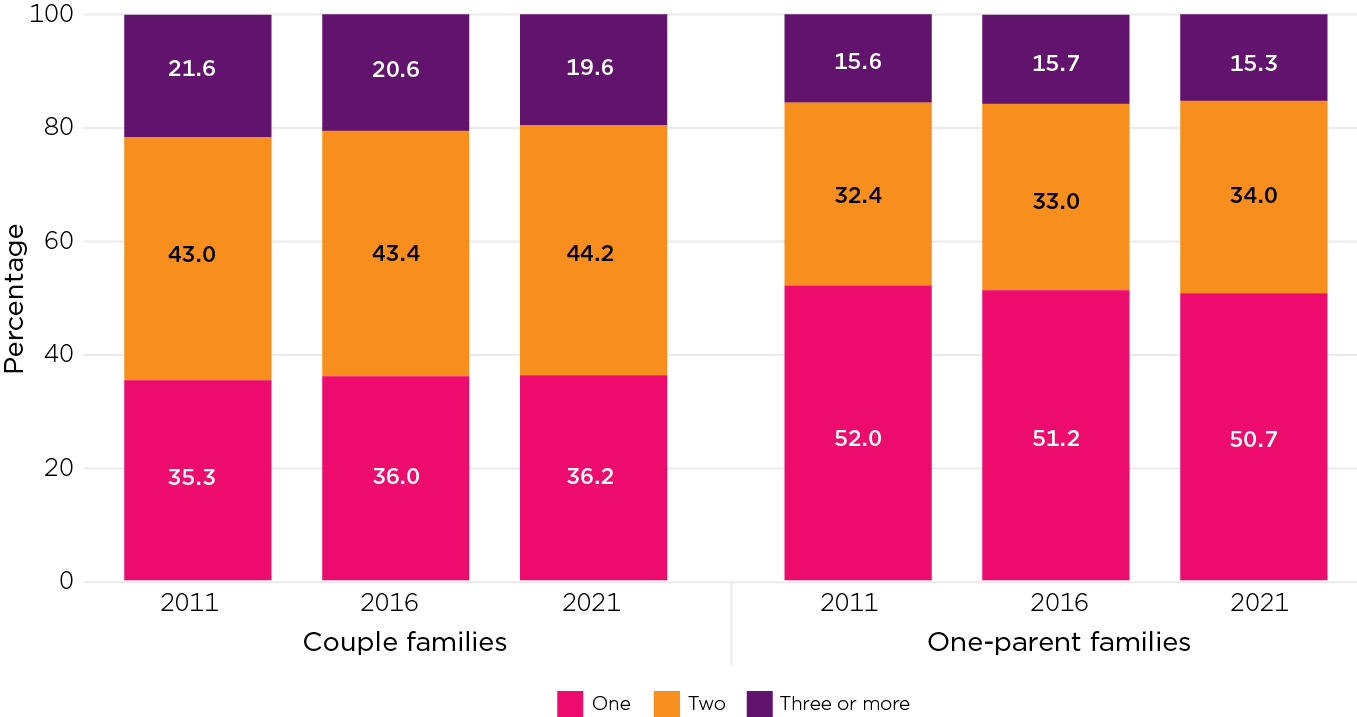
Sources: ABS 2011, 2016 & 2021 Census TableBuilder
The statistics above focus on co-resident dependent children. Households often include children who are not classified as ‘dependent’. This may include 15–24 year olds who are not full-time students or other adult children aged 25 years and over. In 2021, 31% of families included full-time students aged 15–24 years and 12% included non-dependent children (adult children aged 25 years and older or 15–24 year olds who were not full-time students).
AIFS Facts and Figures about Young People Living with Parents presents more information from the young people’s perspective.
Families, of course, extend beyond the household but the census data focus on those who were in the household on census night or who usually live in the household.
Blended and other families with children
In the statistics presented above, families were described as couple-parent or one-parent families. Within couple-parent families, there is diversity. This analysis categorises couple families into intact families, step-families or blended families. The ABS defines a blended family as a couple family with at least one natural or adopted child of both partners and at least one step-child of either partner. A step-family is defined as a couple family with at least one step-child of either partner in the couple and without any natural or adopted children of both partners. The analysis excludes other families such as grandparent-headed families – see later section.
As at the 2021 Census, 12% of couple families with dependent children were either step- or blended families. There were:
- 182,229 step-families, representing 8% of couple families with dependent children
- 99,564 blended families, accounting for 4% of couple families with dependent children.
Figure 5 presents the trends in these statistics for couples with dependent children for 2006–21:
- At each year, the vast majority were intact families (88%–90%). The proportion in 2021 was slightly lower than in previous time periods (88% vs 89%–90%).
- The proportion classified as step-families fluctuated, with the proportion in 2021 higher than in the previous three censuses (8% cf. 5%–6%).
- The proportion classified as blended families was slightly lower in 2021 compared to previous years.
Figure 5: About one in ten couples with dependent children was a step-family or blended family
Family blending of couples with dependent children, 2006–2021
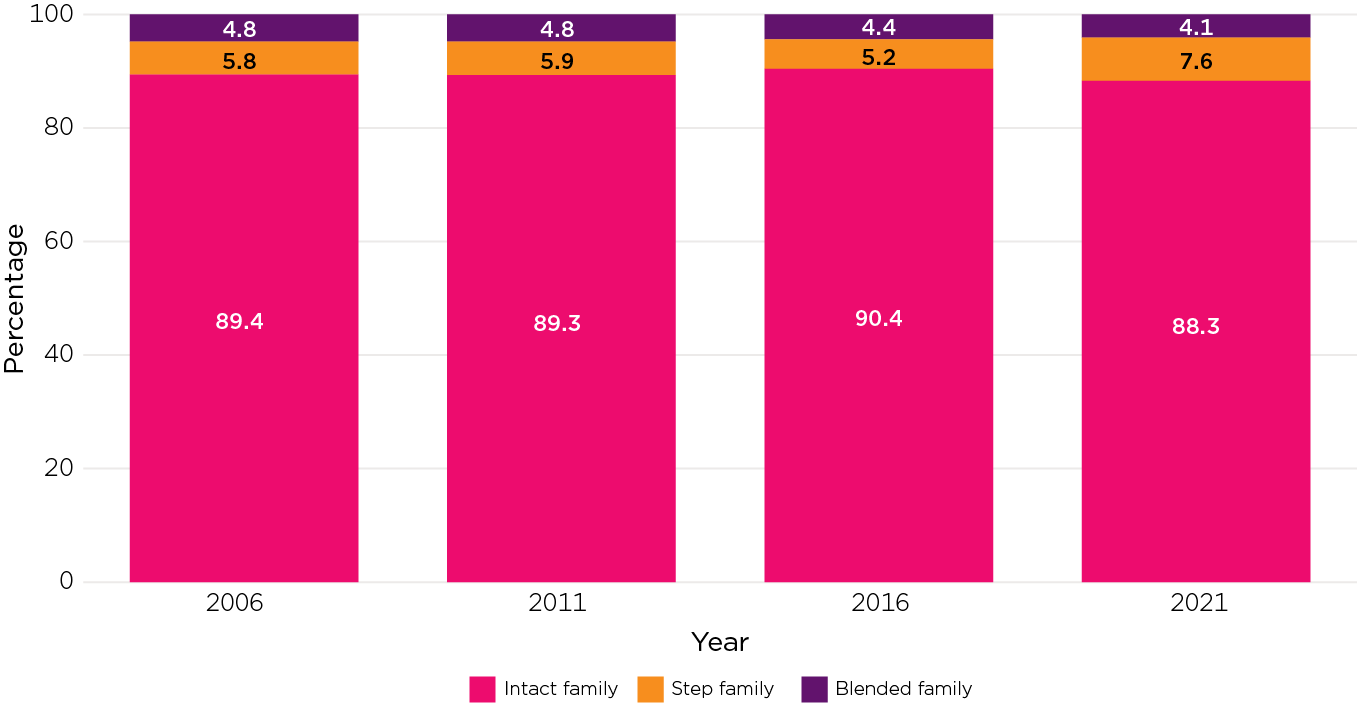
Note: Excludes a very small number (0.4% in 2021) that were classified as ‘other couple’.
Sources: ABS 2006, 2011, 2016 and 2021 Census TableBuilder
Children in different types of families
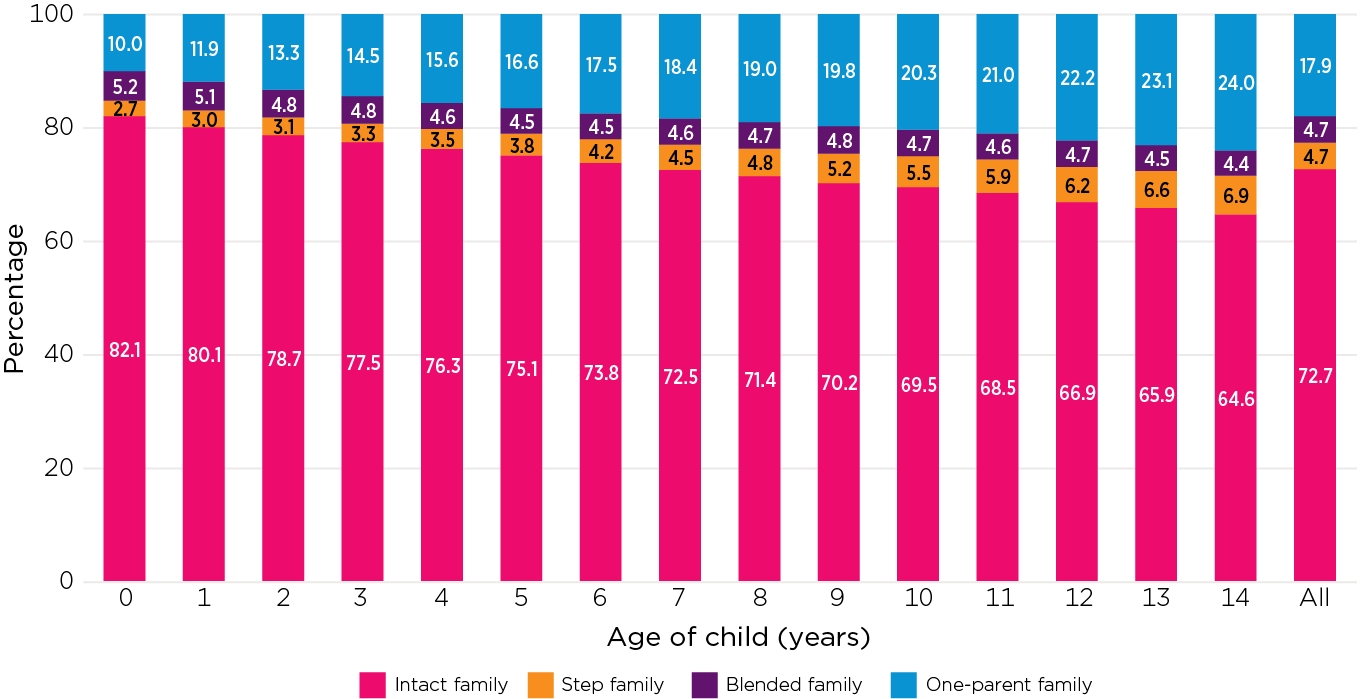
This section takes a different perspective – showing how family composition varies for children by single year of age up to 14 years, using the 2021 Census. Figure 6 shows the proportion living in a one-parent family, intact, step- or blended family at each age. (A very small proportion, 0.4%, living in a family classified as ‘other couple’ is excluded from the figure.):
- The proportion of children in intact families fell with age, from 82% for infants under one year down to 64% for 14 year olds, reflecting the impacts of parental separation as children grow. The proportion over all ages combined was 72%.
- Among children aged under one year, 10% were living in a one-parent family. This proportion increased gradually each year with a child’s age, such that 24% of 14 year olds were living in a one-parent family, reflecting the accumulated effects of parental separation. Over all 0–14 year olds, 18% lived in a one-parent family.
- Of the under-one year olds, 5% were living in a blended family and 3% in a step-family. The proportion of children in blended families changed little with children’s age. However, the proportion living in a step-family increased with age, to 7% for 14 year olds.
Figure 6: The proportion of children living in a one-parent, step- or blended family increases with their age
Percentages of children aged 0–14 years living in couple or one-parent families by age, 2006 and 2021
Source: ABS 2021 Census TableBuilder
Couple-only families
Getting older
Figure 1 shows that families without children as a proportion of all families increased faster than all other family types. This increase mainly reflects a rise in the number of older couples, which is consistent with Australia’s ageing population (see Populations & Households). Figure 7 shows the distribution of couple-only families according to the age of the female partner from 1991 to 2021:
- The proportion of couple-only families with a female partner aged 65 years and over rose from 26% in 1991 to 36% in 2021.
- The proportion of couple-only families with a female partner aged 55–64 years increased from 23% in 1991 to 27% in 2006, and then fell to 23% in 2021.
- The proportions with either a female partner aged 45–54 or aged under 25 years both decreased, from 16% to 10% and from 10% to 5%, respectively, between 1991 and 2021.
Figure 7: With the ageing population, over time, couple families without children are more likely to be older
Couples without children: age of female partner, 1991–2021
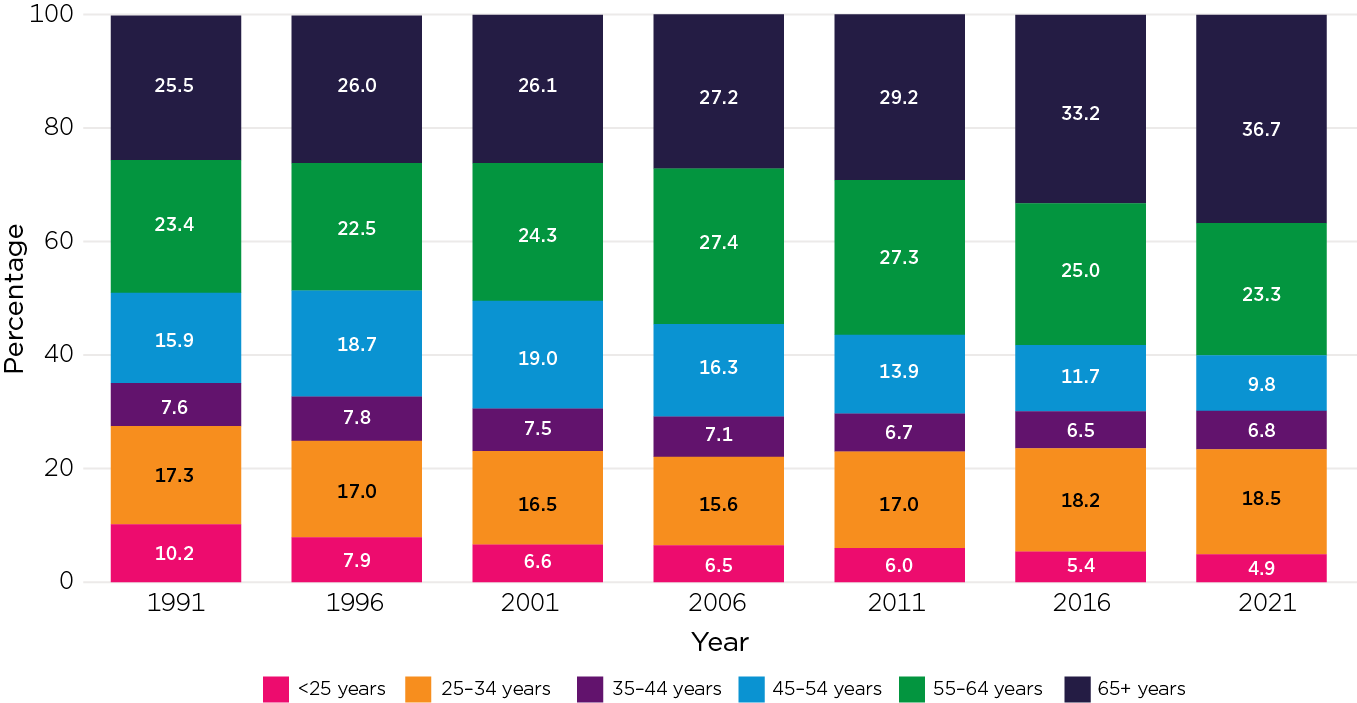
Notes: For 1991–2011, when there were two female partners, the age of the first female partner listed on the census form was used. For 2016 and 2021, person-level data in TableBuilder were used for those living with a partner in a couple-only family. Both partners in a female same-sex relationship would be included in the calculations for these years.
Sources: ABS 1991–2011 Census customised tables; ABS 2016 & 2021 Census TableBuilder
Grandparents and families
Grandparents play an important role in children’s lives. Not only do most children spend time with their grandparents regularly, but grandparents are also the main providers of informal child care (Baxter [AIFS], 2015, 2022). For various reasons, some grandparents become primary carers of their grandchildren (Qu, Lahausse, & Carson [AIFS], 2018; Qu, Moloney, Weston et al. [AIFS], 2011). This section focuses on these ‘grandparent families’. ABS statistics on grandparent families refer to families in which a grandparent–grandchild relationship is present and there is no parent–child relationship.1 Grandparent families were not identified in censuses prior to 2011.
ABS further separates grandparent families into single-grandparent families and couple-grandparent families, and whether they have dependent grandchildren (i.e. children aged under 15 years, full-time students aged 15–24 years) or older non-dependent grandchildren.
In the 2021 Census, 60,785 grandparent families were identified, accounting for 0.9% of all families, or 1.5% of families with children (dependent and non-dependent). In 2011 there were 46,679 grandparent families, accounting for 0.8% of all families, and, in 2016, there were 60,644 grandparent families (1% of all families). The proportion of grandparent families among all families has remained largely stable over the last decade.
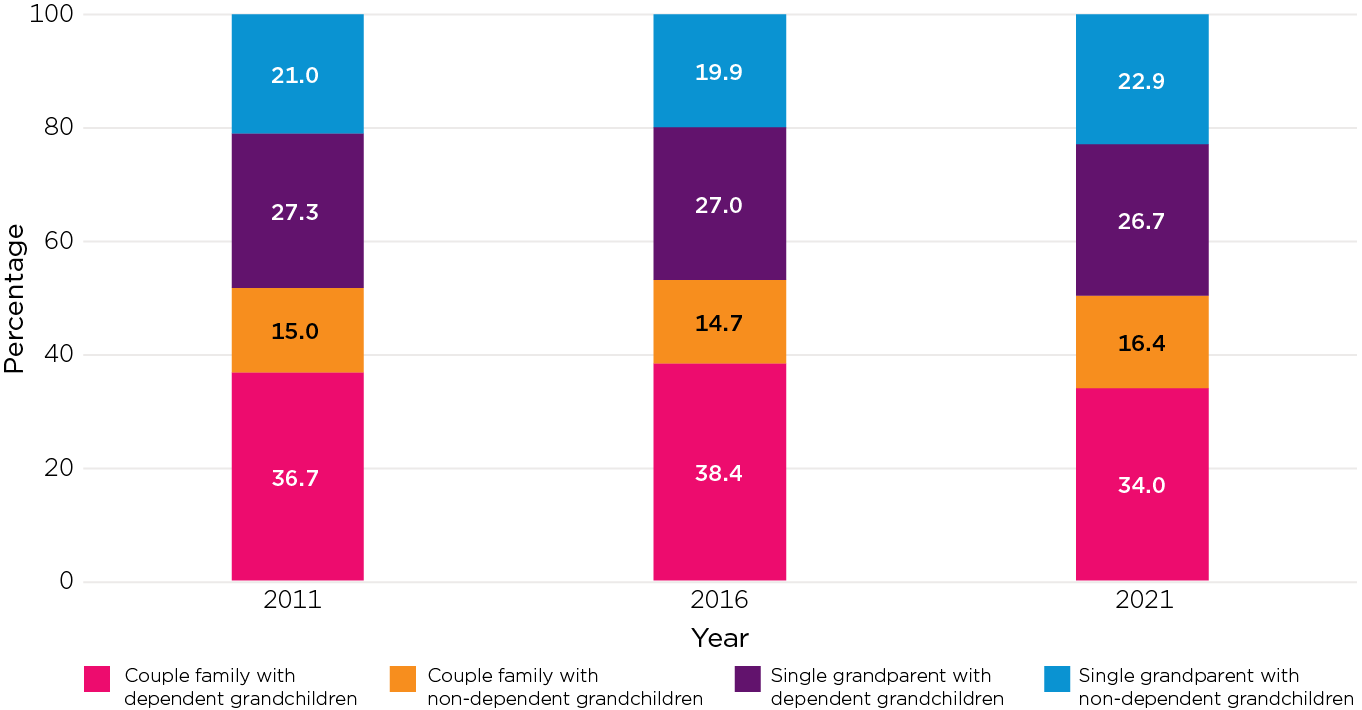
Figure 8 presents the proportion of grandparent families in different forms over three census years:
- Of the four family types shown, couple-grandparent families with dependent grandchildren were the most common (34%–38%), followed by single-grandparent families with dependent children (27% for each of the three census years).
- The proportions of couple grandparent families and single grandparent families were similar across the three census years, although there were slightly fewer couple grandparent families in 2021 than in 2011 and 2016.
Figure 8: The most common type of grandparent family is couple grandparents living with dependent grandchildren
Type of grandparent families, 2011–21
Sources: ABS 2011–16 Censuses
Same-sex couple families
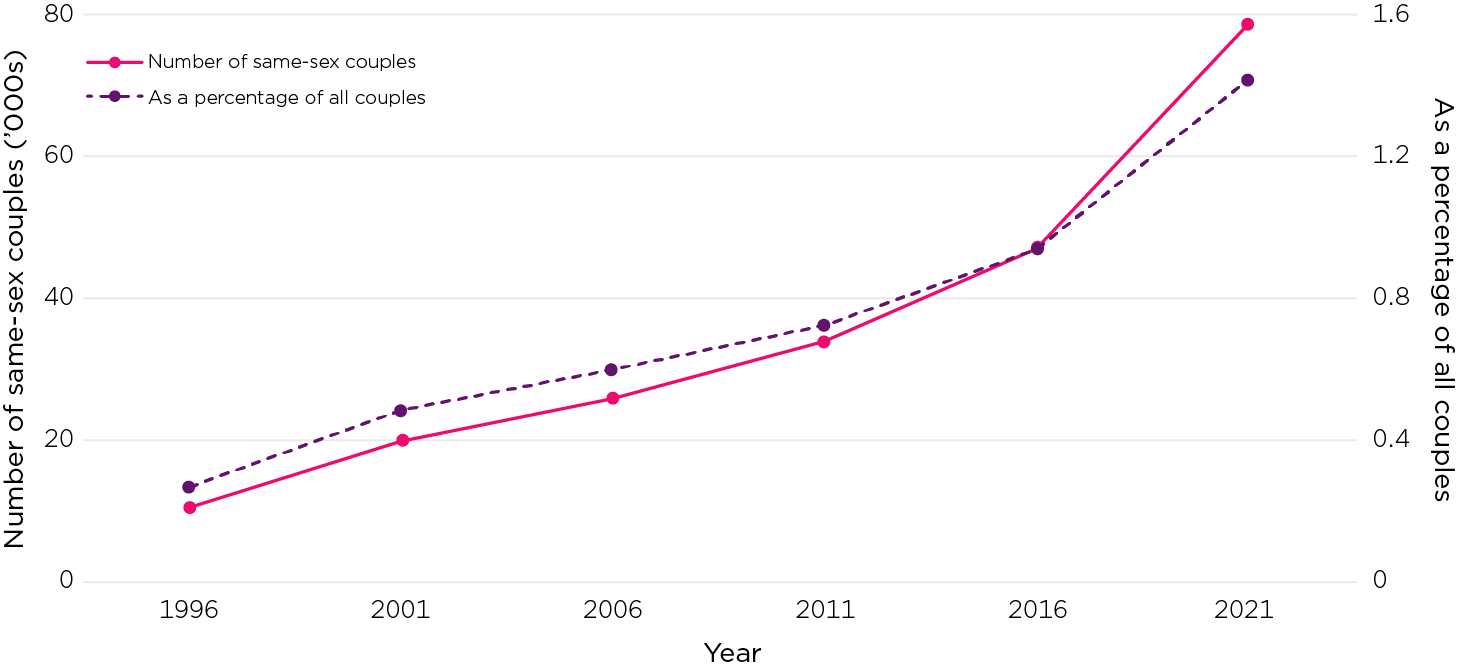
One change relating to family composition has been the rise in the number of same-sex couple families (ABS, 2021). The amendments to the Marriage Act in 2017 allowed same-sex couples to legally marry in Australia (Marriages in Australia). The ABS started reporting about same-sex couples from the census in 1996. Figure 9 shows the number and proportion of same-sex couples in Australia across census years from 1996 to 2021:
- In 2021 there were more than 78,000 same-sex couples, accounting for 1.4% of all couples.
- The number of same-sex couples increased sevenfold, from about 10,000 couples in 1996 to 78,000 couples in 2021. The proportion of couples identified as a same-sex couple increased from 0.3% in 1996 to 1.4% in 2021. The sharp rise between 2016 and 2021 was particularly marked compared to the trends before 2016. For example:
- the proportion of same-sex couples increased by 0.2 percentage points, from 0.7% in 2011 to 0.9% in 2016
- whereas the proportion rose by 0.5 percentage points, from 0.9% in 2016 to 1.4% in 2021.
As the ABS has noted, the rise in same-sex couples might partly reflect an increasing willingness for same-sex couples to disclose their relationship. It could also be that, with the legalisation of same-sex marriage and increasing acceptance of same-sex relationships, same-sex partners are now more prepared to form a couple household, instead of living separately.
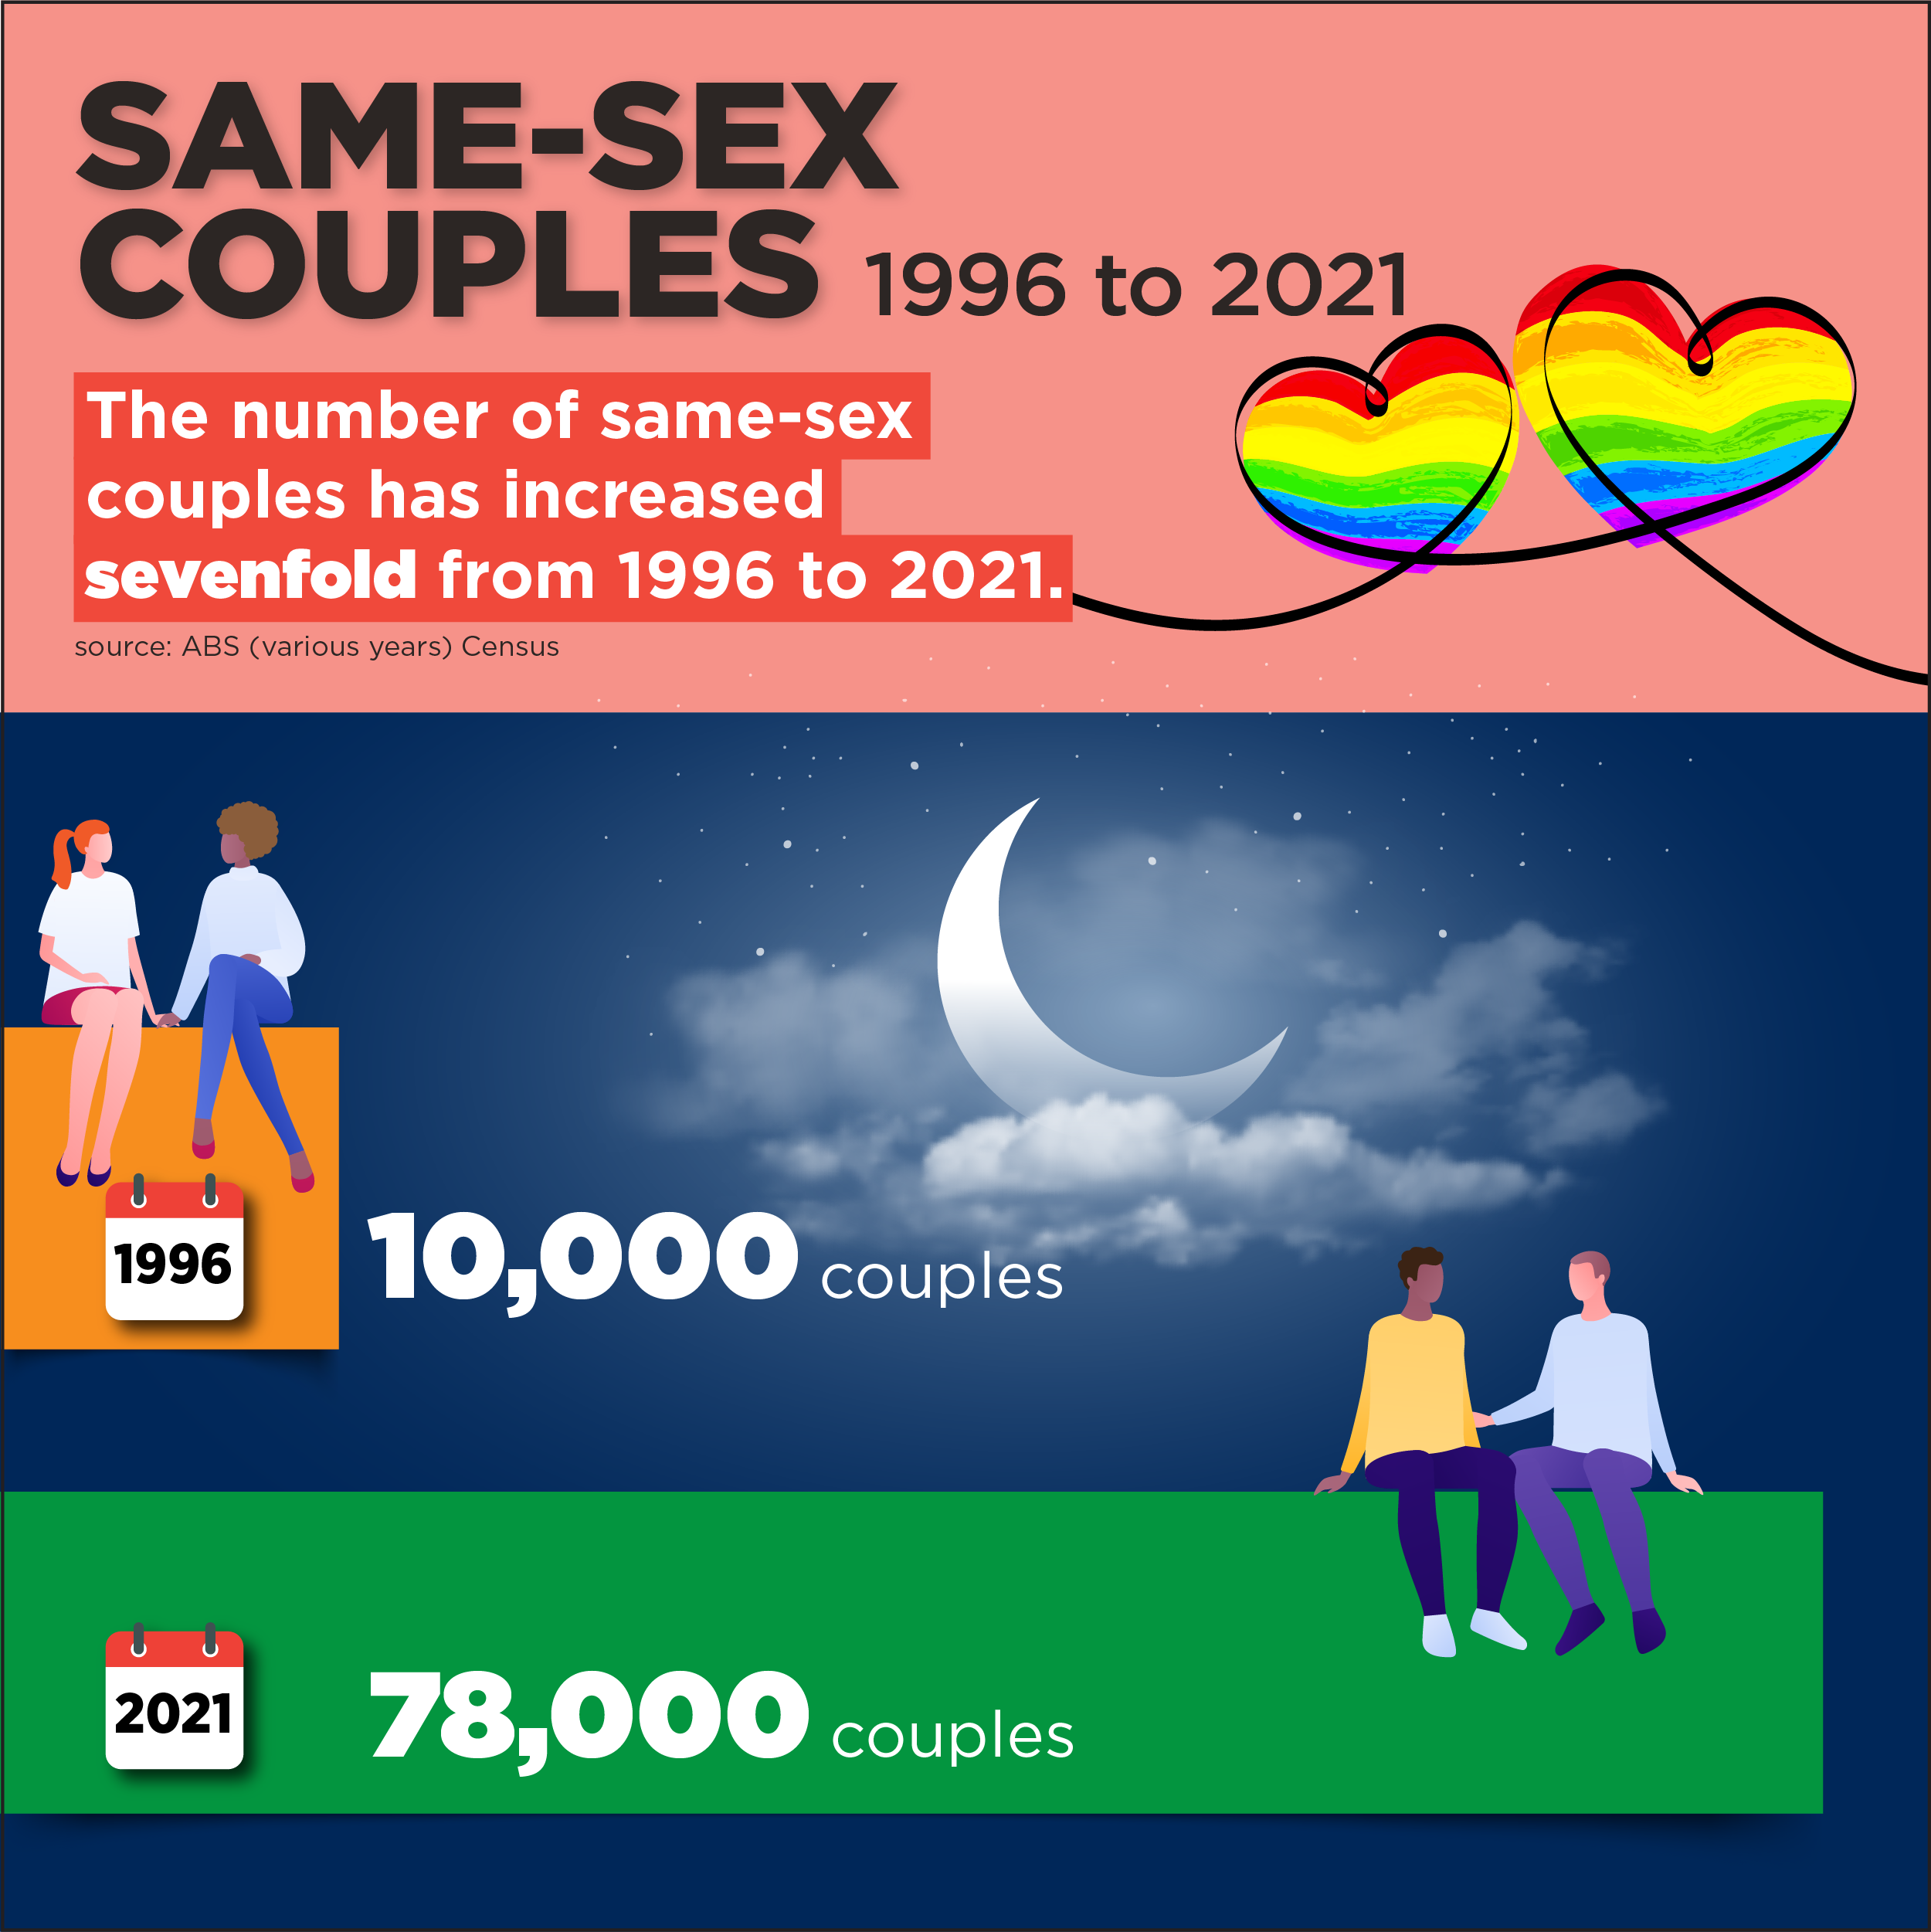
Figure 9: Numbers of same-sex couples increased in both absolute and relative terms
Same-sex couples, number and as a percentage of all couples, 1996–2021
Sources: ABS, (2005), Year Book Australia (2005) Catalogue (no.1301.0) (Table 3.63); ABS 2006–21 Census TableBuilder
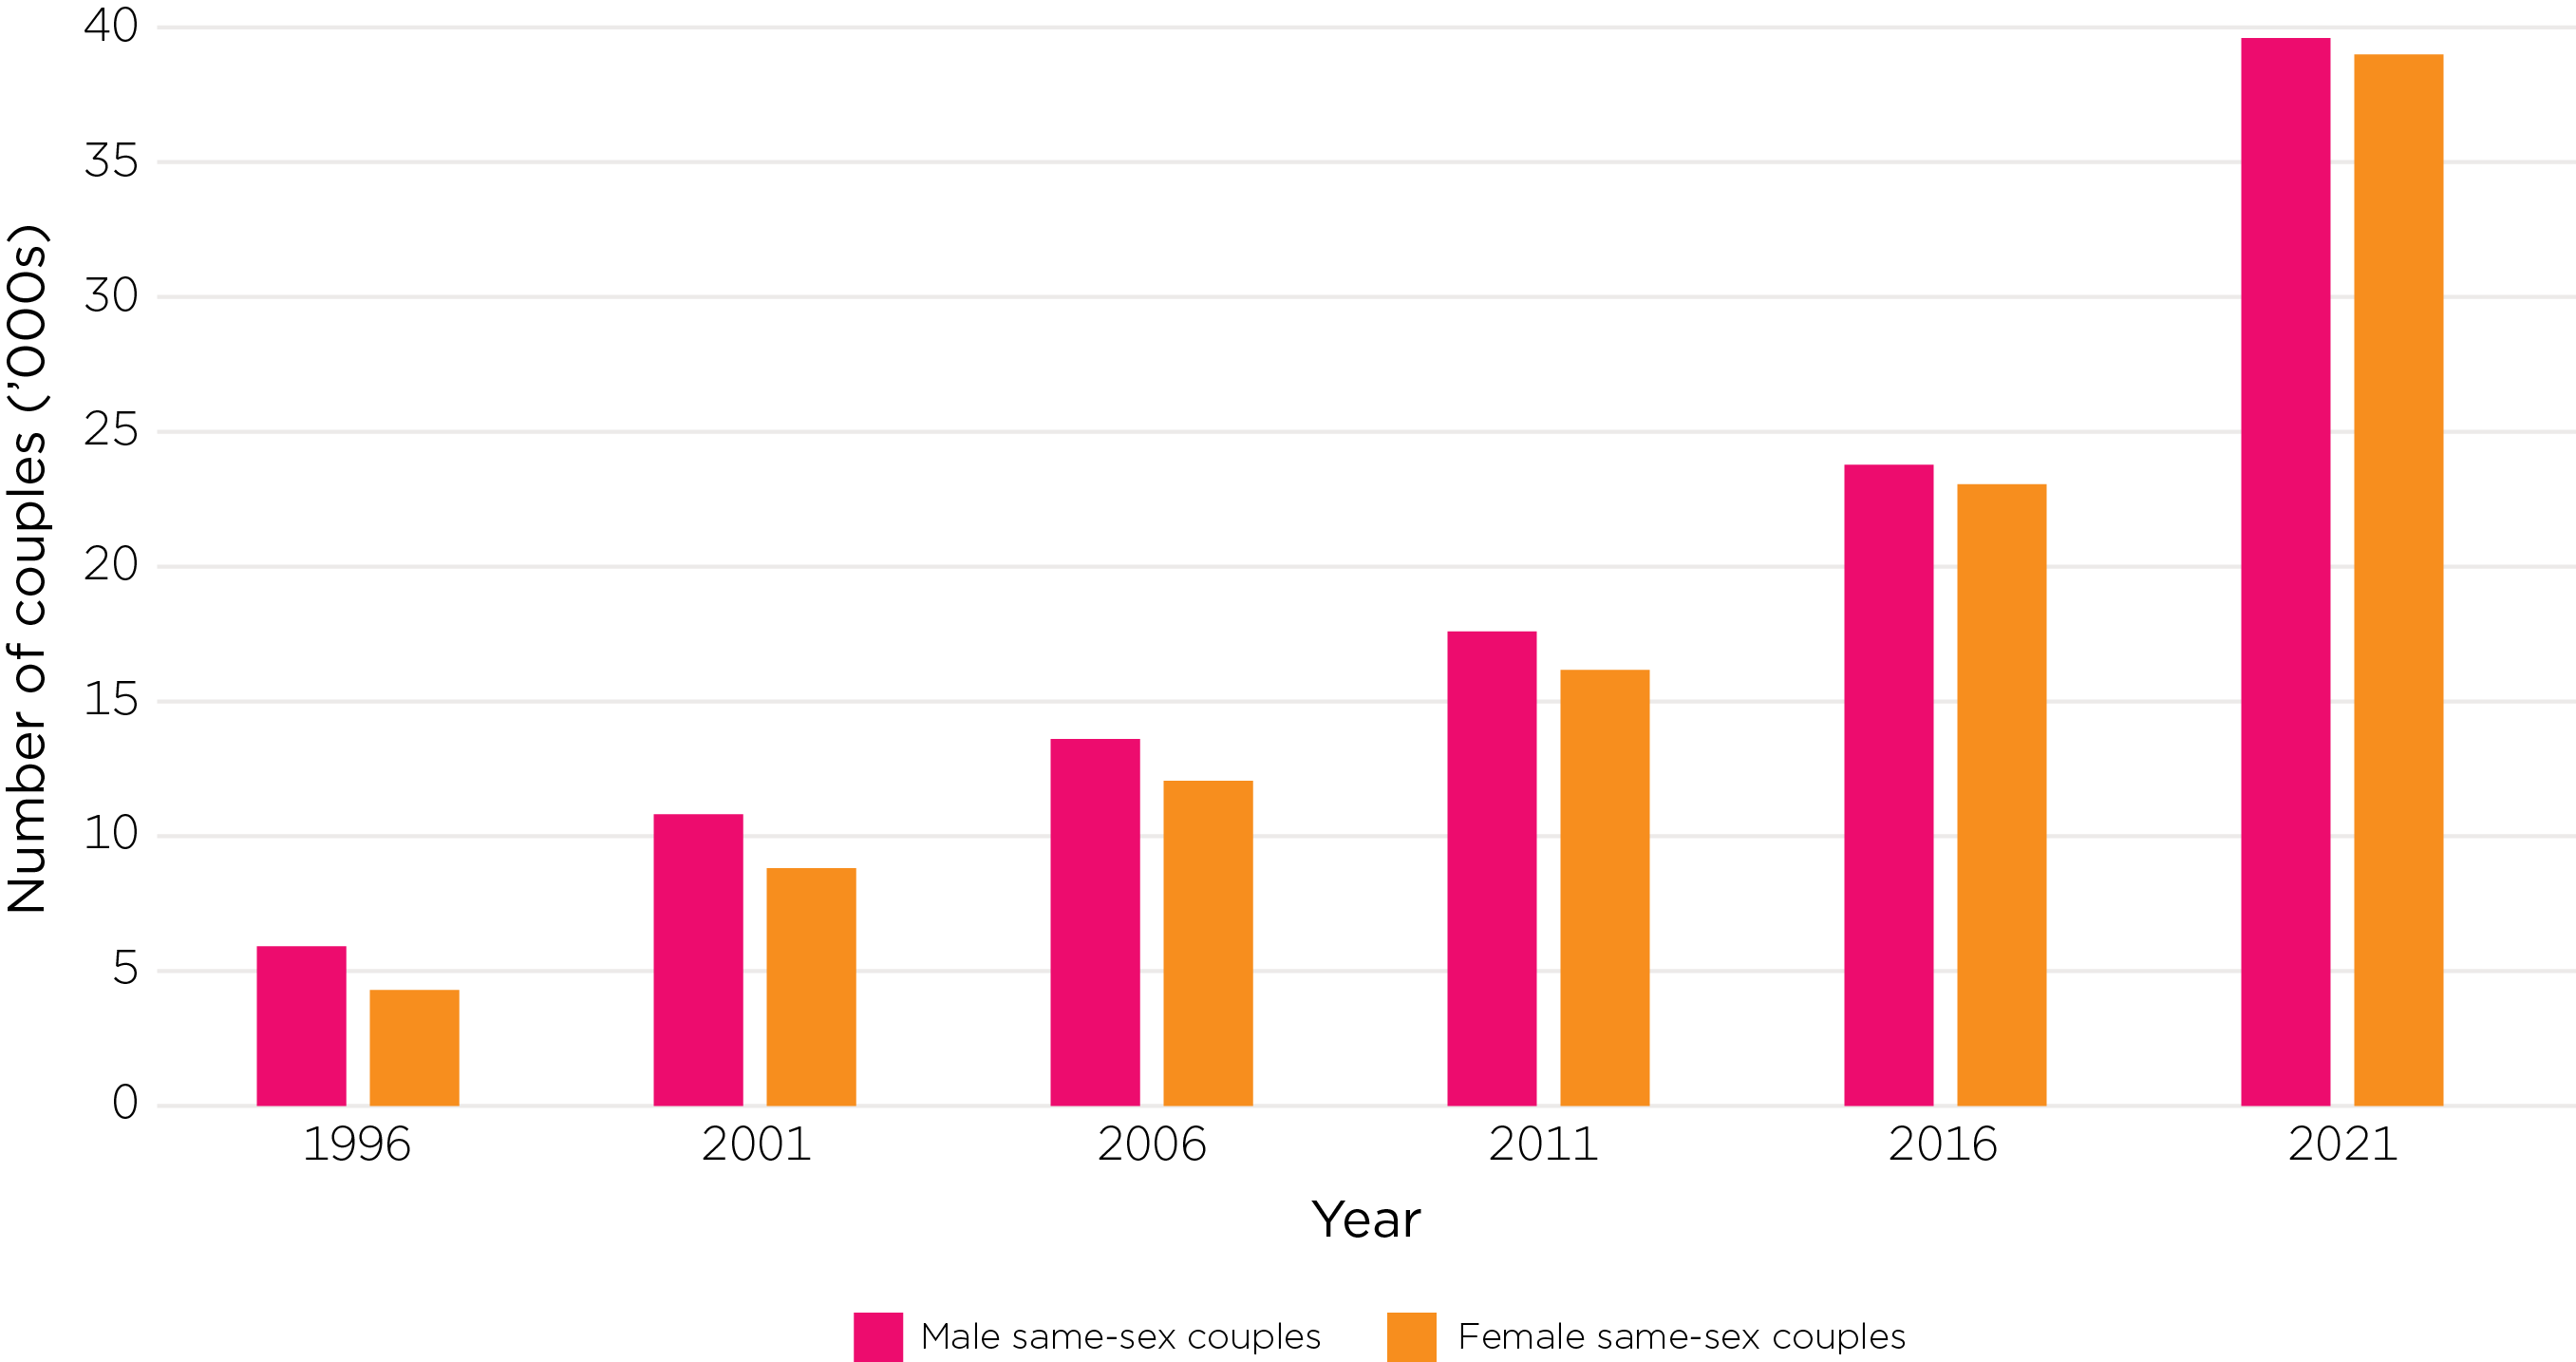
Figure 10 presents the number of same-sex couples by gender from 1996 to 2021:
- In 2021, the number of male and female same-sex couples was similar, with the proportion almost identical (50% for each gender couple).
- In contrast, in 1996, male same-sex couples outnumbered female same-sex couples, with male couples accounting for 58% of all same-sex couples.
- While the number of both male and female same-sex couples has increased, the increase in female couples has been greater. The proportion of same-sex couples who were female has risen from 42% in 1996 to 50% in 2021.
Figure 10: The number of same-sex couples has increased, with the numbers of male and female same-sex couples similar at 2021
Gender profile of same-sex couples, 1996–2021
Sources: ABS, (2005), Year Book Australia (2005) Catalogue (no.1301.0) (Table 3.63); ABS 2006–21 Census TableBuilder
Figure 11 provides more insights on same-sex couple families, by showing the number of people, by age and sex, living with a same-sex partner as reported in the 2006 and 2021 census:
- The figure shows a rise in the numbers of people living with a same-sex partner between 2006 and 2021 across all age groups for men and women, with the increase being greatest for those aged 30–34 years.
- In 2006, the largest numbers of men and women with a same-sex partner were at age 35–39 years, followed by 40–44 years and 30–34 years. The median age of those living with a same-sex partner was 39.2 for men and 38.7 for women.
- The age profile in 2021 had shifted towards a slightly older demographic. The largest age group was 30–34 years for both men and women living with a same-sex partner, followed by 35–39 years and 25–29 years. However, there was also an increased proportion at older age groups compared to 2006, which resulted in higher median ages of men (41.3 years) and women (39.2 years) living with same-sex partners.
Figure 11: There have been increases in the numbers of men and women living with a same-sex partner at all age groups, with the greatest increase at 30–34 years
Number of people living with a same-sex partner by age and sex, 2006 and 2021

Sources: ABS 2006 and 2021 Census TableBuilder
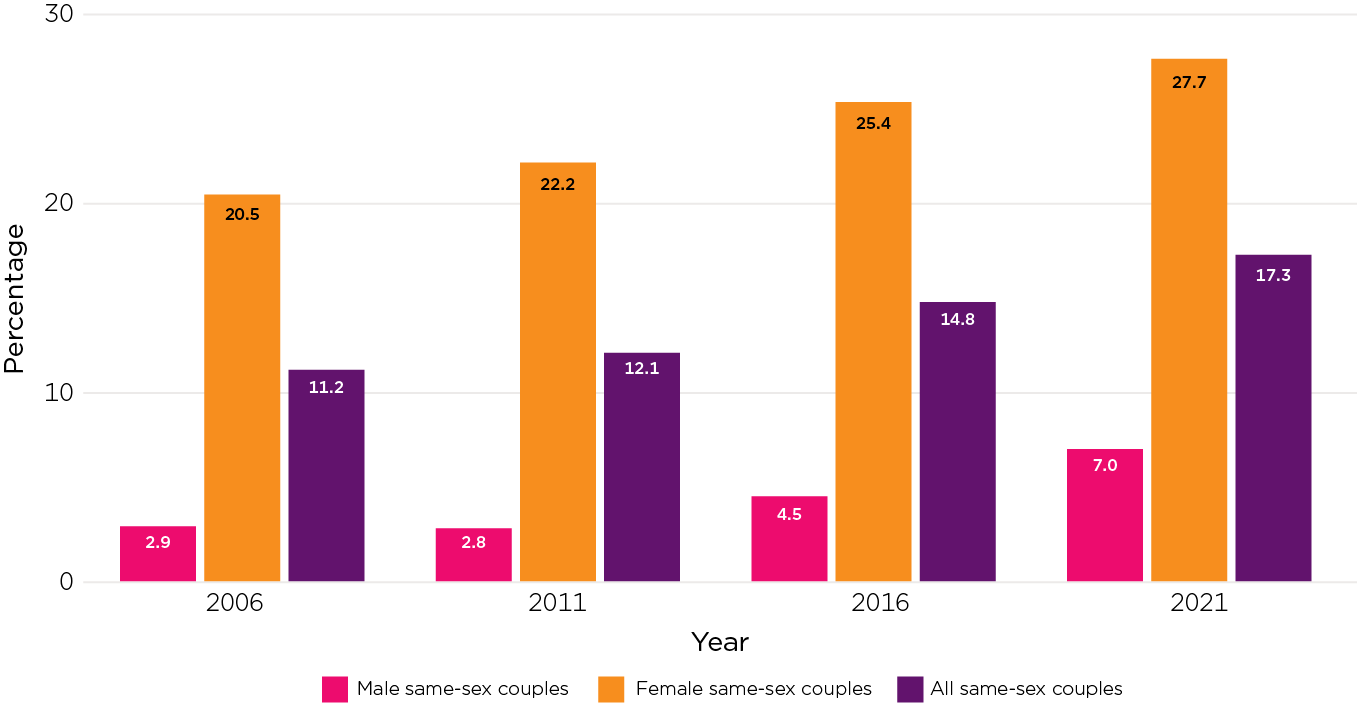
The numbers of same-sex couples with children (dependent and/or non-dependent children) have also increased, as shown in Figure 12:
- In 2006, 12% of same-sex couples were living with children, the proportion rose to 17% by 2021.
- Figure 12 also shows that female couples were more likely to be living with children compared to male couples across all the years (21%–28% cf. 3%–7%).
Figure 12: Same-sex couple families are increasingly likely to have dependent/non-dependent children
Proportions of same-sex couples living with children by couple gender, 2001–21
Sources: ABS 2006–21 Census TableBuilder
Summary
This report has provided a detailed look at family composition, using family-level and individual-level data to explore some characteristics of families. More information about aspects of family life can be found in AIFS other Facts and Figures, as well as in more detailed research reports on our website.
This snapshot shows the diversity of Australian families:
- Family composition has changed in the last few decades. There has been a decline in families with dependent children but an increase in couple-only families, especially older couples.
- One-parent families with dependent children as a proportion of all families with dependent children increased between 1981 and 2006, but a slight downward trend has emerged since then.
- One-parent families had fewer children compared to couple families with children. The number of dependent children living in families has changed little in the last decade for either one-parent families or couple families with dependent children.
- Most families with dependent children were intact families and over one in ten couple families with dependent children were either step- or blended families.
- There has been an increase in the numbers of same-sex couple families (from 0.3% of all couple families in 1996 to 1.4% in 2021).
References
Australian Bureau of Statistics (ABS). (1983). 1981 Census household sample file (1%) – Confidentialised Unit Record File. Findings based on use of ABS Microdata. Canberra: ABS.
Australian Bureau of Statistics. (1988). 1986 Census household sample file (1%) – Confidentialised Unit Record File. Findings based on use of ABS Microdata. Canberra: ABS.
Australian Bureau of Statistics. (1989). Census 1986 – Cross-classified characteristics of persons and dwellings, Australia (Catalogue no. 2498). Canberra: ABS.
Australian Bureau of Statistics. (2000). 1996 Census of population and housing – Basic community profile (Catalogue no. 2001.0). Canberra: ABS. Retrieved from quickstats.censusdata.abs.gov.au/census_services/getproduct/census/1996/communityprofile/0?opendocument&navpos=230
Australian Bureau of Statistics. (2005). Year Book Australia (2005) Catalogue (no.1301.0). Canberra: ABS
Australian Bureau of Statistics. (2006). 2006 Census of population and housing, TableBuilder. Findings based on use of ABS TableBuilder data. Canberra: ABS.
Australian Bureau of Statistics. (2007). 2006 Census of population and housing – Basic community profile (Catalogue no. 2001.0). Canberra: ABS. Retrieved from www.abs.gov.au/census/find-census-data/community-profiles/2006/0
Australian Bureau of Statistics. (2011). 2011 Census of population and housing, TableBuilder. Findings based on use of ABS TableBuilder data. Canberra: ABS.
Australian Bureau of Statistics (2012). 2011 Census of population and housing – Basic community profile (Catalogue no. 2001.0). Canberra: ABS. Retrieved from www.abs.gov.au/census/find-census-data/community-profiles/2011/0
Australian Bureau of Statistics. (2016a). 2016 Census of population and housing, TableBuilder. Findings based on use of ABS TableBuilder data. Canberra: ABS.
Australian Bureau of Statistics. (2016b). Census of population and housing: Census dictionary, Australia 2016 (Catalogue no. 2901.0). Canberra: ABS. Retrieved from www.abs.gov.au/AUSSTATS/[email protected]/ProductsbyCatalogue/9795AA2F5B1A5C2DCA2581BE00127257?OpenDocument
Australian Bureau of Statistics. (2017). 2016 Census of population and housing – General Community Profile (Catalogue no. 2001.0). Canberra: ABS. Retrieved from www.abs.gov.au/census/find-census-data/community-profiles/2016/0
Australian Bureau of Statistics. (2021a). 2021 Census of population and housing, TableBuilder. Findings based on use of ABS TableBuilder data. Canberra: ABS.
Australian Bureau of Statistics. (2021b). 2021 Census of population and housing – General Community Profile. Canberra: ABS. Retrieved from www.abs.gov.au/census/find-census-data/community-profiles/2021/AUS
Baxter, J. (2015). Child care and early childhood education in Australia. Melbourne: Australian Institute of Family Studies.
Baxter, J. (2022). Grandparents and child care in Australia (Families in Australia Survey Report). Melbourne: Australian Institute of Family Studies.
Qu, L., Lahausse, J. & Carson, R. (2018). Working together to care for children: A study of foster and relative/kinship carers. Melbourne: Australian Institute of Family Studies.
Qu, L., Moloney, L., Weston, R., Hand, K., Deblaquiere, J. & De Maio, J. (2011). Grandparenting and the 2006 family law reforms. Family Matters, 88, 42–50.
Appendix
| Age group | Couple only | Couple with children | One-parent family | Living alone | Other a | Non-private dwelling |
|---|---|---|---|---|---|---|
| 0–4 | NA | 82.2 | 12.3 | NA | 5.0 | 0.5 |
| 5–9 | NA | 77.2 | 17.1 | NA | 5.3 | 0.3 |
| 10–14 | NA | 73.4 | 20.7 | NA | 5.2 | 0.6 |
| 15–19 | 1.6 | 64.0 | 21.5 | 1.2 | 9.0 | 2.8 |
| 20–24 | 13.4 | 37.7 | 13.9 | 5.5 | 25.5 | 4.0 |
| 25–29 | 27.9 | 27.2 | 8.9 | 8.6 | 24.2 | 3.2 |
| 30–34 | 24.3 | 42.4 | 7.5 | 8.7 | 14.5 | 2.7 |
| 35–39 | 13.1 | 58.7 | 8.3 | 7.9 | 9.7 | 2.3 |
| 40–44 | 9.1 | 62.2 | 10.4 | 7.8 | 8.2 | 2.2 |
| 45–49 | 10.8 | 58.2 | 12.0 | 8.9 | 7.8 | 2.2 |
| 50–54 | 18.1 | 48.9 | 11.6 | 11.1 | 7.9 | 2.3 |
| 55–59 | 31.3 | 34.6 | 9.4 | 14.2 | 8.2 | 2.3 |
| 60–64 | 44.3 | 21.3 | 6.9 | 17.1 | 8.1 | 2.3 |
| 65–69 | 52.0 | 13.2 | 5.1 | 19.4 | 8.0 | 2.3 |
| 70–74 | 54.9 | 9.3 | 4.3 | 21.5 | 7.1 | 2.9 |
| 75–79 | 52.6 | 7.5 | 4.6 | 24.5 | 6.3 | 4.4 |
| 80–84 | 44.6 | 6.6 | 6.0 | 28.8 | 5.9 | 8.2 |
| 85+ | 26.3 | 4.6 | 7.9 | 32.1 | 5.1 | 23.9 |
Note:a For the age group under 15 years, this includes small numbers of children living alone (0.3%–0.4%). NA = Not applicable.;
Source: ABS 2021 Census TableBuilder
Definitions of family forms
Couple family
A couple family is identified by the ABS by ‘the existence of a couple relationship. A couple relationship is defined as two people usually residing in the same household who share a social, economic and emotional bond usually associated with marriage and who consider their relationship to be a marriage or marriage-like union. This relationship is identified by the presence of a registered marriage or de facto marriage. A couple family can be with or without children, and may or may not include other related individuals. A couple family with children present can be expanded to elaborate on the characteristics of those children, such as their number, age and dependency status.’
One-parent family
According to the ABS, ‘a one-parent family consists of a lone parent with at least one child (regardless of age) who is also usually resident in the household and who has no identified partner or child of his/her own. The family may also include any number of other related individuals.
‘Examples of one-parent families include: a 25-year-old parent with dependent children; and an 80 year old living with a 50-year-old child.
‘Information on people who are temporarily absent is used in family coding to differentiate between lone-person households and one-parent families (if child was temporarily absent) or between one-parent and couple families (if a spouse was temporarily absent).’
Other family
‘Other family’ is defined by the ABS as ‘a group of related individuals residing in the same household, who cannot be categorised as belonging to a couple or one-parent family.
‘If two brothers, for example, are living together and neither is a spouse/partner, a lone parent or a child, then they are classified as an other family. However, if the two brothers share the household with the daughter of one of the brothers and her husband, then both brothers are classified as other related individuals and are attached to the couple family.’
Grandparent family
‘Grandparent families are recognised when there is a grandparent-grandchild relationship present and no parent-child relationship present in a family.’
This information is sourced from the Australian Bureau of Statistics 2016 and 2021 Census Dictionary.
News stories
- Surge in same-sex couples reporting living together since marriage equality, study says
- New data shows huge increase in same-sex couples living together
- Huge increase in number of gay couples living together in Australia
- Rise In Same-Sex Couples Living Together Since Changes To Marriage Act
1 The ABS identifies and classifies families based on the relationship between the family reference person and each of the other family members.
© GettyImages/CatLane