Marriages in Australia
Facts and Figures 2023
March 2023
Marriages
Although the Australian population has doubled in size since the early 1970s, the number of marriages registered each year has not increased over this time. The yearly number has instead fluctuated between 100,000 and 120,000 (Figure 1). The number of marriages registered in 2019 (113,815) was lower than in 1970 (116,066). The COVID-19 pandemic had an impact on marriages in 2020 and 2021 (Figure 1). Lockdowns and restrictions led to wedding cancellations and the postponement of wedding plans.1 According to the Australian Bureau of Statistics (ABS), in 2020, there were only 78,989 registered marriages, representing a 30% decline from the 113,815 marriages the previous year. There were 89,164 marriages in 2021, an increase of 13% on the previous year but still significantly lower than the years before the pandemic.
The crude marriage rate (the number of marriages registered in a year per 1,000 Australian residents) fluctuated across the first half of the twentieth century. The all-time high was in 1942. Following an increase in the 1960s, the rate began to fall steadily from 1970 until 2000. It then stabilised for a decade before falling again.
The fall in the marriage rate over the last half century has been influenced by a range of demographic and social changes, including extended time in pursuing education beyond Year 12 with increasing demands for a skilled workforce; increased labour force participation of women, especially mothers; the availability of the pill, which enabled a disconnection between marriage and childbearing; the rise in cohabitation, and a change in attitudes towards marriage. See Baxter, Hewitt, and Rose (2015) and Gray, Qu, Stanton, and Weston (2019) for a discussion of social changes contributing to these trends.
As with the number of marriages, the crude marriage rate was especially low in 2020 and 2021 because of the impact of COVID restrictions. In 2020 the rate was 3.1 marriages per 1,000 Australian residents, the lowest rate ever recorded. In 2021, the rate was 3.5 marriages per 1,000 residents, higher compared to the previous year but still significantly lower than the pre–pandemic years.
Figure 1: Number of marriages registered and crude marriage rate, 1901–2021
Notes: Crude marriage rate = number of marriages per 1,000 of estimated resident population at June for each reference year. Same-sex marriage was legalised in Australia in December 2017 and figures from 2018 onwards include same-sex marriages.
Source: ABS, (various years), Marriages and Divorces Australia
State variation in crude marriage rates
The effect of the COVID pandemic on the marriage rate is most apparent when viewed by state and territory, given the varied experiences of COVID-related restrictions across different parts of Australia in 2020 and 2021. Figure 2 shows the state variation in crude marriage rates in 2018–21.
- All states experienced a decrease in marriage numbers in 2020.
- Victoria experienced the largest decrease in this rate compared to previous years (a decrease of 42% from 2019 to 2020; this compares to a decrease of 12%–31% for other states and territories).
- In 2021 the marriage rate rebounded in most states/territories but not to the pre-pandemic level.
- The crude marriage rate did not increase in New South Wales (NSW) in 2021 (remaining at 3.4, well below the 4.9 rate of 2019), while it further declined in the Australian Capital Territory (ACT) (compared to 3.4 in 2019, it was 3.0 in 2020 and 2.8 in 2021).
- Despite the increase in 2021, the rate in Victoria (2.9) was still significantly lower than those in 2018 and 2019 (4.7 and 4.3 respectively), and lower than other states and territories except ACT.
Aside from the impacts of COVID, this figure also shows that prior to the pandemic, the crude marriage rates were typically lower in the two territories – the Northern Territory (NT) and the ACT – compared to the states, and usually highest in NSW. This may reflect different patterns of cohabitation versus marriage across different states and territories.2
Figure 2: Crude marriage rate by state and territory, 2018–21
Note: Crude marriage rate = number of marriages per 1,000 of estimated resident population at June for each reference year.
Source: ABS, (various years), Marriages and Divorces Australia
When do we marry?
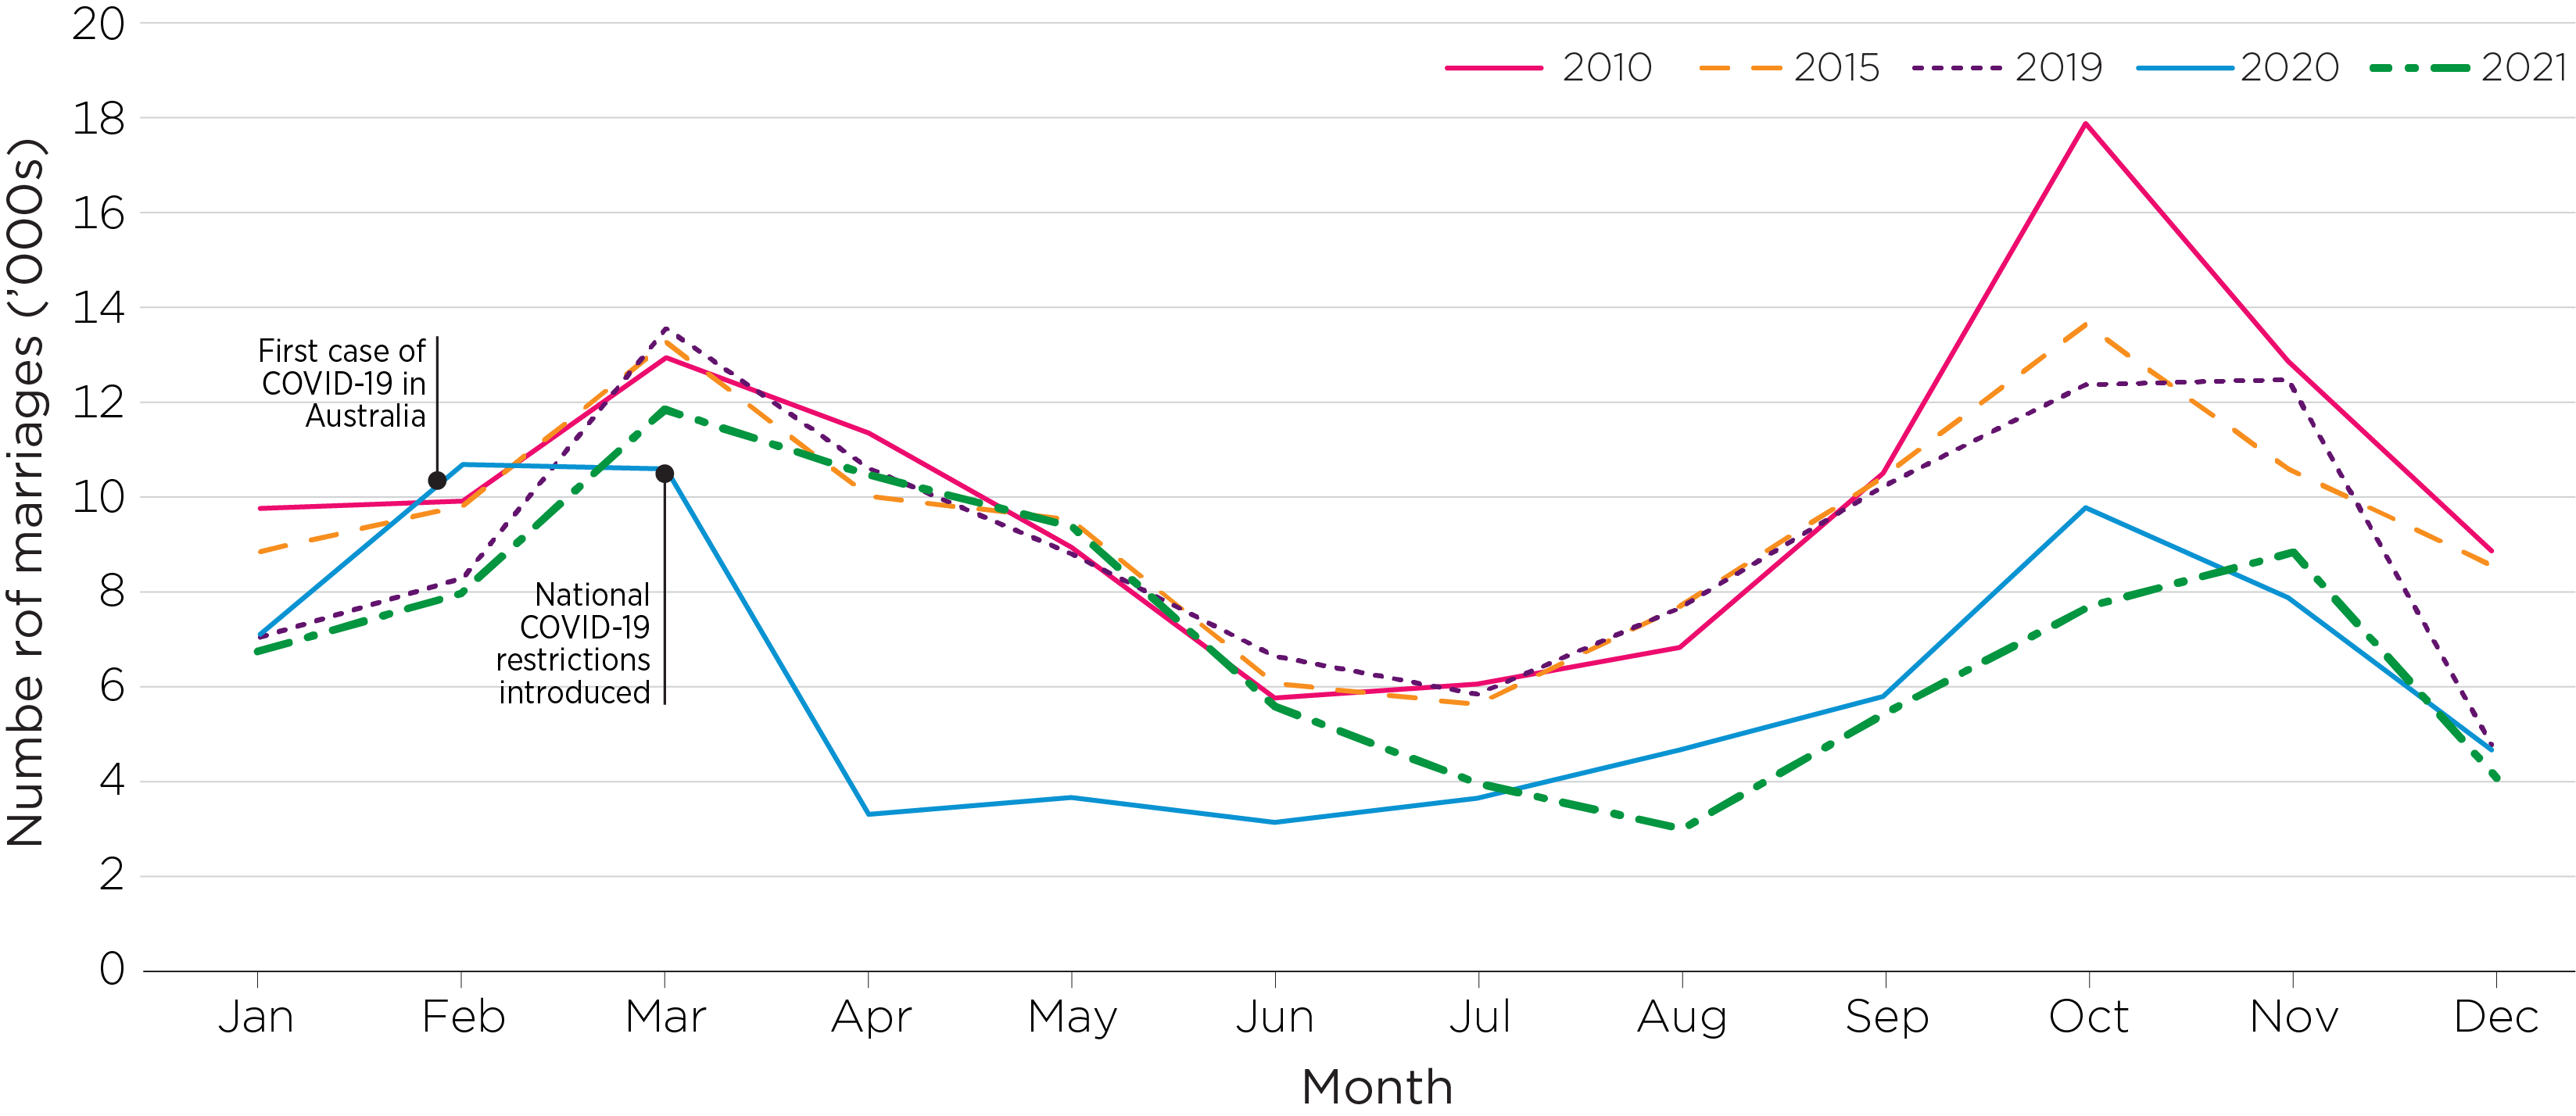
There are seasonal patterns to when people get married. Figure 3 shows the number of marriages per month in Australia in 2020 and 2021, compared to selected previous years. The number of marriages is typically higher around February–April and again around September–November.
The impacts of COVID on marriages can be seen in the number of weddings per month in 2020. The introduction of COVID restrictions in March 2020 had an immediate impact on the number of marriages, for example, with a dramatically lower number of marriages in April 2020 compared to April numbers in previous years. The 2020 April number was approximately 30% of the 2019 April number.
At a state level (data not shown) the impacts on marriages in the early months of the year of 2020 were felt equally across Australia. In the latter half of 2020, the marriage numbers had rebounded to above 60% of the previous year in most states and territories, with numbers for Tasmania and the NT as high as 90%. Numbers for Victoria were the exception, where a second wave of COVID restrictions meant September had only 192 marriages registered, compared to 1,981 the previous September.
The seasonal patterns in 2021 were similar to the pre-pandemic years, although the second peak month shifted from October to November, which reflected the restrictions introduced at different time points in different states and territories in the second half of the year.
Figure 3: Number of marriages per month, selected years, 2010–21
Note: Variations in the number of weekends per month and the additional leap day in 2020 may contribute to some variation between years in the number of marriages each month.
Source: ABS, (various years), Marriages and Divorces Australia
First and later marriages
Out of the 89,164 registered marriages in 2021, 66,247 were first marriages for both partners (74%). For 15% of the marriages, it was a first marriage for one party but not the other. For 11% of the marriages, it was not a first marriage for either party.
These proportions are similar to those of recent years. In 2019, for example, 73% were first marriages for both, 16% a first marriage for one, and 11% remarriage for both.
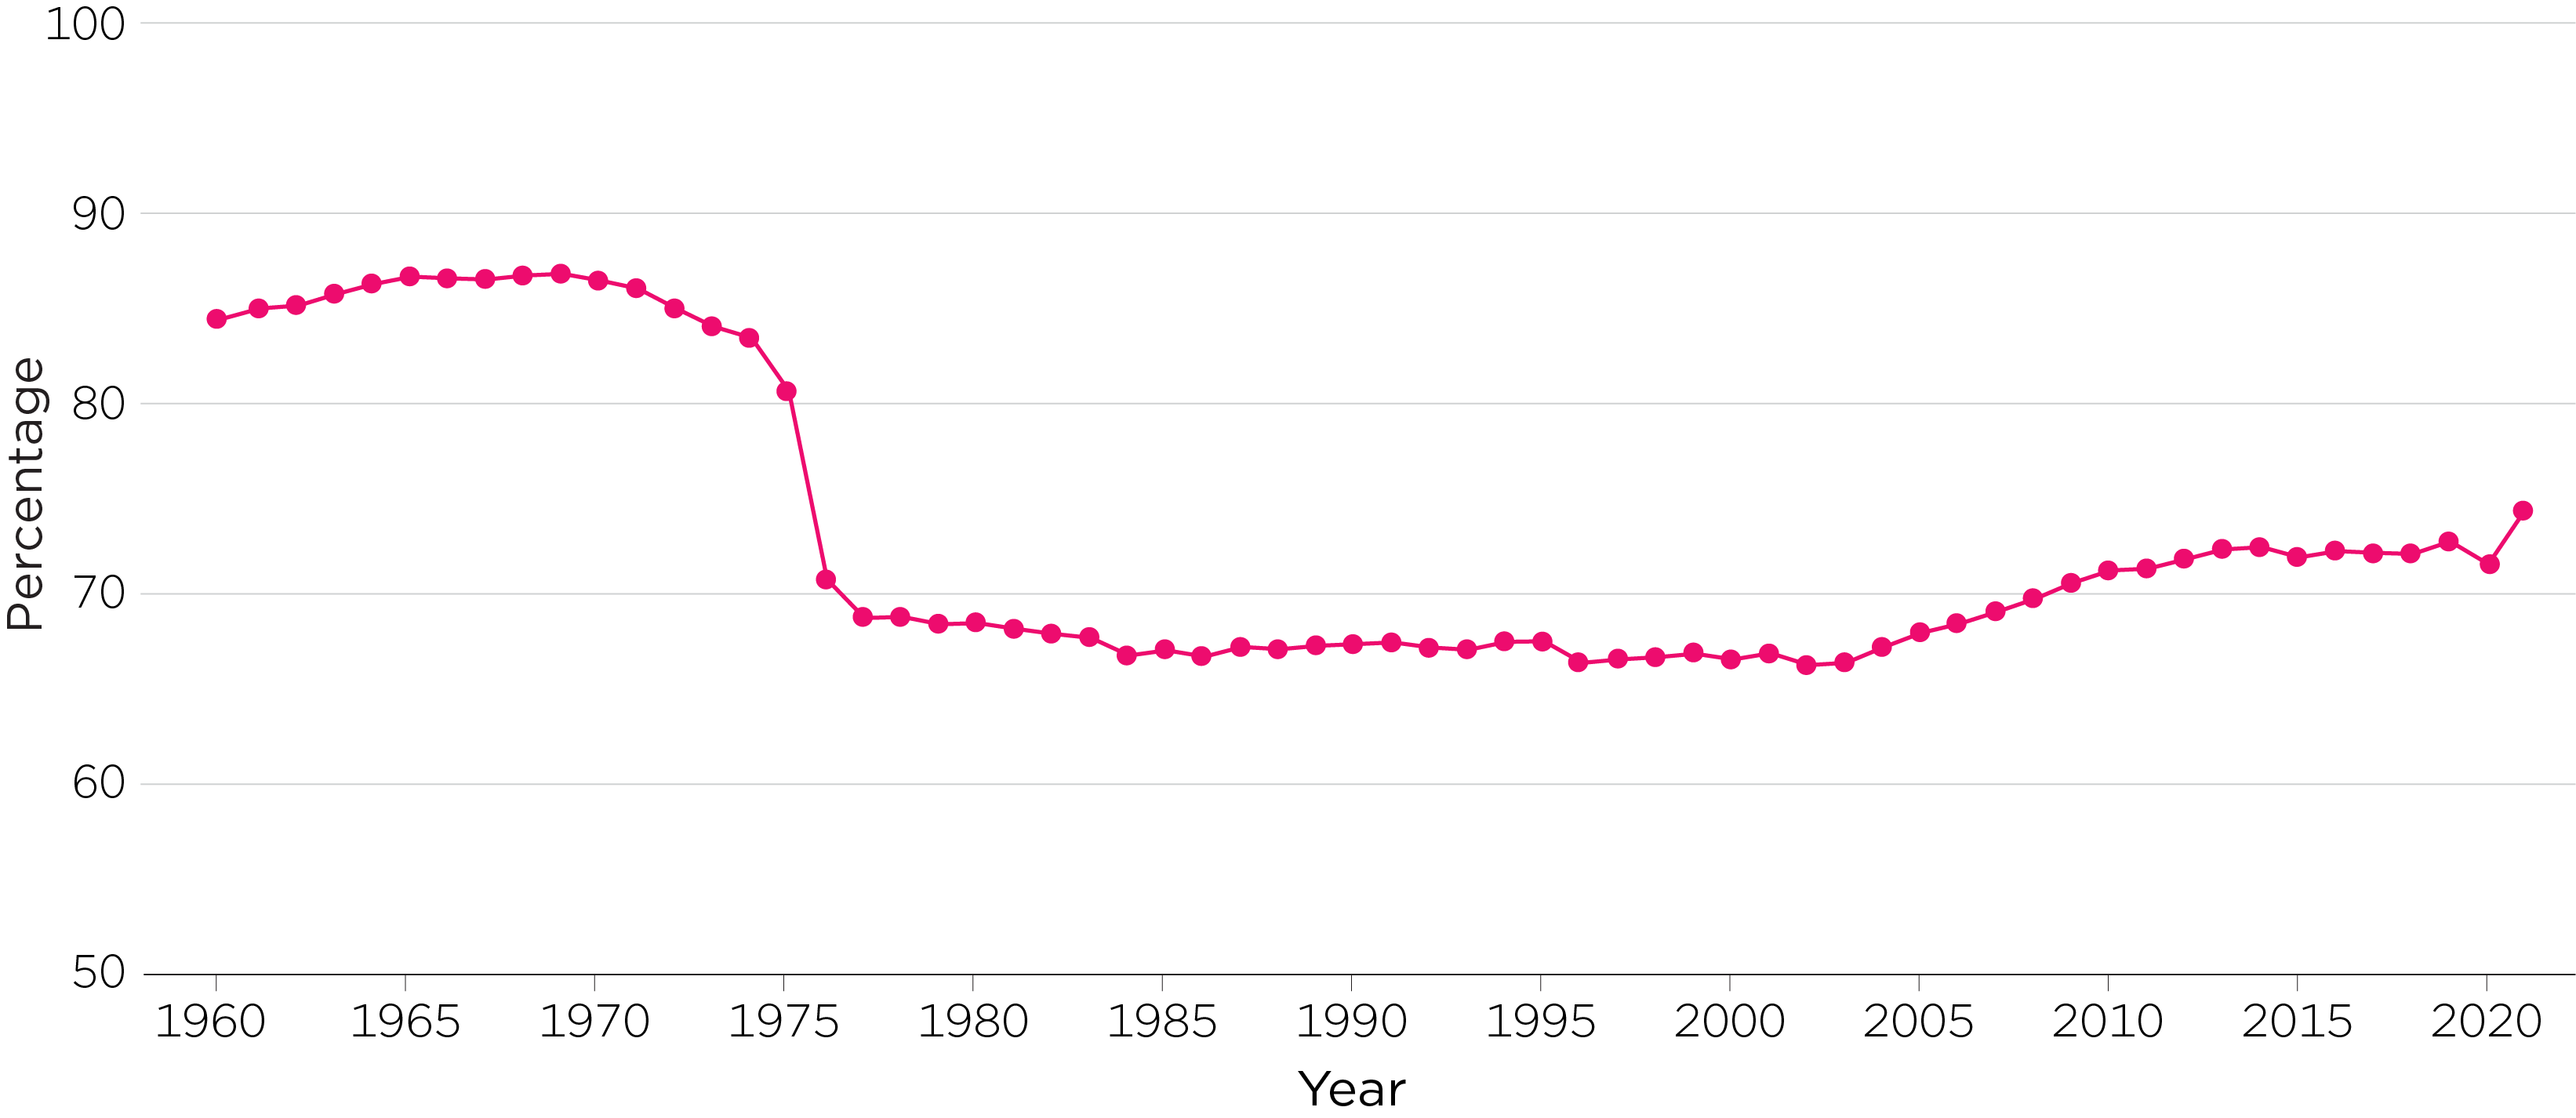
Figure 4 shows the proportion of marriages that were first marriages for both partners since 1960. The proportions of first marriages were 85%–87% in the 1960s. This fell sharply to 71% in 1976 when the no-fault principle was introduced through the Family Law Act 1975 (Cth), allowing couples who filed for divorce in previous years to finalise their divorce and remarry. The rate of first marriages remained stable from the late 1970s to the mid-2000s (66%–67%), with a progressive increase in the following years and, from 2013, stabilising at 72%–73%. The rate of first marriages edged higher again in 2021, reaching 74%.
Figure 4: First marriages as a proportion of all marriages, 1961–2021
Sources: ABS, (various years), Marriages Australia (Catalogue no. 3306.0); ABS, (various years), Marriages and Divorces Australia; Commonwealth Bureau of Census and Statistics, (various years), Australian Demography Bulletin (ABS Catalogue 3141.0)
How old are we when we marry?
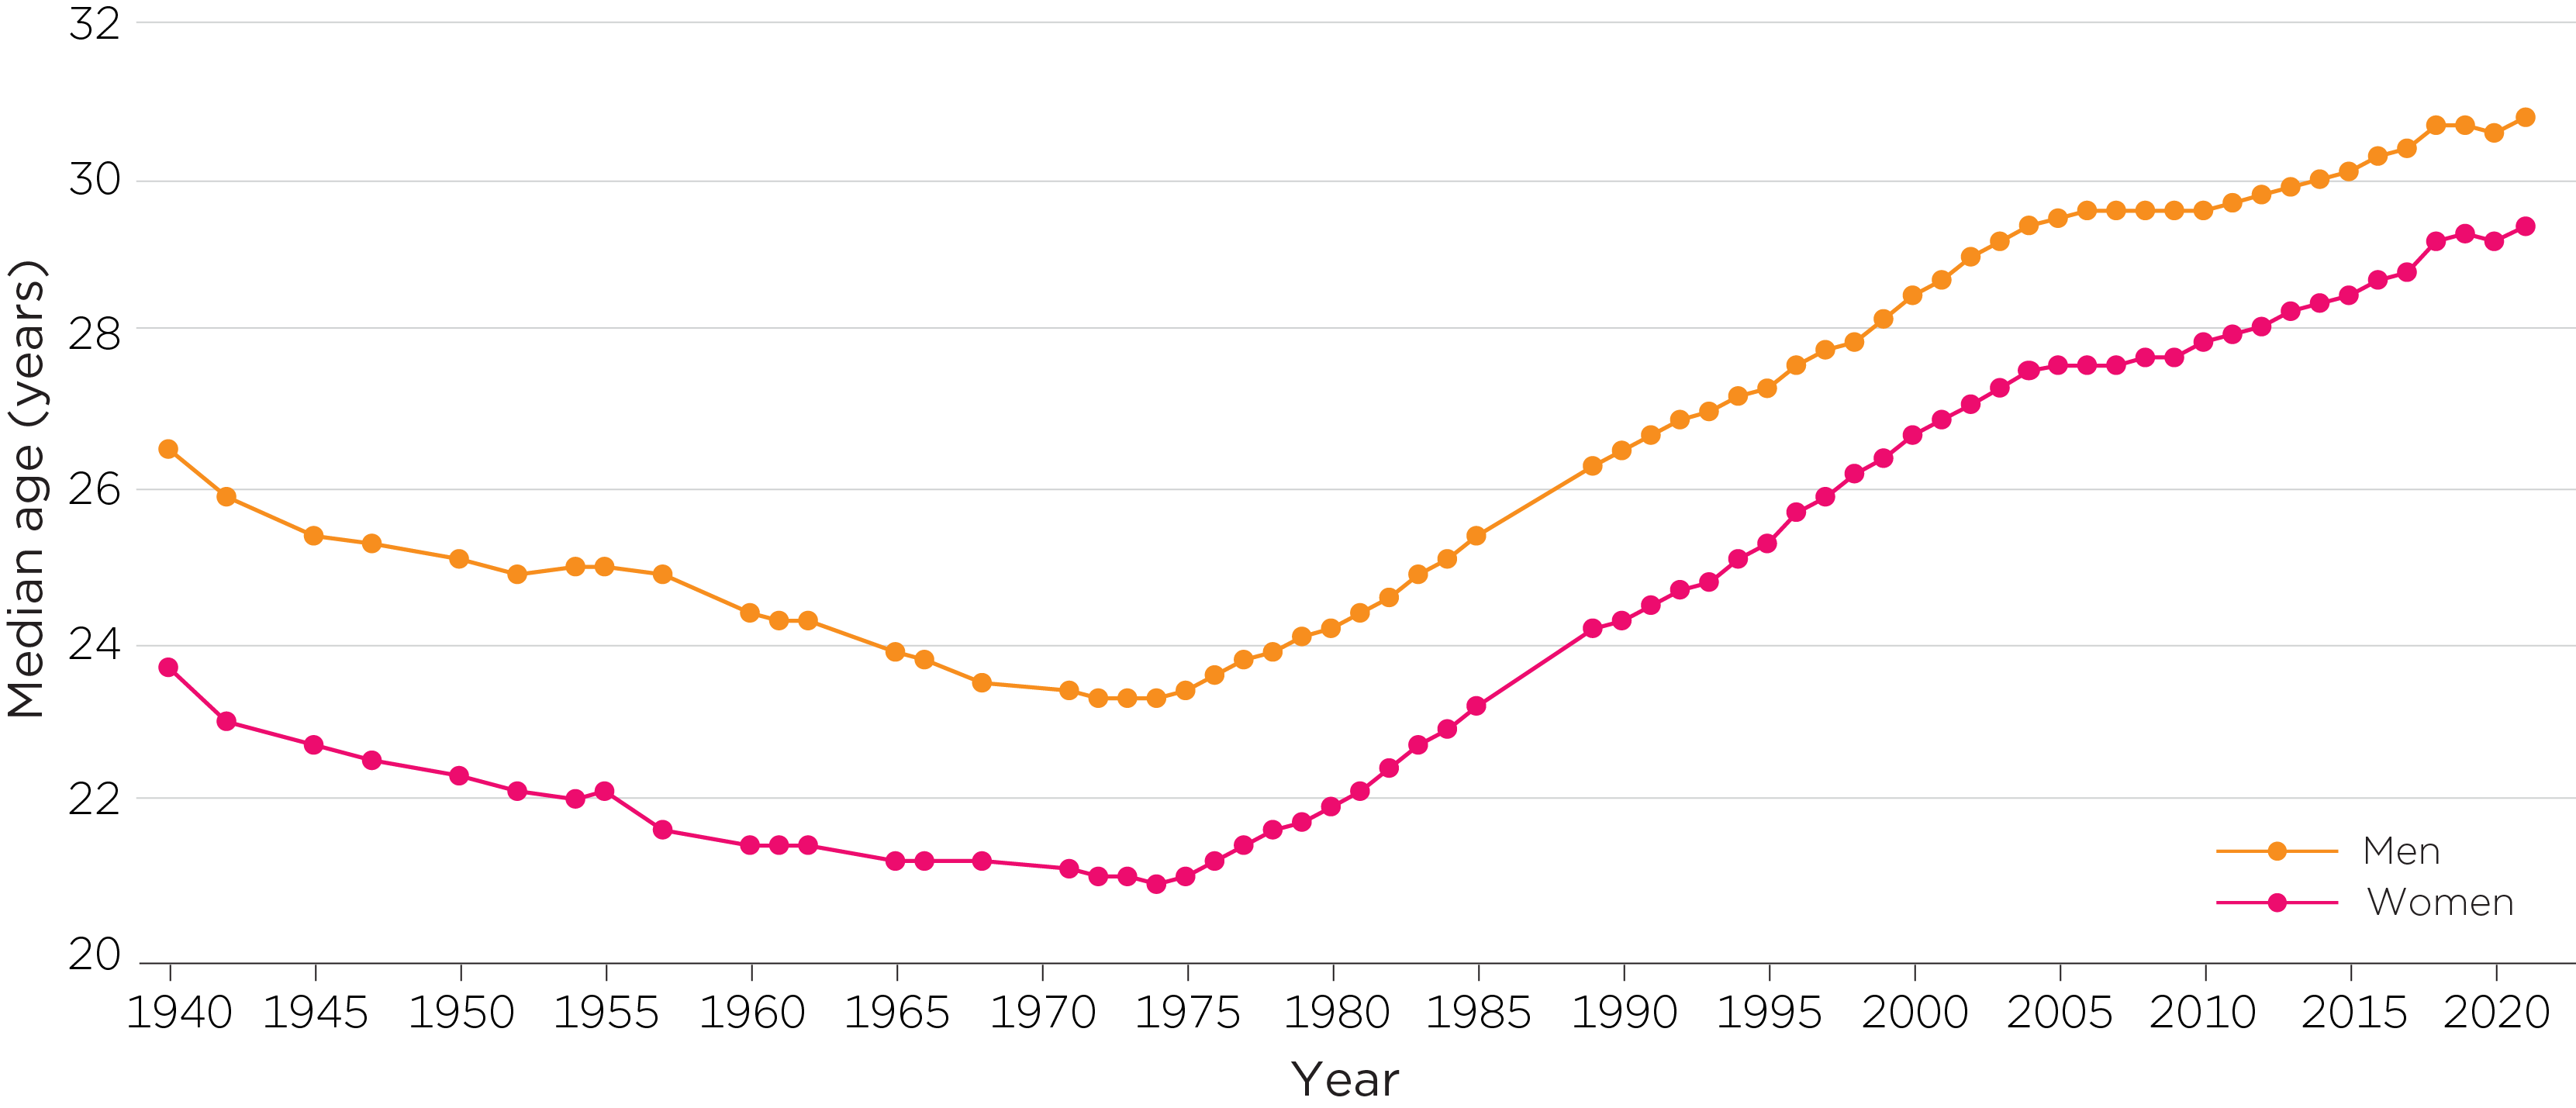
Figure 5 shows that between 1940 and the early 1970s, the median age at which men entered their first marriage fell by more than three years, from 26.5 years in 1940 to 23.4 years in 1974. The median age at first marriage for women also fell by a similar magnitude during this period, from 23.7 years in 1940 to 20.9 years in 1974. For a discussion about the trends over this period and beyond see Baxter, Hewitt, and Rose (2015) and Gray, Qu, Stanton, and Weston (2019).
From the mid-1970s until 2018 there was a steady and ongoing increase in the median age of men and women at first marriage. This upward trend halted between 2018 and 2020 but continued again in 2021. In 2021 the median age of men was 30.8 years, and women 29.4 years. It is also worth noting that the gap in median age at first marriage between men and women has narrowed from 2.3 years in 1980, to 1.8 in 2000 and 1.4 years between 2019 and 2021.
The yearly statistics on median age at first marriage since 2018 may be affected by same-sex marriages, which were included in the official statistics following the amendments to the Marriage Act 1961 in December 2017 (see discussion below). As shown in the later section, median ages at first marriage were higher for same-sex marriages than all marriages, with this pattern being more apparent in 2018 than the subsequent two years. In addition, the proportion of marriages involving same-sex marriages was higher in 2018 (6%) compared to later years (3%–5%). The high median age at first marriage for men and women in 2018 might have been ‘pushed up’ somewhat by older same-sex couples who had wanted to marry now being able to do so.
Figure 5: Median age at first marriage, 1940–2021
Sources: ABS, (various years), Marriages and Divorces Australia; ABS, (1997), Australian Social Trends (Catalogue No. 4102.0); ABS, Unpublished data
Living together before marriage
Most couples now live together before getting married. Levels of cohabitation before marriage have increased greatly since the mid-1970s. In 1975, only 16% of marriages were preceded by cohabitation. By 2017, 81% of couples had been living together before marriage. (Data for more recent years are not available.)
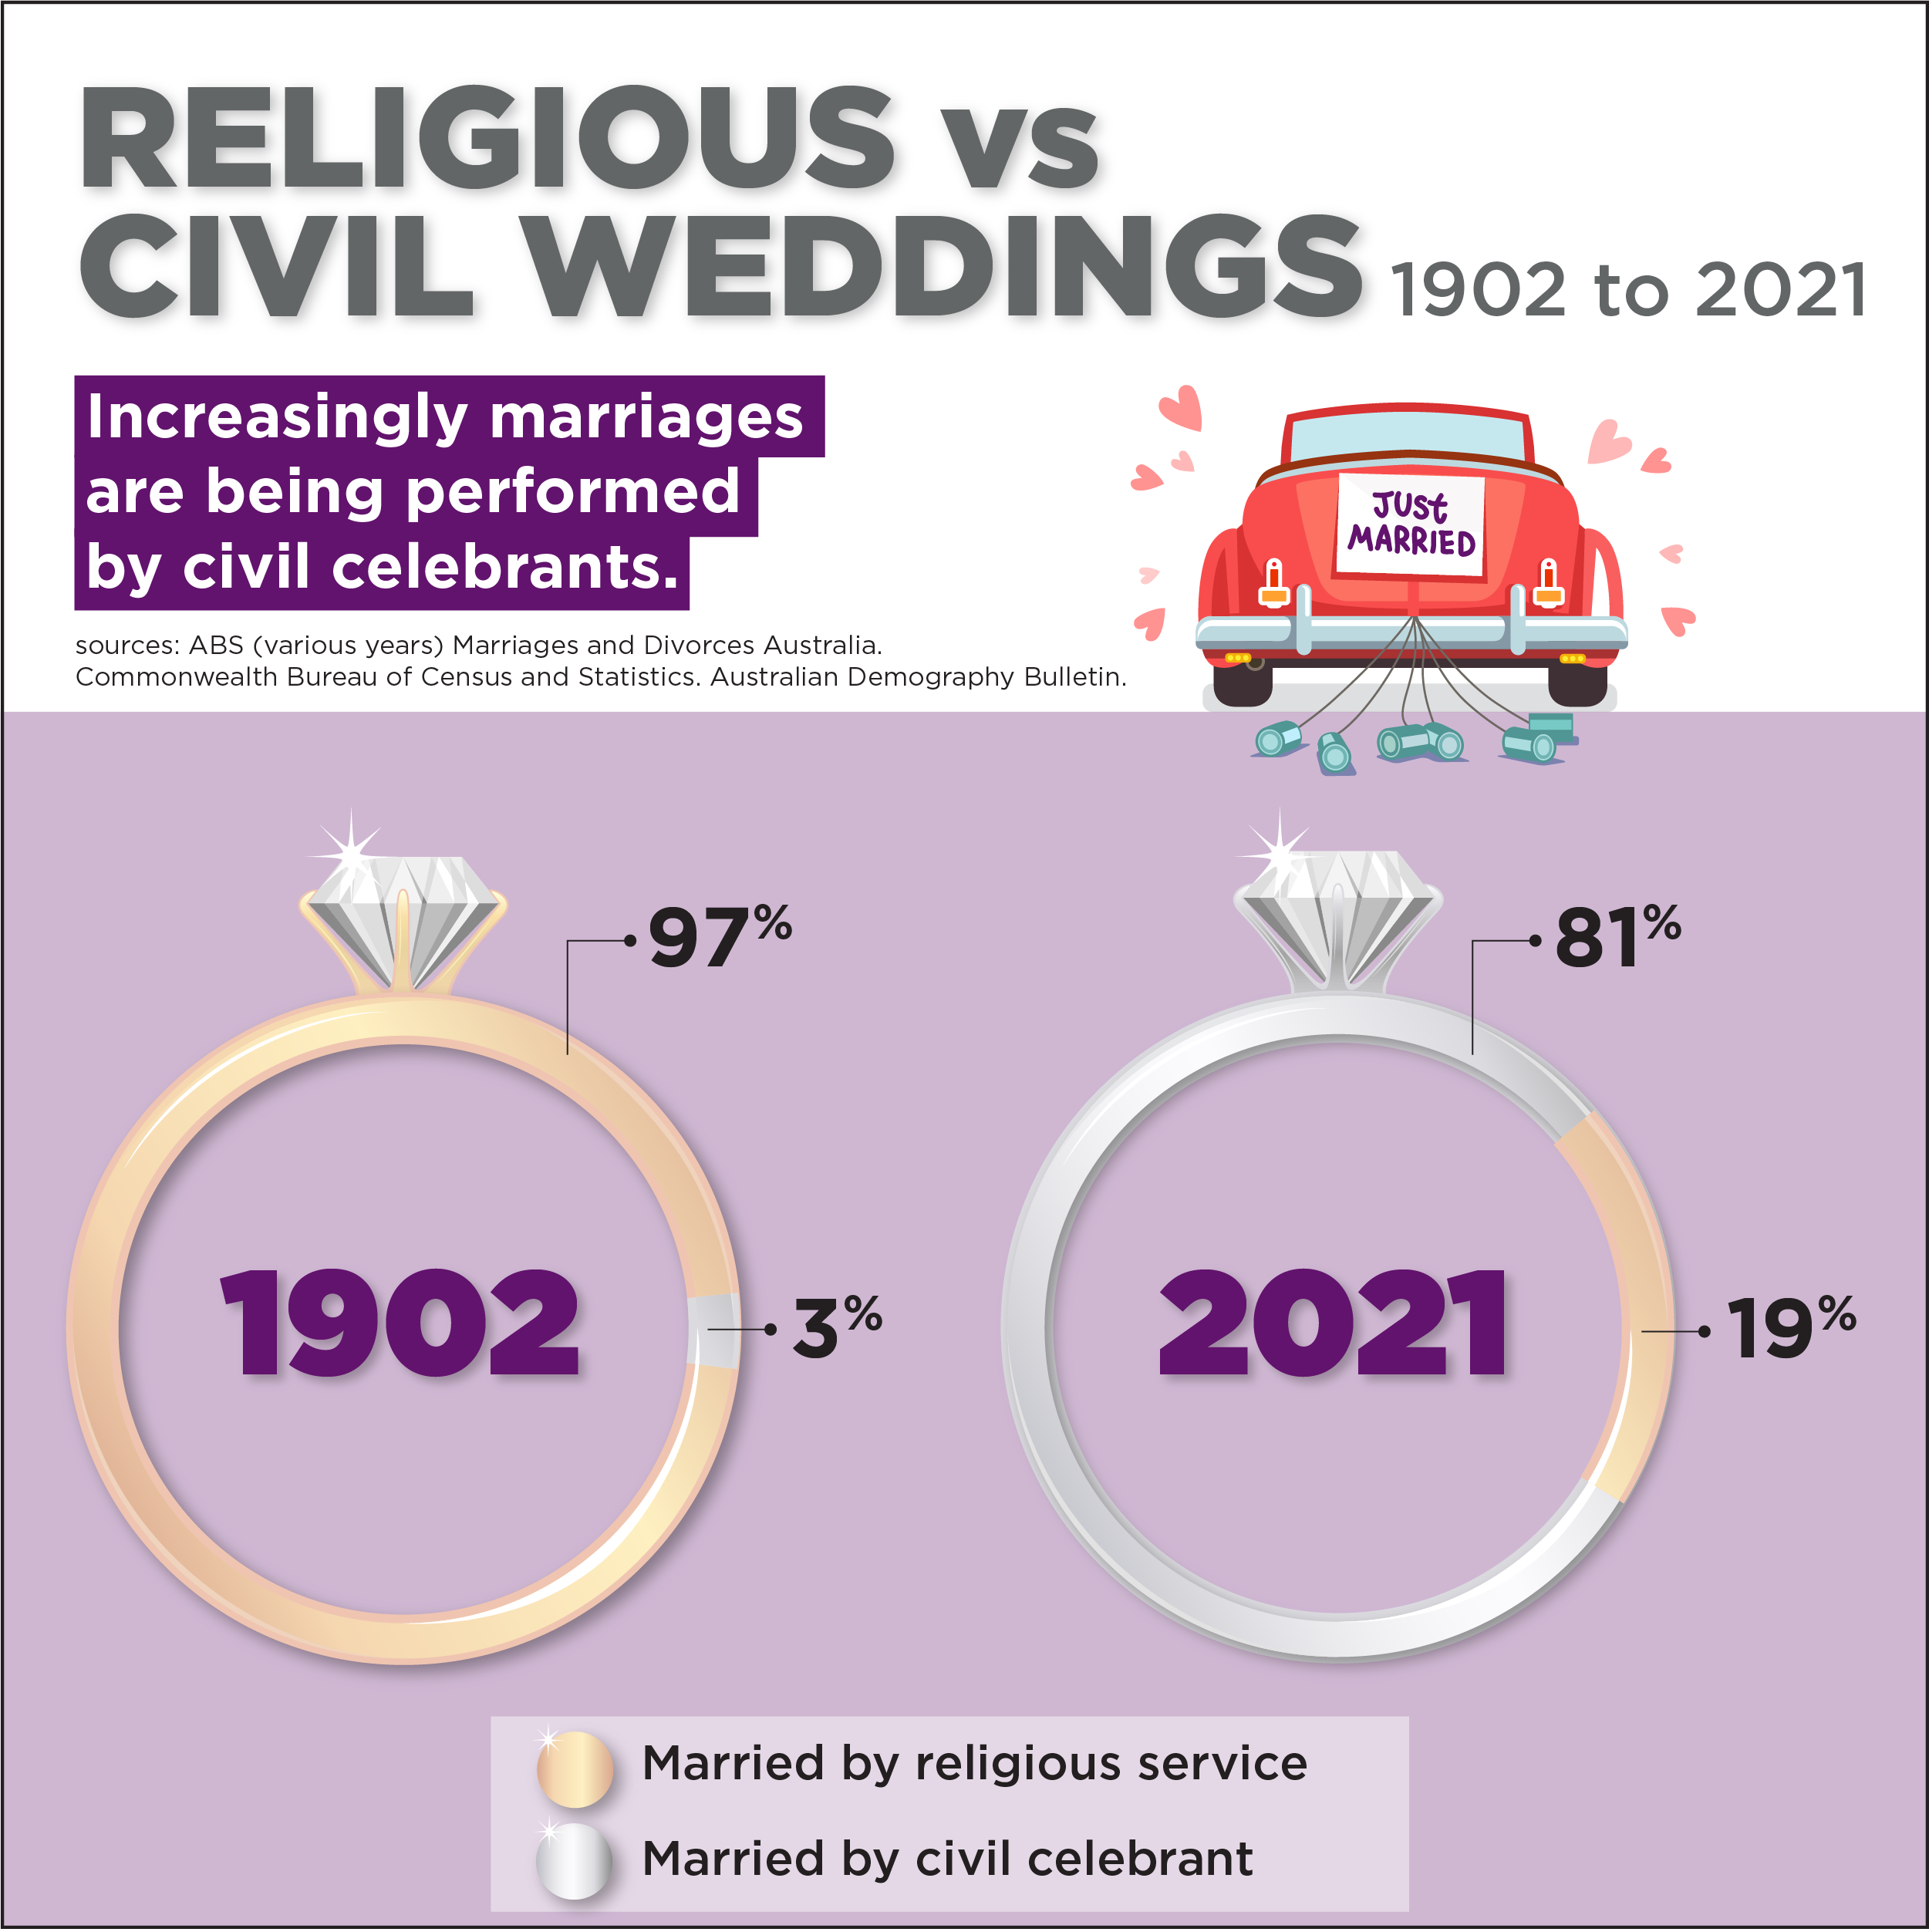
Religious vs civil weddings
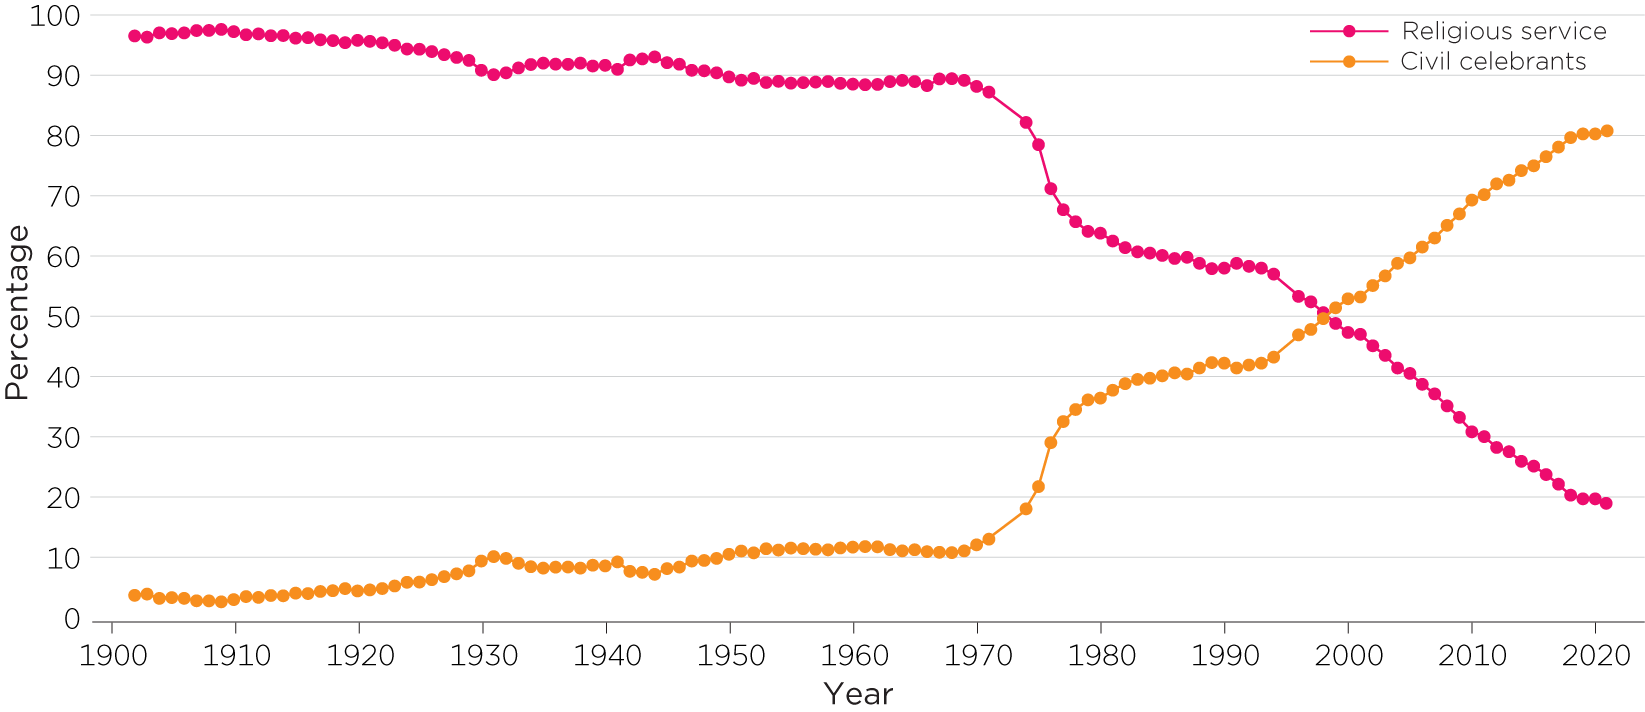
Marriages by civil celebrants are now much more common than those by religious service, following a trend over recent decades that reversed the previous dominance of religious marriage services (Figure 6).
Figure 6: Marriages by celebrants and religious service, 1902–2021
Sources: ABS, (various years), Marriages and Divorces Australia; Commonwealth Bureau of Census and Statistics, (various years), Australian Demography Bulletin (ABS Catalogue No. 3141.0)
In 1902, almost all marriages (97%) were performed by religious service. However, by 2000, for the first time, there were more marriages performed by civil celebrants than by religious service. By 2021, 81% of marriages were performed by civil celebrants. The proportion of marriages performed by civil celebrants has remained stable since 2018.
Same-sex marriages
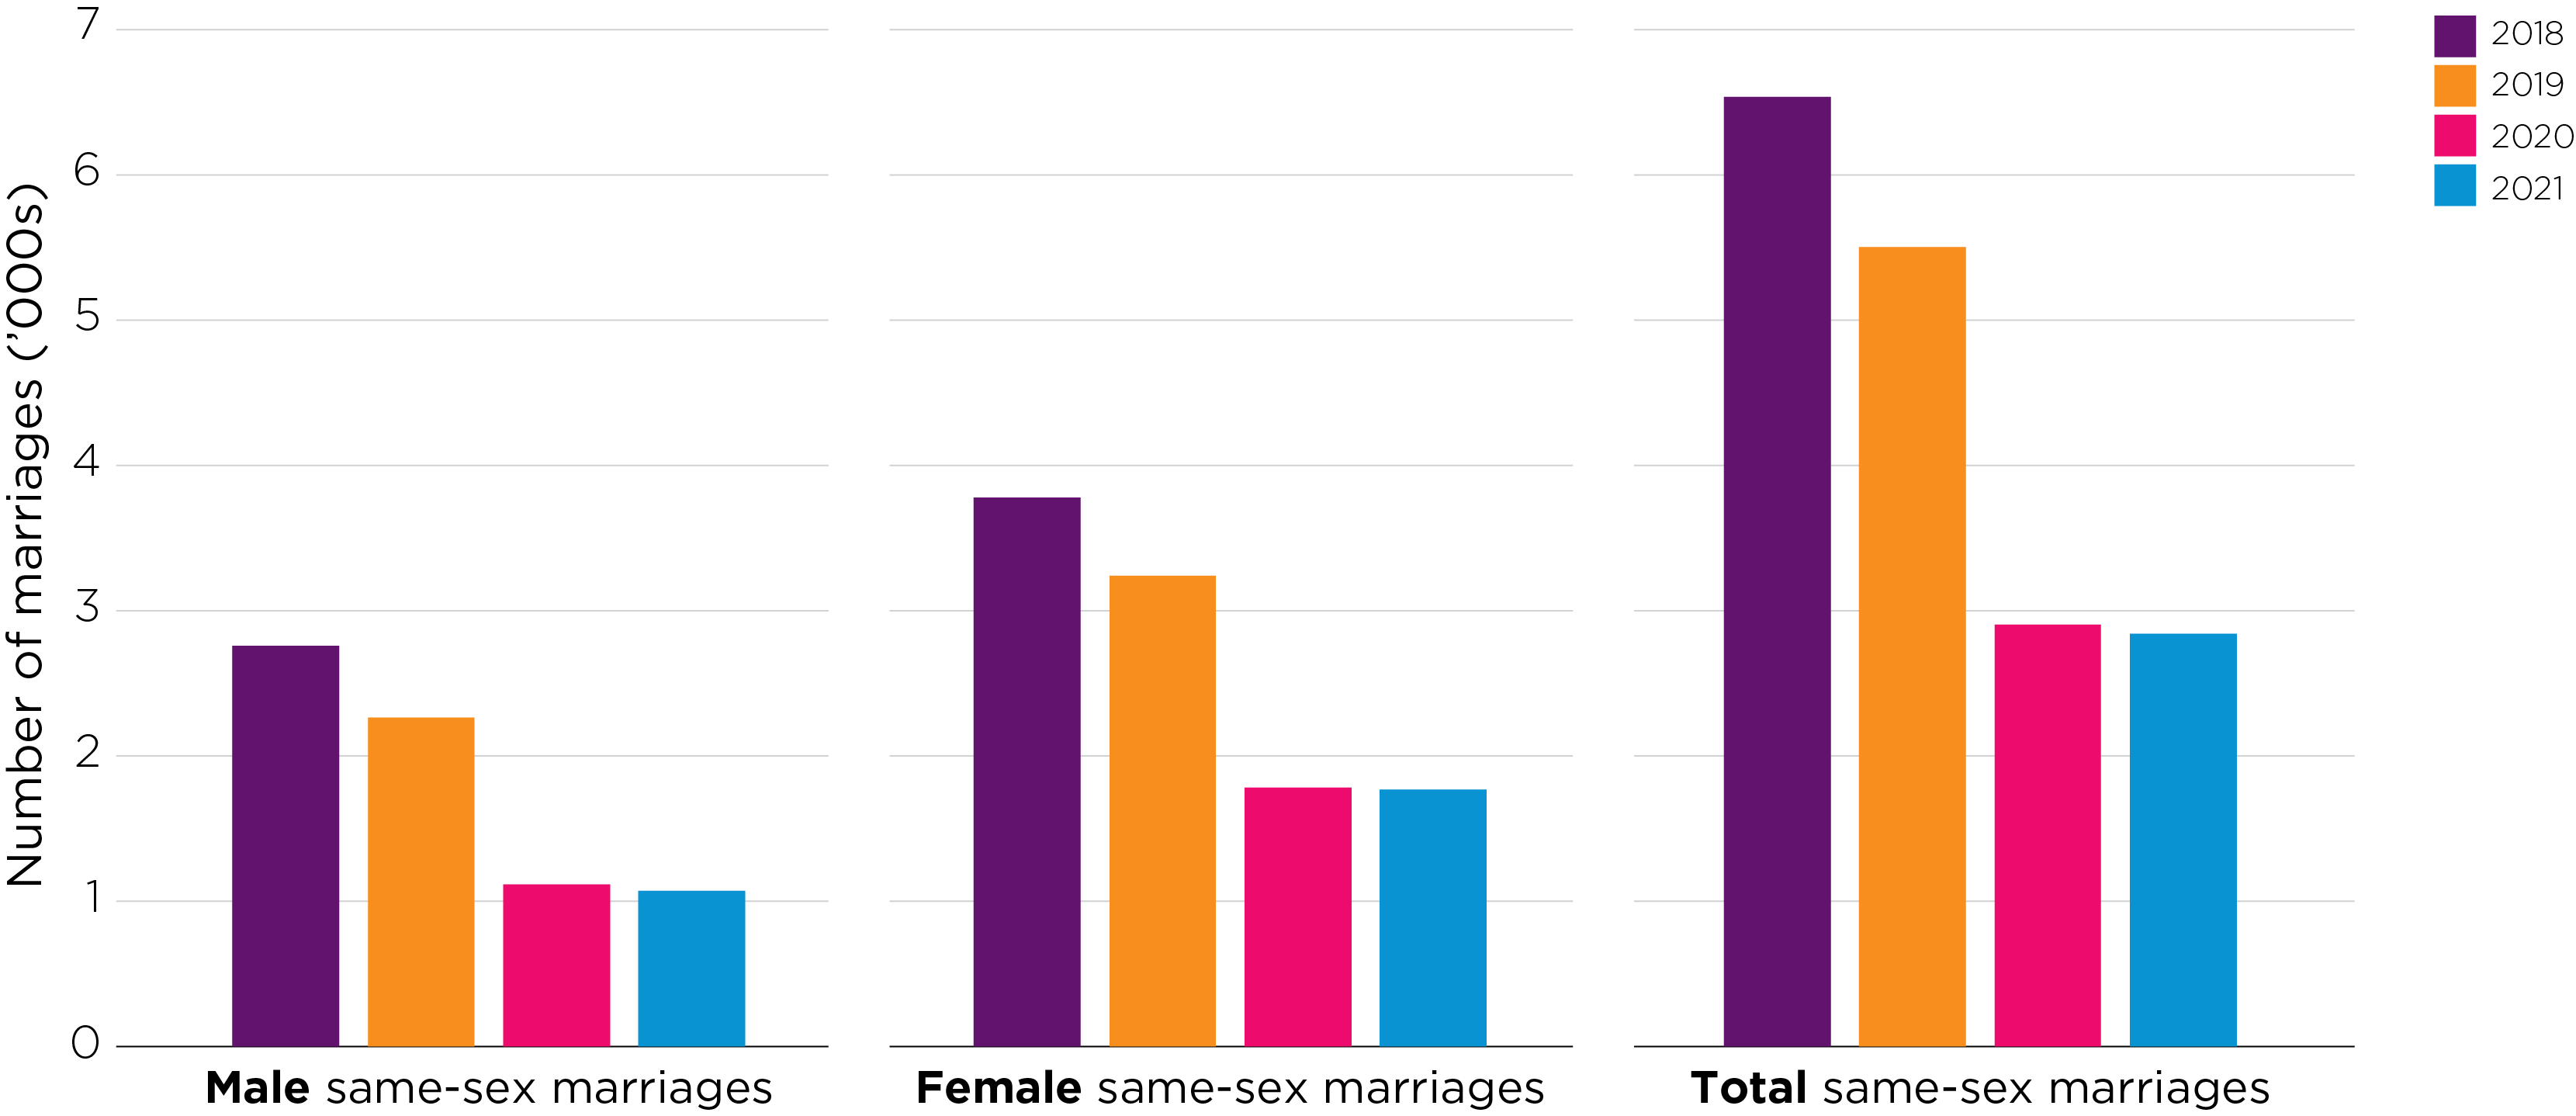
Amendments to the Marriage Act 1961 came into effect on 9 December 2017, enabling same-sex couples to legally marry in Australia. Same-sex marriages were included in the marriages data for the first time in 2018. In 2018, there were 6,538 same-sex marriages registered, with more female same-sex marriages than male same-sex marriages (58% of the same-sex marriages were females).
The effects of the COVID pandemic on same-sex marriages were the same as on all marriages (Figure 8). The number of same-sex marriages fell by 48% between 2019 and 2021, from 5,507 in 2019 to 2,902 in 2020 and 2,842 in 2021. The fall was greater for male same-sex marriages (by 53%, from 2,262 in 2019 to 1,072 in 2021) than for female same-sex marriages (by 45%, from 3,242 in 2019 to 1,771 in 2021).
Same-sex marriages represented 6% of all marriages in 2018. The proportion fell to 5% in 2019, 4% in 2020 and 3% in 2021.
Figure 7: Number of same-sex marriages registered by gender, 2018–21
Source: ABS, (2021), Marriages and Divorces Australia 2020
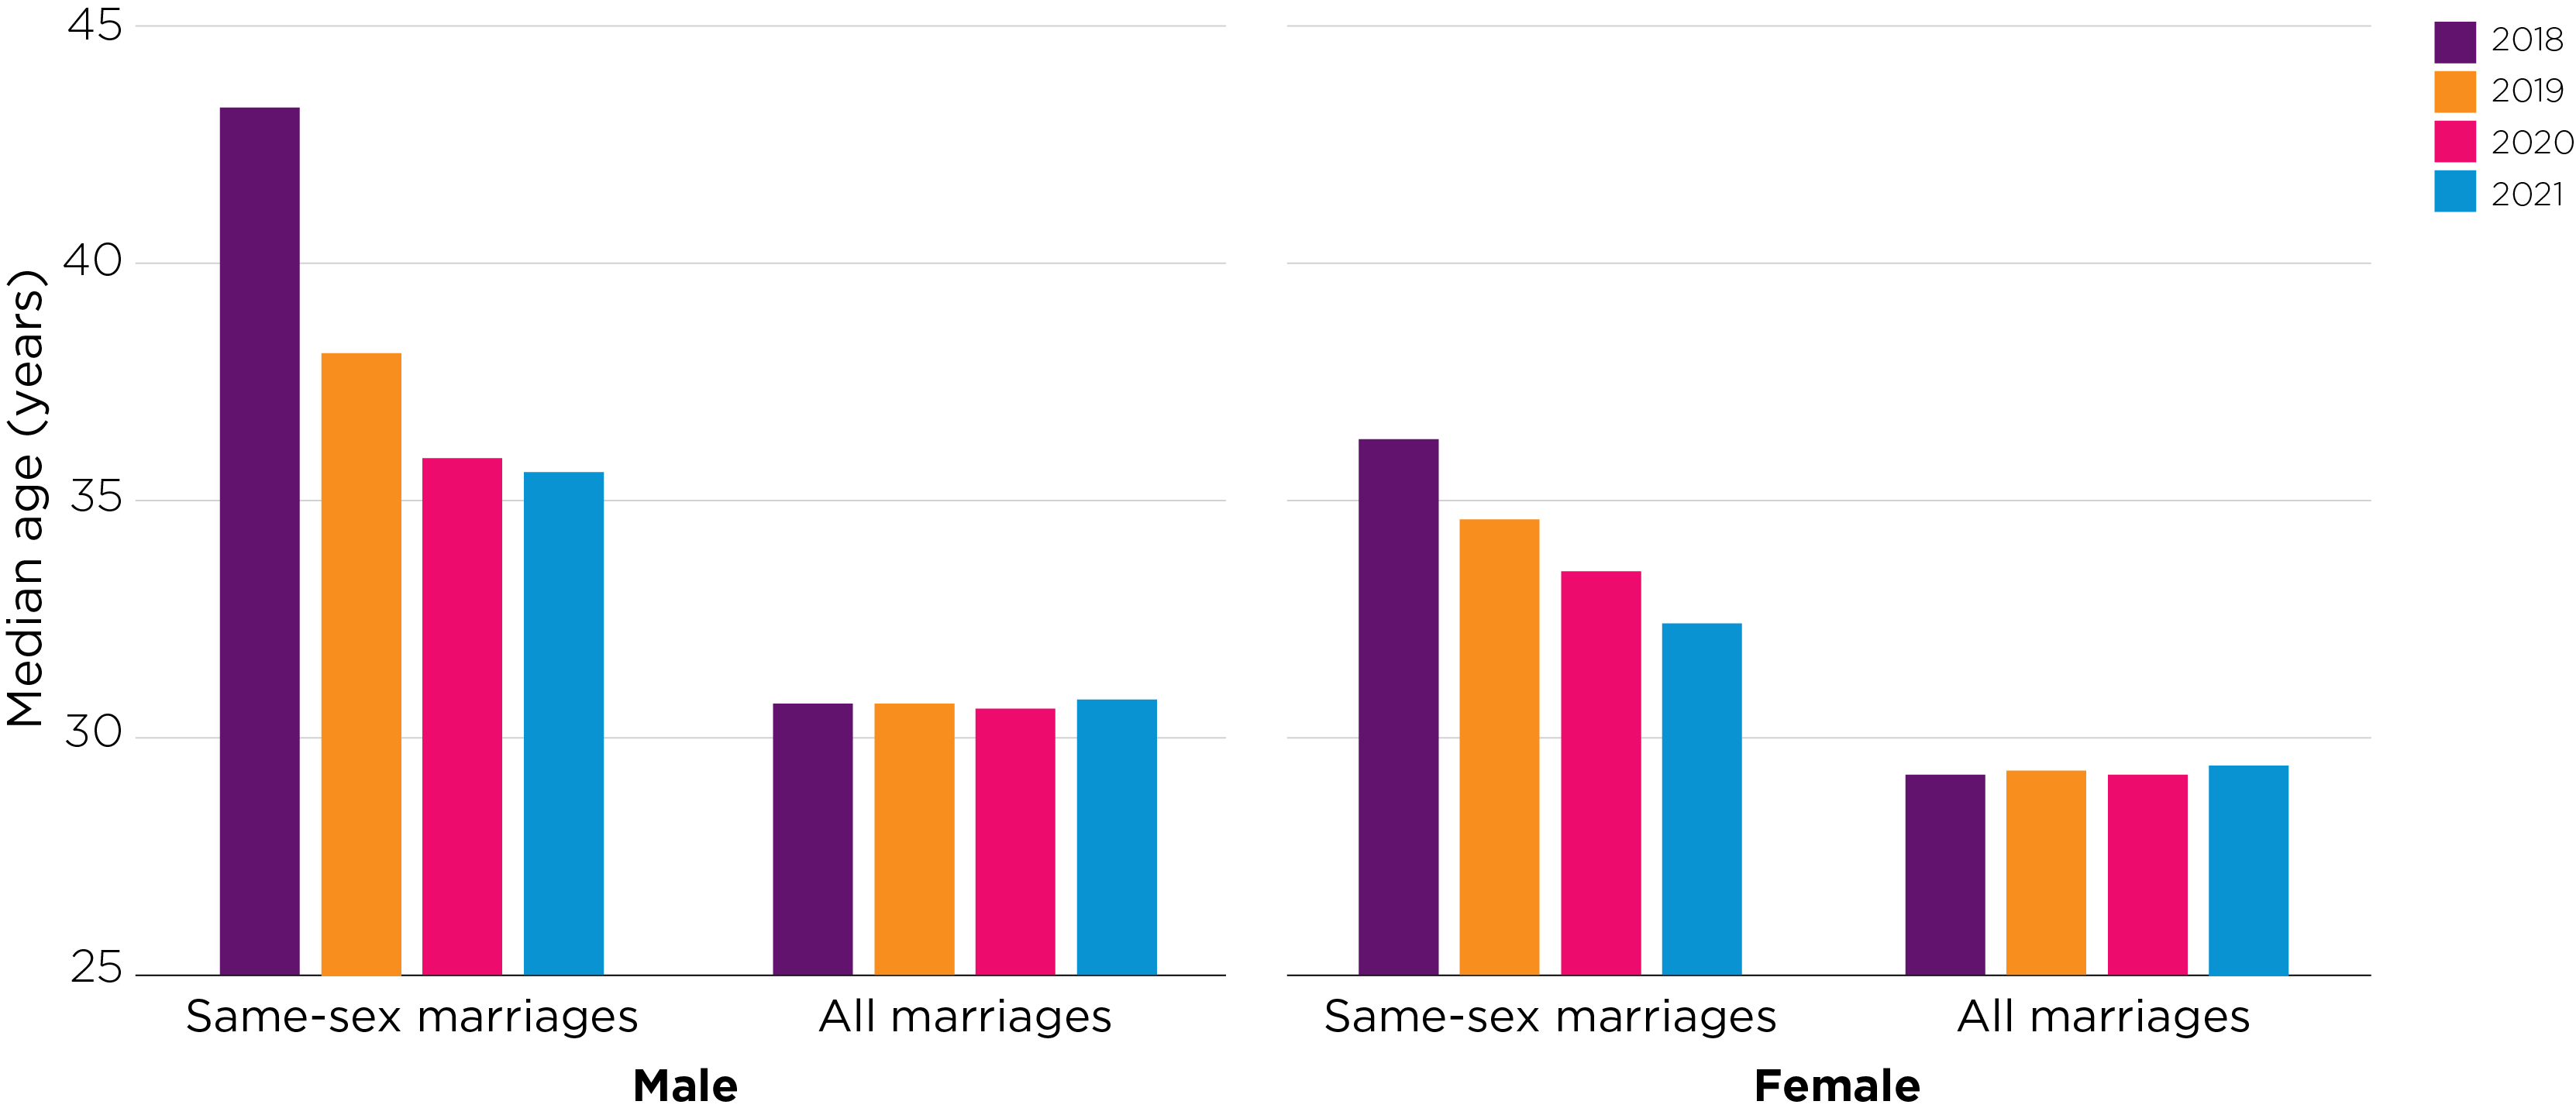
The median age at first marriage for same-sex marriages in 2018 was substantially older than for all marriages (Figure 8). This pattern applied to both men and women and is likely to be due to established same-sex couples who wished to marry, but were previously unable to, making use of the change to the Marriage Act. The median age at first marriage for same-sex marriages has trended down over the subsequent three years. Over the four years, the trends in the median age at first marriage for same-sex marriages were: for men from 43.3 years in 2018 to 38.1 years in 2019 and 35.6 years in 2021; for women from 36.3 years in 2018 to 34.6 years in 2019 and 32.4 years in 2021.
Figure 8: Median age at first marriage, same-sex marriages and all marriages, 2018–21
Source: ABS, (2021), Marriages and Divorces Australia 2020
References
- Australian Bureau of Statistics (ABS). (1997). Australian Social Trends (Catalogue No. 4102.0). Canberra: ABS.
- Australian Bureau of Statistics. (various years). Marriages and Divorces Australia. Canberra: ABS.
- Australian Bureau of Statistics. (various years). Marriages Australia (Catalogue no. 3306.0). Canberra: ABS.
- Baxter, J., Hewitt, B., & Rose, J. (2015). Marriage. In G. Heard & D. Arunachalam (Eds.), Family formation in 21st Century Australia. Dordrecht: Springer.
- Commonwealth Bureau of Census and Statistics. (various years). Australian Demography Bulletin (ABS Catalogue No. 3141.0). Canberra: Commonwealth Bureau of Census and Statistics.
- Gray, M., Qu, L., Stanton, D., & Weston, R. (2019). Fifty years of changing families: Implications for income support. In P. Saunders (Ed.), Revisiting Henderson: Poverty, social security and basic income. Melbourne: Melbourne University Press.
1 In addition to restrictions on large gatherings, venue capacity limits and border closures, many states had specific restrictions on the number of guests attending weddings at some time during 2020 and 2021. At the height of restrictions in Victoria, weddings were only permitted as exceptions.
2 The proportion of couples living together without being married is higher in the Northern Territory than in other states (in 2021, 28% of people living with a partner were cohabiting compared to 18%–22% in other states and territory), which likely contributes to its lower marriage rate.
© GettyImages/wragg