Population, households and families
This research snapshot outlines some key changes in the population, households and families of Australia over the last four decades, with some of the trends going back before this time. This research snapshot is mainly based on Australian censuses.
Key messages
-
Australia’s population is getting bigger and older, it has also become more ethnically and culturally diverse.
More people
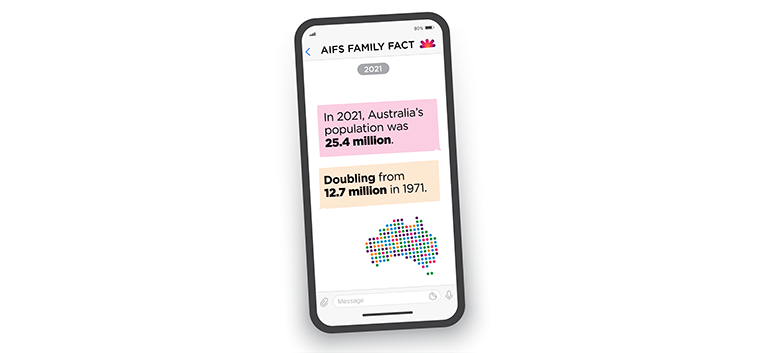
Over the last century, Australia’s population has experienced significant change in size and composition. The 2021 Census revealed that Australia’s population had reached 25.4 million, doubling from 12.7 million in 1971 and quadrupling from 6.6 million in 1931 (Figure 1).
Figure 1: Australia’s population has doubled since 1971, reaching 25 million in 2021
Australia’s population size, 1911–2021
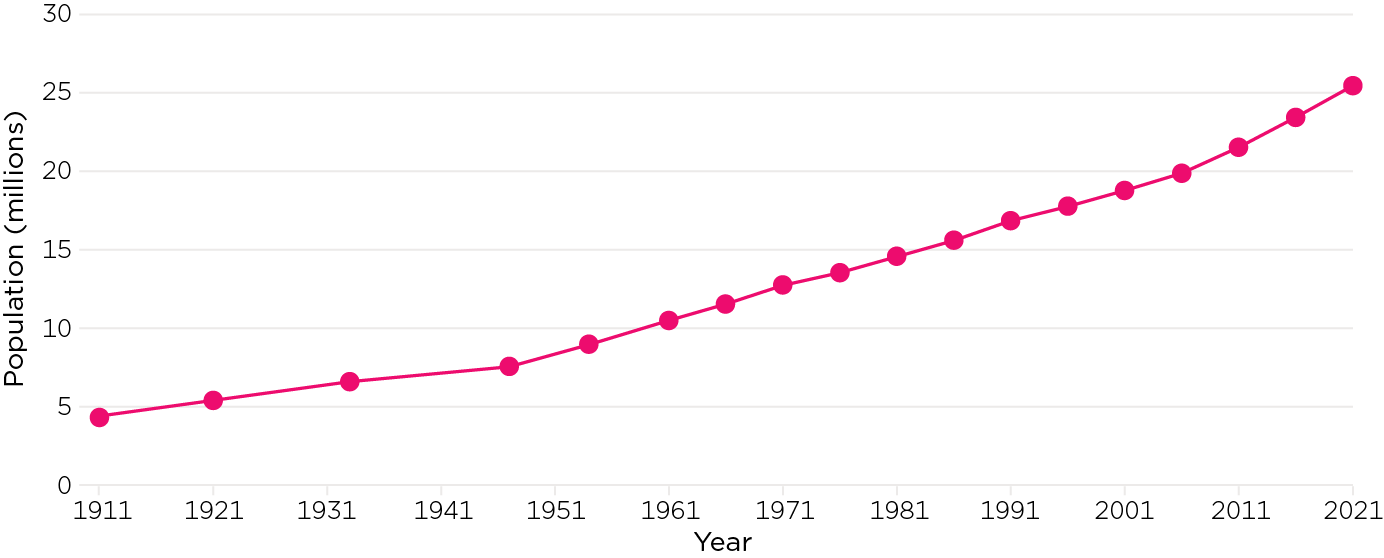
Source: Australian Bureau of Statistics (ABS), 1911–2021 Censuses
Population growth comprises natural increase (the number of births minus the number of deaths) as well as net migration (overseas arrivals less overseas departures). The impact of migration on the Australian population has been significant, contributing to a very multicultural population – see Ethnically and culturally diverse below.
The trend in population size has been disrupted in recent years, with travel restrictions through the COVID pandemic having a large impact on migration numbers. The population numbers for 2011–22 are shown in Figure 2, and the components of population growth, summarised by year for 2011–21, in Figure 3. This figure confirms that usual migration stopped during the COVID-19 pandemic, leaving population growth to only reflect the impacts of natural increase.
Figure 2: Australia’s estimated population growth was close to zero in 2021
Estimated annual resident population growth, June 2013—June 2022
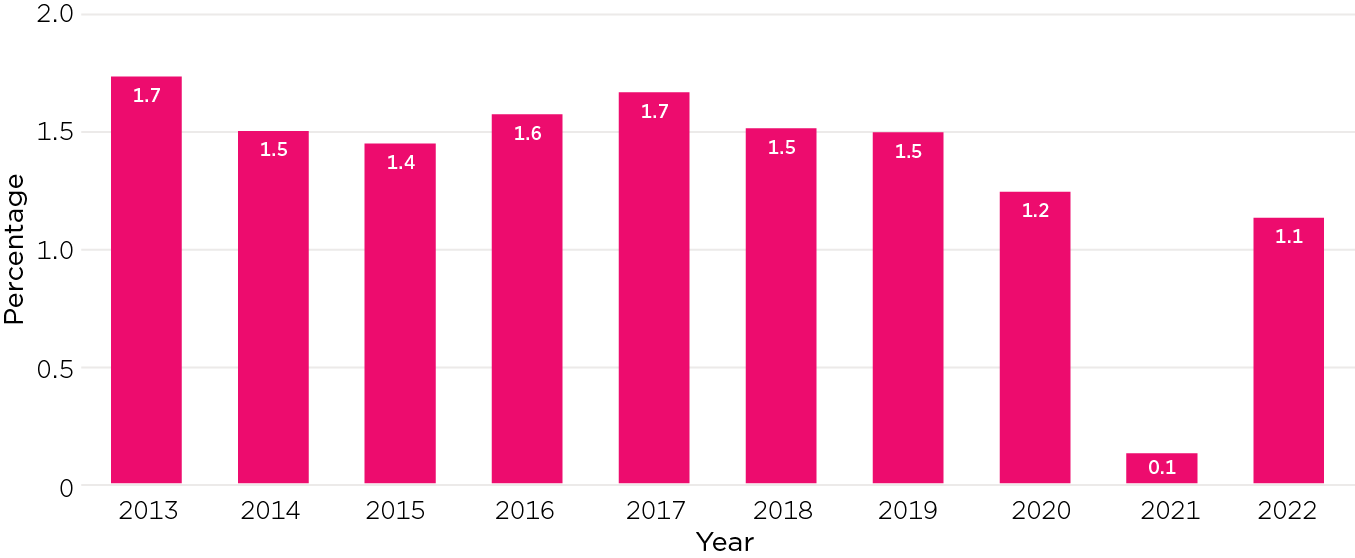
Source: ABS, (2022), National, state and territory population, June 2022
Figure 3: Net overseas migration was close to zero in 2020 and 2021
The components of annual Australian population growth, June 2013–June 2021
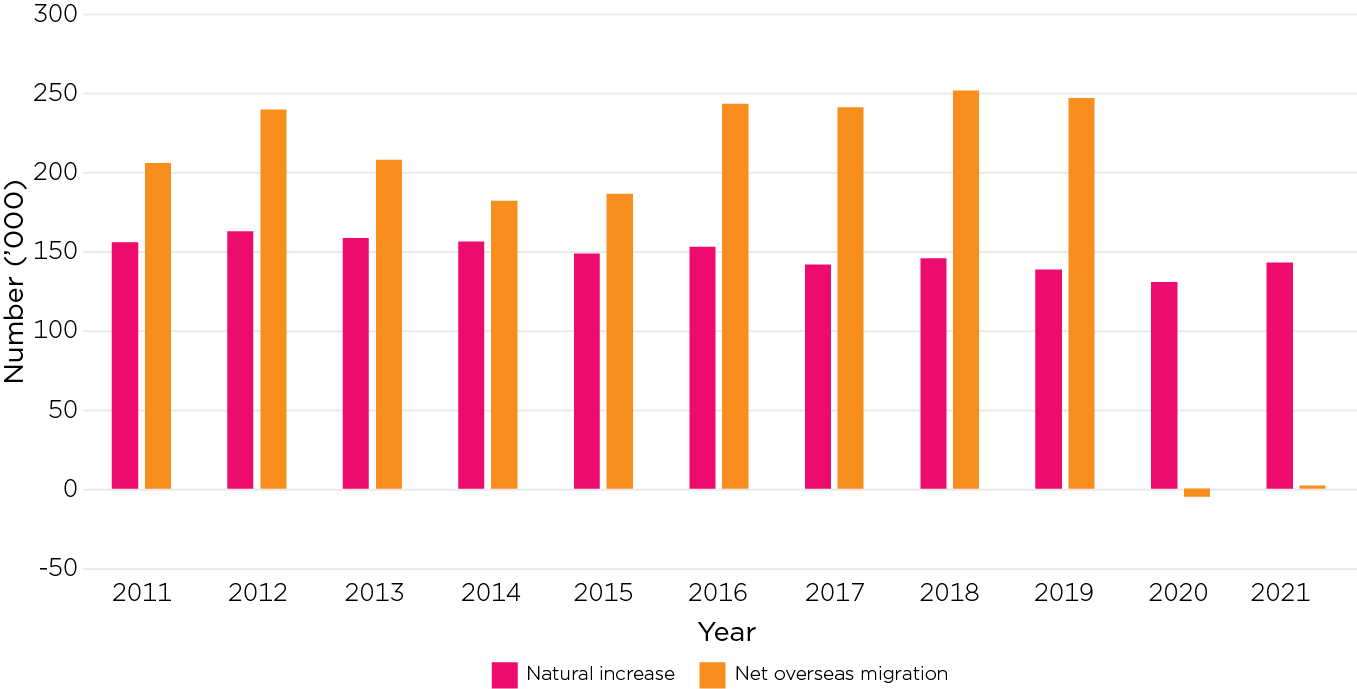
Source: ABS, (2022), National, state and territory population, June 2022
Widely spread over the country
While Australia’s population is spread across states and territories, Figure 4 shows that more than one-half of the population in 2021 was in the two states of New South Wales (32%) and Victoria (25%). One-fifth of the population was in Queensland. Figure 5 shows the majority of Australia’s population (67%) housed in the capital cities, with two in five living in metropolitan Sydney and Melbourne. Over the last decade, the population increased more in the capital cities compared to regional areas (17% cf. 11%). Figure 6 shows that this pattern applied to each state.
Figure 4: Over half of Australia’s population resides in NSW and Victoria
Proportion of the population by state and territory, 2021
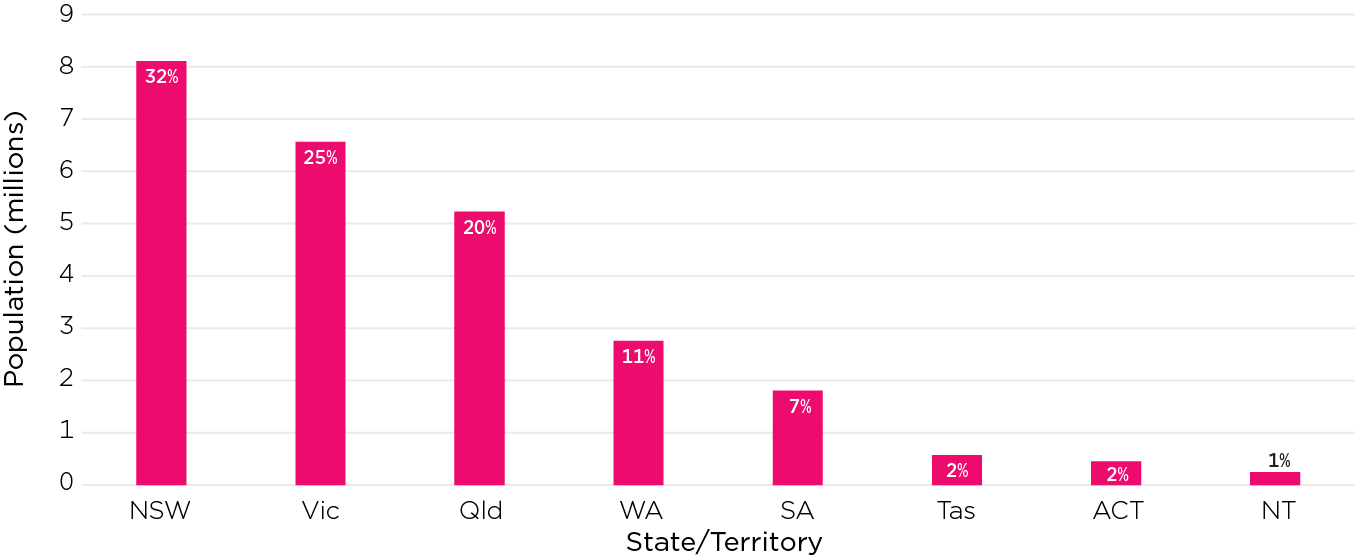
Source: ABS, (2022), Regional population, 2021 (Population estimates by SA2 and above (ASGS2016))
Figure 5: The majority of people in capital cities, except Queensland and Tasmania
Proportion of the population by greater capital city area vs the rest of the state/territory, 2021
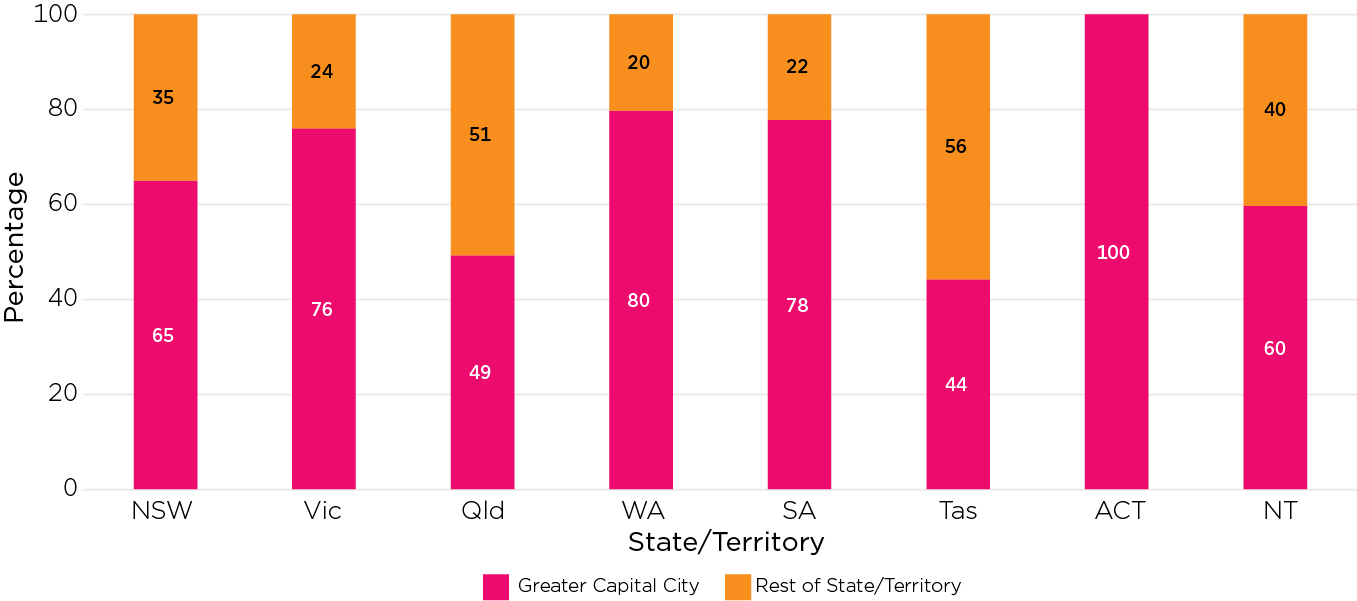
Source: ABS, (2022), Regional population, 2021 (Population estimates by SA2 and above (ASGS2016))
Figure 6: Population growth is consistently higher in capital cities
Percentage change in population between 2011 and 2021, by greater capital city areas and rest of states and territories
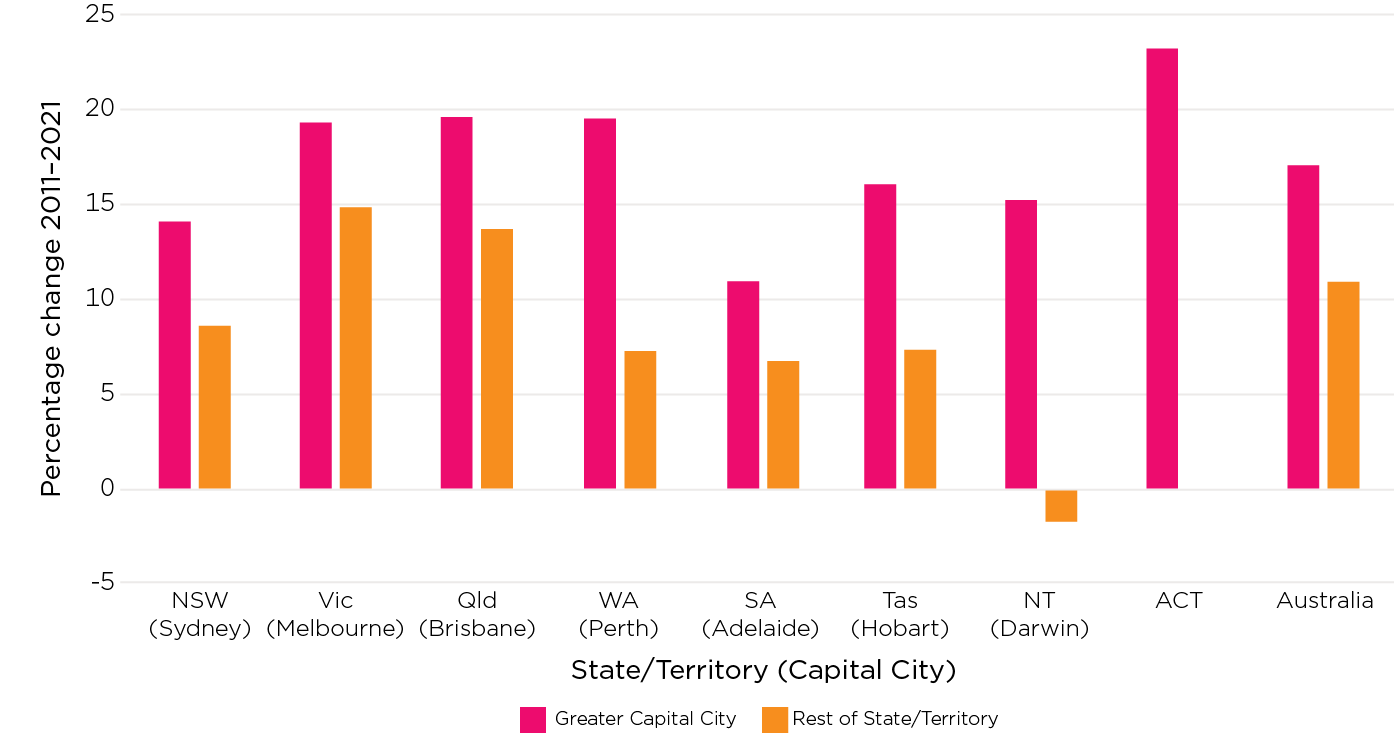
Source: ABS, (2022), Regional population, 2021 (Population estimates by SA2 and above (ASGS2016))
Growing older
The Australian population has become older, reflecting long-term changes in life expectancy as well as changes in fertility patterns (see also Births in Australia). An indication of this is seen in Figure 7, with the decline in the share of the population aged 0–14 years and an increase in the share aged 65 years and over.
- The proportion of the population aged 0–14 years was 35% in 1911, declining in subsequent years to 25% in 1947. This was followed by a period of steady increase until the early 1960s, reflecting what is still referred to as the ‘baby boom’ (see more below). The proportion aged 0–14 years has since then progressively declined, down to 17% in 2021.
- In 1911, only 4% of the population was 65 years old and over. The representation of this older population has steadily increased over the last century, to 17% in 2021.
- The proportion of the ‘working age’ population – the broad age group between the younger and older ranges – rose from 1911 and peaked at 67% in 1947. It then fell but started increasing again from 1961. The proportion remained stable in the 1990s and 2000s but has trended downward in the last two censuses in 2016 and 2021.
Another key statistic is the proportion aged 85 years and older, sometimes referred to as the ‘oldest-old’. The population aged 85+ years was very small in the early decades of the 20th century (0.2% from 1911–31) but this population had increased to 2% by 2021.
Figure 7: Australia’s population continues to age
Proportions of population aged 0–14, 15–64, and 65 and over, 1911–2021

Source: ABS, 1911–2021 Censuses
For another perspective on these trends, Figure 8 depicts the distribution of population by age and sex for 1911, 1961, 2001 and 2021. In 1911, the distribution of population resembles a pyramid comprising relatively many children at the base and relatively few elderly people at the top. By 1961, there had been a swell in the age groups up to 14 years, representing most of the post-war ‘baby boomers’, defined by ABS as those born between 1945 and 1964. The population is much larger overall, by 2001, with the biggest age group being the 40–44 year olds – a consequence of the baby boomer population growing older. By 2021, the age–sex profile no longer resembles a pyramid. The number of older Australians is significantly higher, while the distribution still has some bulges reflecting flow-on effects of the baby boomer population.
Figure 8: The size and age of Australia’s population has grown considerably over the past century
Population by age and sex, 1911, 1961, 2001 and 2021
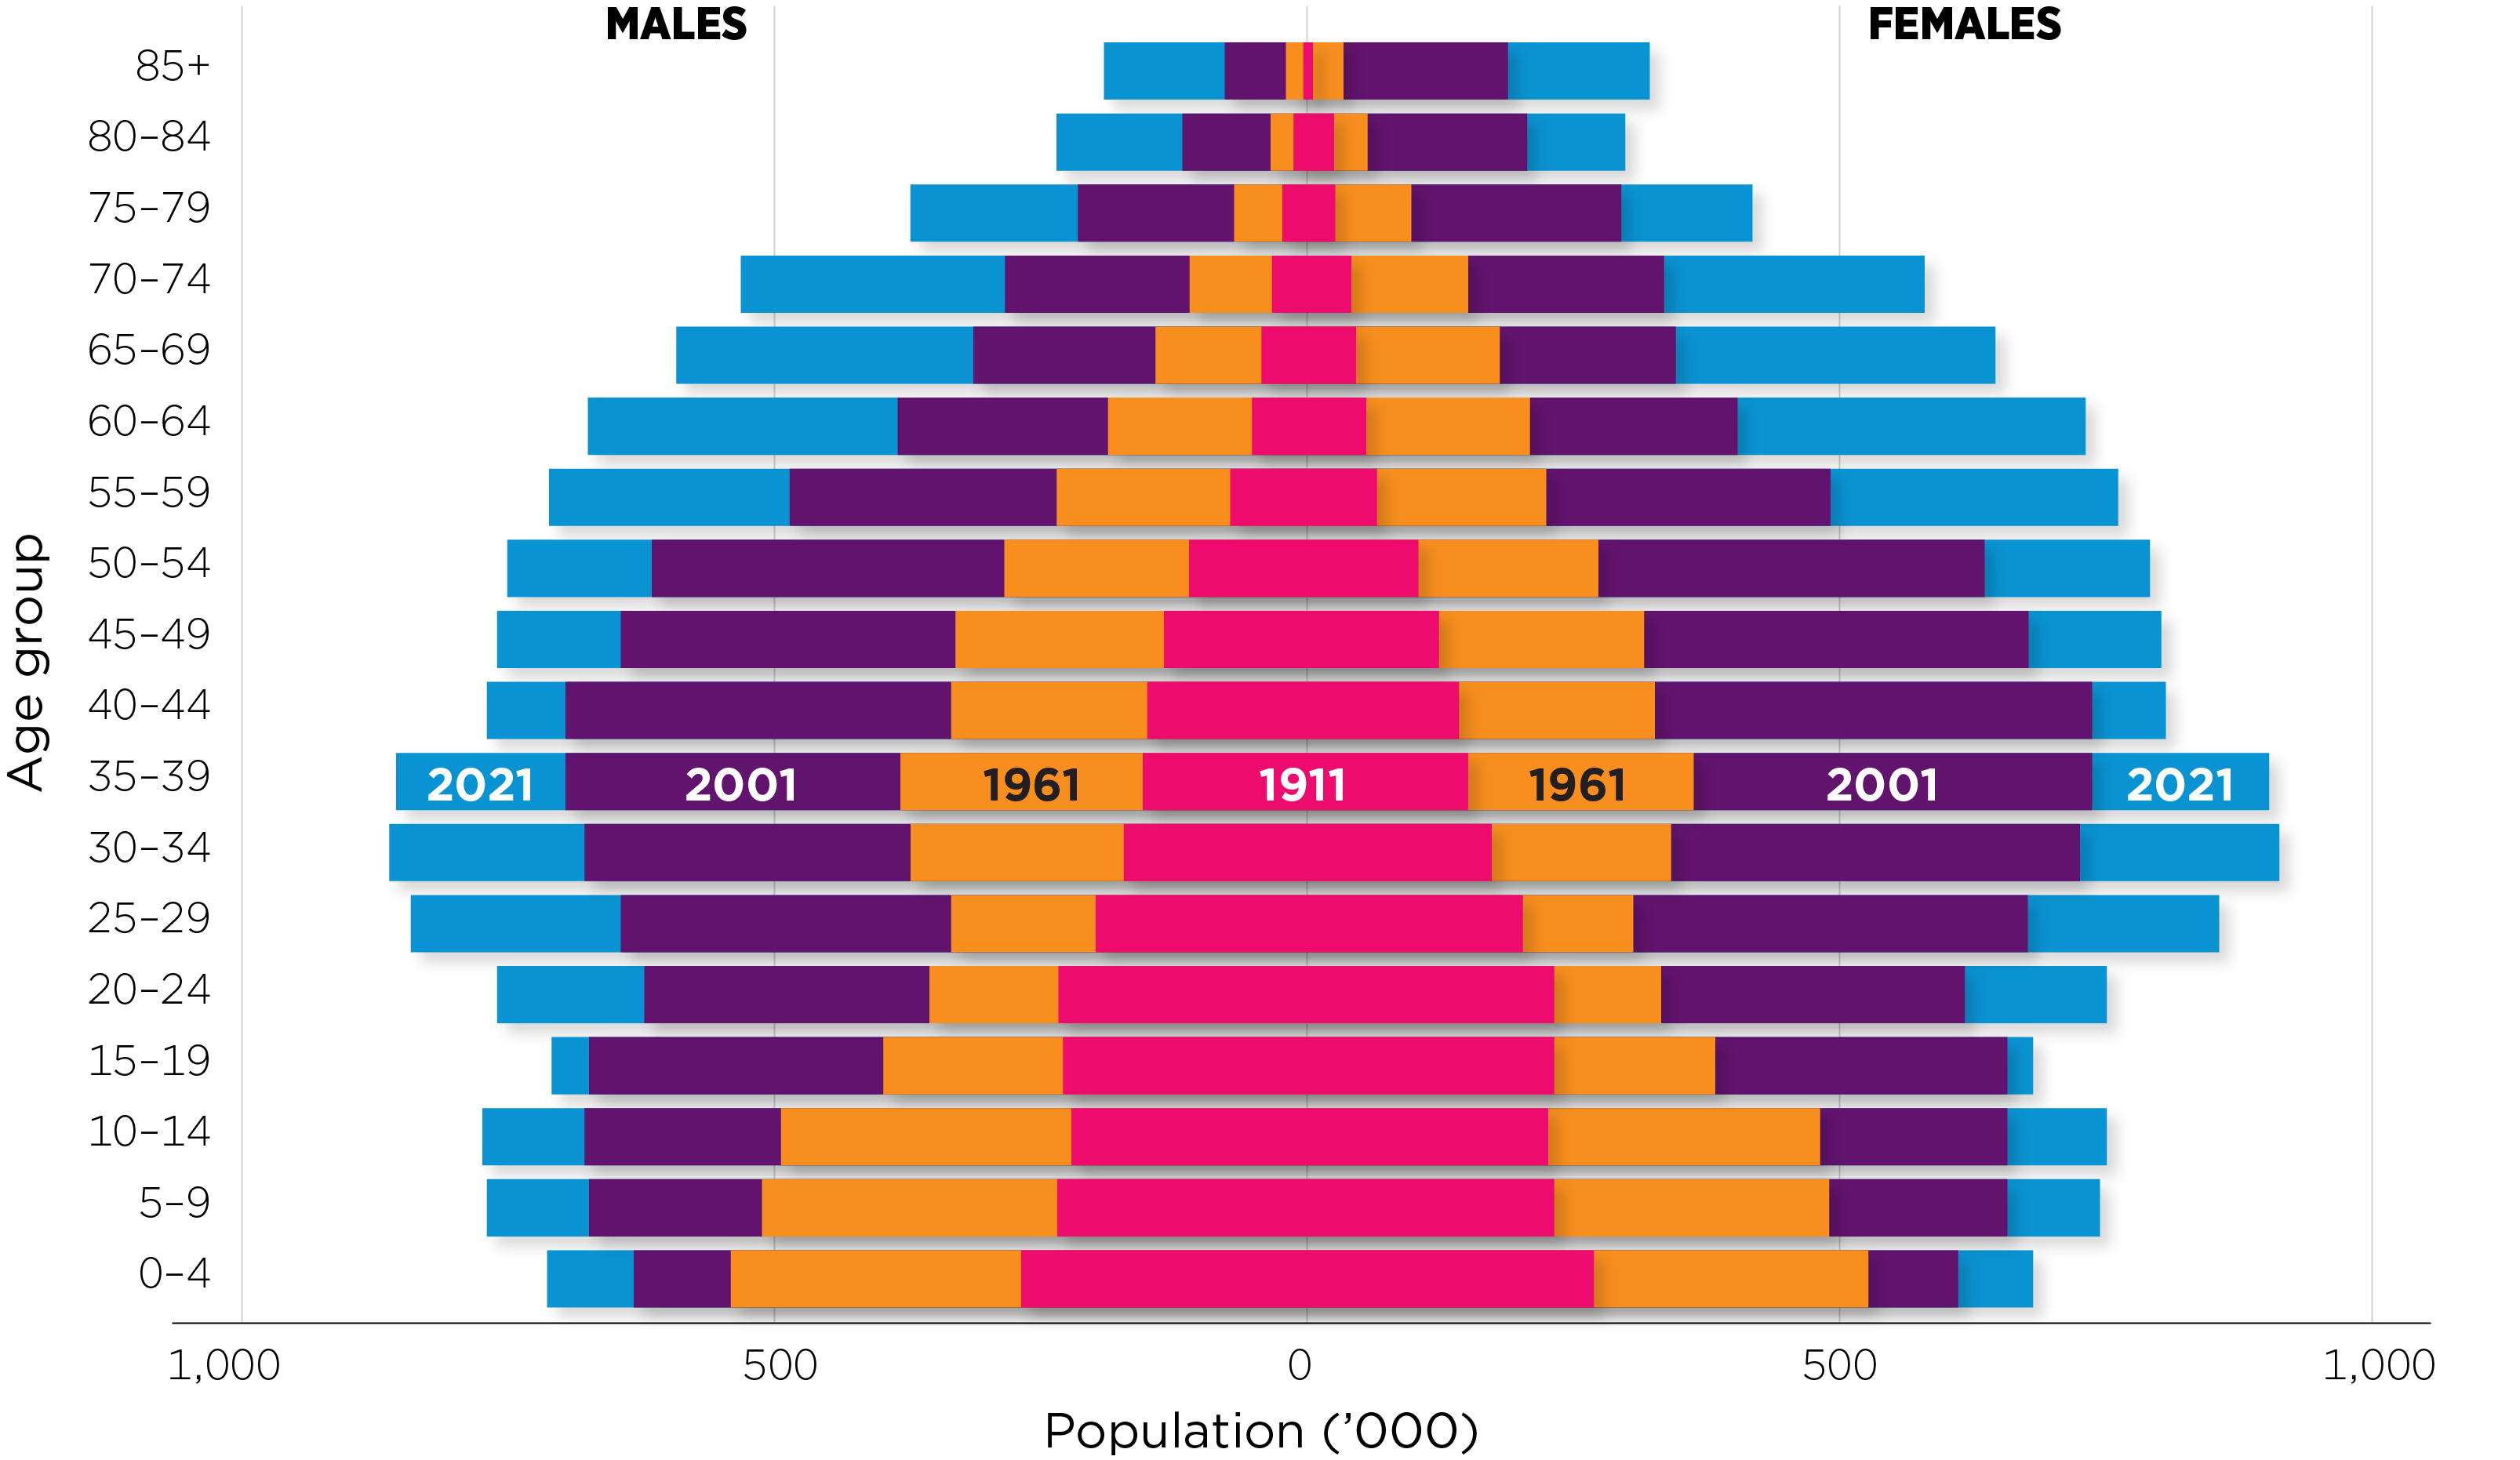
Source: ABS, 1911, 1961, 2001 & 2021 Censuses
Ethnically and culturally diverse
Australia’s population is culturally and ethnically diverse, with more than one in four Australians (28%) having been born overseas; and one in five born in Australia but having one or both parents born overseas. These figures were from the 2021 Census.
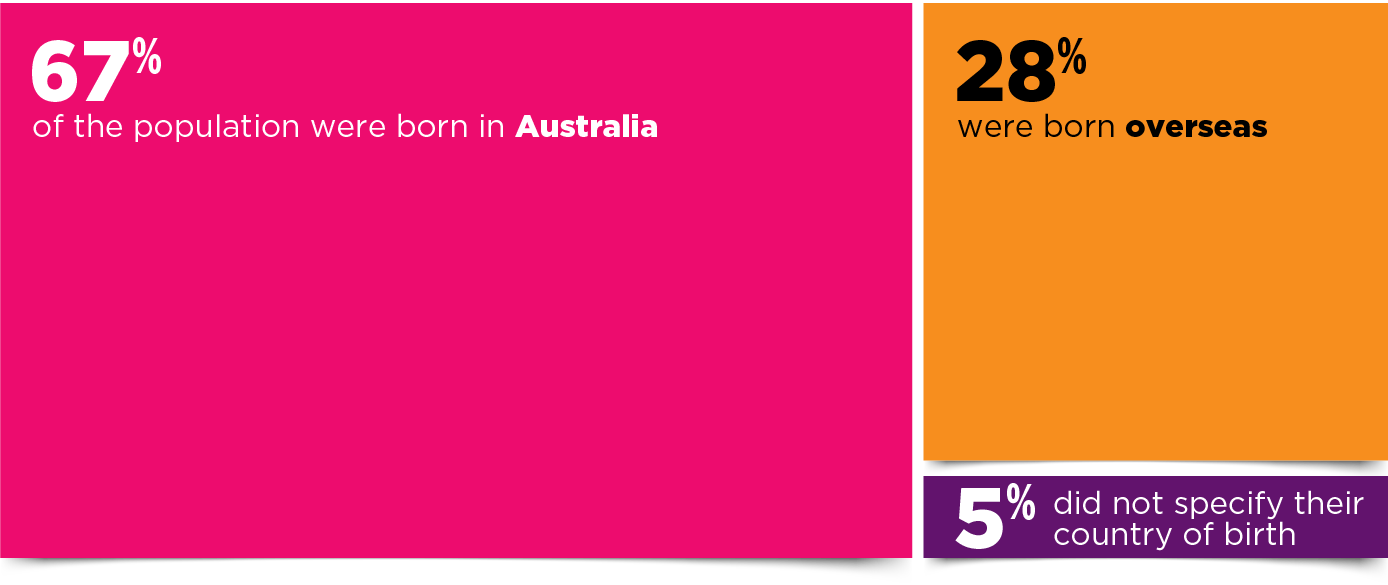
In 2021 the top five countries of birth for those born overseas were:
- England (3.6%)
- India (2.6)
- China (excludes the Special Administrative Regions of Hong Kong and Macau, and Taiwan) (2.2%)
- New Zealand (2.1%)
- Philippines (1.2%).
Australia’s cultural and ethnic diversity has been apparent for many decades, although changing immigration patterns have seen vast differences over time in arrivals’ countries of origin. For example, 10% of the Australian population in 1981 were from North-West European countries; by 2021, the proportion had fallen to 6%. By contrast, immigration from Asian countries has been on the rise during the period, with immigrants from South-East Asian countries as a proportion of the entire population increasing from 1% to 4%, North-East Asian countries from 0.5% to 3%, Southern and Central Asian countries from 0.5% to nearly 5%. The diversity in immigrants’ countries of origin has contributed to a richly varied and diverse population.1
See also More immigrant households for information on ethnic diversity and households.
Growing First Nations population
There were 812,728 people who identified as First Nations (Aboriginal and/or Torres Strait Islander)2 in the 2021 Census, representing 3.2% of the Australian population, and increasing from 2.5% in the 2011 Census. Most First Nations people identified as being of Aboriginal origin only (91%), 4% as Torres Strait Islander origin, and 5% as both Aboriginal and Torres Strait Islander origin. The First Nations population has grown faster than the total population overall. Reasons for this greater growth in the First Nations population include increasing numbers of people self-identifying as First Nations3 and the relatively high fertility rate of First Nations women. There has been a rise in the number of couples with one partner identifying as having a First Nations background and the other partner as of non-indigenous background (Qu & Warren, 2020), and the number of children born to these couples and identifying as having a First Nations background may be increasing.
As depicted in Figure 9, the proportion of the population that is First Nations varies markedly across the states and territories. In 2021, the proportion of the population that was First Nations was highest in the Northern Territory (26% in 2021) and lowest in Victoria (1% in 2021). These patterns were also evident in 2011.
Figure 9: The Northern Territory has the largest proportion of First Nations people in Australia but is the only state or territory where the proportion declined
Proportion of population that is First Nations by state/territory, 2011 and 2021

Source: Based on the data derived from the 2011 & 2021 Census TableBuilder
More but smaller households
With the population growth, the number of Australian households has also significantly increased. According to the 2021 Census, there were 9.275 million households in Australia.4 This compares to estimates from previous years of 8.286 million in 2016 and 7.76 million in 2011.5
While the number of households has increased, the average household size has declined. Figure 10 shows that household size fell from an average of 4.5 people per household in 1911 to 3.6 people per household in 1961, and then to around 2.6 from 2001. The average was slightly lower, at 2.5, in 2021.
Figure 10: The average Australian household size reduced by two people between 1910 and 2021
Average household size, 1911–2021
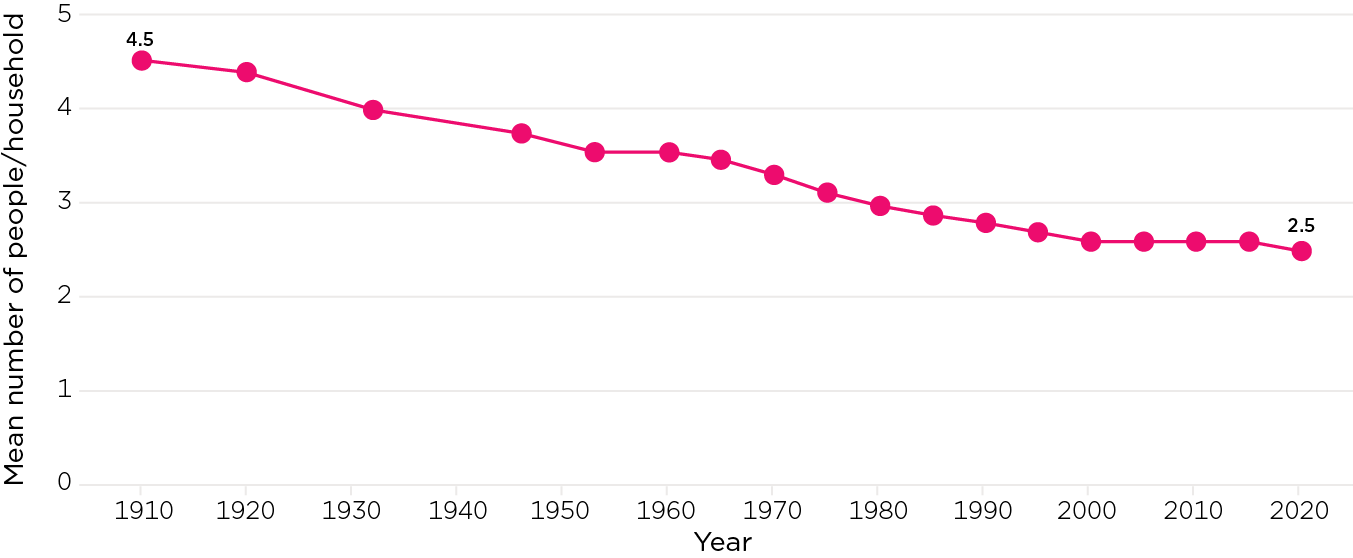
Source: ABS, 2011, 2016 and 2021 Censuses – Time Series Profile; Hugo, (2002), A century of population change in Australia.
The change in household size reflects the changing distribution of household compositions. Households are grouped into three basic forms (see Figure 11):
- Family households, comprising families where members are related by blood or marriage (registered or de facto), adoption, step or fostering, and who reside in the same household. These made up the majority (71%) of Australian households in 2021.
- Individuals living alone – in 2021 more than one in four households (26%) were occupied by one person.
- Groups of unrelated persons. These made up only 4% of households in 2021.
A household may contain more than one family, though multiple-family households are uncommon; less than 2% of households had two or more families.
The trends in household compositions since 1981 are shown in Figure 11. The greatest changes happened between 1981 and 1996. Over the period 1981–2021:
- Family households remained predominant, although declining from 78% in 1981 to 71% in 2021.
- One-person households increased from 18% in 1981 to 24% in 2006. The proportion was slightly higher at 26% in 2021.
Further analysis of one-person households found that women living alone outnumbered men living alone. Of persons living alone, 55% were women and 45% were men. Women living alone had an older age profile compared to men living alone. One-half of women living alone were aged 65 years or older, compared to one-third (32%) of men living alone.
Figure 11: The proportion of one-person households in Australia has climbed over the past 40 years
Household composition, 1981–2021
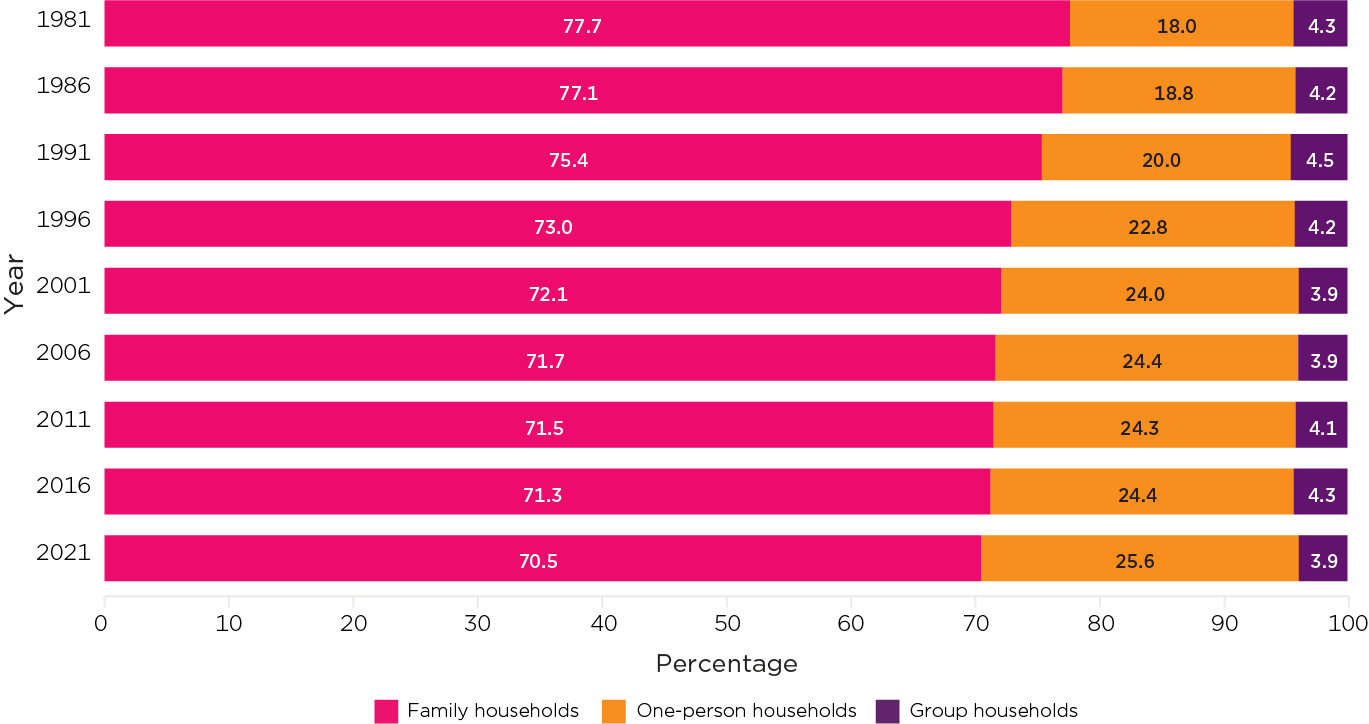
Notes: Data for 1981 were derived from the 1981 Census 1% Household sample file. In 1986, household membership was based on where the person was enumerated on census night. In 1996 and onwards, households were classified according to ‘usual residence’ for up to three residents of a household who were temporarily absent on census night. Excludes ‘visitors only’ and ‘other non-classifiable’ households.
Source: ABS, 1981–2021 Censuses
Increase in First Nations households
ABS defines Indigenous households (here referred to as First Nations households) with at least one usual resident who identified as Aboriginal and/or Torres Strait Islander. There were 352,041 households with First Nations person(s) in the 2021 Census, representing 4% of all households. Figure 12 shows that the proportion of households identified as First Nations has steadily increased. Less than 1% of households were First Nations in 1981, and the proportion rose to 4% by 2021. This trend is consistent with the increasing representation of First Nations people in the Australian population, as mentioned above.
Figure 12: The proportion of households with First Nations members continues to rise
Households with First Nations members as a percentage of all households, 1981–2021
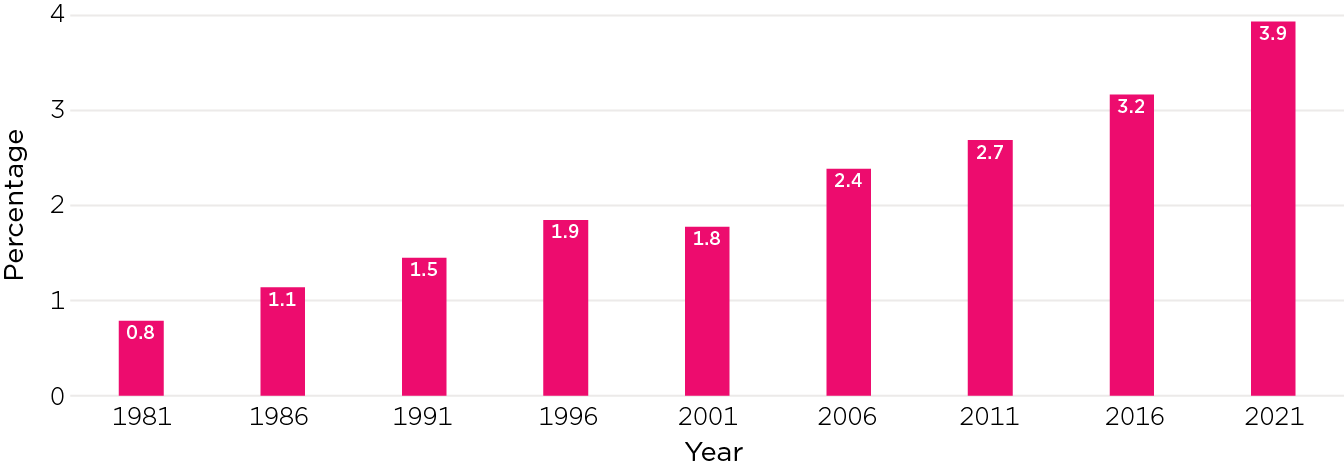
Notes: For 1981–1996, the proportions were derived from a 1% household sample file of each census period, using the most recent definition. For 2001, the definition of household with First Nations member(s) differed from other years (see the Appendix).
Source: ABS, 1981–1996 Census 1% of household sample files; ABS, 2006–2021 Census Community Profile Series – Indigenous Profile
More immigrant households
Over the last four decades, Australia has become a more multicultural society, with an increasing proportion of the population born overseas, and Asian countries becoming key sources of immigrants (ABS, 2020). Figure 13 presents proportions of household reference persons by their country of birth.
- The proportion of households with reference persons born in Australia declined from 72% in 1981 to 65% in 2021.
- In 1981, UK and Ireland were the largest group of immigrant households (based on household reference persons) at 11%, while household reference persons from Southern, Eastern and Southern-Eastern European countries were the second largest group at 9%. By 2021, the proportions of these two groups had fallen to 7% and 4%, respectively.
- The proportion of households with reference persons from Asian countries increased from less than 2% of Australian households (when the three Asian regions were combined) in 1981 to 13% in 2021.
Figure 13: The proportion of Australian households with Asian and African backgrounds is on the rise
Percentage of household reference persons born in overseas countries, 1981 and 2021
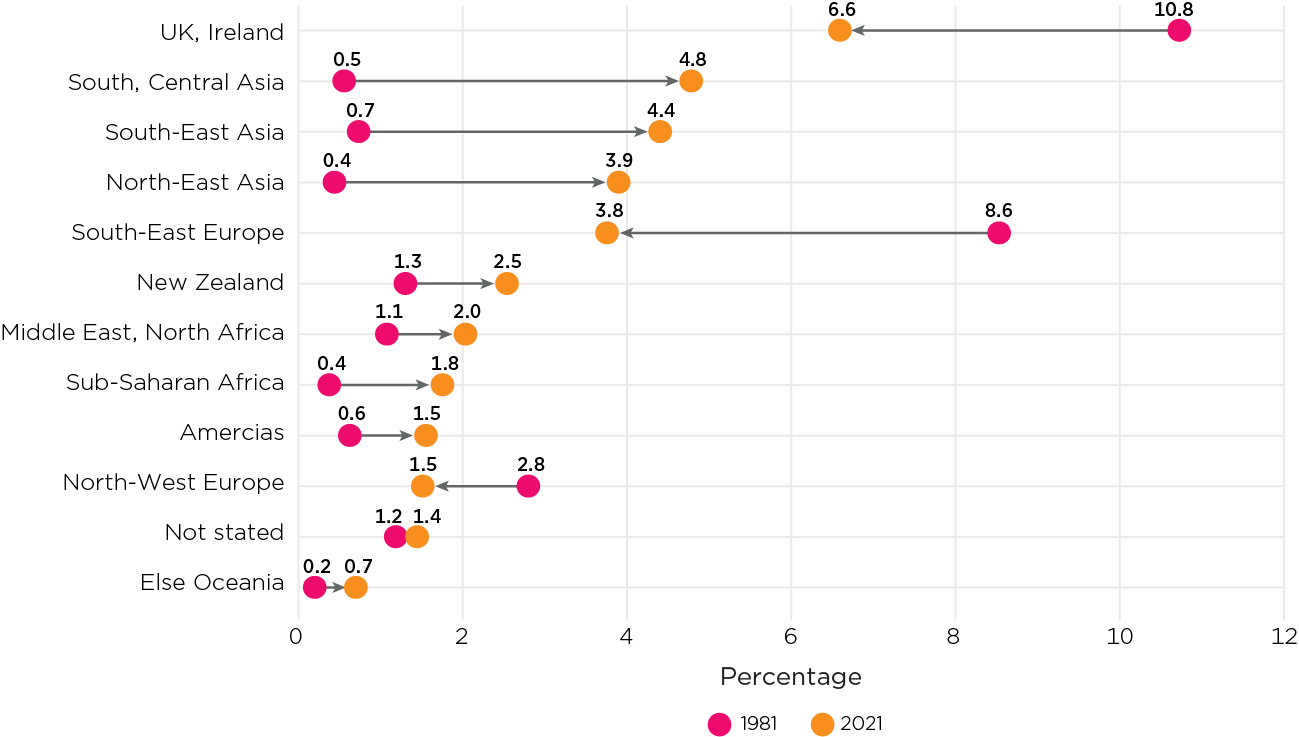
Source: ABS, 1981 & 2021 Census 1% of households sample file; ABS, 2011 & 2021 Census TableBuilder
Family trends
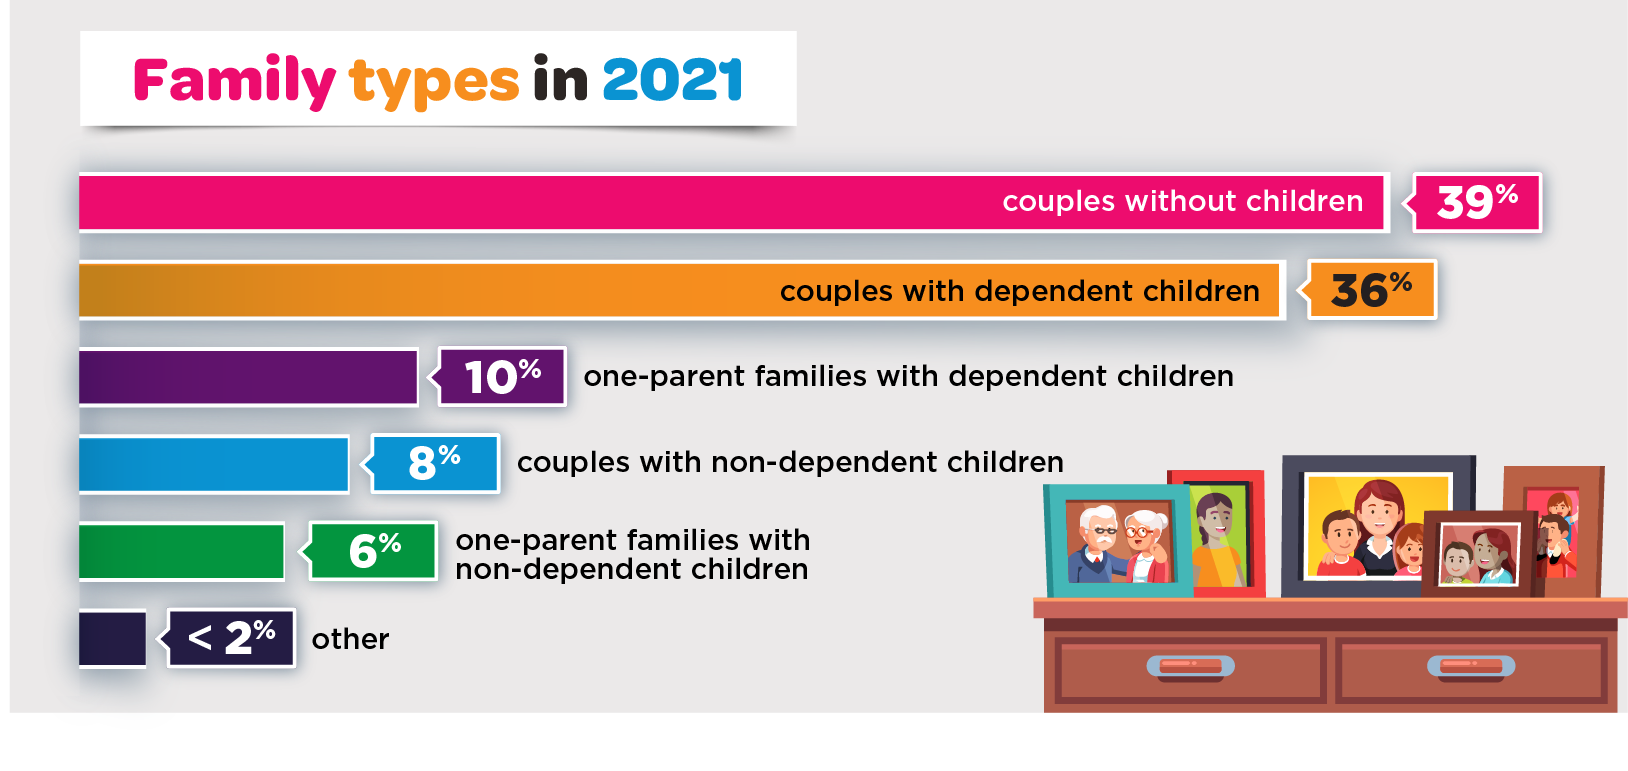
Figure 14 showed that family households have remained the most common household form – with 6.73 million families across Australia according to the 2021 Census. This count of families in the census focuses on who people usually lived with, when household members identify that they are related by relationship or by blood.
In 2021, families included:
- 2,608,834 couples without children (39%)
- 2,424,680 couples with dependent children (36%) – that is, with children up to 14 years or dependent students aged 15–24 years
- 674,059 one-parent families with dependent children (10%)
- 519,457 couples with non-dependent children (children aged over 25 years or children aged 15–24 years who are not full-time students) (8%)
- 394,202 one-parent families with non-dependent children (6%)
- 108,941 other families, such as siblings or other related people living together (<2%).
Noting the earlier data on the age-related changes to the population, some changes in the distribution of family types are to be expected. Figure 14 shows the trends from 1981 to 2021.
- The proportion of couple families without children has increased and the proportion with children has decreased, consistent with expectations with an ageing population.
- One-parent families as a proportion of all families were under 9% in 1981 and 1991, and increased to 10.7% in 2001, but have remained at a similar level in census years since then.
- One-parent families with non-dependent children represented 4% of all families in 1981; the proportion has shown an upward trend, rising to 6% in 2021.
There was considerable stability in these distributions over the period 2011–21 compared to the preceding decades.
Figure 14: The proportion of couple families without children continues to rise
Proportion of Australian families by type,1991–2021
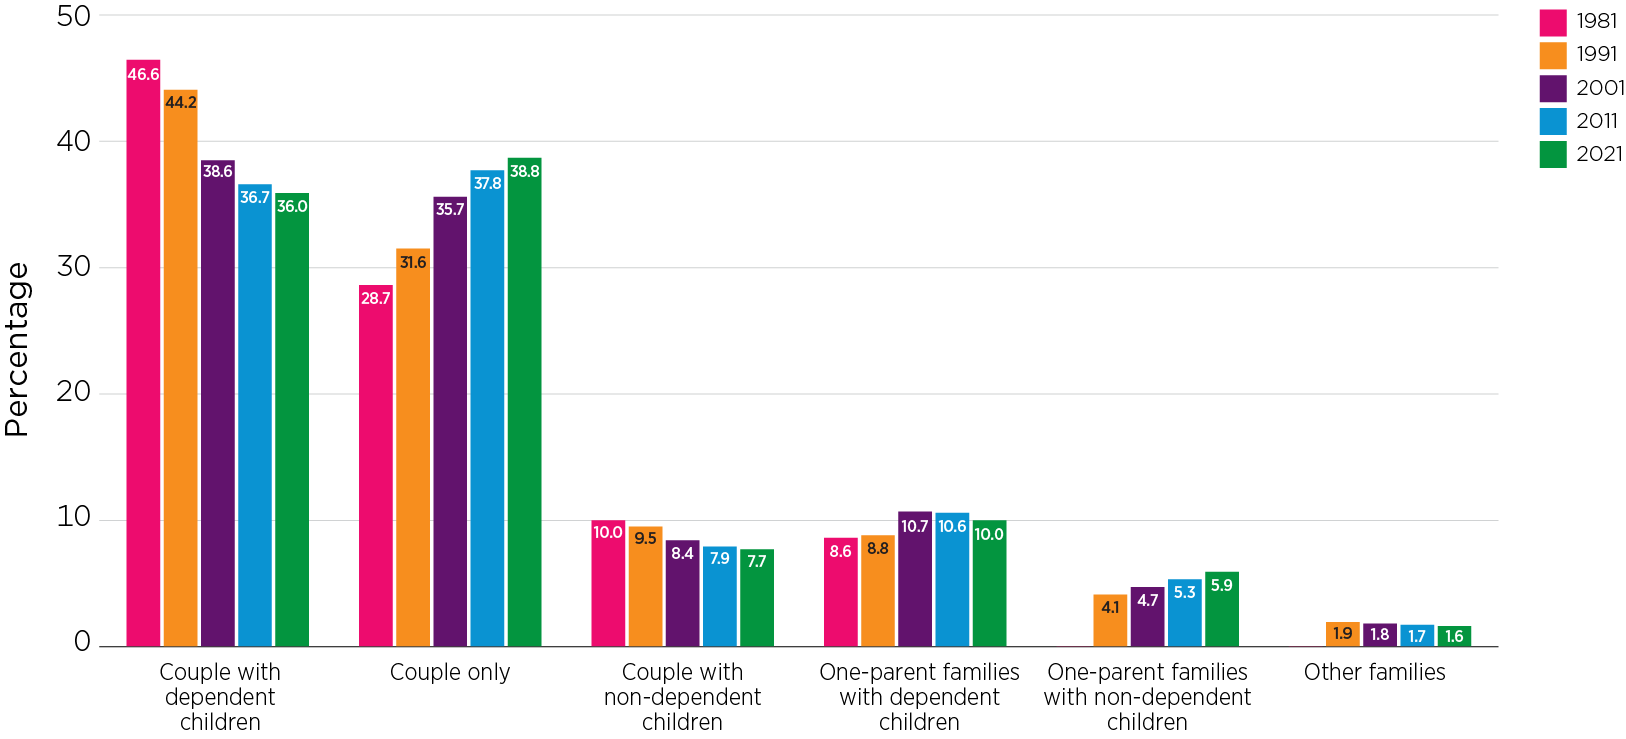
Note: Dependent children include children aged under 15 years and full-time students aged 15–24 years.
Source: ABS, 1981–2021 Censuses
1 Cultural diversity may have different meanings in different contexts, and can be considered by country of birth, language spoken at home, ancestry or other aspects. We have focused just on country of birth.
2In the census, individuals were asked whether they were of ‘Aboriginal or Torres Strait Islander origin’. With the options to select either or both.
3 Biddle and Markham (2018) analysed the Australian Census of Longitudinal Dataset and found that while the vast majority of people identified as Indigenous or non-indigenous in both the 2011 and 2016 Censuses, people who identified as First Nations in the 2016 Census but not in the 2011 outnumbered those who identified as Indigenous in 2011 but not in 2016.
4 This does not include 533,200 households with visitors only or households that were not classifiable.
5 A small segment of the population (3% in 2021) lived in non-private dwellings (e.g. boarding school, residential care facilities, and so on).
References
- Australian Bureau of Statistics (ABS). (various years). 1911–1921 Census: Population and dwellings: cross-classified tables (2426.0). Canberra: ABS.
- Australian Bureau of Statistics. (1983). 1981 Census household sample file (1%) – Confidentialised Unit Record File. Findings based on use of ABS Microdata. Canberra: ABS.
- Australian Bureau of Statistics. (1988). 1986 Census household sample file (1%) – Confidentialised Unit Record File. Findings based on use of ABS Microdata. Canberra: ABS.
- Australian Bureau of Statistics. (2000). 1996 Census of population and housing – Basic community profile (Catalogue no. 2001.0). Canberra: ABS.
- Australian Bureau of Statistics. (2007). 2006 Census of population and housing – Basic community profile (Catalogue no. 2001.0). Canberra: ABS.
- Australian Bureau of Statistics. (2012a). 2011 Census of population and housing, TableBuilder. Findings based on use of ABS TableBuilder data. Canberra: ABS.
- Australian Bureau of Statistics (2012b). 2011 Census of population and housing – Time series profile (Catalogue no. 2003.0). (T02 Selected medians and averages) Canberra: ABS. Retrieved from quickstats.censusdata.abs.gov.au/census_services/getproduct/census/2011/communityprofile/0?opendocument
- Australian Bureau of Statistics. (2016). Census of population and housing: Census dictionary, Australia 2016 (Catalogue no. 2901.0). Canberra: ABS. Retrieved from www.abs.gov.au/AUSSTATS/[email protected]/ProductsbyCatalogue/9795AA2F5B1A5C2DCA2581BE00127257?OpenDocument
- Australian Bureau of Statistics. (2017a). 2016 Census of population and housing – Basic Community Profile (Catalogue no. 2001.0). Canberra: ABS.
- Australian Bureau of Statistics. (2017b). 2016 Census of population and housing – Time series (Catalogue no. 2003.0). Canberra: ABS.
- Australian Bureau of Statistics. (2018). 2016 Census household sample file (1%) – Confidentialised Unit Record File. Findings based on use of ABS Microdata. Canberra: ABS.
- Australian Bureau of Statistics. (2020). Migration, Australia, 2018–19 (Catalogue no. 3412.0). Canberra: ABS. Retrieved from www.abs.gov.au/AUSSTATS/[email protected]/Latestproducts/3412.0Main%20Features32018-19?opendocument&tabname=Summary&prodno=3412.0&issue=2018-19&num=&view=
- Australian Bureau of Statistics. (2021a). 2021 Census of population and housing Australia – General community profile. Canberra: ABS.
- Australian Bureau of Statistics. (2021b). 2021 Census of population and housing, TableBuilder. Canberra: ABS.
- Australian Bureau of Statistics. (2022a). National, state and territory population, June 2022. Canberra: ABS.
- Australian Bureau of Statistics. (2022b). Regional population, 2021 (Population estimates by SA2 and above (ASGS2016)) Canberra: ABS.
- Australian Bureau of Statistics. (2022c). Australia: Aboriginal and Torres Strait Islander population summary. Canberra: ABS. Retrieved from www.abs.gov.au/articles/australia-aboriginal-and-torres-strait-islander-population-summary
- Biddle, N., & Markham, F. (2018). Indigenous identification change between 2011 and 2016: Evidence from the Australian Census Longitudinal Dataset (CAEPR Topical Issue No. 1/2018). Canberra: Centre for Aboriginal Economic Policy Research, ANU College of Arts & Social Sciences.
- Hugo, G. (2002). A century of population change in Australia. In Australian Bureau of Statistics (Ed.), 2001 Year Book Australia, No. 83, Cat. No. 1301.0 (169–210). Canberra: ABS.
- Qu, L., & Warren, D. (2020). Families Then and Now (No.1): Households and Families. Melbourne: Australian Institute of Family Studies.
Definitions of households
Household
A household is defined by the ABS as ‘one or more persons, at least one of whom is at least 15 years of age, usually resident in the same private dwelling.
‘Under this definition, all occupants of a dwelling form a household and complete one form.
‘Therefore, for census purposes, the total number of households is equal to the total number of occupied private dwellings as a census form is completed for each household from which dwelling information for the household is obtained.’
Family household
‘A family is defined by the ABS as two or more persons, one of whom is at least 15 years of age, who are related by blood, marriage (registered or de facto), adoption, step or fostering, and who are usually resident in the same household.
‘Each separately identified couple relationship, lone parent–child relationship or other blood relationship forms the basis of a family. Some households contain more than one family.
‘Non-related persons living in the same household are not counted as family members (unless under 15 years of age).
‘Other related individuals (brothers, sisters, aunts, uncles) may be present in the household. If more than one family is present these people can only be associated with the primary family.’
For census, a family household is a household with a family (or more than one family) present on census night.
Lone-person household
According to the ABS, a lone-person household is ‘any private dwelling in which there is only one usual resident at least 15 years of age, is classified as being a lone person household.’ A lone-person household is considered as a non-family household.
Group household
‘The ABS defines a group household as a household consisting of two or more unrelated people where all persons are aged 15 years and over. There are no reported couple relationships, parent–child relationships or other blood relationships in these households.
‘An unrelated child (e.g. boarder) under the age of 15 who lives in a household with one or more usual residents is coded as forming a parent–child relationship within that household. These households become family households, not group households.’
A group household is considered as a non-family household.
Indigenous household
An Indigenous household is ‘any household where at least one usual resident at the time of the census was a person of any age who identified as being of Aboriginal and/or Torres Strait Islander origin.’
In 2001 and previous censuses, an Indigenous household referred to ‘households where any family in the household is defined as an Indigenous family or a lone-person household where the lone person is of Aboriginal/Torres Strait Islander origin’ and the definition of an Indigenous family was a family where either the reference person and/or spouse/partner were of Aboriginal and/or Torres Strait Islander origin (ABS, 2003 community file).
In this snapshot, Indigenous households are referred to as First Nations households or households with First Nations member(s).
Definitions of family forms
Couple family
A couple family is identified by the ABS by ‘the existence of a couple relationship. A couple relationship is defined as two people usually residing in the same household who share a social, economic and emotional bond usually associated with marriage and who consider their relationship to be a marriage or marriage-like union. This relationship is identified by the presence of a registered marriage or de facto marriage. A couple family can be with or without children, and may or may not include other related individuals. A couple family with children present can be expanded to elaborate on the characteristics of those children, such as their number, age and dependency status.’
One-parent family
According to the ABS, ‘a one-parent family consists of a lone parent with at least one child (regardless of age) who is also usually resident in the household and who has no identified partner or child of his/her own. The family may also include any number of other related individuals.
‘Examples of one-parent families include: a 25-year-old parent with dependent children; and an 80 year old living with a 50-year-old child.
‘Information on people who are temporarily absent is used in family coding to differentiate between lone-person households and one-parent families (if child was temporarily absent) or between one-parent and couple families (if a spouse was temporarily absent).’
Other family
‘Other family’ is defined by the ABS as ‘a group of related individuals residing in the same household, who cannot be categorised as belonging to a couple or one-parent family.
‘If two brothers, for example, are living together and neither is a spouse/partner, a lone parent or a child, then they are classified as an other family. However, if the two brothers share the household with the daughter of one of the brothers and her husband, then both brothers are classified as other related individuals and are attached to the couple family.’
© GettyImages/chris-mueller
Media releases
19 July 2023