Families Then & Now: How we worked
Overview

Many changes have occurred in Australia since the establishment of the Australian Institute of Family Studies in 1980. This snapshot outlines some of the changes over the last four decades in when, how and where we work.
Key trends
The trends in how we worked
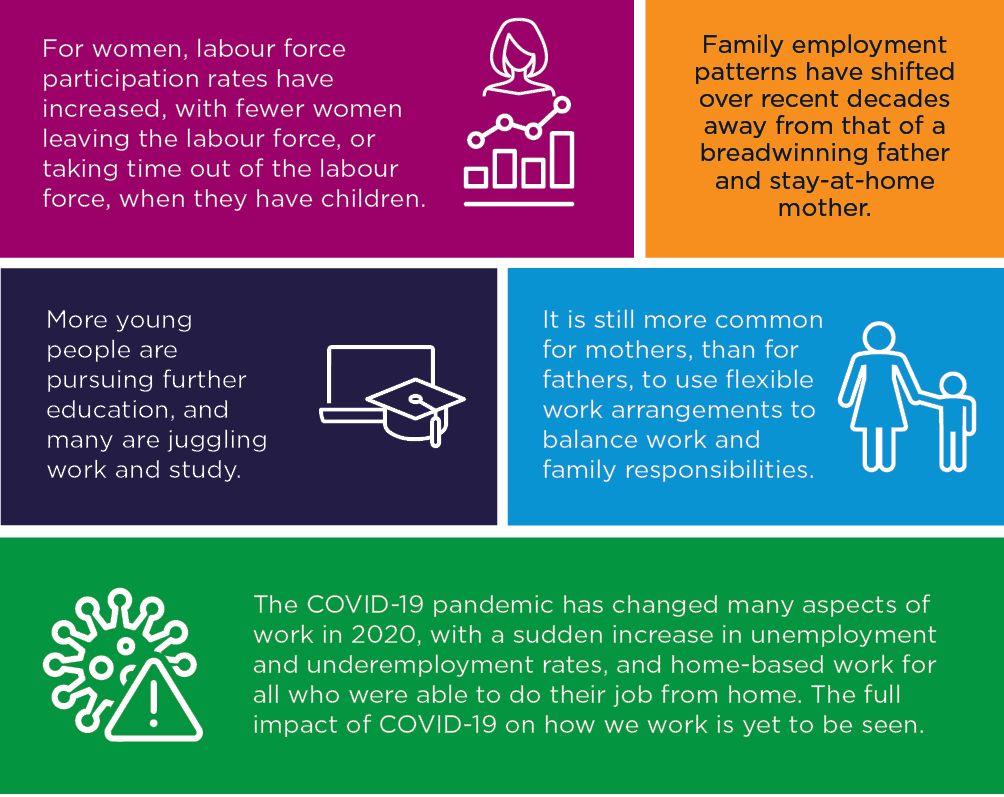
Mothers staying in the workforce
Traditionally, most women stayed in the formal labour force until they got married, then never returned to a paid job. In fact, before 1966, married women could not work in the Commonwealth public service (Australian Bureau of Statistics [ABS], 2012). This trend began to change in the 1970s - women still withdrew from the workforce when they had children, but returned when their children were older.
Several social changes have contributed to the increase in women's participation rates (the proportion of women who are either employed or actively seeking employment) - women are now able to work and progress in a wider variety of jobs as a result of increased access to post-school education and the increased use of contraception to manage fertility (ABS, 2003). Flexible working arrangements (particularly part-time work) and greater availability of child care and maternity leave, means fewer women withdraw completely from the workforce because of child care responsibilities. Demographic changes, including having children later, smaller family sizes, and higher levels of educational attainment have been intertwined with these in employment changes (Baxter, 2013a).
In 1979, female labour force participation had an 'M-shaped' distribution, decreasing among women aged 24-35 years, then increasing for those aged 35-44, before dropping again as women retired (Figure 1). In 2019, with greater access to part-time jobs and child care, there is no longer a dip in women's labour force participation around childbearing age.
Figure 1: Labour force participation rates of women and men, 1979-2019

Source: ABS (various years), Cat. No. 6291.0.55.001. 'Labour Force, Australia', Labour force status by Social marital status, Age and Sex, various years
Credit: Australian Institute of Family Studies 2020
It has also become more common for women to continue in the workforce until their late fifties or early sixties, and more women are remaining in the workforce after the age of 65 - 11% in 2019, compared to 3% in 1979. This is partly due to changes in the qualifying age for the age pension. In 1995, the qualifying age for women was gradually increased from age 60, so that by July 2013 it was 65. Since 2017, the qualifying age for the age pension for men and women has been progressively increased from age 65 so that, by 2023, it will be 67.
Changes for male workers
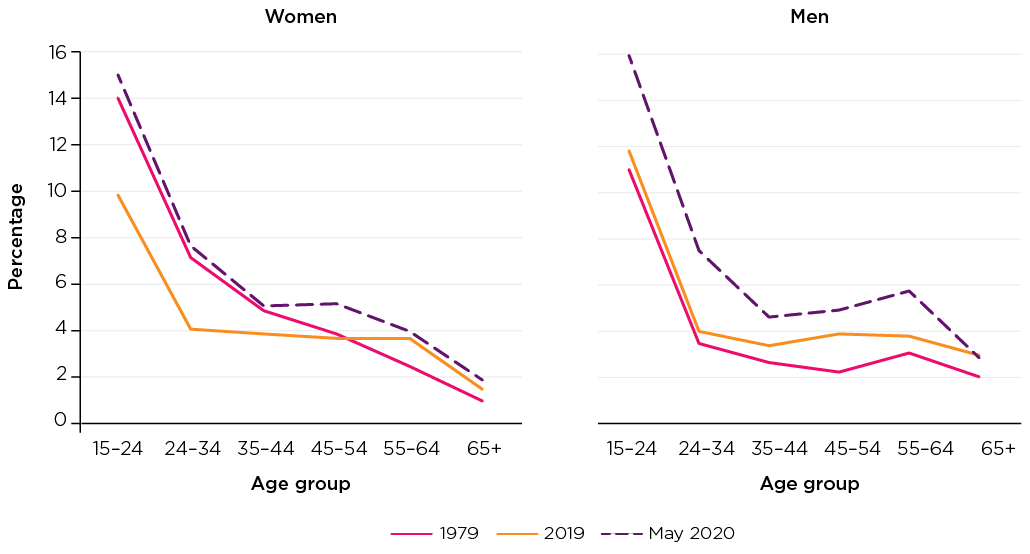
While men's labour force participation rates have changed relatively little over the last 40 years, there are marked differences in employment rates of men during this period. Between 1977 and 1997, the composition of Australian industries changed, and rates of employment in service industries, which are dominated by females, increased substantially, while growth in industries traditionally employing full-time male workers, such as utilities, mining and manufacturing, slowed, resulting in a drop in employment rates for men across all age groups (Commonwealth Treasury of Australia, 1999). In 2019, rates of unemployment for men under the age of 35 are similar to those of 1979, but for men in their forties and fifties, unemployment rates were higher in 2019 than they were in 1979 (Figure 2). On the other hand, for women under the age of 35, unemployment rates were considerably higher in 1979 than they were in 2019.
Figure 2: Unemployment rates of men and women, 1979 to 2019
Source: ABS (2020), Cat. No. 6202.0 'Labour Force, Australia', Table 22. Underutilised persons by Age and Sex
Credit: Australian Institute of Family Studies 2020
 In May 2020, overall unemployment rates increased to 7% for men and 6.9% for women, as a result of job losses due to the COVID-19 pandemic (ABS, 2020a). With higher rates of casual employment among younger people, rates of unemployment have increased to almost 16% for men and women under the age of 25.
Parental employment
One of the most significant social changes over recent decades is the increased labour force participation of mothers. This change can be seen in Figure 3, which shows the employment rates of partnered mothers and single mothers, by age of youngest child, in selected years from 1984 to 2019.
- Employment rates increased over the years for both partnered and single mothers regardless of the age of the youngest child.
- For example, the employment rate increased from 30% in 1984 to 63% in 2019 for partnered mothers whose youngest child was under five years, and from 19% in 1984 to 39% in 2019 for single mothers with a youngest child of the same age.
- Across all the years presented, employment rates for partnered and single mothers increased as the age of the youngest child increased.
- Across all the years presented, the three groups of single mothers were less likely to be employed than partnered mothers whose youngest child was of the same age.
Figure 3: Employment rates of partnered and single mothers with dependent children, by age of youngest child, selected years

Sources: ABS (various years) Labour force and other family characteristics (Cat. no. 6224.0)
Credit: Australian Institute of Family Studies 2020
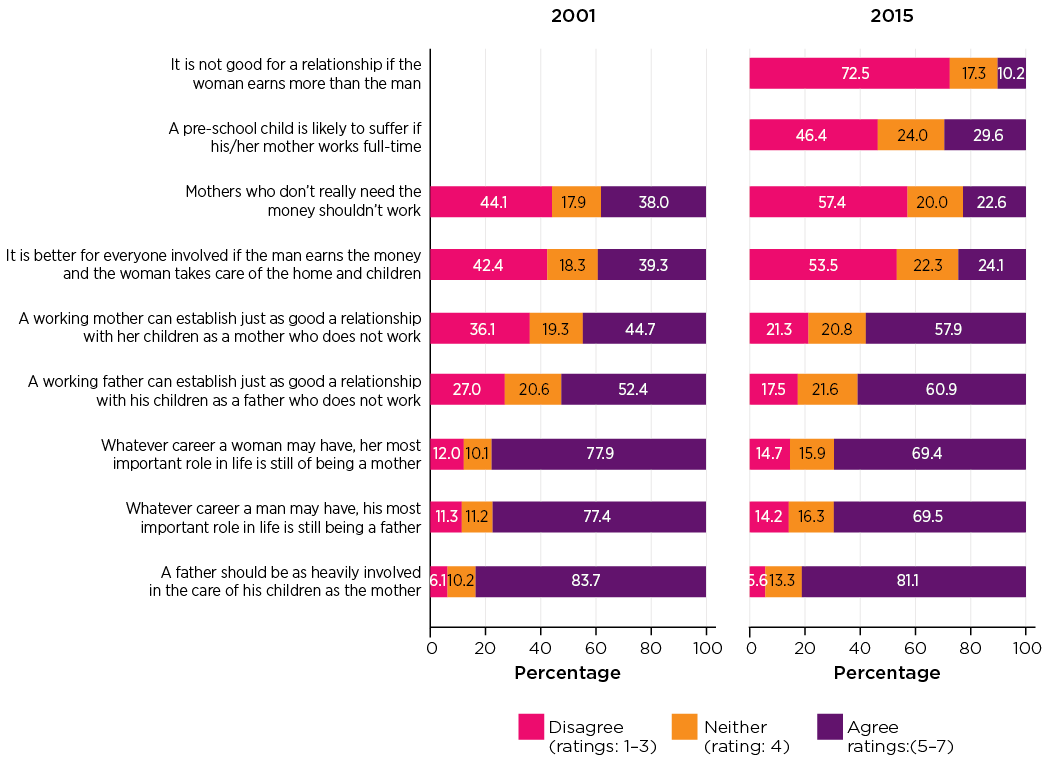
Consistent with trends in the increased labour participation of mothers, changes in community attitudes reflect an overall endorsement of mothers' being in paid work and support for gender equality. Figure 4 shows the extent to which men and women over the age of 15 in 2001 and 2015 agreed with a series of statements that tap into their views about parental employment.
- Regarding mothers' being in paid work:
- Nearly one-half disagreed with the statement 'a pre-school child is likely to suffer if his/her mother works full-time' in 2015.
- More than one half of adults in 2015 (and just under half in 2001) agreed that 'a working mother can establish just as good a relationship with her children as a mother who does not work'. It is worth noting that a similar proportion of respondents agreed with this statement for fathers (i.e. 'a working father can establish just as good a relationship with his children as a father who does not work').
- Regarding statements on gender equality:
- Nearly three-quarters disagreed with the two statements (taken separately): 'it is not good for a relationship if the woman earns more than man'; 'mothers who don't really need the money shouldn't work'.
- A vast majority agreed that 'a father should be as heavily involved in the care of his children as the mother'.
Figure 4: Attitudes towards mothers' employment
Source: Household, Income and Labour Dynamics in Australia (HILDA) Survey 2001 and 2015
Credit: Australian Institute of Family Studies 2020
But some things stay the same
With increased employment among mothers, family employment patterns have shifted over recent decades away from that of a breadwinning father and stay-at-home mother (Baxter, 2019). However, census data show relatively little change in the employment patterns of fathers over the last 25 years (Figure 5). In two-parent households, the majority of fathers worked full-time, with the percentage in part-time work increasing only slightly, from 6% in 1991 to 10% in 2016.
While the number of couple-with-children families featuring two working parents has increased (Figure 6), the allocation of Australian parents' time to paid and unpaid work has remained very gendered, with fathers usually in full-time paid employment, and mothers often employed part-time or not in employment (Baxter, 2013b, 2015). The estimated number of stay-at-home-father families has remained low over the last 40 years. While there was an increase in the percentage of stay-at-home fathers in two-parent households between 1981 and 2001 (1.9% to 4.5%), this increase did not continue, with the percentage of stay-at-home fathers in 2016 (4.6%) similar to that in 2001 (Baxter, 2018).
Only single fathers (see Figure 5) showed more diverse work patterns with higher proportions in part-time work (increasing from 8% of single fathers in 1991 to 15% in 2016). Compared to partnered fathers, it was more common for single fathers to be out of the labour force, with almost a quarter of single fathers in 2016 not employed or actively seeking work. Rates of unemployment were also higher for single fathers, compared to partnered fathers, with 8% of single fathers unemployed in 2016.
Figure 5: Trends in fathers' employment, couple and single fathers, 1991-2016
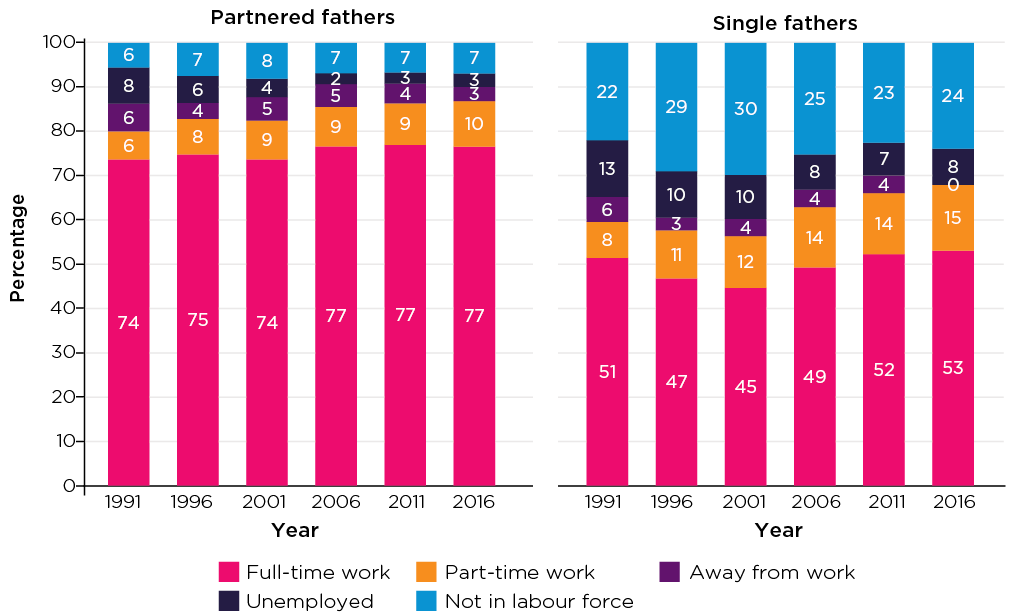
Note: Away from work includes those classified as employed but with work hours of zero or not stated.
Source: Baxter (2019)
Credit: Australian Institute of Family Studies 2020
Figure 6: Couple-parent employment patterns, 1991-2016
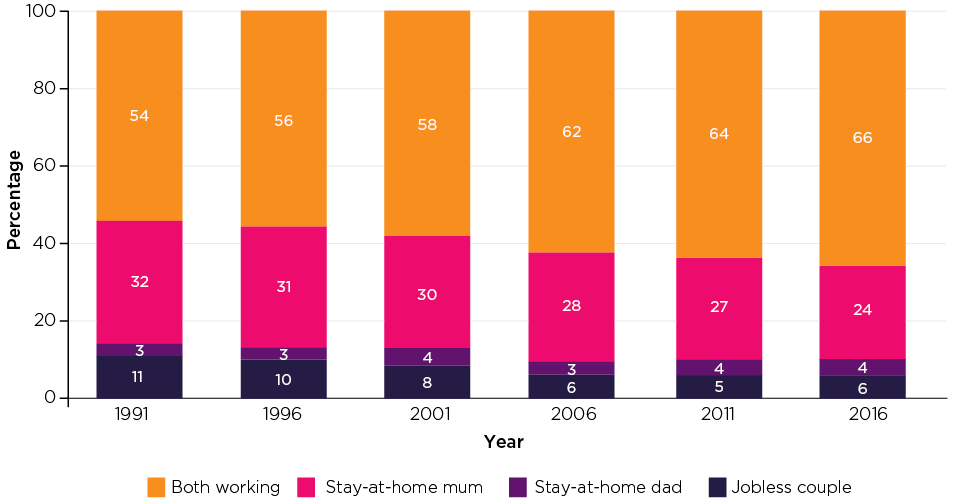
Notes: 'Stay-at-home' parents are those who are not in work who have a partner/spouse who is in work. 'Jobless' families are those in which both parents are not working, including those away from work. 'Both working' indicates both parents spent at least one hour in paid work in the reference period. Excludes families in which either parent's labour force status was not stated. Percentages may not total exactly 100.0% due to rounding.
Source: Baxter (2019)
Credit: Australian Institute of Family Studies 2020
Parents working around caring responsibilities
Fathers today may be more involved in caring for their children than fathers 40 years ago but in most families, the number of hours that fathers spend in employment remains the same before and after having children (Baxter, 2019). This is in sharp contrast to the changes that women experience at this time, when reductions in paid work typically occur, balanced by increases in time on caring and other household work.
Fathers commonly fit parenting and caring for their children around their hours of employment, with weekends providing more opportunity for shared time with their children than weekdays. Mothers' time use patterns are dramatically different, as their time in employment is lowest when they have an under one-year-old child, gradually increasing as their children get older (Baxter, 2019).
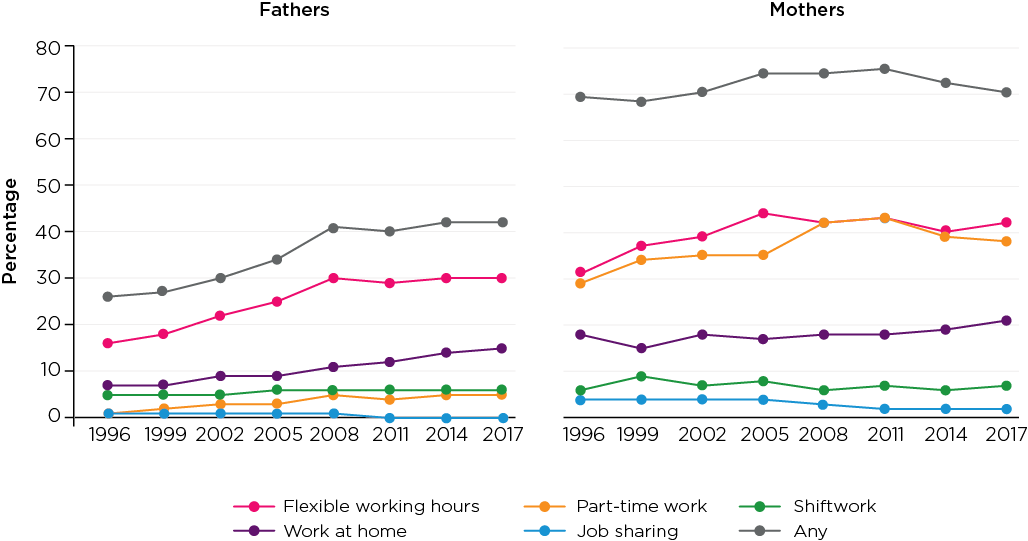
The relatively low uptake of part-time work by fathers, as a means of helping to care for children, is evident in Figure 7, which shows the proportion of mothers and fathers who reported using various types of work arrangements to care for their children. While there was steady growth in the proportion of fathers using some work arrangement to care for children from 1996 through to 2008, this has levelled off since this time. The most common arrangement for fathers is flexible working hours, with around 30% of fathers using this arrangement since 2008. The next most common arrangement for fathers is working at home, with the percentage of fathers working from home so that they can care for their children increasing from 7% in 1996 to 15% in 2017.
Figure 7: Parents' work arrangements, 1996-2017
Source: ABS (2018) 4402.0 - Childhood Education and Care, Australia, June 2017
Credit: Australian Institute of Family Studies 2020
Very few fathers reported working part-time in order to care for children. However, for mothers this was a common arrangement. The percentage of mothers who reported working part-time due to parenting responsibilities increased from 29% in 1996 to 43% in 2011, and has since declined, to 38% in 2017. The percentage of mothers who used flexible working hours and working from home was also higher than that of fathers. In 2017, one in five mothers worked at home, and two in five used flexible working hours to help juggle their work and family responsibilities.
While part-time work, flexible working hours and home-based work are more common for mothers than for fathers, previous research has shown that when mothers work full-time, fathers more often use their own work arrangements to help care for the children, particularly in relation to flexible work, which is much more likely in families where mothers work full-time compared to those where mothers are not employed (Baxter, 2019).
Fewer hours, more flexibility
Over the last few decades, there have not only been changes in how many people are working, but also how many hours we work, and where we work, with more workers, particularly parents, working some hours from home.
More part-time work
With increased levels of female employment, rates of both full- and part-time work are higher for women now than they were 40 years ago (Figure 8). In 1979, more women worked full-time in their teens and early twenties than they do today, with more women participating in further education before moving to full-time work in their mid twenties. Part-time employment is also more common for women now than it was 40 years ago.
The percentage of men who worked full-time was considerably higher in the late 1970s than it is today. In 1979, less than 5% of men aged between 20 and 65 worked part-time. In 2019, part-time work is still much less common for men than for women, but rates of part-time work have increased, particularly among men in their late teens and twenties, and also in the transition to retirement.
Figure 8: Full-time and part-time work, men and women, 1979 and 2019
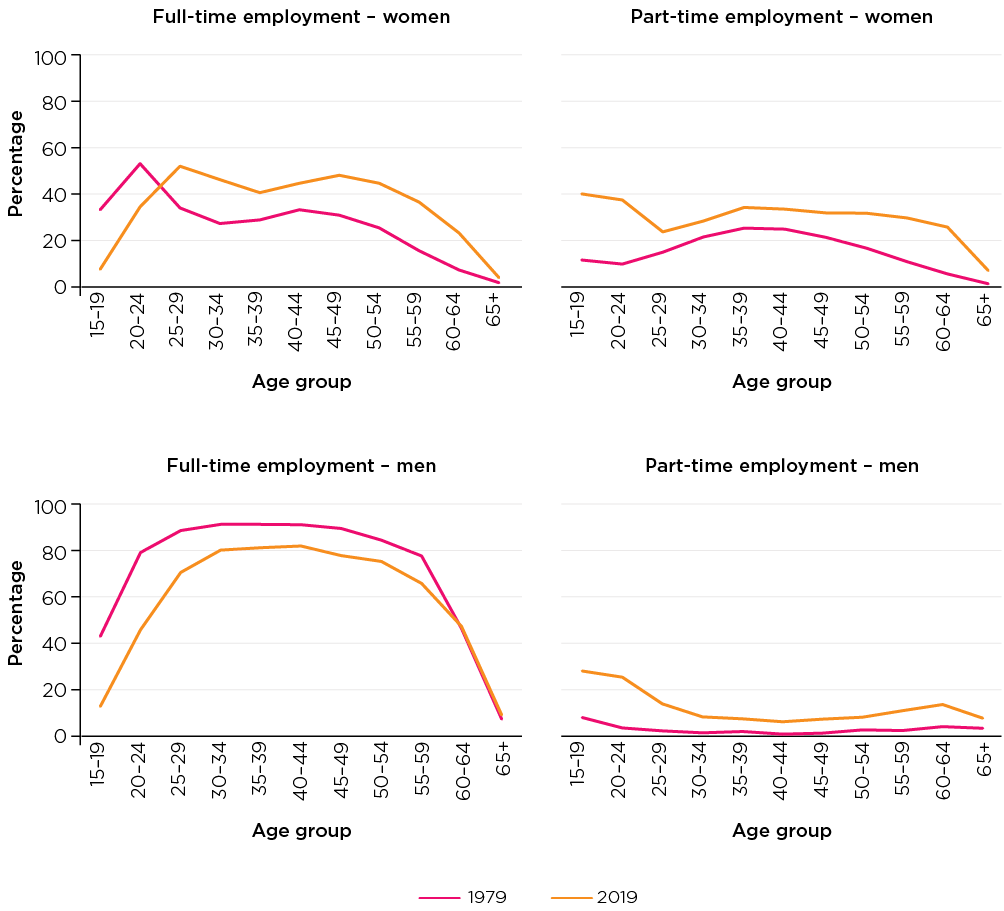
Note: Part-time work is defined as less than 35 hours per week.
Source: ABS (2020a), 'Labour Force, Australia', Labour force status by Social marital status, Age and Sex (Cat. No. 6291.0.55.001)47
Credit: Australian Institute of Family Studies 2020
Compared to part-time work for mothers, part-time work for fathers is more commonly representative of underemployment, rather than a choice. Among those who worked part-time, the main reasons for doing so differed for men and women, and also by age. For men and women under the age of 25, the most common reason for working part-time was to combine work and study. Between the ages of 25 and 45, working part-time because of child care responsibilities was much more common for women than for men. Men more commonly worked part-time because they were combining work and study, they could not find full-time work or because part-time hours were a requirement of their job. For men and women aged 55 and over, working part-time was often part of a transition to retirement; and the most common reason for working part-time was a preference for part-time hours.
However, underemployment (the percentage of employed people who want, and are available for, more hours of work than they currently have) has increased, particularly among young people (Figure 9). In 1979, the rate of underemployment was 2-3% for men across all age groups, and 3-5% for women under the age of 55. By 2019, underemployment rates had increased considerably, particularly for men and women under the age of 25.
Figure 9: Underemployment rates, men and women, 1979 and 2020
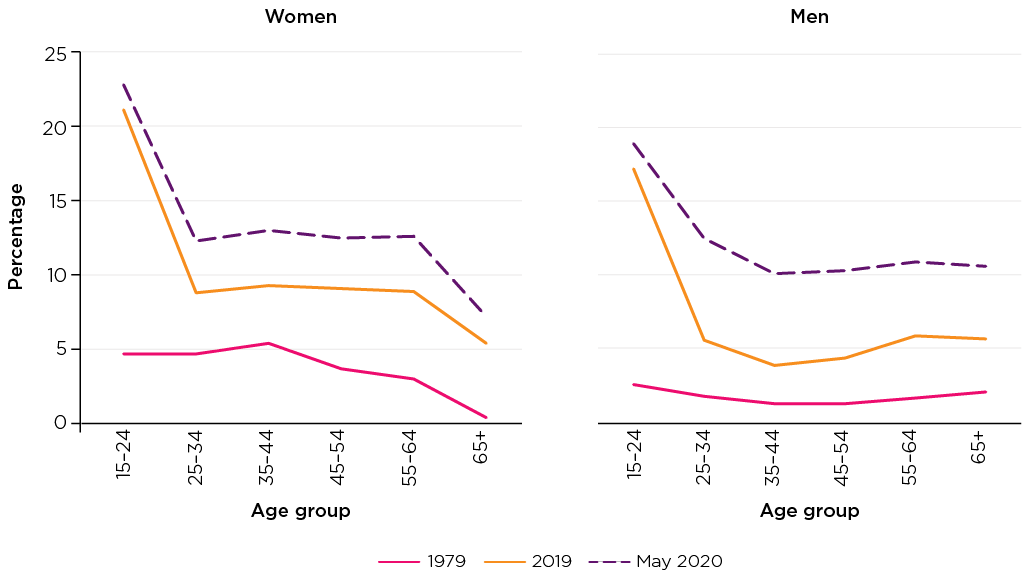
Source: ABS (2020a) Cat. No. 6202.0 'Labour Force, Australia', Table 22. Underutilised persons by Age and Sex
Credit: Australian Institute of Family Studies 2020
In 2020, rates of underemployment increased substantially as a result of the COVID-19 pandemic, with many thousands of workers either being stood down or having their work hours reduced. Among Australians aged over 18 who had a job in the first week of April 2020, 24% worked less hours than usual due to COVID-19; and among those who worked less hours, 60% said it was due to a reduction in the amount of work available, while approximately 15% said it was because they were stood down by their employer. The remaining 25% did so because of other reasons, such as illness or injury or changes in shifts (ABS, 2020b).
As rates of underemployment of men and women under the age of 25 were already relatively high before COVID-19, increases in underemployment were more apparent for men and women over 25, with 12-13% of men aged 25-64, 12.5% of women aged 25-34 and around 10% of women aged 35 and over being underemployed in May 2020.
Working from home
In 1989, 24% of men and 21% of women who were employed did some work from home (ABS, 1989). With advances in information and communication technology making home-based work possible for more people, the percentage of workers who did some work from home had increased to 27.5% of men and 25.3% of women by 2001.1 In subsequent years, rates of home-based work dropped slightly and, in 2018, one in four workers did some work from home.
Among those who worked some hours at home, most worked fewer hours at home than at their workplace (Figure 10). Since the late 1980s the percentage of employees who did some work from home has been slightly higher for men than for women. However, compared to men, a higher percentage of women worked at least half of their hours at home each week. In recent years, this gender difference has become less pronounced - in 2018, 4% of employed men and 6% of employed women worked mainly from home.
Figure 10: Working from home, employed persons, 1989-2018
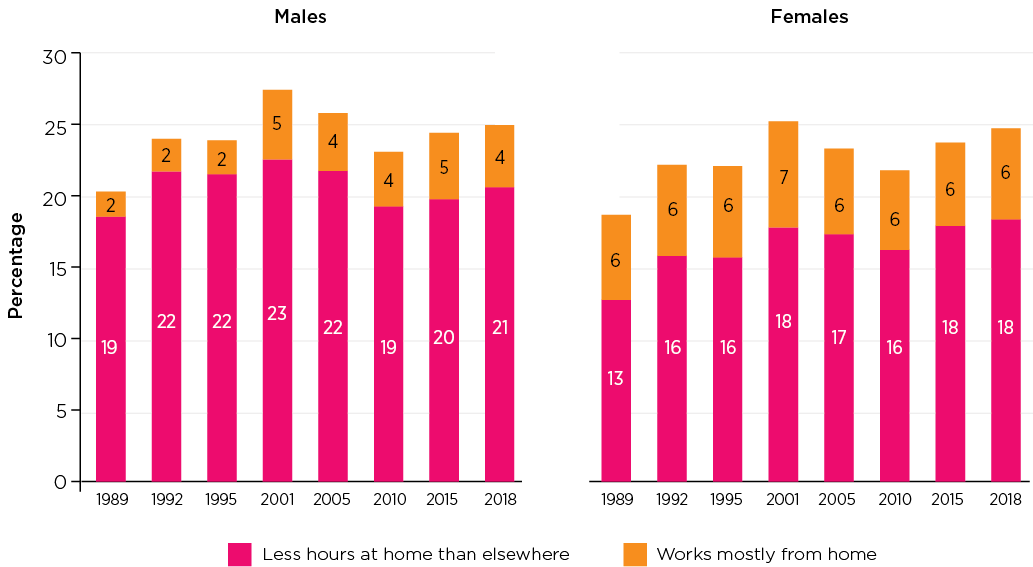
Note: Employed persons working at least 50% of their usual weekly work hours at home were classified as working mainly from home.
Source: ABS Working from home survey (1989, 1992 and 1995) and HILDA 2001 to 2018
Credit: Australian Institute of Family Studies 2020
The COVID-19 pandemic has changed the nature of work in 2020 in many ways, including where we work, with those who were able to work from home doing so for several months, and many workers still having not returned to their usual locations of work at the time of publication. The ABS household impacts of COVID-19 survey found that nearly half (46%) of all Australians who were working in late April to early May were working from home, with 17% increasing their number of hours working from home since COVID-19 (ABS, 2020c). The long-term impact of COVID-19 on where we work is yet to be seen, and it is likely that many workers will continue to do at least some work from home even after the pandemic is over.
For many people, working from home is a way to help balance work and family responsibilities. Even in the late 1980s and early 1990s, home-based work was more common for parents with dependent children than for other workers. For example, in 1989, females accounted for 74% of all workers who were employed at home, with 28% of those working from home saying they did so because of child care responsibilities (ABS, 1989). Data from the HILDA Survey shows that over the past 20 years, rates of home-based work were significantly higher among parents with children under 15, compared to other workers (Figure 11). For example, in 2018, almost a third of employed parents with children under the age of 15 did some work from home, compared to 22% of men and 21.5% of women with no children under 15.
For men, the difference in home-based work, according to parental status, was almost entirely due to fathers doing some of their work at home, rather than working mainly from home. However, for women, both the percentage who did some work from home and the percentage who worked mainly from home was higher for mothers with children under 15 than for other women.
Figure 11: Home-based work, males and females, by parental status, 2001-18
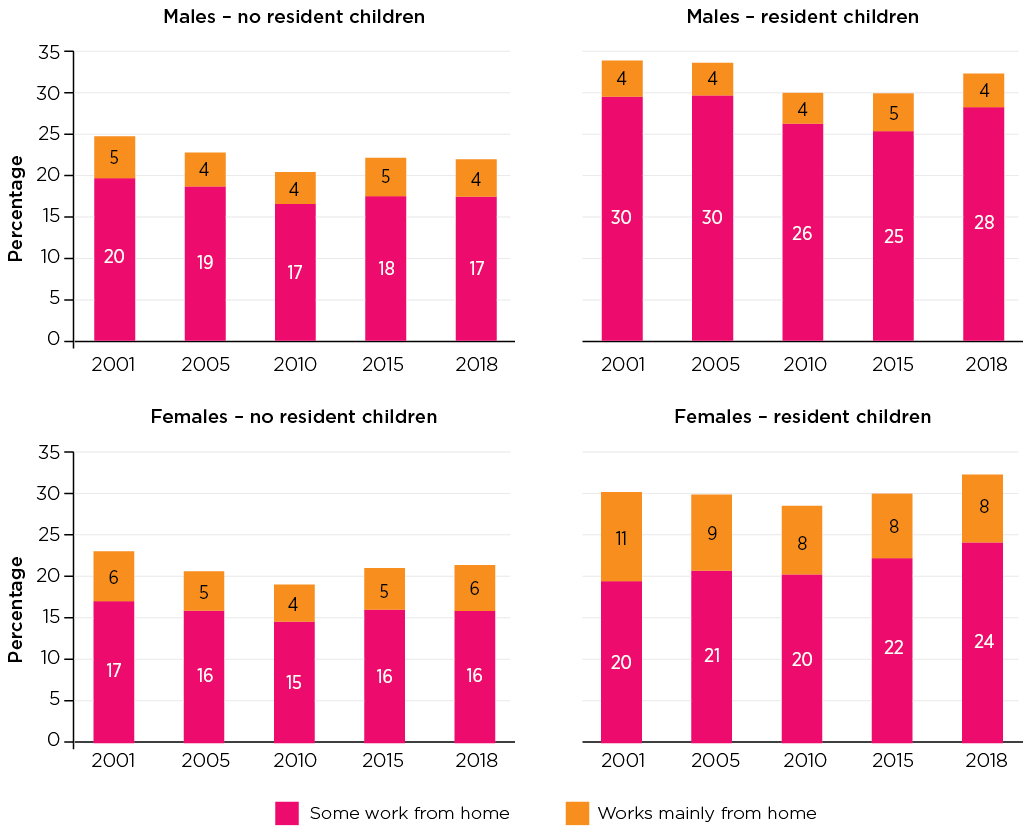
Note: Employed persons working at least 50% of their usual weekly work hours at home were classified as working mainly from home. Resident children are defined as being under the age of 15.
Source: HILDA 2001 to 2018
Credit: Australian Institute of Family Studies 2020
Young people: Juggling work and study
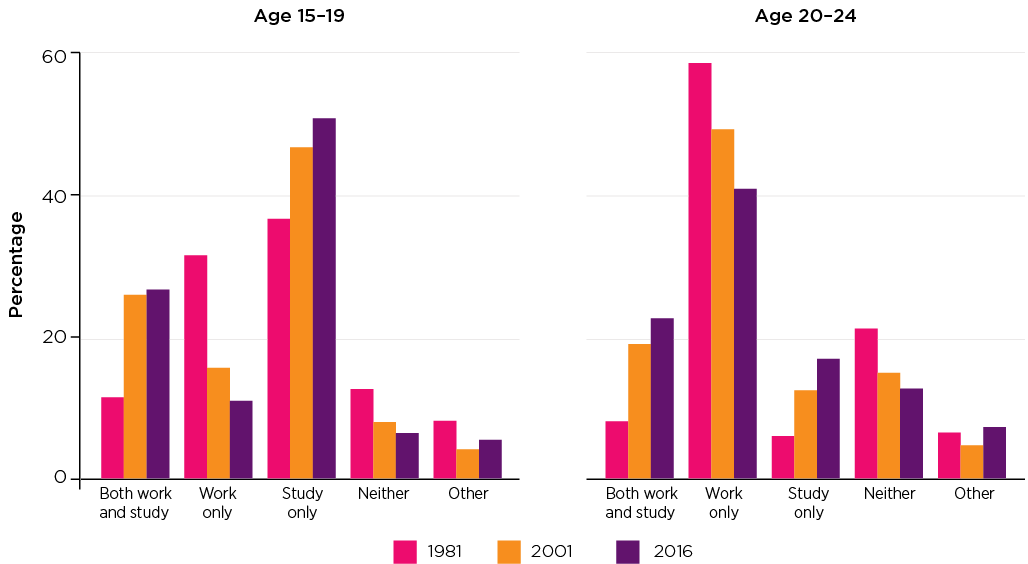
Over the last few decades, an increasing proportion of young people pursue education beyond secondary school, with some doing so by combining study with employment. Figure 12 presents proportions of young people in their late teens and early twenties who were working, studying, or both, across census years.
Figure 12: Young people who were in paid work and/or studying by age, 1981, 2001 and 2016
Credit: Australian Institute of Family Studies 2020 (aifs.gov.au/copyright)
For young people aged 15-19 years:
- In 1981, the most common activity was studying (including continuing secondary school) (37%), followed by working (31%), while 11% were in both education and employment. Taken together, in 1981, just under one half of young people of this age were studying and four in 10 were employed.
- Across the census years from 1981 to 2016, pursuing education with or without combining paid work was on the rise among 15-19 year olds, increasing from 48% in 1981 to 77% in 2016.
- The proportion who were studying (and not working) increased from 37% in 1981 to 51% in 2016.
- The proportion who were studying and working increased from 11% in 1981 to 27% in 2016.
- Across the census years from 1981 to 2016, the proportion of the 15-19 year olds who were in paid work and not studying fell from 31% to 11%. As noted above, an increasing proportion of 15-19 year olds engaged in both studying and employment. Taken together, the proportion of young people in paid work (with or without studying) declined slightly from 43% in 1981 to 38% in 2016.
For young people aged 20-24 years:
- In 1981, most young people of this age were in paid employment and not studying (59%), while 8% were in both education and employment. Only a small minority (6%) were pursuing further education and not working. Together, two-thirds of young people in their early 20s were employed, and 14% were studying. One-fifth were neither studying nor in paid work.
- Over the years, the proportion of young people of this age who were studying increased, either combining study with paid work or without taking on paid work, from 14% in 1981 to 39% in 2016.
- The proportion of young people in their early 20s who were both studying and employed rose from 8% in 1981 to 23% in 2016.
- The proportion of young people of this age who were studying , but not working, increased from 6% in 1981 to 17% in 2016.
- The proportion of young people in their early 20s who were in paid work and not studying fell from 59% in 1981 to 41% in 2016. As mentioned above, combining study and employment was on the rise. The net effect is that the proportion of young people in paid work (with or without studying) fell slightly from 67% in 1981 to 63% in 2016.
- The proportion of young people of this age who were neither studying nor working had declined from 21% in 1981 to 13% in 2016.
References
- Australian Bureau of Statistics (ABS). (various years). 'Labour Force, Australia', Labour force status by Social marital status, Age and Sex (Cat. No. 6291.0.55.001). Canberra: ABS.
- Australian Bureau of Statistics. (1989, 1992, 1995). Persons employed at home, Australia (Cat. No. 6275.0). Canberra: ABS.
- Australian Bureau of Statistics. (2003). Paid work: Changes in labour force participation across generations, Australian Social Trends 2003 (Cat. No. 4102.0). Canberra: ABS. Retrieved from www.abs.gov.au/Ausstats/[email protected]/0/ 4d240d4bbc0e533cca2570ec00006eed?OpenDocument
- Australian Bureau of Statistics. (2012). Fifty years of labour force: now and then. In Yearbook Australia, 2012 (Cat. No. 1301.0). Canberra: ABS.
- Australian Bureau of Statistics. (2020a). Labour force, Australia, unemployment and underemployment. (Cat. No. 6202.0). Canberra: ABS.
- Australian Bureau of Statistics. (2020b). Household Impacts of COVID-19 Survey, 1-6 April 2020 (Cat. No. 4940.0). Canberra: ABS.
- Australian Bureau of Statistics. (2020c). Household Impacts of COVID-19 Survey, 29 April-4 May 2020 (Cat. No. 4940.0). Canberra: ABS.
- Baxter, J. (2013a). Employment and the life course: analyses of birth cohort differences of young Australian women. In Evans, A., & Baxter, J. H. (Eds.) Negotiating the life course: Stability and change in life pathways, (pp. 99-120). Springer, Netherlands.
- Baxter, J. (2013b). Parents working out work (Australian Family Trends No. 1). Melbourne: Australian Institute of Family Studies.
- Baxter, J. (2015). Gender role attitudes within couples, and parents' time in paid work, child care and housework. In Growing Up in Australia: The Longitudinal Study of Australian Children Annual Statistical Report 2014. Melbourne: Australian Institute of Family Studies.
- Baxter, J. (2018). Stay-at-home fathers in Australia (Research Report). Melbourne: Australian Institute of Family Studies.
- Baxter, J (2019) Fathers and work: A statistical overview (Research summary). Melbourne: Australian Institute of Family Studies. Retrieved from aifs.gov.au/aifs-conference/fathers-and-work
- Commonwealth Treasury of Australia. (1999). Recent movements in the labour force participation rate. Economic Roundup (Summer). Canberra: Commonwealth of Australia.
1 Estimates for 2001 and 2018 based on HILDA Survey data.
The HILDA project was initiated and is funded by the Australian Government Department of Social Services (DSS) and is managed by the Melbourne Institute of Applied Economic and Social Research. The findings and views based on these data are those of the authors and should not be attributed to either DSS or the Melbourne Institute.
Featured image: © GettyImages/andresr
11 August 2020