Parents working out work
You are in an archived section of the AIFS website
Overview
This fact sheet presents statistical information on parents’ employment patterns, and their use of child care, leave and other work arrangements.
Key messages
-
In 2011, 68% of couple mothers and 57% of single mothers were in paid employment.
-
Part-time work was the dominant choice for mothers, with 36% of working mothers employed part-time, compared to 25% full-time.
-
The average age of the child at mother’s return to work was 6.5 months.
-
Fathers took less leave at the time of birth and used a mix of leave types including parental, annual and unpaid leave.
-
Child care provision was essential for many parents’ ability to manage work and care.
Introduction
For families with children, the employment of parents is vital to address the wellbeing of family members. Increasingly, when we consider parental employment, it is not only fathers' employment that is of concern, but also mothers'. How parents work out work applies both to those families with two parents in the workforce and those with a single parent working.
This facts sheet presents statistical information about trends in parents' engagement in paid work, examining mothers' and fathers' employment patterns. We provide detailed information about jobless families. Further, the ways in which families manage their work and care responsibilities is analysed, through presentation of statistics on their use of child care, paid parental and other leave, and other working arrangements.
The report draws heavily on the Australian Population Census data from 1991 through to 2011, available from the Australian Bureau of Statistics (ABS).1 Additional data sources are used throughout to gain insights beyond those that can be gleaned from the Census.
1 See Australian Bureau of Statistics. (2012). Census: Data and analysis. Canberra: ABS. Retrieved from <tinyurl.com/c6l63lz>. Most Census data presented here are derived from custom data reports.
Mothers in employment: The last 30 years
One of the very significant changes that has occurred within Australian families over recent decades has been the considerable growth in maternal employment. This sustained growth is apparent across the last 30 years of Census data, which are collected every five years. Among families with children aged under 18 years old, the proportion of mothers who were employed increased from 55% in 1991, to 56% in 1996, 59% in 2001, 63% in 2006 and 65% in 2011.
The percentage of mothers employed for each of these years is shown by the age of their youngest child in Figure 1.
- Increases in maternal employment participation have been apparent at all ages of youngest children.
- In each year, the steepest increase in maternal employment by age of youngest child was from when children were under one year to when they were one year old, after which time employment rates increase more gradually.
- Note that being employed does not necessarily mean being at work, as "employed" includes those on leave (see Figure 3).
Figure 1: Mothers' employment rates, by age of youngest child, all mothers, 1991-2011
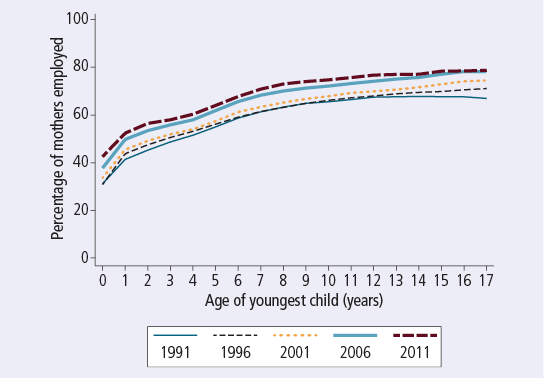
Source: Australian Population Census, ABS, various years (custom data reports)
Of continuing interest is to what extent some mothers are less able to engage in paid employment than others. Single parents may have particular difficulties since they do not have a co-resident parent with whom they can share the parenting responsibilities. For families with children aged under 18 years in 1991, 57% of couple mothers and 44% of single mothers were employed. Between 1991 and 2011, the employment rate of couple mothers increased to 68%, an increase of just over 10 percentage points. For single mothers in 2011, the employment rate was 57%, an increase of 13 percentage points; that is, single mothers' employment participation grew at a faster rate than couple mothers' over this time.
Figure 2 shows trends in employment rates for couple and single mothers by age of youngest child.
- Couple and single mothers' employment participation broadly followed the same pattern seen in Figure 1, but single mothers' employment rates were lower at all ages of youngest children within the same year.
- As with couple mothers, the employment participation of single mothers increased over these periods. Between 2001 and 2011, a very large increase was apparent for single mothers of children aged 6 years and over.
Figure 2: Mothers' employment rates, by age of youngest child, couple and single mothers, 1991-2011
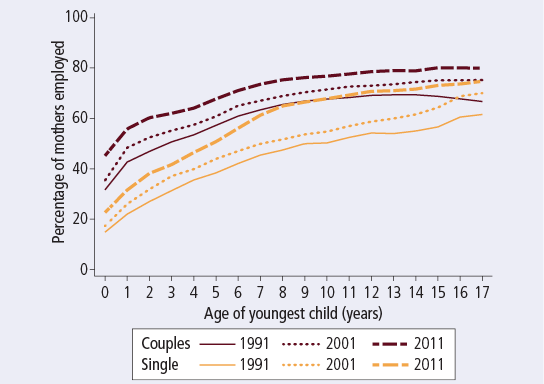
Source: Australian Population Census, ABS, various years (custom data reports)
One of the key features of maternal employment in Australia is the use of part-time work. In 1991, 28% of mothers were in part-time work and 23% were in full-time work.2 The percentage in part-time work increased to 31% in 1996, 32% in 2001, 35% in 2006 and 36% in 2011. The percentage in full-time work grew more slowly, from 23% of mothers in 1991 to 25% in 2011.
Focusing just on mothers with children aged under 6 years old, Figure 3 shows employment disaggregated into full-time and part-time hours, by age of youngest child. Also shown in this figure is the percentage who had a job but were away from work at the time of the Census.
- Part-time work was more prevalent than full-time work for mothers with children at each age shown, and as the youngest child grew older, increases in employment participation were explained by higher percentages of mothers being employed in part-time work. This was true in each of the Census years shown.
- The percentage in full-time work did, however, also increase as children grew older.
- For mothers with children aged under 6 years old, there was little growth in full-time work over the period 1991 to 2011, with only slight increases for mothers of children aged 2 years and over.
- The percentage who were away from work was most relevant to mothers with children aged under one year. This especially reflects mothers who were on some form of maternity or parental leave. The percentage with children under one year old who were away from work increased markedly from 1991 to 2011. In fact, when this is taken into account, the percentage of mothers of children under one year old who were employed and at work did not change over this period.
Figure 3: Employment rates of mothers with youngest child aged under 6 years, by employment status and age of youngest child, all mothers, 1991-2011
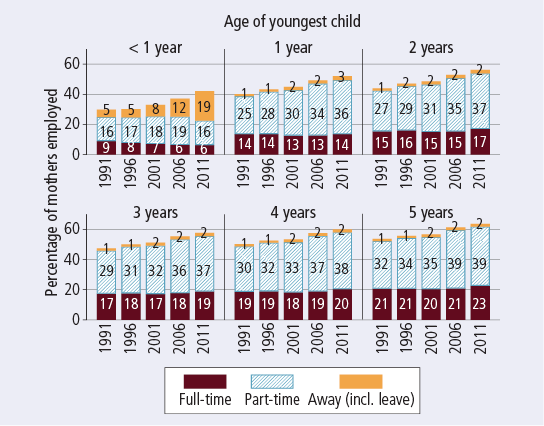
Note: Excludes mothers with labour force status or hours not stated.
Source: Australian Population Census, ABS, various years (custom data reports)
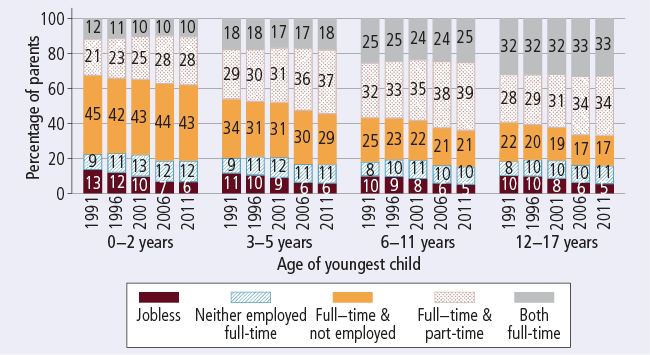
Taking a broader perspective, but incorporating information on mothers' relationship status, increases in part-time work were apparent for children in other age groups, and were apparent for single and couple mothers (Figure 4).
- Full-time work became more common as children grew older, with mothers slightly more likely to be in full-time than part-time work when their youngest child was 12-17 years.
- There were small increases in mothers' full-time work over this period, although this was not apparent for those with a youngest child aged 0-2 years, and was most apparent for mothers with children aged 12-17 years.
- For mothers with a youngest child aged 6 years and over, increases in full-time work were greater for single mothers than couple mothers.
Figure 4: Employment rates of couple and single mothers, by employment status and age of youngest child, 1991-2011
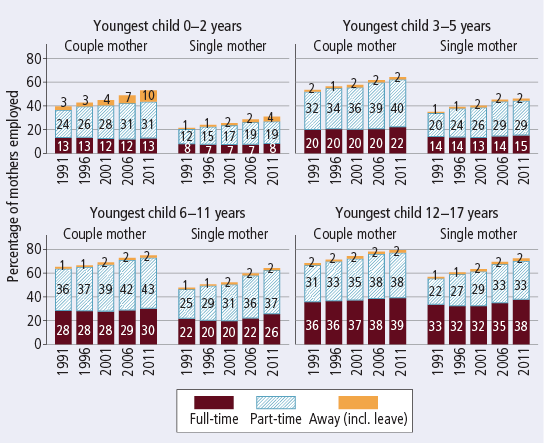
Note: Excludes mothers with labour force status or hours not stated.
Source: Australian Population Census, ABS, various years (custom data reports)
In 2011, among all single mothers with children aged under 18 years, 31% were in part-time work and 24% were in full-time work. Among all couple mothers with children aged under 18 years, 38% were in part-time work and 25% were in full-time work.
Fathers and couples in employment: The last 30 years
While fathers' employment does not tend to vary according to ages of children, this employment is vital to the financial wellbeing of most Australian families. There have been changes over the last 30 years in rates of paternal participation in employment, which largely reflect the occurrence of recessions at different times in this history. In 1991 and 1996, 86% of fathers with children aged under 18 years were employed. Since then employment rates have increased slightly, to 87% in 2001, and 90% in 2006 and 2011.
Combining information on fathers' and mothers' employment participation in couple families is particularly useful for gaining insights into the way in which parents organise their paid work and time spent on caring for children (Table 1).
- Over the period 1991-2011, there was no increase in the percentage of families with two full-time employed parents.
- The most significant change in family-level employment over this period was the increase in the percentage of families with one parent employed full-time and the other part-time. In most cases it was the mother working part-time.
- Around one in ten couple families had some connection to employment, although neither parent was in full-time work. Most of these families had one or both parents employed part-time, but in some families both parents were away from work.
- The percentage of couple families that were jobless reduced from 11% in 1991 to 6% in 2011. This largely reflects higher rates of paternal employment over this time.
| 1991 (%) | 1996 (%) | 2001 (%) | 2006 (%) | 2011 (%) | |
|---|---|---|---|---|---|
| Both full-time | 21.4 | 21.1 | 20.4 | 20.9 | 21.0 |
| Full-time and part-time | 27.0 | 28.4 | 30.4 | 33.6 | 34.0 |
| Full-time and not employed (or away from work) | 31.8 | 29.7 | 29.0 | 28.4 | 28.3 |
| One or both employed, but neither in full-time employment | 8.6 | 10.4 | 11.4 | 10.9 | 11.1 |
| Neither at work, but at least one employed (and away from work) | 1.2 | 1.3 | 1.7 | 1.5 | 1.6 |
| Part-time & not employed (or away from work) | 4.6 | 5.8 | 6.4 | 5.8 | 5.9 |
| Both part-time | 2.8 | 3.3 | 3.4 | 3.6 | 3.7 |
| Jobless | 11.2 | 10.3 | 8.8 | 6.1 | 5.6 |
| Total | 100.0 | 100.0 | 100.0 | 100.0 | 100.0 |
Note: Excludes parents with labour force status or hours not stated. Parents who are "away from work" are employed, by definition (see Table 2). "Jobless" includes unemployed and not in the labour force. Percentages may not total exactly 100.0% due to rounding.
Source: Australian Population Census, ABS, various years (custom data reports)
Figure 5 shows couple-level employment by age of youngest child.
- The percentage of families in which both mother and father were working full-time increased with the age of youngest child, from around one-tenth of families with children aged 0-2 years, to around one-third of families with children aged 12-17 years.
- The percentage of families with one parent employed full-time and the other part-time also increased with age of youngest child.
- The percentage with one parent employed full-time and the other not employed decreased markedly as the age of youngest child increased.
- The percentage with neither parent in full-time employment did not vary greatly by age of youngest child, although it was slightly lower in families with older children.
Figure 5: Family-level employment rates, father and mother participation for couple families, by age of youngest child, 1991-2011
Note: Excludes parents with labour force status or hours not stated. Percentages may not total exactly 100% due to rounding.
Source: Australian Population Census, ABS, various years (custom data reports)
2 The percentages in part-time and full-time work do not add to the total percentage in employment, as there were small numbers away from work or with not-stated hours who were also counted as being employed.
Mothers' return to work after a birth and parents' use of paid parental and other leave
Mothers with a youngest child aged under one year include those with a newborn through to those with a child approaching their first birthday. There is considerable variation in employment within this group, reflecting different patterns of return to work by mothers. A recent data collection on this topic is the Baseline Mothers Survey (BAMS).3 This survey included 2,587 mothers who had babies in October or November 2009 and who would have met the eligibility requirements for the government Paid Parental Leave (PPL) scheme if it had been in place at the time of the birth.4 Regarding the timing of mothers' return to work in this study:
- 71% had returned to work by the time of the survey, about 13 months after the birth of their child; and
- the average age of the child at return to work was 6.5 months for those mothers who had returned to the same job that they had worked in prior to the birth.
The use of different forms of leave after the birth of a child is one of the ways in which mothers can maintain their connection to employment while taking time away from the workplace to care for children. The ABS conducted the Pregnancy and Employment Transitions Survey in 2011, which surveyed mothers of at least one child under two years of age at the time of interview (Figure 6).5 The survey included mothers who had their child prior to the introduction of PPL, as well as those who had their child after the introduction of PPL.
- An estimated 132,000 mothers with a child aged less than 2 years were employees in a job while pregnant, and took paid maternity leave after the birth of their youngest child. This represented 41% of all mothers with a child aged less than 2 years who were employees in a job while pregnant.
- A considerably higher percentage of mothers who had been employed in the public sector were entitled to paid maternity leave and used that leave (75%), compared to mothers who had worked in the private sector (31%). Note, however, that the private sector figures exclude owner-managers.
- A higher proportion of mothers who had worked as employees in the private sector permanently left their job before the birth of the child (28% compared to 15% of those in the public sector).
Figure 6: Mothers' use of paid maternity leave, by sector of employment while pregnant, 2011
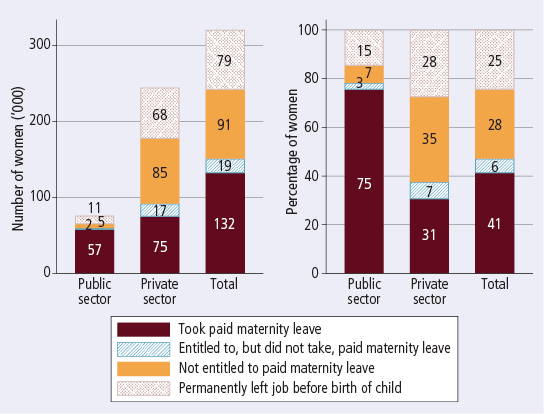
Note: Percentages may not total exactly 100% due to rounding. Excludes owner managers, who were not asked about maternity leave use.
Source: ABS, 2012
Fathers take less leave at the time of a birth than do mothers, and tend to use a mix of types of leave, rather than just paternity or parental leave.6 Mothers who were eligible for PPL in the BAMS (described above) reported on their partners' leave eligibility and use. According to this survey:7
- 31% of their partners were employed (referred to as "employed fathers" here) and had access to employer-paid parental leave at the time of the birth:8
- 92% of these fathers used employer-paid parental leave after the birth;
- most fathers took 1-2 weeks' leave (35%) or 2-4 weeks' leave (31%);
- a majority of the employed fathers had access to paid holiday or annual leave (62%) and, of these fathers, most (80%) used some of this leave at the time of the birth; and
- 45% of the employed fathers used unpaid paternity leave provisions, compared with 81% of the mothers.
3 See Martin, B., Hewitt, B., Baird, M., Baxter, J., Heron, A., Whitehouse, G. et al. (2012). Paid Parental Leave evaluation: Phase 1 (Occasional Paper No. 44). Canberra: Department of Families, Housing, Communities and Indigenous Affairs.
4 The main eligibility criteria for PPL is that mothers have to have been working in a paid job for at least 10 of the 13 months before the child's birth.
5 Australian Bureau of Statistics. (2012). Pregnancy and employment transitions, Australia, Nov 2011 (Cat. No. 4913.0). Canberra: ABS.
6 See Rush, P. (2013). Dad and Partner Pay: Implications for policy-makers and practitioners (CFCA Paper No. 12). Melbourne: Child Family Community Australia.
7 See Martin et al. (2012) (details in footnote 3).
8 Technically, this also refers to the time of the adoption in the case of adoptive parents, but for simplicity we refer only to births.
Jobless parents
Parents who are not in paid employment may have a range of reasons for this. Some may prefer to be in employment, but are out of employment because of difficulties in finding work. This, for example, is reflected in the percentage of mothers and fathers who are unemployed. Others are classified as being not in the labour force, which includes those who are out of employment to focus on caring for children or relations with an illness or disability, as well as those who are not actually looking for employment. Here, we refer to parents who are either unemployed or not in the labour force as being "jobless".
Table 2 shows that most mothers who had been jobless over the Census years were classified as being not in the labour force, with the percentage of mothers who were classified as unemployed declining from 1991 to 2011. For fathers, there was a much smaller percentage who were jobless, especially for those not in the labour force. Like mothers, though, the percentage of fathers who were unemployed declined across these Census years.
| 1991 (%) | 1996 (%) | 2001 (%) | 2006 (%) | 2011 (%) | |
|---|---|---|---|---|---|
| Mothers | |||||
| Employed | 55.2 | 56.5 | 58.9 | 63.2 | 65.2 |
| At work | 53.4 | 54.7 | 56.5 | 60.3 | 61.4 |
| Away from work | 1.8 | 1.8 | 2.4 | 2.9 | 3.8 |
| Jobless | 44.8 | 43.5 | 41.1 | 36.8 | 34.8 |
| Unemployed | 5.7 | 4.6 | 4.0 | 3.6 | 3.7 |
| Not in the labour force | 39.1 | 38.9 | 37.1 | 33.1 | 31.0 |
| Total | 100.0 | 100.0 | 100.0 | 100.0 | 100.0 |
| Fathers | |||||
| Employed | 85.7 | 85.7 | 86.7 | 89.8 | 90.0 |
| At work | 83.9 | 83.7 | 84.2 | 87.6 | 87.7 |
| Away from work | 1.8 | 2.0 | 2.5 | 2.2 | 2.3 |
| Jobless | 14.3 | 14.3 | 13.3 | 10.2 | 10.0 |
| Unemployed | 8.3 | 6.3 | 4.4 | 2.7 | 2.7 |
| Not in the labour force | 6.0 | 8.1 | 8.9 | 7.5 | 7.2 |
| Total | 100.0 | 100.0 | 100.0 | 100.0 | 100.0 |
Note: Excludes parents with labour force status not stated. Percentages may not total exactly 100.0% due to rounding.
Source: Australian Population Census
While we do not consider them here to be jobless, some employed parents reported that they were away from work. As we saw in Figure 3, this particularly applied to parents who were on leave to have a new baby, but could also be found at any age of child.
Putting the information on parental joblessness together with information about family structure, Figure 7 shows that:
- there was a decline, from 1991 to 2011, in the percentage of families who were jobless couple families - from 9% of all families to 4% of all families;
- the percentage of families that were employed couple families (that is, with at least one employed parent) remained relatively stable over this period;
- much of the change was actually related to the overall increase in the percentage of families that were single-parent families - from 19% of families in 1991, to 26% of families in 2011; and
- there was an increase in the percentage of employed single-parent families from 1991 to 2011, while the percentage of jobless single-parent families fluctuated between 10% and 12%.
Figure 7: Employment rates of couple and single-parent families, by employment status, 1991-2011
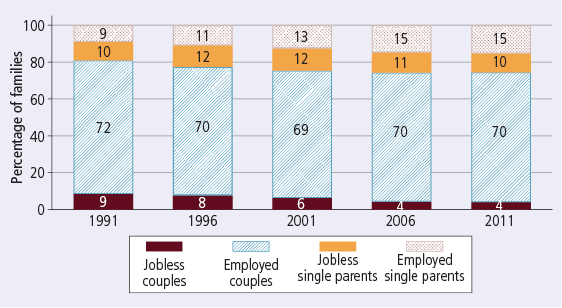
Note: Note that figures exclude families in which labour force status was not stated for the mother or father. Percentages may not total exactly 100% due to rounding.
Source: Australian Population Census, ABS, various years (custom data reports)
The number of families in each of the family employment groups is shown in Figure 8.
- The number of jobless couple families declined from around 181,000 in 1991 to 99,000 in 2011.
- The number of jobless single-parent families was lowest in 1991 (213,000), highest in 2001 (278,000), and between 250,000 and 260,000 for the other years.
- The number of employed couple and single-parent families increased over this period.
Figure 8: Employment numbers of couple and single-parent families, by employment status, 1991-2011
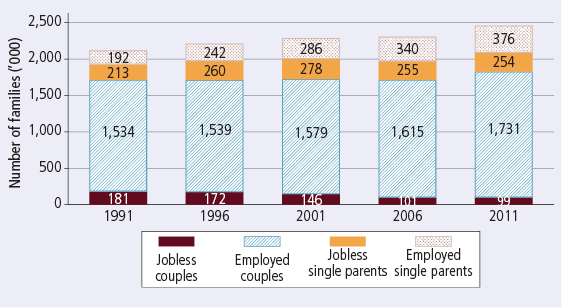
Note: Note that figures exclude families in which labour force status was not stated for the mother or father.
Source: Australian Population Census, ABS, various years (custom data reports)
In Table 2, the labour force data for mothers showed that most jobless parents were not in the labour force, rather than being unemployed. Nevertheless, tracking the particular difficulties faced by unemployed parents is important. One useful indicator for those who are unemployed is the duration of unemployment, with long-term unemployment being defined as having been looking for work for 12 months or more. Figure 9 focuses on single mothers, using another ABS data source to examine trends in the nature of joblessness for these mothers from 2005 to 2011.
- Clearly, like jobless mothers generally, far more jobless single mothers were not in the labour force, rather than unemployed.
- The estimated number of long-term unemployed single mothers was 7,200 in 2012, which was less than the estimates for 2010 (8,100) and 2011 (9,800).
- Some single mothers who were classified as not in the labour force would have been out of employment for 12 months or more, and so these estimates of long-term unemployed are not equivalent to likely estimates of "long-term jobless" single mothers.
Figure 9: Jobless single mothers, by labour force status and duration of unemployment, 2005-12
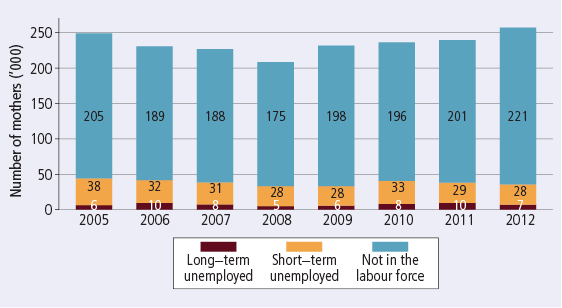
Note: Single mothers include those with children aged under 15 years or other dependent children. Data for June in each year have been reported.
Source: ABS, Labour Force Status (ST FM1) by Sex, State, Relationship; and Unemployed Persons (ST FM4) by Sex, Duration of Unemployment, Relationship (both extracted March 2013)
Family-level joblessness data provide some insights into the extent of joblessness experienced by children. Another way to examine this is to consider the number of children who are living in jobless families. According to the 2011 Census, including only children aged up to 12 years old:9
- 316,194 children were living in jobless single-parent families (10% of all children aged up to 12 years); and
- 159,154 children were living in couple families in which both parents were jobless (5% of all children aged up to 12 years).
Growing Up in Australia: The Longitudinal Study of Australian Children (LSAC) also provides some insights concerning parents who are not in paid employment. Parents in LSAC Waves 2 to 4 who did not have a job were asked why they were not working. This includes parents who were unemployed as well as those not in the labour force. Across jobless mothers and fathers with youngest children aged 0 to 11 years:10
- 83% of mothers and 21% of fathers cited reasons related to their family or preference, such as preferring to care for children;
- 11% of mothers and 5% of fathers said the reasons related to finances - their partner earned enough, or it would not be worthwhile working because of the cost of child care or concerns that they would lose benefits;
- very small percentages of mothers and fathers (< 2%) said it was because of difficulties in finding suitable child care;
- 8% of mothers and 24% of fathers cited reasons related to being unable to find suitable work (jobs that are suitable, of interest or flexible enough); and
- the selection of the "other reasons" response was particularly common for fathers (52% compared to 15% of mothers). Additional information provided by respondents indicated that, among other factors, this included ill health, disability and caring for others.
When these data are examined by age of youngest child, Figure 10 shows that:
- reasons related to family or preference were the most common reasons given by not-employed mothers of the youngest children;
- as the age of the youngest child increased, an increasing proportion of mothers cited "other" and job-related reasons;
- as children grew older, a decreasing proportion of fathers cited job-related reasons for being not employed, while the rate of "other" reasons being given increased.
Figure 10: Jobless mothers' and fathers' reasons for not working, by age of youngest child, couple families with children aged 0-11 years, 2006-10
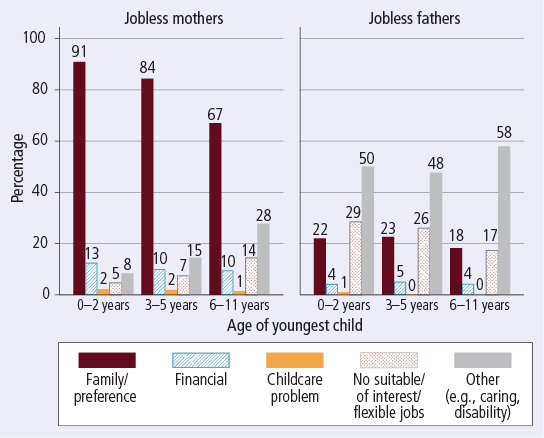
Note: Parents could nominate more than one reason for working. Data are reported for parents who are unemployed or not in the labour force.
Source: LSAC Waves 2 to 4
9 These estimates were derived from 2011 Census data using Tablebuilder.
10 LSAC is conducted in a partnership between the Department of Families, Housing, Community Services and Indigenous Affairs (FaHCSIA), the Australian Institute of Family Studies (AIFS) and the Australian Bureau of Statistics (ABS). The findings are those of the authors and should not be attributed to FaHCSIA, AIFS or the ABS.
Employment and caring for children
With the increased participation by mothers in paid work in recent decades, the availability of child care has become an important concern. In Australia, child care may be provided through formal means (such as long day care, family day care and outside-school-hours care) or informal means (such as grandparents or other relatives, friends or neighbours). In addition, in the year before full-time school (and sometimes earlier than this), most children attend early childhood education (ECE).11
Children's involvement in care and/or ECE varies with age and with mothers' employment status (Figure 11). There have also been significant changes in child care/ECE participation over time. Analyses of the 1984 and 1993 ABS Child Care Surveys and the 2011 Childhood Education and Care Survey (CEaCS) shows that: 12
- for children aged under one year old who had employed mothers, participation in child care/ECE did not change across these time periods;
- for children aged one to four years, participation in child care/ECE increased most between 1984 and 2011, and increased for children of both employed and not-employed mothers; and
- for school-aged children, participation in child care was lower in 2011 than in 1993 and 2005.
Figure 11: Participation rates of children in formal/informal care or ECE, by mothers' employment status and age of child, 1984-2011
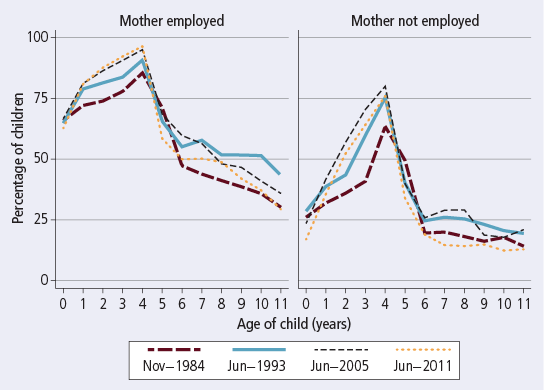
Note: Mothers who were employed but away from work were counted as not employed.
Source: ABS, 1984, 1993 Child Care Survey & 2011 CEaCS (confidentialised unit record files)
Child care/ECE data are also summarised in Table 3, for three broad age groups and their mothers' employment status.
- Across all age groups, increases over time in the percentages of children participating in any type of child care reflect a larger proportion being in formal care or ECE, rather than informal care.
- For children aged 0-2 years, there was a very significant growth over time in the use of formal child care. Nevertheless, informal care was still very often used for children in this age group.
- Formal care or ECE was very common among children in the 3-5 year age group. The use of formal care and ECE also grew significantly over time for this age group, whether mothers were employed or not-employed, while at the same time the use of informal care dropped.
- For school-aged children, formal care was least often used by children with not-employed mothers, but among children with employed mothers the rate of use grew considerably over time.
- Across all the age groups, the use of informal care was lower in 2011 than in previous years.
| Mother employed | Mother not employed | |||||
|---|---|---|---|---|---|---|
| 1984 (%) | 1993 (%) | 2011 (%) | 1984 (%) | 1993 (%) | 2011 (%) | |
| Child aged 0-2 years | ||||||
| Any care | 71.3 | 76.0 | 82.2 | 31.1 | 36.5 | 32.8 |
| Formal care | 19.5 | 29.7 | 54.6 | 4.6 | 10.1 | 16.9 |
| Informal care | 58.9 | 59.8 | 49.3 | 27.7 | 29.9 | 20.1 |
| Child aged 3-5 years | ||||||
| Any care | 78.1 | 80.2 | 82.7 | 51.0 | 58.4 | 61.0 |
| Formal care/ECE | 48.8 | 55.0 | 71.2 | 34.8 | 43.1 | 51.3 |
| Informal care | 49.7 | 55.0 | 41.4 | 24.3 | 30.4 | 20.0 |
| Child aged 6-11 years | ||||||
| Any care | 38.9 | 51.6 | 43.4 | 17.7 | 23.4 | 20.2 |
| Formal care | 2.8 | 9.9 | 19.7 | 0.5 | 1.5 | 5.0 |
| Informal care | 36.5 | 45.9 | 30.3 | 17.2 | 22.3 | 16.7 |
Note: More than one type of care could be nominated. Mothers who were employed but away from work were counted as not employed.
Source: ABS, 1984, 1993 Child Care Survey & 2011 CEaCS (confidentialised unit record files)
Focusing just on the ABS data for 2011, Figure 12 shows the percentage of children in any formal care (regardless of whether they were also in ECE or informal care), the percentage in ECE (regardless of whether they were also in informal care), and then the percentage only in informal care. These sum to the percentage of children in some care or ECE arrangement.
- The proportions of children spending time in any child care or ECE were greatest when they were 3-4 years old (the year or two before commencement of full-time school), particularly among children of employed mothers.
- In families with not-employed mothers, children were in ECE and no other formal care at a higher rate than families with employed mothers.
- A higher proportion of children aged less than one year with employed mothers were only in informal care, rather than formal care, while almost one-third of these children were looked after only by their parents (not in any type of care).
- School-aged children had relatively low rates of usage of non-parental care, with many only being in informal care, even when mothers were employed.
Figure 12: Children's use of formal/informal child care or ECE, by age of child and mothers' employment status, 2011
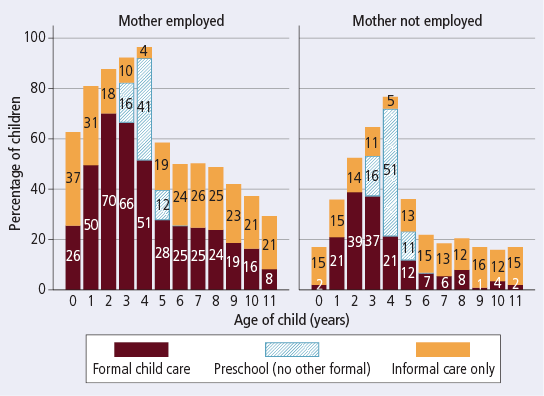
Note: Mothers who were employed but away from work were counted as not employed. Formal child care includes long day care, family day care, outside school hours care or other formal care, but not ECE. Data labels for categories <1% have been removed.
Source: ABS 2011 CEaCS (confidentialised unit record file)
While child care provision is, for many families, integral to their ability to manage work and care, parents also rely on their own working arrangements to address their caring responsibilities. In the ABS CEaCS, parents were asked what working arrangements they had used to care for their children.
In 2011, of employed mothers with a youngest child aged up to 11 years:
- 43% used part-time work;
- 44% used flexible work hours;
- 19% worked at home;
- a smaller percentage used shift work (7%) or another arrangement (4%); and
- 24% used no arrangement
Of employed fathers with a youngest child aged under 11 years:
- 5% used part-time work;
- 30% used flexible work hours;
- 12% worked at home;
- a smaller percentage used shift work (6%) or other arrangement (2%); and
- 58% used no arrangement.
Figure 13 shows that the arrangements used varied somewhat by age of youngest child.
- For mothers, part-time work and working from home were more common among those with the youngest children, while use of flexible work hours was most common for mothers of children aged 6-11 years.
- For fathers, differences by age of youngest child were not large, although the percentage using none of these arrangements declined as age of youngest child increased. This reflects a very slight increase in reporting using the different types of working arrangements as children grew older.
Figure 13: Working arrangements that parents use to care for children, by age of youngest child, mothers and fathers, 2011

Note: Parents could nominate more than one of these working arrangements.
Source: ABS 2011 CEaCS (confidentialised unit record file)
11 The main objective of ECE is to provide an early education for children, to help prepare them for school, and so differs from other formal care. While ECE hours may not match the hours of employment for all mothers, they can nevertheless provide some opportunities for mothers to use that time to undertake paid work.
12 Estimates from these surveys have been derived from the confidentialised unit record files from these surveys.
Conclusion
This facts sheet has highlighted some of the trends in parental employment and joblessness within families. Clearly, there is considerable evidence of change over the period examined here, with increases in the percentages of parents (especially mothers) in paid employment, and also broader changes in family composition, with the growth in single-parent families. These data also document the use of child care, parental leave and other working arrangements that parents make use of when working out their work and care responsibilities.
Dr Jennifer Baxter is a Senior Research Fellow at the Australian Institute of Family Studies.
Baxter, J. (2013). Parents working out work (Australian Family Trends No. 1). Melbourne: Australian Institute of Family Studies.
978-1-922038-23-4
1 April 2013