What is family?
Australian views on what makes a family.
Overview
The findings of the Families in Australia Survey conducted in late 2021 provide useful insights on aspects of Australian families.
Key messages
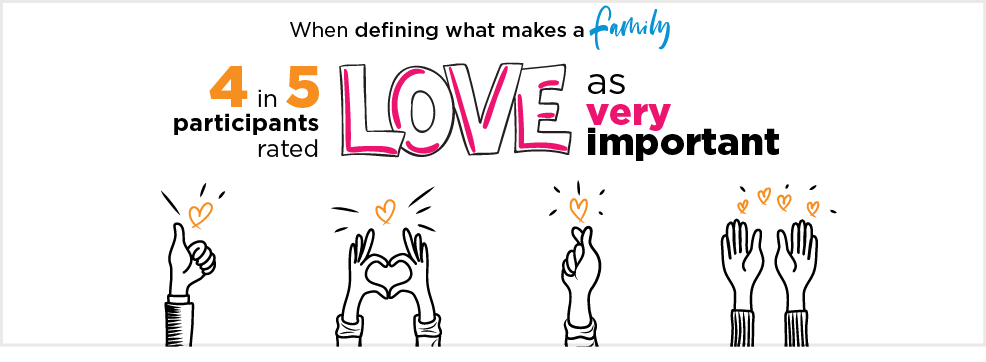
Participants were more likely to rate love as very important in defining what makes a family than any other characteristic, with 4 in 5 (79%) rating it as very important. Those with children and/or grandchildren were more likely to rate love as very important compared to those without (80% vs 70%).
Unconditional, non-judgemental support was very important to 2 out of 3 participants (67%), though women were more likely to rate it as very important compared to men (69% vs 52%).
Aboriginal and/or Torres Strait Islander people were much more likely to rate legal ties or obligations as important or very important compared to non-Indigenous Australians (48% vs 30%).
LGBTQ+ people were almost twice as likely to rate blood or genetics as not important at all in defining a family compared to others (32% vs 17%).
Cultural and linguistic minority Australians were more likely to rate common experiences and activities as very important compared to others (29% vs 19%).
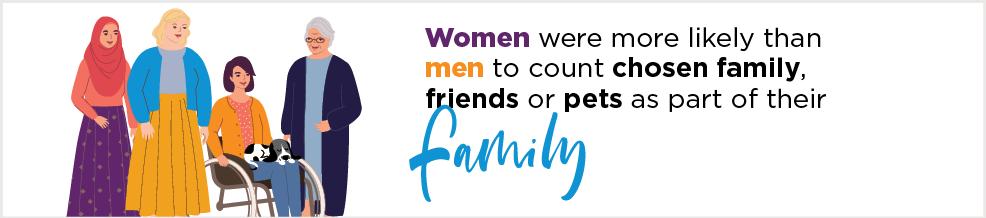
Chosen family or close friends were nominated as part of the family by 41% of participants. Aboriginal and/or Torres Strait Islander people were much more likely to do this compared to non-Indigenous Australians (62% vs 42%).
Pets were part of the family for 52% of participants. LGBTQ+ people were more likely than others to include pets as part of their family (59% vs 50%).
Pets were part of the family for 52% of participants. LGBTQ+ people were more likely than others to include pets as part of their family (59% vs 50%).
The Interwar generation were also significantly less likely than other generations to include chosen family, friends or pets as part of their family (48% vs 66%).
Families in Australia
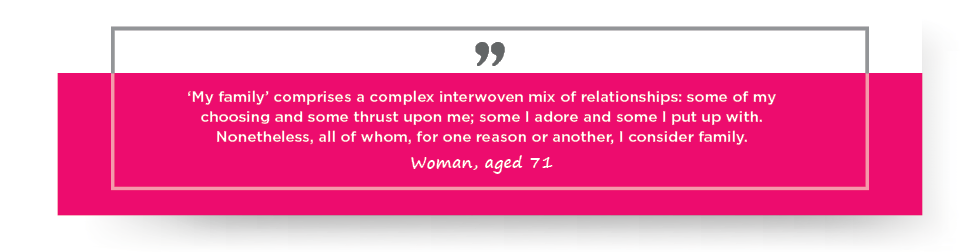
Defining ‘family’ is not straightforward. While the legislation in various contexts provides definitions of family and relationships and outlines obligations and entitlements, the way individuals experience and understand family in their day-to-day lives can be very different. How Australians define family and decide who is included in their kinship circles is influenced by these legal definitions but also shaped by culture and personal life experiences and circumstances. People may also have multiple definitions of family and group these into different sets of people with different values and functions – for example, their ‘birth family’, their ‘in-laws’ or their ‘chosen family’.
![Quote 2: Quote: It’s hard to define ... I’d consider my partner, child and pets my ‘core family’ and [my] parents, siblings, grandparents and in‑laws ‘extended family’. Woman, aged 30](/sites/default/files/2023-09/Q2-wide2.png)
Cultures, values, social expectations and laws have all changed over time and vary from place to place. For example, while marriages and families were once guided by, and created through, obligation and tradition, today relationships are increasingly shaped and defined by love, satisfaction and individual choices (Beck & Beck-Gernsheim, 1995; Coontz, 2005; Giddens, 2002). Legal recognition of mixed-sex de facto relationships occurred in a piecemeal way through the late 1970s and 1980s (Fehlberg et al. 2015). Federal legislation passed in 2008 formally recognising de facto relationships across a range of contexts and included de facto same-sex relationships for the first time (Fehlberg et al., 2015). While non-marital de facto relationships and family are increasingly common in Australia (Qu, 2020a), this definition of ‘family’ is not universally accepted around the world – culturally or legally.
In Australia, the culture and expectations around having children in one’s family have also shifted; women are having fewer children and there has been a rise in families who have no children (Qu, 2020b). Meanwhile, more of us are creating ‘chosen families’ with non-biological kin and/or those not recognised as family by law (Weeks, Heaphy & Donovan, 2001), and are increasingly including animals as members of our family (Animal Medicines Australia, 2019; Bogdanoski, 2006; Irvine & Cilia, 2017). Nevertheless, while definitions of family continue to shift, some Australians may continue to hold more traditional views such as those that define family as being only people who are connected to us by blood and/or law.

The Families in Australia Survey
This research report presents some findings from the fourth Families in Australia Survey conducted by the Australian Institute of Family Studies from 4 November to 13 December 2021. The Families in Australia Survey series aimed to better understand family relationships, connections and support, and the things that Australian families do together or within their communities, such as work and study.
The survey was open to all Australians aged 18 and over and had almost 6,000 participants. While the survey was not representative of the Australian population, it nevertheless provides useful insights on aspects of Australian families.
Other publications from the fourth survey have explored the impacts of COVID-19 on children and the significant events in families’ lives during 2021 and how they felt about 2022. This publication highlights how participants defined their family and who they included in it.
Questions on what defines a family
The fourth Families in Australia Survey included a set of questions about what family means to participants and who they included in their family. Central to this analysis, Families in Australia survey participants were asked to rate how important they considered the following when defining what makes a family:1
- love
- unconditional, non-judgemental support
- common experiences and activities
- shared values, beliefs and traditions
- legal ties or obligations
- blood/genetics.
Of the participants, a final sample of 4,436 was selected for analysis. This sample included only those participants who provided an importance rating for all 6 characteristics of defining a family and enough information to determine their age (generation), gender, whether they had children/grandchildren, LGBTQ+ status, Aboriginal and/or Torres Strait Islander status, and cultural and linguistic minority Australian status (See Appendix A for further details about the sample).
An ordinary least-squares regression was conducted to test for any significant differences in how participants with various demographic characteristics rated the importance of each of the 6 elements in defining what makes a family (Appendix B).
Free-text comments
The survey also provided several opportunities for respondents to write detailed comments in answer to questions relating to their family. This report uses selected comments from 3 main questions to add further insights to the quantitative findings:
- Can you tell us what about the questions was difficult or didn’t work for your family?
- Is there anything you would like to note about COVID-19 impacts on your child/ren, on you as a parent, or the way you parent, and/or family rules and expectations?
- Would you like to provide a comment about your family or household relationships?
Each quoted comment is accompanied by the attributes of the participant relevant to the topic being discussed.
What makes a family?
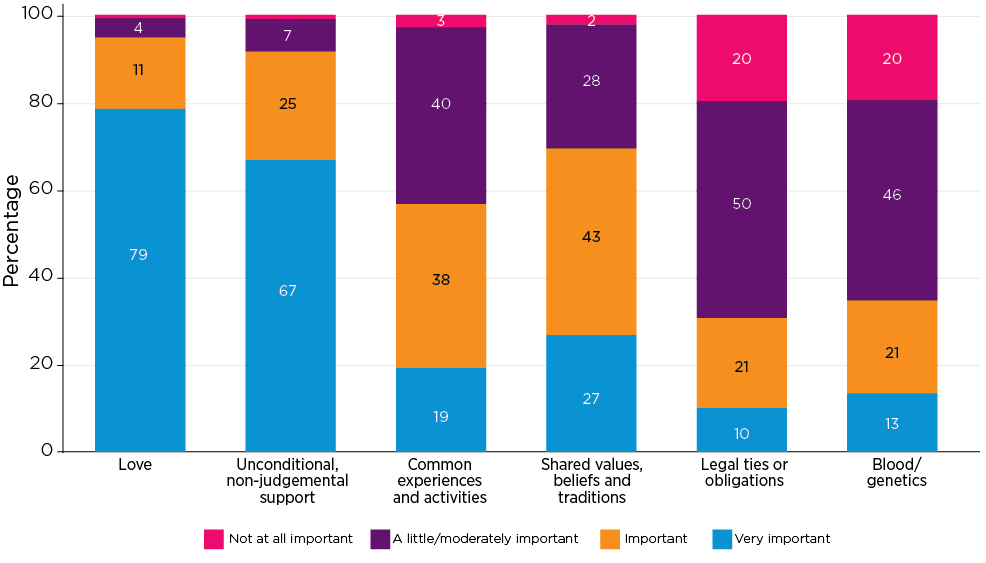
Almost all participants considered love (95%) and unconditional, non-judgemental support (92%) as either ‘important’ or ‘very important’ when defining what makes a family (Figure 1).
While not as universal, a majority of participants also considered shared values, beliefs and traditions (70%) and common experiences and activities (57%) as either ‘important’ or ‘very important’. While participants had evenly divided views on the importance of legal ties or obligations and blood/genetics; overall, they rated them as the least important characteristics when defining a family.
Figure 1: Love and unconditional, non-judgemental support were rated as very important in defining a family
Participant rating, by percentage, of the importance of 6 items in defining what makes a family
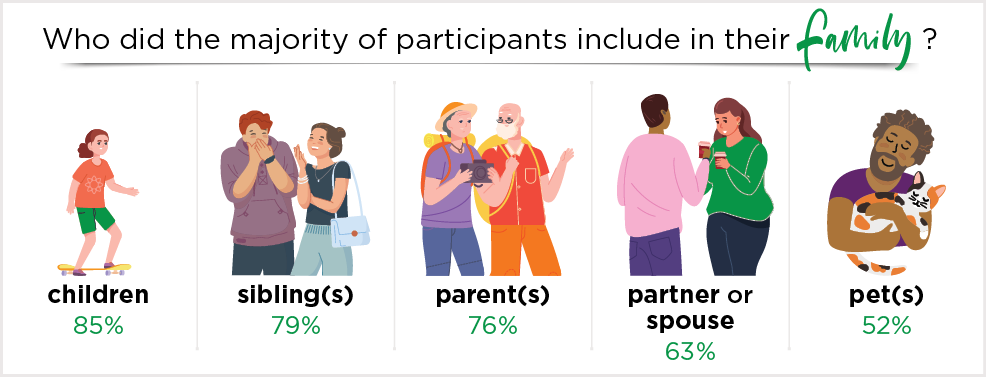
Participants were also asked to indicate ‘which of the following are included when you think about your family’ and provided with a list of 14 options (Figure 2).2 A majority of participants indicated that when they think about their family, they include children (85%), sibling(s) (79%), parent(s) (76%), partner or spouse (63%), and half included pet(s) (52%).
Responses to this question are likely to reflect who is currently in their family rather than their more general view of who comprises family (e.g. a person may not have a partner/spouse right now and so may not have selected this choice).
Figure 2: Half of participants included pets as part of their family
Percentage of participants who included the following as part of their family
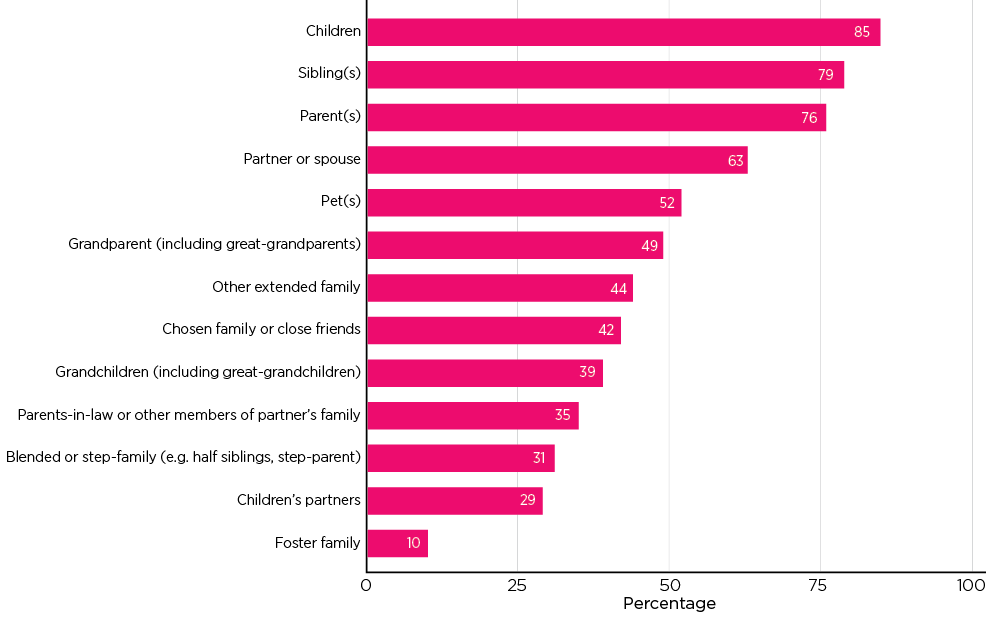
Notes: Less than 1% (n = 41) selected ‘Other’ and provided a written response that could not be coded into the above presented categories. The majority of these ‘other’ responses that were not recoded included ‘donor families’, ‘adopted family’ and ‘ex-partners’.
Gender differences
Many more women than men completed the Families in Australia Survey.3 Among the participants, men and women had significantly different views on what was important for 4 of the 6 characteristics of defining family (Figure 3). The most significant difference identified was that women were much more likely to rate unconditional, non-judgemental support as very important compared to men (69% vs 52%).
My partner is the only person who will support me unconditionally and knows what I experience, and who cares. So when discussing family, it is discussing my relationship with my partner only. – Woman, aged 50, Regional Australia
Women were also significantly more likely than men to consider love as very important when defining what makes a family (80% vs 70%).
There are a lot of times where home life feels very dysfunctional and lots of disagreements between the children, which feels very hard for me [to] mediate, but I know we all love each other. – Woman, aged 38, Regional Australia
Figure 3: Men were more likely to rate blood and genetics as important
Participant rating of how important the 6 items are in defining what makes a family, by gender
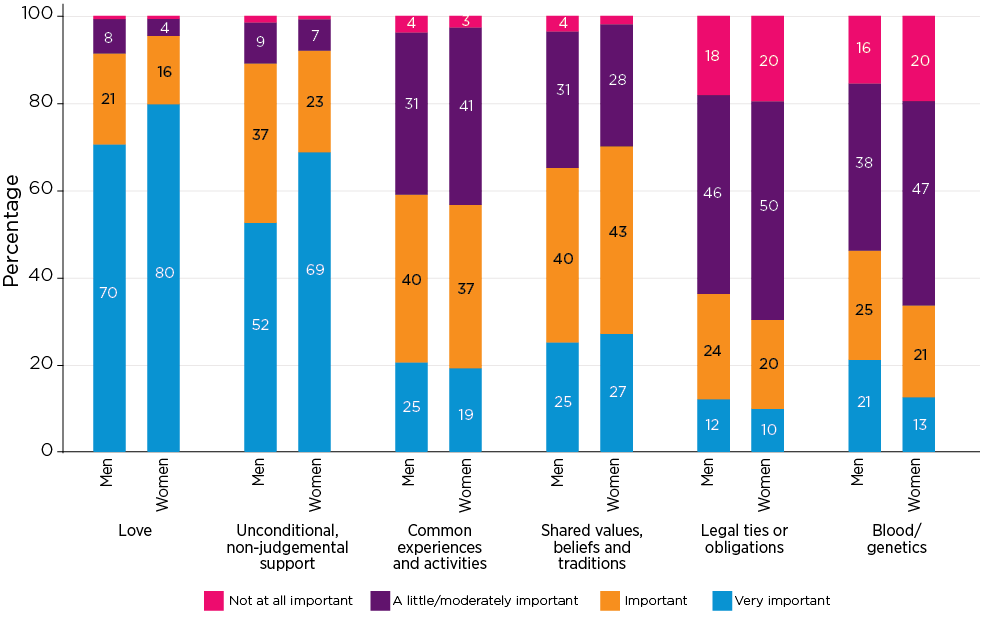
Note: An ordinary least-squares linear regression (see Appendix B) revealed that there was a statistically significant difference in men and women’s rating of the importance of ‘love’, ‘unconditional, non-judgemental support’, ‘shared values, beliefs, and traditions’ and ‘blood/genetics’.
In contrast, men were significantly more likely than women to consider blood and genetics very important in defining a family (21% vs 13%). It is not surprising then, that women were significantly more likely than men to report that chosen family or close friends are included when they think about their family (43% vs 31%). Similarly, women were significantly more likely than men to report that pets are included when they think about their family (54% vs 38%).
My blood family are problematic. My chosen family and close friends are light years closer in terms of values and beliefs. – Woman, aged 61, Regional Australia
Finally, women were significantly more likely than men (but to a lesser extent than the previous characteristics) to view shared values, beliefs and traditions as important or very important (70% vs 65%).
Our relationship is very strong and is built on shared values, trust and empathy. We also have several shared interests, which really helps. – Woman, aged 37, Regional Australia
However, there were no significant differences in how men and women rated the importance of the other 2 characteristics of defining a family: common experiences and activities, and legal ties of obligations.
Aboriginal and/or Torres Strait Islander people’s family definitions
Aboriginal and/or Torres Strait Islander participants4 had significantly different views to the non-Indigenous participants on the importance of ‘legal ties or obligations’ when defining family. Almost half (48%) rated ‘legal ties or obligations’ as important or very important compared to just 30% of other participants (Figure 4). However, for all other characteristics of defining family, Aboriginal and/or Torres Strait Islander participants were not significantly different to the non-Indigenous participants.
When asked who they included as part of their family, Aboriginal and/or Torres Strait Islander participants were significantly more likely than non-Indigenous participants to report that ‘chosen family or close friends’ were included in their family (62% vs 41%). However, free-text comments indicated that while many included chosen members in their family, their extended kinship networks were often determined as much by obligation as individual choice.
I wish I could remove certain people from my extended kinship network. I don’t consider them family. But other people consider them my family. – Woman, aged 26, Aboriginal
Aboriginal and Torres Strait Islander collectivist kinship systems are dynamic and complex social structures that define how individuals relate to each other in terms of their roles, responsibilities and obligations (Lohoar, Butera, & Kennedy, 2014). For example, Aboriginal and Torres Strait families often have a collectivist approach to child rearing where raising children is seen as the collective responsibility of all members of their community who are seen as ‘family’ (Lohoar et al., 2014; Secretariat of National Aboriginal and Islander Child Care [SNAICC], 2011).
However, it is important not to over-generalise Aboriginal and/or Torres Strait Islander people’s views on family, as the way family ties are understood can differ by language, social or nation group (Lindsay & Dempsey, 2009). Aboriginal and Torres Strait Islander families are diverse. For example, while in remote areas of western and northern Australia, many Aboriginal and/or Torres Strait Islander people organise kinship according to traditional culture such as tribal law (Lindsay & Dempsey, 2009), many urban families, particularly in the southern states, have similar notions of family, home and place to non-Indigenous Australians and their families are less likely to resemble traditional Aboriginal or Torres Strait Islander cultural values (Dempsey & Lindsay, 2014). Even within geographic areas, Aboriginal and/or Torres Strait Islander people are likely to hold diverse views about family.
Figure 4: Aboriginal and/or Torres Strait Islander participants were more likely to rate legal ties or obligations as important when defining family
Participant rating of how important the 6 items are in defining what makes a family, by Aboriginal and/or Torres Strait Islander status
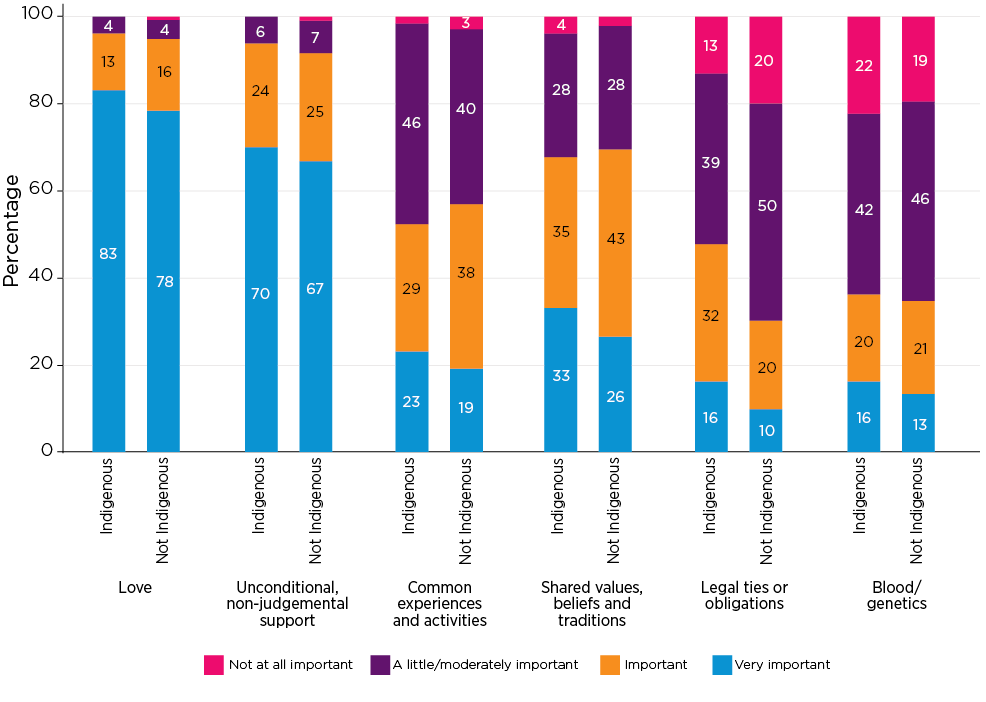
Note: An ordinary least-squares linear regression (see Appendix B) revealed that there was a statistically significant difference in the rating of the importance of ‘legal ties or obligations’ by Aboriginal and/or Torres Strait Islander status.
Perspectives of cultural and linguistic minority Australians
Cultural and linguistic minority Australians, those who were born overseas and who also speak a language other than English at home, had significantly different views on 4 of the 6 characteristics of defining family (Figure 5). The only characteristics where there was no significant difference between cultural and linguistic minority Australians and other participants was ‘unconditional, non-judgemental support’ and ‘love’.
The biggest difference identified was that cultural and linguistic minority Australian participants were significantly more likely to view legal ties or obligations as important or very important when defining family compared to other participants (41% vs 30%). Similarly, compared to other participants, cultural and linguistic minority Australian participants were significantly more likely to view common experiences and activities (29% vs 19%) and shared values, beliefs and traditions (38% vs 26%) as very important when defining family. These findings speak to the communalist family values within some migrant communities in Australia that privilege obligations to an extended kinship network (Dempsey & Lindsay, 2014) and the family practices of generational interdependence, mutual exchange and obligation that are common within many traditional Asian communities (Sheng & Settles, 2007).
Cultural and linguistic minority participants were also significantly more likely than other participants to view blood/genetics as important or very important (43% vs 34%). This is not surprising, given that a higher proportion of non-English speaking migrant families in Australia live in multi-family households – most of which are comprised of family related by blood or marriage and with 2 consecutive generations (de Vaus, 2004).
Figure 5: Cultural and linguistic minority Australians were more likely to rate common experiences and activities and shared values, beliefs and traditions as very important
Participant rating of how important the 6 items are in defining what makes a family, by cultural and linguistic minority status
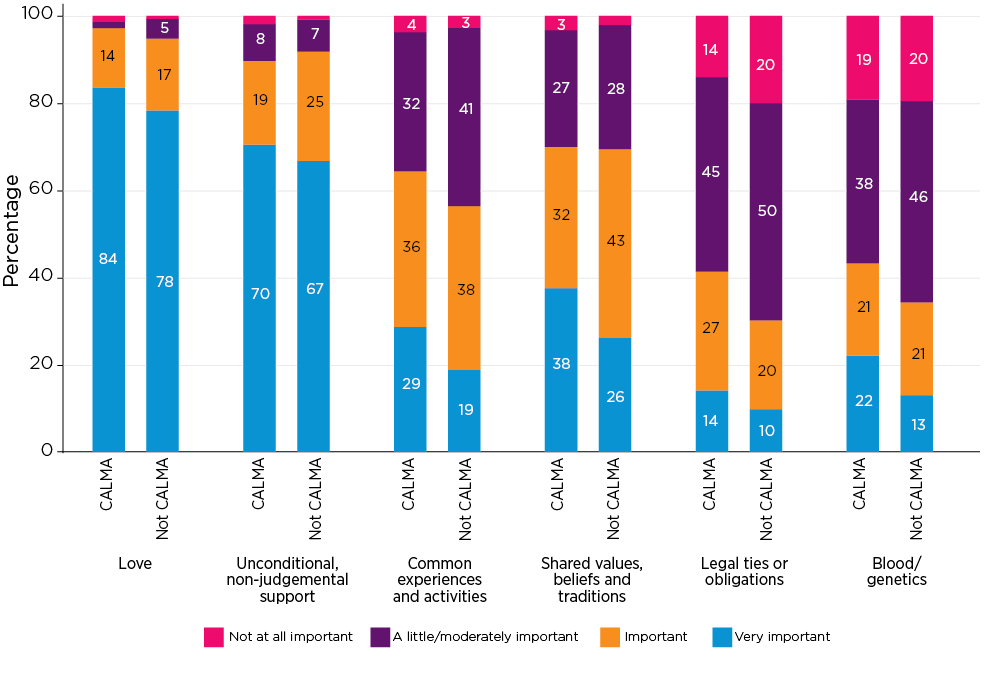
Notes: CALMA = cultural and linguistic minority Australians. An ordinary least-squares linear regression (see Appendix B) revealed that there was a statistically significant difference in the rating of the importance of all characteristics except ‘unconditional, non-judgemental support’ and ‘love’ by cultural and linguistic minority Australians status.
Lesbian, gay, bisexual, transgender and/or queer (LGBTQ+) family definitions
Lesbian, gay, bisexual, transgender and/or queer5 participants had significantly different views on what was important for 4 of the 6 characteristics of defining family (Figure 6). The biggest difference identified was that LGBTQ+ participants were significantly less likely than non-LGBTQ+ participants to view blood/genetics as important or very important when defining what makes a family (15% vs 38%). LGBTQ+ participants were also significantly less likely than non-LGBTQ+ participants to view legal ties or obligations as important or very important when defining family (17% vs 33%).
I no longer believe in, or value genetic or legal understandings of family ... When I had top surgery as part of my transition, my daughter cut off contact. I haven’t seen my grandsons in 6 years … that event revealed to me the ‘myth’ of ‘genetically-based’ family and accelerated my move away from traditional understandings of family towards Family of Choice. – Non-binary, 63, Queer, Capital city
Figure 6: LGBTQ+ people are less likely to rate blood, genetics, legal ties or obligations as important
Participant rating of how important the 6 items are in defining what makes a family, by LGBTQ+ status
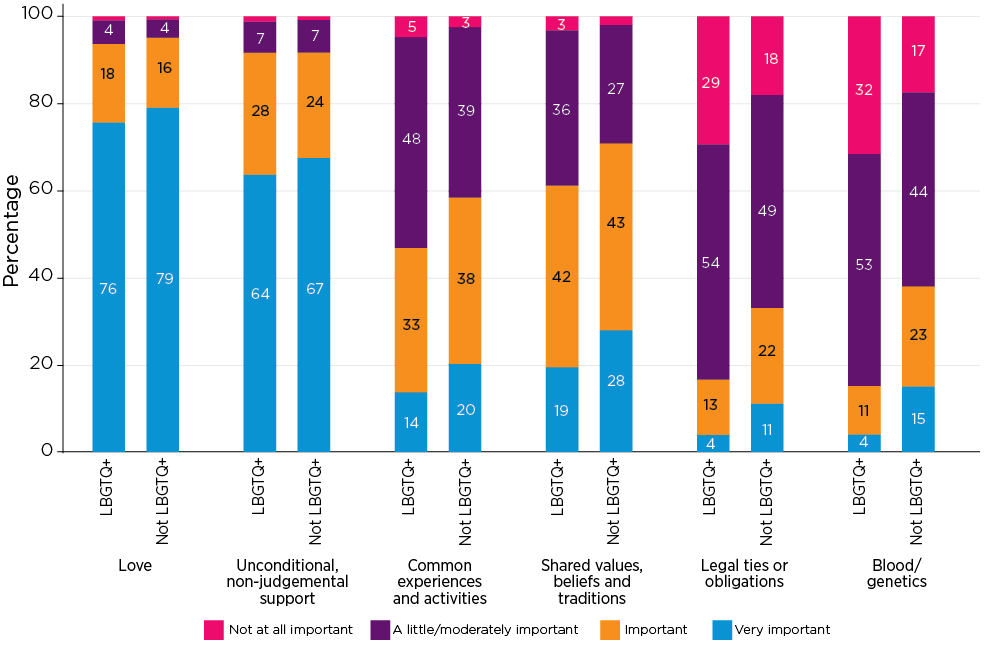
Note: An ordinary least-squares linear regression (see Appendix B) revealed that there was a statistically significant difference in the rating of the importance of all characteristics except ‘love’ and ‘unconditional, non-judgemental support’ by LGBTQ+ status.
These findings are consistent with the literature on LGBTQ+ families of choice where kinships have often existed outside of legal ties and gone beyond blood and genetics, often due to rejection by one’s birth family (Goss, 1997; Weeks et al., 2001; Weston, 1997). They also reflect the growth of LGBTQ+ families with children. These families often do not fit existing legal definitions of parenthood or kinship but have emerged through a re-imagining of previous understandings of biological parenthood (Benkov, 1994; Gahan, 2019; von Doussa, Power, & Riggs, 2015).
LGBTQ+ participants were also significantly less likely than other participants to view as important or very important, common experiences and activities (47% vs 58%) and shared values, beliefs and traditions (61% vs 71%). While LGBTQ+ families of choice come together due to their collective experiences and shared histories of marginality (Weeks et al., 2001; Weston, 1997), they are complex and those within individual families vary greatly by culture, age, class and ethnicity (Goss, 1997).
It is not surprising then that LGBTQ+ participants were significantly more likely than non-LGBTQ+ participants to report including chosen family or close friends when they think about their family (58% vs 39%). Likewise, LGBTQ+ participants were significantly more likely than other participants to report including pets as part of their family (59% vs 50%).
My chosen family [are my] friends, partner, pets. Woman, aged 56, Asexual, Capital city
My 2 cats are basically my children, and they provide more love and support than my other human family members most days. Woman, aged 43, Bisexual, Capital city
Views by generation
There were clear generational differences in what people saw as important when defining a family. Significant differences between the Interwar generation and later generations were observed for 3 of the 6 characteristics of defining family – blood/genetics, legal ties or obligations, and common experiences and activities (Figure 7).
Figure 7: Love and unconditional, non-judgemental support has defined family over the generations
Percentage of those who rated 6 items in defining a family important or very important, by year of birth

Notes: The year ranges used for the generations are those used by the Australian Bureau of Statistics ([ABS], 2022). An ordinary least-squares linear regression (see Appendix B) revealed that there was a statistically significant difference in how younger generations compared to the Interwar generation rated the importance of ‘legal ties or obligations’ and ‘blood/genetics’. Further, Gen X through to Gen Z significantly rated ‘common experiences and activities’ less important than the Interwar and Baby Boomer generations.
The biggest decline was found for views on the importance of blood and genetics when defining family. This decline was most rapid between the Interwar through to Gen X generations, seeing a 33 percentage point drop in those viewing this as important or very important (62% vs 29%). This trend then continued, albeit at a much slower rate, to drop a further 5 percentage points through to Gen Z (24%).
A similar trend was observed for legal ties or obligations, which also fell most dramatically between the Interwar and Gen X generations, with a 22 percentage point drop in those viewing this as important or very important (48% vs 26%). This trend then flattened and remained largely unchanged through to Gen Z (26%).
The way I was brought up to think of family includes blood or legal ties where no love or emotional connection is necessary to be considered ‘family’. But as an adult I consider ‘chosen family’ to be just as important, where genetic/legal ties are irrelevant but having a connection, being there to support each other, and offering unconditional love makes you family. – Woman, aged 30, Millennial
There was also a significant decline in those who rated common experiences and activities as important or very important. While less dramatic than the other characteristics, the decline was somewhat steady over the generations and shifted 20 percentage points overall. The change was most notable between Gen X and Millennials, with a 10 percentage point drop in rating common experiences and activities as important or very important (58% vs 48%).
The rating of shared values, beliefs and traditions as important or very important when defining a family remained relatively steady between the Interwar and Gen X generations (73% vs 70%). However, compared to the Interwar generation, a significant decline was observed for Millennials (by 6 percentage points) and Gen Z (by 16 percentage points) rating shared values, beliefs and traditions as important or very important.
Nevertheless, for love and unconditional non-judgemental support, there was no significant difference across the generations rating them as important or very important. Throughout the generations, the rating of love as important or very important remained between 94% and 96% and it stayed between 88% and 93% for unconditional, non-judgemental support.
These generational differences may be explained by the sociocultural differences between the eras that each group grew up in and/or the particular life stage that the generation is in today. Each of the generational groups has grown up in a different social context with varying social values and mores – with dramatic changes over the past century (Giddens, 2002). Similarly, as people and generations move through the life course, they encounter different lived experiences depending on what life stage they are in; ultimately, these can shape their views and understandings (e.g. the Interwar generation are more likely to be great-grandparents at the time of the survey).
The generational decline in the importance of the more traditional views of family (blood/genetics and legal ties or obligations) speaks to an erosion of tradition in the ways people form ties and connections with others and a gradual shift away from traditional views of kinship (Giddens, 2002). This shift appears to be reflected in our findings, with members of the Interwar generation significantly less likely than participants in other generations to include chosen family, friends or pets as family (48% vs 66%).
Those who have children and/or grandchildren
We explored whether life stage was associated with participants’ responses by looking at whether having children/grandchildren made a difference.7 While people with children and/or grandchildren tended to be older, the regression analysis controlled for age and therefore any significant differences between those with or without children/grandchildren is unlikely to be explained by age differences alone. Subsequently, our analysis revealed that those with children and/or grandchildren had significantly different views on what was important for 4 of the 6 characteristics of defining family (Figure 8).
The biggest difference was that those with children and/or grandchildren were significantly more likely than those without to rate love as very important when defining what makes a family (80% vs 70%).
I love my son and my son loves me, we are supporting of one another, and he knows that he will always be safe with his parents regardless of how him and I get treated from my side of the family. – Woman, aged 23, Regional Australia
Those with children and/or grandchildren were also significantly more likely than those without to consider unconditional, non-judgemental support as very important when defining what makes a family (68% vs 59%). Similarly, those with children and/or grandchildren were significantly more likely to rate legal ties or obligations as important or very important (32% vs 21%). Finally, those with children and/or grandchildren were significantly more likely than those without to view shared values, beliefs and traditions as important or very important (70% vs 64%).
Figure 8: Those with children and/or grandchildren were more likely to rate love and unconditional, non-judgemental support as very important
Participant rating of how important the 6 items are in defining what makes a family, by whether participants had children and/or grandchildren versus those who did not
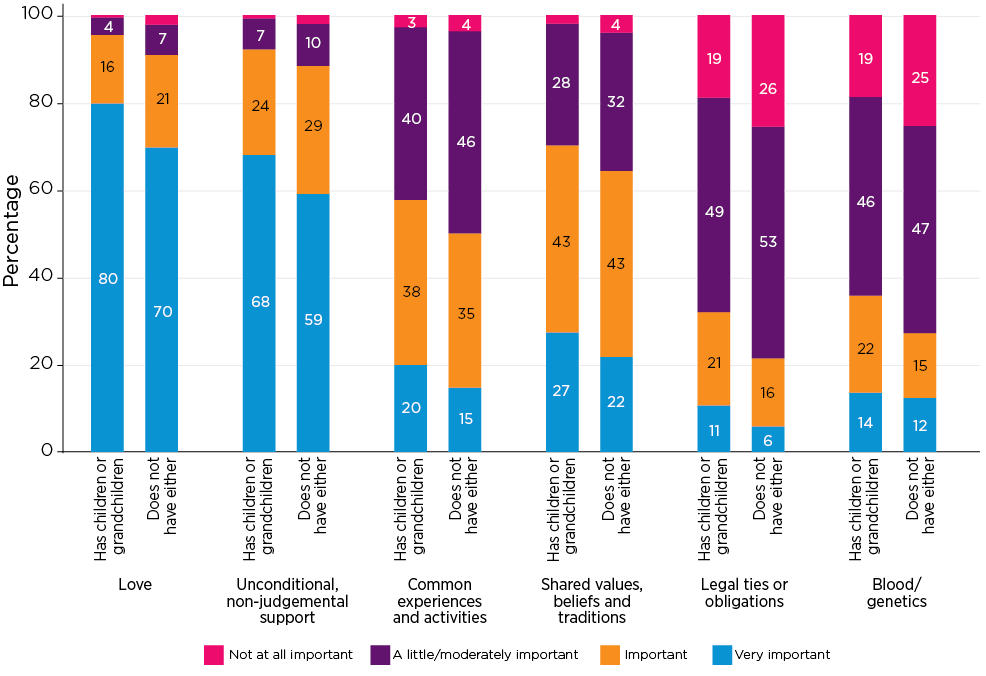
Note: An ordinary least-squares linear regression (see Appendix B) revealed that there was a statistically significant difference in the rating of the importance of all characteristics except ‘common experiences and activities’ and ‘blood/genetics’ by whether participants either had or included children/grandchildren as part of their family.
Love and support make a family
Love and unconditional non-judgemental support had universal agreement as being important in defining what makes a family. Across the entire sample, as well as each generation and group analysed, these 2 characteristics were the most likely to be chosen as important or very important. In contrast, while there was much more variation in views on the importance of blood and genetics, and legal ties or obligations; overall and in each generation and group analysed, these more traditional definitions of family were the least likely to be rated as important or very important. While we do not know to what degree these definitions impact participants’ daily interactions with those they call ‘family’, the findings suggest that for most of those in this study, being ‘related’ by blood and/or the law is less likely to be important compared to relationships defined by love and unconditional support.
Love and support are central aspects of relationships with ‘chosen family’ and are often the reason why people are selected to be in one’s ‘family’ alongside, or sometimes instead of, people related by blood or the law (Weeks et al., 2001). The importance of love and support speaks to the 2 out of 5 participants (42%) who included ‘chosen family or close friends’ when asked who they included when they think about their family.
Equally, love and support characterise the relationships people have with companion animals who are included as family members (Irvine & Cilia, 2016). At the time of the survey, more than half of the participants in this study (52%) included pets as a part of their family. Like chosen family, recent research suggests that animals can play an important role as confidantes and offer people a place of non-judgemental safety and unconditional love (Riggs, Rosenberg, Taylor, & Fraser, 2023; Rosenberg, Rosenberg, Taylor, & Fraser, 2020).
As views shift on what the ‘Australian family’ is, policies and supports may also need to adjust to reflect the needs of a changing society. An example of this is the increasing number of ‘pet custody disputes’ during separation/divorce (Bogdanoski, 2006). Determining how to resolve these disputes is challenging the family law system as the law considers pets as ‘property’, despite the divorcing couple seeing them as members of their ‘family’ (Bogdanoski, 2006). Similarly, in 2022, in response to reports suggesting that increasing numbers of Australian workers wanted pet care leave, or ‘pawternity leave’, included in their employee benefits, some Australian vets introduced ‘pet care leave certificates’ (Ahwan, 2022).
Over time, employment laws in Australia have broadened the definition of ‘immediate family’ and ‘carer relationships’, often in response to test cases (Chapman, 2009). Parental leave has been broadened to include adopted children, and carers leave was introduced for an employee’s ‘household’ (Chapman, 2009). State jurisdictions have subsequently broadened these definitions further, with South Australia defining ‘household’ to include ‘any other person who is dependent on the person’s care’, and Tasmania expanding ‘caring relationships’ to any 2 adults (related as family or not) where one of them provides the other with domestic support and personal care (Chapman, 2009).
As more people include chosen members as family, research has also begun to include chosen family when exploring family violence (Hill, Bourne, McNair, Carman, & Lyons, 2020). While changes have occurred in this space over recent years, there continues to be calls for policy and laws to further expand definitions to better reflect the reality of the Australian family today (Gahan, 2019; Rose & Hebblethwaite, 2020).
Understandings of ‘family’, like many aspects of our society, are shifting over time from a rigid institution guided by obligations, tradition and legal definitions to relationships that are defined by love, satisfaction and individual choices (Beck & Beck-Gernsheim, 1995; Coontz, 2005; Giddens, 2002). More research is needed to better understand how these shifts are impacting the lived experiences of Australian ‘families’ and how we can best support them.
1 Participants were given the options: ‘Very important’, ‘Important’, ‘Moderately important’, ‘A little important’ and ‘Not at all important’ for each item. Due to the very small differences between ‘A little important’ and ‘Moderately important’, they are combined for the sake of easier readability in the figures. However, these 2 response options were not combined when testing for significant differences in responses.
2 The answer options were chosen based on what participants in a previous survey wave had told us when asked in a free-text question to describe who was in their family.
3 Men made up 12% (522) of the sample. This number was sufficient to compare responses of men and women through statistical analysis. We note that the average ages of men and women in the sample were 56 and 51 years respectively, and a multivariate analysis took account of other characteristics (see Appendix B) so the gender differences discussed are those that were statistically significant after controlling for other factors. However, the smaller sample size of men resulted in very limited qualitative data from which quotes could be drawn. As a result, no quotes presented here are from men.
4 Non-binary gender identities were recorded but the sample size was too small to conduct a gendered analysis; however, non-binary individuals are included and represented in the overall sample and in the LGBTQ+ cohort analysis presented in this report.
5 Participants were asked in the survey ‘Are you of Aboriginal or Torres Strait Islander origin?’ Participants were able to select one or both identities, the response of which was used to identify their status.
6 LBGTQ+ includes those who identified as not heterosexual and/or not cisgender. Unfortunately, due to the limitations of the measures in the survey we were unable to capture those who may have otherwise disclosed their intersex status and have therefore not included ‘I’ in the acronym.
7 Defined as those who had children under 18 in their or another household, or those who included children and/or grandchildren when asked who was included when they thought about their family.
References
Australian Bureau of Statistics [ABS]. (2022, June 27). 2021 Census shows Millennials overtaking Boomers. Canberra: ABS. Retrieved from www.abs.gov.au/media-centre/media-releases/2021-census-shows-millennials-overtaking-boomers
Ahwan, L., (2022, December 22). Pawternity leave push. Herald Sun, p 25.
Animal Medicines Australia. (2019). Pets in Australia: A national survey of pets and people. 2019 Survey Report. Barton, ACT: Animal Medicines Australia. Retrieved from animalmedicinesaustralia.org.au/report/pets-in-australia-a-national-survey-of-pets-and-people/
Beck, U., & Beck-Gernsheim, E. (1995). The normal chaos of love. Cambridge, UK: Polity Press.
Benkov, L. (1994). Reinventing the family: The emerging story of Lesbian and Gay parents. New York: Crown.
Bogdanoski, T. (2006). The marriage of family law and animal rights: How should Australian family law approach the rise of ‘pet custody disputes?’ Alternative Law Journal, 31(4). doi.org/10.1177/1037969X0603100407
Chapman, A. (2009). Employment entitlements to carer’s leave: Domesticating diverse subjectiveness. Griffith Law Review, 18(2), 453–473.
Coontz, S. (2005). Marriage, a history: How love conquered marriage. New York: Penguin Books.
Dempsey, D., & Lindsay, J. (2014). Families, relationships and intimate life (2nd Ed). Melbourne: Oxford University Press.
de Vaus, D. (2004). Diversity and change in Australian families: Statistical profiles. Melbourne: Australian Institute of Family Studies.
Fehlberg, B., Kaspiew, R., Millbank, J., Kelly, F., & Behrens, J. (2015). Australian Family Law: The Contemporary Context. Melbourne: Oxford University Press.
Gahan, L. (2019). Separation and post-separation parenting within lesbian and gay co-parenting (guild parented) families. Australian and New Zealand Journal of Family Therapy, 40(1) 98–113. doi: 10.1002/anzf.1343
Giddens, A. (2002). Runaway world: How globalisation is reshaping our lives (2nd Ed). London: Profile Books.
Goss, R. E. (1997). Queering procreative privilege: Coming out as families. In R. E. Goss and A. Adams Squire Strongheart (Eds), Our Families, Our Values: Snapshots of queer kinship, pp 3–20. New York: Harrington Park Press.
Hill, A. O., Bourne, A., McNair, R., Carman, M., & Lyons, A. (2020). Private Lives 3: The health and wellbeing of LGBTIQ people in Australia (ARCSHS Monograph Series No 122). Melbourne: Australian Research Centre in Sex, Health and Society, La Trobe University.
Irvine, L., & Cilia, L. (2017). More-than-human families: Pets, people, and practices in multispecies households. Sociology Compass, 11(2). doi.org/10.1111/soc4.12455
Lindsay, J., & Dempsey, D. (2009). Families, relationships and intimate life. Melbourne: Oxford University Press.
Lohoar, S., Butera, N., & Kennedy, E. (2014). Strengths of Australian Aboriginal cultural practices in family life and child rearing (CFCA Paper No 25). Melbourne: Child Family Community Australia, Australian Institute of Family Studies.
Qu, L. (2020a). Australian Families Then & Now: Couple relationships. Melbourne: Australian Institute of Family Studies.
Qu, L. (2020b). Australian Families Then & Now: Having children. Melbourne: Australian Institute of Family Studies.
Riggs, D. W., Rosenberg, S., Taylor, N., & Fraser, H. (2023). The role of animals in buffering against cisgenderism in and beyond family contexts for trans young people living in Australia. Journal of Family Violence. doi.org/10.1007/s10896-023-00503-z
Rose, H., & Hebblethwaite, S. (2020, 14 February). Expanding the definition of family to reflect our realities. The Conversation. theconversation.com/expanding-the-definition-of-family-to-reflect-our-realities-131743
Rosenberg, S., Riggs, D., Taylor, N., & Fraser, H. (2020). ‘Being together really helped’: Australian transgender and non-binary people and their animal companions living through violence and marginalisation. Journal of Sociology, 56(4), 571–591. doi.org/10.1177/1440783319896413
Secretariat of National Aboriginal and Islander Child Care (SNAICC). (2011). Growing up our way: Practices matrix. Melbourne: SNAICC.
Sheng, X., & Settles, B. H. (2007). Intergenerational relationships and elderly care in China: A global perspective. Current Sociology, 54(2), 293–313.
von Doussa, H., Power, J., & Riggs, D. (2015). Imagining parenthood: The possibilities and experiences of parenthood among transgender people. Culture Health & Sexuality, 17(9), 1119–1131. doi: 10.1080/13691058.2015.1042919
Weeks, J., Heaphy, B., & Donovan, C. (2001). Same sex intimacies: Families of choice and other life experiments. London: Routledge.
Weston, K. (1997). Families we choose: Lesbians, gays, kinship (Rev Ed). New York: Columbia University Press.
Appendix A: About the sample
The sample used in this analysis was drawn from the fourth Families in Australia Survey, which ran from 4 November to 13 December 2021 and had almost 6,000 participants.
This sample included only those participants who provided a rating of all 6 characteristics of importance in defining a family and enough information to determine their age (generation), gender, whether they had children/grandchildren, LGBTQ+ status, Aboriginal and/or Torres Strait Islander status, and cultural and linguistic minority Australians status. This resulted in a total sample of 4,436 participants for analysis.
The convenience sampling approach and reliance on an online survey resulted in some biases. It is therefore not likely to represent the experiences of all demographic groups, including those from lower socio-economic backgrounds and non-English speaking backgrounds. This bias is evident in Table 1, which presents the numbers and representations of sample characteristics used in this analysis. Notably, men were only 12% of the sample (n = 522), while a large proportion of the sample had children or grandchildren (88%).
While the survey was not representative of the Australian population, and this should be noted, the survey nevertheless had sufficient numbers to conduct statistical modelling and gain useful insights on how Australians think about what family means to them.
Table 1: Sample characteristics used in analysis
n | % | |
|---|---|---|
Generation (Year of birth) | ||
Interwar (1928–1945) | 195 | 4.4 |
Baby Boomers (1946–1965) | 1,717 | 38.7 |
Gen X (1966–1980) | 1,224 | 27.6 |
Millennials (1981–1995) | 1,173 | 26.4 |
Gen Z (1996–2012) | 127 | 2.9 |
Gender | ||
Men/Male | 522 | 11.8 |
Women/Female | 3,853 | 86.9 |
Non-binary/other term | 52 | 1.2 |
Prefer not to say | 9 | 0.2 |
Demographics | ||
Has children or grandchildren | 3,884 | 87.6 |
LGBTQ+ | 649 | 14.6 |
Aboriginal and/or Torres Strait Islander people | 130 | 2.9 |
Cultural and linguistic minority Australians | 213 | 4.8 |
Total n | 4,436 | 100.0 |
Source: Fourth Families in Australia Survey, November–December 2021
Appendix B: Supplementary tables
Table 2: Factors associated with a higher rating of importance for each of the 6 characteristics, ordinary least-squares regression analysis
Coefficients | ||||||
|---|---|---|---|---|---|---|
Variable | Love | Unconditional, non-judgemental support | Common experiences and activities | Shared values, beliefs and traditions | Legal ties or obligations | Blood/genetics |
Generation | ||||||
Interwar (ref) | - | - | - | - | - | - |
Baby Boomers | -0.07 | 0.013 | -0.139 | -0.105 | -0.374*** | -0.433*** |
Gen X | -0.042 | 0.049 | -0.197** | -0.09 | -0.633*** | -0.785*** |
Millennials | -0.025 | -0.034 | -0.359*** | -0.175* | -0.672*** | -0.891*** |
Gen Z | 0.066 | 0.081 | -0.304** | -0.218 | -0.478*** | -0.682*** |
Women | 0.132*** | 0.179*** | 0.03 | 0.119** | -0.041 | -0.184** |
Those with children/grandchildren | 0.188*** | 0.155*** | 0.062 | 0.097* | 0.176** | 0.021 |
LGBTQ+ | -0.017 | 0.012 | -0.197*** | -0.173*** | -0.416*** | -0.651*** |
Aboriginal and/or Torres Strait Islander people | 0.056 | 0.083 | 0.043 | 0.015 | 0.469*** | 0.062 |
Cultural and linguistic minority Australians | 0.078 | 0.012 | 0.228*** | 0.139* | 0.384*** | 0.321*** |
Constant | 4.471*** | 4.247*** | 3.770*** | 3.808*** | 3.216*** | 3.754*** |
r2 | 0.016 | 0.014 | 0.022 | 0.014 | 0.05 | 0.079 |
n | 4,436 | 4,436 | 4,436 | 4,436 | 4,436 | 4,436 |
Note: *p < 0.05, **p < 0.01,***p < 0.001, 1 = not at all important to 5 = very important.
Source: Fourth Families in Australia Survey, November–December 2021
Table 3: Factors associated with including chosen family or friends, or pet as part of family
Variable | Chosen family or close friends | Pets | Chosen family or close friends OR pets |
|---|---|---|---|
Generation | |||
Interwar (ref) | - | - | - |
Baby Boomers | 0.504** | 0.633*** | 0.639*** |
Gen X | 0.513** | 0.800*** | 0.678*** |
Millennials | 0.317 | 0.623*** | 0.439** |
Gen Z | 0.176 | 0.735** | 0.560* |
Women | 0.572*** | 0.622*** | 0.696*** |
Those with children/grandchildren | -0.048 | -0.024 | -0.174 |
LGBTQ+ | 0.775*** | 0.368*** | 0.685*** |
Aboriginal and/or Torres Strait Islander people | 0.877*** | 0.307 | 0.772*** |
Cultural and linguistic minority Australians | -0.008 | -0.264 | -0.225 |
Constant | -1.356*** | -1.159*** | -0.468* |
r2 | 0.0229 | 0.0163 | 0.0253 |
n | 4,436 | 4,436 | 4,436 |
Media releases
Acknowledgements
The authors of this report would like to acknowledge Megan Carroll who led the development of the family questions on the fourth Families in Australia survey and presented initial findings on this subject at the AIFS 2022 Conference.
We wish to also acknowledge Dr Jennifer Baxter who supervised and provided regular feedback on the report from its inception through to its publication.
We acknowledge Liz Neville, Dr Jody Hughes, Dr Lixia Qu, Dr Rae Kaspiew and Dr Chris Schilling for their review of this report, and Katharine Day and Lisa Carroll for their editing and typesetting of the final report.
Finally, we acknowledge and thank all the people who have participated in the Families in Australia surveys.
Featured image
© gettyimages/FG Trade
Budinski, M., & Gahan, L. (2023). What is family?: Australian views on what makes a family. Melbourne: Australian Institute of Family Studies.
978-1-76016-293-1
7 December 2023