Child care fees charged by services
Overview
This snapshot presents findings from the 2018–2021 evaluation of the Australian Government's Child Care Package.
Key objectives of the Child Care Package were to improve affordability, especially for low- and middle-income families, and to address increasing costs of child care. The fees charged by child care services are an important determinant of the affordability of child care. The hourly rate caps introduced with the Child Care Package placed an upper limit on the level of subsidy entitlements available and was seen as a means of putting downward pressure on fees. These caps, indexed by the Consumer Price Index (CPI), apply to services' fees in the calculation of families' Child Care Subsidy (CSS).1
This snapshot focuses on findings from the Child Care Package evaluation about child care fees, including analysis of the distribution of fees charged, and how that has changed, and analysis of fees relative to the caps. The analysis used Department of Education, Skills and Employment's administrative data.2 Affordability is also determined by the levels of subsidy and sessional charging practices; see related snapshots on affordability and on sessions and charging practices.
Child care fees and the Child Care Package
The hourly rate caps, in conjunction with the requirement for family co-contribution towards the cost of child care, were introduced with the Child Care Package. The hourly rate caps are applied in the calculation of a family's entitlement to CCS. The subsidy rate is applied to the fee charged to the family, up to the hourly rate cap.3 Any amount charged above the rate cap is not subsidised.
Centre Based Day Care (CBDC) and Outside School Hours Care (OSHC) have the same rate cap but with a higher rate cap for children who are below school age.4 The rate cap for Family Day Care (FDC) lies between these two rates. In Home Care (IHC) has a higher rate cap, reflecting that the charge for IHC is per family, rather than per child.
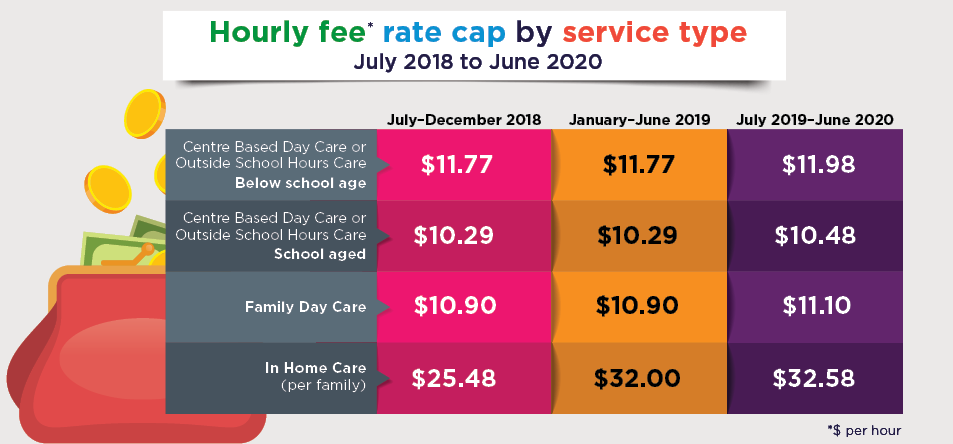
Hourly rate caps for all services increased in July 2019, in line with indexation. Further, for In Home Care, the rate cap had a one-off additional increase at January 2019, as the initial rate cap for IHC was significantly below fees charged for IHC.
The concept and measure of hourly child care fees
While the hourly fee is a key part of the CCS calculation, the concept of hourly fees in child care services is not straightforward. This is because most children are provided care on a sessional basis, rather than on an hourly basis. Though some services, particularly FDC and IHC services, do charge on an hourly basis. With sessional charging, when services offer multiple sessions, the hourly fee they charge parents can vary significantly across sessions. So, in this context, the hourly fee is a notional concept, being based on dividing the sessional fee charged to parents by the nominal length of the session. Because of the nature of the administrative data provided by the Department for the evaluation, estimates of the hourly fee were based on total weekly fees paid and the total weekly hours charged for. See also the sessions and charging snapshot for more information.
The distribution of hourly child care fees
The hourly fees charged varied between service type and also varied within service type depending on locations, details of the services and other factors influencing the cost of service provision. The variation across services shows that for CBDC and FDC a significant proportion of services' fees were above the rate cap (analysed later in this snapshot, see Figure 6).
Figure 1 shows the distributions of fees for CBDC, FDC and OSHC, which all charge per child. IHC fees are not shown as these fees are instead charged per family. Also note, as described above, these fees are derived from the sessions-based data and, in particular, FDC fees are more often charged per hour compared to CBDC and OSHC services.
Figure 1: Distribution of derived hourly fees by care type (excluding IHC), December Quarter 2019
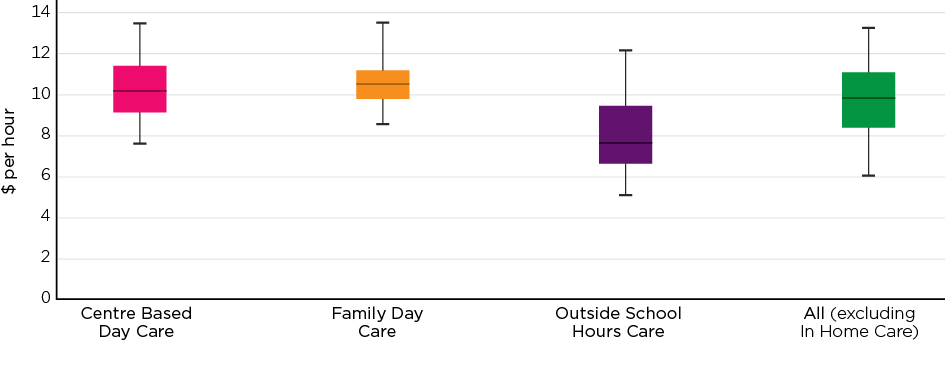
Notes: For each service type, the box part of the figure presents the inter-quartile range, where the middle 50% of fees lies. The median is indicated by the line in the middle of the box). The spread of all fees is indicated through the upper and lower 'whiskers' (the lines above and below each box) and show the 5% and 95% points in the distribution. Records with zero fees or zero hours were excluded from calculations. IHC is excluded given it is charged per family rather than per child.
Source: DESE administrative data
Together, the data for the December 2019 quarter show:
- CBDC services have a median hourly fee of $10.20, with a range from $7.60 at the 5th percentile to $13.48 at the 95th percentile.
- FDC services had the highest of the per child median hourly fees at $10.55 (IHC is higher but charged at a family rate).
- OSHC services had the lowest median fee at $7.69, and the largest range in fees from $5.05 (5th percentile) to $12.18 (95th percentile). This range is likely due, at least in part, to variations in charging practices between shorter before and after school care sessions and full day care provided by vacation care.
For each care type, the average fees were similar to the medians: $10.34 for CBDC, $10.69 for FDC, and $8.14 for OSHC.
IHC service fees are per family rather than per child. As derived from the DESE administrative data, the median IHC fee at December 2019 was $34.50, with a range from $19.13 at the 5th percentile to $43.00 at the 95th percentile. The mean for IHC at this time was $32.94.
In addition to variations between service types, there were also some marked differences between states and, to some extent, according to whether services were for profit or not for profit. For example, Figure 2 shows the variation in average fees for for-profit and not-for-profit services across states, and by service type, with particularly high costs in the Australian Capital Territory, followed by Western Australia and Victoria.
Figure 2: Average service fees by service type, state and for profit/not for profit, excluding IHC, December Quarter 2019
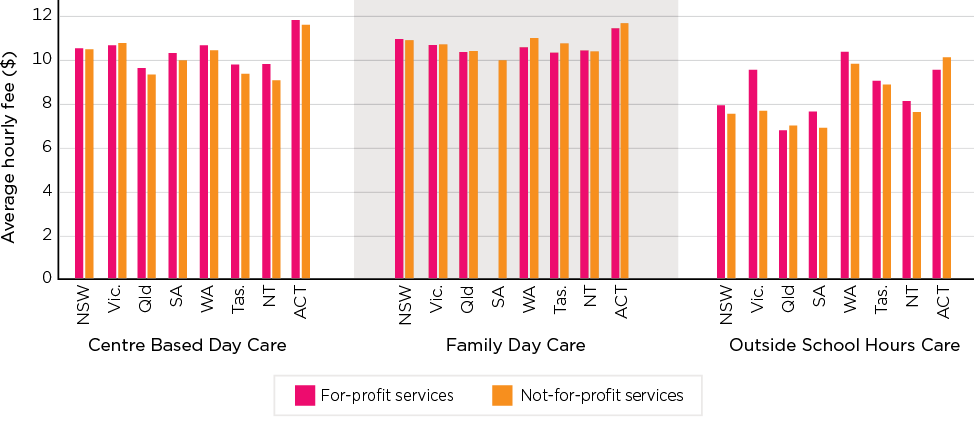
Notes: IHC is not shown given it is charged per family rather than per child.
Source: DESE administrative data
Changes in fees, 2017-19
The evaluation analysed changes in fees from the March 2017 quarter through to the December 2019 quarter. The analysis reported below focuses firstly on the change in the average fee charged, across all services excluding IHC. Secondly, it reports on changes in fees for IHC, which are charged per family rather than per child.
CBDC, OSHC and FDC services
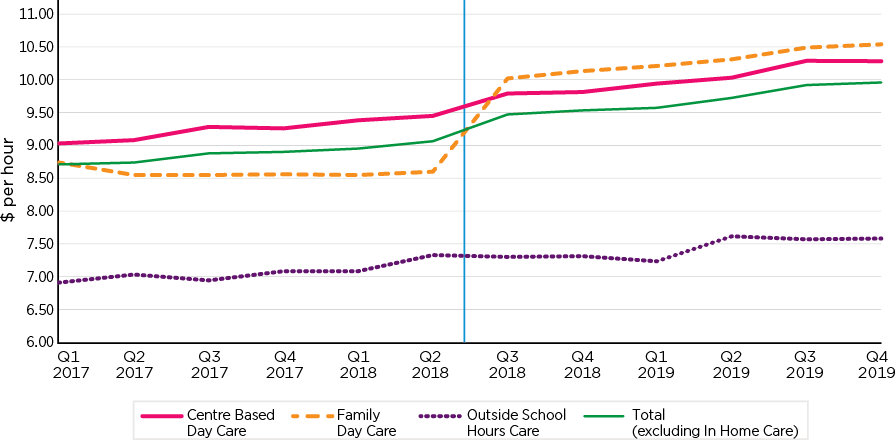
Across all services, excluding IHC, the fee for an average hour of child care increased from $8.71 in Q1 2017 to $9.96 in Q4 2019 (Figure 3). This is an increase of 14.4%.
Figure 3: Quarterly average hourly fees, Centre Based Day Care, Family Day Care and Outside School Hours Care, Q1 2017 to Q4 2019
Source: DESE administrative data
Looking at each of the service types, between March Quarter 2017 and December Quarter 2019:
- CBDC average hourly fees increased 13.8%, from $9.03 to $10.28 per hour.
- OSHC average hourly fees increased 9.7%, from $6.91 to $7.58 per hour.
- FDC fees had the largest increase at 20.6%, from $8.74 to $10.54 per hour.
In regard to the trends before and after the introduction of the package:
- The average hourly fee charged by CBDC and OSHC was increasing prior to the introduction of the Child Care Package, and this continued after July 2018.
- For FDC, there was a sharp increase in the hourly fee between the June and September 2018 quarters, following the introduction of the Child Care Package.
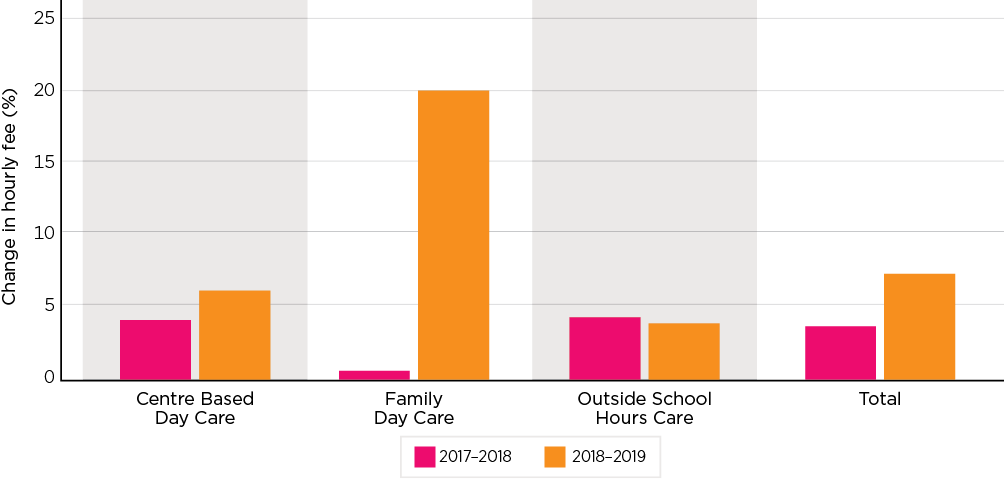
An important question in evaluating the impact of the Child Care Package is did the rate of increase in fees slow following its introduction? Figure 4 shows that the percentage increase in the average hourly fee charged in different child care settings in the 12 months prior to the changes to the system and in the 12 months after the changes to the system.
- There was a slightly higher percentage increase for CDBC following the changes than before.
- There was a marginally lower percentage increase for OSHC following the introduction of the Package relative to the 12 months before.
- There was a significant increase in the hourly fee for FDC services.
Figure 4: Change in quarterly average hourly fees, Centre Based Day Care, Family Day Care and Outside School Hours Care, Q1 2017 to Q4 2019
Source: DESE administrative data
The FDC fee increase was explored in more detail, also considering differences in the for-profit and not-for-profit sectors:
- Before July 2018, for-profit FDC providers were charging a substantially lower per hour fee than were not-for-profit FDC providers. From July 2018, the hourly fee charged by for-profit FDC providers increased to be the same as that being charged by not-for-profit providers, and the hourly fee charged by both sectors increased at about the same rate in the quarters from July 2018 to December 2019.
- The derived hourly fee uses information about total fees charged and total hours charged. Between 2017-18 and 2018-19, while the per hour cost of care charged by for-profit FDC providers increased by 22%, the annual number of hours of care per child paid for by families using for-profit FDC decreased by 23%. In comparison, among not-for-profit FDC providers there was a much smaller decrease in hours charged for (3.5%).
- Together, this suggests that apparent increases in the hourly rate being charged by for-profit FDC providers was due to a change to the basis on which many for-profit FDC providers are charging families, towards an hourly based charging model.
Overall, the analysis of change did not indicate that the introduction of the Child Care Package had resulted in significant downward pressure on fees across the sector to date.
IHC services
With the introduction of the Child Care Package, there were significant changes to the IHC program (see also the In Home Care snapshot). The changes included redefined eligibility criteria, a renewed focus on early childhood education and care, minimum qualification requirements for educators, and changes to the allocation of places. The alignment to the CCS also meant changes to the costs of IHC for families. In regard to fees (and costs), a significant change was the change from child-level charging to family-level charging for IHC. Calculations for CCS amounts are at the family level. In addition, the Community Support Program was removed and the Community Child Care Fund introduced.
Together, these changes were expected to result in changes to the charging practices of the IHC services. Fees also relate to educator pay. Educators' pay is subject to the Children's Service Award, which requires that pay varies depending on an educator's level of qualifications and requires penalty rates for work performed during non-standard hours.
Given the change from child-level charging to per-family charging, all calculations of changes in IHC fees take account of this by summing the child fees that applied before July 2018 to estimate a family fee. Figure 5 shows that the average fee charged by IHC services was increasing prior to the introduction of the Child Care Package and increased substantially immediately following the changes from $18.93 per hour (on a family basis) in Q2 2018 to $29.08 per hour in the Q3 2018.
Figure 5: Quarterly average hourly family fees, In Home Care services, Q1 2017 to Q4 2019
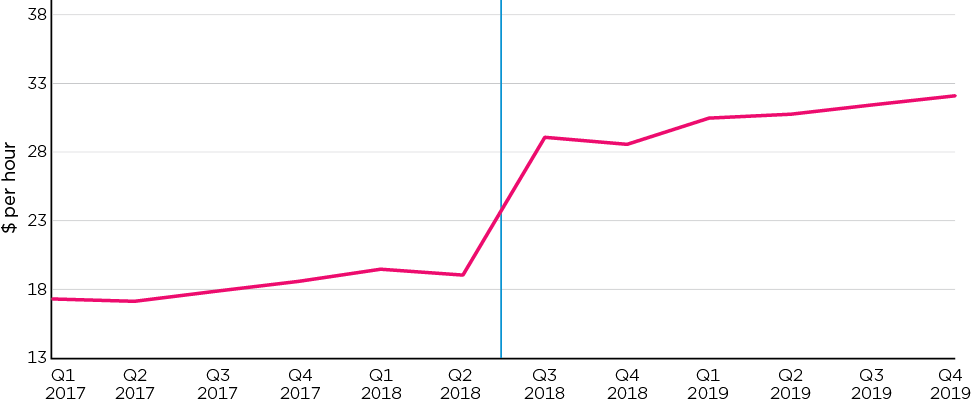
Notes: In order to take in to account the shift in IHC from charging on a per child to a per family level, IHC fees prior to July 2018 are calculated by summing fees charged to individual children.
Source: DESE administrative data
Fees and the hourly rate cap
As shown in Figure 1, median hourly fees in December 2019 were below the hourly rate cap. In the case of OSHC, the median hourly fee was well below the cap. But the figure also showed that some individual services were charging at rates considerably above the hourly rate cap.
Figure 6 shows the proportion of services with an average hourly fee above the hourly rate cap, by service type. Also shown is the proportion of services where at least one child was charged an average fee across the quarter that was above the hourly rate cap. These approaches produce very different results, which is due to the variation in the fees charged to families within a service. Using average hourly fees to compare to the hourly rate cap does not fully capture this possible variation, so underestimates the extent to which services are charging above this rate. The evaluation therefore focused on the latter measure.5
Figure 6: Proportion of services charging above the hourly rate cap using two measures, by service type, December quarter 2019

Notes: For In Home Care the hourly rate is calculated at the family level. Records with zero fees or zero hours are excluded. Where rates vary for school-aged children, all children aged six years and over are treated as school age.
Source: DESE administrative data
While the majority of services were charging below the hourly rate cap when considering the average hourly fee, a large proportion were charging some children at rates that exceeded the cap. For CBDC services, while only 12% of services were charging an average fee above the hourly rate cap, 59% had at least one child with average hourly fees above the hourly rate cap.
Overall, for the December quarter 2019 more than half (56%) of child care services were charging some children rates above the hourly rate cap. Further analysis showed younger children (particularly those aged 0-2) or those using less than 10 hours of care per week are more likely to be charged above the hourly rate cap.
The proportion of services charging above the hourly rate cap has varied since the introduction of the package. Most notably, there was a significant increase for CBDC services, where charging at least one child over the hourly rate cap rose from around 40% in early July 2018 to nearly 60% by December 2019. The proportion of IHC services charging some families above the hourly rate cap fell from over 95% to between 70% and 80% following the January 2019 adjustment to the IHC hourly rate cap.
The rate cap, indexation and other evaluation findings
As noted previously, the rate caps are adjusted each year by the CPI. This indexation of the fees cap to the CPI will curtail increases in the government's expenditure on child care but, over time, increases in fees beyond the CPI increase will be transferred to parents. This is apparent, given the hourly rate caps have not been effective in constraining hourly fees and families are consuming a volume of care beyond that supported under the activity test. With the main driver of child care costs being wages, it is to be expected that costs will increase at a rate above CPI, consistent with wage growth overall.
Further, through the evaluation, concerns were raised about the rate cap being fixed, while costs of care varied in particular situations. This was raised, in particular, with respect to child care provided outside of typical business hours, which may be charged by services at a higher fee to reflect educators' penalty rates for working these hours. This is most relevant to IHC and FDC, with these service types more likely to be providing care outside of typical business hours.
See also the sessions and charging snapshot for a discussion of findings related to the links between session lengths, hourly fees and the rate cap.
While the analysis above suggests the hourly rate caps have not had a significant impact on services' fees, further analysis of the administrative data shows that the hourly rate caps are reducing the amount of subsidy received by families, with about 15%-17% of hours in the second half of 2019 charged above the hourly fee cap. The modelling of administrative data indicated that if there were no hourly rate caps, an additional $127 million in subsidy would be paid to families.
Summary
The analysis of hourly fees presented in this snapshot was based on a derived measure of fees, using Departmental administrative data that included child-level weekly data on total fees charged and total hours charged. The derived hourly fee is therefore a function of the charging practices of services, which tend to vary by service type, with IHC and FDC services more often charging per hour compared to CBDC and OSHC services that are more likely to charge for a particular session length.
The snapshot on Costs and Affordability shows that to December 2019, the Child Care Package has had an overall positive impact on affordability for lower and middle income families, consistent with the objects of the policy. The analysis in this snapshot shows that fees charged by CBDC and OSHC services increased at a similar rate following the introduction of the Package to what they were before the changes. FDC services showed, on average, an increase in the hourly fee following the introduction of the Child Care Package, when compared to the increase the previous year. Changes in charging practices within the for-profit FDC sector appeared to contribute to the explanation for the increased hourly rate for these services.
The IHC program underwent significant changes with the introduction of the Child Care Package. It was expected these changes would lead to services changing their charging practices, and the analysis of administrative data indicate their average fees increased substantially following the introduction of the Child Care Package, with this analysis taking account of the change from child-based to family-based charging.
As well as varying by service type, fees charged vary across service characteristics, including the state and/or territory and, to an extent, whether services are for profit or not for profit.
The analysis of fees relative to the fees cap indicated that many services charge fees that exceed the hourly rate cap to some of the families attending their service. Within services, some families are more likely than others to be charged fees above the hourly rate cap. This includes those using child care for younger children and those using fewer hours per week. There is concern among FDC and IHC services that the hourly rate caps do not sufficiently take account of fees for care provided outside of business hours. There is also concern that the indexation of the hourly caps will not be sufficient to contain the costs for families in the future.
Overall, the detailed analyses of changes in fees undertaken for the evaluation and summarised in this snapshot indicated that the introduction of the Child Care Package had not, to December 2019, resulted in significant downward pressure on fees.
Child Care Package evaluation
In July 2018 the Australian Government introduced the Child Care Package. The Australian Institute of Family Studies in association with the Social Research Centre, the UNSW Social Policy Research Centre and the ANU Centre for Social Research and Methods were commissioned by the Australian Government Department of Education, Skills and Employment to undertake an independent evaluation of the new Child Care Package. Findings presented here are based on data collected and analysed for the Child Care Package evaluation. The evaluation commenced in December 2017 prior to the introduction of the Package and reported on data collected up to December 2019. The evaluation was impacted by external events, particularly COVID-19, which resulted in the suspension of the child care funding system for a period during 2020. As a result, the evaluation only draws on data to the end of 2019 and does not include data from 2020. sufficiently take account of fees for care provided outside of business hours.
1 The policy settings described in this snapshot refer to those that applied at the time of the evaluation. There have been some updates to policy settings since this time, and the Department of Education, Skills and Employment (DESE) is now the Department of Education.
2 The evaluation estimated the hourly fee from weekly data, provided for each child's enrolment, on total weekly fees paid and total weekly sessions (hours charged for). From these data, estimates of fees charged by each service to each child (or family for In Home Care (IHC)) were derived.
3 Before July 2018, child care fees were subsidised by the Child Care Benefit (CCB) and the Child Care Rebate (CCR). The CCB had an implied hourly fee rate cap with a maximum rate payable of $4.30 per hour for a non-school-aged child and 85% of this rate for school-aged children. However, no cap was applied to CCR, so fees that were above the CCB cap were eligible for subsidy via the CCR.
4 'School-aged' children are children in school, including being home schooled, or 6 years or older.
5 The Department publishes a high-level indicator of the 'Number of services under/above the fee cap', which is based on the total fees charged by a service divided by the total hours charged for in a quarter, with similar findings to the average hourly fee approach presented in Figure 6.
Australian Institute of Family Studies. (2023). The 2018–2021 Child Care Package Evaluation: Child care fees charged by services. (Findings from the Child Care Package evaluation). Melbourne: Australian Institute of Family Studies.
9 June 2023