Diverse families making a difference
You are in an archived section of the AIFS website
Download Research snapshot
Families are very diverse and take many shapes and forms. They also typically extend across a number of households. Despite this diversity, there is a set of functions that families in all societies are commonly expected to provide: care and nurture of children, financial support of their members, and transmission of cultural and moral traditions and values.
To support the 2009 Families Week, the Australian Institute of Family Studies has prepared this facts sheet about the diverse range of families in which Australians live and the diverse ways in which they provide support to one another. The theme for Families Week in 2009 is "Celebrate how everyone makes a difference", which recognises the diversity of families and the different of ways in which their members support one another.
The families in which we live
Children and young adults
The majority of Australian children live with both their parents until they leave home and begin to form their own families. In 2006, the living arrangements for children under 15 years old were:1
- 74% with both of their biological parents;2
- 18% in a lone-parent family (virtually all with their mother);
- 6% in a step- or blended family; and
- 2% in other living arrangements.
Figure 1 shows the living arrangements of children and young people from birth to age 24. For children in 2006, in their first year of life, 86% lived with both their parents. The proportion of children living with both parents then declines throughout childhood as a result of the separation of parents (and, in a small number of cases, ill health or death of parents). By age 10, 69% of children were living with both parents and, by age 15, this had dropped to 63%.
Figure 1 Proportion of children and young people living with a parent or other carer, by type of family, birth to 24 years, 2006

Source: 2006 Census (one per cent sample CD-ROM)
The proportion of children living with a lone parent increased from around 10% of infants to a peak of around 22% from the ages of 9 through to 17 years. As children’s parents re-partnered following separation, the proportion of children living in a step- or blended family increased from 4% for 5-year-olds to 11% for 14-year-olds.
From around age 16, young peoples’ living arrangements start to change as they leave home and start to form a life more independent from their parents. In 2006, between the ages of 16 and 20, the proportion of young people living with at least one parent fell from 92% to 58%.
Living arrangements of adults
The living arrangements of adults change across life as a result of major life transitions, such as relationship formation, the birth and growth of children, children leaving home, separation from partner and, in later life, a partner moving to a nursing home or dying.
In 2006, there were some differences in the patterns of leaving home and forming independent living arrangements between women and men:3
- 60% of women aged 16–24 years were living with one or both of their parents, compared to 67% of men in this age group;
- 8% of women and 15% of men aged 25–34 years were living with one or both of their parents; and
- 2% of women and 5% of men aged 35–44 years were living with one or both of their parents.
Women started living with a partner at a younger age than men:
- 15% of women aged 16–24 years were living with a partner, compared to 8% of males in this age group;
- 64% of women and 54% of men aged 25–34 years lived with a partner; and
- by 35–44 years there was no difference in rates of partnering between females and males (73% and 72% respectively).
In relation to having children:
- 7% of 16–24 year old women, 49% of 25–34 year old women and 77% of 35–44 year old women had children with whom they lived; and
- 2% of 16–24 year old men, 31% of 25–34 year old men and 62% of 35–44 year old men had children with whom they lived.
At the other end of the life course, the proportion of people living with a partner decreased from the ages of 55–64 years for women and 75 years plus for men. The proportion living in a non-private dwelling increased from 75 years plus for both women and men. This reflects older people moving out of their own homes and into nursing homes.
Families caring
Families raise children and provide care to their members. At any point in time, one in five people aged 18 years and over are providing care for a person with a disability, illness or frail old age. The age groups most likely to be providing this type of care in 2006 were 45–54 year olds (28%) and 55–64 year olds (31%).4
The majority of this care is provided to family members. Out of the 20% of carers aged 15 and over, 14% provided care to family members and 6% to non–family members.5
Providing care within the household
Almost one in ten (9%) people (aged 15 years or older) cared for a family member with whom they lived:6
- 5% for a spouse or partner;
- 2% for a child or grandchild (beyond the usual care required); and
- 2% for someone else (e.g., a parent)
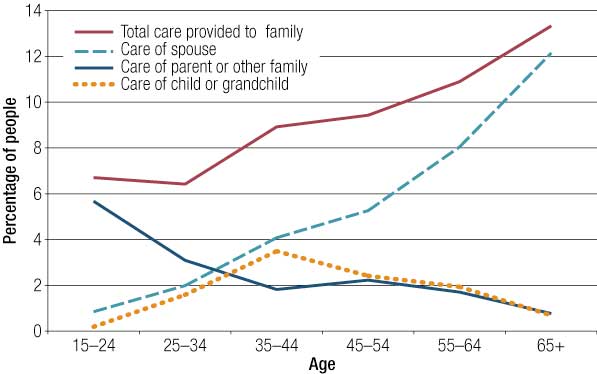
Figure 2 shows the proportion of people by age group providing care for somebody with whom they live. The proportion providing care increased from 7% for those aged 15–24 years to 13% for those aged 65 years or older, with care for a spouse increasing significantly with age. Caring for a child is most common for those aged 35–44 years, whereas care for a parent or other family member living with the carer is most commonly done by those aged 15–24 years.
Figure 2 Proportion of people providing care to others within the household, by age, 2006
Source: 2006 Time Use Survey Confidentialised Unit Record File (CD-ROM)
Providing care to family members living in another household
Six per cent of people (aged 15 years or older) provided care to a relative who lived in another household:7
- 2.6% to a parent;
- 0.6% to a child or grandchild; and
- 2.6% to another family member.
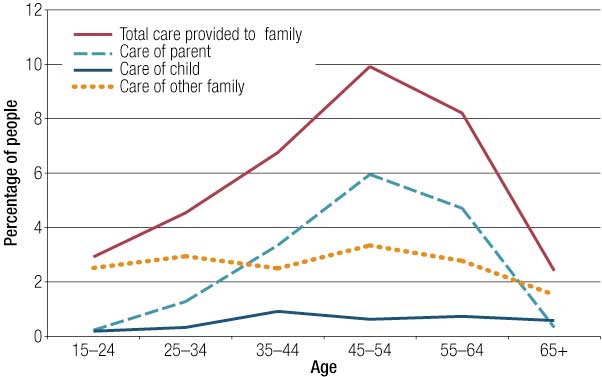
Figure 3 shows the proportion of people by age group providing care for a family member living in another household. The proportion providing care increased from 3% of those aged 15–24 years to a peak of 10% of those aged 45–54 years. Caring for a parent is very uncommon for those aged 15–24 years (0.2%) and those aged 65 years plus (0.3%), but much more common for those aged 45–54 and 55–64 years (6% and 5% respectively). Younger carers are relatively more likely to be caring for other family members living elsewhere than are carers aged 45–54 years.
Figure 3 Proportion of people providing care to relatives living in another household, by age, 2006
Source: 2006 Time Use Survey Confidentialised Unit Record File (CD-ROM)
Families supporting and helping one another
In addition to care, families provide support and help to their members in a variety of ways, including help with domestic work, home maintenance, gardening, transport, running errands, child care, and providing emotional support and financial assistance.
Just under one-third (31%) of adults provided regular unpaid assistance to a relative living elsewhere (excluding assistance given to children who live elsewhere).8 Of those who provided regular unpaid assistance:
- 38% provided help with domestic work, home maintenance or gardening;
- 42% provided help with transport or running errands;
- 32% provided help with child care; and
- 42% provided emotional support.
Family members often provide financial assistance to other members of the family. Almost one in five adults aged 18 years plus (17%) provided financial support to adult relatives living elsewhere (not including support to children aged less than 25 years).
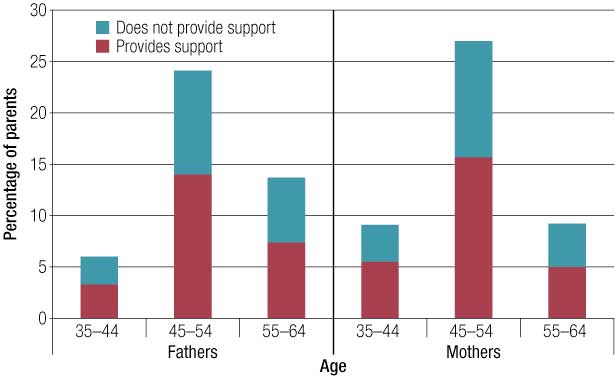
Support is also often given by parents to children who no longer live at home, but are still studying or establishing themselves in their own job or family (Figure 4). Men and women aged 45 to 54 years were the most likely to have older children living outside the household. Just over half of those in this age group provided support to their children. The main types of support provided include:
- financial help (51% of those who provided support), including paying for food, clothing, bills, educational costs or housing costs; and
- driving them places or letting them borrow the car (26% of those who provided support).
Figure 4 Provision of parental support to non-resident children aged 18–24 years, 2006
Source: 2006 General Social Survey, Confidentialised Unit Record File (Remote Access Data Laboratory)
Some people are also responsible for younger children who no longer live in their household. This is most commonly the result of relationship breakdown. Of those who had young children living elsewhere, nine in ten reported providing support to those children, including:9
- 61% paying child support;
- 69% assisting financially in ways other than child support (e.g., paying for clothing, food or educational costs, or giving pocket money); and
- 42% driving children places or lending them their car.
Contact with family and relatives living elsewhere
Most people maintain ties to the family they grew up with—parents, siblings, grandparents and others. It is through these connections that many people continue to feel that they can rely upon their family if they are in need of help. Eight out of ten people said that a family member would be someone they would turn to in times of crisis.10
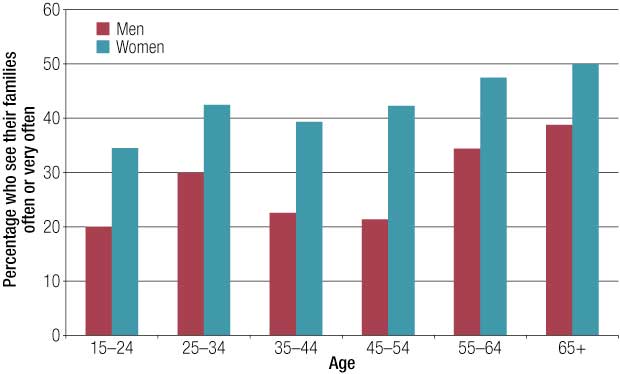
Figure 5 shows how often people said that they saw members of their extended family or relatives not living with them:
- women were a little more likely than men to see their family regularly—42% of women and 27% of men saw their family often or very often; and
- older women and men were the most likely to see family members regularly—41% of those aged 55–64 years and 45% of those aged 65 and over saw their family often or very often.
Figure 5 Frequency of face-to-face contact with family outside of own household, 2006
Source: HILDA, 2006 (Wave 6)11
People’s contact with family may not always involve seeing each other; it frequently involves other forms of communication. As shown in Figure 6, a majority of people have at least weekly contact with their parents and also with any non–resident children, with the most popular form of contact being via telephone.
Figure 6 Weekly or more frequent contact with non–resident family, 2006
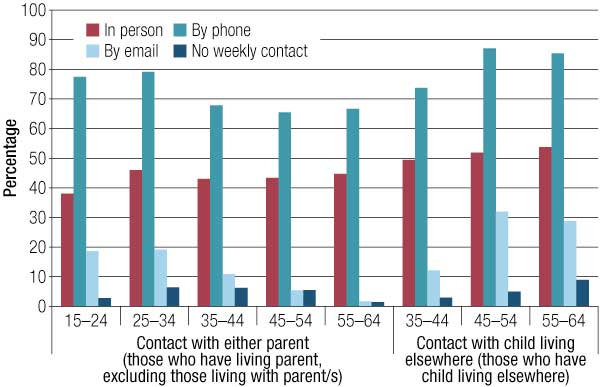
Source: Negotiating the Life Course, 2006 (Wave 4)12
Conclusion
Families are very diverse and support one another in many different ways. Changes in life stage, such as leaving home, partnering, birth of a child, separation, and sickness, disability or frail old age require families to provide different types of support. The support provided by families is the thread that holds together the fabric of society. This becomes even more important in times of economic hardship.
1 Australian Bureau of Statistics (ABS) 2006 Census of Population and Housing, Australia, calculated from the one per cent sample file.
2 Including adoptive parents.
3 Data from the 2006 Census of Population and Housing, Australia, one per cent sample file.
4 ABS 2006 General Social Survey, Summary of Results (Cat. No. 4159.0), Table 25.
5 ABS 2006 Time Use Survey, calculated from the Confidentialised Unit Record File CD-ROM.
6 ABS 2006 Time Use Survey, calculated from the Confidentialised Unit Record File CD-ROM.
7 ABS 2006 Time Use Survey, calculated from the Confidentialised Unit Record File CD-ROM.
8 ABS 2006 General Social Survey, Survey Summary of Results (Cat. No. 4159.0), Table 25, and calculated from the Confidentialised Unit Record File, Remote Access Data Laboratory. Percentages for types of support are based on those who only provide support to adult relatives.
9 ABS 2006 General Social Survey, Summary of Results (Cat. No. 4159.0), Table 25, and ABS 2006 General Social Survey, calculated from Confidentialised Unit Record File, Remote Access Data Laboratory.
10 ABS 2006 General Social Survey, Summary of Results (Cat. No. 4159.0), Table 25.
11 The Household, Income and Labour Dynamics in Australia (HILDA) survey is funded by the Australian Government through the Department of Families, Housing, Community Services and Indigenous Affairs. It is managed by the Melbourne Institute of Applied Economic and Social Research, in collaboration with the Australian Institute of Family Studies and the Australian Council for Educational Research.
12 McDonald, P., Baxter, J. H., Mitchell, D., Evans, A., Gray, E., & Baxter, J. A. (2008). Negotiating the Life Course, 2006 [Data file]. Canberra: Australian Social Science Data Archive, Australian National University.
Baxter, J., Gray, M., & Hayes, A. (2009). Diverse families making a difference (Facts Sheet). Melbourne: Australian Institute of Family Studies.